Embed Size (px)
Citation preview

“Economic doctrine is not a body of concrete truth, but an engine of discovery of concrete truth.” Alfred Marshall
The International Energy Authority’s 2017 Review of New Zealand
I have been asked by Energy Trusts of New Zealand (ETNZ) to provide an assessment of the content and reasoning of Chapter 7 of the International Energy Authority’s (IEA’s) 2017 Review of New Zealand (“C7”), which is one of a series of reviews of the Energy Policies of IEA Countries. C7 is a ‘special focus’ chapter devoted to Electricity Distribution Development.
In particular, I have been asked to give opinions on the Review’s views and recommendations or inferred suggestions on three, specific matters:
(a) the number of electricity distribution businesses (EDBs) in New Zealand,
(b) economies of scale in electricity distribution, and
(c) the adequacy of trust governance.
This report in response is divided into seven sections providing or addressing:
1. A brief summary of the content of C7, with some initial comments.2. A general assessment of the structure and style of the economic reasoning in C7. 3. The suggestion of excessive fragmentation of EDBs in New Zealand. 4. Economies of scale in electricity distribution. 5. EDB ownership and governance. 6. Looking to the past vs looking to the future: the German example. 7. Concluding thoughts.
1. A brief summary of, and initial comments on, the content of Chapter 7
C7 of the IEA Review explains at the outset that the New Zealand Government asked that IEA include, in its 2017 Review of New Zealand, a special examination of the electricity distribution sector, with a focus on the sector’s ability to respond in a timely, efficient and cost-effective manner to emerging challenges associated with market liberalisation, decarbonisation policies and accelerated technological change. Such challenges confront policymakers around the world and the request was a natural one: in principle, as an international body the IEA should be well placed to offer constructive thinking to New Zealand based on its studies of other IEA countries.
There follow some basic facts about the NZ distribution sector, including an extended table providing details of some of the main characteristics of each of the distribution companies. The detail is presumably directed at non-NZ and/or non-specialist readers of the Report, since it is not information that will be new to those involved with the sector. Unfortunately for such readers, the table contains mistakes and these mistakes lead on to incorrect inferences.
1

Thus, Wellington Electricity is classified as an exempt distributor, while Northpower and Waipa Network are classified as non-exempt. The classifications are instrumental in arriving at a later proposition, on page 135, that “exempt distributors may have achieved higher growth in revenues than regulated distributors”. However, in the period covered, Wellington Electricity has faster than median revenue growth and Northpower and Waika Network had slower than median growth. After correcting the misclassification, there is no basis for the conclusion reached.
Following some descriptive sections about regulatory arrangements in NZ, C7 has a section headed ‘recent performance trends’, although the first chart (7.1) shows cross-sectional internal rates of return (IRRs) and is therefore not concerned with trends at all. It is another early sign of a relatively casual approach to the matters at hand. The chart is of some limited interest in showing greater dispersion (around similar means) in rates of return for exempt distributors, although this is hardly a particularly surprising result: it is generally to be expected that price regulation will have a homogenising effect on rates of return.
The second chart (7.2) shows cross-EDB rates of revenue growth (2013-15), but, in addition to the aforementioned classification errors, it is difficult to see how differences in growth rates over such a short time period could tell us very much. The focus on revenue growth is also a little odd in that revenue conflates output and price effects: a given change in revenue could potentially be attributable to price increases only or to output increases only, and these are two, very different outcomes, at least from the viewpoint of consumers. The statistic would not, therefore, generally be regarded as a ‘performance indicator’ in this type of exercise, at least when dealing with issues in a policy context.
Figure 7.3, exhibiting changes in opex and capex, is confusing. The chart indicates that the growth rates are calculated from data for 2008-12 and 2013-2015, whereas the textual discussion of the charts at page 136 refers to changes in expenditure between 2013 and 2015 only, a much shorter period. This appears to be another error, possibly a typo, but, since no significant inferences are made from the charts, it is of no great consequence.
When it comes to trends in the frequency of interruptions (Figure 7.4) – which is a more salient performance metric – the comparison periods change again: the growth rates are from 2003-10 to 2011-15. The choices of time periods in the different exercises (revenues, opex/capex, interruptions) may have been due to ease of data availability, but no explanation is offered and the impression given is that it is all very slapdash.
The general finding of this section of C7 is that there are no discernible differences in the metrics between regulated and exempt distributors, save that the rate of return shows greater variability for exempt distributors, although there is no test of that difference for statistical significance (which would have been the simplest of exercises to perform).
The remaining sections of C7 have the headings: Emerging policy issues; Strengthening the governance framework; Assessment; and Recommendations. Nothing material in them appears to depend on the data in the performance trends section, which therefore appears to have been something of a space filler (although it needn’t have been such if different metrics had been chosen and more care had been expended on the exercise). These later sections
2

include the more substantive content of C7, which will now be addressed in a more systematic way.
2. The structure and style of the economic reasoning in C7
Argument by insinuation
I would characterise the style of reasoning in the C7 as argument by insinuation. Little is substantiated as the discussion moves on and there is a dearth of safe inferences. Instead, the text is littered by many instances of ‘mays’, ‘mights’ and ‘coulds’. Also indicative of the style is the very frequent referencing of ‘concerns’: there are ‘concerns’ about this or that, but the references are almost invariably unspecific about detail and there is no identification of their sources. Are these the concerns of the authors, of NZ consumers, of NZ businesses? The reader is not told.
The words ‘may’, ‘might’ and ‘could’ signify possibilities, and no more than that. They carry with them the notion that things are uncertain. When looking at an economic policy issue, there are always uncertainties and always many possibilities in play. The point of assessment is to identify the main possibilities and then to arrive at judgments about the relative likelihoods and the consequences of each of them, so as to be able to better inform policy decisions. C7 does not attempt such an exercise, leaving an unbridged chasm between the possibilities identified, most frequently introduced as a ‘concern’ of unknown provenance, and the suggestions and recommendations that are eventually made. Instead, it offers argument by insinuation: a possible problem is vaguely suggested and it is insinuated, without further ado, that it should be addressed.
Something much more definite than this is required to arrive at useful conclusions and recommendations, e.g.s. ‘X can be expected to be a problem’ and ‘doing Y in response to X can be expected to have effect Z’, in each case offered with substantiation for the degree of definiteness.
The ‘can be expected to’ formulation does appear in C7, five times, but (i) that frequency is far lower than the frequency of the mays, mights and coulds, and (ii) in four of the five cases it is unaccompanied by any supporting evidence or reasoning. The exceptional reference – the one case in which a reasonably definite, supported conclusion/judgment is referenced in C7 – is not a judgment/conclusion of the C7 authors themselves: it is a report of a judgment/conclusion of the NZ Commerce Commission.
The existence of concerns is, of course, a potentially valid reason for paying attention to a particular issue, but it should have been recognised in C7 that:
The existence of an expressed concern does not itself necessarily mean that it is warranted or justified. I would have expected to see judgment being applied on this point. Regulators and policymakers are not psychological therapists: they could not function effectively if they had to soothe every ‘concern’.
Similarly, there are questions to be asked about the salience of the issue: not all concerns are equal.
3

People can be concerned about a matter for a variety of different reasons, many of which may be largely irrelevant to the tasks of the policymaker. Again, I would have expected to see some discrimination applied in a Report by an expert body.
There may be issues to be addressed where no major concerns have been expressed. Good regulation should be alert to issues that may develop ahead of problems eventuating and ahead of them being generally perceived to be in prospect. One of the roles of an external review is to bring fresh pairs of eyes to issues, helping to spot aspects that may be missed by insiders whose views of matters may have become aligned in the natural course of their regular interactions.
The general problem with the reasoning can be illustrated by noting that wherever a ‘might’, ‘may’ or ‘could’ appears in the text, it would in most cases be legitimate to add ‘or might not’, ‘or may not’ or ‘or could not’, these being equally valid statements about possibilities. If the statement and subsequent sentences are then re-read, with that inclusion, it should be apparent what is meant by argument by insinuation. I will add these qualifiers at one or two points in what follows, marked by square brackets […], to demonstrate the point that there is no logical structure to much of the discussion in C7.
Unexamined counterfactuals
There is a strong sense throughout the Review Chapter that actual NZ practice is being compared with and evaluated against some theoretical model, rather than against operational (or potentially operational) alternatives. That is, the counterfactuals in play appear to be theoretical ideals, but since they are never developed and examined, it is not possible to be certain as to their nature.
There are two aspects of this deficiency that merit specific comment: the regulatory counterfactual(s) and the governance counterfactual(s). I will address the governance issues later but will consider the general regulatory problem here.
To introduce the problem, it can be noted that C7 says at page 153 that “Extending regulation to cover all distributors including currently exempt community-owned trusts, could [or could not] be considered to ensure more effective development of the regulatory framework to help complement and reinforce incentives for timely and efficient responses given these potentially rapidly changing circumstances.” This thought and the immediately following sentences lead quickly to the recommendation in the next paragraph that: “Policy makers are encouraged to prepare for the possible extension of economic and reliability regulation to all distributors to facilitate a more consistent, reliable, timely, efficient, innovative and cost-effective response to the potential challenges facing the distribution sector.”
The inserted bracket makes it clear that nothing at all follows from the consideration of a possibility. The point to add is that it is simply taken as given (i.e. it is assumed) that regulators can achieve all the good things listed at the end simply by extending the scope of some of their existing practices. There is an unexamined ‘counterfactual’ at play here in which regulators and policymakers have powers somewhat akin to those of the super-heroes of Hollywood movies.
4
To point out that regulators lack such powers is not a criticism of them. I have been known in the past to say that regulators are doomed to work in the pork-pie factory of economic policy. They do their best to make the product as palatable as possible, but, given their intimate familiarity with the production process, they tend to know the limitations of the product better than almost anyone else.
Ironically, the next sub-section of C7 – ‘Approaches to include innovation in economic regulation’ – begins to raise questions about the ability of regulation, in its real and practical manifestation to do these things, having just insinuated that it can. (It is to be wondered whether the sub-sections were drafted by different officials who did not fully co-ordinate their thinking). After discussing issues to do with potential distortions to regulatory incentives arising from differential treatment of capex and opex in price setting, much more fundamental questions of incentives for innovation and of average cost pricing are raised. Thus, challenges that should have a major bearing on a conclusion are noted only after reaching a conclusion that has ignored them.
C7 correctly notes that the Commerce Commission has considered the question of the efficacy of the current regulatory arrangements, which is a matter that it no doubt keeps under review, and that it has judged that major changes would not be appropriate in the current state of knowledge. Nevertheless, C7 persists with its call for more regulatory action, “… these circumstances could [my emphasis] change rapidly and substantially.” They could, but then again they might not.
In considering the possibilities it is also advisable to bear in mind that there can be a degree of over-excitement when it comes to assessing the future consequences of new technologies. The breakthroughs themselves are indeed exciting, but it can often take many years for them to have major economic impacts – and when those impacts come they may appear on a different scale in different locations. For example, a small distribution system reliant chiefly on local hydro power may be little affected by developing wind and solar PV technologies.
C7 does not, in fact, provide any substantiation at all for the proposition that there should be an extension of price-quality regulation to all EDBs. Yet the same sentiment is repeated later (on page 161): “An increase in the effective scale of distribution activities may [or may not] also provide an opportunity to extend the price-quality path regulation to all distribution activities: this would provide a way to ensure a more consistent and comprehensive incentive-based regulation of the distribution sector. The development of more effective management across the distribution sector may serve to encourage more efficient and timely behavioural responses to the incentives created by price-quality regulation.”
This adds comprehensiveness to consistency as a criterion for judgment, but increasing comprehensiveness has costs, including the scope for harm caused by less than perfect regulation, remembering that discovering and implementing incentive structures that (in practice) work well for consumers are difficult, skilled and costly tasks and that excessive pursuit of comprehensiveness is just another name for over-regulation.
If by consistent regulation is meant application of similar incentive structures to all distribution companies, there is nothing in it that is inherently meritorious. Indeed, NZ
5
regulation is characterised by its tailoring of regulatory approaches to variations in circumstances via its mix of default price-quality paths, customised price-quality paths and information disclosure requirements. The challenge is more a matter of the consistent application of policy principles in different, given contexts (which may lead to differentiation in implementations) than of trying to change the context to fit the policy, e.g. trying to increase the size of EDBs to make them suitable for a one-size-fits-all, homogeneous implementation of those principles.
There is a strong sense in all of this that the underlying objective in C7 is to render regulation less intellectually challenging than it currently is, by bending commercial realities to an existing way of thinking, rather than developing new ways of thinking that will fit better with commercial realities.
A static analytical framework for tackling a set of dynamic economic issues
C7 rightly recognises that a combination of market liberalisation, decarbonisation policies and rapid technological change (itself stimulated by liberalisation and environmental policies) poses major challenges that may fundamentally affect (a) the way distribution systems are used, operated and developed and (b) the business models and regulatory approaches that are adopted. These developments almost necessarily give rise to greater uncertainty about the evolutionary paths of business organisation and regulatory systems. The Review is therefore also right in saying, in one of its more definite statements that “there are considerable risks associated with adapting the legal and governance framework, given the substantial uncertainty around the nature and timing of this transformation.” It does not go on to examine the nature of those risks, however, being content to suggest that uncertainty may point to an incremental and proportional approach as the most appropriate way to proceed.
Again, there is little to object to in this sentiment, but it is highly incomplete. It is focused on a desirable, but nevertheless defensive, approach of seeking to avoid mistakes. The much more significant task, given uncertainty as to how to proceed and uncertainty as to how things might turn out, is to discover how best to proceed. Given the unknowns, it is generally the case that this requires the exploration and testing out of a variety of alternative possibilities. This, after all, is how scientific discovery processes work, and it puts a premium on the existence of diversity of approaches. It is also how evolution proceeds: random variations occur in genetic material and their fitness is put to the test in the relevant environments. Some variations do better in one type of environment, others in other types of environment, and what we consequentially see in nature is great diversity across different contexts/environments.
C7 does not, however, frame the problem in terms of a dynamic discovery process. Rather it rests on a more static economics, an approach that is nowhere better illustrated than in its heavy reliance on the notion of economies of scale. This focuses all attention on the shape of the cost curve of an EDB, asking: how do average costs of distribution change as the scale of activity increases? But cost curves are static concepts, meaning that they are defined and estimated on the basis of a known technology, when the central issues at stake are to do with technological change. An amalgamation between two businesses can reduce unit costs for a
6
given, existing technology, but also have the simultaneous effect of reducing the number of ‘competitors’ in a dynamic discovery process, e.g. in a search for new and better ways of doing things as solar panel and battery technologies develop.
C7 misses this ‘discovery’ point entirely and its discussion of the regulatory implications of potentially disruptive change is focused on a choice between two different business models that “appear to be emerging”, the “value-added services” model and the “platform for services” model. In the former the EDB is an active participant in related markets and activities, in the latter it is a ‘neutral facilitator’ of other markets and activities. These are, in effect, the alternatives that have been the focus of much past attention in liberalisation processes, revolving around the questions: should activities be unbundled, and should monopolistic activities be ring-fenced? They are the alternatives that have been considered by the Council of European Energy Regulators (CEER), which has come down in favour of the neutral facilitation approach, and C7, in effect, endorses this choice. This endorsement is accompanied by a palpable sense of disappointment that the 2010 NZ legislation marked a (limited) shift away from retail unbundling in electricity supply, whose attraction to the authors is that it “introduced the potential to efficiently and cost-effectively transit into a platform for services model.”
This presentation of a binary choice between models does not really get to grips with the issue. There are many potential business models that could emerge in the future and the premature adoption of one, for the entirety of EDBs, would serve to put barriers in the way of the development of other, alternative ways of doing things, i.e. of institutional innovation.
The general message is that what is required is experimentation and evidence gained from experimentation. Such experimentation is in progress in many jurisdictions around the world and it would, I think, have been of more value if C7, having examined the current state of play in NZ, had focused its attention rather more on providing information on those of the experiments that it judged likely to be most relevant for NZ thinking, preliminary though such evidence might be. For example, in Box 7.1 (‘Changing business and regulatory models for distribution service operators (DSOs)’) which focused on the Nordic countries, there is nothing to be found that would assist with the question: have any of the municipally-owed DSOs (which account for about 75% of the total number of DSOs in Sweden) been trying new business models and, if so, what are their characteristics and how are things going?
3. The suggestion of excessive fragmentation of EDBs in New Zealand
Perhaps the oddest aspect of C7 is the suggestion that the structure of the NZ electricity distribution sector is unduly fragmented. Thus, on page 148 it is said that:
“At present, New Zealand’s distribution sector has a relatively large number of small distributors, many of which are constituted as community-owned trusts. The Controller and Auditor General recently concluded that those responsible for governing distributors generally possess the appropriate skills and experience to manage their core activities (Auditor General, 2016).
7
However, the nature of ownership and organisational governance, and the degree of fragmentation of the sector have given rise to a range of concerns about its capacity to deliver timely and efficient outcomes. In particular, concerns have been raised about the sector’s capacity to effectively harness efficiencies associated with economies of scale, and to quickly and effectively respond to the fundamental sector transformation which may result from the deployment of distributed generation technologies and changing patterns of network use.”
Several of the general problems of C7 are visible here. Thus:
The Auditor General concluded that those responsible for governing EDBs possess the requisite management skills, but this is immediately set aside because unsourced and unparticularised ‘concerns’ have been raised that, inter alia, fragmentation is a problem. But C7 doesn’t establish the existence of abnormal fragmentation, let alone substantiate that it is a problem.
There is an unspecified counterfactual: there is a claim of a relatively large number of small distributors, but against what benchmark? In relation to precisely what alternative is the number relatively large?
The economies of scale trope is repeated, but there is no substantiation that such economies exist in the relevant range of business sizes (see further below).
What is left is the possibility that small organisations may not be perform very well in the face of disruptive technological change (about which “concerns have been raised”). Anything is possible, of course, but the mammals didn’t do badly relative to the dinosaurs when the asteroid hit earth and there is a strong, general case to the effect that smaller organisations are typically quicker on their feet than large organisations in coping with sharp changes in the economic environment.
The fragmentation suggestion (the first bulleted point) can be dealt with relatively quickly, since it is so obviously wrong. One possible indicator is the ratio of the number of small EDBs to the number of large EDBs in a jurisdiction. If this number were large in comparison with elsewhere in the world, it would be reasonable to say that NZ “has a relatively large number of small distributors”.
A Eurelectric Report1 gives statistics from which the relevant ratio or percentage can be calculated for European systems, at least on the basis of Eurelectric’s assumed dividing line between small and large distributors, which is 100,000 connections. The percentage varies very considerably from country to country in Europe, largely in consequence of different policy histories. For nine of the twenty-seven countries the ratio is zero (i.e. there are no small distributors), largely because of past policies of nationalization (i.e. public ownership by the national government, not by local government) adopted at various points in history. The UK is one of these observations2: it had over 500 electricity undertakings at the time of nationalization in 1948, comprising a mix of privately and municipally owned utilities, but
1 Eurelectric, Power Distribution in Europe, 2013.2 Strictly speaking, the Eurelectric number for the UK is wrong: as of early 2018, fourteen Independent Distribution Network Operator (IDNO) licenses have been issued. However, the Eurelectric number is not misleading: IDNOs account for a tiny fraction of total distribution.
8

the number was then reduced to fifteen, fourteen of which had distribution responsibilities. At the other end of the scale from the nine zeros are Spain and Italy: In 2010, Spain had 68.8 small distributors for every large distributor, and Italy had 66.5
With such a bifurcated history in the different jurisdictions, the median and mean European ratios differ substantially. The best overall indicator is probably therefore simply the ratio of ‘small’ to ‘large’ distributors for the Eurelectric countries in aggregate. The ratio is 12.7: i.e. in Europe there are 12.7 small distributors for every one large distributor. If the nine zero observations were excluded, the ratio would increase to 20.7. In NZ the ratio is 8.7. Against these comparators, therefore, it can be said that NZ has a relatively small (not large) number of small EDBs.
For a less aggregated benchmark, my view is that the most appropriate comparator group of European nations for NZ is the set of Nordic countries (Denmark, Finland, Norway and Sweden), for a mix of reasons. The countries have a less broken policy history in energy than the UK or the Eastern European nations that have been subject to Soviet-type systems, the population density across the region is not dissimilar to NZ3, like NZ there is a combination of a small number of large settlements and large land areas with low population density, the topography has some similarities to NZ (mountains, hills and flatter areas), the countries are economically advanced, they were leaders in electricity sector liberalisation, and they are currently wrestling with the decarbonisation and technological change challenges identified by C7. Indeed, Box 7.1 of C7 is devoted to the Nordic area, with an emphasis on Sweden, and one of the IEA’s country reports in 2017 was for Norway.
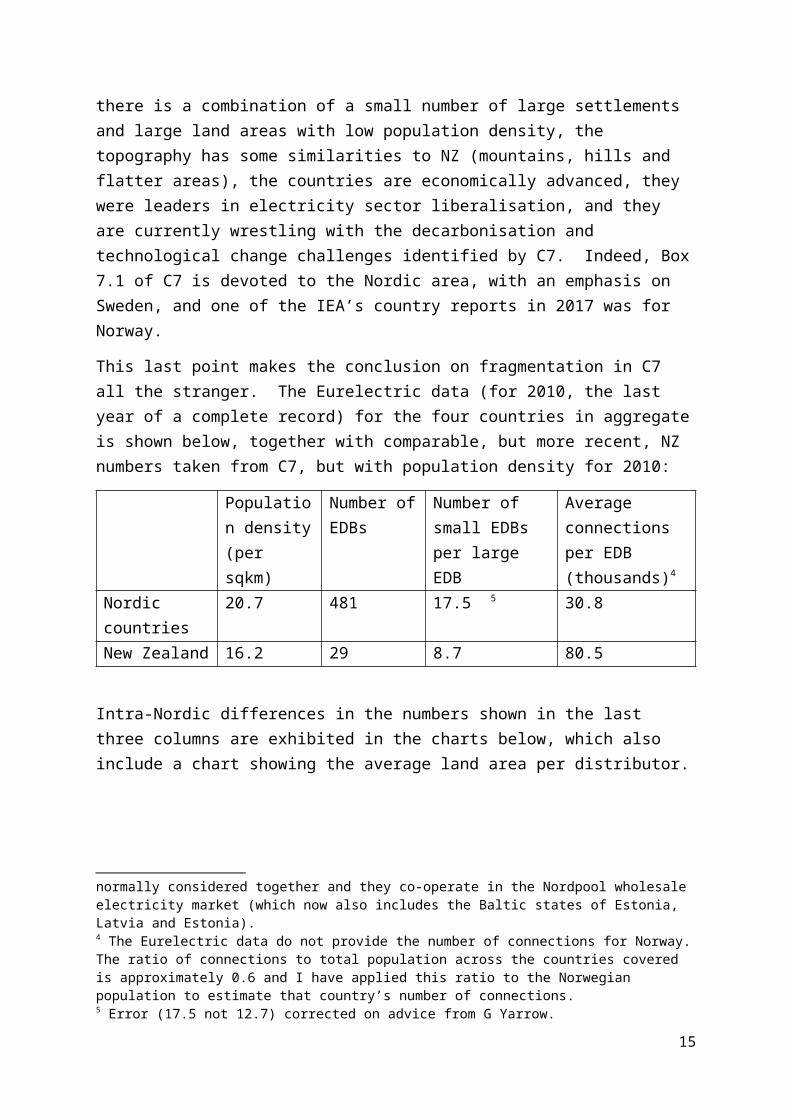
This last point makes the conclusion on fragmentation in C7 all the stranger. The Eurelectric data (for 2010, the last year of a complete record) for the four countries in aggregate is shown below, together with comparable, but more recent, NZ numbers taken from C7, but with population density for 2010:
Population density (per sqkm)
Number of EDBs
Number of small EDBs per large EDB
Average connections per EDB (thousands)4
Nordic countries 20.7 481 17.5 5 30.8New Zealand 16.2 29 8.7 80.5
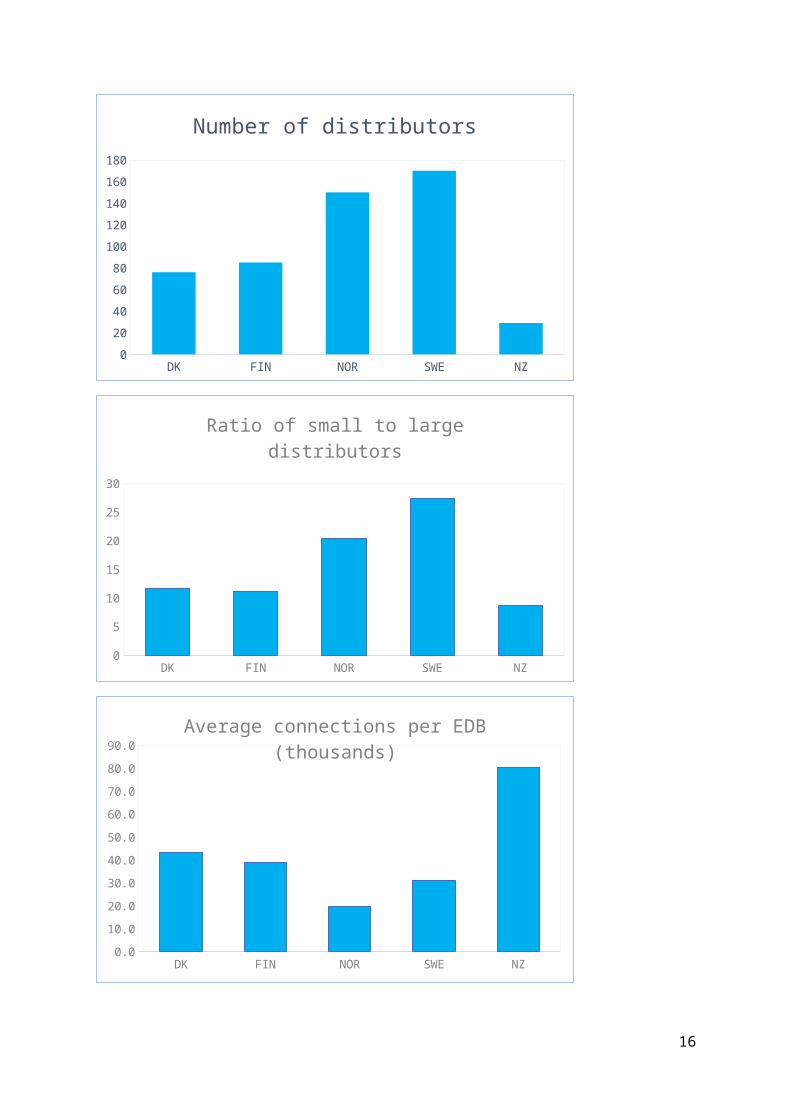
Intra-Nordic differences in the numbers shown in the last three columns are exhibited in the charts below, which also include a chart showing the average land area per distributor.
3 For Finland, Norway and Sweden combined it is almost identical. Denmark is much more densely populated, but is included because the countries are normally considered together and they co-operate in the Nordpool wholesale electricity market (which now also includes the Baltic states of Estonia, Latvia and Estonia).4 The Eurelectric data do not provide the number of connections for Norway. The ratio of connections to total population across the countries covered is approximately 0.6 and I have applied this ratio to the Norwegian population to estimate that country’s number of connections.5 Error (17.5 not 12.7) corrected on advice from G Yarrow.
9

DK FIN NOR SWE NZ0
20
40
60
80
100
120
140
160
180
Number of distributors
DK FIN NOR SWE NZ0
5
10
15
20
25
30
Ratio of small to large distributors
DK FIN NOR SWE NZ0.0
10.0
20.0
30.0
40.0
50.0
60.0
70.0
80.0
90.0
Average connections per EDB (thousands)
10
DK FIN NOR SWE NZ0
1000
2000
3000
4000
5000
6000
7000
8000
9000
10000
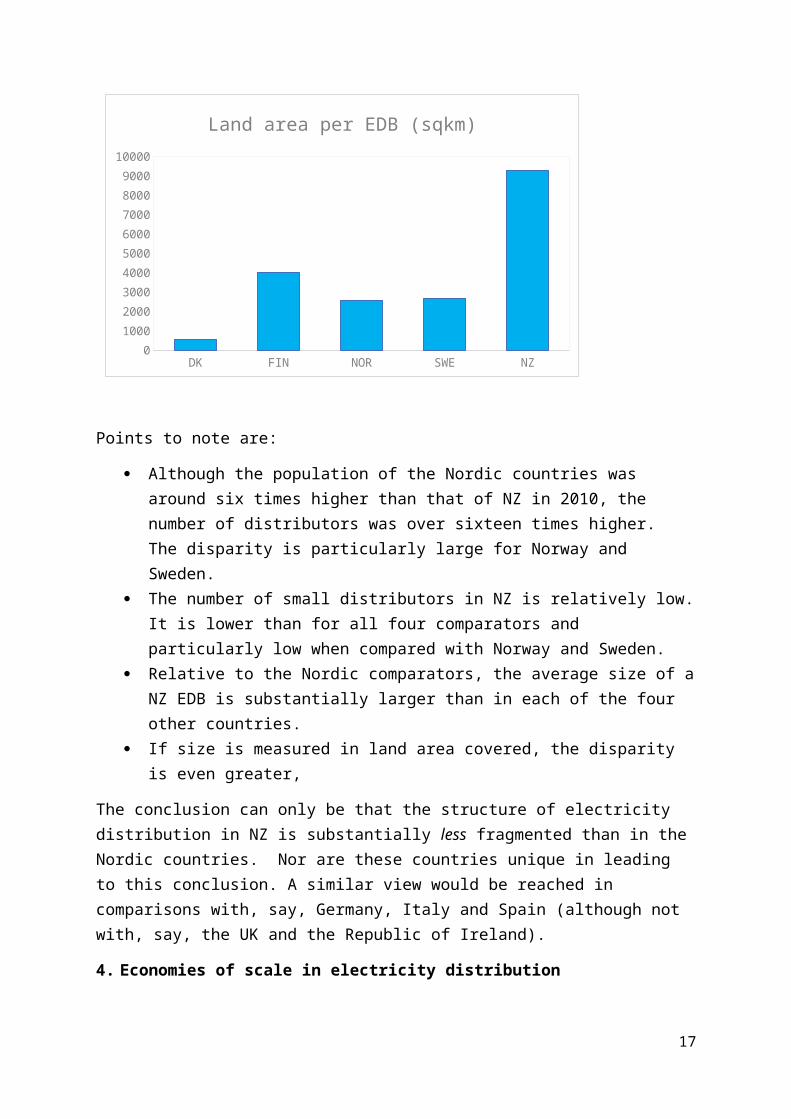
Land area per EDB (sqkm)
Points to note are:
Although the population of the Nordic countries was around six times higher than that of NZ in 2010, the number of distributors was over sixteen times higher. The disparity is particularly large for Norway and Sweden.
The number of small distributors in NZ is relatively low. It is lower than for all four comparators and particularly low when compared with Norway and Sweden.
Relative to the Nordic comparators, the average size of a NZ EDB is substantially larger than in each of the four other countries.
If size is measured in land area covered, the disparity is even greater,
The conclusion can only be that the structure of electricity distribution in NZ is substantially less fragmented than in the Nordic countries. Nor are these countries unique in leading to this conclusion. A similar view would be reached in comparisons with, say, Germany, Italy and Spain (although not with, say, the UK and the Republic of Ireland).
4. Economies of scale in electricity distribution
Running throughout the Review Chapter is the notion that EDBs are subject to economies of scale and that there would be benefits from amalgamation or some other form of consolidation, particularly in the management and financing of the distributors.
In fact, the concept of economies of scale is not a simple one in the context of electricity distribution, although this is not discussed at all in C7. In reality, EDBs are multiproduct suppliers: each downstream end-point of a distribution system defines a distinct economic product or service. Other things being equal, the costs of distributing electricity to a specific location will differ from those at other locations. Even leaving aside the problems of output measurement (e.g. by adopting a single unit of measurement such as a MWh), the appropriate (total) cost function will take the rather extensive form C(q1,q2, … , qi … ,qn), where qi is the supply to location/connection i and n is the total number of locations/connections supplied.
11

This raises the question of how to define economies of scale. If total output is defined as the sum of the individual outputs, i.e. Q = qi + q2 + … + qn, ‘economies of scale’ only becomes a coherent concept if attention is restricted to comparisons of average costs involving equi-proportionate changes in supplies at all locations. That is, an increase of 5% in Q entails a 5% increase in supplies at each and every location/connection. With this restriction, it is possible to define what are called ‘ray average cost curves’, but there is an infinity of such curves for each business: there is one for every conceivable, locational break-down of the total MWhs supplied.
The Review skates over this multiproduct issue, as do all empirical studies of economies of scale in the academic literature. However, it is important when interpreting the results to be aware of the issue. If it is found that average costs are negatively correlated with total output, Q, the fact is that it cannot simply be inferred that economies of scale exist. Two EDBs may have identical cost curves and may operate at the same scale, as measured by total output Q, yet it is near certain that will exhibit different measured costs. Moreover, the difference can be substantial.
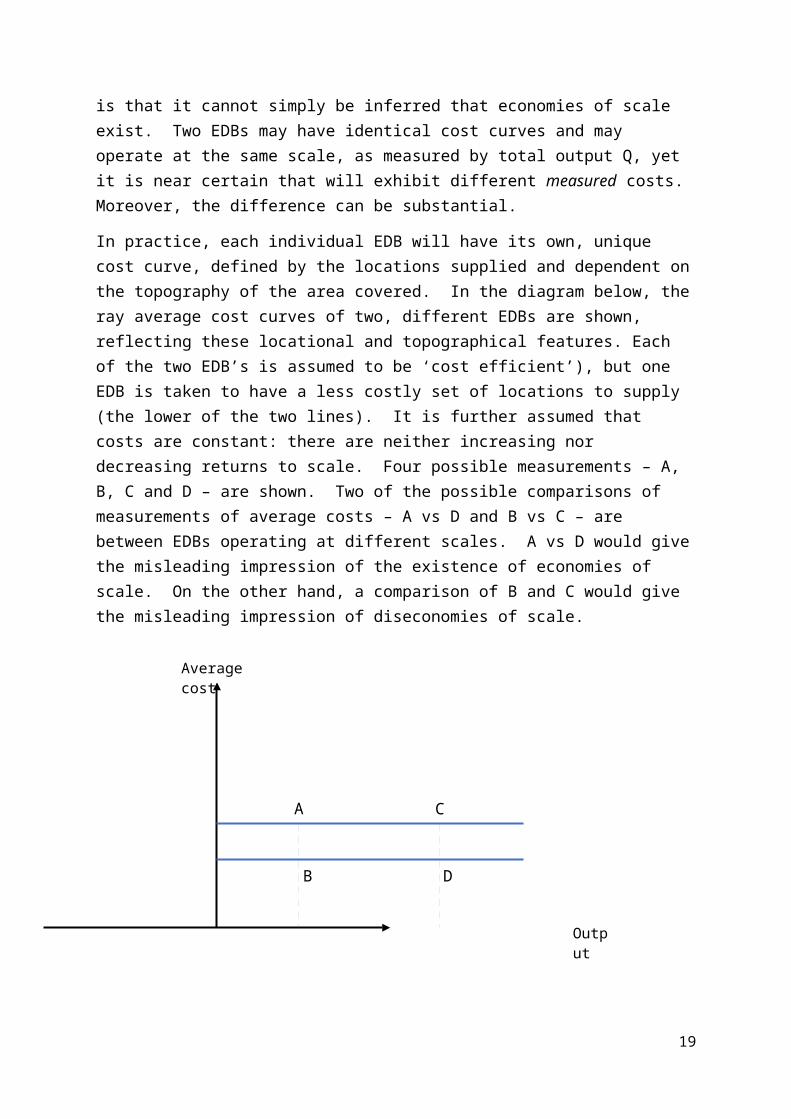
In practice, each individual EDB will have its own, unique cost curve, defined by the locations supplied and dependent on the topography of the area covered. In the diagram below, the ray average cost curves of two, different EDBs are shown, reflecting these locational and topographical features. Each of the two EDB’s is assumed to be ‘cost efficient’), but one EDB is taken to have a less costly set of locations to supply (the lower of the two lines). It is further assumed that costs are constant: there are neither increasing nor decreasing returns to scale. Four possible measurements – A, B, C and D – are shown. Two of the possible comparisons of measurements of average costs – A vs D and B vs C – are between EDBs operating at different scales. A vs D would give the misleading impression of the existence of economies of scale. On the other hand, a comparison of B and C would give the misleading impression of diseconomies of scale.
12
Average cost
Output
D
C
B
A
A
A priori, there are reasons to expect that both types of situation could occur. Thus, A might be the measured position in a relatively mountainous area characterised by relatively small settlements whereas D might be the measured position for a flatter landscape with larger settlements. On the other hand, B might reflect a mid-density settled area and C a major city, where the underlying (ray) average cost curve is higher because of constraints on distribution network layout caused by the existence of all manner of other economic infrastructure that must be worked around (densely packed buildings and roads).
The bottom line is that a great deal of information is required about each individual network in order to correct for the influence of different mixes of locations and physical environments.
The emphasis of C7, however, is not on cost efficiencies from building larger networks, but rather on economies of scale in management. No evidence is presented on this and there are few a priori grounds for assuming that such economies exist. Thus, whilst a larger management structure may help to ensure that there is greater expertise ‘in house’, it may also bring greater problems of coordination among managers. The trade-offs between these things will vary with the specifics of the individual commercial context, but it might be noted that small teams are often regarded as more effective than large teams when it comes to matters of innovation. A popular expression of this is the Bezos two-pizza rule: if you can’t feed the team on two pizzas, the team is too big.
There is, however, another twist to the issues. What C7 is effectively recommending is amalgamations among smaller EDB’s, in the name of more effective management. Here there is extensive evidence – from many studies, in many sectors and countries, over several decades – about pre- and post-amalgamation performance of businesses. Post-amalgamation performance is very frequently disappointing relative to prior expectations, and quite frequently is worse. Many years ago, as an undergraduate, I listened to lectures from two
13

faculty members (Ajit Singh and Geoffrey Whittington) who had each, independently published books on the effects of mergers on economic performance. Each text was an empirical study and each study reached broadly similar conclusions. Whittington’s book was called: Disappointing Marriage: A Study of the Gains from Mergers (on average there were no benefits). I have seen those results replicated on multiple occasions and in multiple sectors in the decades since.
The most directly relevant is co-authored by one of my own former graduate students, Professor Michael Pollitt, and is focused on mergers between electricity distribution companies. I can do no better than reproduce the abstract of his paper with John Kwoka (2014)6: “This paper analyses the performance impact of the merger wave which took place in the US electricity industry during the period 1994-2003. It does so by analyzing the impact on operating and total cost in electricity distribution. While there are past studies of efficiency and productivity effects, as well as of prices, profits, and other outcomes, this study differs in several ways. First, the database consists of many merging and non-merging firms, rather than only a few on which to base inferences. Second, all of these mergers arise in a single industry, greatly facilitating controlled comparison. Third, we have data on the several years of pre-merger and post-merger efficiency of the specific merging units, unlike virtually all past studies. And finally, we employ a powerful nonparametric technique – data envelopment analysis – to measure the efficiency of each operating unit. The results indicate that electricity mergers are not consistent with improved cost performance.” [My emphasis.]
One problem stems from the fact that different businesses have their own unique ways of doing things (their own management cultures) and an amalgamation immediately entails efforts to meld these cultures. That is not a straightforward task and it can take several years to achieve. Meanwhile, performance tends to suffer, both because of clashes in managerial styles and due to the distraction of attention and effort, toward managerial re-organisation and away from the main purposes of the enterprise.
Returning to the more general question of scale economies (aside from amalgamations), as already indicated C7 notes that “no official empirical analysis of economies of scale among EDBs has been undertaken” and, in the light of the above discussion, it is not difficult to understand why. If there is little prospect that such work would yield informative results, there is no justification for allocating scarce administrative resources to the task.
Academic work on the issue has also been relatively limited, although a few papers have been produced, largely grounded in the conceptual framework of static economics and conducted in time periods before changing technologies had become a major issue. Even more problematically, whenever they rely heavily on (cross-sectional) data drawn from different distributors they flounder on the rocks of non-comparability, unable to adjust for the uniqueness of each and every business.
6 John Kwoka and Michael Pollitt, “Industry Restructuring, Mergers and Efficiency: Evidence from Electric Power”, EPRG 0708, Cambridge University.
14
The studies, therefore, must be approached with a considerable degree of caution, but, having given that health warning, it is safe to say that they have found no convincing evidence of significant economies of scale in electricity distribution, other than at very small scale.
A good example of this type of study is that of Yatchew7, based on a sample of 81 municipal distributors in Ontario, Canada, over the three years 1993-95, ranging in size from around 600 to 220,000 customers. The cost data were drawn from accounts prepared on a uniform basis prescribed by the Ontario regulator. A diagram from the paper showing actual (measured) costs and estimated (from the modelling) costs is reproduced below.
The fitted curves are very flat over a wide range and it is evident that scale alone explains very little of the observed cost variations. Although difficult to see, the kernel estimates show the first flat section emerging at around 4,000 customers (remembering that the horizontal axis uses a logarithmic scale) and I think it near certain that no higher estimate of minimum efficient scale would come close to being (statistically) significantly different from that number. Yatchew, in summarising earlier studies covering New Zealand, Norway and Switzerland additionally notes that the NZ and Norwegian studies suggest that “minimum efficient scale occurs at surprisingly small scales of operation.”
5. EDB ownership and governance
The general themes of C7 point the reader toward ownership, governance and management restructuring and it is perhaps best summarised by a passage on page 150 where it is said: 7 A. Yatchew, “Scale Economies in Electricity Distribution: a semiparametric analysis”, Journal of Applied Econometrics, 15, 2000.
15
“One response [to technological change] would be to pursue a programme of amalgamations. Fewer, larger distributors may be better placed to harness potential economies of scale to achieve more efficient investment and operational outcomes. … … Ultimately, a more consolidated sector would [my emphasis] lend itself to more comprehensive and effective regulatory supervision, which prima facie would be in the public interest.”
The familiar, unwarranted elision from possibilities to a concluding statement can again be noted, but here we have extras: the claim is more definite (there are no mights or mays) and there is the additional claim that the regulatory effects of more comprehensive regulatory supervision “prima facie would be in the public interest”. The immediate question is: where did that come from? And the immediate answer is: from nowhere.
The claim is immediately followed by statements that should instantly induce scepticism. It is noted by the C7 authors that:
no official empirical analysis of economies of scale among EDBs has been undertaken and there is little evidence that small firms are less innovative or perform less well than large firms, and
a programme of sponsored amalgamations would likely be highly contentious and problematic to implement in practice, because community owned trusts appear to have strong support throughout the community, especially in rural areas. “Unilateral moves to corporatise and privatise are therefore likely to be strongly resisted and potentially counterproductive at this time.”
Clearly, the authors are frustrated at the prospect that consumer sovereignty and local democracy might stand in the way of plans to ‘rationalise’ a supply system. Reading this brought to mind a famous passage in Adam Smith’s The Theory of Moral Sentiments on what he called the ‘man of system’, who today we would call a central planner. Such a person: “…. is often so enamoured with the supposed beauty of his own ideal plan of government, that he cannot suffer the smallest deviation from any part of it. He goes on to establish it completely and in all its parts, without any regard either to the great interests, or to the strong prejudices which may oppose it. He seems to imagine that he can arrange the different members of a great society with as much ease as the hand arranges the different pieces upon a chess-board. He does not consider that the pieces upon the chess-board have no other principle of motion besides that which the hand impresses upon them; but that, in the great chess-board of human society, every single piece has a principle of motion of its own, altogether different from that which the legislature might choose to impress upon it.”
The relevant NZ legislation is centred on the notion of the long-term interests of consumers and it is normally presumed that in most, but not all, circumstances those interests are best judged by consumers themselves. One implication of that is that, although economic textbooks may, for their own teaching purposes, assume that consumers are interested only in prices and quality of supply, those assumptions are not determinative of what a regulator or policymaker needs to take into account when assessing consumer interests. The actual, rather than the assumed, preferences of consumers are what matter, or what should matter.
16
In practice, consumers take things other than price and quality of product/service into account. In purchasing foodstuffs, we may be concerned that animals have been humanely treated in its production or that significant environmental damage has not been caused. For manufactured goods, we may be deterred from purchasing the products of a particular company by virtue of its reputation for bad labour practices or because it is perceived that it is run by crooks. We buy from a particular supplier, even though the supplier’s prices may not be the lowest available, because good service has been provided in the past (and not just because that is taken as a signal of likely good service in the future, although that will also be a significant factor).
In promoting the interests of consumers of electricity, then, it is reasonable, and arguably it is entailed, that all factors that influence consumption decisions be taken into account. This point is highly relevant when it comes to assessing the significance of economies of scale. Even if, contrary to the evidence, there were significant economies of scale it is perfectly rational for consumers in a local area to prefer a higher cost alternative method of supply, if it comes bundled with more control over the EDB.
A factor that is very frequently ignored by analysts is that control has economic value. Technically speaking it is an option value, deriving from an ability to influence decisions that might, in an EDB context, affect consumer welfare. The value tends to be higher (a) the greater the impact of a potential decision on consumer welfare, (b) the greater the degree of influence over decisions that might affect consumer welfare, and (c) the greater the level of uncertainty about future, relevant business decisions. Factor (a) tends to be greater when the effects are closer to home, factor (b) tends to be greater at smaller scale, and factor (c) tends to be greater the higher the level of uncertainty about what future decisions might be required. Putting these together, control is more valuable when EDB decisions have localised effects, EDBs are small, and change is in the air.
There is an important lesson here that generalises far beyond electricity distribution. When consumers don’t behave in the ways that conform to the assumptions of economic models, it is unwise to attribute that to irrationality, stubbornness, ideology, inertia, stupidity or to any other factor that is beyond the pale for economic analysis. Much more often than not, it just means that the theorising is wrong. In the case of C7, an underlying flaw is that the conceptual framework has no room for uncertainty, change and adaptation. In consequence it is unsuitable for assessing problems in context where uncertainty and change are major features, and where option values are an important factor that needs to be taken into account.
My general view is that the NZ structures are rather well adapted to the relevant economic context. Even in conditions of uncertainty, in a major city such as Auckland it is difficult to afford smaller sub-communities a substantial degree of control, because decisions will tend to have affects which go beyond local neighbourhoods. Here large scale is usually the preferred structure, not because of economies of scale, but because of ‘network externalities’.
For smaller communities, the effects of decisions are more ‘localised’ and consumer influence or control is easier to establish. As in Germany and the Nordic countries (but not in the UK as things currently stand), municipal or community ownership makes more sense. A
17

significant number of EDBs, coupled with diversity in their ownership and corporate governance arrangements is also positive for the kinds of supervised experimentation likely to be conducive to innovation and adaptation as circumstances change.
Small scale and community or municipal ownership naturally gives rise to questions about the effectiveness of corporate governance and it is easy enough to find examples, across many contexts, where a lack of strong incentives (such as might be provided by a profit motive) has led to poor governance and performance in organisations. There is an established literature on such problems. However, this point alone can only be part of any analysis. Policy decisions always involve choices between one thing and an alternative: there is always a counterfactual to consider. As indicated earlier, it is a central flaw in C7 that, to the extent that it operates with any counterfactual at all, the alternative is unexamined and unexplored.
C7 draws attention to ‘concerns’ about community trust governance but pays no attention to the corresponding potential weaknesses in the governance of for-profit businesses. What it provides is an analysis that implicitly assumes that any identified governance weaknesses in community trusts can be corrected by recourse to some alternative, idealised form of corporate governance. That is an assumption: it does not follow from any comparative analysis of the strengths and weaknesses of different ways of doing things. At bottom it is ‘magical thinking’.
The one concrete case raised in C7 that involves an exempt EDB is that of the Marlborough Lines ‘conglomerate’ diversification into wine production, via an acquisition of an 80% stake in Yealands Wine Group, the largest local producer.8 By conglomerate diversification is meant expansion into activities that are only very loosely connected, if at all, with an EDBs core business. It does not encompass the kinds of diversification that characterise, say, the Public Utility Districts (PUDs) of Washington State in the USA, where community-run electricity distribution is to be found bundled with one or both of local telecoms and water services, but not (so far as I know) with apple growing.
There can be little doubt that diversification into unrelated activities is often linked to weaknesses in corporate governance, but the reason for the confidence expressed by that statement is the existence of a significant body of evidence on the issue that is drawn from a wide range of different market contexts, including contexts involving different types of ownership and business structures. It is a generic issue, not specifically tied to any one form of business organisation or type of ownership.
There are many illustrations of this point, but three cases should suffice to establish the point: Carillion, which is a UK political scandal of the moment whose corporate governance entrails are still being picked through by Parliament; the Royal Bank of Scotland, whose governance failures were a contributory factor to the fallout from the financial crash in 2008; and the collapse of Enron, which kept regulators at Ofgem working late nights in the office fifteen or
8 C7 does not elaborate on the details and neither will I, other than to note that identifying the boundary line between policies of seeking (a) the most favourable financial disposition of a reasonable holding-level of reserve funds and (b) expanding reserve funds in order to diversity is not necessarily a straightforward exercise.
18
so years ago. The common factor was a very strong drive to increase financial returns accompanied with a strategy of diversification that over-stretched management capacities.
In an example closer to utilities regulation, conglomerate diversification became an issue in the water industry in the UK only after privatisation, when managers freed from intrusive political supervision suddenly found that their large numbers of private shareholders were not a force to be reckoned with when deciding what to do with their cash flows. Subsequent ring fencing provisions introduced by the regulator, Ofwat, were motivated by the desire to retain the cash flows within the sector to secure compliance with company duties to ensure that they were always able to finance their regulated activities (it was not motivated by competition concerns, since there was little or no competition, or prospect of competition, to speak of at the time).
It can safely be concluded then that increasing the size and changing the objectives of businesses offers no panacea for corporate governance problems. Indeed, in respect of the ‘separation of ownership and control’ aspect of the more general governance problems, smaller size can be expected to give rise to lesser problems.
C7 fails to address these realities, simply assuming that amalgamation, privatisation, corporatisation and its other suggestions and recommendations would almost necessarily improve EDB governance. No reason is given to think it would.
6. Looking to the past vs looking to the future: the German example
The Eurelectric statistics used are the best available, comprehensive collection of statistics on distribution companies in Europe, but 2010 is some years ago now and economic contexts are changing rapidly. Moreover, precisely because of these changes, the past is not necessarily a good guide to the future.
Looking backwards from 2010, it appears that there was a slow but steady trend toward consolidation of smaller electricity distribution companies across several jurisdictions. Sometimes this was a result of bottom-up amalgamations and sometimes a result of top-down regulatory pressures – although European regulators have generally not been to the fore in applying pressures to amalgamate and it is necessary to look across the Atlantic for very active policy-induced restructuring. Ontario is perhaps the most obvious example.
It seems likely that the authors of C7 had this past trend in mind as they relentlessly sought to nudge the NZ authorities in the direction of a top-down restructuring of electricity distribution, but in times of change the future rarely turns out to be an extrapolation of the past. Notwithstanding the existence of Box 7.1, C7 does not offer any detailed consideration of more recent developments in distribution networks, which prima facie are likely to be more informative about the future than are trends in an era before recent technological changes started to have any very material impact on distribution systems.
Even in the Eurelectric statistics, which end in 2011 with an incomplete set of numbers, there are one of two straws in the wind. Up to 2010, the number of distributors in Norway and Sweden was falling, but the 2011 numbers show a slight increase over 2010. However, whilst Norway and Sweden were pioneers in wholesale and retail market liberalisation, the
19

European leader in general adaptation to disruptive change in the electricity sector has been Germany, with its Energiewende (energy transition – to a lower-carbon economy); and Germany is interesting.
The Eurelectric statistics indicate that Germany had 896 distributors in 2010, with an average connection level of 31,200 (less than half the NZ average). The system is characterised by extensive municipal ownership of local distribution networks, but from the early 1980s until the early 1990s increasingly large numbers of these came to be operated on long-term concession contracts by private companies. In effect, responsibility for distribution fell into the hands of private companies, including the much larger German electricity companies. It was an example of privatisation-through-concessions, and where a private company acquired multiple concessions there was a concomitant consolidation/concentration in control. The authors of C7 could therefore have pointed to this evolution, using it to cross check the assertions made about the advantages that such consolidation would yield.
The expansion in the number of such concession contracts from the beginning of the 1980s meant that a significant number of them were set for expiry between 2005 and 2016. Decisions therefore had to be made afresh about the appropriate ownership, management and governance of these distribution systems, and the upshot has been a significant movement toward ‘re-municipalisation’: between 2005 and 2012, 72 new municipal power entities were created to replace existing concession contracts.9 With two exceptions (Hamburg and Stuttgart), these were all small systems.
Data on numbers of connections are not available to me, but population statistics for the relevant local government areas are. Across Germany the number of connections per capita is close to 0.6. If applied to the local populations, this gives a usable estimate of the number of connections. On this basis, the newly municipalised entities (excepting Hamburg and Stuttgart) vary in size from 870 connections to 73,800 connections. Sixteen of the all the 72 entities (i.e. around 22%) had fewer than 6,000 connections and forty-two (i.e. around 58%) had fewer than 15,000 connections.
The establishment of the new companies did not imply an across-the-board switch from fully private control to fully municipal control, although that did happen in eighteen (25%) of the cases (see the chart below, taken from Wagner and Belo, which indicates the shareholder structures). In most cases private interests retained a minority stake, and in eleven instances an equal or majority stake.
9 Oliver Wagner and Kurt Belo, “Remunicipalisation and Foundation of Municipal Utilities in theGerman Energy Sector: Details about Newly Established Enterprises”, Journal of Sustainable Development of Energy, Water and Environment Systems, 5, 2017.
20

We therefore observe a mix of different arrangements being tried out, and this, I think, is the kind of experimental approach that is called for in the face of uncertainty about the future. It is pretty much the opposite direction of travel to that favoured by C7 and it was feasible in Germany because of the multiplicity of distributors. In competitive market contexts Professor John Kay has called it “disciplined pluralism” (decentralised control, with accountability) and has argued that it is conducive to innovation, adding, in his usual no-nonsense way, that “rationalist bureaucracies tend to detest such pluralism”.10 My own experience in regulatory contexts is not so much that the approach is detested, more that it is ignored – which is precisely what C7 has done.
7. Concluding thoughts
It should be clear from the above that I do not have a high opinion of C7. The IEA is barking up the wrong trees in the first place and it is clearly no fan of diversity and experimentation. I would not, however, use Kay’s label of rational bureaucrats as a label for its agents, because there is little that is rational about moving from ‘concerns’ to recommendations with minimal contact with evidence and reasoning on the journey between the two.
Nevertheless, there are always things to be learned from these exercises. To the NZ Government I would say that, if resources are to be expended on this type of exercise in the future, there would be merit in seeking to exert more influence on what is done, e.g. by pressing for more specific, more interesting questions to be addressed. As indicated earlier, there are lots of ‘experiments’ in electricity distribution underway elsewhere in the world and a progress report on those considered to have the greatest information content for NZ policy would likely have been much more useful than what has been delivered. Germany is particularly interesting, as are the Nordic countries, and, since these are all IEA members, the IEA would have been in a good position to collect and assess the relevant information. The servants should be told clearly and simply what is expected of them.
10 https://www.johnkay.com/2007/08/01/failure-market-failure/
21

Experimentation inevitably leads to failures as well as successes and there is valuable information to be gleaned from both. Knowing of a failure elsewhere, and of the reasons for it, may help reduce the incidence of future failures in NZ. And learning of successful innovation can hasten the time at which good ideas from elsewhere are taken up at home.
Then there is Kay’s word ‘disciplined’ to consider. Failures in utility systems at the local level – and, to repeat, failures are to be expected in any innovative process – are often underwritten at the national level. In the end, if local systems encounter problems beyond their capacity to resolve, central governments tend to bring extra resources to the table. There is therefore an obvious case for some quid pro quo for this ‘insurance’ and one already exists in NZ in the form of the information disclosure regime for exempt EDBs. Whether this will remain the most appropriate quid pro quo in changing circumstance is, I think, an interesting question, and one that is part and parcel of a more general set of questions about ‘institutional innovation’.
George YarrowRegulatory Policy Institute, Oxford, UK
22