Embed Size (px)
Citation preview
©2014 International Monetary Fund
IMF Country Report No. 14/41
NAMIBIA SELECTED ISSUES
This Selected Issues Paper on Namibia was prepared by a staff team of the International Monetary Fund. It is based on the information available at the time it was completed on January 16, 2014.
Copies of this report are available to the public from
International Monetary Fund Publication Services
PO Box 92780 Washington, D.C. 20090 Telephone: (202) 623-7430 Fax: (202) 623-7201
E-mail: [email protected] Web: http://www.imf.org Price: $18.00 per printed copy
International Monetary Fund
Washington, D.C.
February 2014
NAMIBIA
SELECTED ISSUES
Approved By
Anne-Marie Gulde-Wolf
Prepared by the team led by Lamin Leigh and comprising of
Ara Stepanyan, La-Bhus Fah Jirasavetakul, Ashwin Moheeput,
Andrew Jonelis, Aidar Abdychev, Friska Parulian, Albert
Touna Mama, Yibin Mu and Jenny Lin (summer intern during
2013). Ms. Robertson provided excellent editorial assistance.
POLICIES THAT CAN RAISE POTENTIAL GROWTH IN SMALL MIDDLE-INCOME-
COUNTRIES OF SSA ____________________________________________________________________ 3
A. Introduction __________________________________________________________________________ 3
B. Literature Review: Determinants of Total Factor Productivity (TFP) ____________________ 5
C. Stylized Facts _________________________________________________________________________ 9
D. Empirical Analysis ____________________________________________________________________ 17
E. Conclusions __________________________________________________________________________ 24
References ______________________________________________________________________________ 25
BOX
1. Structural Transformation in Selected SMICs in SSA—Mauritius and Namibia _______ 14
FIGURES
1. SMICs of SSA: Growth Development __________________________________________________ 6
2. SSA MICs Growth Decomposition _____________________________________________________ 7
3. Factors Affecting Productivity in Selected SMICs in SSA ______________________________ 15
TABLES
1. Structural Impediments to Productivity Enhancement in Selected SMICs ____________ 16
2. Summary of the Empirical Results ____________________________________________________ 18
CONTENTS
January 16, 2014
NAMIBIA
2 INTERNATIONAL MONETARY FUND
3. Dynamic Panel Result (System GMM) ________________________________________________ 19
4. Panel Group Mean Fully Modified OLS Results _______________________________________ 21
5. Panel Probit Analysis, TFP ____________________________________________________________ 23
6. Predictive Probabilities _______________________________________________________________ 23
APPENDIX
I. Methodologies for Modeling Total Factor Productivity _______________________________ 28
FINANCIAL INCLUSION AND STABILITY IN AFRICA’S MIDDLE-INCOME
COUNTRIES INCLUDING NAMIBIA __________________________________________________32
A. Introduction _________________________________________________________________________ 32
B. Literature Review _____________________________________________________________________ 33
C. Data__________________________________________________________________________________ 35
D. Analytical Framework ________________________________________________________________ 36
E. Empirical Findings ____________________________________________________________________ 38
F. Conclusions __________________________________________________________________________ 40
References ______________________________________________________________________________ 45
BOXES
1. Derivation of Z-Score ________________________________________________________________ 44
2. Derivation of Z-Score Threshold in Binary Estimation ________________________________ 44
TABLES
1. List of Independent Variables ________________________________________________________ 42
2. Marginal Effects: Adults Saving versus SME Access Constraint ______________________ 42
3. Individual Access versus SME Access _________________________________________________ 43

NAMIBIA
INTERNATIONAL MONETARY FUND 3
0
2000
4000
6000
8000
10000
120001980 1995 2012
Source: IMF World Economic Outlook.
Average GDP Per Capita(US$)
POLICIES THAT CAN RAISE POTENTIAL GROWTH IN
SMALL MIDDLE-INCOME-COUNTRIES OF SSA
Many small middle-income countries (SMICs) in sub-Saharan Africa (SSA) have experienced a
moderation in trend growth in recent years in a volatile and an uncertain external environment.
Although factor accumulation, most notably capital deepening, was crucial to the success of many
SMICs historically, this growth model appears to have run its course. The analysis in this chapter
suggests that the decline in the contribution of total factor productivity (TFP) to growth is largely
responsible for the slowdown in trend growth in many SMICs, which highlights the need for policy
actions to reinvigorate productivity growth. The chapter explores the question of what kind of
structural policies could boost productivity growth in SMICs, including Namibia, and the political-
economy factors that may be contributing to the slow implementation of these critical reforms in
these countries. The findings suggest that although macroeconomic stability and trade openness
are necessary for productivity growth, they are not sufficient. SMICs need to improve the quality of
their public spending, most notably on education to minimize the skill mismatch in the labor
market, reduce the regulatory burden on firms, improve access to finance by small and medium-
sized enterprises and create the enabling environment to facilitate structural transformation in
these economies. Given the short-term cost of these reforms, the timing and sequencing of reforms
and, the role of quick wins is important in implementing reforms. In some case, a social bargain
can be a mechanism to generate consensus around a package of mutually reinforcing reforms.
A. Introduction
1. Prudent macroeconomic
management and improved institutional
settings in many of the SMICs in SSA
delivered impressive economic
performance in the last few decades.1 A
prolonged period of strong growth has
raised overall incomes and delivered good
economic outcomes. GDP per capita of
SMICs of SSA on average increased by more
than 5 times over the last 30 years
compared to only 1.7 times increase for the
SSA average excluding South Africa and
1 The following SMICs are included in the analysis of this chapter: Botswana, Cape Verde, Lesotho, Mauritius, Namibia,
Seychelles, and Swaziland.

NAMIBIA
4 INTERNATIONAL MONETARY FUND
-1
0
1
2
3
4
5
6
Botswana Cape Verde Lesotho Mauritius Namibia Seychelles Swaziland
Source: IMF Regional Economic Outlook: Sub-Saharan Africa.
GDP Growth Per Capita and the Middle-Income Trap(Last 5-year average, percent)
Nigeria (text chart on page 3). The governments of these countries have generally been effective
in addressing the countries’ development challenges, including narrowing the infrastructure gap
and facilitating access to education and health.
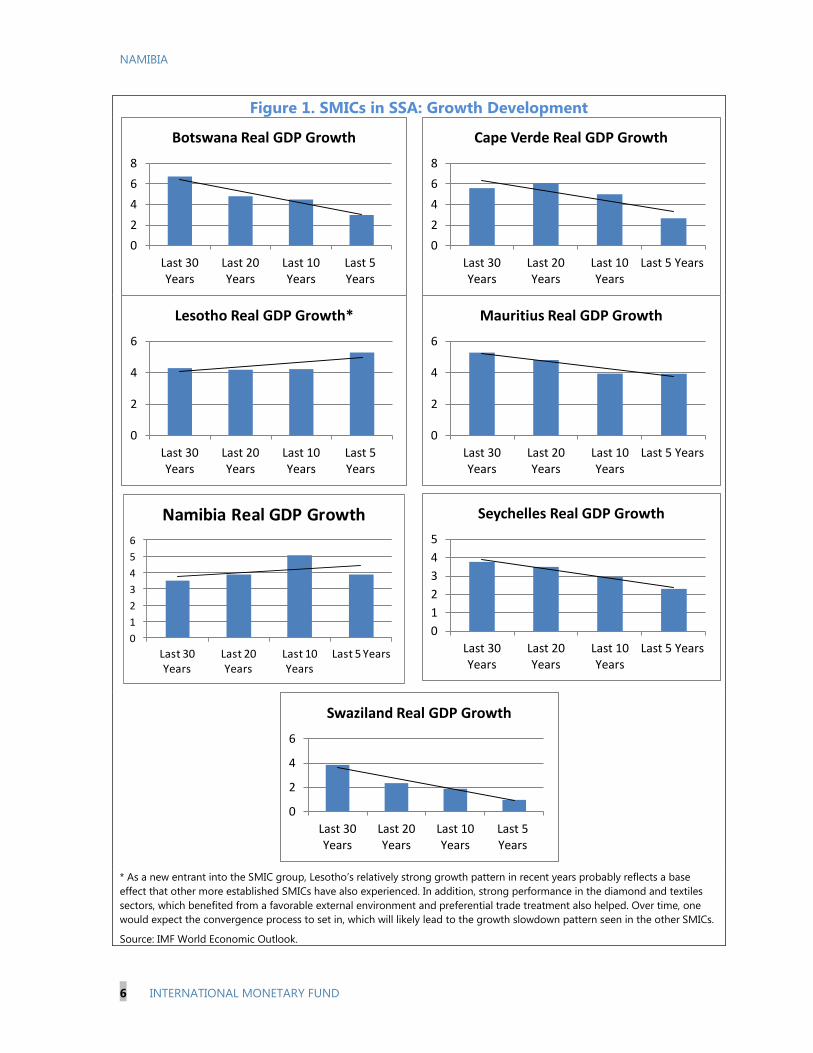
2. However, in many of the SMICs, as in middle-income countries in other regions,
growth rates are slowing, reflecting reduced contribution of TFP (Figure 1 and Aiyar and
others (2013)). Per capital real GDP
growth for most of these countries has
fallen short of the 4 percent average
needed to escape from the so called
“Middle-Income-Trap” (text chart).2 The
growth moderation in many of these
countries reflects the slowdown in the
contribution of TFP to growth that has
reduced their potential to graduate from
middle-income status into high income
status. This highlights the importance of
SSA MICs reinvigorating policies to boost
TFP growth.
3. This chapter thus focuses on identifying policy reforms that would increase
productivity growth―a key driver of long-term growth prospects.3 The paper explores
policy options that could boost productivity growth in SSA MICs based on the analysis of the role
of productivity in the growth dynamics of these countries using a cross-country study. The
chapter adds to the existing growth literature in two ways: (i) it looks not only at the level of
education but at its quality by introducing the index of skill-mismatch as an indicator explaining
TFP growth and (ii) looks at the impact of macro-stability friendly forms of financial inclusion on
productivity growth.
4. Our analysis suggests that structural reforms are needed to foster TFP growth and
to accelerate convergence to higher income levels. In particular, boosting productivity growth
would require reforms in the banking sector, reducing regulatory barriers on firms, improving the
quality of public spending most notably on secondary and tertiary education to reduce skill
mismatch, alleviating infrastructure bottlenecks, deepening capital markets, and investing in
research and development and new technologies. In addition we find that there is a limit on how
2 For more detail see J. Felipe, 2012, “Tracking the Middle-Income Trap: What is It, Who is in It, and Why?” Asian Development
Bank.
3 While the paper does not formally test the role of exchange rate regimes, the stylized facts suggest that exchange rate
regimes do not play a discernible role on the evolution of growth, which is broadly consistent with the body of work in the
literature stating that by and large the exchange rate regime by itself does not determine economic outcomes (see for example
the recent Fund paper by J. G. Stotsky et al (2012)).
NAMIBIA
INTERNATIONAL MONETARY FUND 5
much the government can close the infrastructure gap by borrowing, because after a certain
threshold, government debt’s marginal impact on productivity growth becomes negative.
5. The chapter also touches on the question of the political economy considerations in
the implementation of structural reforms. The implementation of structural reform is not an
easy task in any country. Up-front economic and political costs—including lower growth,
redistribution of income, frictional unemployment4, and the erosion of oligopoly rents—means
there is usually a strong constituency of stakeholders that favor the status quo since they stand
to lose from structural reforms. Creative solutions must be found in SMICs to overcome these
obstacles.
6. The rest of the chapter is organized as follows: Section B provides the literature
review; Section C discusses stylized facts; Section D presents the empirical analysis; and Section E
discusses the conclusions and the policy implications for SMICs and future areas of research.
B. Literature Review: Determinants of Total Factor Productivity
7. This section reviews the main determinants of TFP from the relevant literature. TFP
is related to economic growth through improvement in resource allocation, innovation, and
productivity of each of the factor inputs, providing an opportunity to grow more efficiently and
sustainably in the long run. Based on the existing theoretical and empirical literature, a number
of determinants have an impact on TFP’s contribution to growth. These determinants of TFP can
be summarized into several conceptual variables as follows.
8. Macroeconomic variables: A number of macroeconomic factors could play a role in
determining the TFP and its growth as they may influence both input use and allocative
efficiency. The two macroeconomic variables often discussed in the literature are inflation and
size of government. The relationship between inflation and productivity growth is found to be
negative in a number of cross-country empirical studies (see for example, Fischer (1993); De
Gregorio (1993); Ghosh and Phillips (1998); Loko and Diouf (2009); Espinoza (2012); and Barro
(2013)). While the role of government is potentially an important factor in growth performance,
the relationship between these two variables remains ambiguous. The size of the public sector
can both foster and hinder productivity growth (Ranis, 1989). Provision of basic public goods and
economic infrastructure would enhance overall productivity (Ghali, 1999). On the other hand, a
number of studies point to the negative effect of government spending on economic growth,
owing to government inefficiencies and low quality of public spending (see for instance, Barro,
(1991); Sala-i-Martin, Doppelhofer, and Miller, (2004); Loko and Diouf, (2009), Danquah, Moral-
Benito, and Outtara, (2013)).
4 Frictional unemployment is when workers leave their jobs to find better ones. It is usually thought of as a voluntary exit, but
can also occur as a result of a layoff or termination with cause. The time, effort and expense it takes to find these new jobs is
known as friction.
NAMIBIA
6 INTERNATIONAL MONETARY FUND
Figure 1. SMICs in SSA: Growth Development
* As a new entrant into the SMIC group, Lesotho’s relatively strong growth pattern in recent years probably reflects a base
effect that other more established SMICs have also experienced. In addition, strong performance in the diamond and textiles
sectors, which benefited from a favorable external environment and preferential trade treatment also helped. Over time, one
would expect the convergence process to set in, which will likely lead to the growth slowdown pattern seen in the other SMICs.
Source: IMF World Economic Outlook.
0
2
4
6
8
Last 30 Years
Last 20 Years
Last 10 Years
Last 5 Years
Botswana Real GDP Growth
0
2
4
6
8
Last 30 Years
Last 20 Years
Last 10 Years
Last 5 Years
Cape Verde Real GDP Growth
0
2
4
6
Last 30 Years
Last 20 Years
Last 10 Years
Last 5 Years
Lesotho Real GDP Growth*
0
2
4
6
Last 30 Years
Last 20 Years
Last 10 Years
Last 5 Years
Mauritius Real GDP Growth
0
1
2
3
4
5
6
Last 30 Years
Last 20 Years
Last 10 Years
Last 5 Years
Namibia Real GDP Growth
0
1
2
3
4
5
Last 30 Years
Last 20 Years
Last 10 Years
Last 5 Years
Seychelles Real GDP Growth
0
2
4
6
Last 30 Years
Last 20 Years
Last 10 Years
Last 5 Years
Swaziland Real GDP Growth

NAMIBIA
INTERNATIONAL MONETARY FUND 7
Figure 2. SSA SMICs’ Growth Decomposition
Source: Penn World Tables and IMF staff calculations.
1/ We used the human-capital augmented growth accounting framework to derive the contribution of total factor
productivity to growth.
-4
-2
0
2
4
6
8
10
12
1981-85 1986-90 1991-95 1996-00 2001-05 2006-10
Capital Labor
TFP Growth
Botswana Growth Decomposition
(Annual percent)
-2
0
2
4
6
8
10
1981-85 1986-90 1991-95 1996-00 2001-05 2006-10
Cape Verde Growth Decomposition
(Annual percent)
-2
-1
0
1
2
3
4
5
6
1981-85 1986-90 1991-95 1996-00 2001-05 2006-10
Lesotho Growth Decomposition
(Annual percent)
0
2
4
6
8
10
1981-85 1986-90 1991-95 1996-00 2001-05 2006-10
Mauritius Growth Decomposition
(Annual percent)
-4
-2
0
2
4
6
1981-85 1986-90 1991-95 1996-00 2001-05 2006-10
Namibia Growth Decomposition
(Annual percent)
-4
-2
0
2
4
6
8
1981-85 1986-90 1991-95 1996-00 2001-05 2006-10
Seychelles Growth Decomposition
(Annual percent)
-2
-1
0
1
2
3
4
5
6
1981-85 1986-90 1991-95 1996-00 2001-05 2006-10
Swaziland Growth Decomposition
(Annual percent)
NAMIBIA
8 INTERNATIONAL MONETARY FUND
9. Openness and technology creation and transfer: Openness to the world economy is
another important factor explaining total factor productivity growth. Trade openness increases
international contacts and can be a source of learning—as technology is often embodied in
goods (Lewis, 1979; Grossman and Helpman, 1993; Sachs and Warner, 1995; Sala-i-Martin et al,
2004; and Dollar and Kraay, 2004). FDI is also a key channel for the transfer of advanced
technology and research and development (R&D) knowledge from industrialized to developing
countries. In addition, Loko and Diouf (2009) emphasized that the level of FDI reflects the
macroeconomic environment of a country.
10. Quality of labor input and efficient allocation: An increase in human capital base can
have a positive impact on TFP growth by facilitating structural change and technological
improvement (Romer, 1990; Barro, 2001). In addition, human capital can help to absorb positive
externalities from international trade and FDI (Loko and Diouf, 2009). The gaps between the
supply of and demand for skills could account for the decline in TFP growth (Acemoglu and
Zilibotti, 2001).
11. Female labor force participation: Higher labor force participation, particularly among
women, may increase TFP growth if technological progress and the female labor force are
complementary (Galor and Weil, 2000; and Madsen and Ang, 2013). However, some of these
show that the impact of increased female labor force participation on productivity growth is
likely to be concave and decline over time (McGuckin and Van Ark, 2005).
12. Sectoral composition and structural change: Many studies address the importance of
structural change, captured by sectoral production or sectoral employment, in determining TFP
growth. A transition from concentration in less productive to more productive sectors would
positively affect aggregate productivity growth (Lewis, 1954; Ranis and Fei, 1961). While most of
the literature finds a positive relationship between structural change and TFP growth at the
cross-country level (see for example, Poirson (2000); Jaumotte and Spatafora (2007); Loko and
Diouf (2009)), some specific country studies show ambiguous results owing to the pre-conditions
on market institution, openness, and labor market mobility (Lu, 2002). A less diversified economy
could portend risk and vulnerability, which will in turn undermine TFP growth.
13. Monetary and financial development: The positive impact of financial sector
development on productivity has been well documented (see for instance, Roubini and Sala-i-
Martin, (1992); King and Levine, 1993; and Aghion, Howitt and Mayer-Foulkes, 2005). The main
intuition is that financial markets enhance productivity through efficient capital reallocation and
that financial development also brings in technological innovation.
14. Institutional and regulatory factors: Many recent papers have shown that institutional
factors can enhance productivity growth by ensuring resource reallocation efficiency and
encouraging a good economic environment for investment, (see for example, Hall and Jones
(1999); Acemoglu, Johnson and Robinsonl (2004); Glaeser and others (2004); Acemoglu and
Johnson (2003); Easterly (2006)).

NAMIBIA
INTERNATIONAL MONETARY FUND 9
The table below presents a summary of the key influential factors from the literature and the
variables, which will be used in the qualitative and quantitative analyses of this chapter.
Summary of TFP Determinants and Variables Used in SMICs Analysis
TFP determinants from the literature Variables
1. Macroeconomic conditions Inflation, government debt, public employment
2. Openness, and technology creation and transfer Trade, FDI, R&D, infrastructure
3. Quality of labor inputs and efficient allocation Years of schooling, skill mismatch
4. Female labor force participation Female labor force participation rate
5. Sectoral composition and structural change Sector shares of output, economic diversification
6. Monetary and financial development credit, market capitalization
7. Institution and regulatory factors Labor and business regulation indices, doing business indicators, income inequality,
C. Stylized Facts
15. This section presents the stylized facts on the factors that could explain the
evolution of TFP in SMICs. Although these economies have made strides towards upgrading
their infrastructure networks and attracting FDI, the relative lack of diversification of their
production and trade base has often increased their vulnerability to external shocks such as oil
price hikes. The analysis of the stylized facts shows a two-stage trend in TFP and thus growth.
In earlier decades, during periods of relatively supportive global economic environment,
SMICs generally used capital deepening in the form of infrastructure investment
programs and higher FDI to bolster their productivity and thus growth.
However, in the last few years, in the face of a less favorable external environment, the
growth momentum in many SMICs waned because structural reforms that would sustain
the growth of TFP such as a diversified economic base with a business friendly
environment were not fully in place in many SMICs. In addition, the nascent regulatory
system often impinged on their institutional setup and prevented their TFP from rising
further, although this issue is being addressed in many SMICs, albeit at different pace.
A further analysis of the stylized facts is presented below.
Infrastructure Investments and the Role of FDI
16. Reliance on FDI inflows in key sectors has been crucial for enhancing productivity
growth and for boosting growth potential in many SMICs.
Good management of natural resources, following years of significant FDI inflows into
the mining sector, allowed Botswana to transform revenues from natural resources into
sustained boosts to TFP by being effectively re-invested in infrastructure, health and

NAMIBIA
10 INTERNATIONAL MONETARY FUND
education. Namibia’s TFP has been highly correlated with FDI in the mining sector. In
2008, for instance, the re-opening of two copper mines by Weatherly Mining, the
Skorpion zinc mine and other smaller metal mines were the catalysts that encouraged
capital inflows by international and private investors. The country’s liberal Foreign
Investment Act of 1990 provided guarantees against nationalization, allowed freedom to
remit capital and profits abroad, facilitated currency convertibility, and instituted a
process for settling disputes equitably.
Mauritius, likewise, carefully addressed the infrastructure gap in the 1980s by ensuring
country-wide coverage of basic infrastructure services such as electricity, water and
telecommunications network. Mauritius’ strong legal and institutional framework
attracted massive inflows of FDI during the late 1980s / early 1990s. More recently, the
government has sought public-private partnerships with foreign investors to invest in the
electricity generation and port infrastructure. The country benefited enormously from the
investment, expertise, and technical know-how of Hong Kong and Chinese businessmen
who took textile and apparel manufacturing to new heights and kindled the country’s
Export-Processing Zone (EPZ) industrialization phase. The country’s attractive fiscal
regime and the Double Taxation Treaty signed with India, have been powerful incentives
for attracting foreign businesses and for stimulating the offshore sector. In Seychelles,
massive investments in the country’s infrastructure network have constituted the bedrock
of productivity growth in years in which this growth materialized. Seychelles and Cape-
Verde, which have a smaller economic base and are relatively more dependent on
tourism, have experienced increasing TFP in years in which FDI flowed into construction
and tourism sectors.
Before the expansion of its industrial base, Lesotho’s productivity growth in the late
1980s and early 1990s was primarily driven by the large public sector investments in
basic infrastructure. Since late 2000, foreign investment in diamond mining by foreign
mining companies helped support Lesotho’s TFP, against a backdrop of growing
concerns regarding emerging weaknesses in its textile manufacturing output.
Economic Concentration
17. The lack of diversified production and trade base, which might also be a by product
of development, often intensifies the vulnerability of many SMICs to external
developments, and thus undermines TFP contribution to growth. High economic
concentration is a common feature among many SMICs in SSA.
The slowdown in global growth accompanied by lower commodity prices also
undermined productivity growth in Botswana and Namibia, both of which are highly
dependent on production of mining such as diamonds and uranium.
In Seychelles, tourism is the leading sector ahead of tuna fishing, accounting for
25 percent of GDP, generating 70 percent of foreign currencies, and employing 40
percent of the labor force. Cape-Verde, likewise, is highly dependent on the tourism
NAMIBIA
INTERNATIONAL MONETARY FUND 11
sector, which accounts for about 20 percent of GDP. TFP in both Seychelles and Cape-
Verde, has been declining in recent years following the euro crisis, as their tourism
industry took the hit during those years. Mauritius’ gradual diversification into textiles,
tourism, and financial services in the 1980s and 1990s, helped build resilience through a
balanced production and trade structure. The Mauritian economy nonetheless suffered a
few setbacks in 2008–10 when the euro crisis peaked and an important trade preferential
agreement, the Sugar Protocol, was eroded in 2009. Another preferential agreement in
textiles, the Multi-Fiber Agreement, was dismantled in 2004. The Mauritian TFP declined
in 2004 and during 2008–10.
Uncertainties about possible extension of the Africa Growth and Opportunity Act (AGOA)
undermined growth of Lesotho’s textile manufacturing sector in the late 2000s.
Exogenous shocks
18. Exogenous shocks often undermine productivity growth in SMICs and thus growth.
Externally generated shocks have had material effects on TFP (and subsequently on growth
potential). The unfolding of the crisis in Europe in 2008–10 weakened potential growth in many
SMICs.
In the resource-rich SMICs, Botswana and Namibia, the 2008–09 global shock led to
growth contraction despite the use of countercyclical measures including increase in
capital spending to smooth the impact of the global shock.
In Mauritius and Seychelles external shocks undermined economy-wide productivity,
including in tourism. Seychelles potentially is also exposed to risks such as piracy in the
Indian Ocean and hazardous events such as tsunamis or changes in climate-related
factors that may affect the quality of fish stock, thereby affecting the tuna fishing and
artisanal fishing. Given the economy’s high dependence on oil for its primary energy
needs, the economy also remains vulnerable to international oil price hikes. Cape Verde’s
similar exposure to oil shocks potentially explained the decline in TFP in 2004–05. This
was aggravated by a lower-than-average rainfall in that year (which had negative impacts
on agricultural productivity).
Weather-related conditions have often affected Lesotho’s agriculture, which, despite its
relatively low contribution to GDP growth, makes up a relatively large part of the
livelihood in the country. Swaziland also experienced negative contribution of TFP to
growth for a few years since the early 2000s, because of weather-related drought that
affected its agricultural sector. The rapid spread of HIV/AIDS has undermined human
capital in Swaziland which remained in 2007, the most affected country in the world,
according to the United Nations. By lowering life expectancy, and reducing supply of
labor, HIV/AIDS deterred human capital accumulation in Swaziland and reduced
productivity growth during that period.
NAMIBIA
12 INTERNATIONAL MONETARY FUND
Sources: World Bank WDI
0
10
20
30
40
50
60
70
IDN
MU
S
TH
A
ME
X
CP
V
SWZ
CH
L
LSO
BR
A
BW
A
ZA
F
NA
M
SYC
Poverty and Income InequalityGini coefficient
Poverty rates (Based on the WB's PPP$ 1.25 per day)
Regulatory Barriers, Structural Transformation and Political-Economy Considerations
19. The confluence of a less favorable external environment and barriers to private
sector development also negatively affected productivity growth in many SMICs. While
most countries in our study have been making strides towards addressing the major regulatory
constraints in the last decade, the presence of some regulatory barriers continues to impinge on
their growth potential.
In both Botswana and Namibia, delayed policy action on easing the doing business and
the regulatory burden on firms, inhibited the pace of private sector development and
thus affected their rankings in global economic competitiveness in recent years. Both
countries also experienced skill mismatch in the labor market, which continues to
contribute to their persistently high structural unemployment.
In Cape-Verde, the gradual removal of regulations that hindered the development of the
private sector helped explain the rise in TFP in the 1990s. However, the country’s
international competitiveness in tourism and other industries dropped significantly owing
to restrictive labor market regulations, inefficient logistics, and high transportation costs
in 2008–11, resulting in a declining TFP. In Seychelles (the only country in the list to have
undergone an economic crisis recently), the restrictive labor market regulations and high
infrastructure access costs are stumbling blocks to improving the country’s productivity
and competitiveness. If left unaddressed, this may continue to undermine the
competitiveness of its export industries.
The need for structural transformation and laying the enabling environment for factors to
move from low return sectors to high return sectors (see Table in Box 1) and consistently
experimenting and innovating through the implementation of new ideas are also
important ingredients in lifting up potential growth in an environment characterized by
structural impediments (see Box 1).
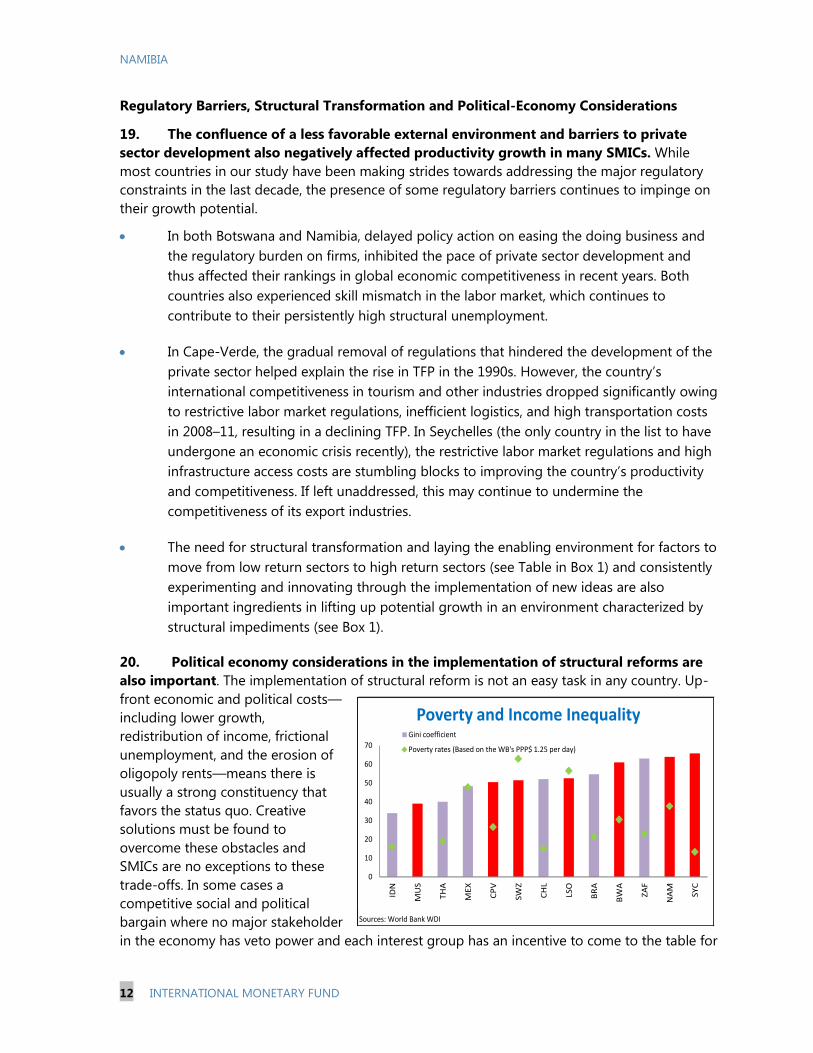
20. Political economy considerations in the implementation of structural reforms are
also important. The implementation of structural reform is not an easy task in any country. Up-
front economic and political costs—
including lower growth,
redistribution of income, frictional
unemployment, and the erosion of
oligopoly rents—means there is
usually a strong constituency that
favors the status quo. Creative
solutions must be found to
overcome these obstacles and
SMICs are no exceptions to these
trade-offs. In some cases a
competitive social and political
bargain where no major stakeholder
in the economy has veto power and each interest group has an incentive to come to the table for

NAMIBIA
INTERNATIONAL MONETARY FUND 13
mutually beneficial solutions, can be a mechanism to generate consensus around a package of
mutually reinforcing reforms. Mauritius has been the archetype of such compromises, where a
potentially divisive ethnical mix gave birth to successive coalition governments and generous
social benefits for all. This approach has been successful with the country embarking on
successive waves of structural reforms. The question is why have other SMICs not been able to
replicate such a social and political bargain mechanism to speed up the implementation of
productivity-enhancing reforms? Are these related to capacity constraints? Or is the dual nature
of these SMIC economies (highly unequal societies with poverty rates reminiscent of large
emerging markets—see text chart5) making it difficult to generate “consensus” in terms of
implementing such productivity-enhancing structural reforms? In some cases, the desire to
promote more public investment clashes with social aspirations towards more public services or
redistribution, especially in highly unequal societies with poverty rates reminiscent of low-income
countries (LICs) (for example Lesotho and Swaziland).
5 In the chart, IND represents Indonesia, MUS is Mauritius, THA is Thailand, MEX is Mexico, CPV is Cape Verde, SWZ is
Swaziland, CHL is Chile, LSO is Lesotho, BRA is Brazil, BWA is Botswana, ZAF is South Africa, NAM is Namibia and SYC is
Seychelles.
NAMIBIA
14 INTERNATIONAL MONETARY FUND
Source: Country Authorities.
Agriculture, forestry and fishing, 3.5%
Manufacturing, 16.9%
Construction, 6.3%
Wholesale & retail trade,
12.0%
Accommodation and food
service, 6.9%
Information and
communication, 4.6%
Transportation and storage ,
5.8%
Real estate, 5.6%
Finance and insurance,
10.2%
Education, 4.4%
Human health and social
work, 3.8%
Others, 20.0%
Percent distribution of GDP by industry group (2012)Mauritius as a model of
economic transformation
Emerging sectors:ICT
Real Estate – IRS/ERS
Seafood hub
Knowledge hub
Health hub
Diversification of markets:Reducing our dependence on euro markets
Regional integration
Average GDP Per Capita
Agriculture Industry Services Agriculture Industry Services (PPP, 2005 constant USD)
Asian countries:
Bangladesh -0.5 0.5 0.0 -0.3 0.4 -0.1 3.6
Cambodia, 1998—2010 -1.8 0.7 1.0 -1.5 0.8 0.8 5.6
Vietnam -0.7 0.8 -0.1 -1.2 0.5 0.6 5.5
Indonesia, 1993—2011 -0.2 -0.1 0.3 -0.9 0.3 0.6 3.2
India -0.7 0.0 0.7 -0.7 0.4 0.3 4.8
SSA MICs, 1995—2010 unless indicated otherwise:
Botswana -0.5 -0.1 0.1 0.9 -0.4 -0.1 3.0
Cape Verde -0.4 -0.2 0.1 -0.2 -0.1 0.2 7.2
Lesotho -0.3 0.4 -0.1 … … … 2.7
Mauritius, 2000—2010 -0.3 -0.2 0.1 -0.3 -0.3 0.3 3.4
Namibia -0.4 0.0 0.1 -0.2 0.2 0.1 2.3
Seychelles, 2004—2010 -0.4 -0.1 0.0 … … … 2.9
Swaziland -0.1 -0.1 0.2 … … … 1.1
Sources: Haver Analytics; WDI; and IMF staff calculations.
Output Shares Employment Shares 1
1 Employment shares data for Botswana was calculated through period of 1996-2006, Cape Verde (1995-2007), and Namibia (2000-2011).
Change in Output, Employment Shares, and GDP per Capita, 1990–2011
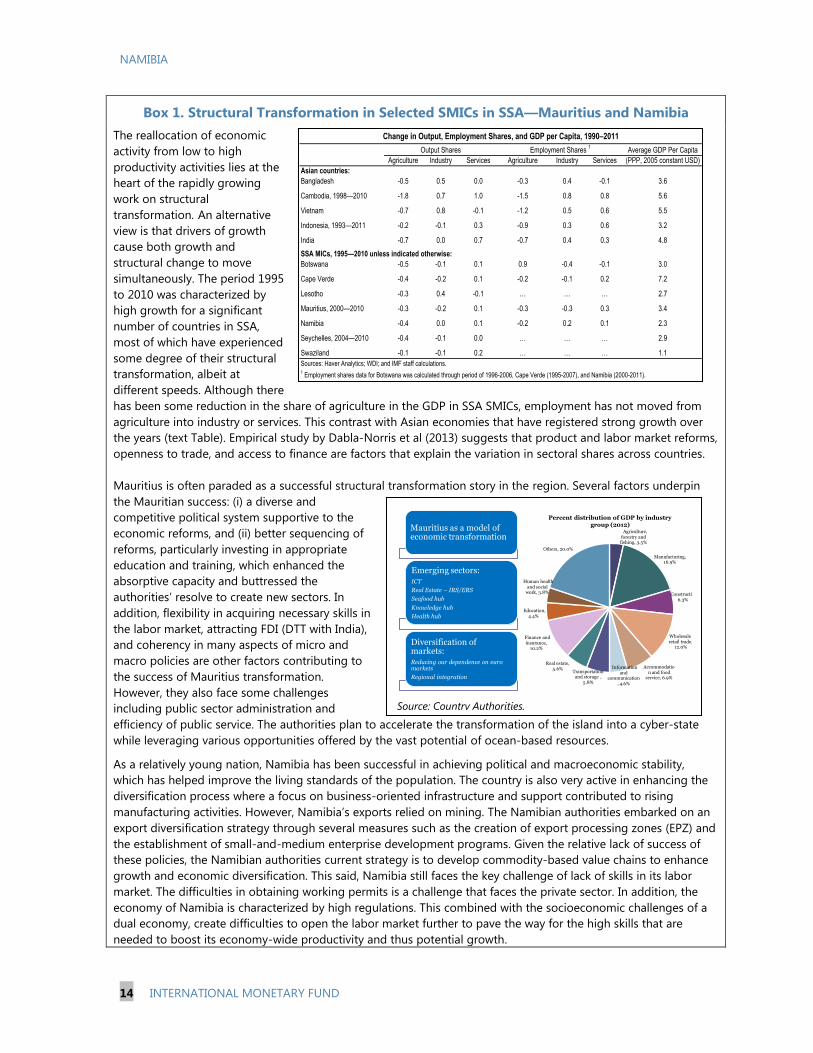
Box 1. Structural Transformation in Selected SMICs in SSA—Mauritius and Namibia
The reallocation of economic
activity from low to high
productivity activities lies at the
heart of the rapidly growing
work on structural
transformation. An alternative
view is that drivers of growth
cause both growth and
structural change to move
simultaneously. The period 1995
to 2010 was characterized by
high growth for a significant
number of countries in SSA,
most of which have experienced
some degree of their structural
transformation, albeit at
different speeds. Although there
has been some reduction in the share of agriculture in the GDP in SSA SMICs, employment has not moved from
agriculture into industry or services. This contrast with Asian economies that have registered strong growth over
the years (text Table). Empirical study by Dabla-Norris et al (2013) suggests that product and labor market reforms,
openness to trade, and access to finance are factors that explain the variation in sectoral shares across countries.
Mauritius is often paraded as a successful structural transformation story in the region. Several factors underpin
the Mauritian success: (i) a diverse and
competitive political system supportive to the
economic reforms, and (ii) better sequencing of
reforms, particularly investing in appropriate
education and training, which enhanced the
absorptive capacity and buttressed the
authorities’ resolve to create new sectors. In
addition, flexibility in acquiring necessary skills in
the labor market, attracting FDI (DTT with India),
and coherency in many aspects of micro and
macro policies are other factors contributing to
the success of Mauritius transformation.
However, they also face some challenges
including public sector administration and
efficiency of public service. The authorities plan to accelerate the transformation of the island into a cyber-state
while leveraging various opportunities offered by the vast potential of ocean-based resources.
As a relatively young nation, Namibia has been successful in achieving political and macroeconomic stability,
which has helped improve the living standards of the population. The country is also very active in enhancing the
diversification process where a focus on business-oriented infrastructure and support contributed to rising
manufacturing activities. However, Namibia’s exports relied on mining. The Namibian authorities embarked on an
export diversification strategy through several measures such as the creation of export processing zones (EPZ) and
the establishment of small-and-medium enterprise development programs. Given the relative lack of success of
these policies, the Namibian authorities current strategy is to develop commodity-based value chains to enhance
growth and economic diversification. This said, Namibia still faces the key challenge of lack of skills in its labor
market. The difficulties in obtaining working permits is a challenge that faces the private sector. In addition, the
economy of Namibia is characterized by high regulations. This combined with the socioeconomic challenges of a
dual economy, create difficulties to open the labor market further to pave the way for the high skills that are
needed to boost its economy-wide productivity and thus potential growth.
NAMIBIA
INTERNATIONAL MONETARY FUND 15
0102030405060708090
100
Bo
tsw
ana
Cap
e V
erd
e
Leso
tho
Mauri
tius
Nam
ibia
Seyc
helles
Sw
azi
land
Services Industry Agriculture
Composition of GDP
(Percent of total)
0
0.1
0.2
0.3
0.4
0.5
0.6
0.7
0.8
0.9
1
2000 2002 2004 2006 2008 2010
Botswana Cape Verde
Lesotho Mauritius
Namibia Seychelles
Swaziland
Export Diversification Index
(HFI Index, lower=greater diversification)
-4
-3
-2
-1
0
1
2
3
4
5
-5 0 5 10 15 20
TFP
FDI
BWA CPV LSO
MUS NAM SYC
SWZ
TFP and FDI
(Contribution to growth Y-axis, percent of GDP X-axis)
-4
-3
-2
-1
0
1
2
3
4
5
0 10 20 30 40
TFP
Phone Lines
BWA CPVLSO MUS
NAM SYC
TFP and Phone Lines
(Contribution to growth Y-axis, phone lines X-axis)
-4
-3
-2
-1
0
1
2
3
4
5
0 50 100 150 200
TFP
Terms of Trade
BWA LSO
MUS NAM
SYC SWZ
TFP and Terms of Trade
(Contribution to growth Y-axis, terms of trade X-axis)
-4
-3
-2
-1
0
1
2
3
4
5
5 6 7 8
TFP
Regulatory Index
BWA
LSO
MUS
NAM
TFP and Regulatory Burden
(Contribution to growth Y-axis, regulatory index X-axis)
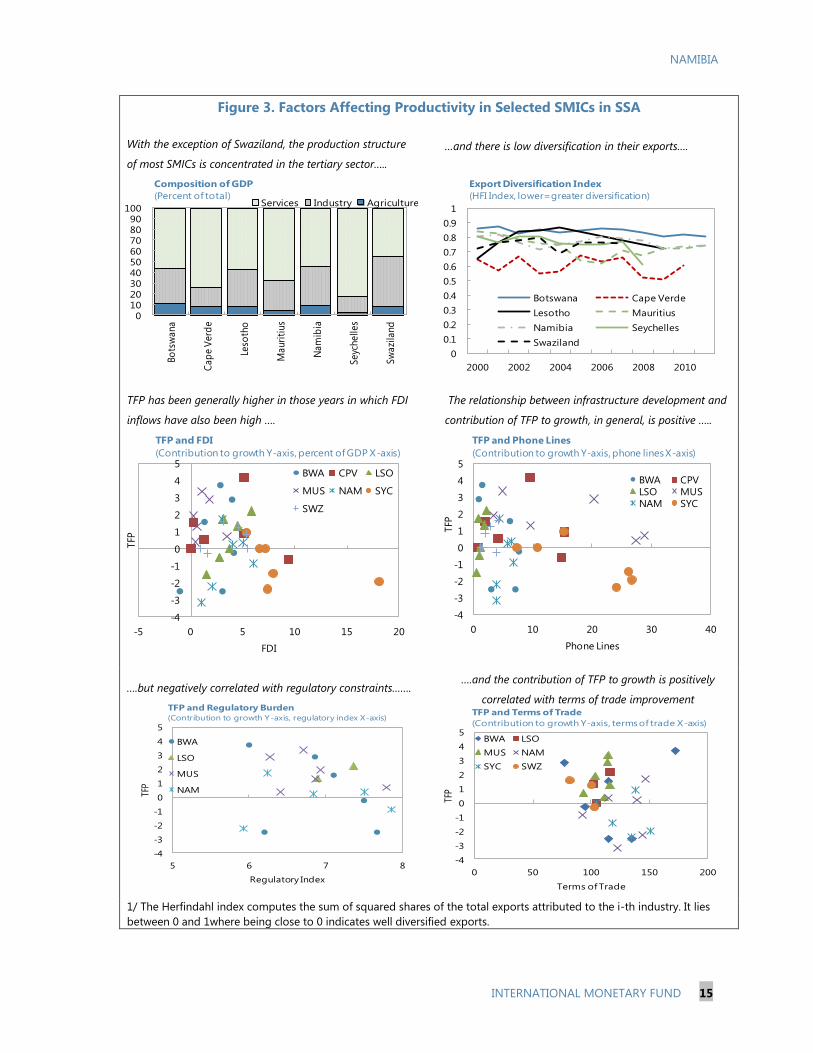
Figure 3. Factors Affecting Productivity in Selected SMICs in SSA
With the exception of Swaziland, the production structure
of most SMICs is concentrated in the tertiary sector…..
…and there is low diversification in their exports….
TFP has been generally higher in those years in which FDI
inflows have also been high ….
The relationship between infrastructure development and
contribution of TFP to growth, in general, is positive …..
….but negatively correlated with regulatory constraints…….
….and the contribution of TFP to growth is positively
correlated with terms of trade improvement
1/ The Herfindahl index computes the sum of squared shares of the total exports attributed to the i-th industry. It lies
between 0 and 1where being close to 0 indicates well diversified exports.
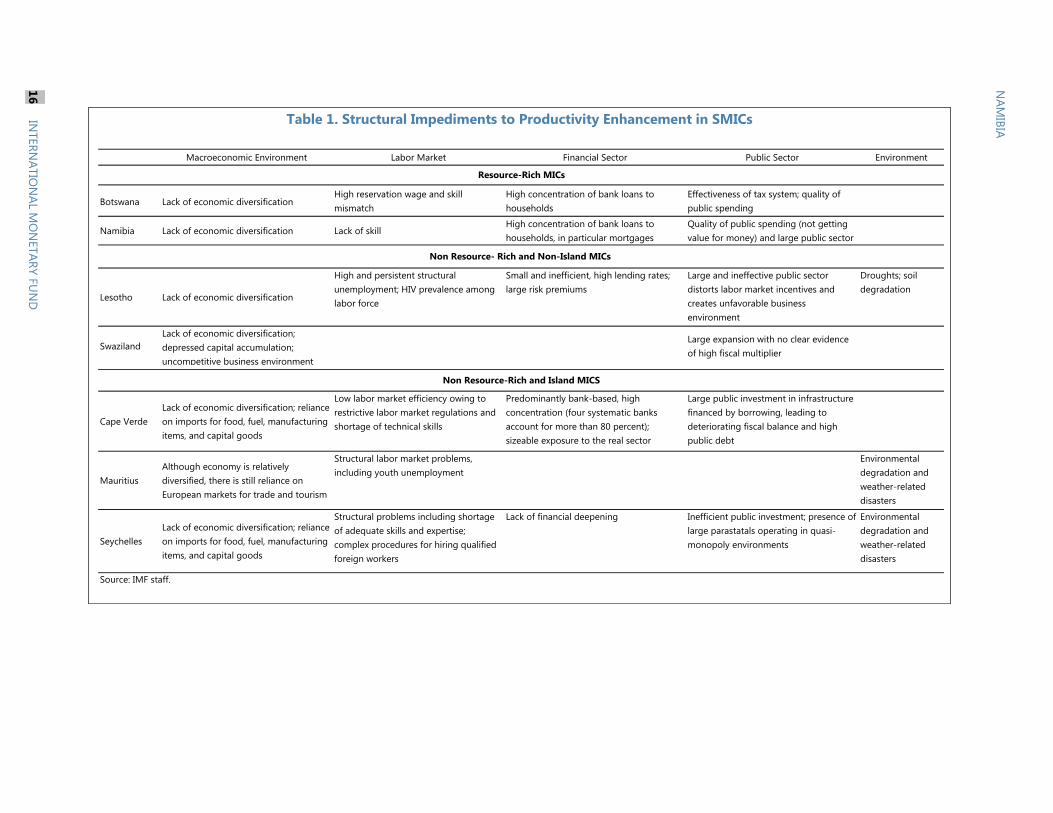
Table 1. Structural Impediments to Productivity Enhancement in SMICs
Macroeconomic Environment Labor Market Financial Sector Public Sector Environment
Botswana Lack of economic diversificationHigh reservation wage and skill
mismatch
High concentration of bank loans to
households
Effectiveness of tax system; quality of
public spending
Namibia Lack of economic diversification Lack of skillHigh concentration of bank loans to
households, in particular mortgages
Quality of public spending (not getting
value for money) and large public sector
Lesotho Lack of economic diversification
High and persistent structural
unemployment; HIV prevalence among
labor force
Small and inefficient, high lending rates;
large risk premiums
Large and ineffective public sector
distorts labor market incentives and
creates unfavorable business
environment
Droughts; soil
degradation
Swaziland
Lack of economic diversification;
depressed capital accumulation;
uncompetitive business environment
Large expansion with no clear evidence
of high fiscal multiplier
Cape Verde
Lack of economic diversification; reliance
on imports for food, fuel, manufacturing
items, and capital goods
Low labor market efficiency owing to
restrictive labor market regulations and
shortage of technical skills
Predominantly bank-based, high
concentration (four systematic banks
account for more than 80 percent);
sizeable exposure to the real sector
Large public investment in infrastructure
financed by borrowing, leading to
deteriorating fiscal balance and high
public debt
Mauritius
Although economy is relatively
diversified, there is still reliance on
European markets for trade and tourism
Structural labor market problems,
including youth unemployment
Environmental
degradation and
weather-related
disasters
Seychelles
Lack of economic diversification; reliance
on imports for food, fuel, manufacturing
items, and capital goods
Structural problems including shortage
of adequate skills and expertise;
complex procedures for hiring qualified
foreign workers
Lack of financial deepening Inefficient public investment; presence of
large parastatals operating in quasi-
monopoly environments
Environmental
degradation and
weather-related
disasters
Source: IMF staff.
Resource-Rich MICs
Non Resource- Rich and Non-Island MICs
Non Resource-Rich and Island MICS
NA
MIB
IA
16
IN
TER
NA
TIO
NA
L MO
NETA
RY F
UN
D

NAMIBIA
INTERNATIONAL MONETARY FUND 17
D. Empirical Analysis
Methodology
22. This section assesses empirically the relationship between macroeconomic, structural
and institutional variables and TFP growth in SMICs. In addition to the standard factors and
channels identified in the literature (Section B), this chapter also looks at two relatively less explored
areas. First, it goes beyond the level of education and looks at its quality, because in many of SMICs,
while the literacy rates are high and government spends significant portion of budgetary resources
on education, lack of skills that are in demand in the labor market has contributed to the persistently
high unemployment. Second, the paper looks at the relationship between stability-friendly forms of
financial inclusion (see also the next chapter) and TFP growth.
23. We use several panel data techniques to identify the determinants of TFP growth and
estimate their impact. The following methods are used: (i) dynamic panel estimation, which allows
the lag-dependent variable to affect the dependent variable and controls for the endogeneity;
(ii) panel cointegration for heterogeneous panels, which deals with cross-sectional biases and in
which all variables are endogenously determined; and (iii) binary response models, which measures
the extensive margin effects to get a bigger picture of what structural policy factors contribute to
positive TFP (Appendix I).
Data issues
24. Our dataset comes from five primary sources: The Penn World Tables (PWT), the IMF’s
World Economic Outlook (WEO), the World Bank’s World Development Indicators (WDI), the
Economic Freedom of the World (EFW) project, and the Barro-Lee database. Our dataset covers 33
upper-middle-income countries for the period 1980–2010. For TFP we used data calculated by the
latest PWT for 30 of the countries in our panel data. The sample size was driven by the paper’s focus
on middle-income countries and the availability of data across this group. We derived TFP for Cape
Verde, Seychelles, and Swaziland with the latest available country data using a growth accounting
tool from the World Bank’s Economic Policy and Debt Department. TFP derived this way closely
matches TFP from the PWT for other countries in our panel data. We constructed a
skill-mismatch index, following (Estevão and Tsounta, 2011) methodology (Appendix I).
25. For many of the SMICs in our study, a known issue we faced here is the availability of
data and quality of those statistics. For example, Swaziland has not published national accounts
data in a number of years and the data used to calculate TFP comes from data published in the WDI
database.
Empirical Results
26. The results across different methods depict a broadly consistent picture (Table 2).
Some of the traditional variables such as trade openness and macroeconomic stability have a
significant and positive impact on productivity growth. The index of skill-mismatch has statistically
significant and negative impact on productivity growth, which highlights the need to have a demand
oriented education system. Another important factor is government debt, which has a concave
relationship with TFP growth: at low levels, debt has a positive impact on TFP growth, while at high
levels its impact on TFP growth becomes negative.

NAMIBIA
18 INTERNATIONAL MONETARY FUND
Table 2. Summary of the Empirical Results
System Generalized Method of Moments (GMM)6
27. The dynamic panel estimation is done at the country and year-levels (i.e. the estimates
do not represent long-run effects). Various specifications are estimated on account of limited data
for some variables for the SSA SMICs. First, the impact of government debt on the TFP contribution
appears to be concave. Second, skill mismatches negatively affects the TFP growth. The selected
results are presented in Table 3.7
28. The estimation results suggest that skill-mismatch and government debt have
statistically significant effects on TFP growth (Table 3, Columns 2-A and 2-B).8 The TFP growth
significantly declines as the level of skill mismatches increases. For every 100-point increase in the
skill-mismatch index, TFP growth tends to decline by about 0.3 percentage points. The relationship
between government debt and TFP appears to be concave.9 This implies that a higher level of
government debt reduces the TFP growth, and the negative impacts are increasing with the level of
debt. In addition, this suggests that some initial government debt may improve TFP growth.
6 See Arellano and Bond (1991), and Blundell and Bond (1998). 7 To avoid the problem of over-identification, the instrument set was restricted by (i) creating one instrument for each variable and
lag distance (collapsing instrument set) and (ii) restricting the number of components from the principal component analysis on the
instrument set. By doing so, all the dynamic panel regression analysis survives the over-identification tests (namely the Hansen P-
values are strictly less than 1). 8 This model includes four SSA SMICs of interest: Botswana, Cape Verde, Mauritius, and Namibia.
9 While the relationship between TFP growth and government debt is negative and concave, the coefficient estimates on
government debt are not statistically significant for some specifications (Table 3, Columns 1-A and 1-B). In the last two specification,
the coefficient estimates on government debt become negative for the linear term, and insignificant for the square terms. This
could be due to the fact that too many variables are added to the specification, while the number of panel observations (countries)
reduces substantially.
Short-Run
Dynamic Panel Cointegration Panel Probit
Government debt to GDP (-) or Concave * (-) or Concave * (+)/(-) or Concave *
Trade to GDP (+) (+)* (-)
FDI to GDP (+) (+)/(-)*
Credit to GDP` (+)/(-)1* (+)
Share of agriculture sector in GDP (-)*
Share of manufacturing sector in GDP (+)*
Female labor force participation (+)/(-) (+)/(-)2*
Inflation (+)/(-) (-)* (-)*
Years of education (+) (+)*
Skill mismatch (-)* (-)* (-)*
Credit market regulation index (+) (+)*
Labor market regulation index (+)*
Goods market efficiency index (+)/(-)
SMEs with credit line (+)*
(+)/(-) indicates ambiguous results; * indicates statistical significance at least at the 10 percent level.1This probably reflects the high number of countries in our sample that have experienced financial crisis.
2The impact of female participation becomes positive after controlling for the share of agriculture in GDP.
Long-Run

NAMIBIA
INTERNATIONAL MONETARY FUND 19
However, its positive impact on TFP growth, if it exists, declines with the level of debt. These results
are robust even after controlling for variables for infrastructure development.10
29. Based on the results where both the linear and quadratic terms of the government
debt to GDP ratio are statistically significant, the level of government debt, at which the
positive returns to government debt will decline to zero, is 80 percent. That is, given that the
specifications are correct, the additional government debt yields a positive return to TFP growth, but
this positive return declines as the debt level increase, and will become negative when the debt is
above 80 percent of GDP.11
30. The impact of economic freedom/efficiency indicators on the TFP growth is
ambiguous (Table 3, Columns and 3-B).12
Better credit market regulation seems to be positively
correlated, albeit statistically insignificant, with the TFP growth. The effects of goods market
efficiency on TFP growth are ambiguous and are not robust to changes in model specification and
the inclusion of a lagged dependent variable.
Table 3. Dynamic Panel Result (System GMM)
10
The results of the regressions with a telephone line indicator as an additional explanatory variable are not shown here. 11
This interpretation of the coefficient estimates is different from that of Reinhart and Rogoff (2010) and Herndon et al (2013),
which emphasize on the 90 percent threshold of government debt to GDP. First, our study includes only middle income countries
during the year 1980 to 2010, and controls for other heterogeneous structural characteristics across countries. Second, our
interpretation of the estimates is based on the concept of marginal returns to government debt on TFP contribution to economic
growth. 12
The model includes only three SSA SMICs (Botswana, Mauritius, and Namibia).
(1-A) (1-B) (2-A) (2-B) (3-A) (3-B)
L.tfp 0.131 -0.165 0.139
(0.091) (0.234) (0.452)
govdebt_gdp 0.031 0.004 0.222* 0.254* -0.441* -0.364*
(0.070) (0.059) (0.120) (0.132) (0.238) (0.185)
(Debt/GDP)2/100 -0.041 -0.026 -0.141* -0.155** 0.320 0.248
(0.036) (0.030) (0.068) (0.068) (0.215) (0.185)
trade_gdp 0.010 0.004 0.097 0.106 -0.018 -0.009
(0.034) (0.021) (0.088) (0.084) (0.059) (0.042)
fdi_gdp 0.110 0.033 0.037 0.130 0.201 0.235
(0.168) (0.099) (0.242) (0.256) (0.261) (0.187)
Female Participation -0.390 -0.327 -0.155 -0.391 -0.318 -0.231
(0.239) (0.204) (0.598) (0.596) (0.221) (0.181)
inflation 0.079 0.047 -0.028 -0.056 0.621 0.506
(0.059) (0.047) (0.060) (0.065) (0.421) (0.319)
Years of Schooling 1.599 0.416 0.384 -0.268
(2.745) (2.914) (1.492) (0.743)
skillmismatch_100 -0.279* -0.304** -1.715 -1.079
(0.152) (0.135) (2.567) (1.649)
creditreg_efw 2.696 2.390
(2.230) (2.680)
gmkt_efw -0.993 0.639
(4.635) (4.569)
_cons 13.686 13.094 -13.495 0.938 -5.572 6.809
(9.097) (7.956) (18.461) (20.017) (68.703) (56.218)
N 434 433 265 265 73 73
Countries 30 30 23 23 19 19
One-step GMM estimation method. Standard errors in parentheses.
* p<0.1, ** p<0.05, *** p<0.01

NAMIBIA
20 INTERNATIONAL MONETARY FUND
Cointegration Analysis13
31. Cointegration analysis allows us to identify and estimate the long-run relationship
between TFP growth and its determinants.14
This approach assumes heterogeneity among
countries in the panel and adjusts for potential endogeniety and cross-sectional dependence. Given
the data-intensive nature of this approach and limited data availability for middle-income countries
in our sample, we estimate various specification of the model. Some of the findings are consistent
with the literature, while some of them differ from the results found in the other studies.
32. Cointegration analysis confirms the importance of skill-mismatch for productivity
growth and the concave relationship between government debt and TFP growth. 15
16
The
results suggest that skill-mismatch has statistically significant and negative impact on TFP growth in
the long-run, which underscores the importance of the quality of education (Table 4). An increase in
the index by 100 points reduces the long-run TFP growth by about 2 percentage points. This result
is quite robust to the different model specifications. The results also suggest that at a lower level of
debt to GDP ratio the impact of government debt on TFP growth is positive, probably reflecting the
positive impact of public borrowing to finance infrastructure spending. However, when debt exceeds
32 percent of GDP the marginal impact of government debt on TFP growth becomes negative in the
long-run. In addition, the debt threshold increases to 55 percent of GDP when we control for market
capitalization. An alternative interpretation of the concavity could be given through government
debt’s impact on the financial sector. At the initial stage, issuance of government debt contributes to
the development of the financial market, which positively affects productivity growth. However, at a
high level of government debt, it starts to crowd out private investments and pushes long-run
interest rates up, which has negative implications for productivity. These results broadly confirm the
thrust of the findings of the system GMM analysis. The estimated threshold of debt to GDP ratio
obtained in the cointegration analysis is lower than the one obtained in the dynamic GMM analysis
because it represents long-run relation, while dynamic GMM estimates are short-run effects.
33. Consistent with other studies, we found that macroeconomic stability, small
agricultural sector, and trade openness are conducive to TFP growth. The results suggest that
high inflation and a large agricultural sector reduces TPF growth, while high FDI and large foreign
trade relative to GDP support TFP growth. An increase in FDI to GDP ratio by one percentage point
increases TFP growth by about 0.1 to 0.6 percentage points in the long-run. However, when we
include the share of foreign trade in GDP with FDI, the impact of FDI becomes negative. Also
reducing the relative size of the agricultural sector would improve long-run TFP growth.
34. The analysis reveals some ambitious results as well. In particular, we found a negative
relationship between female participation in the labor force and TFP growth. However, when we
13
For more detail see P. Pedroni (2000) and (2004). 14
In the cointegration analysis we used codes which were kindly provided by Peter Pedroni. 15
The presence of cointegration is tested by Pedroni’s seven statistics. The results for all specifications reject the no cointegration
hypothesis at least with four out of seven statistics, including the group mean Augmented Dickey Fuller test. 16
The consistent set of explanatory variables cannot be applied across the three methodologies due to limited data information
(the selected econometric approaches require more data intensive and we cannot afford to lose more degree of freedom). In
particular, the panel cointegration approach requires more time series relative to probit or system GMM methods.
NAMIBIA
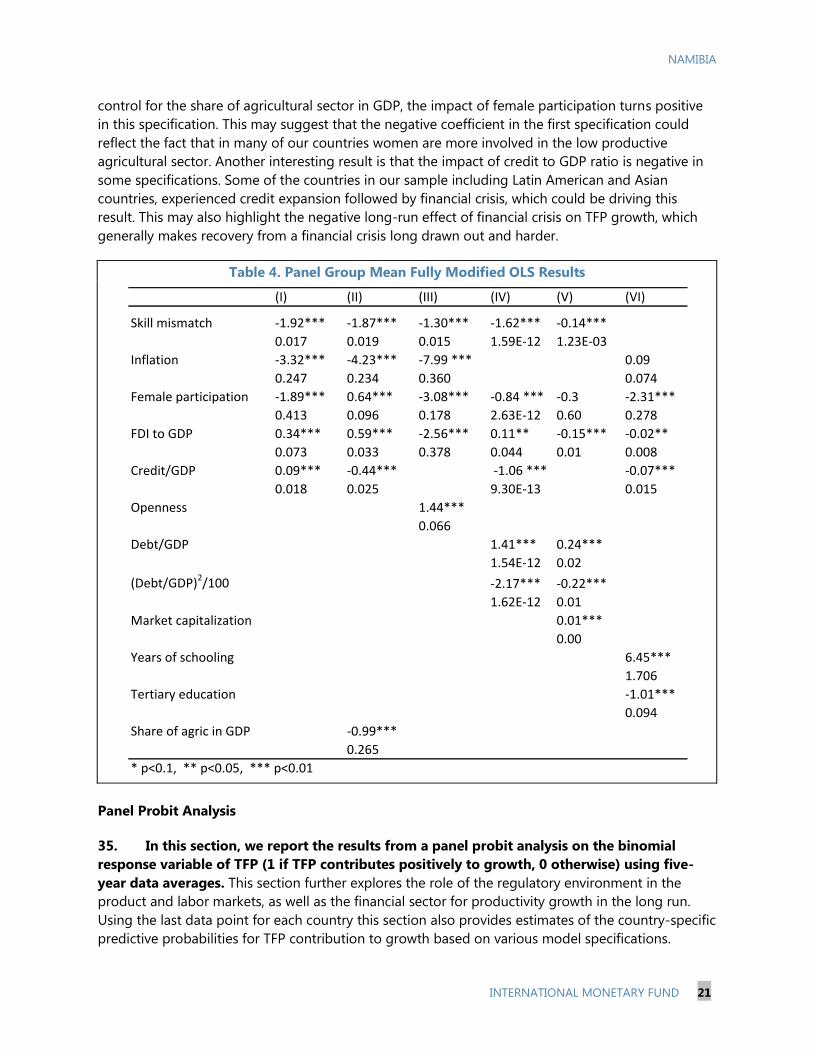
INTERNATIONAL MONETARY FUND 21
control for the share of agricultural sector in GDP, the impact of female participation turns positive
in this specification. This may suggest that the negative coefficient in the first specification could
reflect the fact that in many of our countries women are more involved in the low productive
agricultural sector. Another interesting result is that the impact of credit to GDP ratio is negative in
some specifications. Some of the countries in our sample including Latin American and Asian
countries, experienced credit expansion followed by financial crisis, which could be driving this
result. This may also highlight the negative long-run effect of financial crisis on TFP growth, which
generally makes recovery from a financial crisis long drawn out and harder.
Table 4. Panel Group Mean Fully Modified OLS Results
Panel Probit Analysis
35. In this section, we report the results from a panel probit analysis on the binomial
response variable of TFP (1 if TFP contributes positively to growth, 0 otherwise) using five-
year data averages. This section further explores the role of the regulatory environment in the
product and labor markets, as well as the financial sector for productivity growth in the long run.
Using the last data point for each country this section also provides estimates of the country-specific
predictive probabilities for TFP contribution to growth based on various model specifications.
(I) (II) (III) (IV) (V) (VI)
Skill mismatch -1.92*** -1.87*** -1.30*** -1.62*** -0.14***
0.017 0.019 0.015 1.59E-12 1.23E-03
Inflation -3.32*** -4.23*** -7.99 *** 0.09
0.247 0.234 0.360 0.074
Female participation -1.89*** 0.64*** -3.08*** -0.84 *** -0.3 -2.31***
0.413 0.096 0.178 2.63E-12 0.60 0.278
FDI to GDP 0.34*** 0.59*** -2.56*** 0.11** -0.15*** -0.02**
0.073 0.033 0.378 0.044 0.01 0.008
Credit/GDP 0.09*** -0.44*** -1.06 *** -0.07***
0.018 0.025 9.30E-13 0.015
Openness 1.44***
0.066
Debt/GDP 1.41*** 0.24***
1.54E-12 0.02
(Debt/GDP)2/100 -2.17*** -0.22***
1.62E-12 0.01
Market capitalization 0.01***
0.00
Years of schooling 6.45***
1.706
Tertiary education -1.01***
0.094
Share of agric in GDP -0.99***
0.265
* p<0.1, ** p<0.05, *** p<0.01

NAMIBIA
22 INTERNATIONAL MONETARY FUND
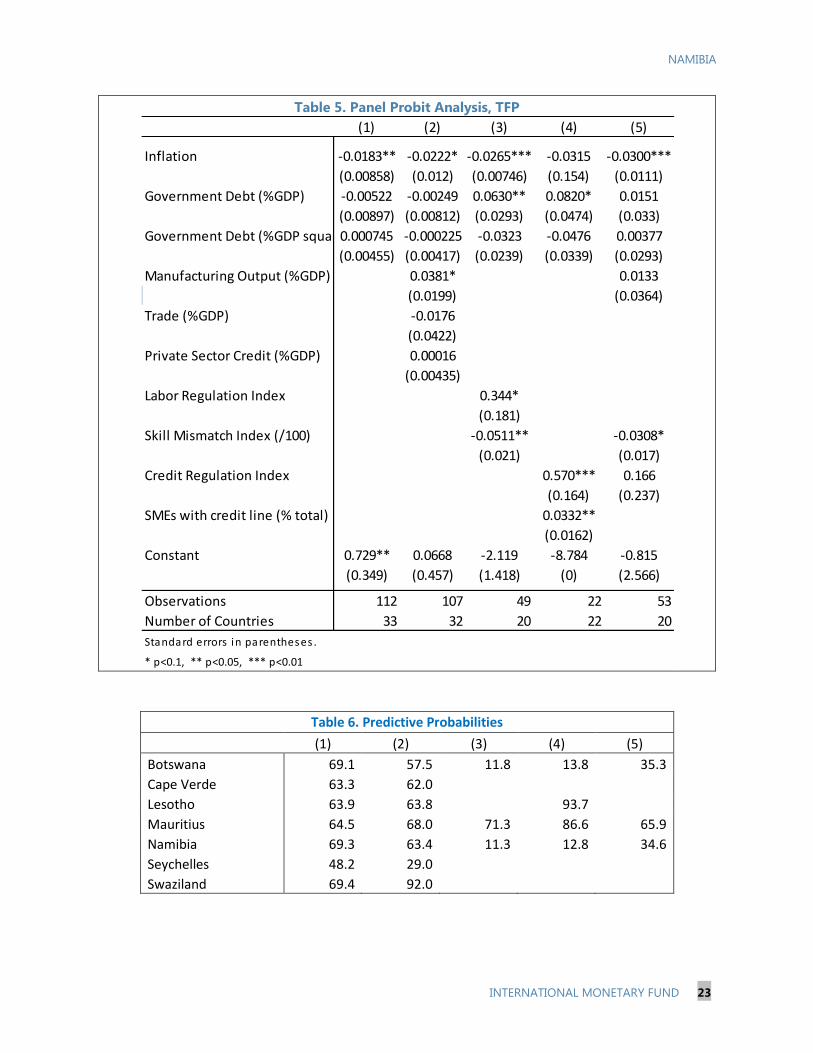
36. The results broadly support the findings in the system GMM and panel cointegration
long-run analysis (Table 5). In particular, a higher skill mismatch index decreases the chance of TFP
increasing growth in the long-run. In line with the previous empirical analysis, higher inflation
decreases the probability of TFP contributing to growth. A one percentage point increase in inflation
reduces the probability of TFP contributing to growth by about 2 percent in the long-run. We also
find that the link between the probability of the TFP contributing to growth and the government
debt is concave, although the coefficients are not always statistically significant.
37. The results suggest that less strict regulations in credit and labor markets and higher
access to finance by SMEs increases the likelihood of TFP adding to growth (Table 5). Less
strict regulations on the labor market boosts the chance of TFP contributing to growth significantly.
Lowering the index of labor regulations by one point is associated with a 34 percent increase in the
probability of positive TFP contribution to growth. This suggests that reforms aimed at increasing
flexibility of the labor market have the potential to boost economy-wide productivity and thus
potential growth. The credit market variables are found significant with less strict credit regulations
and a higher percent of SMEs with a credit line increasing the likelihood of TFP increasing growth.
38. The predictive probabilities for TFP in SMICs are provided in Table 6. The predictive
estimates based on the first model specifications, where we have mostly macroeconomic variables
are largely similar for our SMICs showing higher chances for positive contribution of TFP to growth.
This suggests that these countries have generally managed to achieve macro-stability, which
contributed to their good economic performance and historically strong growth. However, the
estimated predictive probabilities based on the last three specifications, where we added structural
variables, like regulatory burden on firms and skill-mismatch in the labor market, reduces the
probability of TFP contributing to GDP growth significantly for all our SMICs except for Mauritius.
This highlights the need for structural reforms to unlock the productivity growth in many of our
SMICs and the better outcomes in Mauritius relative to other SMICs in SSA.
NAMIBIA
INTERNATIONAL MONETARY FUND 23
Table 5. Panel Probit Analysis, TFP
Table 6. Predictive Probabilities
(1) (2) (3) (4) (5)
Botswana 69.1 57.5 11.8 13.8 35.3
Cape Verde 63.3 62.0
Lesotho 63.9 63.8 93.7
Mauritius 64.5 68.0 71.3 86.6 65.9
Namibia 69.3 63.4 11.3 12.8 34.6
Seychelles 48.2 29.0
Swaziland 69.4 92.0
(1) (2) (3) (4) (5)
Inflation -0.0183** -0.0222* -0.0265*** -0.0315 -0.0300***
(0.00858) (0.012) (0.00746) (0.154) (0.0111)
Government Debt (%GDP) -0.00522 -0.00249 0.0630** 0.0820* 0.0151
(0.00897) (0.00812) (0.0293) (0.0474) (0.033)
Government Debt (%GDP squared/100)0.000745 -0.000225 -0.0323 -0.0476 0.00377
(0.00455) (0.00417) (0.0239) (0.0339) (0.0293)
Manufacturing Output (%GDP) 0.0381* 0.0133
(0.0199) (0.0364)
Trade (%GDP) -0.0176
(0.0422)
Private Sector Credit (%GDP) 0.00016
(0.00435)
Labor Regulation Index 0.344*
(0.181)
Skill Mismatch Index (/100) -0.0511** -0.0308*
(0.021) (0.017)
Credit Regulation Index 0.570*** 0.166
(0.164) (0.237)
SMEs with credit line (% total) 0.0332**
(0.0162)
Constant 0.729** 0.0668 -2.119 -8.784 -0.815
(0.349) (0.457) (1.418) (0) (2.566)
Observations 112 107 49 22 53
Number of Countries 33 32 20 22 20
Standard errors in parentheses .
* p<0.1, ** p<0.05, *** p<0.01
NAMIBIA
24 INTERNATIONAL MONETARY FUND
E. Conclusions
39. This chapter has looked at factors that could boost total factor productivity and thus
potential growth in SMICs in SSA, including Namibia. Our findings suggest that, in SMICs,
productivity growth is an important intermediate objective that serves to improve economic welfare
and to accelerate convergence to higher income levels. Although macroeconomic stability and trade
openness are necessary for productivity growth, they are not sufficient. SMICs need to improve the
quality of public spending, most notably on education to minimize the skill mismatch in the labor
market, reduce the regulatory burden on firms, and improve access to finance for SMEs.
40. Our case studies suggest that there is a room for SMICs to facilitate structural
transformation to raise their potential growth. Overall, Mauritius fared better than other SMICs
in this area (see paragraph 38 and Box 1). Several factors underpin the Mauritian success: (i) a
diverse and competitive political system supportive of the economic reforms, and (ii) better
sequencing of reforms, particularly investing in appropriate education and training, which enhanced
the absorptive capacity and buttressed the authorities’ resolve to create new sectors. In addition,
policy innovation and the flexibility in acquiring necessary skills in the labor market17
, attracting FDI,
and coherency in many aspects of micro and macro policies are other factors that contributed to the
relative success of Mauritius’s structural transformation.
41. The chapter also touches on the political economy considerations in the
implementation of productivity-enhancing structural reforms. The implementation of structural
reforms is not an easy task in any country, including in Namibia. The up-front short-term economic
and political costs means there is usually a strong constituency who favor the status quo. The timing
and sequencing of reforms and, the role of quick wins are important in achieving success in the
implementation of reforms. In some cases, a social bargain can be a mechanism to generate
consensus on a package of mutually reinforcing reforms.
42. This chapter, by no means, exhausts the factors that could boost potential growth in
SMICs thus begging the question—what are the possible areas of future research on how to
boost potential growth in SMICs? Clearly one area relates to the tools that can best help SMICs to
overcome political-economy constraints and thus speed up the implementation of structural
reforms. Perhaps another possible topic of future research is how SMICs can leverage global supply
chains (GSCs) to boost their potential growth. GSC offers opportunities for developing countries to
benefit from trade integration, and is at the heart of the East Asian success story.
17
This is broadly in line with the findings in Behar A. (2010).

NAMIBIA
INTERNATIONAL MONETARY FUND 25
References
Acemoglu, D. and S. Johnson: 2003, `Unbundling Institutions'. Working Paper 9934, National
Bureau of Economic Research.
Acemoglu, D., S. Johnson, and J. Robinson: 2004, `Institutions as the Fundamental Cause of Long-
Run Growth'. NBER Working Papers 10481, National Bureau of Economic Research, Inc.
Acemoglu, D. and F. Zilibotti: 2001, `Productivity Differences'. The Quarterly Journal of Economics
116(2), 563–606.
Aghion, P., P. Howitt, and D. Mayer-Foulkes: 2005, `The Effect of Financial Development on
Convergence: Theory and Evidence'. The Quarterly Journal of Economics 120(1), 173–22.
Aiyar. S, Duval R, Puy D, Wu Y, and Zhang L. ―Growth Slowdowns and the Middle-Income Trap,
IMF working paper (WP/13/71).
Arellano, M. and S. Bond: 1991, `Some Tests of Specification for Panel Data: Monte Carlo
Evidence and an Application to Employment Equations'. Review of Economic Studies 58(2),
277–97.
Barro, R. J.: 1991, `Government Spending in a Simple Model of Endogenous Growth'. NBER
Working Papers 2588, National Bureau of Economic Research, Inc.
Barro, R. J.: 2001, `Human Capital and Growth'. American Economic Review 91(2), 12–17.
Barro, R. J.: 2013, `Inflation and Economic Growth'. Annals of Economics and Finance 14(1),
121–144.
Behar A.: 2010, “Would More Skills Raise Demand for Those Who Do Not Get Them? Evidence
from South African Manufacturing”. Journal of African Economies, Vol. 19, number 4, pp.
496–535.
Blundell, R. and S. Bond: 1998, `Initial conditions and moment restrictions in dynamic panel data
models'. Journal of Econometrics 87(1), 115–143.
Coe, D. T. and E. Helpman, 1995. `International R&D spillovers'. European Economic Review,
Elsevier, vol. 39(5), pages 859-887, May.
Danquah, M., E. Moral-Benito, and B. Ouattara: 2013, `TFP growth and its determinants: a model
averaging approach'. Empirical Economics 46, 1–25.
De Gregorio, J.: 1993, `Inflation, taxation, and long-run growth'. Journal of Monetary Economics
31(3), 271–298.
Dollar, D. and A. Kraay: 2004, `Trade, Growth, and Poverty'. Economic Journal 114(493), F22–F49.
Easterly, W.: 2006, `Reliving the 1950s: the big push, poverty traps, and takeoffs in economic
Development'. Journal of Economic Growth 11(4), 289–318.
Espinoza, R.: 2012, `Factor Accumulation and the Determinants of TFP in the GCC'. OxCarre
Working Papers 094, Oxford Centre for the Analysis of Resource Rich Economies, University
of Oxford.
Estevão, M. and E. Tsounta, 2013. `Has the Great Recession Raised U.S. Structural
Unemployment?'. IMF working paper (WP/11/105).

NAMIBIA
26 INTERNATIONAL MONETARY FUND
Fischer, S.: 1993, `The role of macroeconomic factors in growth'. Journal of Monetary Economics
32(3), 485–512.
Ghali, K.: 1999, `Government size and economic growth: evidence from a multivariate
cointegration analysis'. Applied Economics 31(8), 975–987.
Ghosh, A. R. and S. Phillips: 1998, `Inflation, Disinflation, and Growth'. IMF Working Papers 98/68,
International Monetary Fund.
Glaeser, E. L., R. L. Porta, F. L. de Silane, and A. Shleifer: 2004, `Do Institutions Cause Growth?'.
NBER Working Papers 10568, National Bureau of Economic Research, Inc.
Grossman, G. M. and E. Helpman: 1993, Innovation and Growth in the Global Economy, Vol. 1 of
MIT Press Books. The MIT Press.
Hall, R. E. and C. I. Jones: 1996, `The Productivity of Nations'. NBER Working Papers 5812,
National Bureau of Economic Research, Inc.
Hall, R. E. and C. I. Jones: 1999, `Why Do Some Countries Produce So Much More Output Per
Worker Than Others?'. The Quarterly Journal of Economics 114(1), 83–116.
Herndon, T., M. Ash and Pollin, R., 2013. `Does High Public Debt Consistently Stifle Economic
Growth? A Critique of Reinhart and Rogoff '. Working Papers wp322, Political Economy
Research Institute, University of Massachusetts at Amherst.
Jaumotte, F. and N. Spatafora: 2007, `Asia Rising: A Sectoral Perspective'. IMF Working Papers
07/130, International Monetary Fund.
King, R. G. and R. Levine: 1993, `Finance and Growth: Schumpeter Might Be Right'. The Quarterly
Journal of Economics 108(3), 71–37.
Leigh, L., and Flores I, (2013), “Closing the Jobs Gap in the Southern Africa Customs Union
(SACU), Chapter 6 of a book entitled “Building a Common Future in Southern Africa”
(Washington: International Monetary Fund).
Lewis, A.: 1979, `The Slowing Down of the Engine of Growth'. Nobel Prize in Economics
documents 1979–2, Nobel Prize Committee.
Lewis, W. A.: 1954, `Economic Development with Unlimited Supplies of Labor'. The Manchester
School 22(2), 139–191.
Loko, B. and M. A. Diouf: 2009, `Revisiting the Determinants of Productivity Growth: What's new?'.
IMF Working Papers 09/225, International Monetary Fund.
Lu, D.: 2002, `Sectoral Factor Reallocation and Productivity Growth: Recent Trends in the Chinese
Economy'. Journal of Economic Development 27(2), 95–111.
Madsen, J. B. and J. B. Ang, (2013), `The Asian Growth Miracle: Factor Accumulation, the
Demographic Transition, and R&D-Driven Growth'. No 23-13, Monash Economics Working
Papers, Monash University, Department of Economics
McGuckin, R. and B. v. Ark: 2005, `Productivity and participation: an international comparison'.
GGDC Research Memorandum 200578, Groningen Growth and Development Centre,
University of Groningen.

NAMIBIA
INTERNATIONAL MONETARY FUND 27
Pedroni, P. (2000), "Fully Modified OLS for Heterogeneous Cointegrated Panels," Advances in
Econometrics, Vol. 15, 93–130.
Pedroni, P. (2004), "Panel Cointegration; Asymptotic and Finite Sample Properties of Pooled Time
Series Tests with an Application to the PPP Hypothesis," Econometric Theory, 20, 597–625.
Poirson, H.: 2000, `Factor Reallocation and Growth in Developing Countries'. IMF Working Papers
00/94, International Monetary Fund.
Ranis, G.: 1989, `The role of institutions in transition growth: The East Asian newly industrializing
countries'. World Development 17(9), 1443–1453.
Ranis, G. and C. Fei: 1961, `A theory of economic development'. The American Economic Review
51, 533–565.
Reinhart, C. M. and K. S. Rogoff, 2010.`Growth in a Time of Debt'. American Economic Review,
American Economic Association, vol. 100(2), pages 573-78, May.
Romer, P. M.: 1990, `Human capital and growth: Theory and evidence'. Carnegie-Rochester
Conference Series on Public Policy 32(1), 251–286.
Roodman, D.: 2009, `A Note on the Theme of Too Many Instruments'. Oxford Bulletin of
Economics and Statistics 71(1), 13–158.
Roubini, N. and X. Sala-i Martin: 1992, `Financial repression and economic growth'. Journal of
Development Economics 39(1), 5–30.
Sachs, J. D. and A. Warner: 1995, `Economic Reform and the Process of Global Integration'.
Brookings Papers on Economic Activity 26(1, 25th A), 1–118.
Sala-I-Martin, X., G. Doppelhofer, and R. I. Miller: 2004, `Determinants of Long-Term Growth: A
Bayesian Averaging of Classical Estimates (BACE) Approach'. American Economic Review
94(4), 813–835.
Weil, D. N. and O. Galor: 2000, `Population, Technology, and Growth: From Malthusian Stagnation
to the Demographic Transition and Beyond'. American Economic Review 90(4), 806–828.
NAMIBIA
28 INTERNATIONAL MONETARY FUND
Appendix I. Methodologies for Modeling Total Factor Productivity
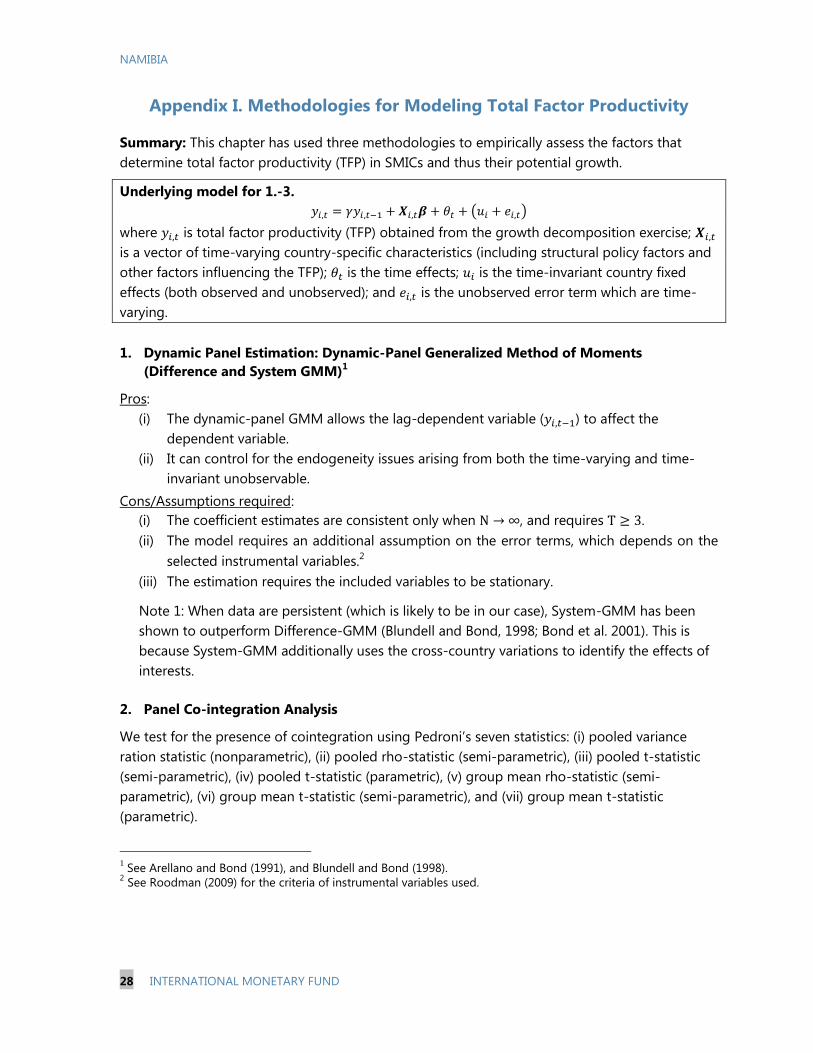
Summary: This chapter has used three methodologies to empirically assess the factors that
determine total factor productivity (TFP) in SMICs and thus their potential growth.
Underlying model for 1.-3.
where is total factor productivity (TFP) obtained from the growth decomposition exercise;
is a vector of time-varying country-specific characteristics (including structural policy factors and
other factors influencing the TFP); is the time effects; is the time-invariant country fixed
effects (both observed and unobserved); and is the unobserved error term which are time-
varying.
1. Dynamic Panel Estimation: Dynamic-Panel Generalized Method of Moments
(Difference and System GMM)1
Pros:
(i) The dynamic-panel GMM allows the lag-dependent variable ( ) to affect the
dependent variable.
(ii) It can control for the endogeneity issues arising from both the time-varying and time-
invariant unobservable.
Cons/Assumptions required:
(i) The coefficient estimates are consistent only when , and requires .
(ii) The model requires an additional assumption on the error terms, which depends on the
selected instrumental variables.2
(iii) The estimation requires the included variables to be stationary.
Note 1: When data are persistent (which is likely to be in our case), System-GMM has been
shown to outperform Difference-GMM (Blundell and Bond, 1998; Bond et al. 2001). This is
because System-GMM additionally uses the cross-country variations to identify the effects of
interests.
2. Panel Co-integration Analysis
We test for the presence of cointegration using Pedroni’s seven statistics: (i) pooled variance
ration statistic (nonparametric), (ii) pooled rho-statistic (semi-parametric), (iii) pooled t-statistic
(semi-parametric), (iv) pooled t-statistic (parametric), (v) group mean rho-statistic (semi-
parametric), (vi) group mean t-statistic (semi-parametric), and (vii) group mean t-statistic
(parametric).
1 See Arellano and Bond (1991), and Blundell and Bond (1998).
2 See Roodman (2009) for the criteria of instrumental variables used.
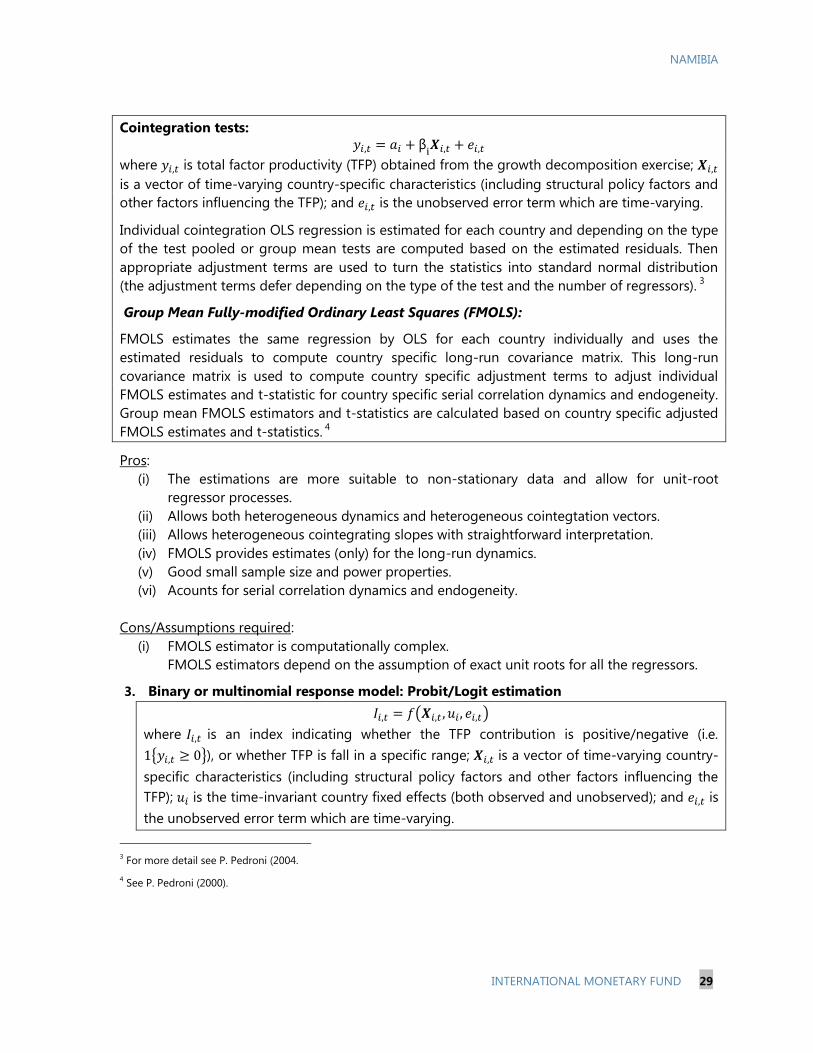
NAMIBIA
INTERNATIONAL MONETARY FUND 29
Cointegration tests:
where is total factor productivity (TFP) obtained from the growth decomposition exercise;
is a vector of time-varying country-specific characteristics (including structural policy factors and
other factors influencing the TFP); and is the unobserved error term which are time-varying.
Individual cointegration OLS regression is estimated for each country and depending on the type
of the test pooled or group mean tests are computed based on the estimated residuals. Then
appropriate adjustment terms are used to turn the statistics into standard normal distribution
(the adjustment terms defer depending on the type of the test and the number of regressors). 3
Group Mean Fully-modified Ordinary Least Squares (FMOLS):
FMOLS estimates the same regression by OLS for each country individually and uses the
estimated residuals to compute country specific long-run covariance matrix. This long-run
covariance matrix is used to compute country specific adjustment terms to adjust individual
FMOLS estimates and t-statistic for country specific serial correlation dynamics and endogeneity.
Group mean FMOLS estimators and t-statistics are calculated based on country specific adjusted
FMOLS estimates and t-statistics. 4
Pros:
(i) The estimations are more suitable to non-stationary data and allow for unit-root
regressor processes.
(ii) Allows both heterogeneous dynamics and heterogeneous cointegtation vectors.
(iii) Allows heterogeneous cointegrating slopes with straightforward interpretation.
(iv) FMOLS provides estimates (only) for the long-run dynamics.
(v) Good small sample size and power properties.
(vi) Acounts for serial correlation dynamics and endogeneity.
Cons/Assumptions required:
(i) FMOLS estimator is computationally complex.
FMOLS estimators depend on the assumption of exact unit roots for all the regressors.
3. Binary or multinomial response model: Probit/Logit estimation
where is an index indicating whether the TFP contribution is positive/negative (i.e.
), or whether TFP is fall in a specific range; is a vector of time-varying country-
specific characteristics (including structural policy factors and other factors influencing the
TFP); is the time-invariant country fixed effects (both observed and unobserved); and is
the unobserved error term which are time-varying.
3 For more detail see P. Pedroni (2004.
4 See P. Pedroni (2000).
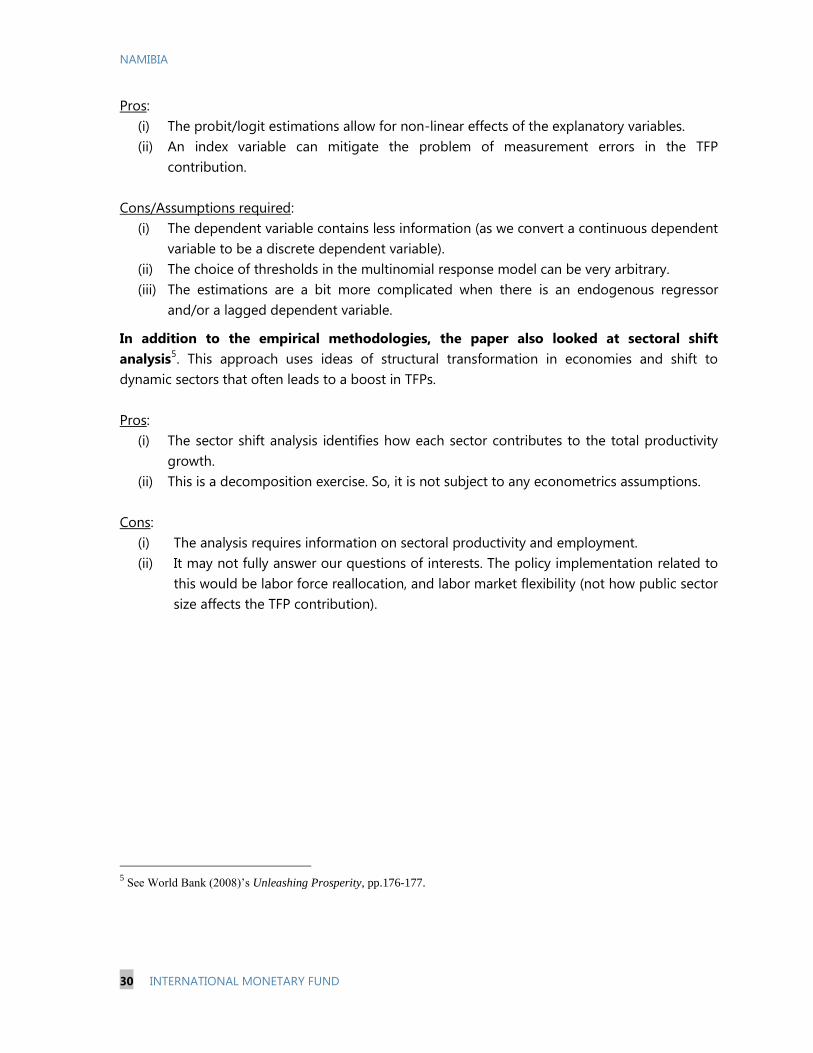
NAMIBIA
30 INTERNATIONAL MONETARY FUND
Pros:
(i) The probit/logit estimations allow for non-linear effects of the explanatory variables.
(ii) An index variable can mitigate the problem of measurement errors in the TFP
contribution.
Cons/Assumptions required:
(i) The dependent variable contains less information (as we convert a continuous dependent
variable to be a discrete dependent variable).
(ii) The choice of thresholds in the multinomial response model can be very arbitrary.
(iii) The estimations are a bit more complicated when there is an endogenous regressor
and/or a lagged dependent variable.
In addition to the empirical methodologies, the paper also looked at sectoral shift
analysis5. This approach uses ideas of structural transformation in economies and shift to
dynamic sectors that often leads to a boost in TFPs.
Pros:
(i) The sector shift analysis identifies how each sector contributes to the total productivity
growth.
(ii) This is a decomposition exercise. So, it is not subject to any econometrics assumptions.
Cons:
(i) The analysis requires information on sectoral productivity and employment.
(ii) It may not fully answer our questions of interests. The policy implementation related to
this would be labor force reallocation, and labor market flexibility (not how public sector
size affects the TFP contribution).
5 See World Bank (2008)’s Unleashing Prosperity, pp.176-177.
NAMIBIA
INTERNATIONAL MONETARY FUND 31
4. Construction of the Skill Mismatch Index
As discussed in Leigh and Flores (2011), skill-mismatch could be one of the reasons for
high structural unemployment in many of the SSA SMICs. For our analysis, we constructed a
skill-mismatch index, following (Estevão and Tsounta 2011), to determine if changes in TFP could
be captured by country differences in matching supply and demand for skills. The skills mismatch
index is calculated by taking the difference between the skill demand and supply for each
country in the sample. Following Estevao and Tsounta (2011), the skills mismatch index for each
country i at time t is constructed using equation:
in which j is the skill level; Sijt is the percentage of the population with skill level j at time t in
country i (skill level supply), and Mijt is the percentage of employees with skill level j at time t in
country i (skill level demand).
Skill level supply. World Bank educational attainment data are used to construct skill level
supply using primary education (as low skilled), secondary education (as semi-skilled), and
college and tertiary education (as high skilled).
Skill level demand. Skill level demand is approximated by the percentage of employees in
three key sectors: mining and construction (to proxy low-skilled workers), manufacturing (for
semi-skilled workers), and government and financial services (for high-skilled workers).6
6 Although the Estevao and Tsounta (2011) method of estimating skill supply is reasonably robust based on educational
attainment, the measures of skill demand and skill intensity does have some weaknesses, including treating mining sector as
low skilled in the skill-intensity spectrum when most of the mining sector employees in SMICs are at least medium to high
skilled.
NAMIBIA
32 INTERNATIONAL MONETARY FUND
FINANCIAL INCLUSION AND STABILITY IN AFRICA’S
MIDDLE-INCOME COUNTRIES INCLUDING NAMIBIA 1
The financial sectors of middle-Income countries (MICs) in sub-Saharan Africa (SSA) continue to evolve
and recent global regulatory reforms will likely steer funding structures further towards equity and
deposits. This chapter examines two questions. What is the financial landscape (stability and inclusion)
in SSA MICs relative to emerging market economies (EMs)? How do financial inclusion and shifts in
funding structure of banks affect financial stability? Our findings suggest that: (i) financial stability and
access to finance for households in SSA is comparable to EMs, while access to finance for small and
medium-sized enterprise (SMEs) lags behind those of EMs; (ii) SME access to finance and/or savings-
oriented financial inclusion enhances financial stability, while overly consumption-oriented financial
inclusion likely undermines financial stability; and (iii) a more equity and deposit-based funding
structure enhances financial stability.
A. Introduction
1. The rapidly expanding financial sectors in MICs in SSA, including Namibia, plays a
critical role in the general economy of these countries. Given that this role is also expected to
expand over time, the financial environment itself must be understood in greater detail. First, as we
know, the financial sector is becoming more and more important in IMF surveillance. Thus, it is
important to have a better knowledge of how the financial landscapes of SSA MICs compares with
those of EMs.
2. While financial stability has been central to the IMF’s work, over the recent years,
financial inclusion/access to finance has become increasingly important. Financial stability and
financial inclusion are often considered to be conflicting goals, just as fighting inflation and
maximizing growth are often at odds in a central bank’s objective function. For example, financial
stability focuses on asset quality. This means that credit institutions (including banks) need to be
more selective about whom they lend and provide financial services. In contrast, financial inclusion
focuses on quantity such as size of assets and the number of customers (in percent of population).
This often means that credit institutions should lower their standards for lending and reduce the
minimum balance requirement or fees associated with opening or maintaining a bank account. A
natural question therefore is how different types of financial inclusion tend to affect financial
stability.
1 This chapter was prepared by Yibin Mu and Jenny Lin (a summer intern during 2013). The key findings were
presented to the Namibian authorities by Andrew Jonelis during the 2013 Article IV consultation mission.
NAMIBIA
INTERNATIONAL MONETARY FUND 33
3. The current global regulatory reforms will likely encourage banks’ funding structures
to shift towards greater holdings of equity and deposits. This raises the question will this
funding structure shift impact financial stability in SSA MICs?
4. In this chapter, we address each of the above issues by exploring the following
questions: How has the financial landscape in SSA MICs evolved? How does the financial landscape
(stability and inclusion) in SSA MICs compare to that of EMs? How do financial inclusion and funding
structure shifts affect financial stability?
5. Our findings suggest the following: (i) financial stability and financial inclusion for
households in SSA MICs are comparable to a group of EMs while financial inclusion for SMEs lags
behind that in EMs;2 (ii) aspects of financial inclusion that focuses on expanding SMEs access to
finance and individuals’ access to savings accounts enhances financial stability, while financial
inclusion that focuses purely on expanding the percentage of individuals with credit undermines
financial stability; and (iii) a more equity and deposit based funding structure enhances financial
stability.
B. Literature Review
6. This chapter explores the nexus between financial inclusion and stability. Much work
has been done in the literature on financial sector stability and a growing body of ongoing work is
focusing on financial access as well. Here, we present an overview of the literature, as it relates to
this chapter, and give a sense of the limited work available on exploring the interactions between
financial stability and access.
7. The literature on financial stability is vast and diverse, with most of it focused on
measures and indicators for financial stability (FSIs). Demirgüç-Kunt and Detragiache (1998),
Kaminsky (1998), and Bordo and Schwartz (2000), among others, pioneered early warning indicators
on macro-financial stability based on risk spreads, and market liquidity. The primary FSIs cover a few
key banking areas: capital adequacy, asset quality, management effectiveness, earnings, liquidity,
and sensitivity to market risks.
8. Work has also been done to look at predictors of banking crises. Demirgüç-Kunt and
Detragiache (1997) use a multivariate logit estimation to identify determinants of banking crises in a
panel of developing and industrialized countries. They found that weak macroeconomic
environments with low growth, high inflation, high real interest rates, explicit deposit insurance
schemes and weak law enforcement were particularly vulnerable to economy-wide banking crises.
2 The definition of SMEs is the same across all countries as the paper’s uses the World Bank Enterprise Survey
definition on this.

NAMIBIA
34 INTERNATIONAL MONETARY FUND
Demirgüç-Kunt and Detragiache (2005) survey the body of work done on crisis prediction and
identify two main methodologies of the cross-country empirical work in this field based on the
signals approach and the multivariate probability model.
9. Other stands of the literature on financial stability have looked at the central bank’s
role in financial sector stability (Nier 2009), bank competition and stability (Berger et al.
2009).3 Other work includes financial liberalization and crisis (Caprio and Summers 1993), external
shocks and crisis (Eichengreen and Rose 1998), bank ownership and structure as related to crisis (La
Porta, Lopez-de-Silanes, and Shleifer 2002) and the role of institutions and the political system in
causing and preventing crises (Beck, Demirgüç-Kunt, and Levine 2004).
10. The literature on financial access focuses on the effect of individual access on income
inequality, poverty, and GDP growth. The Global Financial Index (Findex) surveys on “how adults
in 148 economies save, borrow, make payments, and manage risk” finds that high cost, physical
distance, and lack of proper documentation are the most common barriers to household access to
finance (WB GFDR 2013, Demirgüç-Kunt & Klapper 2012). “Policies and Pitfalls in Expanding Access”
- Demirgüç-Kunt, Beck and Honohan. (2008) illustrates that financial access is quite limited around
the world and identifies barriers that may be preventing small firms and poor households from
using financial services. Based on this research, the report derives principles for effective
government policy on broadening access. Beck, Demirgüç-Kunt, and Maksimovic (2003) explores the
effects of firm-level financial access and find that financial constraints are strongest for small firms
and weakening these constraints disproportionately benefits smaller firms.
11. The literature, is however, limited on the interactions between financial stability and
access. Hannig and Jansen (2010) acknowledge that financial inclusion poses risks in terms of
reputation and quality, low-income savers and borrowers maintained “solid financial behaviour”
through crises periods and that the presence of “vulnerable clients” in the financial system has
negligible risks. They show various graphical correlations such as a positive correlation between GDP
per capita and inclusion, but stop short of establishing a causal quantitative relationship. Similarly,
Khan (2011) provides a graphical correlation showing the positive relationship between financial
3 Under the traditional "competition-fragility" view, more bank competition erodes market power, decreases profit margins, and
results in reduced franchise value that encourages bank risk taking. Under the alternative "competition-stability" view, more market
power in the loan market may result in greater bank risk as the higher interest rates charged to loan customers make it more
difficult to repay loans and exacerbate moral hazard and adverse selection problems. But even if market power in the loan market
results in riskier loan portfolios, the overall risks of banks need not increase if banks protect their franchise values by increasing their
equity capital or engaging in other risk-mitigating techniques. The Berger et al test these theories by regressing measures of loan
risk, bank risk, and bank equity capital on several measures of market power, as well as indicators of the business environment,
using data for 8,235 banks in 23 developed nations. The results suggest that - consistent with the traditional "competition-fragility"
view - banks with a greater degree of market power also have less overall risk exposure. The data also provide some support for
one element of the "competition-stability" view - that market power increases loan portfolio risk. The Berger et al show that this risk
may be offset in part by higher equity capital ratios.

NAMIBIA
INTERNATIONAL MONETARY FUND 35
inclusion, as indicated by, and development as measured by World Bank development levels (High
Income, Low Income, etc.). This, however, does not provide a causal link or direction of causation.
Aduda and Kalunda (2012) explore financial inclusion and stability with reference to Kenya and
postulate that it is very likely that banking performance, and the likelihood of crises, may depend on
the structure and degree of development of the financial systems, which is one of the focal point in
financial inclusion. However, there is no quantitative analysis performed in that paper and the
observation is purely speculative.
12. The chapter addresses a different question and provides quantitative evidence on the
impact of financial inclusion and funding structure shifts on financial stability. Rather than
focusing on a qualitative or descriptive assessment based on correlations, we attempt to establish
quantitatively whether a causal link exists among financial inclusion, funding structure and stability.
We also look at whether and which types of financial inclusion exist that are stability friendly at the
bank-level. This approach is taken in the context of SSA for several reasons. First, the banking sector
in SSA is relatively small; with 227 banks in the sample, solvency and stability of each individual bank
can have great ramifications for MICs in SSA. Second, financial access levels can have differing
impacts on heterogeneous banks and a bank-level analysis can account for fundamental differences
between individual banks that may be affecting stability, which helps to isolate the effect of each
individual explanatory variable without use of aggregation and its resulting distortions.
C. Data
13. The dataset includes bank-level data for 227 banks in SSA, over the period 1998-2013.
Eleven SSA MIC countries are covered: Botswana, Cape Verde, Ghana, Lesotho, Mauritius, Namibia,
Senegal, Seychelles, South Africa, Swaziland, and Zambia. Country-level financial stability and access
data for a group of EM countries is also included for 2011 for benchmarking purposes. The EM
countries are: Argentina, Brazil, Chile, China, Colombia, Hungary, Indonesia, India, Republic of Korea,
Mexico, Malaysia, Peru, Philippines, Poland, Romania, Russia Federation, Thailand, Turkey and
Ukraine. The selection criteria of the EM group are based on the peer group of South Africa (South
Africa 2013 Article IV Consultation Staff Report 13/303).
14. Our data sources include: bank-level financial data from Bankscope, macroeconomic
indicators data from the World Bank Indicators and Bloomberg, individual financial access data from
WB Development Indicators and Financial Access Survey and SME financial access data from the IFC
SME Financial Access Survey.

NAMIBIA
36 INTERNATIONAL MONETARY FUND
D. Analytical Framework
15. The framework centers around two econometric models of the determinants of
financial stability. The first is a baseline Probit model with the probability of bank distress because
the dependent variable. The second is a standard OLS estimation with percentage deviation from
bank insolvency as the dependent variable.
Baseline probit model
16. In this section, we attempt to explore the effects of financial access on financial
stability and, particularly, whether households or SME financial access affects distress
probability differently. Traditional measures of bank distress in the literature include the book-
price ratio, analyst ratings and the Z-score. We focus on the Z-score measure of bank distress as it
has become the most frequently used indicator, in addition to having greater data availability. The
Z-score measure of bank stability equals the return on assets (ROA) plus the capital asset ratio (CAR)
of each bank divided by the banks’ standard deviation of return on assets. It proxies the risk of bank
insolvency as it is the inverse of the probability that losses exceed equity; that is, a higher Z-score
implies lower risk of insolvency (see Box 1 for details of its derivation).
17. The traditional factors affecting bank distress can be categorized by: (1) funding
structure (e.g., Herfindahl funding diversity index, loans to customer deposits, short-term funding to
assets, equity to assets, term deposits to assets), (2) profitability and asset quality (return on average
assets, return on average equity, loan loss provisions to gross loans net interest margin), (3) size
(total assets, asset growth) and (4) macroeconomic factors (e.g. inflation, output growth). Thus, in
tackling our question, we must control for the effects of these other factors.
18. We proceed by first estimating a Probit model of probability of financial distress:
P{Distressijt | Xijt-1,Wjt } = F(Xijt-1 ij + Wjt j) (1)
where P{} is the probability that bank yi from country j will be in distress at time t, conditional on
bank-specific and country-level characteristics Xijt-1 and Wjt. P{} is based on the Z-score and is a
decreasing function of the Z-score as higher levels of Z imply lower probability of distress. F() is the
standard normal distribution function that transforms a linear combination of the explanatory
variables into the [0,1] interval. The estimations use lagged bank-level explanatory variables in order
to reduce endogeneity concerns and report robust standard errors.
NAMIBIA
INTERNATIONAL MONETARY FUND 37
19. Distressijt is measured by bank-level Z-scores, with a threshold at the 10th
percentile of
Z-scores within the sample4, which is equivalent to being above the 10
th percentile in
probability of default (Box 1). The presence of bank-specific lagged explanatory variables, Xijt-1, is
primarily to reduce endogeneity concerns and report robust standard errors, but also to control for
bank-level characteristics (e.g. size) that may make an individual bank particularly sensitive or
insensitive to country-wide macroeconomic conditions. Finally country-specific explanatory
variables, Wjt, must also be included to control for macroeconomic conditions that can obviously
affect a given bank’s default probability.
Baseline Logarithmic Model
20. We look at the relationship in levels and ensure that our Probit results are not
sensitive to the choice of binary cutoff threshold by examining the impact of the explanatory
variables on the percentage change in Z-score, that is, ln(Z-score). We estimate a standard
linear regression of bank-level explanatory variables, Xijt-1, and macro-level stability variables, Wjt, on
ln(Z-score):
ln(Z-score) = F(Xijt-1 ij + Wjt j) (2)
21. In order to include observations corresponding to negative values of the Z-score,
which cannot be log-transformed, we adjust additively relative to the minimum Z-score. This
technique uses ln(Z-score+min(Z-score)+1) in order to keep all observations under the previous
binary dependent variable estimation in this analysis as well. All other explanatory variables are kept
the same. The estimation again uses lagged bank-level explanatory variables in order to reduce
endogeneity concerns and report robust standard errors.
Variables
Probit
P{Z<10th
percentile} is a binary dependent variable representing the probability that a bank’s Z-
score is below the 10th
percentile of Z-scores of regional banks, putting it at risk of default
relative to other banks in the sample. As the Z-score represents the adequacy of a bank’s capital
to cover potential equity losses and thus is directly and inversely related to the probability of
default, higher values of the Z-score correspond to greater solvency. This cutoff is equivalent to
a bank’s probability of a default being amongst the top 10 percentile of sample banks (Box 2).
Thus positive coefficients on explanatory variables would indicate a negative contribution of that
variable towards bank-level stability. The 10th
percentile is chosen as a measure in line with the
4 The 10
th percentile threshold was chosen in line with that of a recent estimation in the October 2013 Global Financial Stability
Report using a similar model of probability of bank default. In that estimation, the 10th
percentile of bank Z-scores for that sample
was chosen.
NAMIBIA
38 INTERNATIONAL MONETARY FUND
convention in related literature (IMF’s GFSR October 2013); other nearby cutoffs had very similar
results for robustness.
ln(Z-score)
ln(Z-score) is a continuous dependent variable representing the percentage increase relative to
the lowest bank Z-score present in the sample. Under this dependent variable, positive
coefficients on explanatory variables correspond to greater solvency and a decreased probability
of bank default. This variable is secondary in our analysis because the true relationship between
explanatory variables and bank stability and is likely piece-wise linear. Thus, beyond a certain
point of high Z-scores, observed explanatory variables may have increasingly weak marginal
impact on stability and unobserved variables may carry more weight. This can appear in an
estimate as a weakening of the causal link between independent variables (summarized in Table
1) and stability.
E. Empirical Findings
22. Tables 2 and 3 present the key results of the estimates. All estimates distinguish between
household financial savings versus borrowing as indicators for household financial access. Table 2
gives the Probit estimation results using the SME Access Constraint as self-reported by SMEs within
each country in the IFC Enterprise Survey. Table 3 gives Probit results using percentage of small
firms with a credit Line among total small firms as the measure of SME financial access. Our analysis
also provides marginal effects on the respective Probit estimations. We provide estimation results
using ln (Z-score) as the dependent variable as a robustness check on whether our results are
sensitive to chosen thresholds for our Probit analysis. However, this has limited utility because
marginal differences in Z-score for already very high Z-score levels are unlikely to be significantly
affected by changes in explanatory variables.
23. The Probit estimations under either measure of SME access are broadly similar. Under
SME Access Constraint as reported in the World Bank Enterprise Survey, individual bank size, term
deposits to assets, equity to assets, country legal index and both individual access as well as SME
access variables are significant determinants for bank-level financial stability. The signs of these
coefficients give a sense of their contribution to financial stability. Note that in the Probit analysis,
our dependent variable is a measure of the likelihood of bank distress, that is, the inverse of financial
stability. Bank size, measured as total assets, has a positive and highly significant effect on the
probability of distress. The proportion of assets that are term deposits increases financial stability
significantly.
24. Our results give the directional impact of each explanatory variable on bank distress,
and the statistical significance. Negative coefficients indicate the variable is associated with
greater bank stability while positive coefficients indicate that the variable is associated with greater
bank distress. In general, we find that higher equity to assets, term deposits to assets, and
percentage of adults saving lead to an increase in financial stability. We also find that higher ratios
of loans to customer deposits, percentage of adults borrowing, and percentage of SMEs facing
NAMIBIA
INTERNATIONAL MONETARY FUND 39
financial access constraints and less diverse funding sources lead to increased probability of banking
sector distress.
25. The lagged equity to assets and ROA are used in the main empirical analysis to address
potential endogeneity issues. However, our analysis also provides robustness checks to test the
validity of our findings by taking out equity to assets and ROA. All our previous results are
substantively unaffected.
26. Note that the signs of the Probit estimation coefficients give the direction of the
effects, but the coefficients themselves do not give a sense of the magnitude of the effect.
This is because the coefficient magnitudes are in the units of the standard errors. For a sense of true
magnitude, we separately calculate the average marginal effects for the explanatory variables to
obtain the discrete change in the probability of bank distress averaging across the sample values of
the other predictor variables. For example, to calculate the average predicted probability of distress
for a given percentage of adults saving, the predicted probability was calculated for each bank-year,
using that bank's value explanatory variables for that year, and the average was taken across all
these predicted probabilities.
27. The marginal effect on the households saving percentage tells us that the derivative of
the mean expected probability of bank distress with respect to adults saving is -0.267. This
suggests that if we had four banks and then increased the percentage of adults saving by 1 percent
this would cause one bank to switch from being likely to default to being unlikely to. The 0.02655
coefficient on SME access constraint suggests that if we had 37 banks and then lowered the SME
access constraint by 1 percent, one bank would switch from being likely to default to being unlikely
to. The 0.4046 coefficient on percentage of adults borrowing suggests that, of just 2.5 high default
probability banks, one would become more solvent and unlikely to default if adult borrowing
decreased by 1 percent. The coefficient magnitudes where equity to assets and ROA are removed
are nearly identical.
28. The analysis using the percentage small firm credit line variable as a measure of SME
financial access shows the same directional effects on all variables but the magnitudes of the
effects differ. Here, the marginal effect of the households saving percentage and small firm credit
line percentage on the probability of bank distress are both equal to -0.039. This suggests that if we
had 26 banks and either increased the percentage of adults saving or increased the percentage of
small firms with a credit line by 1 percent this would cause one bank to switch from being likely to
default to being unlikely to default. The 0.046 coefficient on adults borrowing suggests that, of the
21 high default probability banks, one would become more solvent and unlikely to default if adult
borrowing decreased by 1 percent. The -0.0376 coefficient on percentage of small firms with a credit
line suggests that a 1 percent increase in the percentage of small firms with a credit line leads to a
0.038 percent decrease in probability of distress. Removing equity to assets and ROA, column 4,
gives nearly identical magnitudes.
29. Our analysis also shows the results obtained using the dependent variable ln(Z-score),
renormalized so that negative Z-score observations are also reflected. The first two columns

NAMIBIA
40 INTERNATIONAL MONETARY FUND
represent the estimation using the SME Access Constraint of firm-level financial access, while the last
two columns utilize the small firm credit line percentage measure. The interpretation of these
coefficients support the probit estimation results in both the directional effect and the magnitude
effect of variables.
30. If we now turn to the SME access constraint measure, we find that a 1 percentage
point increase in the percentage of households saving increases the Z-score, and thus
improves bank level stability, by 0.0772 percent. A 1 percent increase in adults borrowing
reduces the Z-score by 0.0422 percent and a 1 percent increase in SME access constraint is
associated with a 0.0599 percent reduction in the Z-score measure of stability. Using the small firm
credit line measure of SME financial access, we find consistent results. A 1 percent increase in
percentage of adults saving is associated with a 0.0416 percent increase in Z-score-measured bank
stability, a 1 percent increase in small firms with a credit line leads to a 0.018 percent increase in the
Z-score, while a 1 percent increase in percentage of adults borrowing leads to a 0.0621 percent
decrease in stability. As expected and consistent with the probit analysis, term deposits to assets,
equity to assets and return on average equity all have positive and significant causal effects on bank
stability, while banks’ total asset growth has a negative impact on stability.
F. Conclusions
31. Main findings:
The results of the empirical analysis in this chapter suggest the following broad findings for selected
MICs in SSA, including Namibia:
First, the financial landscape in SSA MICs has deepened in past decades, as reflected in the
increasing share of the stock of private credit to GDP and deposits as ratio to GDP. Furthermore,
their return on assets has stabilized closer to the level of a group of EMs, reflecting a more
mature and competitive financial sector in SSA MICs.
Second, in many MICs in SSA, one reason for the low level of financial inclusion is SME’s lack of
access to finance. Our study shows that SME access to finance has a positive and significant
impact on financial stability. Financial usage can have stabilizing effects on the financial sector
by helping to increase financial sector depth. If borrowing tends to be used for investment or to
finance asset purchases generating returns, overall this would be beneficial to the financial
sector and the economy in general. Thus, financial inclusion focusing on enhancing SME access
to finance tends to enhance financial stability.
Furthermore, another reason for the low level of financial inclusion is that relatively poor
households do not have access to bank accounts for various reasons such as the minimum
balance requirement, fees for opening or maintaining a bank account with low balance, or low
presence of financial institutions in lower-income communities. Therefore, financial inclusion
focusing on improving households’ access to bank accounts will likely enhance financial stability.
Specifically, policy measures such as reducing or eliminating the minimum balance requirement
or fees for opening/maintaining bank accounts with lower balance should increase inclusion.

NAMIBIA
INTERNATIONAL MONETARY FUND 41
Alternatively, using new technology such as e-banking or mobile banking will facilitate the
population’s access to finance.
Moreover, financial inclusion that overly relies on increasing households’ access to credit by
lowering lending standards encouraging low quality creditors to take out unaffordable
loans/mortgages can be destabilizing. In the short run, these policies may mechanically increase
financial inclusion, but in the long run, this will likely jeopardize financial stability which will
ultimately undermine financial inclusion.
Finally, the primary components of global regulatory reforms will likely steer banks’ funding
structures further toward deposits and equity with less reliance on short-term wholesale
funding. This funding structure will likely have a positive impact on financial stability.
32. Policy implications:
We draw the following key policy messages from our findings.
First, policies promoting SME sector development should enhance financial stability. Second,
reforms that facilitate households’ access to savings accounts will also promote financial
stability. However, mechanically expanding the number of people with credit may lead to over
indebtedness. This could undermine financial stability. In a number of countries, the authorities
tend to overly promote loans to households in pursuit of greater financial inclusion. This has led
to over indebtedness of households. Finally, global regulatory reforms will likely have a positive
impact on financial stability by shifting banks’ funding structure more towards capital and
deposits.
However, our results and messages should be interpreted with some caution. There are no one-
size-fits-all approaches to striking an appropriate balance between financial inclusion and
financial stability. The policy of enhancing financial stability of each country has to consider its
country-specific circumstances.
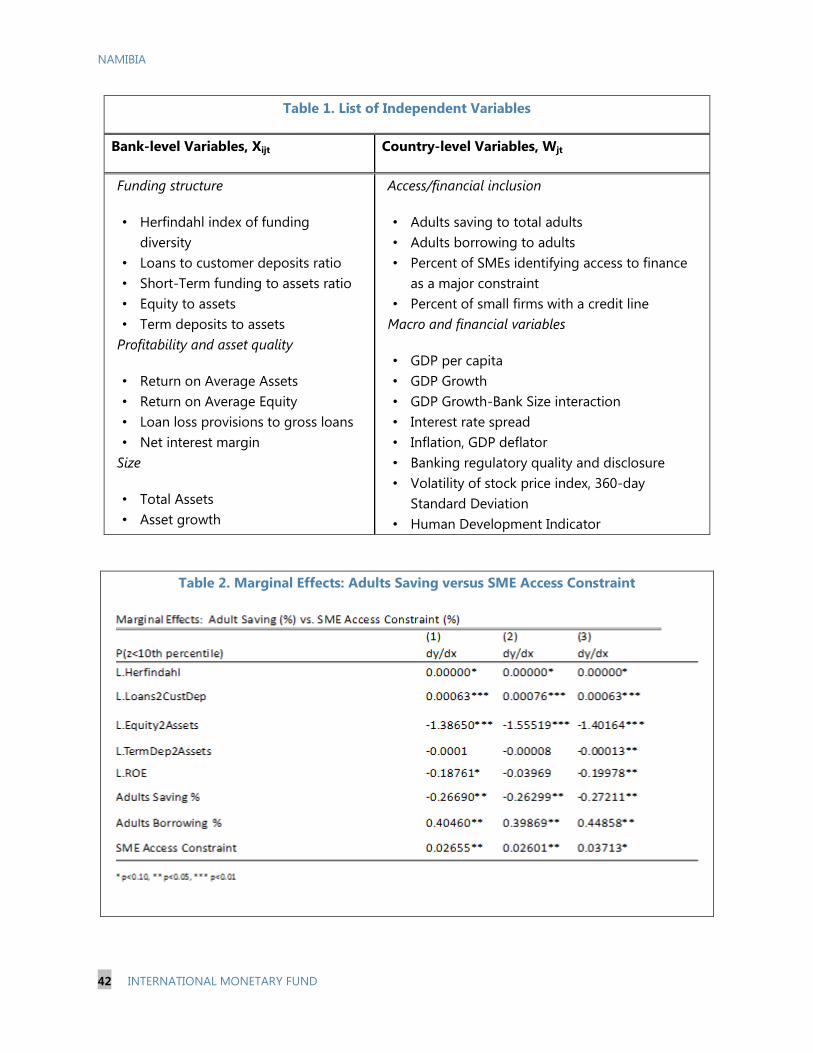
NAMIBIA
42 INTERNATIONAL MONETARY FUND
Table 1. List of Independent Variables
Bank-level Variables, Xijt Country-level Variables, Wjt
Funding structure
• Herfindahl index of funding
diversity
• Loans to customer deposits ratio
• Short-Term funding to assets ratio
• Equity to assets
• Term deposits to assets
Profitability and asset quality
• Return on Average Assets
• Return on Average Equity
• Loan loss provisions to gross loans
• Net interest margin
Size
• Total Assets
• Asset growth
Access/financial inclusion
• Adults saving to total adults
• Adults borrowing to adults
• Percent of SMEs identifying access to finance
as a major constraint
• Percent of small firms with a credit line
Macro and financial variables
• GDP per capita
• GDP Growth
• GDP Growth-Bank Size interaction
• Interest rate spread
• Inflation, GDP deflator
• Banking regulatory quality and disclosure
• Volatility of stock price index, 360-day
Standard Deviation
• Human Development Indicator
Table 2. Marginal Effects: Adults Saving versus SME Access Constraint

NAMIBIA
INTERNATIONAL MONETARY FUND 43
Table 3. Individual Access versus SME Access
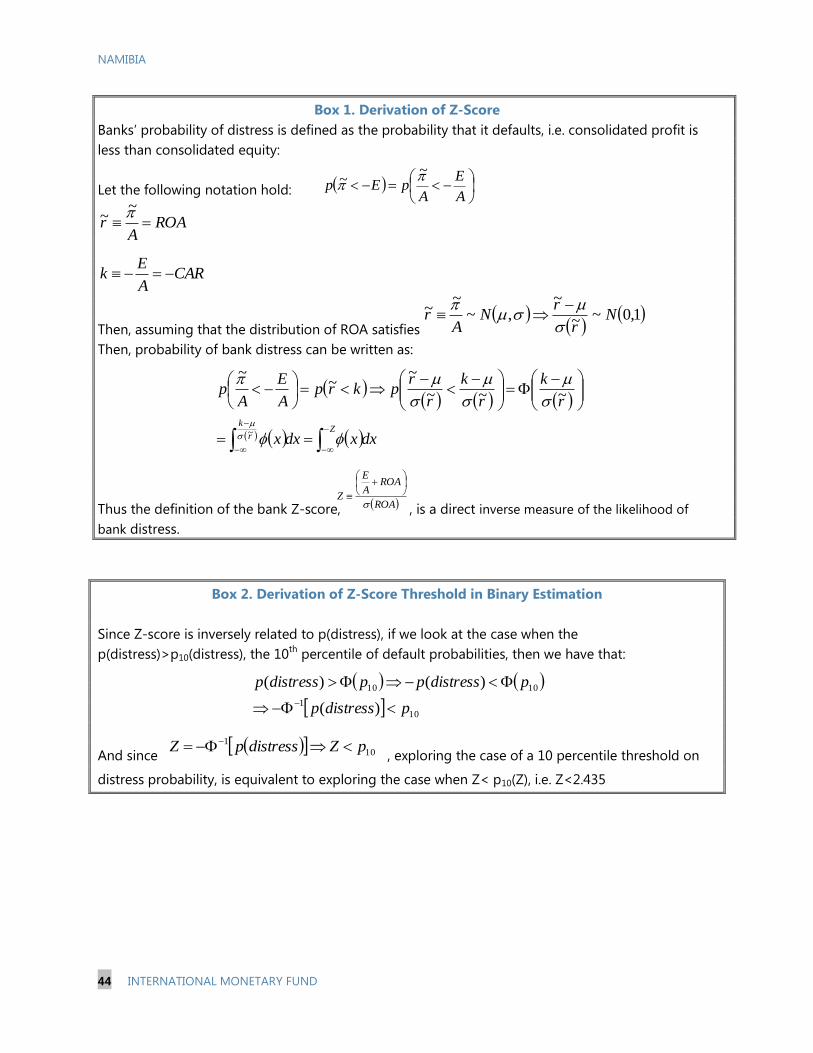
NAMIBIA
44 INTERNATIONAL MONETARY FUND
Box 1. Derivation of Z-Score
Banks’ probability of distress is defined as the probability that it defaults, i.e. consolidated profit is
less than consolidated equity:
Let the following notation hold:
Then, assuming that the distribution of ROA satisfies
Then, probability of bank distress can be written as:
Thus the definition of the bank Z-score, , is a direct inverse measure of the likelihood of
bank distress.
Box 2. Derivation of Z-Score Threshold in Binary Estimation
Since Z-score is inversely related to p(distress), if we look at the case when the
p(distress)>p10(distress), the 10th
percentile of default probabilities, then we have that:
And since , exploring the case of a 10 percentile threshold on
distress probability, is equivalent to exploring the case when Z< p10(Z), i.e. Z<2.435
A
E
ApEp
~
~
ROAA
r ~~
CARA
Ek
1,0~~
~,~
~~ N
r
rN
Ar
dxxdxx
r
k
r
k
r
rpkrp
A
E
Ap
Zr
k
~
~~~
~~
~
ROA
ROAA
E
Z
10
1
1010
)(
)()(
pdistressp
pdistressppdistressp
10
1 pZdistresspZ
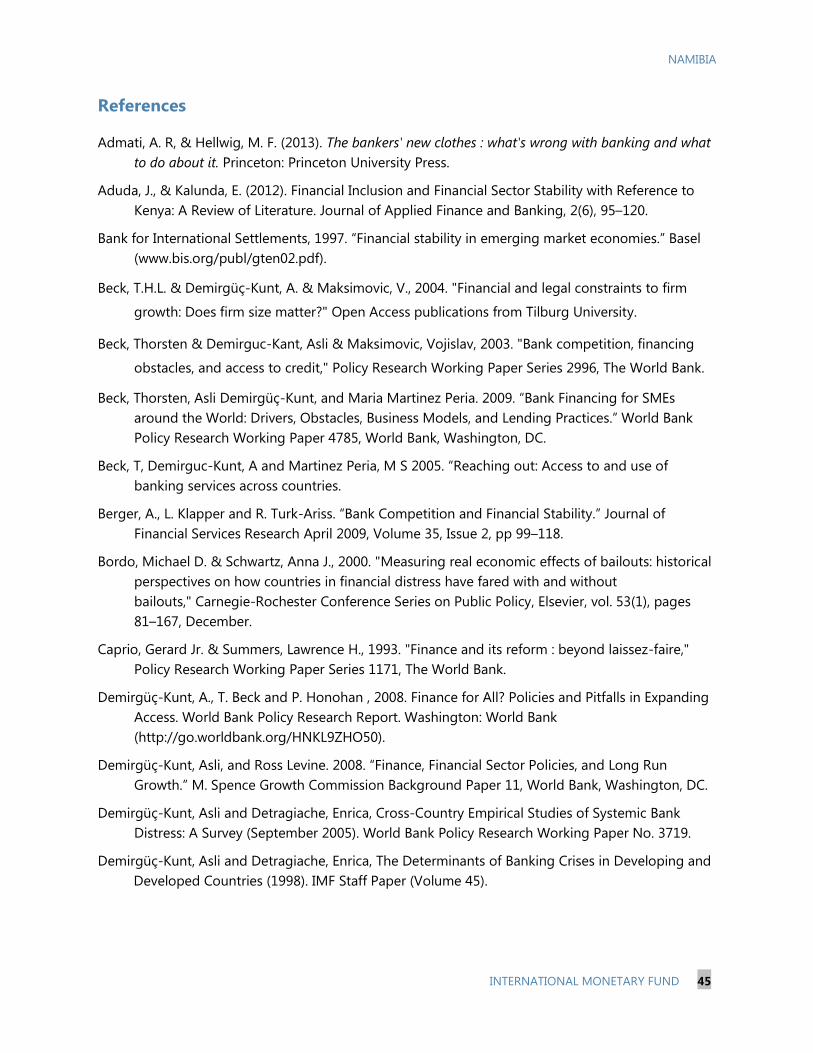
NAMIBIA
INTERNATIONAL MONETARY FUND 45
References
Admati, A. R, & Hellwig, M. F. (2013). The bankers' new clothes : what's wrong with banking and what
to do about it. Princeton: Princeton University Press.
Aduda, J., & Kalunda, E. (2012). Financial Inclusion and Financial Sector Stability with Reference to
Kenya: A Review of Literature. Journal of Applied Finance and Banking, 2(6), 95–120.
Bank for International Settlements, 1997. “Financial stability in emerging market economies.” Basel
(www.bis.org/publ/gten02.pdf).
Beck, T.H.L. & Demirgüç-Kunt, A. & Maksimovic, V., 2004. "Financial and legal constraints to firm
growth: Does firm size matter?" Open Access publications from Tilburg University.
Beck, Thorsten & Demirguc-Kant, Asli & Maksimovic, Vojislav, 2003. "Bank competition, financing
obstacles, and access to credit," Policy Research Working Paper Series 2996, The World Bank.
Beck, Thorsten, Asli Demirgüç-Kunt, and Maria Martinez Peria. 2009. “Bank Financing for SMEs
around the World: Drivers, Obstacles, Business Models, and Lending Practices.” World Bank
Policy Research Working Paper 4785, World Bank, Washington, DC.
Beck, T, Demirguc-Kunt, A and Martinez Peria, M S 2005. “Reaching out: Access to and use of
banking services across countries.
Berger, A., L. Klapper and R. Turk-Ariss. “Bank Competition and Financial Stability.” Journal of
Financial Services Research April 2009, Volume 35, Issue 2, pp 99–118.
Bordo, Michael D. & Schwartz, Anna J., 2000. "Measuring real economic effects of bailouts: historical
perspectives on how countries in financial distress have fared with and without
bailouts," Carnegie-Rochester Conference Series on Public Policy, Elsevier, vol. 53(1), pages
81–167, December.
Caprio, Gerard Jr. & Summers, Lawrence H., 1993. "Finance and its reform : beyond laissez-faire,"
Policy Research Working Paper Series 1171, The World Bank.
Demirgüç-Kunt, A., T. Beck and P. Honohan , 2008. Finance for All? Policies and Pitfalls in Expanding
Access. World Bank Policy Research Report. Washington: World Bank
(http://go.worldbank.org/HNKL9ZHO50).
Demirgüç-Kunt, Asli, and Ross Levine. 2008. “Finance, Financial Sector Policies, and Long Run
Growth.” M. Spence Growth Commission Background Paper 11, World Bank, Washington, DC.
Demirgüç-Kunt, Asli and Detragiache, Enrica, Cross-Country Empirical Studies of Systemic Bank
Distress: A Survey (September 2005). World Bank Policy Research Working Paper No. 3719.
Demirgüç-Kunt, Asli and Detragiache, Enrica, The Determinants of Banking Crises in Developing and
Developed Countries (1998). IMF Staff Paper (Volume 45).
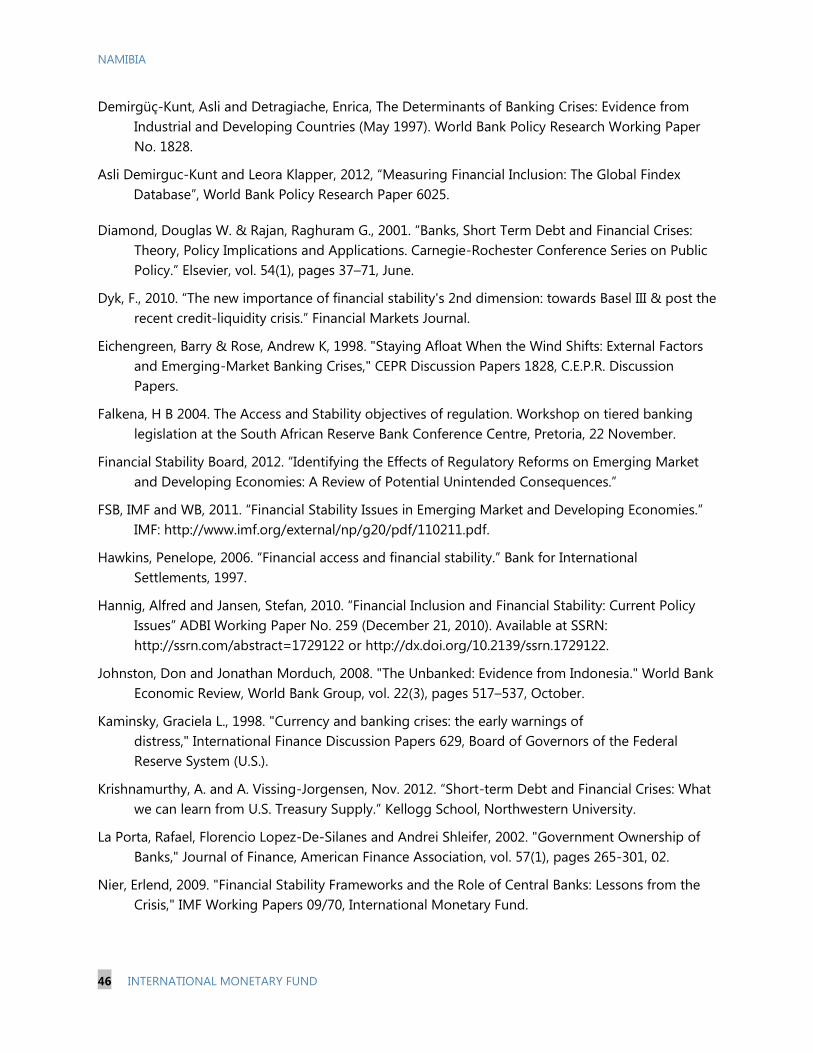
NAMIBIA
46 INTERNATIONAL MONETARY FUND
Demirgüç-Kunt, Asli and Detragiache, Enrica, The Determinants of Banking Crises: Evidence from
Industrial and Developing Countries (May 1997). World Bank Policy Research Working Paper
No. 1828.
Asli Demirguc-Kunt and Leora Klapper, 2012, “Measuring Financial Inclusion: The Global Findex
Database”, World Bank Policy Research Paper 6025.
Diamond, Douglas W. & Rajan, Raghuram G., 2001. “Banks, Short Term Debt and Financial Crises:
Theory, Policy Implications and Applications. Carnegie-Rochester Conference Series on Public
Policy.” Elsevier, vol. 54(1), pages 37–71, June.
Dyk, F., 2010. “The new importance of financial stability's 2nd dimension: towards Basel III & post the
recent credit-liquidity crisis.” Financial Markets Journal.
Eichengreen, Barry & Rose, Andrew K, 1998. "Staying Afloat When the Wind Shifts: External Factors
and Emerging-Market Banking Crises," CEPR Discussion Papers 1828, C.E.P.R. Discussion
Papers.
Falkena, H B 2004. The Access and Stability objectives of regulation. Workshop on tiered banking
legislation at the South African Reserve Bank Conference Centre, Pretoria, 22 November.
Financial Stability Board, 2012. “Identifying the Effects of Regulatory Reforms on Emerging Market
and Developing Economies: A Review of Potential Unintended Consequences.”
FSB, IMF and WB, 2011. “Financial Stability Issues in Emerging Market and Developing Economies.”
IMF: http://www.imf.org/external/np/g20/pdf/110211.pdf.
Hawkins, Penelope, 2006. “Financial access and financial stability.” Bank for International
Settlements, 1997.
Hannig, Alfred and Jansen, Stefan, 2010. “Financial Inclusion and Financial Stability: Current Policy
Issues” ADBI Working Paper No. 259 (December 21, 2010). Available at SSRN:
http://ssrn.com/abstract=1729122 or http://dx.doi.org/10.2139/ssrn.1729122.
Johnston, Don and Jonathan Morduch, 2008. "The Unbanked: Evidence from Indonesia." World Bank
Economic Review, World Bank Group, vol. 22(3), pages 517–537, October.
Kaminsky, Graciela L., 1998. "Currency and banking crises: the early warnings of
distress," International Finance Discussion Papers 629, Board of Governors of the Federal
Reserve System (U.S.).
Krishnamurthy, A. and A. Vissing-Jorgensen, Nov. 2012. “Short-term Debt and Financial Crises: What
we can learn from U.S. Treasury Supply.” Kellogg School, Northwestern University.
La Porta, Rafael, Florencio Lopez-De-Silanes and Andrei Shleifer, 2002. "Government Ownership of
Banks," Journal of Finance, American Finance Association, vol. 57(1), pages 265-301, 02.
Nier, Erlend, 2009. "Financial Stability Frameworks and the Role of Central Banks: Lessons from the
Crisis," IMF Working Papers 09/70, International Monetary Fund.

NAMIBIA
INTERNATIONAL MONETARY FUND 47
Rocha, Roberto R., Zsofia Arvai and Subika Farazi, 2011. “Financial Access and Stability: A Road Map
for the Middle East and North Africa.” World Bank, Washington, DC.
Ruiz-Porras, A. 2009. “Financial Structure, Financial Development and Banking Fragility: International
Evidence”, Análisis Económico Núm. 24 (56).
Vazquez, Francisco and Pablo Federico. Bank Funding Structures and Risk: Evidence from the Global
Financial Crisis. IMF Working Paper WP/12/29.
The World Bank, Global Financial Development Report (2013). World Bank, Washington, DC.


![Imf 2013_country Report, Portugal Selected Issues Paper [January]](https://img.pdfslide.us/doc/110x75/5530cc415503465e598b48b2/imf-2013country-report-portugal-selected-issues-paper-january.jpg)