Embed Size (px)
Citation preview

© 2004 International Monetary Fund June 2004
IMF Country Report No. 04/177
Bulgaria: Selected Issues and Statistical Appendix This Selected Issues paper and Statistical Appendix for Bulgaria was prepared by a staff team of the International Monetary Fund as background documentation for the periodic consultation with the member country. It is based on the information available at the time it was completed on May 27, 2004. The views expressed in this document are those of the staff team and do not necessarily reflect the views of the government of Bulgaria or the Executive Board of the IMF. The policy of publication of staff reports and other documents by the IMF allows for the deletion of market-sensitive information. To assist the IMF in evaluating the publication policy, reader comments are invited and may be sent by e-mail to [email protected].
Copies of this report are available to the public from
International Monetary Fund ● Publication Services 700 19th Street, N.W. ● Washington, D.C. 20431
Telephone: (202) 623 7430 ● Telefax: (202) 623 7201 E-mail: [email protected] ● Internet: http://www.imf.org
Price: $15.00 a copy
International Monetary Fund
Washington, D.C.


INTERNATIONAL MONETARY FUND
BULGARIA
Selected Issues and Statistical Appendix
Prepared by a staff team comprising Christoph Duenwald, Philippe Egoumé-Bossogo, Bikas Joshi (all EUR), Andrea Maechler (MFD), and Alexander Pitt (PDR)
Approved by the European Department
May 27, 2004
Contents Page I. Bulgaria’s Credit Boom: Characteristics, Consequences, and Policy Options .......6 A. Introduction ........................................................................................................6 B. Causes and Characteristics of the Credit Boom .................................................7 C. Consequences of the Credit Boom ...................................................................15 D. Policy Options..................................................................................................20 E. Concluding Remarks ........................................................................................23 F. References.........................................................................................................24 Text Box 1. Channels for Financial Intermediation...................................................................17 2. Credit Growth and Current Account in Financial Programming...........................19 Figures 1. Developments in Credit in Bulgaria, 1996-2004 .....................................................7 2. Change in Credit-to-GDP Ratio, 1998-2003 ...........................................................9 3. Change in Credit-to-GDP Ratio, 1998-2003 ...........................................................9 3a. Bulgaria and the Baltic Countries .....................................................................9 3b. Bulgaria and Selected Other European Countries.............................................9 4. Change in Credit-to-GDP Ratio by Borrower, 1998-2003 ....................................10 5. Real Lending Rates, 1998-2003.............................................................................11 6. Sources of Credit Expansion, 2001-2004 ..............................................................12 7. Changes in Credit-to-GDP Ratio, 2001-2004........................................................13 8. Real Estate Price Index and CPI Index, 2001-03...................................................18 9. Credit and Current Account Deficit to GDP Ratio, 2001-03.................................20 Tables 1. Selected Macroeconomic Indicators, 1999-2003.....................................................9 2. Contribution to Real GDP Growth, 1999-2003 .....................................................11

- 2 -
Contents Page 3. Change in Credit-to-GDP Ratio.............................................................................14 4. Financial Soundness Indicators, 1999-2003 ..........................................................18 II. External Sustainability and Vulnerability ..............................................................26 A. Introduction ......................................................................................................26 B. Analytical Framework ......................................................................................26 C. External Sustainability .....................................................................................27 D. Vulnerability ....................................................................................................31 E. Conclusions ......................................................................................................35 Text Box 1. Comparing Bulgaria with the Baltic Countries......................................................36 Figures 1. Current Account.....................................................................................................28 2. Unit Labor Costs ....................................................................................................29 3. Productivity and Wages .........................................................................................29 4. Scenarios. ...............................................................................................................30 5. FDI .........................................................................................................................32 6. Balance Sheet Indicators ........................................................................................33 Tables 1. Intersectoral Asset and Liability Position ..............................................................35 III. Medium-Term Fiscal Framework and Sustainability and Implications of EU Accession......................................................................38 A. Introduction ......................................................................................................38 B. Medium-Term Fiscal Framework and Policy...................................................38 C. Fiscal Implications of Pre- and Post-EU Accession and NATO Requirements .............................................................................51 D. Medium-Term Fiscal Sustainability.................................................................52 E. Concluding Remarks ........................................................................................58 F. References.........................................................................................................59 Text Box 1. Summary of Tax Rates as of April 2004................................................................41 Figures 1. NSSI Balances, 2003-2043 ....................................................................................44 2. Demographic and Unemployment Forecasts, 2003-2043......................................45 3. Public Debt Data as of end-March 2004................................................................55

- 3 -
Contents Page Tables 1. Medium-Term Fiscal Framework ..........................................................................40 2. Macroeconomic Framework, 2002-2009...............................................................42 3. Selected Pension-Related Indicators ......................................................................47 4. Health Sector Spending Under the Baseline Scenario ...........................................48 5. EU Accession-Related Transfers and Spending ....................................................51 6. Public Debt Under the Baseline Scenario ..............................................................53 7. Public Sector Debt Sustainability Framework, 1998-2009....................................57 IV. FSAP Follow-Up ...................................................................................................60 A. Financial Sector Vulnerability Assessment......................................................60 B. Financial Soundness Indicators ........................................................................79 Text Box 1. Monitoring Leasing Activities ...............................................................................78 Figures 1. Interest Rate Spread in Euros, 1999–2003.............................................................75 2. Interest Rate Spread in Leva, 1999–2003 ..............................................................75 Tables 1. Financial Sector Structure, 1999–2003..................................................................61 2. Bank Market Structure, 1999–2003.......................................................................63 3. Financial Soundness Indicators, 1999–2003..........................................................64 4. Quality of Banks’ Loan Portfolio, 1999–2003.......................................................66 5a. Sectoral Distribution of Commercial Banks’ Loans Registered in the Credit Registry .........................................................................................67 5b. Currency Breakdown of Commercial Banks’ Loans Registered in the Credit Registry ........................................................................67 6. Commercial Banks’ Credit Structure, 1999–2003.................................................68 7. Prudential Ratio Requirements, December 2003...................................................69 8. Loanable Resources of Commercial Banks, 1999–2003 .......................................71 9. Deposit Structure, 1999–2003 ...............................................................................72 10. Non-Bank Financial Sector, 1999–2003................................................................83 Appendix I: Implementation of Main FSAP Recommendations ......................................88

- 4 -
Contents Page Statistical Appendix Tables A1. National Accounts 1999–2003...............................................................................93 A2. Selected Transition Economies: Cumulative Change in GDP, 1989–2003 .........94 A3. Gross Value Added in the Industrial Sector, 1999–2003.......................................95 A4. Gross Value Added in the Services Sector, 1999–2003 ........................................96 A5. Gross Output of Services by Branches, 1999–2003...............................................97 A6. Total and Private Agicultural Production, 1999–2003 ..........................................98 A7. Production and Average Yields of Selected Agricultural Crops, 1999–2003 .......99 A8. Acquisition of Tangible Fixed Assets, 1999–2003..............................................100 A9. National Income Accounts, 1999–2003...............................................................101 A10. Average Monthly Earnings in the State Sector, 1999–2003 ................................102 A11. Average Monthly Earnings in the Private Sector, 1999–2003.............................103 A12. Average Monthly Earnings in the Public and Private Sectors, 1999–2003 .........104 A13. Labor Force, Employment, and Unemployment, 1999–2003..............................105 A14. Price Indices of Food, Non-Food, and Services, 1999–2004...............................106 A15. Consumer and Producer Price Indices, 1999–2004 .............................................107 A16. Estimated Private Sector Share in GDP in Selected Transition Economies, 1999–2003 ...................................................................108 A17. Financial Performance of State-Owned Enterprises, 1999–2003 ........................109 A18. Bank and Nonbank Liabilities of State-Owned Enterprises, 1999–2003 ............110 A19. State-Owned Enterprises Profitability and Profit Categories, 1999–2003...........111 A20. Share of the 100 Largest Loss-Making State-Owned Enterprises in All State-Owned Enterprises, 1999–2002 ...................................................112 A21. Privatization of State-Owned Enterprises, 1999–2004........................................113 A22. General Government, 1999–2003........................................................................114 A23. General Government Revenue, 1999–2003 .........................................................115 A24. General Government Expenditure, 1999–2003 ...................................................116 A25. Cash Flow Statement – Consolidated General Government (GFSM 2001 Definition) 1999–2003................................................................117 A26. Revenue – Consolidated Central Government (GSFM 2001 Definition), 1999-2003 ...............................................................118 A27. Total Outlays – Consolidated Central Government (GSFM 2001 Definition) 1999-2003 ................................................................119 A28. Cash Flow Statement – Budgetary Central Government (GSFM 2001 Definition) 1999-2003 ................................................................120 A28a. Cash Flow Statement – Extrabudgetary Accounts (GSFM 2001 Definition), 1999-2003 ...............................................................121 A29. Cash Flow Statement – Social Security Funds (GSFM 2001 Definition), 1999-2003 ...............................................................122 A30. Cash Flow Statement – Local Governments (GSFM 2001 Definition), 1999-2003 ...............................................................123

- 5 -
Contents Page A31. Monetary Survey, 1998-2003...............................................................................124 A32. Foreign Assets of the Banking System, 1998-2003 .............................................125 A33. Composition of Broad Money, 1998-2003 ..........................................................126 A34. Nominal Interest Rates and Exchange Rates, 1998-2004 ....................................127 A35. Real Interest Rates and Uncovered Interest Differentials, 1998-2004.................128 A36. National Bank Balance Sheet, 1998-2003 ...........................................................129 A37. Commercial Bank Indicators, 1998-2003 ............................................................130 A38. Consolidated Income Statement of the Banking System, 2000-2003..................131 A39a. Summary Balance of Payments, 1999-2003 (In millions of euros) .....................132 A39b. Summary Balance of Payments, 1999-2003 (In millions of U.S. dollars)...........133 A40. Current Account, 1999-2003 ...............................................................................134 A41. Trade Volume and Prices, 1999-2003..................................................................135 A42. Commodity Composition of Exports, 1999-2003................................................136 A43. Commodity Composition of Imports, 1999-2003................................................137 A44. Direction of Trade, 1999-2003.............................................................................138 A45. Tourism Indicators, 1999-2003............................................................................139 A46. Financial Account, 1999-2003.............................................................................140 A47. Foreign Direct Investment by Sector and Country of Origin, 1999-2003............141 A48. External Debt Stock, 1999-2003..........................................................................142 A49. External Debt Service, 1999-2003.......................................................................143 A50. Currency Composition of External Debt, 1999–2003 .........................................144 A51. Convertible Currency, Position with Developing Countries, 1999–2003 ...........145 A52. Import Tariffs, 1999–2003...................................................................................146

- 6 -
I. BULGARIA’S CREDIT BOOM: CHARACTERISTICS, CONSEQUENCES, AND POLICY OPTIONS1
A. Introduction
1. One of the most apparent economic developments in Bulgaria in recent years is a surge in bank credit. In the aftermath of the 1996/97 economic and financial crisis, credit growth was initially very subdued, reflecting low credit demand and risk-averse behavior by banks. The banking sector was completely restructured after the crisis, with virtually the entire banking system now in private hands and three-quarters foreign owned. As confidence returned, credit demand increased and banks began to lend again. While this catch-up process was initially very slow, the past two years have seen a dramatic acceleration.
2. The rapid credit expansion has not yet raised significant financial stability issues, but it has been a key factor in the sharp weakening of the external current account. Increased financial intermediation is welcome from a growth perspective, as it increases output and demand and raises efficiency, and so far, it has not led to a weakening of prudential indicators. Indeed, banks’ asset quality, liquidity, profitability, and capitalization remain very high. However, concurrent with the surge in bank credit, the external current account has weakened, reaching a deficit of 8½ percent of GDP in 2003, up from 5½ percent in 2002. While the deficit has been mostly financed by foreign direct investment (FDI) inflows in recent years, deficits of this magnitude cannot be sustained as privatization inflows will dry up with the completion of the government’s privatization program. Indeed, given reasonable assumptions on greenfield investment, the debt-stabilizing non-interest current account deficit amounts to about 7¼ percent of GDP.2
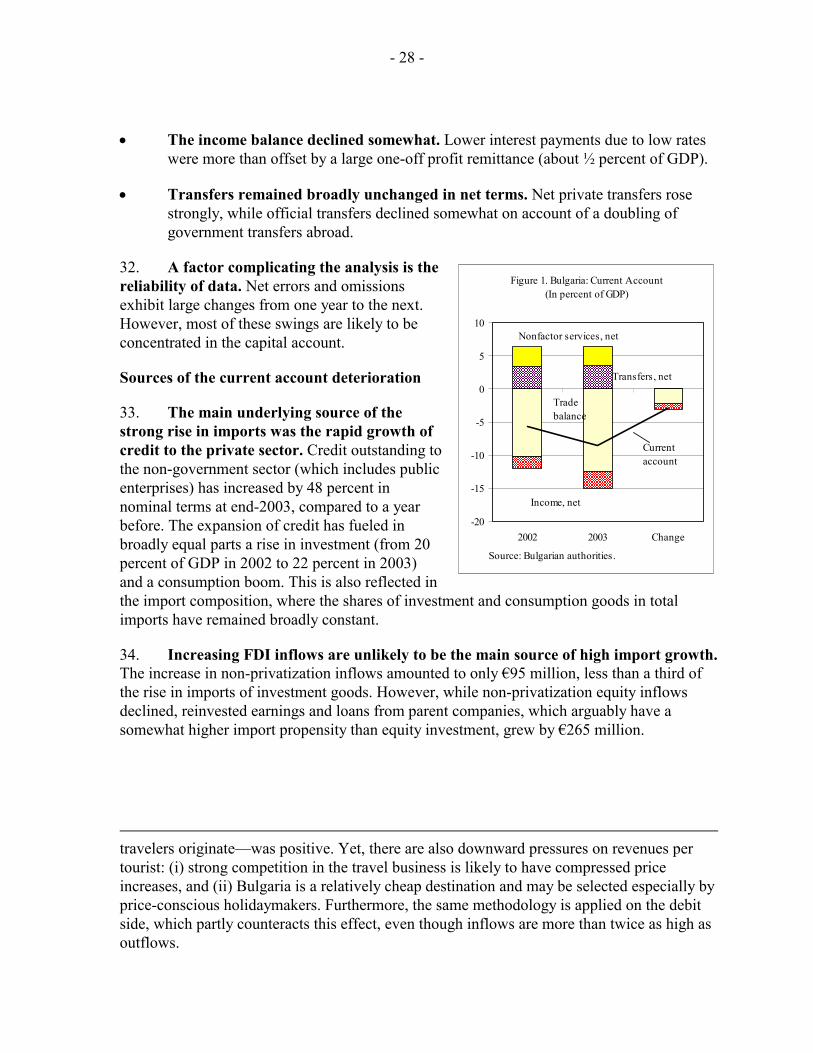
3. Credit growth is unlikely to slow substantially without measures to contain it. While banks’ loan portfolios will eventually grow in line with growth in funding sources, the banking system remains liquid in the aggregate, and able to fund sustained rapid credit expansion from abroad. Moreover, Bulgaria’s level of financial intermediation is still low and further catch-up is to be expected. For example, Cottarelli et al. (2003) estimate that the post-transition equilibrium level of the credit-to-GDP ratio for a country with Bulgaria’s fundamentals is about 50 percent, nearly twice the current level.
4. To the extent that credit growth is driving the external deficit, policies aimed at reducing bank lending growth—as part of a broader package of measures including tighter fiscal policy and structural reforms—are an appropriate response to these developments. While the levels of monetization and financial intermediation remain low
1 Prepared by Christoph Duenwald and Bikas Joshi.
2 See Chapter II.
- 7 -
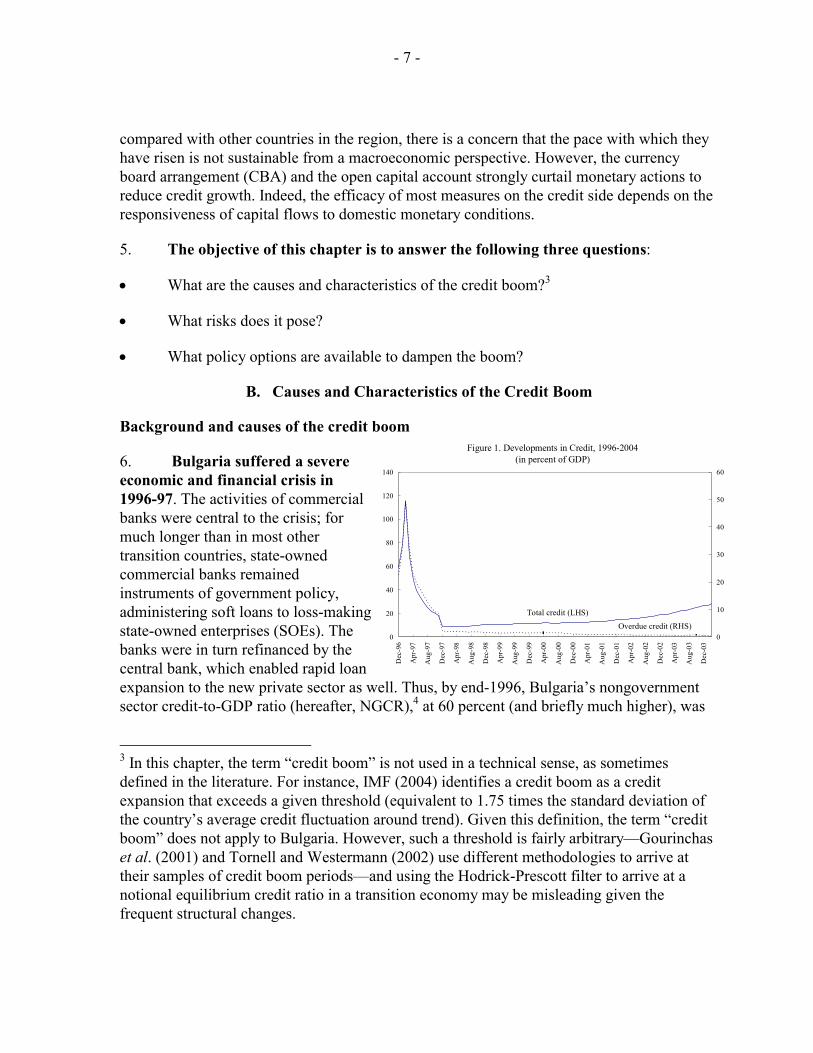
Figure 1. Developments in Credit, 1996-2004(in percent of GDP)
0
20
40
60
80
100
120
140
Dec
-96
Apr
-97
Aug
-97
Dec
-97
Apr
-98
Aug
-98
Dec
-98
Apr
-99
Aug
-99
Dec
-99
Apr
-00
Aug
-00
Dec
-00
Apr
-01
Aug
-01
Dec
-01
Apr
-02
Aug
-02
Dec
-02
Apr
-03
Aug
-03
Dec
-03
0
10
20
30
40
50
60
Total credit (LHS)Overdue credit (RHS)
compared with other countries in the region, there is a concern that the pace with which they have risen is not sustainable from a macroeconomic perspective. However, the currency board arrangement (CBA) and the open capital account strongly curtail monetary actions to reduce credit growth. Indeed, the efficacy of most measures on the credit side depends on the responsiveness of capital flows to domestic monetary conditions.
5. The objective of this chapter is to answer the following three questions:
• What are the causes and characteristics of the credit boom?3
• What risks does it pose?
• What policy options are available to dampen the boom?
B. Causes and Characteristics of the Credit Boom
Background and causes of the credit boom
6. Bulgaria suffered a severe economic and financial crisis in 1996-97. The activities of commercial banks were central to the crisis; for much longer than in most other transition countries, state-owned commercial banks remained instruments of government policy, administering soft loans to loss-making state-owned enterprises (SOEs). The banks were in turn refinanced by the central bank, which enabled rapid loan expansion to the new private sector as well. Thus, by end-1996, Bulgaria’s nongovernment sector credit-to-GDP ratio (hereafter, NGCR),4 at 60 percent (and briefly much higher), was
3 In this chapter, the term “credit boom” is not used in a technical sense, as sometimes defined in the literature. For instance, IMF (2004) identifies a credit boom as a credit expansion that exceeds a given threshold (equivalent to 1.75 times the standard deviation of the country’s average credit fluctuation around trend). Given this definition, the term “credit boom” does not apply to Bulgaria. However, such a threshold is fairly arbitrary—Gourinchas et al. (2001) and Tornell and Westermann (2002) use different methodologies to arrive at their samples of credit boom periods—and using the Hodrick-Prescott filter to arrive at a notional equilibrium credit ratio in a transition economy may be misleading given the frequent structural changes.

- 8 -
higher than in most other Eastern European countries (Figure 1).5 With the unreformed SOEs making losses, nonperforming loans rose sharply, and, with the growing decapitalization of banks and a number of failed pyramid schemes, public confidence in the financial system evaporated in late 1995. Mass bank runs followed the exchange rate crisis in spring 1996. In the meantime, the health of the banking sector had reached new lows: in early 1996, 70 percent of outstanding loans were classified as nonperforming, and the negative net worth of the banking system was estimated at 10 percent of GDP. Bank lending ground to a halt, with the NGCR falling to 9 percent by end-1997, a precipitous drop of 50 percentage points from a year earlier.
7. The period after the crisis saw a gradual revival of commercial banking. Following the crisis, banks, now operating in a new regime and with different incentives, initially invested mostly in government securities, and generally maintained high cash balances. This risk-averse behavior in part reflected a lack of information (including too short a credit history) about prospective borrowers, doubts about contract enforcement, and the loss of a large client base as the CBA (with the prohibition to lend to banks and the government) had severed the close link between the banks and SOEs. Gradually, and aided by economic recovery, a return of confidence, strengthening of bank balance sheets, and privatization of state banks (in many cases to foreign investors), this risk averse behavior gave way to increased lending. At the same time, the legal, supervisory, and accounting framework banks were operating in was strengthened, laying the foundation for increased bank lending. The framework was strengthened by (i) expanding the regulatory powers of the Bulgarian National Bank (BNB); (ii) strengthening prudential regulations and supervision, including an increase in minimum capital adequacy requirements; (iii) increasing creditors’ rights; and (iv) introducing international accounting standards.
4 In the official credit statistics, the nongovernment sector includes the following types of borrowers: nonfinancial public corporations, nonfinancial private corporations, and households (including nonprofit institutions serving households, which comprise political and charitable organizations).
5 The Organization for Economic Co-Operation and Development (1999, p. 59) notes that, until 1996, “commercial credit was expanded to the nonfinancial sector in Bulgaria to a degree that was unprecedented relative to any other European transition economy.” It should be pointed out that private banks—the emergence of which was facilitated by soft entry regulations—were also actively extending credit at the time.

- 9 -
Figure 2. Change in Credit-to-GDP Ratio, 1998-2003(from previous year, in percentage points)
0
1
2
3
4
5
6
7
8
Dec-98 Dec-99 Dec-00 Dec-01 Dec-02 Dec-030
1
2
3
4
5
6
7
8
1999 2000 2001 2002 2003
Real GDP (percent change) 2.3 5.4 4.1 4.9 4.3CPI Inflation (average) 2.6 10.4 7.5 5.8 2.3CPI Inflation (end of period) 7.0 11.4 4.8 3.8 5.6Credit-to-GDP ratio (end of period) 11.8 12.2 14.5 19.0 26.4Broad Money (in percent of GDP) 31.7 36.8 41.7 42.9 48.1Current Account (in percent of GDP) -4.8 -5.6 -7.3 -5.6 -8.5
Sources: Bulgarian National Bank; National Statistical Institute, and staff estimates.
Table 1. Selected Macroeconomic Indicators, 1999-20038. Since mid-2002, what had been a gradual revival of financial intermediation has turned into a credit boom. The post-crisis period witnessed a return of macroeconomic stability, robust real GDP growth (4¼ percent on average) and moderate inflation (Table 1). Against this favorable macroeconomic background, the NGCR rose by roughly 1½ percentage points (annual average) between end-1997 and end-2001 (Figure 2). Thereafter, credit growth accelerated, with the NGCR rising by 6 percentage points per year on average between end-2001 and end-2003, and by a further 2 percentage points in the first quarter of 2004 alone.
9. Bulgaria’s credit growth is broadly comparable to other countries that have experienced or are experiencing credit booms (Figure 3). Cottarelli et al. (2003) classify Bulgaria among the “early birds”—along with Croatia, Estonia, Hungary, Latvia, Poland, and Slovenia—having bank credit to the nongovernment sector rising for at least five years at an annual average rate exceeding 1½ percentage points of GDP. More recent credit developments in Bulgaria would classify the country more appropriately as a “fast riser.”
Figure 3. Change in Credit-to-GDP Ratio, 1998-2003(from previous year, in percentage points)
Source: Bulgarian National Bank, National Statistical Institute, WEO, and staff estimates.
Figure 3a: Bulgaria and the Baltic Countries
-4
0
4
8
12
1998 1999 2000 2001 2002 2003
-4
0
4
8
12
Bulgaria Estonia
Latvia Lithuania
Figure 3b: Bulgaria and Selected Other European Countries
-4
0
4
8
12
1998 1999 2000 2001 2002 2003
-4
0
4
8
12Bulgaria CroatiaHungary RomaniaPoland Slovenia

- 10 -
Figure 4. Change in Credit-to-GDP Ratio by Borrower, 1998-2003(from previous year, in percentage points)
-2
-1
0
1
2
3
4
5
6
7
8
Dec-98 Dec-99 Dec-00 Dec-01 Dec-02 Dec-03
-2
-1
0
1
2
3
4
5
6
7
8
Credits to households and NPISHCredits to nonfinancial private corporationsCredits to nonfinancial public corporations
Total
10. The boom reflects a mix of supply- and demand-side factors. In broad terms, the credit boom reflects a catching-up from depressed levels of post-crisis bank lending, and is thus part of a process of financial deepening. More specifically:
• Banks’ ability to fund loan expansion has been boosted by strong capital inflows, partly through the banking system, amid high global liquidity, low interest rates, and increased confidence associated with Bulgaria’s prospective EU accession.
• The newly privatized banks were keen to boost profitability and market share. With high capital adequacy ratios, banks managed to increase profitability by shifting the composition of their assets towards loans. This more aggressive stance on the part of the banks has been actively encouraged by their foreign parents. Many of the banks’ foreign owners are domiciled in less profitable markets, so parents have encouraged their subsidiaries to pursue aggressive loan portfolio expansion to improve consolidated results. With most banks pursuing this strategy, there has been a race between banks to maintain market share, which contributed to the acceleration of credit.
• The greater supply of credit has been matched by increased demand from both businesses and households (Figure 4). For the former, a newfound confidence in Bulgaria’s future—prompted in part by strong EU accession prospects—boosted investment intentions and demand for credit. Consumer and mortgage credit has taken off partly because the banks offered new products, and partly because household demand for durables and real estate increased from previously depressed levels as they have felt more confident in their ability to service debt. These developments are reflected in real sector indicators, with private consumption and fixed investment growing rapidly last year (Table 2).
• Finally, an additional factor explaining the credit boom may be crowding-in: bank credit to the public sector has declined substantially (Figure 4), reflecting low general government fiscal deficits and the privatization of nonfinancial public corporations.

- 11 -
Figure 5. Real Lending Rates, 1998-2003(in BGN, percent, weighted period average)
Short-term
Long-term
-5
0
5
10
15
20
Dec-98
Mar-99
Jun-99
Sep-99
Dec-99
Mar-00
Jun-00
Sep-00
Dec-00
Mar-01
Jun-01
Sep-01
Dec-01
Mar-02
Jun-02
Sep-02
Dec-02
Mar-03
Jun-03
Sep-03
Dec-03
-5
0
5
10
15
20
1999 2000 2001 2002 2003
Real GDP 2.3 5.4 4.1 4.9 4.3Final consumption 7.3 5.0 3.8 3.2 5.7
Private consumption 6.5 3.1 3.6 2.5 4.4Public consumption 0.8 1.9 0.2 0.7 1.3
Gross capital formation 1.7 2.3 3.7 0.9 3.2Net exports -6.7 -2.0 -3.5 0.8 -4.6
Exports of goods and services -2.4 7.4 5.6 3.9 4.3Imports of goods and services -4.3 -9.4 -9.0 -3.1 -8.9
Memorandum itemsShare of domestic demand in nominal GDP 105.8 105.4 107.6 106.6 109.8Share of net exports in nominal GDP -5.8 -5.4 -7.6 -6.6 -9.8
Nominal GDP (in millions of leva) 23,790 26,753 29,709 32,335 34,410
Sources: National Statistical Institute and staff estimates.
Table 2. Contribution to Real GDP Growth, 1999-2003
(In percent)
11. The sustained decline in real lending rates suggests that demand for credit is still catching up with ample supply. While nominal rates have stabilized in recent months, both short- and long-term real lending rates fell in 2003 (Figure 5). The implied yield curve has remained broadly stable. The spread between lending and deposit rates has fallen, but at around 950 basis points it remains very high.6
12. Banks have funded the expansion of credit through three main channels (Figure 6): (i) deposit growth has been relatively quick, owing to reintermediation and improved confidence; (ii) a reduction of foreign assets abroad, reflecting low global interest rates; and, more recently, (iii) borrowing from abroad (increasing foreign liabilities). While the first has led to a dramatic rise of the credit-to-deposit ratio, from 53 percent at end-2001
6 An important caveat here is that, given the hard peg, banks are limited in the extent to which they can raise rates. Also, given the CBA, banks can in principle face relatively high interest rate volatility. While volatility was indeed high in 1999-2001, the last two years have seen a reduction, a reflection of steadier capital flows.

- 12 -
to 84 percent at end-2003, the latter two have resulted in a very sharp drop in banks’ net foreign assets. To a lesser extent, additional capital—either from the parent bank or through issuance of subordinated debt—has also been a source, but only for banks whose capital adequacy ratios were near the regulatory minimum of 12 percent.
Figure 6. Sources of Credit Expansion, 2001-2004
Source: Bulgarian National Bank and staff estimates.
Foreign Assests and Liabilities(In billions of leva)
0
1
2
3
4
5
6
Jan-01 Jul-01 Jan-02 Jul-02 Jan-03 Jul-03 Jan-040
1
2
3
4
5
6
Net Foreign AssetsForeign AssetsForeign Liabilities
Credit and Deposits(In percent)
2030405060708090
Jan-01 Jul-01 Jan-02 Jul-02 Jan-03 Jul-03 Jan-042030405060708090
Credit-to-depositratioDeposit-to-GDP ratio
Characteristics of the credit boom
13. As noted, in the post-crisis period, bank credit to the nongovernment sector initially rose gradually, but accelerated after 2001 (Figure 7 and Table 3). The largest contributor to the average annual 6 percentage point increase in the NGCR in 2002-03 was the nonfinancial corporate sector with 3¾ percentage points. The average increase in the NGCR for households amounted to about 2 percentage points, while that for nonfinancial public corporations remained unchanged (after having dropped by ¾ percentage point a year on average in 1998-2001). The 2002-03 pick-up in growth was concentrated in medium- and long-term credit, which rose on average by 5 percentage points of GDP per year.7 Finally, while domestic and foreign currency credit were equal contributors to credit growth in the later period, the contribution of foreign currency credit rose dramatically in this period relative to the earlier period. There are a number of other noteworthy trends:
7 The BNB uses the following maturity breakdown: less than one year, between one year and five years, and over five years. For the purposes of this chapter, the first category is short-term credit, and the sum of the latter two is medium- and long-term credit. Overdrafts are assumed to be short-term credits.

- 13 -
Figure 7. Changes in Credit-to-GDP Ratio, 2001-2004(in percentage points of GDP, year-on-year)
Sources: Bulgarian National Bank and staff estimates.
Credit by Borrower
-2-10123456789
Jan-01 Jul-01 Jan-02 Jul-02 Jan-03 Jul-03 Jan-04-2-10123456789
Credit by borrower
Credits to nonfinancial public corporations
Credits to nonfinancial private corporations
Credits to households and NPISH
Credit by Maturity
-2-10123456789
Jan-01 Jul-01 Jan-02 Jul-02 Jan-03 Jul-03 Jan-04-2-10123456789
Total credit
Short-term
Medium- and Long-term
Credit by Currency
-2-10123456789
Jan-01 Jul-01 Jan-02 Jul-02 Jan-03 Jul-03 Jan-04-2-10123456789
Total creditDomesticForeign

- 14 -
Table 3. Change in Credit-to-GDP Ratio
Dec-98 Dec-99 Dec-00 Dec-01 Dec-02 Dec-03 Mar-04 1/
Total 1.1 1.6 0.4 2.3 4.5 7.3 2.0By borrowerCredits to nonfinancial public corporations -1.4 -0.9 -1.0 0.0 0.1 0.0 0.0Credits to nonfinancial private corporations 1.3 2.4 1.3 1.5 3.3 4.3 1.3Credits to households and NPISH 1.2 0.1 0.1 0.8 1.1 3.0 0.7By maturityST -0.5 0.3 -0.2 0.6 1.2 0.6 0.6
o/w overdraft 0.5 0.2 0.3 0.2 0.5 0.7 0.4MLT 2.0 1.4 1.1 2.0 3.4 6.8 1.4Memo item: Overdue -0.5 -0.1 -0.4 -0.2 -0.2 -0.1 0.0By currencyDomestic 1.8 0.9 0.8 1.5 1.7 4.1 0.8Foreign -0.7 0.7 -0.3 0.8 2.8 3.3 1.2
Average 1998-2001
Average 2002-2003
Average 1998-2003
Total 1.4 5.9 2.9By borrowerCredits to nonfinancial public corporations -0.8 0.1 -0.5Credits to nonfinancial private corporations 1.6 3.8 2.4Credits to households and NPISH 0.5 2.1 1.1By maturityST 0.0 0.9 0.3
o/w overdraft 0.3 0.6 0.4MLT 1.6 5.1 2.8Memo item: Overdue -0.3 -0.1 -0.3By currencyDomestic 1.2 2.9 1.8Foreign 0.1 3.0 1.1
Source: Calculations based on data provided by the Bulgarian National Bank.
1/ Relative to end-2003.
(From previous year, in percentage points)
• The share of nonfinancial public corporations in nongovernment credit has declined sharply, from around 40 percent at end-1997 to 3½ percent at end-2001. Most of this decline occurred during 1998-2000, reflecting major progress in privatization and increased reluctance by the banks to lend to SOEs. Reflecting a slowdown in privatization, the share has not changed much since then, reaching 2½ percent at end-2003. The relative shares of businesses and households have also shifted, with the household share rising relatively faster: at end-1997, the shares were about 56 percent and 5 percent, respectively, and at end-2001 they were 74½ percent and 21½ percent. Since end-2001, there has been a further change, with the share of private corporations falling to about 70 percent and households rising further to 27 percent. This trend has continued in the first quarter of 2004.

- 15 -
• At end-1997, short-term credit accounted for 50 percent of the total. By end-2001, this share had fallen to nearly 33 percent, and by end-2003 to about 25 percent. The corresponding gain was in the medium- and long-term category, which moved from around 16 percent at end-1997 to 72½ percent in 2003. The shift from short- to longer-term lending is a reflection of increased confidence of both creditors and debtors. In addition, the share of overdues in the total, which stood at 23 percent in 1997, has dropped to about 2 percent in 2003.
• The relative shares of domestic and foreign currency credit have also shifted substantially. In 1997, foreign currency credit accounted for about 51½ percent of the total, and by 2001 this share had fallen to 35½ percent, a reflection of rising confidence in the lev. However, since then there has been a reversal of this trend, with the foreign currency share rising to 42½ percent by end-2003. It is likely that the latter reflected the relatively lower interest rate on euro-denominated loans.8
C. Consequences of the Credit Boom
The economic growth-financial intermediation nexus
14. An increase in the level of financial intermediation is associated with an increase in the long-run growth rate of the economy. The theoretical and empirical literature generally supports the view that financial sector development increases economic growth.9 There are various channels though which financial development can contribute to economic growth, including by collecting information and thereby improving the allocation of capital; risk sharing; and pooling savings and raising the efficiency of financial intermediation.
15. From a structural perspective, the increase in financial intermediation could therefore be considered beneficial. Bulgaria’s per capita GDP is still well below the average of Central and Eastern Europe. To the extent that financial deepening raises the country’s potential growth rate—through increases in the marginal productivity of capital and higher private savings—recent developments should in principle be welcome.
8 The spread between lev and euro long-term interest rates averaged 335 basis points in 2003.
9 IMF (2004) provides a summary of the state of play in the literature; a more extensive discussion of both the theory and empirics regarding finance and growth can be found in Levine (2003).

- 16 -
What are the risks?
16. While potentially beneficial, rapid financial deepening can carry with it risks (Box 1).10 The risks can be grouped into two broad categories: (i) prudential, i.e., overly rapid credit growth can threaten the stability of the financial system; and (ii) macroeconomic, i.e., rapid credit growth can lead to macroeconomic imbalances, both domestic and external.11 In the first group of risks, banks’ ability to manage risk typically declines as the volume of loans increases. As the number of borrowers rises (e.g., in the expansionary phase of the business cycle), banks may find it profitable to attract customers by reducing collateral requirements, trading off borrower quality for increased market share. This easing of lending standards may lead to a deterioration of banks’ portfolios, thus increasing the risk of financial instability.12 In the second group of risks, domestic risks relate to increased inflation of goods and asset prices. Typically, lending booms have been associated with rapid increases in asset prices, eventually leading to a financial bubble. A painful recession often follows the inevitable bursting of this bubble, as agents’ balance sheets are re-adjusted. External risks relate to a deterioration of the external current account, as the credit boom finances imports. To the extent that the wider external current account balance is not financed by inflows of foreign direct investment (FDI), gross external debt would tend to rise, increasing the country’s vulnerability to exogenous shocks. When credit spurs an import boom, the composition of imports will matter; if a large part of imports are investment goods that are used to increase the country’s export capacity, there may be fewer reasons for concern. In contrast, if credit finances primarily imports of consumer goods or investment in the nontradables sector, there may be more reasons for concern as this type of import boom is not self-financing.
10 While the probability of a credit boom leading to a banking crisis is low, Gourinchas et al. (2001) and Tornell and Westermann (2002) find that most banking crises are preceded by a credit boom.
11 The distinction between prudential and macroeconomic risks is made for expository purposes. The two types of risk may be causally linked: an episode of financial instability can quickly produce macroeconomic imbalances, while macroeconomic shocks can produce financial instability. The vicious spiral that may result is outlined in Kaminsky and Reinhart (1999).
12 A model consistent with these insights is presented in Dell’Ariccia and Marquez (2003).

- 17 -
Box 1: Channels for Financial Intermediation
Increases in financial intermediation—lending booms being one manifestation—may occur due to various factors. According to Gourinchas et al. (2001), explicit or implicit bailout guarantees may spur lending as projects are priced under a “best possible scenario.” The pace of credit growth may also be affected by a poorly regulated financial market, a terms of trade shock that affects consumption or investment, or an inflow of capital from abroad due to external reasons.
Lending booms can be amplified by the “credit channel” of the economy. The financial accelerator model of Bernanke and Gertler (1990, 1995)—supplemented by a survey of empirical support in Bernanke, Gertler and Gilchrist (1996)—is generally used to explain this development. This model argues that credit market conditions amplify and propagate effects of initial monetary or real shocks, thus magnifying the volatility of macroeconomic variables. This approach rests on the assumption that the external finance premium—the difference in cost of funds raised externally by issuing equity or debt and internally by retaining earnings—varies inversely with the borrower’s net worth, his internal funds and collateral value of his illiquid assets. A boom in the real sector raises the net worth of the borrower, thus reducing his external finance premium and increasing his demand for loans. The subsequent increase in asset prices causes a further reduction of the borrower’s external finance premium (by increasing his net worth), and spurs further lending. Within the financial accelerator model, the positive feedback can be easily reversed. A change in monetary policy or the real sector that increases the interest rate may—through the balance sheet channel (by reducing net worth) or the bank lending channel (by reducing credit)—increase the external finance premium of the borrower. As a result, his access to credit is reduced and, in addition, due to the fall in his net worth, his ability to service his debt may be compromised. In this case, through the negative feedback effect, the economy may face a recession.
17. Prudential risks do not appear to be an issue at present. Despite the rapid increase in lending, there is no evidence that the stability of Bulgaria’s financial system is currently threatened.13 Indeed, prudential indicators suggest a healthy banking system (Table 4), with low non-performing loans (NPLs), high capital adequacy (almost twice the required minimum of 12 percent), high liquidity, and strong profitability. Moreover, indicators for individual banks do not point to isolated systemic problems. Admittedly, these indicators tend to provide lagging signals of future problems; in particular, in a lending boom, the NPL 13 Chapter IV summarizes the FSAP follow-up, including the results of banking system stress tests.

- 18 -
Figure 8. Real Estate Price Index and CPI Index, 2001-03(in percent change, year-on-year)
-5
0
5
10
15
20
25
30
35
40
2001Q1 2001Q2 2001Q3 2001Q4 2002Q1 2002Q2 2002Q3 2002Q4 2003Q1 2003Q2 2003Q3 2003Q4 2004Q1-5
0
5
10
15
20
25
30
35
40
Residential market price indexCPI (seasonally adjusted)
ratio initially drops as the volume of loans (the denominator) rises. The deterioration in loan quality (the numerator) would tend to show up later. Nevertheless, it is important to monitor developments closely for any signs of deterioration.
1999 2000 2001 2002 2003
Regulatory capital to risk-weighted assts 41.8 35.6 31.1 25.2 22.0Nonperforming loans to total loans 1/ 26.7 17.3 13.1 8.6 7.3NPLs net of provisions to capital 7.0 2.5 2.4 2.7 3.1Return on assets 2.7 3.1 2.9 2.1 2.4Return on equity 18.8 22.5 22.0 16.4 21.7Liquid assets to total assets 63.2 54.2 47.9 40.3 27.5
Source: Bulgarian National Bank.
1/ Non-performing loans including the watch, substandard, doubtful, and loss categories.
Table 4. Financial Soundness Indicators, 1999-2003(In percent)
18. There is, however, evidence of heightened macroeconomic risks (Box 2). While rapid credit growth has not been reflected in CPI inflation—the recent uptick largely reflects temporary factors related to food prices—real estate price inflation has accelerated since last year, coinciding with increased credit growth (Figure 8).14 While worth monitoring going forward, it may be premature to focus on this phenomenon at this time as it may be driven by fundamental factors, such as a catch-up to price levels prevailing in neighboring countries, or external interest in anticipation of EU accession.15 Of more concern is the
14 The index, available on a quarterly basis from the National Statistical Institute, measures the average price of one-, two-, and three-bedroom apartments in all administrative districts of the country.
15 In support of this contention, the increase in real estate prices is concentrated in large cities (such as Sofia and Plovdiv) and towns on the Black Sea coast.

- 19 -
Box 2: Credit Growth and Current Account in Financial Programming
The analytics of the link between the current account and credit growth can be described in a simple financial programming model (based on Dornbusch 1980). The starting point is the observation that the current account (CA) represents a change in the net foreign asset position (NFA) of a country:
CA NFA≡ ∆
The right hand side encompasses all sectors of the economy—the central bank (NFACB), commercial banks (NFAB), the government (NFAG), and the nonbank private sector (NFANB). As the central bank is prevented by the currency board arrangement from issuing domestic credit, changes in the net foreign assets of the central bank have to equal changes in base money (H):
CBNFA H∆ = ∆
Any change in the reserves of the central bank is, thus, automatically translated to a change in the monetary base (as also described in Lewis (2002)).
For the consolidated banking system, the balance sheet identity can be written as:
2BNFA M DC∆ = ∆ −∆
where M2 is broad money and DC is domestic credit . Since total change in DC can be expressed as the sum of changes in domestic credit to the government and the nonbank public—
G NGDC DC DC∆ = ∆ + ∆ —and since any excess of expenditure of the government over tax revenue has to be financed by taking on more domestic credit or reducing its net foreign asset position—
G GG T DC NFA− = ∆ −∆ —the above equation can be rewritten as:
( ) ( 2 )B G NBNFA T G NFA M DC∆ = − −∆ + ∆ −∆
This gives a link between the banking system’s net asset changes and the government’s deficit financing. Inserting the value for BNFA∆ in the current account equation gives:
2 ( ) ( )NB NBCA M T G DC NFA= ∆ + − − ∆ −∆
The equation above links both fiscal policy and changes in credit to the nongovernment sector to the current account balance. For a given change in broad money, a higher fiscal deficit or an increase in credit to the nongovernment sector (that is not met by a decline in the net foreign assets of the nonbanking sector) leads to worsening of the current account. The equation further highlights the role played by currency-to-deposit ratios and reserve requirements in a currency board environment; for a given change in base money, changes in the currency-to-deposit ratio or the reserve requirement would bring about the required change in M2, which is then reflected in the current account.

- 20 -
Figure 9. Credit and Current Account Deficit to GDP Ratio, 2001-03(12-month cumulative change)
0
1
2
3
4
5
6
7
8
9
10
Jan-01 Jul-01 Jan-02 Jul-02 Jan-03 Jul-03 Jan-040
1
2
3
4
5
6
7
8
9
10
Current Account Deficit/GDP Credit/GDP
weakening of the external current account which reflects a credit-induced import boom (Figure 9).16 The rise in imports has been relatively broadly based, with imports of raw materials, investment goods, and consumer goods all rising strongly.
19. Although there are mitigating factors, on balance, the weaker current account has increased macroeconomic risks. The current account deficit has been largely financed by FDI (82 percent coverage last year), and, combined with other capital inflows, international reserves have continued to rise. However, FDI is not without risks. Not only can it stop suddenly and even go into reverse, it may also represent investment in sectors that do not produce primarily for export. In the case of Bulgaria, as discussed in Chapter II, it is estimated that two-thirds of FDI went into the nontradables sector last year. In addition, even if it does not stop suddenly, privatization-related FDI is certain to dry up in a few years. If it is not replaced by other types of FDI, a continued high current account deficit would result in higher external debt and/or lower international reserves, increasing Bulgaria’s external vulnerability.17
D. Policy Options
20. It is likely that credit growth will moderate, even in the absence of measures, owing to a number of factors, including:
• Some banks may become liquidity-constrained, reducing their ability to lend.
• The share of loans in total assets has risen dramatically, and is bound to slow.
• Credit growth has outstripped one of its key funding sources, deposits, resulting in a very sharp rise the credit-to-deposit ratio (see Figure 6). This may not continue.
16 A recent survey of early warning system models by Berg et al. (2004) reports widespread use of the current account as one of the predictive variables. For instance, Goldstein et al. (2000) find the current account deficit to be among the best indicators for predicting currency crises.
17 The Baltic countries are commonly cited as examples of why high current account deficits can be sustained. However, these countries were more advanced with structural reform and consequently attracted very high FDI inflows on a sustained basis.

- 21 -
• Banks’ foreign assets have fallen substantially, partly because of low foreign interest rates. With U.S. dollar interest rates likely to move higher, there will be less of an incentive to repatriate or borrow abroad. In any event, a minimum level of foreign assets is required for banks’ foreign operations, putting a ceiling on how much can be repatriated and some banks may reach exposure limits for their parent banks or other foreign lenders.
21. However, any deceleration in credit growth from these factors is unlikely to be substantial in the near term. Consequently, credit growth will need to be reduced to moderate domestic demand. Combined with reducing demand in the short run, economic policy needs to aim at strengthening supply in the medium to long run. Given Bulgaria’s policy framework, the following mix of policies could be considered:
• Tightening fiscal policy. The authorities have already tightened their fiscal stance in response to the current account developments and are maintaining a prudent wage policy. However, a significant increase in government saving would be needed to fully offset the private saving-investment imbalance. A large additional fiscal tightening is difficult to justify, given that (i) the widening of the external imbalance is likely to partly reflect transition to a new equilibrium with increased financial intermediation that fiscal policy should not attempt to fully offset; (ii) fiscal policy is already prudent—the general government deficit has averaged only ¾ percent of GDP in recent years, and there are no evident fiscal sustainability problems; and (iii) there would be output costs to doing so, not to mention the political difficulty of such actions one year before parliamentary elections.
• Reinvigorating structural reforms. Reforms are necessary to increase the economy’s productive potential, including export capacity. In the short run, there should be a focus on maintaining privatization inflows at a high level to satisfy external financing requirements. Beyond the short-term considerations, however, structural reforms are likely to have an impact—in the sense of stimulating a supply response—only with a considerable lag.
• Reducing banking system liquidity. A tightening of reserve requirements and shifting of government deposits in commercial banks to the BNB—as the authorities are already doing—is likely to have an impact in the short run.18 However, given the
18 The tightening of reserve requirements consists of the following two measures: (i) subjecting 50 percent of cash in vault to reserve requirements; and (ii) broadening the base of liabilities subject to reserve requirements by including deposits and securities above two years’ maturity and repos (excluding those of commercial banks), at a rate of 4 percent. Both measures could be tightened further by making all cash in vault subject to reserve requirements and subjecting longer-term liabilities to the full 8 percent reserve requirement
(continued)

- 22 -
open capital account and banks’ ability to borrow from abroad, further repatriate foreign assets, and access capital directly from their parents, the withdrawn liquidity might be replaced.19 The key question in this regard is how fast and to what extent it will be replaced; while the answer is uncertain, it is likely that market imperfections will prevent capital from being perfectly mobile in this case.
22. A number of other—somewhat more controversial—measures could be considered:
• Regulatory and supervisory measures. The authorities have been implementing a strategy of phased supervisory measures to slow credit growth.20 So far, this strategy has not produced the hoped for reduction in credit growth. This is perhaps not surprising as supervisory measures aim to preserve bank asset quality. If, as a result of tighter prudential standards, banks lend less, this would be merely a by-product of such measures. The scope for further measures is limited by the fact that regulatory and supervisory practices already are at, or exceed, best international practice. However, one element in the BNB’s strategy—minimum liquid asset ratios—has not yet been implemented. A more stringent measure would be the imposition of credit ceilings.21 These types of measures, if implemented, should be considered temporary as they are distortionary and may impede bank competition.
• Domestic bond issuance by the government. By selling domestic bonds—over and above rollover or deficit financing requirements—to commercial banks, the government could help soak up liquidity. This measure has the advantage of being more market based than some of the alternatives. However, there are disadvantages: such an operation (i) would amount to a quasi-monetary policy action that is not in conformity with the spirit of the CBA; and (ii) could be costly from a fiscal perspective, particularly if the banks are reluctant buyers of government paper (given
rate. An actual increase in the reserve requirement rate is currently not being considered by the BNB as it goes in the opposite direction of EU harmonization.
19 Such an offset is more likely where banks are predominantly foreign owned, such as in Bulgaria.
20 See Chapter IV.
21 Other possible measures include dynamic provisioning, where additional provisions are set aside in lending booms, rather than in downturns when loan quality deteriorates. See for example Bank for International Settlements (2001).

- 23 -
that it is more lucrative to lend to the private sector).22 Nevertheless, this measure could be considered if credit growth remains at a very high level. More generally, the government’s debt management strategy can help develop the domestic securities market, which would provide banks (and private pension funds) with alternative investment opportunities.
• Price-based controls on capital inflows. A measure of this nature should be considered only as a last resort. While potentially effective—Chile (and, more recently, Malaysia) being the oft-quoted examples—such a measure has several disadvantages: (i) the controls may eventually be circumvented; (ii) it may undermine financial market confidence; and (iii) capital controls tend to be distortionary (especially over the medium term).
E. Concluding Remarks
23. In many respects, the credit boom in Bulgaria is a welcome development. Increased financial intermediation will likely boost long-run economic growth and efficiency. From this perspective, the widening of the external current account deficit is partly a reflection of a transition to a new equilibrium characterized by greater financial intermediation and has alleviated financing constraints for investment and consumption. In addition, relatively rapid credit growth is likely to continue into the foreseeable future.
24. However, the recent pace of credit expansion has increased macroeconomic vulnerabilities. The large increase in private domestic demand and imports associated with the credit boom has resulted in a sharp widening of the external imbalance. While FDI inflows have mostly covered the growing deficit, this cannot be assured in the future. If FDI inflows were to slow significantly, a continued high current account deficit would increase external debt and/or lower international reserves. In such a case, financial markets could quickly change their hitherto benign view of Bulgaria’s prospects.
25. If the authorities want to reduce the external imbalance, credit growth should be lowered. Measures to reduce bank liquidity and prudent fiscal policy would contain domestic demand, while reinvigorated structural reform would boost the economy’s productive potential. Further measures, particularly on the credit side, may be needed if this strategy were to prove ineffective.
22 It could be argued that the costs of reducing credit growth should not be borne by the public sector, but rather by the private sector which is the source of the imbalances.

- 24 -
F. References
Bank for International Settlements, 2001, Marrying the Macro- and Microprudential
Dimensions of Financial Stability (Basel). Berg, Andrew, Eduardo Borensztein, and Catherine Pattillo, 2004, “Assessing Early
Warnings Systems: How Have They Worked in Practice?” IMF Working Paper WP/04/52 (Washington: International Monetary Fund).
Bernanke, Ben, and Mark Gertler, 1990, “Financial Fragility and Economic Performance,”
Quarterly Journal of Economics, Vol. 105 (February), pp. 87–114. ————, 1995, “Inside the Black Box: The Credit Channel of Monetary Policy
Transmission,” Journal of Economic Perspectives, Vol. 9 (Autumn), pp. 27–48. ________, and Simon Gilchrist, 1996, “The Financial Accelerator and the Flight to Quality,”
Review of Economics and Statistics, Vol. 78 (February), pp. 1–15. Cottarelli, Carlo, Giovanni Dell’Ariccia and Ivanna Vladkova-Hollar, 2003, “Early Birds,
Late Risers, and Sleeping Beauties: Bank Credit Growth to the Private Sector in Central and Eastern Europe and the Balkans,” IMF Working Paper WP/03/213 (Washington: International Monetary Fund).
Dell’Ariccia, Giovanni, and Robert Marquez, 2003, “Lending Booms and Lending
Standards,” mimeo. Dornbusch, Rudiger, 1980, Open Economy Macroeconomics (New York: Basic Books). Goldstein, Morris, Graciela Kaminsky, and Carmen Reinhart, 2000, Assessing Financial
Vulnerability: An Early Warning System for Emerging Markets (Washington: Institute for International Economics).
Gourinchas, Pierre-Olivier, Rodrigo Valdés, and Oscar Landerretche, 2001, “Lending
Booms: Latin America and the World.” NBER Working Paper No. 8249 (Cambridge, Massachusetts: National Bureau of Economic Research).
International Monetary Fund, 2004, World Economic Outlook: Advancing Structural Reforms
(Washington). Kaminsky, Graciela, and Carmen Reinhart, 1999, “The Twin Crises: The Causes of banking
and Balance-of-Payments Problems,” American Economic Review, Vol. 89 (June), pp. 473–500.
- 25 -
Levine, Ross, 2003, “Finance and Growth: Theory, Evidence, and Mechanisms,” mimeo. Lewis, Mervyn K., 2002, “Currency Boards and Currency Arrangements in Transition
Economies,” in Banking Reforms in South-East Europe, ed. by Zeljko Sevic (New York: Edward Elgar).
Organization for Economic Co-Operation and Development, 1999, OECD Economic
Surveys—1998-99, Bulgaria (Paris). Tornell, Aaron, and Frank Westermann, 2002, “Boom-Bust Cycles in Middle Income
Countries: Facts and Explanation,” NBER Working Paper No. 9219 (Cambridge, Massachusetts: National Bureau of Economic Research).

- 26 -
II. BULGARIA—EXTERNAL SUSTAINABILITY AND VULNERABILITY23
A. Introduction
26. Bulgaria’s external current account deficit has sharply increased in the space of one year, diverging substantially from the average current account deficits of about 5½ percent of GDP during 1999-2002. At the same time, coverage of the deficit by non-debt creating inflows has declined from above 100 percent on average during 1999-2002 to about 82 percent in 2003. As a result, the external debt-to-GDP ratio (excluding the effect of exchange rate changes) has declined only marginally in 2003. Similarly, net external debt (again excluding exchange rate changes) has remained constant.
27. This chapter assesses Bulgaria’s external sustainability and vulnerability. It argues that, for a variety of reasons, recent developments in the current account are not as worrying as they appear, but that, on the other hand, external vulnerabilities have increased and can be expected to remain larger than hitherto. Nevertheless, an analysis of sectoral asset and liability positions indicates that overall Bulgaria has—at least for the time being—sufficient buffers to manage a potential drop in confidence. A comparison with the Baltic countries (Box 1) also indicates that Bulgaria is relatively well-placed from a vulnerability viewpoint.
B. Analytical Framework
28. An assessment of external sustainability is in essence one of external debt sustainability. Assessing sustainability in the first instance means forming a view of how outstanding stocks of liabilities are likely to evolve over time. The question of external sustainability thereby turns into one of whether the external debt can be serviced without an unrealistically large future correction in the balance of income and expenditure. In essence, this becomes a question of whether the external debt stock remains constant (or is falling) as a share of GDP. The key determinants of the evolution of the stock of external liabilities over time are the current account deficit and the net inflows of non-debt creating financing.
29. External sustainability is closely linked to vulnerability.24 Therefore, not only does debt financing matter, but also the amount of non-debt financing, i.e., the size of the external current account deficit, and the risks to these financing flows. The larger the imbalance between income and absorption, the larger is in principle the vulnerability of the economy to a loss of confidence, or other shocks. Furthermore, for an assessment of vulnerability, the composition of non-debt financing, as well as the level and composition of the external debt
23 Prepared by Alexander Pitt.
24 The latter requirement captures the notion that the social and political willingness to service debt has limits.

- 27 -
stock are important. Therefore, even if external sustainability appears sound, this does not necessarily imply that vulnerability is low.
30. In assessing vulnerability, a useful complement to the analysis of flow variables is the perspective of the balance sheet approach.25 It permits an analysis of existing currency and maturity mismatches and thus related liquidity and solvency risks. It also allows to gauge the transmission mechanism and impact of a devaluation of the domestic currency. Thereby, it helps to shed light on the economy’s vulnerability to external shocks and, consequently, policy choices should such shocks occur.26
C. External Sustainability
Level and composition of the current account deficit
31. Bulgaria’s 12-month current account deficit has increased sharply since late 2002, and reached 8.5 percent of GDP at end-2003. The main contributing factor (almost 90 percent of the deterioration) was the merchandise trade balance, itself the result of a rapid rise in imports (Figure 1).
• The merchandise trade balance, which has been in a large deficit for some time, widened further to 12½ percent of GDP. Exports increased markedly in euro terms (10 percent, or €600 million), and even more so in volume terms (17 percent), but were outpaced by import growth (14 percent or €1.1 billion in euro terms, and 20 percent in volume terms).27
• The nonfactor services balance remained unchanged. An increase in tourist arrivals by 18 percent and the associated increase of net tourism receipts by 0.7 percent of GDP offset a decline in net non-travel receipts.28
25See “Debt-Related Vulnerabilities and Financial Crises—An Application of the Balance Sheet Approach to Emerging Market Countries” (forthcoming).
26 There are limitations to balance sheet analysis. The division of the economy in only three sectors (public sector, financial private sector, and nonfinancial private sector) implies a high level of aggregation, which could obscure within-sector vulnerabilities. Furthermore, data limitations generally limit the reliability of analysis. In Bulgaria, data availability and quality are broadly sufficient for the purpose of this exercise.
27 Part of this increase may be due to efforts at improving customs control.
28 However, the method used by the authorities to compile tourism revenue—based on an estimated amount of nominal euro receipts per traveler (unchanged since 1999)—risks increasing underreporting over time, as this implies assumed zero inflation for this type of expenditure at a time when inflation both in Bulgaria and the Eurozone—where most
(continued)
- 28 -
• The income balance declined somewhat. Lower interest payments due to low rates were more than offset by a large one-off profit remittance (about ½ percent of GDP).
• Transfers remained broadly unchanged in net terms. Net private transfers rose strongly, while official transfers declined somewhat on account of a doubling of government transfers abroad.
32. A factor complicating the analysis is the reliability of data. Net errors and omissions exhibit large changes from one year to the next. However, most of these swings are likely to be concentrated in the capital account.
Sources of the current account deterioration
33. The main underlying source of the strong rise in imports was the rapid growth of credit to the private sector. Credit outstanding to the non-government sector (which includes public enterprises) has increased by 48 percent in nominal terms at end-2003, compared to a year before. The expansion of credit has fueled in broadly equal parts a rise in investment (from 20 percent of GDP in 2002 to 22 percent in 2003) and a consumption boom. This is also reflected in the import composition, where the shares of investment and consumption goods in total imports have remained broadly constant.
34. Increasing FDI inflows are unlikely to be the main source of high import growth. The increase in non-privatization inflows amounted to only €95 million, less than a third of the rise in imports of investment goods. However, while non-privatization equity inflows declined, reinvested earnings and loans from parent companies, which arguably have a somewhat higher import propensity than equity investment, grew by €265 million.
travelers originate—was positive. Yet, there are also downward pressures on revenues per tourist: (i) strong competition in the travel business is likely to have compressed price increases, and (ii) Bulgaria is a relatively cheap destination and may be selected especially by price-conscious holidaymakers. Furthermore, the same methodology is applied on the debit side, which partly counteracts this effect, even though inflows are more than twice as high as outflows.
Figure 1. Bulgaria: Current Account(In percent of GDP)
-20
-15
-10
-5
0
5
10
2002 2003 Change
Source: Bulgarian authorities.
Currentaccount
Income, net
Tradebalance
Transfers, net
Nonfactor services, net

- 29 -
35. Competitiveness does not appear to have been a significant factor in the deterioration of the trade balance, though the evolution of competitiveness indicators requires careful monitoring. Since the euro started appreciating in late-2002, Bulgaria’s CPI-based REER has appreciated more than those of other Central and Eastern European (CEE) countries whose exchange rates are not rigidly pegged to the euro. However, while the position relative to other CEE countries has deteriorated to some extent, a comparison with the Eurozone indicates that unit labor costs in manufacturing, in particular relative to major trading partners like Germany and Italy, have declined strongly (Figure 2). Further, while economy-wide productivity growth turned negative in 2003, this can be attributed partly to the government-sponsored employment creation program. Productivity declined only in the services sector, where the publicly-funded employment was generated, while productivity in the manufacturing sector—albeit slowing down recently—has continued to increase, above the rate of real wage growth (calculated by deflating nominal wages by the Eurozone CPI). Nevertheless, declining rates of productivity growth in all sectors warrant caution (Figure 3). On the other hand, Bulgaria’s market share in the world as well as in the European Union has continued to increase.
Financing of the current account deficit
36. Critical for the assessment of sustainability is the financing of the current account deficit. The main criterion for sustainability is therefore whether the current account can be financed while still retaining room for reserves to continue to increase at a pace allowing to compensate for the private sector’s foreign exchange mismatches (see below) and for the external debt-to-GDP ratio to be further reduced.
37. The balance of payments has been in surplus every year since 1999. Correspondingly, gross international reserves have increased from €2.6 billion (23 percent of GDP) at end-1998 to €5.3 billion (30 percent of GDP) at end-2003. In that year, despite a record current account deficit, reserves rose by another €817 million. The capital account has
Figure 3: Productivity and Wages(Percentage change)
-4
-2
0
2
4
6
8
10
12
14
16
1999 2000 2001 2002 2003
Productivity, manufacturing
Produtivity, economy-wide
Wages, economy-wide
Wages, manufacturing
Figure 2: Unit Labor Costs(1998 = 100; Manufacturing sector, unless otherwise indicated)
60
80
100
120
1998 1999 2000 2001 2002 2003
Bulgaria
Germany
Italy
Euro area Bulgaria:total economy
Sources: Bulgarian authorities, and WEO
Sources: Bulgarian authorities, and Fund staff estiamtes.

- 30 -
been bolstered by a large increase in FDI (including privatization), though the FDI-current account ratio declined from over 100 percent in 2002 to 82 percent in 2003, by net external borrowing by the public sector, and by continued large repatriations of foreign assets by domestic banks. Meanwhile, the non-bank private sector decreased its net borrowing, compared to 2002.
38. As the coverage of the current account deficit by FDI inflows has declined, the rapid reduction of the external debt stock observed in recent years has almost come to a halt. After decreasing from about 89 percent of GDP in 1999 to 65 percent at end-2002), the reduction in the external-debt to GDP ratio by 6¼ percentage points in 2003 is almost exclusively due to exchange rate effects—at constant exchange rates, the decline would have been less than one percentage point. Similarly, the net external debt ratio, while declining by 6 percentage points, would have remained virtually unchanged at constant exchange rates, at about 26 percent of GDP.
Outlook
39. The debt-stabilizing non-interest current account deficit is currently at around 7¼ percent of GDP.29 This is around the level projected for 2004, but higher than in the medium term. Furthermore, with the authorities’ privatization plans, projected inflows of FDI during 2004-07 are forecast to generally exceed current levels. Both factors are expected to permit a further reduction of external debt (albeit gradually) and a further reserve build-up. Both are needed to reduce external vulnerability.
40. However, there are risks to this scenario. Slower external demand—mainly if the medium-term performance in the EU is not as envisaged—and a failure to implement productivity-improving structural reforms could keep the trade deficit at high levels.30 At the same time, lower non-privatization FDI—again due to lagging structural reforms—and a possible failure of major privatizations would lead to a declining coverage of the current account by non-debt creating inflows. In a scenario where these risks materialize (Figure 4), the external debt-to-GDP ratio would not decline but
29 Based on the assumption that key variables, including nominal GDP growth, non-debt creating inflows (in percent of GDP), and interest rates remain constant at their 2003 levels.
30 Higher oil prices are also a source of risks. An oil price higher by US$1 implies a deterioration of the current account by 0.2 percentage points of GDP.
Figure 4. Bulgaria: Scenarios 1/(In percent of GDP)
0
20
40
60
80
2004 2005 2006 2007 2008 2009-16
-12
-8
-4
0
Source: Fund staff projections.
1/ The temporary decline in the current account deficit in 2008 arises from the overlap in pre- and post accession transfers from the EU.
External debt(adverse scen., LHS)
External debt(baseline, LHS)
Current account(baseline, RHS)
Current account(adverse scen., RHS)

- 31 -
start to embark on an explosive path, or reserves would need to be drawn down. While the baseline scenario is rather conservative, this adverse scenario is not extreme, indicating that the borders of sustainability are easily being reached. However, the main risks relate less to potential external shocks but rather to policy failures. Therefore, it is in the authorities’ hands to minimize the probability of adverse debt or reserve dynamics.
41. If structural and macroeconomic policies are sound, therefore, medium-term sustainability looks reasonably assured, despite the recent widening of the current account deficit and the much smaller reduction of external debt in 2003 than hitherto.
D. Vulnerability
42. However, while sustainability seems quite solid, vulnerability has increased. First, while total external debt has decreased as a share of GDP, short-term external debt has increased. Second, even FDI, while reducing sustainability concerns as “credit” risk is transferred to the foreign investor, gives rise to vulnerability in a similar way as debt. Third, the balance sheets of individual economic sectors exhibit substantial currency and maturity mismatches.
External debt
43. The external debt stock amounted to 59 percent of GDP at end-2003. This level of external debt is still relatively high.31 While 48 percent of this stock consists of debt to multilateral creditors and Brady bonds, the share of short-term debt has increased steadily, even as the total external debt stock has declined. Short-term external debt stands now at 19 percent of the total (by original maturity; 23 percent by remaining maturity), implying a steady rise from 9 percent of GDP in 2001 to 11 percent (by original maturity) at end-2003, increasing rollover risks (though part of this increase may be due to trade credits, which are less subject to rollover risk). On the other hand, the increase in short-term debt has been accompanied by an increase in foreign reserves of the central bank, keeping the coverage of short-term debt (by original maturity) by reserves at over 250 percent (though the coverage by excess reserves—i.e., reserves over and above the amount required to cover the monetary base under the currency board arrangement—declined somewhat, from 144 percent in 1999 to 133 percent at end-2003).
31 In 47 percent of sovereign defaults over the past 30 years, the external debt was below 60 percent of GNP, but in only 17 percent of defaults below 40 percent (Reinhart, Rogoff and Savastano, “Debt Intolerance,” in Brookings Papers on Economic Activity: 1, Brookings Institution 2003, pp. 1-62).

- 32 -
44. The government is considering to pre-pay some of its external debt. While this would lower the external debt-to-GDP ratio, and decrease net interest payments, it would not reduce the net external debt stock. Also, it would lower the stock of freely available reserves, which are a useful buffer against risks arising from the private sector’s overall short position in foreign currency (see below).
Foreign direct investment
45. FDI is often viewed as a financing panacea. The key advantage of FDI over debt financing is that the future obligations it creates (profit remittances) are directly linked to the ”capacity to repay”, i.e., actual profits. The risk of “repayment” is therefore borne by the investor, even in the case of loans from parent companies that are subsumed under FDI. Furthermore, FDI inflows are generally thought to encompass a longer-term commitment and are viewed as a sign of confidence in the economy.
46. However, FDI is not without risks. It can stop or reverse in a relatively short time frame, depending on the confidence of investors. Further, and more importantly, the outflows generated by profit remittances (and repayment of intra-company loans), like other outflows, are generating pressure on foreign exchange reserves, if the investment is not in sectors that produce primarily for export (only FDI in export sectors is naturally hedged). In Bulgaria, recent FDI has been concentrated in the nontradables sector: FDI in manufacturing has been less than 20 percent of the total during 2000-03, while two-thirds of FDI went into the financial, real estate, communications, and wholesale and retail trade sectors (Figure 5). Should foreign investors lose confidence in the stability of the exchange rate on which they have based their earnings forecasts, they are bound to seek to protect their earnings in foreign currency by hedging their expected domestic-currency revenues. Therefore, while FDI financing is supporting sustainability, it gives rise to vulnerability.
Balance sheets
47. At end-2003, there were sizable currency and maturity mismatches in individual sectors, though they were contained at the aggregate level (Figure 6 and Table 1). Short-term external liabilities in foreign currency exceeded liquid external foreign-currency assets of the private sector (both financial and nonfinancial). However, this short position was more than outweighed by the public sector’s net liquid foreign assets.
Figure 5. Bulgaria: FDI(In billions of euro)
0.0
0.2
0.4
0.6
0.8
1.0
1.2
1.4
2000 2001 2002 2003
Source: Bulgarian authorities, and Fund staff estimates.
Tradablessector
Nontradables sector

- 33 -
Figure 6. Bulgaria: Balance Sheet Indicators
FX: Foreign currency; STFX: Short-term position in foreign currency; STFXE: Short-term external position in foreign currency. FX columns: Assets, liabilities, and mismatch; STFX columns: Liquid foreign currency-denominated assets, short-term foreign currency-denominated liabilities, mismatch;
STFXE columns: Liquid external assets, short-term external liabilities, mismatch. • For the nonfinancial private sector (NFPS), overall foreign-currency liabilities
(medium- and long-term as well as short-term) exceeded assets, but short-term foreign-currency assets exceeded liabilities. However, short-term external liabilities in foreign currency exceeded liquid external foreign-currency assets by a sizable margin (about 6 percent of GDP; Figure 6, Panel 1). This implies that potential pressures on the short-term external position of the NFPS—e.g., from reduced rollover of credit lines—would be transmitted to the domestic banking sector, as foreign-currency denominated liquid liabilities of the banking sector to the NFPS would likely be called.
• The financial private sector (FPS) had a long overall foreign-currency position, but its short-term foreign-currency liabilities exceeded liquid foreign-currency assets by a wide margin (12½ percent of GDP), deriving from the financial intermediation role of the sector, and the considerable degree of euroization (48 percent of the sector’s liabilities are in foreign currency, mostly euros). Meanwhile, short-term external liabilities in foreign currency exceeded liquid external foreign-currency assets only by
Panel 1: Nonfinancial Private Sector
-10
-5
0
5
10
15
20
25
30
FX STFX STFXE
Percent of GDP
Panel 3: Public Sector
-40
-20
0
20
40
60
80
FX STFX STFXE
Percent of GDP
Panel 2: Financial Private Sector
-15
-10
-5
0
5
10
15
20
25
FX STFX STFXE
Percent of GDP
Panel 4: Total Economy
-60
-40
-20
0
20
40
60
80
100
120
FX STFX STFXE
Percent of GDP

- 34 -
a small amount (Figure 6, Panel 2). This suggests that, though some risks arise from the banks’ own balance sheets, the larger risk to the banking system arises from the domestic NFPS, with its sizable potential demand on banks’ foreign exchange.
• The public sector’s short overall foreign-currency position derives from its large external debt. However, this debt is all medium and long-term (by original maturities), and there is thus little short-term refinancing risk.32 This is reflected in liquid foreign-currency assets exceeding short-term foreign-currency liabilities by a wide margin: even if the coverage of the monetary base by foreign exchange (required by the currency board) is treated as a foreign-currency liability, liquid foreign-currency denominated assets exceeded short-term foreign-currency liabilities by more than 11 percent of GDP. The situation is similar for the external short-term foreign currency position (Figure 6, Panel 3).
48. Therefore, the public external short-term foreign currency position is strong enough to offset weaknesses in the private sector (Figure 6, Panel 4). Should the nonfinancial private sector withdraw deposits from banks (to meet external payments obligations), the public sector could support the banking system. This reduces the risk of potential rollover difficulties of firms in the NFPS (which is unlikely to be uniform across firms) being transmitted via the banking system to the entire economy. In the banking sector itself, this reduces the risks from one of foreign-currency positions to one of the usual maturity mismatches that financial intermediation creates, regardless of currency.
49. However, this insurance is neither complete nor costless. The transfer of risks across sectors, and in particular to the public sector, is not without cost. First, there are the opportunity costs of holding large lowly-remunerated reserves. Second, and perhaps more importantly, there is a moral hazard problem as the private sector relies on the public sector to assume the burden of providing insurance for the risks to the economy created by banks and corporations. These drawbacks need to be weighed against the (potential) cost of providing no or more limited insurance.
50. There are also risks going forward. Continued high current account deficits put pressure on both the public and private sectors’ external positions. The current account will need to be financed by drawing down foreign assets and/or increasing foreign liabilities, weakening the private sector’s external position (though long-term foreign credit, e.g., from parent banks, could mitigate the effect on the short-term external position) and increasing demands on the public sector to compensate for this deterioration. At the same time, the accumulation of additional foreign exchange reserves is becoming more difficult.
51. In summary, the strength of the short-term external foreign currency position in Bulgaria depends on the public sector. At present, the cushion of official reserves is 32 The amortization of medium- and long-term external debt falling due in 2004 is €241 million (1.4 percent of GDP).

- 35 -
sufficient to counterbalance weaknesses in the private sector’s balance sheets, but this comes at a cost and involves moral hazard. In addition, credit developments are likely to weaken private sector balance sheets further, putting greater demands on public reserves and requiring continued reserve build-up through inflows on non-debt creating financing, while at the same time aggravating moral hazard, as well as political and budgetary costs.
Issuer of Liability (Debtor)(I) (II) (III) (IV)
Government and BNB
Monetary Base 1,981 712 0
Total Other Liabilities 1,049 1,132 7,201Short-term 27 88 0
Domestic Currency 27 88 0Foreign Currency 0 0 0
Medium- and Long-Term 1,022 1,044 7,201Domestic Currency 575 248 0Foreign Currency 447 796 7,201
Total Liabilities 934 4,978 766Short-term 907 4,909 536
Domestic Currency 553 2,812 68Foreign Currency 354 2,097 468
Medium- and Long-Term 27 69 230Domestic Currency 24 28 0Foreign Currency 3 41 230
Equity 0 0 0
Nonfinancial Private Sector
Total Liabilities ... 4,532 2,514Short-term ... 1,162 1,418
Domestic Currency ... 634 0Foreign Currency ... 528 1,418
Medium- and Long-Term ... 3,370 1,096Domestic Currency ... 1,959 0Foreign Currency ... 1,411 1,096
Equity ... 14 4,785
Rest of the World
Total Liabilities 5,308 1,503 389Currency and Short-term 5,308 185 389Medium- and Long-Term 0 1,318 0
Equity ... 1 ...
Sources: BNB, MoF, and Fund staff estimates.
1/ Excludes insurance sector.
Table 1. Bulgaria: Intersectoral Asset and Liability Position (end-December 2003, in millions of euros)
Financial Private Sector 1/
Holder of Liability (Creditor)
Government Sector Financial Private Sector 1/ Nonfinancial Private Sector Rest of the World
E. Conclusions
52. Recent developments indicate that external sustainability is not in immediate jeopardy, but risks have increased. While the current account deficit has increased considerably and is projected to remain relatively high for some time, non-debt financing has been sizable and can be expected to continue, in particular as EU accession approaches. On the other hand, the slowing pace of decline in the external debt-to GDP ratio indicates that the boundaries of sustainability are being reached.
53. Vulnerability has increased overall. Increased financing requirements, both due to the widening current account deficit and increasing short-term debt levels, imply greater vulnerability to a potential loss of confidence. Likewise, FDI, while it mitigates some risks, does not represent a cure-all. Also, the still high degree of euroization is a risk to the balance sheets of the private sector. On the other hand, the short-term foreign-exchange position of the public sector is still strong enough to mitigate those risks, and thereby bolster confidence. However, this implicit insurance is not without cost.

- 36 -
Box 1. Comparing Bulgaria with the Baltic Countries1
A comparison of external indicators with the Baltic first-wave accession countries indicates that Bulgaria, in some respects, is stronger positioned, while it also exhibits weaknesses. This section focuses on comparisons with the Baltic countries, as they have either currency board arrangements (Estonia and Lithuania), or a hard peg (Latvia), which makes their policy constraints similar to those faced by Bulgaria. In comparing Bulgaria with the Baltics, it is important to bear in mind that Bulgaria’s most recent systemic crisis was in 1997, while the Baltic countries experienced their most severe output contraction in 1991/92 (though GDP continued to shrink in 1993).2 Therefore, the comparison does not only compare the state of the respective economies in a given year, but also looks at their evolution since their most recent crises. Bulgaria’s current account, as well as its financing by FDI, broadly follows the same trends as in the Baltics (Box Figure 1). The current account (CA) balances of the Baltics, after significant surpluses through 1992 (and in Latvia, through 1993), deteriorated rapidly, reaching or surpassing deficits of 10 percent of GDP. If the scales are normalized, with t indicating the last crisis year (1992 for the Baltics, and 1997 for Bulgaria), current account developments are similar, with Bulgaria showing relatively modest deficits so far. Taking the current account and FDI together, developments show a similar pattern (Box Figure 2). In the initial years after their respective crises, current account deficits were more than covered by FDI, but this declined as economies recovered and current account deficits widened. At the same time, Bulgaria is lagging in saving and investment performance. As current account deficits are similar, Bulgaria’ s relatively low savings rate translates into low investment (Box Figures 3 and 4). Correspondingly, output growth in the Baltics has shifted to some 6-8 percent per year after the 1999 crisis, after an initial burst of 7-10 percent in 1997 (Box Figure 5). Bulgaria has not reached that stage after its systemic crisis yet, but the rather low saving and investment rates need to be raised to increase future growth. __________________ 1 Source: WEO. 2 In this context, the recession in 1999 (due to the 1998 Russian crisis) is not viewed as a systemic crisis. Indeed, all the Baltic countries weathered this shock rather well.
Box Figure 1: Current Account Balance(In percent of GDP)
-20
-15
-10
-5
0
5
10
15
20
t t+1 t+2 t+3 t+4 t+5 t+6 t+7 t+8 t+9 t+10 t+11
Box Figure 2: CA + FDI (net)(In percent of GDP)
-15
-10
-5
0
5
10
15
20
t t+1 t+2 t+3 t+4 t+5 t+6 t+7 t+8 t+9 t+10 t+11
Latvia
EstoniaLithuania
Bulgaria
Latvia
Lithuania Estonia
Bulgaria
Box Figure 3: Gross National Saving(In percent of GDP)
0
5
10
15
20
25
30
t t+1 t+2 t+3 t+4 t+5 t+6 t+7 t+8 t+9 t+10 t+11
Box Figure 4: Gross Fixed Capital Formation(In percent of GDP)
0
5
10
15
20
25
30
35
t t+1 t+2 t+3 t+4 t+5 t+6 t+7 t+8 t+9 t+10 t+11
Bulgaria
Estonia Latvia
LithuaniaBulgaria
Latvia
Lithuania
Estonia

- 37 -
Box 1. Comparing Bulgaria with the Baltic Countries (continued)
Both Bulgaria and the Baltics adopted fiscal discipline with the introduction of currency boards (in 1992 in Estonia, in 1994 in Latvia and Lithuania). However, there are surprisingly large variations (Box Figure 6). In all Baltic countries, the fiscal balance deteriorated significantly in the 1999 recession, reaching 8 percent of GDP in Lithuania. Overall, Bulgaria is one of the best performers, with its fiscal deficit never exceeding one percent of GDP (in cash terms), comparable only to Estonia. Bulgaria started with a very large external debt stock, which it managed to bring down substantially. In contrast, the Baltics began with zero external debt, but their debt stocks (public and private combined) rose to levels now observed in Bulgaria (with the exception of Lithuania; Box Figure 7). At the same time, Bulgaria’s external reserves remained high at over 20 percent of GDP, while the Baltics’ are substantially lower (Box Figure 8). Overall, Bulgaria exhibits many similarities to the Baltic countries. From a vulnerability viewpoint, Bulgaria appears well-placed. However, savings and investment are relatively low and must be raised to ensure future growth.
Box Figure 5: Real GDP(Percent change)
-10
-8
-6
-4
-2
0
2
4
6
8
10
t t+1 t+2 t+3 t+4 t+5 t+6 t+7 t+8 t+9 t+10 t+11
Box Figure 6: Fiscal Balance(In percent of GDP)
-10
-8
-6
-4
-2
0
2
4
t t+1 t+2 t+3 t+4 t+5 t+6 t+7 t+8 t+9 t+10 t+11
Bulgaria Estonia
Latvia
Lithuania
Bulgaria
Estonia
Lithuania
Latvia
Box Figure 7: Total External Debt(In percent of GDP)
0
20
40
60
80
100
t t+1 t+2 t+3 t+4 t+5 t+6 t+7 t+8 t+9 t+10 t+11
Bulgaria
Estonia
Box Figure 8: Foreign Reserves(In percent of GDP)
0
5
10
15
20
25
30
t t+1 t+2 t+3 t+4 t+5 t+6 t+7 t+8 t+9 t+10 t+11
Latvia
Bulgaria
Estonia
Lithuania
Latvia
Lithuania
- 38 -
III. BULGARIA—MEDIUM-TERM FISCAL FRAMEWORK AND SUSTAINABILITY AND IMPLICATIONS OF EU ACCESSION33
A. Introduction
54. In the aftermath of the 1996 crisis, Bulgaria adopted a currency board arrangement (CBA) supported by a tight fiscal policy. Since 1997 fiscal deficits have not exceeded 1 percent of GDP, the public debt-to-GDP ratio has been more than halved, and government saving has more than covered government investment. At the same time, government deposits in the banking system—the fiscal reserve account (FRA)—have risen to cover almost three times annual debt service. However, in 2003 a stronger than expected recovery in credit growth has exacerbated private sector demand pressure, resulting in a sharp deterioration of the current account deficit and raising the requirement for fiscal adjustment in the context of the CBA.
55. The adequacy of fiscal policy going forward remains an issue and, in this regard, a number of questions appear worth asking. Is the fiscal stance underlying the medium-term fiscal framework (MTFF) appropriate and how does EU accession fit in? What are the risks to the MTFF? While fiscal sustainability is less of a concern now, could it become a problem in the medium term? Answering these questions would help assess the adequacy of the MTFF and allow to draw lessons for fiscal policy in the period ahead.
B. Medium-Term Fiscal Framework and Policy
Main elements of Medium-term Fiscal Framework
56. Fiscal policy has been appropriately tight, but opportunities have been missed to strengthen it further and create more room for priority spending. Since 1998 Bulgaria has operated under an implicit fiscal rule of not exceeding a cash deficit of 1 percent of GDP, with recent efforts to achieve balance being motivated by the need to offset private sector-led demand pressures resulting in part from a surge of bank credit. However, the government’s objective to curtail current spending to free up room to increase capital outlays and broaden the social safety net has not been fully achieved. In fact, there has been no success in reducing non-interest spending. The primary balance declined from an average of 2.9 percent of GDP in 1999-2001 to an average of 1.6 percent in 2002-03. During the same periods, on average, capital spending decreased by one point to 3.3 percent of GDP. In this respect, the opportunity presented by historically low interest rates to accelerate reforms while limiting spending cuts was lost.
57. The MTFF envisages a balanced budget, with the exception of 2007, the expected year of EU accession (Table 1). As the authorities are still forming a view on fiscal policy 33 Prepared by Philippe Egoumé-Bossogo.

- 39 -
post-EU accession, the MTFF discussed below is a combination of the authorities’ broad plans up to 2006 and a normative projection for 2007-09. In response to the deterioration in the current account deficit, the authorities this year decided to cut budgeted spending by 0.7 percent of GDP to revert to a broadly neutral fiscal stance in 2004 with a deficit of 0.4 ercent of GDP. Further, they decided to devote any revenue overperformance (above about 0.1 percent of GDP pre-committed under the budget for higher subsidies) to achieving a balanced budget. A further tightening could be envisaged if the current account deficit threatens to exceed current projections. The projected gradual contraction of the current account deficit in the medium term (see Chapter II) is predicated on balanced budgets, except in 2007. As discussed in section II, new spending requirements upon accession could burden the budget by up to 3 percent of GDP in 2007 and slightly more than 1½ percent of GDP thereafter. The authorities are still discussing how to accommodate this spending, but considerations of external sustainability and vulnerability suggest to accommodate this spending partially only in 2007. Section 1.3 analyzes these points further.
58. Revenue projections are based on lower tax and nontax revenue and higher grants. Tax revenue is projected to decline gradually, reflecting the government’s objective to reduce tax rates to promote investment. While the tax system has maintained generally low rates and few exemptions, tax policy has focused in recent years on shifting from direct to indirect taxation (Box 1). In 2004, the profit tax was reduced from 23.5 percent to 19.5 percent and the personal income tax rate for the lowest income brackets from 15 to 12 percent. In 2005, the government envisages to further lower these tax rates to 15 percent and 10 percent, respectively, while increasing the minimum taxable income threshold. Plans are also being considered to provide tax breaks to families with children. To offset the revenue loss, excises will be further increased toward minimum EU levels consistent with EU harmonization requirements. However, as this offset may be only partial and given spending constrains, particularly associated with the EU, the planned reduction in direct taxation may need to be less ambitious. For the remainder of the medium term, tax revenue is projected to decline slightly in relation to GDP, reflecting inter alia a higher transfer of social security contributions to the privately-operated second pillar of the pension system. Nontax revenue would continue to decline before stabilizing from 2005, as privatization would entail dwindling dividend revenue. Grants—mostly from the EU—would rise slightly until 2006, reflecting improvement in the absorption capacity, and jump from 2007 with the receipt of post-accession funds.

- 40 -
2003 2004 2005 2006 2007 2008 2009Proj. Proj. Proj. Proj. Proj. Proj.
Total revenue and grants 36.5 37.9 35.4 35.0 35.0 36.2 37.8 37.2Tax revenue 27.4 29.7 28.0 27.9 27.9 27.8 27.7 27.6
Profit tax 3.0 3.0 2.5 2.3 2.3 2.3 2.3 2.3Income tax 3.3 3.3 2.9 3.0 3.0 3.0 3.0 3.0VAT 8.3 9.0 8.8 8.7 8.7 8.7 8.7 8.7Excises 4.1 4.5 4.6 4.7 4.8 4.8 4.8 4.8Customs duties 0.6 0.7 0.5 0.5 0.5 0.5 0.5 0.5Social insurance contributions 7.3 8.2 7.8 7.7 7.6 7.5 7.4 7.4Other taxes 0.9 1.0 0.9 0.9 0.9 0.9 0.9 0.9
Nontax revenues 8.1 7.3 6.2 5.8 5.8 5.8 5.8 5.7Grants and donations 0.9 0.9 1.2 1.3 1.3 2.7 4.3 3.9
Total expenditure and net lending 37.2 38.4 35.8 35.0 35.0 37.1 37.8 37.2Noninterest expenditure and contingency 34.9 36.2 33.9 33.0 32.8 34.9 35.8 35.5
Current noninterest expenditure 31.1 32.5 30.0 28.2 27.8 29.3 29.6 29.5Compensation 4.3 4.5 4.1 3.9 3.7 3.5 3.3 3.2Maintenance and operations 6.8 6.9 6.0 5.8 5.8 5.8 5.8 5.8Defense and security 3.3 3.2 3.1 3.0 3.0 3.0 3.0 3.0Subsidies 2.4 2.6 1.8 1.5 1.4 2.0 2.5 2.4Social expenditures 14.3 14.8 14.6 14.0 14.0 13.9 13.9 14.1Transfers 2/ 0.4 0.4 1.1 1.1 1.0
Capital expenditure 3.2 3.5 3.4 4.2 4.4 5.1 5.7 5.5Contingency 0.6 0.3 0.5 0.6 0.5 0.4 0.5 0.5
Primary balance 1.6 1.7 1.6 2.0 2.3 1.4 2.0 1.7
Interest 2.2 2.1 1.9 2.0 2.3 2.2 2.0 1.7
Overall balance 2/ -0.6 -0.4 -0.4 0.0 0.0 -0.8 0.0 0.0
Financing 0.6 0.4 0.4 0.0 0.0 0.8 0.0 0.0Privatization 0.9 1.1 4.1 1.6 0.2 0.2 0.0 0.0External (net) 1.5 0.0 0.9 0.3 -1.9 -3.3 -2.2 -1.5Domestic (net) -1.7 -0.7 -4.6 -1.9 1.7 4.0 2.2 1.4
Memorandum item:Nominal GDP in millions of leva 32,324 34,410 37,973 41,226 44,801 48,685 53,006 57,711
Sources: Ministry of Finance; and Fund staff projections.
2002
Table 1. Bulgaria: Medium-Term Fiscal Framework 1/(In percent of GDP)
1/ Prior to 2003 the fiscal balance does not include transfer made below the line.2/ Under the 2003 and 2004 budget, these transfers were envisaged to be made below the line for various purposes. From 2007 includes contribution to the EU budget.

- 41 -
Box 1. Bulgaria: Summary of Tax Rates as of April 2004
Tax
Rates in 20001
Rates in 2004
Remarks on current taxes
VAT 20 percent 20 percent Uniform rate, exports zero-rated.
Excise Various specific and ad valorem rates
Various specific and ad valorem rates
Increasing gradually to at least minimum EU levels according to a pre-established schedule. Applies to alcoholic beverages, coffee, tea, cars, tobacco, certain fuels, and gambling.
Profit tax 32 percent (effective average)
19.5 percent (effective average)
A tax break of 10 percent of the amount spent to create a new company or to increase capital. Different rates apply for various miscellaneous activities. E.g., insurance companies pay 7 percent of premiums (2 percent for life insurance). Total exemption is given to companies created in municipalities where the unemployment rate exceeded the national average by 50 percent the year prior to establishment.
Personal income tax (PIT)
graduated scale with rates of 0, 20, 26, 32, 40 percent
graduated scale with rates of 0, 12, 22, 26, 29 percent
Bulgarian citizens on worldwide income and foreign citizens on income derived from Bulgarian sources. Capital gains, interest from banks and state securities, income from mandatory pensions, health schemes and from social security are exempt. 100 percent of PIT revenues accrue to municipalities.
Social Security 45.7 percent (standard rate)
42.7 percent (standard rate)
Applies to the 3rd category of worker (covering 90 percent of workers). The rate comprises pension (29 percent, of which 3 percentage points transferred to the second pillar for workers born after 12/31/1959); health insurance (6 percent); unemployment (4 percent); general illness and maternity leave (3 percent); labor injury and personal diseases (0.7 percent). For the first and second categories of workers (10 percent of workers) whose jobs are classified as dangerous and for whom early retirement is possible rates are 48.7 and 43.7 percent, respectively.
Local taxes Various rates Various rates Including taxes for real estate, inheritance, gifts, property transfers, fees for administrative services, garbage collection, etc.
Import duties Effective average rate of 3 percent
Effective average rate of 1.7 percent
Expected to be replaced by the common external tariff upon EU accession
__________________ 1From B. Horvath and I. Szekely (2000), IMF WP/00/11.

- 42 -
59. The improvements in tax and customs administrations are beginning to pay dividends through higher buoyancy of taxes and the MTFF assumes this trend will continue. Quarterly revenue series—available only from 1999—are not long enough to estimate tax buoyancy and elasticity. However, simpler indicators point to improved tax buoyancy. In 2003, nominal GDP grew by 6½ percent, whereas tax revenue rose by 15¼ percent. While the surge in imports explains most revenue growth in 2003, efforts to improve collection are beginning to bear fruit, especially in the customs administration. The latter calculated that, correcting for increases in excises, the rise in customs revenue attributable to Customs’ effort to fight smuggling and fraud amounted to 3.6 percent.
60. Expenditure restructuring is a key element of the MTFF, pointing to the need to augment government saving to boost investment (Table 2). The MTFF envisages a continued lowering of current spending until 2006, mainly by allowing the wage bill to grow only by average CPI inflation, further reducing subsidies through the implementation of structural reforms in the railways, energy, and health sectors, while keeping spending for social benefits, pensions and active labor market policies in check. From 2007, EU accession-related requirements, particularly for agricultural subsidies, would reverse this trend somewhat, but Bulgaria could accommodate some of the additional outlays by curtailing lower priority spending. Government saving would increase gradually to finance rising capital outlays needed to upgrade and build infrastructure.
2002 2003 2004 2005 2006 2007 2008 2009
Saving and investment (in percent of GDP)Foreign saving 1/ 7.3 9.5 9.6 8.7 7.8 7.3 7.2 7.1Gross national saving 14.2 13.2 14.1 15.4 15.9 16.6 19.9 18.6Gross domestic saving 2/ 12.5 12.2 12.8 14.1 15.3 16.2 17.0 17.4
Government 4.3 4.7 4.4 5.9 6.2 6.0 7.2 6.8Non-government 8.2 7.6 8.4 8.2 9.1 10.3 9.8 10.6
Gross domestic investment 19.8 21.7 22.4 22.8 23.1 23.5 24.2 24.5Government 3.2 3.5 3.4 4.2 4.4 5.1 5.7 5.5Non-government 16.6 18.3 19.0 18.6 18.7 18.4 18.5 19.0
Government S-I balance 1.0 1.2 1.0 1.7 1.8 0.9 1.5 1.3Non-government S-I balance -8.3 -10.7 -10.6 -10.4 -9.6 -8.1 -8.7 -8.4
Memorandum itemsTotal public debt 61.3 53.4 47.3 44.6 41.5 37.1 33.8 31.1
Of which : External 54.8 46.8 40.1 37.0 33.5 29.1 25.9 23.4External debt/GDP (in percent) 65.1 58.7 58.2 54.8 50.7 46.2 43.8 41.9Current account balance (in percent of -5.6 -8.5 -8.2 -7.4 -7.2 -6.9 -4.3 -5.9Real GDP 4.9 4.3 5.0 5.2 5.3 5.3 5.5 5.5GDP deflator 3.8 2.1 5.1 3.2 3.2 3.2 3.2 3.2CPI (end of period) 3.8 5.6 3.2 3.6 3.5 3.5 3.5 3.5 (period average) 5.8 2.3 5.8 3.6 3.5 3.5 3.5 3.5
Sources: Bulgarian authorities; and Fund staff projections.
1/ Net imports of goods and nonfactor services.
Table 2. Bulgaria: Macroeconomic Framework, 2002-2009
Projections
2/ Gross domestic saving equals gross national saving less net factor income and transfers from abroad. The government contributions to gross domestic saving equals revenues less current expenditures, excluding external interest payments.
61. In undertaking public investment, Bulgaria faces important policy options, which could affect fiscal sustainability. The authorities have expressed interest in financing the construction of new expressways notably through PPP-type schemes. The general

- 43 -
principles of public investment call for, on the one hand, cost-benefit analysis and the highest level of return to guide project selection and, on the other hand, project financing to avoid saddling the government with contingent liabilities. Since PPPs involve the private sector and the latter has a different objective function than the government, proper selection is very important. PPPs also raise issues regarding the government’s exposure and proper fiscal accounting of these operations. Recent Board papers recommend that “until an internationally accepted accounting and reporting standard for PPPs is developed, the actual and potential costs for the government implied by a PPP contract should be taken into account when undertaking debt sustainability analysis” (www.imf.org) and argue that the recording of PPP operations in fiscal accounts depends on the assessment of risks incurred by the government (www.imf.org). PPPs can be very complex and both ESA95 and GFS2001 provide only partial guidance on their fiscal accounting, leaving considerable scope for interpretation, which if not conservative could result in governments incurring large contingent liabilities. In addition to these considerations, in the road sector, Bulgaria faces a choice between giving priority to renovating and upgrading the existing road network or building new expressways. Such decisions will determine how projected capital expenditures are allocated and may have far-reaching implications for fiscal sustainability.
62. Ongoing institutional strengthening will support the MTFF. Previous technical assistance, including through the posting of resident advisors, as well as the establishment of the Public Finance School in the Ministry of Finance have considerably enhanced capacity to prepare and conduct fiscal policy. Further progress is needed, however. Budget preparation starts early during the previous year, while an increasing number of line ministries are preparing program budgets (for the time being only to build this capacity) so that from 2007 the state’s budget would completely be program-based. However, lack of technical expertise constrains the ability of line ministries to prepare three-year rolling budgets in a timely manner, as required by the Ministry of Finance. Technical assistance may be necessary in moving to accrual accounting. Further progress is sought in improving tax administration and expenditure management (see paragraph 72).
Pension and health spending in the medium-term fiscal framework
63. Assuming unchanged policies, the pension system should exert a declining pressure on government spending in the medium term, but there are—mainly political—risks (Figure 1, first panel). The one-off adjustment in the monthly pension ceiling from 240 leva to 420 leva—a level that makes the ceiling almost non-binding—would result in a widening of the deficit of the National Social Security Institute (NSSI).34 However, going forward, while still high, the dependency ratio is projected to decline until 2020, allowing NSSI’s revenue to rise (Figure 2). Underpinning this projection are lower
34 The NSSI comprises the old-age (first and universal pillar of the pension system) and disability pensions; and insurance for sickness and maternity leave, unemployment, and work-related injuries. Other social benefits are administered by the Ministry of Labor and Social Affairs (with the exception of public health insurance).

- 44 -
Figure 1. Bulgaria: NSSI Balances, 2003-2043 (In percent of GDP)
Sources: National Social Security Institute (NSSI) and Staff calculations.
Under unchanged policies
-1.50
-1.00
-0.50
0.00
0.50
1.00
1.50
2.00
2.50
2000
2002
2004
2006
2008
2010
2012
2014
2016
2018
2020
2022
2024
2026
2028
2030
2032
2034
2036
2038
2040
2042
2044
2046
2048
1999 Projections 2004 Projections
Under changed policies
-1.8
-1.6
-1.4
-1.2
-1
-0.8
-0.6
-0.4
-0.2
0
0.2
0.4
2003
2004
2005
2006
2007
2008
2009
2010
2011
2012
2013
2014
2015
2016
2017
2018
2019
2020
2021
2022
2023
2024
2025
2026
2027
2028
2029
2030
2031
2032
2033
2034
2035
2036
2037
2038
2039
2040
2041
2042
2043

- 45 -
Figure 2. Bulgaria: Demographic and Unemployment Forecasts, 2003-2043
Sources: National Social Security Institute (NSSI) and Fund staff calculations.
Demographic forecasts(In millions)
6.0
6.5
7.0
7.5
8.0
2003 2006 2009 2012 2015 2018 2021 2024 2027 2030 2033 2036 2039 20422.0
2.2
2.4
2.6
Population (LHS)
Number of contributors (RHS)
Number of Pensioners (RHS)
Forecasts of the Unemployment Rate and Dependency Ratio
0
2
4
6
8
10
12
14
16
2003 2006 2009 2012 2015 2018 2021 2024 2027 2030 2033 2036 2039 20420.80
0.85
0.90
0.95
1.00
1.05
1.10
Unemployment rate (LHS)Dependency ratio (RHS)

- 46 -
unemployment and higher participation rates, robust economic growth, a decline in the shadow economy, and administrative improvements, notably to increase revenue collection. Expenditures are envisaged to remain under control due to the gradual increase in the retirement age for females (to 60 years) and males (to 65 years) and the strict adjustment of pensions based on an indexation formula, which assigns to inflation and insurable income weights of 75 percent and 25 percent, respectively. Notwithstanding the gradual increase in the transfer to the second pillar to 5 percent by 2007, the deficit of the first pillar is projected to continue to decline toward balance by 2013—instead of 2005, as projected in 1999 when the three-pillar pension system was introduced—and accumulate surpluses thereafter. The delay in reaching balance can be attributed to over-optimistic assumptions, but more importantly reflects political pressure that resulted in new measures boosting spending. Such pressure continues to present a serious risk to the NSSI balance, particularly in light of the low level of pensions and the rapid rise in disability pensions (Table 3). However, it could be mitigated by enshrining in a law the indexation formula for pension and pensionable bases underlying the medium-term projections and by strictly controlling the disability certification process.
64. Assuming additional policies to strengthen pensions and reduce labor taxation, the NSSI is projected to post a balanced budget in the long run. In addition to current policies, the following set of measures were simulated, including: (i) a change in pension indexation from the current split of 75 percent inflation and 25 percent growth of insurable income to 50-50 percent from 2013; (ii) further increases in the transfer to the second pillar to 7 percent from 2014, 8 percent from 2020, and 9 percent from 2026; (iii) from 2017, a decrease in the contribution rate by 1 percent, half a point each for employers and employees. However this simulation does not include an increase in the contribution rate for the health insurance fund from 6 to 8 percent—and therefore assumes that such adjustment would not be financed by a reduction in contributions going to the pension system. The simulation presented in Figure 1, second panel, suggests that, the NSSI could achieve and maintain balance or near balance from 2013 onwards, while raising pensions and reducing contribution rates.
65. The MTFF envisages a stabilization of health spending in relation to GDP, but the delay in completing health sector reforms poses a risk (Table 4). Compared to the past and the medium term, the 2004 budget estimate for health spending seems low. The authorities had planned to make progress in the health sector reform this year, with a significant expansion of activity-based financing of hospitals and restrictions in the reimbursement of drug expenses and various other claims. The failure to sign a National Framework Agreement with health care providers, however, makes it somewhat difficult that the budget can be strictly adhered to, presenting the risk of spending overruns—as in past years—and of a larger fiscal deficit (on an accrual basis) this year. The MTFF envisages a rise in the revenue of the National Health Insurance Fund (NHIF) in 2006 resulting from an increase in the contribution rate from 6 to 8 percent; but, even with this increase, revenue would fall short of expenditures. The MTFF also envisions that the NHIF would assume a growing share of health care spending covered only partially by subsidies redirected from the

- 47 -
2000 2001 2002 2003
Number of insuredInsured by employer 1,985,804 1,953,446 1,867,648 2,059,685Insured - military and police 79,475 88,072 82,458 ...Selfinsured 184,712 190,943 158,288 201,352
Number of pensioners 2,379,324 2,370,871 2,350,900 2,336,806Number of pensions 2,439,754 2,566,711 2,622,006 2,673,576Number of contributors ... ... ... 2,365,082Dependency ratio ... ... ... 98.8
Average monthly insurable income (in euros) Insured by employers 1/ 105.5 110.1 123.6 130.7Insured - military and police 224.9 245.0 292.9 ...Self insured 1/ 82.0 87.0 93.2 103.1
Average insurable incomePercent of GDP per capita (annual basis)
Insured by employers 1/ 79.2 73.7 72.3 69.5Insured - military and police 168.9 163.9 171.5 ...Self insured 1/ 61.6 58.2 54.6 54.8
Average monthly pension (in euros) 44.1 47.2 52.2 56.5Percent of GDP per capita (annual basis) 33.1 31.6 30.6 30.1
Average effective replacement ratio 2/ 41.8 42.8 42.3 43.2
Disability pensionsNumber of disability pensioners 197,778 235,349 267,357 316,243Additional pensioners ... 37,571 32,008 48,886In percent of total pensioners 8.3 9.9 11.4 13.5Cost (millions of leva) 165.8 195.9 246.3 313.4Costs (in percent of GDP) 0.6 0.7 0.8 0.9Average annual pension (in euros) 428.1 425.1 470.4 506.1
Memorandum itemGDP per capita (in euros) 1598 1794 2050 2256
Sources: National Social Security Institute and Fund staff calculations1/ For these two categories, it is believed that wages are significantly underreported to evade taxes.2/ Based on the income of individuals--90 percent of all workers--working for an employer other than the armed forces.
Table 3. Bulgaria: Selected Pension-Related Indicators

- 48 -
budget of the Ministry of Health, leaving the NHIF in deficit.35 Failure to advance the reforms would worsen this deficit—especially given the aging population—putting pressure on the government to loosen fiscal policy, as it would be politically difficult to make cuts in the quality and availability of health services. The authorities have not yet come to grips with this looming problem, which will require strong political commitment to accelerate the reforms.
2003 2004 2005 2006 2007 2008 2009 Budget
Health Expenditure 4.8 4.3 4.6 4.6 4.6 4.6 4.6Ministry of Health 1.7 1.5 1.6 1.3 1.1 0.9 0.8National Health Insurance Fund 2.2 2.3 2.6 2.9 3.1 3.3 3.5Municipalities 0.6 0.3 0.3 0.3 0.3 0.2 0.2Others 0.3 0.2 0.2 0.1 0.1 0.1 0.1
Of which, Hospital care 2.3 1.6 2.0 2.2 2.3 2.5 2.6
Ministry of Health 0.9 0.5 0.7 0.6 0.6 0.5 0.5National Health Insurance Fund 0.6 0.8 1.1 1.4 1.6 1.8 2.0Municipalities 0.5 0.1 0.1 0.1 0.1 0.1 0.1Others 0.3 0.2 0.1 0.1 0.1 0.1 0.1
MemorandumReserves of the NHIF 2.2 1.8 1.5 0.8 0.1 -0.5 ...
Sources: National Health Insurance Fund and Fund staff calculations.
Projections
Table 4. Bulgaria: Health Sector Spending Under the Baseline Scenario (In percent of GDP)
Appropriateness of and risks to the MTFF
66. The question of the appropriateness of the MTFF boils down to whether the underlying fiscal stance is adequate. In the short run and given the CBA, fiscal policy is the central macroeconomic instrument for offsetting the impact of the credit boom. A balanced budget for 2004-05 appears therefore appropriate, but not necessarily sufficient. Indeed, the acceleration in private demand would suggest a need for a bias toward fiscal surpluses. In the longer run, since growth is expected to accelerate toward its annual potential of 5½ percent in 2008, a balanced budget could actually be pro-cyclical.36 While a surplus might be difficult to achieve because of political constraints, aiming for a balanced budget over the cycle would seem adequate to offset excess demand pressure. Moreover, in the absence of a long-enough series of macroeconomic variables necessary to estimate the structural fiscal balance, an implicit balanced budget rule appears a prudent enough approach that would allow sufficient room for fiscal adjustment in an environment of lack of monetary stabilization tools.
35 The NHIF deficit would be financed by its accumulated reserves, which are included in the FRA. However, they would run out before or by 2007, depending on how fast reforms are implemented.
36 See Bulgaria—Selected Issues and Statistical Appendix, IMF Country Report No. 01/54.

- 49 -
67. It may not be prudent to allow a significant deviation from a balanced budget upon EU accession. Bulgaria has announced its intention to enter ERM2 with the current peg under the CBA and to maintain it as the central parity until joining EMU. There is hence no reason to deviate from the tight fiscal policy pursued so far. This would thus imply that Bulgaria should regard the Maastricht fiscal criteria as upper bounds and endeavor to stay below them, despite EU solidarity mechanisms. The need to allow room for counter-cyclical fiscal policy in case of a downturn strengthens the argument for not loosening the fiscal stance. Also, a balanced budget—and associated primary surpluses—would greatly contribute to reducing public debt, which in turn would strengthen fiscal sustainability and help keep interest rates low. Finally, a balanced budget would help bolster public savings needed to finance rising government capital investment.
68. Whether a fiscal surplus could prevent growth from accelerating to its potential would be an issue, if in fact the authorities were to go that route. This would depend on how the surplus is generated. Fiscal consolidation has been shown to have non-Keynesian effects, with the composition of the adjustment playing a crucial role in achieving expansion. Alesina and Perotti (1997) argue that fiscal adjustment that relies primarily on tax increases and cuts in public investment tend to last and are contractionary, while cuts in current spending are likely to be expansionary. Tax increases would result in higher unit labor costs and lower competitiveness especially when unions are strong, while cuts in public investment would lower growth. In contrast, credible spending cuts—particularly on the wage bill and transfers—have a favorable effect on growth by increasing competitiveness and lowering interest rates. More recently, Giudice et al. (2004) found strong evidence in favor of these arguments in the EU area. Although the right mix of revenue and expenditure measures when adjusting is country-specific, this suggests that curtailing current spending would be more benign with respect to growth and should therefore be the primary source of adjustment.
69. Experience in some previous accession countries suggests that a strong fiscal policy could help foster real convergence. Countries that aspire to join the EU hope that this would result in rapid convergence of real income to EU levels. The experience of Ireland shows that strong fiscal adjustment from initial large deficits could help accelerate real convergence (Honohan, 1999). Bulgaria already implements a strong fiscal policy, which, if maintained after EU accession, would position the country well to attract higher FDI, crucial to achieving sustained rapid growth.
70. In the context of the CBA, flexibility remains an important element of conducting fiscal policy. In addition to normal contingencies, Bulgaria has a well-established practice of setting aside roughly 1 percent of GDP by capping discretionary spending across-the-board during the first three quarters of the year. This approach, however, is prone to favor the accumulation of arrears and lead to less-than-desirable adjustment. The practice will change beginning with the 2005 budget through the prior identification of lower priority spending in the budget of each line ministry and other budget entities. By cutting or delaying only such spending, the quality of the adjustment, if in fact needed, would be improved. Also, in 2004 the government will experiment for the first time with quarterly

- 50 -
expenditure ceilings. While not flexible, such ceilings would prevent revenue overperformance, as in the past, to be spent at the end of the year on low-priority items.
71. Reducing the size of the government is an important objective that could, however, be reversed after EU accession. The size of government—as measured by the ratio of total government expenditure to GDP—compares well with that in the EU and other countries in the region. Yet, the government has made further downsizing one of its medium-term fiscal objectives, although it has not been successful in recent years. From 2007, the size of the government may increase again, reflecting EU grants and related spending. In fact, previous EU accession rounds have shown that the size of government in new EU member countries tends to converge toward the average EU level (e.g., Greece). Nevertheless, consistent with the government’s objective the MTFF does assume some substitution so that expenditure will increase by less than would have been the case otherwise. Abstracting from EU grants and related spending, the size of the general government would decline steadily during the medium term to 33¼ percent of GDP in 2009, but this crucially hinges on whether remaining structural reforms are implemented.
72. Delays in completing structural reforms could increase pressure to deviate from the MTFF path. Reforms in the energy sector have made strides with the passage of the energy law underpinning the liberalization of the sector. The railways sector, on the other hand, is still quite inefficient, with freight subsidizing passenger traffic and many idle lines still open. Both sectors continue to receive subsidies totaling about ½ percent of GDP, but the MTFF assumes some reduction. Tax administration is expected to improve notably with the introduction of the National Revenue Agency, which would consolidate the collection of taxes and social security contributions. Expenditure management would be enhanced through consolidation of budgetary entities’ accounts in the Treasury Single Account and the introduction of the Financial Management Information System. The latter would allow better control of expenditure commitments. These reforms are crucial for implementing the MTFF and delay would make it difficult to achieve its objectives. After the recent slowdown of reforms, a new impetus is needed.
73. The MTFF faces other risks. In the immediate future, the general elections may lead to a weakening of policies either before, to “buy votes,” or afterwards, if a new government decides to follow a somewhat looser fiscal policy. Slow EU growth, further substantial oil price increases and appreciation of the euro are potential occurrences that may make it more difficult to achieve the objectives of MTFF.37 A delay in EU accession could result in significant market volatility, if it is interpreted as putting in question accession altogether. In addition, there could be pressure on the CBA associated with questions regarding the exit strategy.
37 Shocks to the MTFF are analyzed in Section C.

- 51 -
2002 2003 2004 2005 2006 2007 2008 2009
Transfers from the EU (gross) 2.0 1.5 1.3 1.6 1.6 3.0 4.6 3.9Pre-EU accession funds allocated 2.0 1.5 1.3 1.6 1.6 1.3 1.2 ...Post-EU accession funds allocated ... ... ... ... ... 1.7 3.4 3.9
EU related expenditure 0.8 1.6 1.6 1.6 1.9 5.9 6.3 5.5Related to pre-accession funds 0.8 1.4 1.2 1.2 1.5 1.6 1.2 ...Co-financing of pre-accesion projects 0.0 0.2 0.4 0.4 0.4 0.4 ... ...Related to post-accession funds ... ... ... ... ... 2.5 3.6 3.9Co-financing of post-accession projects ... ... ... ... ... 0.3 0.5 0.6Contribution to the EU budget ... ... ... ... ... 1.1 1.1 1.0
Net cash flow 1.2 -0.1 -0.2 0.0 -0.2 -2.9 -1.7 -1.6
Memorandum itemsNet transfers from the EU 2.0 1.5 1.3 1.6 1.6 1.9 3.6 2.8Nominal GDP ( millions of leva) 32,324 34,410 37,973 41,226 44,801 48,685 53,006 57,711
Sources: Bulgarian authorities.
Table 5. Bulgaria: EU Accession-Related Transfers and Spending (In percent of GDP)
74. Financing of the MTFF is not an issue, but completing privatizations would provide added comfort. While external debt service requirements would be large from 2006, with a spike in 2007, ample international reserves would allow repayments without threatening coverage of base money, although the current cushion would thin out. Although the baseline scenario takes a prudent approach to projecting privatization receipts, the latter could be as much as 4½ percentage points of (projected 2005) GDP higher cumulatively over 2005-07, further bolstering the FRA and international reserves. Completing these privatizations should therefore be one of the government’s priorities. The government can smooth out the debt service spike in 2007 through debt operations.
C. Fiscal Implications of Pre- and Post-EU Accession and NATO Requirements
75. Until 2006, Bulgaria would be able to manage the requirement for counterpart funds for EU accession. Since 1999 approved EU pre-accession funds have averaged 1½ percent of GDP, but implementation capacity has averaged only 50 percent. Co-financing has typically amounted to 20-25 percent of these funds and the government has been able to provide for this requirement within the fiscal envelope. The main reasons for low implementation include lack of technical expertise for timely project preparation and implementation, legislative and regulatory impediments, and inadequate staffing. The authorities have taken steps to address these shortcomings and implementation capacity is expected to gradually increase. Despite this improvement, until 2006 co-financing is not expected to constrain the government’s ability to post a balanced budget.
76. From 2007, however, EU requirements would make it more difficult to achieve a balanced budget (Table 5). Upon accession, Bulgaria will start making contributions to the EU budget averaging 1.1 percent of GDP yearly. Spending requirements associated with adoption of the acquis communautaire will increase, leaving a domestic financing gap of slightly more than 1½ percent of GDP per year. In 2007 specifically, advanced payment—with a transfer from the EU due only in 2008—of common agricultural policy (CAP) subsidies to Bulgarian farmers amounting to 0.8 percent of GDP will temporarily increase the gap to almost 3 percent of GDP. The authorities are still mulling whether to increase the deficit by the full amount of these gaps. But for reasons discussed in paragraph 67, it would be prudent to cut other spending to accommodate EU requirements, with the possible exception of the one-off advanced payment of CAP subsidies in 2007. The MTFF reflects this policy line.

- 52 -
77. Harmonization of indirect taxation with the EU presents less of a challenge than the adoption of the common external tariff (CET). At 20 percent, the VAT rate is comparable to levels in the EU and excises have been rising gradually and are at 60-70 percent of minimum EU levels, although the gap for cigarette and fuel excises remains quite wide. Bulgaria has a lower tariff protection than the EU, with the effective import duties rate averaging 1.7 percent (Box 1). Bulgaria also has free-trade agreements with many countries, some of which may not have such agreements with the EU as a group. The CET may therefore increase trade protection, which may dampen further efficiency gains in the tradable sectors—such as textiles—where Bulgaria still enjoys a comparative advantage. Furthermore, trade protection may have price effects on production factors and consumer goods with welfare losses.
78. The CAP would lead to a significant increase in subsidies. Direct subsidies would rise from 1½ percent of GDP in 2007 to 2 percent of GDP in 2009, while additional implicit subsidies would result from trade barriers against non-EU producers under the CET. The latter, however, would be limited by production quotas. The MTFF assumes that the overall level of subsidies would increase only by a fraction of these transfers, implying that the other subsidies would have been reduced through reforms.38 However, if substitution were not to take place the overall level of subsidies would increase significantly.
79. NATO accession requirements seem to represent a lesser fiscal challenge. Upon NATO accession, Bulgaria committed to spend 2.6 percent of GDP on defense and law enforcement annually. This amount is in line with what the country already spends in this sector, so that the additional burden appears negligible.
D. Medium-Term Fiscal Sustainability
80. Fiscal sustainability is assessed based upon projected levels of public debt in the medium term. According to IMF (2003), the sustainable public debt level for a typical emerging market country could be as low as 25 percent of GDP, since such countries could be subject to significant interest rate and capital volatility. Upon EU accession, solidarity mechanisms would allow Bulgaria to afford a higher debt ratio. Schadler et al. (2003) estimate that such a level could be around 45 percent of GDP for the most recent EU members. But accession is expected to take place only in 2007, with some probability that this date could slip, pointing to the need for Bulgaria to remain focused on continuing to lower its public debt ratio.
81. Public debt dynamics under the baseline scenario are favorable (Table 6). The public debt-to-GDP ratio declined steadily from 83 percent of GDP in 1999 to 53½ percent of
38 Agriculture accounted for 15 percent of GDP in 2003 and will likely continue to represent a significant share of the Bulgarian economy after EU accession.

- 53 -
GDP in 2003. It is projected to drop to 31 percent of GDP by 2009, well below the level determined to be prudent for the newest EU members, which points to strong medium-term fiscal sustainability. While external debt would gradually contract, domestic debt is projected to pick up from 2005, reflecting debt management policies.
2002 2003 2004 2005 2006 2007 2008 2009Projections
External Stock 17,710 16,092 15,230 15,240 15,008 14,150 13,741 13,483Disbursement 540 841 1,298 1,235 1,093 1,028 799 801Amortization 1,210 758 726 1,110 1,303 1,861 1,181 1,032
DomesticStock 2,148 2,271 2,732 3,160 3,562 3,934 4,194 4,445New Issue 902 879 724 843 923 913 815 925Amortization 568 683 238 416 521 541 554 674
Total Stock 19,858 18,364 17,962 18,400 18,570 18,084 17,936 17,928Disbursement 1,442 1,720 2,022 2,078 2,017 1,941 1,614 1,726Amortization 1,778 1,441 964 1,525 1,824 2,401 1,735 1,706
Interest payments 729 747 743 825 1,016 1,067 1,019 970External 622 629 609 671 828 834 759 697Domestic 107 118 134 154 188 232 261 272
External Stock 54.8 46.8 40.1 37.0 33.5 29.1 25.9 23.4Disbursement 1.7 2.4 3.4 3.0 2.4 2.1 1.5 1.4Amortization 3.7 2.2 1.9 2.7 2.9 3.8 2.2 1.8
DomesticStock 6.6 6.6 7.2 7.7 8.0 8.1 7.9 7.7New Issue 2.8 2.6 1.9 2.0 2.1 1.9 1.5 1.6Amortization 1.8 2.0 0.6 1.0 1.2 1.1 1.0 1.2
Total Stock 61.4 53.4 47.3 44.6 41.5 37.1 33.8 31.1Disbursement 4.5 5.0 5.3 5.0 4.5 4.0 3.0 3.0Amortization 5.5 4.2 2.5 3.7 4.1 4.9 3.3 3.0
Interest payments 2.3 2.2 2.0 2.0 2.3 2.2 1.9 1.7External 1.9 1.8 1.6 1.6 1.8 1.7 1.4 1.2Domestic 0.3 0.3 0.4 0.4 0.4 0.5 0.5 0.5
Memorandum itemNominal GDP 32,324 34,410 37,973 41,226 44,801 48,685 53,006 57,711
Sources: Bulgarian authorities and Fund staff calculations.
Table 6. Bulgaria: Public Debt Under the Baseline Scenario
(In millions of leva)
(In percent of GDP)

- 54 -
82. Public debt management objectives have supported the reduction and restructuring of public debt.39 These objectives include the reduction of the share of U.S. dollar-denominated and floating interest rate debt, lengthening the maturity of debt and smoothing the repayment schedule. Given the peg to the euro and the fact that Bulgaria’s trade with the EU amounts to more than 60 percent of its total trade, it makes sense to shift debt to euro and leva, the domestic currency. Moreover, the increase in domestic debt is also meant to provide additional financial instruments to domestic investors, notably pension funds, thereby deepening the financial system. To achieve these objectives, Bulgaria has at its disposal a wide array of instruments including debt swaps, buybacks, and prepayments. Some of these were used in the past, particularly the Brady bonds swap that reduced U.S. dollar-denominated debt by 16 percentage points in 2002.
83. The composition of public debt suggests that there remains room to undertake further debt operations to minimize risks (Figure 3). Foreign currency debt represents 86 percent of total public debt. US dollar-denominated debt amounts to 42 percent of the total and is subject to exchange rate fluctuations. The recent appreciation of the euro vis-à-vis the US dollar was a windfall, but since a depreciation would have increased the debt burden, the objective of lowering the US dollar share is remains sensible—although the timing of debt operations is crucial for taking full advantage of opportunities. Debt with fixed interest rates represents 43 percent, while longer-term debt (with a maturity of over 10 years) represents 40 percent of the total. These ratios could be further increased. Short-term debt (with a maturity of up to one year), however, equals only about 1 percent of the total. As can be seen in Table 1, principal repayments will jump in 2006-09, with a peak in 2007. Debt operations could be very useful in smoothing the debt service profile. For this purpose, the authorities can use the resources in the FRA subject to maintaining an adequate international reserve cover.
84. A public debt sustainability analysis shows that even under extreme conditions, the public debt-to-GDP ratio would continue to decline and stay below the Maastricht limit of 60 percent (Table 7). Stress tests include the following shocks in 2004-05: higher real interest rates, lower GDP growth, lower primary balance, a substantial increase in debt creating inflows, and a 30-percent depreciation. Only the latter would result in a large increase (close to 20 percentage points) of the public debt ratio in 2005 followed by a gradual decrease to a level almost identical to the ratio in 2003. Lower growth would also lead to a less steep decline in the public debt ratio, highlighting the importance of growth for debt sustainability. In all the other cases, the public debt ratio would contract rapidly.
39 See IMF Country Report No. 02/173 for a discussion of debt management and composition in Bulgaria.

- 55 -
Figure 3. Bulgaria: Public Debt Data as of End-March 2004
Sources: Ministry of Finance and Fund staff calculations.
By Creditors
IMF11.7%
European Union4.0%
World Bank10.2%
Other bonds23.7%
G240.4%
Brady bonds21.9%
Domestic debt (GS)14.2%
Called government guarantees
0.6%Others1.4%
Government investment loans4.4%
Paris Club2.3%
Government guanranteed debt5.1%
By Currency
Debt in euro34.6%
Debt in leva 9.5%
Debt in other currencies14.2% Debt in US dollars
41.7%

- 56 -
Figure 3. Bulgaria: Public Debt Data as of End-March 2004, (continued)
Sources: Ministry of Finance and Fund staff calculations.1/ The average-weighted residual term to maturity of the foreign debt is nine years and eight months.
Debt Interest Structure
Debt with floating interest rates
57.0%
Debt with fixed interest rates
43.0%
Term to Maturity of Pubic Foreign Debt 1/
Up to one year1% 1 to 5 years
18%
5 to 10 years42%
Over 10 years39%

- 57 -
Proj
ectio
ns19
9819
9920
0020
0120
0220
0320
0420
0520
0620
0720
0820
09ba
lanc
e 9/
1Pu
blic
sect
or d
ebt 1
/83
.286
.777
.169
.961
.353
.447
.344
.641
.537
.133
.831
.12.
2o/
w fo
reig
n-cu
rren
cy d
enom
inat
ed78
.878
.870
.166
.558
.049
.343
.339
.736
.231
.928
.125
.4
2C
hang
e in
pub
lic se
ctor
deb
t-3
0.3
3.5
-9.6
-7.1
-8.6
-7.9
-6.1
-2.7
-3.2
-4.3
-3.3
-2.8
3Id
entif
ied
debt
-cre
atin
g flo
ws (
4+7+
12)
-11.
82.
1-5
.6-5
.5-2
.6-2
.4-6
.7-3
.5-2
.0-1
.1-1
.60.
24
Prim
ary
defic
it-5
.2-2
.8-3
.0-2
.8-1
.6-1
.7-1
.6-2
.0-2
.3-1
.4-2
.0-1
.75
Rev
enue
and
gra
nts
35.4
38.5
38.7
37.6
36.5
37.9
35.4
35.0
35.0
36.2
37.8
37.2
6Pr
imar
y (n
onin
tere
st) e
xpen
ditu
re30
.235
.735
.734
.734
.936
.233
.933
.032
.834
.935
.835
.57
Aut
omat
ic d
ebt d
ynam
ics
2/-1
2.3
-0.9
-5.6
-3.9
-3.5
-1.6
-3.1
-1.7
-1.3
-1.1
-1.0
-1.1
8C
ontri
butio
n fr
om in
tere
st ra
te/g
row
th d
iffer
entia
l 3/
-21.
0-1
.0-5
.6-3
.9-3
.5-1
.6-3
.1-1
.7-1
.3-1
.1-1
.0-1
.19
Of w
hich
con
tribu
tion
from
real
inte
rest
rate
-1
7.5
0.8
-1.4
-1.1
-0.3
0.9
-0.7
0.5
0.9
0.9
0.8
0.6
10O
f whi
ch c
ontri
butio
n fr
om re
al G
DP
grow
th-3
.5-1
.8-4
.2-2
.8-3
.1-2
.5-2
.4-2
.3-2
.2-2
.0-1
.9-1
.711
Con
tribu
tion
from
exc
hang
e ra
te d
epre
ciat
ion
4/8.
80.
10.
00.
00.
00.
00.
00.
00.
00.
00.
00.
012
Oth
er id
entif
ied
debt
-cre
atin
g flo
ws
5.6
5.9
3.0
1.3
2.5
0.9
-2.1
0.3
1.5
1.3
1.4
3.0
13Pr
ivat
izat
ion
rece
ipts
(neg
ativ
e)-1
.5-2
.1-1
.3-2
.9-0
.9-1
.1-4
.1-1
.6-0
.2-0
.20.
00.
014
Rec
ogni
tion
of im
plic
it or
con
tinge
nt li
abili
ties
7.1
8.0
4.3
4.2
3.3
2.0
2.0
1.9
1.7
1.5
1.4
1.3
15O
ther
(spe
cify
, e.g
. ban
k re
capi
taliz
atio
n)0.
00.
00.
00.
00.
00.
00.
00.
00.
00.
00.
01.
716
Res
idua
l, in
clud
ing
asse
t cha
nges
(2-3
)-1
8.5
1.4
-4.0
-1.6
-6.1
-5.6
0.6
0.8
-1.1
-3.2
-1.7
-3.0
Publ
ic se
ctor
deb
t-to-
reve
nue
ratio
1/
235.
122
5.0
199.
018
6.1
168.
014
0.7
133.
512
7.4
118.
310
2.5
89.5
83.5
Gro
ss fi
nanc
ing
need
5/
8.9
7.6
7.0
6.1
4.8
4.1
2.4
2.5
2.9
4.7
2.8
2.5
in b
illio
ns o
f eur
os1.
00.
91.
00.
90.
85-
Yea
r5-
Yea
r0.
70.
50.
50.
71.
20.
70.
7H
isto
rical
Stan
dard
Proj
ecte
dK
ey M
acro
econ
omic
and
Fis
cal A
ssum
ptio
nsA
vera
geD
evia
tion
Ave
rage
Rea
l GD
P gr
owth
(in
perc
ent)
4.0
2.3
5.4
4.1
4.9
4.1
1.2
4.3
5.0
5.2
5.3
5.3
5.5
5.5
5.2
Ave
rage
nom
inal
inte
rest
rate
on
publ
ic d
ebt (
in p
erce
nt) 6
/4.
84.
85.
35.
43.
44.
70.
83.
74.
04.
65.
55.
75.
95.
45.
0A
vera
ge re
al in
tere
st ra
te (n
omin
al ra
te m
inus
cha
nge
in G
DP
defla
tor,
in p
erce
nt)
-18.
91.
1-1
.4-1
.3-0
.3-4
.28.
31.
6-1
.11.
42.
32.
52.
72.
21.
7N
omin
al a
ppre
ciat
ion
(incr
ease
in e
uro
valu
e of
loca
l cur
renc
y, in
per
cent
)-9
.1-0
.10.
00.
00.
0-1
.84.
10.
00.
00.
00.
00.
00.
00.
00.
0In
flatio
n ra
te (G
DP
defla
tor,
in p
erce
nt)
23.7
3.7
6.7
6.7
3.8
8.9
8.4
2.1
5.1
3.2
3.2
3.2
3.2
3.2
3.3
Gro
wth
of r
eal p
rimar
y sp
endi
ng (d
efla
ted
by G
DP
defla
tor,
in p
erce
nt)
25.9
20.7
5.4
1.3
5.5
11.8
10.8
8.2
-1.9
2.5
4.6
12.1
8.3
4.6
5.5
Prim
ary
defic
it-5
.2-2
.8-3
.0-2
.8-1
.6-3
.11.
3-1
.7-1
.6-2
.0-2
.3-1
.4-2
.0-1
.7-1
.8
Deb
t-sta
biliz
ing
prim
ary
A. A
ltern
ativ
e Sc
enar
ioba
lanc
e 9/
A1.
Key
var
iabl
es a
re a
t the
ir hi
stor
ical
ave
rage
s in
200
4-08
7/
53.4
44.7
39.2
33.4
25.8
20.4
15.7
1.9
B. B
ound
Tes
ts
B1.
Rea
l int
eres
t rat
e is
at h
istor
ical
ave
rage
plu
s tw
o st
anda
rd d
evia
tions
in 2
004
and
2005
53
.453
.856
.352
.848
.244
.541
.41.
7B
2. R
eal G
DP
grow
th is
at h
istor
ical
ave
rage
min
us tw
o st
anda
rd d
evia
tions
in 2
004
and
2005
53
.449
.951
.049
.847
.546
.345
.41.
8B
3. P
rimar
y ba
lanc
e is
at h
istor
ical
ave
rage
min
us tw
o st
anda
rd d
evia
tions
in 2
004
and
2005
53.4
48.4
47.2
43.9
39.5
36.1
33.3
2.0
B4.
Com
bina
tion
of 2
-4 u
sing
one
stan
dard
dev
iatio
n sh
ocks
53.4
50.6
50.5
47.1
42.6
39.1
36.2
2.0
B5.
One
tim
e 30
per
cent
real
dep
reci
atio
n in
200
4 8/
53.4
72.2
68.6
64.7
59.8
55.8
52.3
1.4
B6.
10
perc
ent o
f GD
P in
crea
se in
oth
er d
ebt-c
reat
ing
flow
s in
2004
53
.457
.354
.350
.846
.242
.739
.61.
8
Sour
ce:
Bul
garia
n au
thor
ities
and
Fun
d st
aff c
alcu
latio
ns.
1/ T
his r
epre
sent
s gro
ss p
ublic
sect
or d
ebt,
and
thus
is d
iffer
ent f
rom
gen
eral
gov
ernm
ent d
ebt f
igur
es sh
own
else
whe
re.
2/ D
eriv
ed a
s [(
r - π(1+ g) -
g +
αε(1+
r)]/(
1+g+π +
gπ))
tim
es p
revi
ous p
erio
d de
bt ra
tio, w
ith r
= in
tere
st ra
te; π
= g
row
th ra
te o
f GD
P de
flato
r; g
= re
al G
DP
grow
th ra
te; α
= sh
are
of fo
reig
n-cu
rren
cy
deno
min
ated
deb
t; an
d ε
= no
min
al e
xcha
nge
rate
dep
reci
atio
n (m
easu
red
by in
crea
se in
loca
l cur
renc
y va
lue
of e
uro)
.3/
The
real
inte
rest
rate
con
tribu
tion
is d
eriv
ed fr
om th
e de
nom
inat
or in
foot
note
2/ a
s r - π
(1+g
) and
the
real
gro
wth
con
tribu
tion
as -g
.4/
The
exc
hang
e ra
te c
ontri
butio
n is
deriv
ed fr
om th
e nu
mer
ator
in fo
otno
te 2
/ as αε(
1+r)
. 5/
Def
ined
as p
ublic
sect
or d
efic
it, p
lus a
mor
tizat
ion
of m
ediu
m a
nd lo
ng-te
rm p
ublic
sect
or d
ebt,
plus
shor
t-ter
m d
ebt a
t end
of p
revi
ous p
erio
d.
6/ D
eriv
ed a
s no
min
al in
tere
st e
xpen
ditu
re d
ivid
ed b
y pr
evio
us p
erio
d de
bt st
ock.
7/ T
he k
ey v
aria
bles
incl
ude
real
GD
P gr
owth
; rea
l int
eres
t rat
e; a
nd p
rimar
y ba
lanc
e in
per
cent
of G
DP.
8/ R
eal d
epre
ciat
ion
is d
efin
ed a
s nom
inal
dep
reci
atio
n (m
easu
red
by p
erce
ntag
e fa
ll in
eur
o va
lue
of lo
cal c
urre
ncy)
min
us d
omes
tic in
flatio
n (b
ased
on
GD
P de
flato
r).
9/ A
ssum
es th
at k
ey v
aria
bles
(rea
l GD
P gr
owth
, rea
l int
eres
t rat
e, a
nd p
rimar
y ba
lanc
e) re
mai
n at
the
leve
l in
perc
ent o
f GD
P/gr
owth
rate
of t
he la
st p
roje
ctio
n ye
ar.
II. S
tress
Tes
ts fo
r Pub
lic D
ebt R
atio
Act
ual
Tabl
e 7.
Bul
garia
: Pub
lic S
ecto
r Deb
t Sus
tain
abili
ty F
ram
ewor
k, 1
998-
2009
(In p
erce
nt o
f GD
P, u
nles
s oth
erw
ise
indi
cate
d)

- 58 -
E. Concluding Remarks
85. The MTFF reflects constraints arising from the CBA and the need to respond to increased external vulnerability, but it faces risks. In the context of the CBA, fiscal policy is the central instrument for adjustment. The relatively high level of the current account deficit projected in the medium term and the need to maintain fiscal flexibility justify the implicit balanced budget rule. The latter would require proceeding cautiously with tax cuts and reducing current expenditures further so as to accommodate higher spending associated with EU accession, notably for public investment. However, delays in implementing reforms would make it increasingly difficult to restructure expenditures and would increase pressure to loosen fiscal policy.
86. The EU accession poses challenges to the MTFF. Until 2006, EU pre-accession related spending would not prevent achieving a balanced budget. From 2007, however, the large gap between transfers from the EU and spending related to the adoption of the acquis communautaire would entail difficult policy choices with regard to prioritization of expenditures. The implicit fiscal rule underlying the MTFF would call for efforts in advance of EU accession to create the needed fiscal room, notably through expediting reforms.
87. Fiscal sustainability in the medium term appears strong. An overall balanced budget and strong growth would ensure favorable public debt dynamics. Even under extreme conditions, the public debt-to-GDP would continue to decline to levels well below the Maastricht criterion of 60 percent by 2009. Debt management operations contemplated by the authorities would further improve the composition of public debt and reduce risks.

- 59 -
F. References
Alesina, A. and R. Perotti, 1997, “Fiscal Adjustment in the OECD Countries: Composition and Macroeconomic Effects,” IMF Staff Papers, Vol 44, No. 2, pp. 210-48.
Giudici, G., A. Turrini, and J. I. Veld, 2004, “Can Fiscal Consolidations Be Expansionary in the EU? Ex-Post Evidence and Ex-Ante Analysis,” European Commission, Economic Papers, No. 195.
Honohan, P., 1999, “Fiscal Adjustment and Disinflation in Ireland: Setting the Macro Basis for Economic Recovery and Expansion,” in Barry, Frank, ed., Understanding Ireland Economic Growth, (St. Martin’s Press, 1999).
Horváth, B., and I. Székely, 2001, “The Role of Medium-Term Fiscal Frameworks for Transition Countries: the Case of Bulgaria,” IMF Working Paper No. 01/11 (Washington D.C., International Monetary Fund).
International Monetary Fund, 2004, “Adopting the Euro in Central Europe—Challenges of the Next Step in European Integration,” (forthcoming occasional paper).
———, 2003, “Public Debt in Emerging Markets,” World Economic Outlook, September.
———, 2002, “The Baltics: Medium-Term Fiscal Issues Related to EU And Nato Accession,” IMF Country Report No. 02/7.

- 60 -
IV. BULGARIA—FSAP FOLLOW-UP40
88. For financial surveillance purposes, a follow-up of the 2001/02 FSAP was conducted during the 2004 Article IV consultation mission. The main purpose of this work was to assess the vulnerability of the financial sector in light of recent developments, in particular fast credit growth, and examine how these developments may alter the risk profile of Bulgaria’s financial sector in the near future. In addition, the FSAP follow-up presents a factual description of the main measures that the authorities have taken in response to FSAP recommendations in the banking and nonbanking sectors. A summary table that lists the main FSAP recommendations (see IMF Country Report No. 02/188) and steps taken by the authorities to implement the recommendations is presented in Appendix I.
A. Financial Sector Vulnerability Assessment
Recent developments in the banking sector
89. Overall, the banking sector, which represents over 90 percent of total financial sector assets, continues to operate in an environment of high capital, profitability and liquidity levels. The stability of Bulgaria’s banking system is further supported by four main contributing factors: (i) a strong supervisory and regulatory framework; (ii) the dominance of a core group of large, highly liquid and capitalized, and mostly foreign-owned banks, which perform their activities under close scrutiny from their parent company; (iii) a fully privatized banking system, with the exception of two small banks which, together, represent less than 3 percent of total banking sector assets; and (iv) relatively traditional scope of banking activities, where most of the risk continues to be concentrated in credit risk and related areas. The structure of the financial sector is presented in Table 1.
90. To assess the soundness of individual financial institutions, the BNB Banking Supervision Department (BSD) divides the banks into three groups: Group I, comprising of the 10 biggest banks; Group II, composed of the other 19 medium and small banks; and Group III, including the six branches of foreign banks. The BSD no longer differentiates between its now ten local and 25 foreign-owned banks, as was the case at the time of the FSAP. According to the BSD, this differentiation is no longer relevant for analytical purposes, as asset size seems to represent a better proxy for characterizing a bank’s risk management or investment strategy than its ownership structure.
40 Prepared by Andrea M. Maechler.

- 61 -
1999 2000 2001 2002 2003
Banks 35 35 35 34 35Foreign-owned banks 20 23 25 24 25Domestic banks 15 12 10 10 10 Private banks 8 8 6 7 8 Public banks 7 4 4 3 2Group I (large banks) 7 8 9 10 10Group II (medium & small banks) 21 19 19 18 19Group III (foreign branches) 7 8 7 6 6
Non-bank financial institutionsSecurities firms 76 69 65 70 67Finance companies 48 62 63 67 81Collective investment schemes 1/ 6 4 3 4 5Insurance companies 5/ 30 32 32 32 31 General (non-life) insurance 18 20 20 20 20 Life insurance 12 12 12 12 11Pension funds 2/ 3/ 5/ - 9 8 8 8
Total financial sector 8,810.9 10,563.6 13,138.9 15,754.4 18,785.5Banks 8,186.0 9,774.0 12,221.0 14,557.0 17,324.0
Group I (large banks) 5,750.0 7,017.0 8,722.0 10,746.0 12,716.0Group II (medium & small banks) 1,925.0 2,012.0 2,506.0 2,924.0 3,679.0Group III (foreign branches) 511.0 745.0 993.0 887.0 929.0
Nonbank financial institutions 624.9 789.6 917.9 1,197.4 1,461.5Securities firms 4/ 6/ - - - - 183.6Finance companies 70.8 73.7 26.9 27.0 24.3Collective investment schemes 6/ 16.2 10.8 10.7 13.0 18.0Insurance companies 5/ 6/ 538.0 618.6 691.0 820.0 750.1 General (non-life) insurance 349.7 422.1 462.3 571.9 495.9 Life insurance 188.3 196.5 228.7 248.1 254.2Pension funds 2/ 3/ 5/ 6/ - 86.6 189.3 337.4 485.5 Of which : mandatory - - - 41.7 93.7 Of which : occupational - - 51.5 95.2 131.4 Of which : voluntary - - 135.3 195.5 228.4
Banks 92.9 92.5 93.0 92.4 92.2Group I (large banks) 65.3 66.4 66.4 68.2 67.7Group II (medium & small banks) 21.8 19.0 19.1 18.6 19.6Group III (foreign branches) 5.8 7.1 7.6 5.6 4.9
Nonbank financial institutions 7.1 7.5 7.0 7.6 7.8Securities firms 4/ 1.0Finance companies 0.8 0.7 0.2 0.2 0.1Collective investment schemes 0.2 0.1 0.1 0.1 0.1Insurance companies 5/ 6.1 5.9 5.3 5.2 4.0 General (non-life) insurance 4.0 4.0 3.5 3.6 2.6 Life insurance 2.1 1.9 1.7 1.6 1.4Pension funds 2/ 3/ 5/ - 0.8 1.4 2.1 2.6 Of which : mandatory - - - 0.3 0.5 Of which : occupational - - 0.4 0.7 0.8 Of which : voluntary - - 1.6 1.8 1.8
Memorandum itemsNominal GDP 29,709.2 32,335.1 34,410.2
In millions of US$ 13,599.9 15,565.4 19,866.4Real GDP (annual growth rate, year-on-year) 4.1 4.9 4.3Exchange rate US$ (average) 2,184.5 2,077.4 1,732.1Sources: BNB and FSC.1/ Under the Bulgarian legislation the CIS are open-end investment companies and closed-end investment companies.2/ Under the Bulgarian legislation each pension company manages up to 3 pension funds, one fund for mandatory pension insurance,one fund for occupational pension insurance and one fund for voluntary pension insurance. The data refers to the number of pension companies.3/ The first pension companies in Bulgaria were licensed in 2000.4/ The Financial Supervision Commission (FSC) has no consolidated data on securities firms for 1999-2002.5/ The data about the insurance companies for 2003 is as of end-Q3
Table 1. Bulgaria. Financial Sector Structure, 1999-2003
(Assets in millions of leva)
(Assets in percent of total)
(Number of institutions)

- 62 -
91. Group I dominates the banking system, with a market share of approximately 75 percent of total assets, total deposits, total loans, and total capital (Table 2). Although the market position of the large banks has been increasing slightly, it has remained relatively stable over the last few years. Competition among the three largest banks, at least in the lending market, appears to have increased, with their market share falling from 39 percent to 33 percent between 2000 and 2003. However, this may also suggest that the largest banks have adopted a more prudent lending strategy than some of the smaller banks eager to gain market share.
Financial soundness indicators
92. Financial soundness indicators suggest that the banking sector remains sound and does not show particular signs of financial stability concerns (Table 3). In particular:
• Banks continue to be highly capitalized, with an overall capital adequacy ratio of 22 percent at end-2003. This strong capital position is shared by both the largest banks (Group I) and the medium and small banks (Group II).
• The quality of assets remains good. Classified loans (i.e., loans past due over 31 days)
as a share of total loans continued to fall, reaching 7.3 percent at end-2003, or almost seven percentage points lower than two years earlier.
• Banks’ profitability remains strong, largely due to the expansion of profitable lending
activities, which have translated into high net interest income and higher fee and commission income. In 2003, the return on assets reached 2.4 percent, while the return on equity was 21.7 percent.
• Banks’ liquidity remains sufficient, although there are signs that the sharp credit
growth may have absorbed banks’ excess liquidity and that a further credit expansion would require banks to adjust their liquidity management and find new funding sources.
• Although higher than in 2001, foreign currency substitution has remained stable in
2003. The ratio of foreign currency loans (deposits) to total loans (deposits) was 43.6 percent (51.7 percent) at end-2003.
Risk analysis and monitoring
Credit risk
93. The speed of credit growth, exceeding 50 percent on a twelve-month basis in early 2004, remains the highest concern. So far, asset quality remains adequate, with nonperforming loans (i.e., past 90 days) continuing their decline and currently standing at 3 percent of total loans, in contrast to 6 percent at end-2001 (Table 4). The loan portfolio

- 63 -
1999 2000 2001 2002 2003
Banking systemTotal assets 8,186 9,774 12,221 14,557 17,324 of which: three largest banks 4,242 4,874 5,634 6,296 7,018Total deposits 6,112 7,116 9,555 11,282 13,594 of which: three largest banks 3,168 3,645 4,598 5,027 5,696Total private credit 1,928 2,659 3,475 4,926 9,351 of which: three largest banks 372 614 784 1,194 3,238Capital and reserves 1,283 1,500 1,655 1,936 2,281 of which: three largest banks 701 792 811 964 1,138Number of institutions 35 35 35 34 35
Total assets 5,749 7,017 8,722 10,746 12,716Total deposits 4,389 5,335 7,006 8,425 10,188Total private credit 964 1,337 1,922 3,287 6,831Capital and reserves 910 1,081 1,215 1,465 1,739Number of institutions 7 8 9 10 10
Total assets 1,925 2,012 2,506 2,924 3,679Total deposits 1,319 1,247 1,791 2,077 2,567Total private credit 725 888 971 1,081 1,926Capital and reserves 363 399 412 438 511Number of institutions 21 19 19 18 19
Total assets 511 745 993 887 928Total deposits 404 534 758 780 839Total private credit 240 434 582 557 594Capital and reserves 10 20 28 33 31Number of institutions 7 8 7 6 6
3 largest banksTotal assets 51.8 49.9 46.1 43.3 40.5Total deposits 74.7 72.8 78.2 77.5 78.5Total private credit 38.7 37.3 37.6 34.5 32.9Capital and reserves 23.6 27.2 28.4 33.8 54.0
Group I (large banks)Total assets 70.2 71.8 71.4 73.8 73.4Total deposits 71.8 75.0 73.3 74.7 74.9Total private credit 50.0 50.3 55.3 66.7 73.1Capital and reserves 70.9 72.1 73.4 75.7 76.2
Total assets 23.5 20.6 20.5 20.1 21.2Total deposits 21.6 17.5 18.7 18.4 18.9Total private credit 37.6 33.4 27.9 21.9 20.6Capital and reserves 28.3 26.6 24.9 22.6 22.4
Total assets 6.2 7.6 8.1 6.1 5.4Total deposits 6.6 7.5 7.9 6.9 6.2Total private credit 12.4 16.3 16.7 11.3 6.4Capital and reserves 0.8 1.3 1.7 1.7 1.4
Source: BNB
Group III (foreign branches)
(In percent of total banking sector)
(In millions of leva unless indicated otherwise)
Group II (medium & small banks)
Group III (foreign branches)
Table 2. Bulgaria. Bank Market Structure, 1999-2003(number, in millions of leva)
Group I (large banks)
Group II (medium & small banks)

- 64 -
Tabl
e 3.
Bul
garia
. Fin
anci
al S
ound
ness
Indi
cato
rs, 1
999–
2003
Larg
eM
ediu
m
and
smal
lTo
tal
Larg
eM
ediu
m
and
smal
lTo
tal
Larg
eM
ediu
m
and
smal
lTo
tal
Larg
eM
ediu
m
and
smal
lTo
tal
Larg
eM
ediu
m
and
smal
lTo
tal
Cor
e In
dica
tors
Cap
ital A
dequ
acy
Cap
ital t
o ris
k-w
eigh
ted
asse
ts44
.037
.341
.836
.633
.335
.630
.832
.631
.324
.328
.325
.221
.822
.822
.0Ti
er 1
cap
ital t
o ris
k-w
eigh
ted
asse
ts30
.131
.230
.523
.828
.325
.120
.326
.822
.015
.223
.417
.113
.318
.114
.4A
sset
Qua
lity
Non
perfo
rmin
g lo
ans
to to
tal g
ross
loan
s22
.57.
414
.811
.36.
88.
85.
97.
76.
13.
65.
53.
73.
23.
93.
2N
onpe
rform
ing
loan
s ne
t of p
rovi
sion
s to
cap
ital
7.6
5.6
7.0
2.1
3.6
2.5
1.5
4.9
2.4
2.1
4.4
2.7
3.0
3.3
3.1
Com
mer
cial
loan
s to
tota
l loa
ns89
.097
.893
.372
.196
.982
.570
.895
.880
.874
.593
.880
.470
.395
.077
.2La
rge
expo
sure
s to
cap
ital
46.9
163.
881
.337
.312
5.9
61.8
44.2
102.
360
.486
.210
7.8
91.7
77.8
148.
394
.7E
arni
ngs
and
Pro
fitab
ility
Ret
urn
on a
sset
s3.
21.
32.
73.
81.
33.
13.
71.
02.
92.
51.
12.
12.
71.
62.
4R
etur
n on
equ
ity23
.47.
318
.828
.47.
222
.527
.55.
622
.019
.76.
616
.425
.211
.621
.7N
et in
tere
st in
com
e to
gro
ss in
com
e49
.166
.853
.043
.560
.347
.546
.862
.650
.057
.147
.355
.566
.560
.564
.4N
onin
tere
st e
xpen
se to
gro
ss in
com
e57
.690
.965
.145
.882
.553
.848
.010
0.2
56.9
58.3
83.2
64.1
57.3
76.7
61.4
Pers
onne
l exp
ense
to to
tal i
ncom
e26
.032
.326
.920
.630
.622
.419
.539
.522
.423
.032
.924
.821
.730
.423
.1Tr
adin
g an
d fe
e in
com
e to
tota
l inc
ome
1/30
.320
.828
.221
.023
.521
.819
.135
.721
.823
.230
.724
.730
.441
.132
.6Li
quid
ityLi
quid
ass
ets
to to
tal a
sset
s 2/
68.5
53.0
63.2
59.6
39.1
54.2
51.5
40.8
47.9
41.8
37.6
40.3
25.7
35.3
27.5
Liqu
id a
sset
s to
sho
rt-te
rm li
abili
ties
3/89
.877
.384
.776
.751
.869
.863
.451
.858
.851
.047
.649
.231
.243
.333
.2
Enco
urag
ed In
dica
tors
4/
Dep
osit-
taki
ng in
stitu
tions
Cap
ital t
o as
sets
14.6
17.9
15.4
14.1
18.8
15.2
12.6
17.1
13.6
12.1
15.1
12.8
13.0
14.1
13.2
Trad
ing
inco
me
to to
tal i
ncom
e-
--
--
--
--
--
-2.
47.
73.
5Pe
rson
nel e
xpen
ses
to n
onin
tere
st e
xpen
ses
45.1
35.5
41.3
45.1
37.1
41.7
40.6
39.4
39.3
39.4
39.5
38.7
37.8
39.6
37.6
Spre
ad b
etw
een
refe
renc
e le
ndin
g an
d de
posi
t rat
e in
leva
--
9.2
--
8.9
--
9.8
--
7.0
--
6.4
Spre
ad b
etw
een
refe
renc
e le
ndin
g an
d de
posi
t rat
e in
eur
o-
-5.
9-
-8.
3-
-5.
8-
-7.
2-
-4.
7C
usto
mer
dep
osits
to to
tal (
non-
inte
rban
k) lo
ans
249.
412
4.6
194.
625
5.0
103.
118
7.4
241.
413
3.0
191.
717
3.7
132.
415
7.2
71.4
91.1
77.4
Fore
ign
curre
ncy
deno
min
ated
loan
s to
tota
l loa
ns14
.459
.435
.119
.556
.335
.825
.854
.336
.839
.354
.843
.939
.151
.943
.6Fo
reig
n cu
rrenc
y de
nom
inat
ed li
abili
ties
to to
tal l
iabi
litie
s47
.864
.954
.051
.955
.854
.858
.055
.958
.257
.151
.256
.652
.254
.351
.7N
et o
pen
posi
tion
in e
quiti
es to
cap
ital
1.2
0.5
1.0
1.5
0.7
1.3
1.7
3.1
2.1
1.1
2.5
1.5
0.7
4.0
1.5
Sour
ces:
BN
B B
anki
ng S
uper
visi
on D
epar
tmen
t and
Cre
dit R
egis
try.
1/ O
nly
fee
and
com
mis
sion
inco
me
until
end
200
2.2/
Mar
keta
ble
asse
ts to
tota
l ass
ets,
whe
re m
arke
tabl
e as
sets
incl
ude
cash
, int
erba
nk d
eman
d de
posi
ts, i
nter
bank
tim
e de
posi
ts w
ith le
ss th
an 3
0 da
ys m
atur
ity, t
radi
ng a
sset
s, re
pos
and
excl
ude
pled
ged
asse
ts a
nd c
lass
ified
ban
k cl
aim
s.3/
Mar
keta
ble
asse
ts to
attr
acte
d fu
nd, w
here
attr
acte
d fu
nds
are
tota
l lia
bilit
ies
min
us tr
adin
g lia
bilit
ies,
hed
ging
der
ivat
ives
, off-
bala
nce
shee
ts p
rovis
ions
and
"oth
er" l
iabi
litie
s).
4/ N
o ca
pita
l for
bra
nche
s.
2003
2001
2002
1999
2000

- 65 -
quality is significantly worse in the medium and small banks (where 12 percent of loans are classified) than in the Group I banks and three largest banks, where classified loans represent, respectively, 6 percent and less than 1 percent of their loan portfolio. Large exposures remain well below the prudential limits and the BSD monitors their development closely, with a particular focus on the quality of loans above BGN 1 million and BGN 20 million. At the system’s level, there does not seem to be excessive overexposure to particular economic sectors or foreign currency. The sectoral composition of loans appears to be well diversified and the currency composition of bank lending is shifting slowly toward the domestic currency (Tables 5a and 5b).41
94. This relatively favorable risk assessment reflects partly banks’ sound credit screening and risk management practices and the BSD’s strict and efficient supervisory framework. As was noted in the FSAP report, in some areas the regulatory framework applies relatively stricter standards than those of many other countries, as in the case of provisioning and loan classification. Furthermore, the BSD has recently strengthened its monitoring, with more frequent full and targeted on-site inspections, new reporting requirements for the most aggressive lenders, and in-depth monthly off-site analysis of the risk profiles of these higher-risk banks.
95. Nevertheless, credit developments need to be monitored closely. Asset quality is a backward-looking indicator that does not provide early warning signals for the emergence of potential problems. The transmission mechanism between loan growth and loan quality tends to be particularly slow when credit expands rapidly, as is the case in Bulgaria, often creating a false sense of optimism regarding the soundness of banks’ loan portfolio. Furthermore, credit expansion was strongest in new markets, such as consumer and mortgage lending (Table 6). If sustained, these developments could give rise to new sources of vulnerabilities.
Foreign exchange risk
96. The foreign exchange risk remains low but could rise if the envisaged liquidity-reducing measures were to induce capital inflows. The total net open currency position of the banking system is short (6 percent), at a level which remains well within the limits of sound prudential requirements (Table 7). The prudential limit on net open foreign currency positions, however, excludes euro positions.42 This exclusion may have seemed reasonable
41 According to the BNB credit registry, which currently includes all loans above BGN 10,000.
42 At end-2003, for example, 11 (6) banks had net long (short) positions in euro in excess of prudential limits.
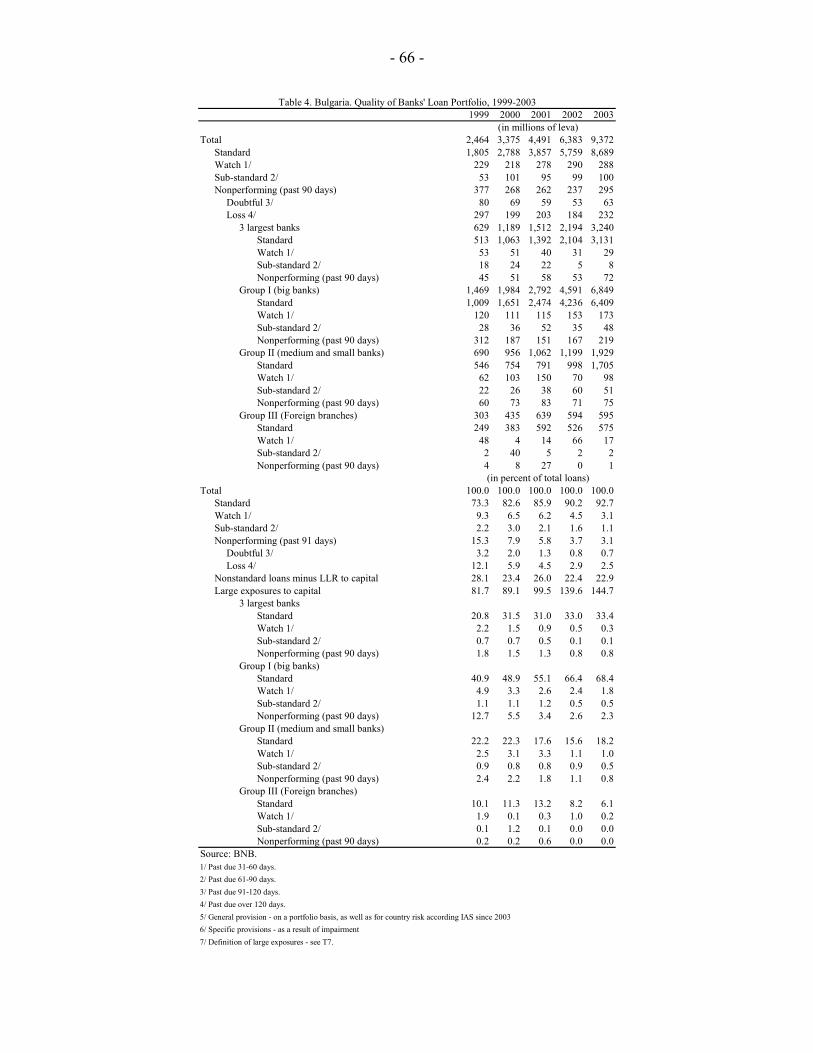
- 66 -
1999 2000 2001 2002 2003
Total 2,464 3,375 4,491 6,383 9,372Standard 1,805 2,788 3,857 5,759 8,689Watch 1/ 229 218 278 290 288Sub-standard 2/ 53 101 95 99 100Nonperforming (past 90 days) 377 268 262 237 295
Doubtful 3/ 80 69 59 53 63Loss 4/ 297 199 203 184 232
3 largest banks 629 1,189 1,512 2,194 3,240Standard 513 1,063 1,392 2,104 3,131Watch 1/ 53 51 40 31 29Sub-standard 2/ 18 24 22 5 8Nonperforming (past 90 days) 45 51 58 53 72
Group I (big banks) 1,469 1,984 2,792 4,591 6,849Standard 1,009 1,651 2,474 4,236 6,409Watch 1/ 120 111 115 153 173Sub-standard 2/ 28 36 52 35 48Nonperforming (past 90 days) 312 187 151 167 219
Group II (medium and small banks) 690 956 1,062 1,199 1,929Standard 546 754 791 998 1,705Watch 1/ 62 103 150 70 98Sub-standard 2/ 22 26 38 60 51Nonperforming (past 90 days) 60 73 83 71 75
Group III (Foreign branches) 303 435 639 594 595Standard 249 383 592 526 575Watch 1/ 48 4 14 66 17Sub-standard 2/ 2 40 5 2 2Nonperforming (past 90 days) 4 8 27 0 1
Total 100.0 100.0 100.0 100.0 100.0Standard 73.3 82.6 85.9 90.2 92.7Watch 1/ 9.3 6.5 6.2 4.5 3.1Sub-standard 2/ 2.2 3.0 2.1 1.6 1.1Nonperforming (past 91 days) 15.3 7.9 5.8 3.7 3.1
Doubtful 3/ 3.2 2.0 1.3 0.8 0.7Loss 4/ 12.1 5.9 4.5 2.9 2.5
Nonstandard loans minus LLR to capital 28.1 23.4 26.0 22.4 22.9Large exposures to capital 81.7 89.1 99.5 139.6 144.7
3 largest banksStandard 20.8 31.5 31.0 33.0 33.4Watch 1/ 2.2 1.5 0.9 0.5 0.3Sub-standard 2/ 0.7 0.7 0.5 0.1 0.1Nonperforming (past 90 days) 1.8 1.5 1.3 0.8 0.8
Group I (big banks)Standard 40.9 48.9 55.1 66.4 68.4Watch 1/ 4.9 3.3 2.6 2.4 1.8Sub-standard 2/ 1.1 1.1 1.2 0.5 0.5Nonperforming (past 90 days) 12.7 5.5 3.4 2.6 2.3
Group II (medium and small banks)Standard 22.2 22.3 17.6 15.6 18.2Watch 1/ 2.5 3.1 3.3 1.1 1.0Sub-standard 2/ 0.9 0.8 0.8 0.9 0.5Nonperforming (past 90 days) 2.4 2.2 1.8 1.1 0.8
Group III (Foreign branches)Standard 10.1 11.3 13.2 8.2 6.1Watch 1/ 1.9 0.1 0.3 1.0 0.2Sub-standard 2/ 0.1 1.2 0.1 0.0 0.0Nonperforming (past 90 days) 0.2 0.2 0.6 0.0 0.0
Source: BNB.1/ Past due 31-60 days.2/ Past due 61-90 days. 3/ Past due 91-120 days.4/ Past due over 120 days.5/ General provision - on a portfolio basis, as well as for country risk according IAS since 20036/ Specific provisions - as a result of impairment7/ Definition of large exposures - see T7.
Table 4. Bulgaria. Quality of Banks' Loan Portfolio, 1999-2003
(in percent of total loans)
(in millions of leva)

- 67 -
Total Percent Total Percent Annual percent change
Consumer loans 2/ 208.3 2.1 845.6 7.3 333.23Agriculture and forestry 194.3 2.0 311.7 2.7 84.40Mining 301.0 3.1 245.0 2.1 -19.31Manufacturing 1,808.8 18.3 2,239.6 19.4 31.63Energy and energy resources 211.8 2.1 423.0 3.7 178.07Building 283.0 2.9 421.3 3.6 73.88Trade, maintenance and technical equipment 2,197.2 22.3 3,365.1 29.1 63.38Hotels and restaurants 335.1 3.4 434.3 3.8 18.05Transport, warehousing and communications 466.6 4.7 356.3 3.1 -25.40Financial intermediaries 1,861.9 18.9 544.8 4.7 -55.59Real estate 129.2 1.3 194.1 1.7 36.68State government and defense 56.7 0.6 47.2 0.4 -4.89Education 1.4 0.0 2.0 0.0 33.98Healthcare and social activities 51.5 0.5 60.5 0.5 58.11Other activities 1,683.0 17.1 2,006.8 17.3 23.91Exterritorial organizations and agencies 74.6 0.8 75.2 0.6 14.41TOTAL 9,864.5 100.0 11,572.5 100.0 32.27Source: BNB Credit Registry.
2002(in millions of leva)
Table 5a. Bulgaria. Sectoral Distribution of Commercial Banks' Loans Registered in the Credit Registry. 1/
2003
Total Percent Total Percent Annual percent change
Bulgarian Lev 4,424 44.8 6,012 52.0 46.50Euro 3,612 36.6 4,057 35.1 41.11US Dollar 1,799 18.2 1,461 12.6 -21.20Swiss Francs 13 0.1 13 0.1 -59.22British Pound 16 0.2 30 0.3 103.84TOTAL 9,864 100.0 11,572 100.0 32.27Source: BNB Credit Registry.1/ All loans above 10,000 leva are to be registered in the Credit Registry.2/ Information from banks on consumer loans (less than 10,000 leva).
20032002
Table 5b. Bulgaria. Currency Breakdown of Commercial Banks' Loans Registered in the Credit Registry 1/(in millions of leva)

- 68 -
1999 2000 2001 2002 2003
By maturity 2,819 3,289 4,375 6,251 9,200up to 1 year 1,157 1,202 1,516 2,046 2,374
of which : in foreign currency 501 419 563 782 1,074over 1 year up to 5 years 2/ 3/ 1,331 1,636 2,218 3,173 5,172
of which : in foreign currency 502 567 723 1,298 2,037over 5 years 331 451 641 1,032 1,654
of which : in foreign currency 125 194 289 561 873By borrower type 2,820 3,287 4,375 6,251 9,200
of which : in foreign currency 1,128 1,180 1,575 2,641 3,984Nonfinancial corporations 2,281 2,645 3,389 4,774 6,575
of which : in foreign currency 1,107 1,140 1,485 2,472 3,639Nonbank financial corporations 4/ 17 24 52 92 123
of which : in foreign currency 14 21 44 70 122Households 4/ 522 618 934 1,385 2,497
of which : in foreign currency 8 20 46 100 218By sector 2,818 3,285 4,368 6,229 9,121
Commercial loans 5/ 2,297 2,670 3,441 4,866 6,698Consumer loans 427 471 684 960 1,675Housing mortgage to households 84 106 154 233 399Other loans 10 38 89 170 349
In foreign currency 40.0 35.9 36.0 42.2 43.3By maturity 100.0 100.0 100.0 100.0 100.0
up to 1 year 41.0 36.5 34.7 32.7 25.8over 1 year up to 5 years 2/ 3/ 47.2 49.7 50.7 50.8 56.2over 5 years 11.7 13.7 14.7 16.5 18.0
By borrower typeNonfinancial corporations 80.9 80.5 77.5 76.4 71.5Nonbank financial corporations 4/ 0.6 0.7 1.2 1.5 1.3Households 4/ 18.5 18.8 21.3 22.2 27.1
By sectorCommercial loans 5/ 81.5 81.3 78.8 78.1 73.4Consumer loans 15.2 14.3 15.7 15.4 18.4Housing mortgage to households 3.0 3.2 3.5 3.7 4.4Other loans 0.4 1.2 2.0 2.7 3.8
By maturity 16.6 33.1 42.9 47.2up to 1 year 3.9 26.1 35.0 16.0over 1 year up to 5 years 2/ 3/ 22.9 35.6 43.1 63.0over 5 years 0.6 0.5 0.9 0.6
By borrower typeNonfinancial corporations 16.0 28.1 40.9 37.7Nonbank financial corporations 4/ 41.2 116.7 76.9 33.7Households 4/ 18.4 51.1 48.3 80.3
By sectorCommercial loans 5/ 16.2 28.9 41.4 37.6Consumer loans 10.3 45.2 40.4 74.5Housing mortgage to households 26.2 45.3 51.3 71.2Other loans 280.0 134.2 91.0 105.3
Memorandum items:Deposits of nonfinancial private sector 5,129 6,063 8,162 9,369 11,132Credit to deposit ratio 55.0 54.2 53.6 66.7 82.6Deposit to asset ratio 62.7 62.0 66.8 64.4 64.3Credit to asset ratio 34.4 33.7 35.8 42.9 53.1Total domestic credit 6/ 5,094 5,329 7,003 9,768 13,134
in percent of GDP 14.7 19.3 26.7Source: BNB.1/ Data obtained from banks' analytical accounts including loans to non-bank financial corporations, nonfinancial corporations and households.2/ Includes all long-term credits which are overdue.3/ For 1999-2002 repurchase agreements are part of credits. Starting January 2003, repos reported in separate 'Repurchase agreements' item.4/ For 1999-2002, NPISHs were included in households.5/ Includes all loans to nonfinancial corporations and nonbank financial corporations.6/ Includes loans to general government, commercial banks, nonfinancial corporations, nonbank financial corporations, households and NPISHs.
(In millions of leva, unless otherwise indicated)
Table 6. Bulgaria. Commercial Banks' Credit Structure, 1999-2003. 1/
(Annual percent growth)
(In percent of total credit)
(In millions of leva)

- 69 -
R
equi
red
Tota
lG
roup
1G
roup
IIG
roup
III
Ope
n fo
reig
n cu
rren
cy p
ositi
ons o
f ban
ks 1
/
Net
ope
n po
sitio
nup
to 3
0-5
.82
-5.8
7-1
.86
-
Ope
n po
sitio
n in
any
par
ticul
ar c
urre
ncy
up to
15
--
--
Big
exp
osur
es o
f com
mer
cial
ban
ks 2
/
Expo
sure
to o
ne p
erso
nup
to 2
5-
-
Tota
l big
exp
osur
esup
to 8
0094
.69
77.7
714
8.32
-C
apita
l ade
quac
y of
ban
ks 3
/
Tota
l cap
ital a
dequ
acy
ratio
min
12
22.9
722
.64
24.1
1-
Pr
imar
y ca
pita
l ade
quac
y ra
tiom
in 6
15.5
914
.46
19.4
2-
A
sset
s cov
erag
e ra
tiom
in 6
13.4
112
.92
15.2
3-
M
inim
um e
quity
cap
ital b
ase
at a
ny ti
me
min
10
mln
.In
vest
men
t in
fixed
tang
ible
ass
ets 4
/
Inve
stm
ent i
n fix
ed ta
ngib
le a
sset
sm
ax. 5
026
.83
27.7
24-
In
vest
men
t in
fixed
tang
ible
ass
ets p
lus s
take
s in
nonb
anks
max
.100
28.7
428
.78
28.6
1-
Con
nect
ed le
ndin
g 5/
Lo
ans t
o co
nnec
ted
pers
ons
up to
10
--
--
Lo
ans t
o em
ploy
ees
up to
3-
--
-Li
quid
ity o
f com
mer
cial
ban
ks 6
/-
25.4
825
.72
27.7
714
.19
Hig
h liq
uidi
ty a
sset
ratio
s (sh
are
of d
epos
its) 7
/
Prim
ary
liqui
dity
8/
-11
.98
11.3
515
.08
10.2
3
Seco
ndar
y liq
uidi
ty 9
/-
25.4
825
.72
27.7
714
.19
Sour
ce: B
NB
1/ R
egul
atio
n 4
of B
NB
. In
perc
ent o
f cap
ital b
ase.
Exc
ludi
ng fo
reig
n ex
chan
ge p
ositi
on in
eur
os.
2/ R
egul
atio
n 7
of B
NB
. In
perc
ent o
f cap
ital b
ase.
3/ R
egul
atio
n 8
of B
NB
. In
perc
ent o
f cap
ital b
ase.
4/ A
rticl
e 30
of B
anki
ng L
aw. I
n pe
rcen
t of e
quity
bas
e. R
epor
ting
requ
irem
ent i
nclu
ded
in R
eg. 7
.5/
Arti
cle
47 o
f Ban
king
Law
. In
perc
ent o
f cap
ital b
ase.
Rep
ortin
g re
quire
men
t inc
lude
d in
Reg
. 7.
6/ R
egul
atio
n 11
of B
NB
. No
requ
ired
liqui
d as
sets
to to
tal a
sset
s rat
io. O
nly
deta
iled
repo
rting
requ
irem
ents
.7/
As s
hare
of d
epos
its. T
hese
indi
cato
rs a
re p
art o
f gov
ernm
ent s
ecur
ities
prim
ary
deal
er se
lect
ion
mec
hani
sm (2
3 ou
t of 3
5 ba
nks a
s of M
arch
200
4).
8/ C
ash
/ tot
al a
ttrac
ted
fund
s, w
here
tota
l attr
acte
d fu
nds i
nclu
de to
tal l
iabi
litie
s min
us tr
adin
g lia
bilit
ies,
hedg
ing
deriv
ativ
es a
nd o
ff-b
alan
ce sh
eet p
rovi
sion
s.9/
Liq
uid
asse
ts /
tota
l attr
acte
d fu
nds,
whe
re li
quid
ass
ets i
nclu
de c
ash,
inte
rban
k de
man
d de
posi
ts, i
nter
bank
tim
e de
posi
ts w
ith m
atur
ity le
ss th
an 3
0 da
ys,
tradi
ng a
sset
s, re
pos a
nd e
xclu
de p
ledg
ed a
sset
s and
cla
ssifi
ed b
ank
clai
ms.
Act
ual
Tabl
e 7.
Bul
garia
. Pru
dent
ial R
atio
Req
uire
men
ts, D
ecem
ber 2
003
(In
perc
ent u
nles
s spe
cifie
d ot
herw
ise)

- 70 -
so far, given that the system has been enjoying a comfortable long position in euros. But if banks are to sustain further credit growth, as they are planning to do, they will need to attract new resources, including from abroad. With the exclusion of euro positions from the prudential open foreign currency position limit, it is possible that they will try to fulfill their liquidity demand disproportionately with euro-denominated borrowing. It is important that the BSD monitors these developments closely.
Interest rate risk
97. Interest rate risk remains moderate, although it is likely to increase somewhat with the observed maturity lengthening of banks’ balance sheets and limited shift to fixed interest rate contracts. These developments are largely related to banks’ increasing desire to provide longer-term mortgage lending to households. At present, however, the risks are well contained as these developments remain limited in magnitude.
Liquidity risk
98. The system’s exposure to liquidity risk remains low but could rise slightly with the introduction of new credit products, which may change the maturity structure of banks’ balance sheets. Currently, the BSD does not require banks to satisfy a particular liquid asset ratio, although it monitors closely banks’ liquidity positions through a detailed reporting system. This may have been satisfactory practice so far, given that banks enjoyed ample liquidity and were able to fund their short-term lending activities with their short-term (but stable) deposit base. But as banks are increasingly extending longer-term credit, their balance sheets are likely to exhibit a widening maturity mismatch, which will need to be monitored closely and, if necessary, regulated.
99. Some liquidity indicators suggest that the recent credit boom has been reducing slowly banks’ excess loanable funds (Table 8). The credit to deposit ratio, for example, rose by almost 30 percentage points in three years, reaching 83 percent at end-2003. Similarly, banks’ net foreign asset position fell from 31 percent of total assets at end-2001 to 8 percent at end-2003, where it seems to have stabilized in early 2004, suggesting that banks have little room to further fund their planned credit expansion by drawing down their deposits held abroad. As domestic deposit growth is not likely to expand much beyond the current 20 percent as of end-2003 (Table 9), banks will need to adopt new funding strategies, including borrowing from abroad. One possible strategy, especially for longer-term credit, is to issue mortgage bonds.43 So far, only a few such mortgage bond issuances has taken place
43 In 2001, a special mortgage law was passed to establish the regulatory framework for the securitization of (highly collateralized) mortgage loans through special purpose vehicles (SPVs).

- 71 -
1998 1999 2000 2001 2002 2003 2004Dec. Dec. Dec. Dec. Dec. Dec. Jan.
Net foreign assets 2,247.4 2,570.0 3,534.7 3,968.5 2,909.5 1,504.3 1,886.5Cash 92.8 162.4 131.6 409.4 185.0 238.7 203.2Net deposits 2,075.9 2,180.6 3,207.6 3,184.3 2,209.1 878.5 1,166.6Net credits 14.6 -71.8 -146.6 -219.4 -221.8 -406.3 -380.7Securities other than shares 60.8 297.5 341.1 594.0 737.0 807.0 911.3Shares and other equity 3.3 1.2 0.9 0.3 0.3 2.5 2.2Debt securities issued 0.0 0.0 0.0 0.0 0.0 -16.1 -16.1
Reserves 643.8 745.3 598.1 864.4 1,071.2 1,388.2 897.7Total domestic credit 1/ 2,322.7 2,821.6 3,290.4 4,380.0 6,259.2 9,327.8 9,570.0Total assets 8,310.3 8,858.7 10,362.0 12,852.7 15,155.9 18,097.8 18,289.0Total deposits 2/ 4,482.3 4,999.0 5,914.4 8,026.0 9,234.4 10,708.2 10,859.4Total liabilities 8,310.3 8,858.7 10,362.0 12,852.7 15,155.9 18,097.8 18,289.0
Net foreign assets (NFA) 14.4 37.5 12.3 -26.7 -48.3 -Cash 75.1 -19.0 211.0 -54.8 29.0 -Net deposits 5.0 47.1 -0.7 -30.6 -60.2 -Net credits -590.6 104.2 49.7 1.1 83.1 -Securities other than shares 389.0 14.6 74.2 24.1 9.5 -Shares and other equity -64.1 -24.1 -68.9 -3.9 838.7 -Debt securities issued - - - - - -
Reserves 15.8 -19.8 44.5 23.9 29.6 -Total domestic credit 1/ 21.5 16.6 33.1 42.9 49.0 -Total assets 6.6 17.0 24.0 17.9 19.4 -Total deposits 11.5 18.3 35.7 15.1 16.0 -Total liabilities 6.6 17.0 24.0 17.9 19.4 -
Memorandum items:NFA (in percent of total assets) 27.0 29.0 34.1 30.9 19.2 8.3 10.3Foreign currency domestic credit (in percent of domestic credit) 39.2 40.0 35.9 36.0 42.2 43.4 44.1Foreign currency deposits (in percent of total deposits) 52.5 52.0 53.7 56.7 53.3 49.9 50.9Domestic credit to total assets 27.9 31.9 31.8 34.1 41.3 51.5 52.3Domestic credit to total deposits 51.8 56.4 55.6 54.6 67.8 87.1 88.1Source: BNB.1/ Excluding interbank credits.2/ Excluding interbank deposits.
Table 8. Bulgaria. Loanable Resources of Commercial Banks, 1999-2003
(In annual percentage change)
(In millions of leva unless specified otherwise)

- 72 -
1999 2000 2001 2002 2003Est.
Total deposits 6,252 7,457 9,943 11,684 14,065of which : foreign-currency 3,488 4,190 5,822 6,618 7,472
Owners of deposits 6,252 7,457 9,943 11,684 14,064Residents 5,918 6,910 9,246 10,790 12,625
Financial institutions 367 459 547 750 568General government 322 313 457 580 927Nonfinancial corporations 2,169 2,337 2,905 3,410 3,884Financial corporations 61 141 203 237 312Households 2/ 2,899 3,585 5,054 5,722 6,840NPISHs 96
Nonresidents 334 547 697 894 1,439of which : EU residents - - - - 572
Type of deposits 6,253 7,457 9,943 11,683 14,065Overnight deposits 2,037 2,386 2,997 3,464 4,361Deposits redeemable at notice, up to 3 months 816 961 1,250 1,398 1,647Deposits with agreed maturity, up to 2 years 3/ 3,311 3,909 5,405 6,424 7,371Deposits with agreed maturity, over 2 years 3/ 89 201 291 397 686
Total deposits 19.3 33.3 17.5 20.4of which : foreign-currency 20.1 38.9 13.7 12.9Owners of deposits
Residents 9.9 23.4 15.4 18.4Financial institutions 25.1 19.2 37.1 -24.3General government -2.8 46.0 26.9 59.8Nonfinancial corporations 7.7 24.3 17.4 13.9Financial corporations 131.1 44.0 16.7 31.6Households 2/ 23.7 41.0 13.2 19.5
Nonresidents 63.8 27.4 28.3 61.0Type of deposits
Overnight deposits 17.1 25.6 15.6 25.9Deposits redeemable at notice, up to 3 months 17.8 30.1 11.8 17.8Deposits with agreed maturity, up to 2 years 3/ 18.1 38.3 18.9 14.7Deposits with agreed maturity, over 2 years 3/ 125.8 44.8 36.4 72.8
Total depositsof which : foreign-currency 55.8 56.2 58.6 56.6 53.1Owners of deposits
Residents 94.7 92.7 93.0 92.3 89.8Financial institutions 5.9 6.2 5.5 6.4 4.0General government 5.2 4.2 4.6 5.0 6.6Nonfinancial corporations 34.7 31.3 29.2 29.2 27.6Financial corporations 13.2 11.6 8.0 7.5 6.3Households 2/ 46.4 48.1 50.8 49.0 48.6NPISHs 0.0 0.0 0.0 0.0 0.7
Nonresidents 5.3 7.3 7.0 7.7 10.2Type of deposits
Overnight deposits 32.6 32.0 30.1 29.6 31.0Deposits redeemable at notice, up to 3 months 13.0 12.9 12.6 12.0 11.7Deposits with agreed maturity, up to 2 years 3/ 53.0 52.4 54.4 55.0 52.4Deposits with agreed maturity, over 2 years 3/ 1.4 2.7 2.9 3.4 4.9
Source: BNB.1) Data are obtained from commercial banks' analytical accounts.2) For 1999-2002 NPISHs are included in households.3) Includes time deposits, restricted deposits (deposits, withdrawals of which are restricted on the basis of legal, regulatory, commercial or other requirements) and credits received.
Table 9. Bulgaria. Deposit Structure, 1999-2003 1/
(Annual percent growth)
(In percent of total deposits)
(In millions of leva)

- 73 -
and for an insignificant amount. According to the BSD, six banks have organized a total of 11 such issues, for an amount equivalent to BGN 118 million, or 7 percent of banks’ total investment portfolio. The typical maturity of these bonds is three years and over half of the amount issued was denominated in euros. The authorities will need to monitor closely these developments, including the structure of banks’ balance sheets.
Market risk
100. Market risk remains limited as banks’ investment portfolio is dominated by government and first grade foreign securities (representing 72 percent of total investment). Banks do not conduct off-balance sheet financial operations for hedging purposes, such as swaps or derivatives. In the case of foreign-owned banks, these activities are often strictly limited by their parent companies, which prefer to conduct their more complex risk management activities (such as VAR models) from their headquarters. Most of banks’ off-balance sheet operations consist of traditional activities, such as credit substitutes and other commitments, which accounted for almost 20 percent of banks’ total assets at end-2003.
101. In line with new EU regulations, the BSD is planning to develop its ability to assess banks’ sensitivity to market risk. In particular, it plans to hire additional staff with special market risk expertise and improve the quality of information collected from banks on this topic. Consistent with FSAP recommendations, the BSD has already hired one additional information technology (IT) specialist to assess banks’ IT-based risk management framework and, more broadly, monitor the soundness of IT developments in Bulgaria’s banking environment. However, given the scope and importance of this task, the BSD may need to hire additional staff.
BSD’s stress test results
102. Stress test results confirm the overall soundness of the banking sector. The BSD conducts stress tests on individual institutions and the banking sector as a whole on a quarterly basis. The tests are based on the methodology that was applied to the FSAP stress testing exercise and that calibrates shocks equivalent to those experienced during the 1996–97 banking crisis. Overall, the stress test results are consistent with the risk analysis presented above. According to the BSD simulations, a credit shock equivalent to reclassifying 5 percent of standard loans, 30 percent of watch loans, and 50 percent of substandard loans into loss loans would make two banks insolvent and reduce the capital adequacy ratio of four banks below the standard eight percent limit. Overall, however, the system would be able to absorb the shock, as its capital adequacy ratio would fall by 6 percentage points to 16 percent, still well above the international capital adequacy ratio lower limit of 8 percent. In fact, the credit shock would need to be at least twice as large as the one experienced in 1996–97 to threaten the stability of the banking system. Banks’ exposure to interest rate risk is smaller than that for credit risk, although it would threaten the soundness of one bank and weaken the financial

- 74 -
standing of two more banks.44 These results suggest that overall banks are able to weather significant changes in interest rate changes without becoming inadequately capitalized. Banks’ exposure to foreign exchange risk remains negligible. A foreign exchange shock equivalent to a one-day 60 percent change in the banks’ net open foreign exchange position would reduce the system’s capital adequacy ratio by less than one percent.
Compliance with supervisory requirements
103. In 2003, there were isolated cases of deviations from the prudential requirements, in particular with respect to large single exposures (one case) and investment in fixed assets (one case). Other cases of violations were related to inappropriate classification and provisioning of classified loans and large exposures. These non-compliance cases were promptly addressed and did not threaten the stability of the system. Prudential requirements and their actual levels at end-2003 are presented in Table 7.
Supervisory response to credit growth
104. The authorities’ credit reducing strategy will help ensure the soundness of banks’ balance sheets but may not prove effective in reducing the speed of credit expansion, at least not to the targeted levels. In view of recent rapid credit growth expansion, the BSD has launched a stepwise supervisory strategy to slow down credit growth to a range between 20 and 30 percent. Overall, it is not likely that this strategy will achieve this objective. Banks continue to be highly capitalized and exhibit high profit margins and the interest rate margin between lending and deposit rates has been falling progressively, with no sign of immediate trend reversal (Figures 1 and 2). Similarly on the demand side, per capita income and enterprise profits are expected to rise, all of which point to a further sustained private sector demand for credit.
105. The strategy, which was launched in mid-2003, is composed of three phases:
Exerting moral suasion. The first phase consisted of exerting moral influence on the banking sector to reduce credit growth, largely through public statements and meetings with banks, especially those exhibiting particularly aggressive lending behavior. The BSD considerably intensified its supervisory activity by increasing the frequency of on-site inspections and conducting targeted reviews of aggressive lenders, including monthly analysis of their loan portfolios. The BSD also started to discuss banks’ medium and long-term individual credit strategies and is trying to ensure that these strategies reflect a 20 percent annual growth target. If needed, the BSD will require banks to perform their own stress tests on credit and liquidity risk and report the results to the BSD. So far, stress testing has been conducted in-house at the BSD.
44 This test is based on a 192 percent daily variation in the interest rate in lev, 2 percent variation in euro and U.S. dollar interest rates, and 5 percent variation in interest rates on other foreign currencies.

- 75 -
Figure 1. Bulgaria. Interest Rate Spread in Euros, 1999–2003 1/
2.00
4.00
6.00
8.00
10.00
12.00
Dec
-98
Jun-
99
Dec
-99
Jun-
00
Dec
-00
Jun-
01
Dec
-01
Jun-
02
Dec
-02
Jun-
03
Dec
-03
Time
In p
erce
nt
In EUR
1/ Short-term lending rate minus time deposit rate.
Figure 2. Bulgaria. Interest Rate Spread in Leva, 1999–2003 1/
4.00
6.00
8.00
10.00
12.00
Dec
-98
Jun-
99
Dec
-99
Jun-
00
Dec
-00
Jun-
01
Dec
-01
Jun-
02
Dec
-02
Jun-
03
Dec
-03
Time
In p
erce
nt
In BGN
1/ Short-term lending rate minus time deposit rate.
- 76 -
• Implementing direct supervisory measures. As credit growth has not yet shown signs of significant deceleration, the authorities have started to implement the second phase of their strategy, which is based on three direct measures:
Tightening provisioning requirements on classified loans. On April 1, 2004, the BNB raised provisioning requirements for: (i) loans overdue by 61-90 days (“substandard” loans) from 30 percent to 50 percent; and (ii) loans overdue by 91 to 120 days (“doubtful” loans) from 75 percent to 100 percent, bringing them in line with “loss” loans (overdue over 121 days). While these rules are stricter than those applied in many other countries, their impact on banks’ capital adequacy may not be significant. Banks tend to overprovision the first category of classified loans (past 30 days), which reduces the impact of higher provisioning requirements, and doubtful loans (for which provisioning requirement was raised from 75 percent to 100 percent) represent less than 1 percent of total loans. According to BSD simulations, these two measures would require a 12 percent increase in provisioning, or the equivalent of 13 percent of end-2003 net profits, which many banks will be able to satisfy without significantly affecting their lending capacity.
Strengthening information on retail lending conditions, including on the overall bank indebtedness of particular households. As of June 2004, the BSD credit registry will register all loans, including retail loans, which were exempted so far under the minimum BGN 10,000 registration limit. In addition, an upgrade of the system will be completed, allowing for easier on-line information access by banks. These measures will greatly help reduce information asymmetries between creditors and debtors, especially regarding the overall indebtedness of a borrower and the soundness of pledged collateral. In particular, the new system will allow banks to determine whether a particular borrower has several outstanding loans across different banks and whether the same collateral or guarantee is used for different contracts. However, it is not clear whether more information on debtors will help raise or reduce credit growth, as banks will be able to make more informed decisions before allocating credit.
Introducing stricter treatment of profit for the calculation of own capital in line with EU regulation (EU/2000/12). In June 2004, banks will be able to include their current profits in their capital base only after auditors’ verification and net of any taxes and dividends that are to be distributed at the end of the year. The BSD simulated the worse-case impact of this measure by excluding the entire current profits from bank’s capital base, which is a much stronger measure than the actual one. According to these simulations, the new profit treatment would reduce the system’s total capital adequacy ratio from 22 percent to 19 percent and bring the

- 77 -
capital adequacy ratio of four banks under the 12 percent prudential limit. Two of these banks, however, have already raised their capital.45
• Introducing credit ceilings. If further tightening is needed, the authorities are willing
to introduce credit ceilings, either on the level or rate of increase of credit, and/or a liquid asset ratio. At present, however, the authorities have not formalized the exact condition under which these measures would be implemented and if so, the form they would take. Instead they are trying to reduce credit growth by tightening reserve requirements and shifting government deposits from commercial banks to the BNB.46
Recommendations
106. The authorities’ envisaged liquidity management measures should be combined with appropriate prudential controls. Overall, there appears to be little immediate threat to the stability of the financial system. Nevertheless, external risks have intensified: the current account deficit has continued to widen and the rapid growth in lending shows no sign of abatement. In an effort to address these risks and dampen credit growth, the authorities have decided to implement a number of liquidity-absorbing measures (see Chapter I of this volume).
107. Typically, stricter prudential measures are not effective in closely controlling the volume of credit, as opposed to ensuring its quality. In the present context, however, any measures that tighten domestic liquidity may induce two new types of risks, both of which could weaken the soundness of Bulgaria’s financial sector: (i) they will raise interbank rates, which, in the context of Bulgaria’s open capital account regime, may induce foreign capital inflows; and (ii) they may encourage banks to shift their credit activities out of the banking system into the nonbank financial sector, a sector that is much less regulated and exhibits a significantly weaker supervisory capacity.47 The latter trend is already emerging and could be accelerated, e.g., with banks starting to acquire leasing companies (Box 1).
45 Some intergovernmental agencies, such as the EBRD, have granted foreign credit lines conditional on a minimum capital adequacy ratio of 15 percent, requiring some banks to maintain a higher than required capital adequacy ratio.
46 See Chapter I of this volume and discussion in Staff Report for the 2004 Article IV Consultation.
47 In addition, imposing stricter prudential measures may raise moral hazard, if they take away banks’ incentives to manage their own risks appropriately and imply some sort of guarantee from the authorities if problems were to arise subsequently.

- 78 -
Box 1. Monitoring Leasing Activities From a financial stability perspective, leasing activities represent an additional channel through which credit can be provided to the private sector. Currently, however, it is not possible to assess the overall impact of leasing activities on Bulgaria’s financial system. Leasing companies are neither regulated (beyond the Commercial Code) nor supervised and are not subject to special reporting requirements. This is particularly worrisome as banks may respond to further credit tightening by shifting their traditionally bank-based credit activities toward (nonbank) leasing activities. Thus, it is important for the authorities to be able to monitor developments in this area, at least to the extent that they are relevant to the analysis of growth and the overall indebtedness of the private sector. Banks are starting to create and/or acquire shares in leasing companies. At end-2003, leasing activities were believed to represent only an insignificant share of total bank lending (less than 1 percent). But this number includes only the leasing activities of banks that have acquired a significant equity participation (more than 10 percent) in a leasing company or conduct leasing activities directly.1/ As long as banks keep their equity participation below 10 percent, they do not have to report their activities on a consolidated basis to the BNB, in which case their leasing activities go unreported. In practice, banks do not have to acquire or invest directly in a leasing company to shift credit activities to the nonbank financial sector; they could design formal or informal partnerships with leasing companies, allowing them to refer their customers to a particular leasing company in return for a given profit-sharing or fee. The need to account for leasing activities was already noted in the FSAP report. In line with FSAP recommendations, the authorities have taken a few steps but more needs to be done. The BNB, which has the right to inspect any company if there is a suspicion that this company may be engaging in banking activities, has conducted a few focused inspections in leasing companies to review the types of contracts offered and any suspicious money laundering or tax-related transactions. Some of these leasing companies were found to charge excessively high interest rates and there is a draft proposal to amend the consumer protection law in this regard, possibly introducing a maximum consumer interest rate, in line with EU regulations. This type of activities, however, represents only a very small share of total leasing activities and the authorities’ ability to monitor leasing activities remains very limited. __________________ 1/ If a bank acquires more than 10 percent of a leasing company (or any other entity), standard prudential requirements for significant equity participation apply, such as capital deductions, connected lending, consolidated disclosure, etc., in line with international best practices and EU directives.
108. To mitigate the prudential risks associated with capital inflows, the authorities may wish to monitor closely developments in the maturity and currency structure of banks’ balance sheets. If necessary, the authorities may wish to consider requiring banks to balance the currency denomination between their liquid assets and liabilities.
109. To monitor credit developments on a system-wide basis, the authorities may wish to collect reliable data on corporate and consumer indebtedness. Presently, the authorities do not have adequate tools to monitor credit activities across banks and nonbank financial institutions. Yet, the expansion in consumer credit could become a major source of concern if borrowers were unable to service their loans, as this could spark a system-wide banking crisis and problems with external debt service. The upgrade of BNB’s credit registry will help reduce information asymmetries, particularly in the case of bank-based consumer lending. The emergence of private credit bureaus, which intend to provide consumer credit reports by end-2005, is another welcome development that will further help raise the level of transparency on consumers’ creditworthiness and thereby help banks make their credit allocation decisions. It is important to monitor how the envisaged liquidity reducing measures affect not only the volume of credit in the banking sector but also its composition across the

- 79 -
banking and nonbank financial sectors. For this, the authorities should compute and monitor indicators that assess household indebtedness (e.g., household debt to GDP, household debt service and principal payment to income, real estate price index) and corporate indebtedness (e.g., debt to equity, return on equity, earnings to interest and principal expenses). These indicators should encompass credit activities of banks, nonbanks and leasing companies.
110. Some countries facing similar high consumer credit growth patterns have introduced a debt-service to income ratio ceiling in their consumer credit law. 48 This idea is to control credit growth by putting an upper limit on consumers’ ability to borrow, regardless of the type of credit, rather than restricting particular market participants, such as banks, to extend credit, as this may only induce them to redirect their credit activities to the nonbank financial sector. Such ceilings, which are stated in terms of debt-service (as opposed to debt level), may be particularly effective in preventing serious cases of consumer abuse, such as certain predatory lending practices observed by the authorities, mostly in the nonbank financial sector. Their implementation, however, requires reliable information on consumer debt service and income, neither of which are readily available at present. Ultimately, their effectiveness will depend largely on the quality of the data; lenders’ ability to access this data; consumers’ ability to circumvent the ceilings; and authorities’ ability to enforce the regulation.
B. Implementation of Main FSAP Recommendations49
Financial sector surveillance framework
111. In line with FSAP recommendations, the authorities have created a Council for Financial Stability, which is composed of representatives from the Ministry of Finance and the respective bank and nonbank supervisory agencies. This Council meets on a quarterly basis and is planning to publish a Financial Stability Report, which would be a welcome initiative. The creation of this Council has facilitated inter-agency cooperation, as indicated by the signing of Memoranda of Understandings (MoUs) on important issues, such as information exchange and joint on-site inspections. Nevertheless, the Council does not provide a formal framework to monitor the soundness of the financial system on an aggregate basis.
112. The existing financial sector surveillance framework focuses primarily on safeguarding the health of individual financial institutions as opposed to the stability of the financial system as a whole. No entity seems to have the explicit mandate and resources to examine cross-sectoral linkages between the various economic sectors and assess how
48 Romania, for example, has recently amended its consumer credit law to lower the maximum debt service to income ratio of consumers from 40 percent to 30 percent.
49 The main measures taken by the authorities in response to FSAP recommendations are summarized in Appendix I.

- 80 -
developments in a particular sector may affect another sector of the financial system. For example, it remains difficult to collect the necessary information to assess how developments in, say, the corporate or real estate sector may affect the banking sector or how a tightening in the banking sector may affect the nonbank financial sector. Ultimately, the supervisory agencies should be responsible for monitoring the health of their respective supervised entities, whereas the responsibility of financial stability should be assigned to a specific entity, such as a BNB research group or another external entity. A clear division of responsibility would help differentiate between the analysis of sources of vulnerabilities that may affect the soundness of particular financial institutions and those that affect the stability of the financial system as a whole, such as macroeconomic imbalances or external shocks. Such an entity should have access to information on the various economic sectors, without necessarily receiving in-depth information on particular institutions, except maybe on the systemically important ones.
Banking Sector
Resolving problem banks
113. The authorities have introduced a new and more effective bank insolvency regime. So far, however, its implementation has remained either largely untested (no new case of bank insolvency) or slow (in the case of existing problem banks). The FSAP urged the authorities to introduce a new regulatory framework to deal with insolvent banking institutions and to resolve promptly the status of the problem banks left over from the 1996–97 banking crisis. In line with FSAP recommendations, the authorities have:
• Introduced a new bank insolvency regime. A new bank insolvency law was adopted in the Fall of 2002. This law aims at providing faster and more efficient bankruptcy proceedings against insolvent credit institutions. It also put the liquidation procedure of insolvent institutions under the control of the Deposit Insurance Fund (DIF), as a public statutory authority over the trustees in charge of liquidating the insolvent banks. The law has also set specific guidelines for the remuneration of the trustees and subjected the liquidation operations to the monthly control of the DIF. So far, however, the new insolvency law, including activation of DIF, has not been put into practice, as there has been no new bankruptcy.
• Strengthened the role of the DIF. The participation in the DIF is mandatory and banks
must contribute an annual fixed 0.5 percent of their total deposits. Once DIF’s portfolio reaches 5 percent of the banking system’s deposit base, it will be possible to amend the contribution system, possibly moving to a risk-based system. At present, the DIF portfolio contains BGN 244.2 million, or 2.3 percent of total deposits. The insurance coverage, which is currently BGN 15,000 (approx. 7,500 euros), is to be raised progressively to BGN 39,200 (approx. 20,000 euros) by the end of 2006, in line with the EU minimum deposit guarantee. To allow prompt reaction, the DIF has signed a MoU with the BNB that allows the BSD to inform the DIF of possible problems with a particular bank or group of banks.

- 81 -
• Worked toward the resolution of problem banks. Since the last FSAP, the authorities have completed successfully the bankruptcy proceedings of five insolvent banks. Two of them were acquired by the Public Receivables Agency (PRA), now transferred under the control of the DIF, and the other three banks were bought by other commercial banks. At present, there still remain four insolvent banks from the 1996–97 banking crisis. Apparently, the authorities received a few offers from commercial banks to acquire these banks at the beginning of 2004, pointing to a possible resolution in the near future.
Identifying ownership structure of banks
114. In line with FSAP recommendations, the authorities amended the banking law to raise the BSD’s ability to monitor the identity and assess the soundness of banks’ ownership structure. In line with EU regulations, banks must now report to the BSD within seven days after a shareholder has acquired (or sold) more than 3 percent of the bank’s equity. The BSD is now empowered to request additional information on the financial soundness of the new shareholders’ structure and, if necessary, apply supervisory measures to ensure full information on and quality of shareholders’ structure. It also started to conduct targeted on-site inspections in 5 banks, 8 financial houses, and one joint stock company in the last quarter of 2003. The inspections were initiated because either the ownership structure was too opaque, with prevailing interests off-shore, or the financial condition of the shareholders was believed to be too weak. A process of capital restructuring and, where necessary, replacement of off-shore shareholders, was initiated.
Nonbank financial sector
115. The nonbank financial sector continues to represent a small share of Bulgaria’s financial sector assets (less than 8 percent of financial system’s assets) and is not likely to affect significantly the stability of the financial sector (Table 1). At end-2003, the nonbank financial sector was composed of 31 insurance companies (representing 4 percent of total assets); 8 pension fund companies (2.6 percent of total assets); 67 securities firms (1 percent of total assets); and a large number of small finance companies and collective investment schemes. Selected financial sector indicators of the nonbank financial sector are presented in Table 10.
116. The authorities created a single agency for nonbank financial institutions, the Financial Sector Commission (FSC). Much effort is needed to further strengthen its supervisory capacity, regulatory framework, and enforcement powers, with a particular focus on the insurance sector. The FSAP had noted significant weaknesses in the supporting legislation and supervision of the nonbank financial sector and the creation of the new agency, which has required substantive cooperation and harmonization efforts, has not necessarily helped address the identified weaknesses. There remain large differences in the quality and effectiveness of supervision across the different types of nonbank financial institutions. Currently, each of the wings continues to operate relatively independently, making it difficult to conduct effective common on-site inspections, share information on off-site examinations, and analyze developments in the nonbank financial sector on an aggregate basis.

- 82 -
117. The ownership structure of nonbank financial institutions remains opaque. Sound supervision requires a proper knowledge of the ownership structure of the supervised entities. According to the FSC, however, it remains difficult to identify and monitor the ownership structure of nonbank financial institutions. Similar to the means given and efforts undertaken by the BSD, the FSC needs to be given adequate enforcement powers and capacity to identify and assess the soundness of owners of nonbank financial institutions.
118. The authorities are working toward establishing a framework for consolidated supervision. Since 2003, Bulgaria has one financial group, whose largest shareholders are an insurance company (47 percent) and a bank (25 percent). In an attempt to supervise this group on a consolidated basis, the BNB and FSC have signed a special MoU to conduct common on-site inspections and share relevant information. The first common on-site inspection was being conducted at the time of the mission visit.
Recent developments
Insurance sector
119. The insurance sector remains very small, accounting for only 4 percent of financial sector assets. The sector is composed of 20 nonlife insurance companies and 11 life insurance companies. Approximately half of these companies have a significant foreign equity participation. Profitability in the insurance sector is low (Table 10). Insurance companies appear to conduct a relatively conservative investment strategy, with almost 50 percent of their investment portfolio invested in government securities (30 percent) and bank deposits (17 percent).
120. There seems to be limited risk transfer between the banks and insurance companies. The role of insurance companies as borrowers and lenders is very small. Based on data for the first nine months of 2003, insurance companies borrowed BGN 1.5 million from banks (less than 0.1 percent of total bank credit to the private sector) and extended BGN 11.8 million credit (less than 2 percent of total bank credit to the private sector), mostly in the form of advances against life insurance policies. Similarly, the involvement of (non-life) insurance companies in credit insurance activities is extremely limited (1.7 percent of total non-life premium income).

- 83 -
1999 2000 2001 2002 2003 Sept.
Insurance sectorNumber of companies 30 32 32 32 31
of which : majority foreign-owned 10 13 13 15 15Non-life 18 20 20 20 20Life 12 12 12 12 11
Total assets 538.0 615.7 691.0 820.0 750.1Non-life 349.7 419.2 462.3 571.9 495.9Life 188.3 196.5 228.7 248.1 254.2
Total loans 2.8 0.1 0.5 1.1 1.5Non-life 1.7 0.1 0.5 1.1 0.8Life 1.1 0.0 0.0 0.0 0.7
Assets (in percent of GDP) 2.4 2.4 2.3 2.6 -Non-life 1.5 1.6 1.6 1.8 1.4Life 0.8 0.7 0.8 0.8 0.7
Expenses 1/Non-life 501.2 661.8 761.3 868.5 518.9Life 80.6 89.1 141.4 213.8 64.6
Income 2/Non-life 47.5 664.4 769.7 887.3 528.9Life 81.5 9.4 143.7 218.9 62.8
Premium incomeNon-life 279.1 343.4 390.9 466.8 399.9Life 31.6 44.2 87.3 148.7 46.2
Life insurance penetration rate 3/ 0.1 0.2 0.3 0.5 -Pension funds
Number of funds - 9 8 8 8Total assets - 86.6 189.3 337.4 485.5
Mandatory - - - 41.7 93.7Occupational - - 51.5 95.2 131.4Voluntary - - 135.3 195.5 228.4
Assets (in percent of GDP) - 0.3 0.6 1.0 1.4Average rate of return on assets -
Mandatory - - - 14.1 11.0Occupational - - - 6.5 11.0Voluntary - - - 9.4 10.0
Number of insured persons (in thousands) -Mandatory - - - 1,164.5 1,518.4Occupational - - 145.0 155.2 161.9Voluntary - - 451.8 484.8 497.0
Securities sectorSecurities firms
Number of securities firms 76 69 65 70 67Assets of securities firms - - - - 183.6
Investment firmsNumber of investment firms 6 4 3 4 5Assets of investment firms 16.2 10.8 10.7 13.0 18.0Assets of investment firms (in percent of GDP) 0.1 0.0 0.0 0.0 0.1
Bulgarian Stock Exchange (BSE)Number of listed companies on the official market 33 46 30 31 35Number of companies admitted for trading on unofficial m 828 478 372 325 303Number of traded securities 21165 42944 70926 311800 688355Turnover on BSE 133.8 133.8 161.1 416.4 688.4Stock exchange capitalization - 1,288.3 1,112.6 1,375.2 2,722.0Stock exchange capitalization (in percent of GDP) - 4.8 4.2 4.3 7.9Stock exchange index value 4/ - 106.7 118.6 183.1 454.3
Source: FSC.1/ Total technical expenses. 2/ Total technical income.3/ The ratio of gross premium income to GDP. 4/ Base=100 on October 17, 2000.
Table 10. Bulgaria. Non-Bank Financial Sector, 1999-2003(in millions of leva unless specified otherwise)

- 84 -
121. The FSAP noted serious shortcomings in the regulatory and supervisory framework of the insurance sector. As a result, the authorities enhanced the supervisory powers of the insurance wing of the FSC. The FSC has been given the power to verify the solvency margin, equity and reserves; issue or revoke a license; and impose administrative measures in the case of prudential violations, including dismissing a member of the management board. Supervised entities need prior approval from the FSC to change the structure of their ownership and the regulatory framework for insolvent insurance companies has been strengthened, putting the trustees in charge of the liquidation under the control of the FSC. Nevertheless, it remains difficult for the FSC to assess the level of inter-company indebtedness (i.e., settlement of claims and disputes) and an effective dispute resolution mechanism should be established to help assess the financial soundness of supervised entities.
122. Many of the FSAP recommendations, however, still need to be addressed. In particular, the authorities should:
• Streamline existing insurance regulations into a single Code of Insurance and further eliminate regulatory gaps between life insurance products and voluntary pension funds.
• Strengthen prudential standards, which will need to be raised significantly before they comply with EU accession requirements, including in the areas of minimum capital requirements and provisioning levels.
• Complete the review of the fiscal regime of insurance companies and eliminate any differential tax treatments between life insurance companies and voluntary pension funds. Insurance companies are currently taxed on the basis of their net premium collected (seven percent). Last year, the insurance companies tried to align their tax structure to a standard corporate tax on profits. Given the low profitability of the sector, this proposal was rejected by Parliament. Next year, a draft proposal is to be discussed, probably on the basis of a hybrid system that would subject the insurance companies to a combination of the standard corporate tax and a tax on gross premiums collected.
• Raise the quality of insurance companies’ asset liability management, including through the development of the actuarial profession.
Pension fund sector
123. Bulgaria’s pension fund sector is very small, accounting for 2.6 percent of financial sector assets and 1.5 percent of GDP as of September 2003. The pension fund sector covers two pillars: mandatory pension funds (Pillar II), which contains both universal

- 85 -
and occupational pension funds, and voluntary pension funds (Pillar III).50 The highest expansion rate is expected with universal pension funds, which represent currently 20 percent of total pension fund assets and cover 1.5 million participants. Contribution rates are relatively low (3 percent of net income) and are to be raised to 5 percent by 2007. To prevent excessive risk-taking by individual pension fund managers, there is a minimum guaranteed rate of return for mandatory pension funds, which is set at 60 percent of the industry’s average rate of return. Occupational funds have higher contribution rates (12 percent in the case of high-risk professions and 7 percent otherwise) but insure only a limited number of employees (less then 200,000). Voluntary pension funds cover approximately 500,000 people and account for almost 50 percent of total pension fund assets. As of July 1, 2004, all voluntary policies are to be transformed into unit-linked policies. As of September 2003, the average rates of return on assets were constant at 11 percent across all three categories of pension funds.
124. In contrast to the insurance sector, most of the FSAP recommendations relative to the pension fund sector have been addressed and implemented. Most importantly, the authorities enacted a single Code of Pension Funds that merged all legislations and regulations that were previously scattered in different pieces of legislations. This new code became effective on May 1, 2004. Overall, representatives of pension fund companies seemed satisfied with the quality and coverage of the new regulatory and supervisory framework. They expressed the desire for greater investment diversification opportunities, as recommended in the FSAP report.
Securities market
125. After three years of relative stagnation, the Bulgaria Stock Exchange (BSE) grew sharply in 2003. In the first nine months of 2003, the stock exchange capitalization more than doubled, accounting for almost 8 percent of GDP, as compared to 4.3 percent at end-2002 (Table 10). During the same period, the number of traded shares more than doubled (increasing by 121 percent), whereas the turnover rose by 65 percent. The development of the BSE remains closely linked to the privatization of state-owned companies. In 2003, the BSE executed 43 privatization deals with a record turnover of BGN 300 million. This trend, however, is likely to decrease, as the privatization process comes slowly to an end.
126. The main regulatory change was the amendment of the law of public offering of securities in 2002, in line with FSAP recommendations. The new regulatory framework appears to be sound and largely in line with EU regulations; the main challenge remains in its implementation. The material changes introduced in the new law include: (i) provisions to increase capital of publicly listed companies; (ii) stricter public information disclosure
50 The mandatory pay-as-you-go Pillar I is supported by the National Social Security Institute (see Chapter III in this volume).

- 86 -
requirements; (iii) explicit regulations regarding modalities of capital increases, including prior approval by the FSC and stronger protection of minority shareholders; and (iv) greater enforcement powers of the FSC. In particular, the FSC is now empowered to take certain coercive actions regarding the content and information disclosed during a general shareholders’ meeting. It can also revoke decisions taken during a shareholders’ meeting in violation with the law. If needed, the FSC can also take judicial actions. Since the enactment of the law, the FSC has initiated several lawsuits against majority shareholders, some of which it has won. Nevertheless, weaknesses in the judicial system and the judges’ overall lack of experience in capital market issues have made court outcomes lengthy and unpredictable.
127. The authorities have also introduced a number of measures to raise corporate governance. For example, publicly listed companies are required to adopt the OECD International Standards on Corporate Governance and appoint an “investor relations contact person,” whose role it is to facilitate information between shareholders, prospective investors, and the management of the company. While these measures will help improve corporate governance in the medium term, they were often introduced with limited guidelines on how they are to be implemented, significantly reducing their short-term impact.
Payment system
128. In June 2003, the BNB launched the Real time INterbank Gross Settlement system (RINGS). The implementation required significant amendments in the legal framework, existing infrastructure, and operating system. RINGS allows participants to monitor in real-time their settlement account, the status of each payment, and the queue of pending transactions through a web-based monitoring station. RINGS’ pricing mechanism is based on a full cost recovery principle. Differentiated tariffs encourage banks to initiate payments early in the working day. According to a EU/ECB self-assessment of compliance with international standards, RINGS’ legal framework and payment process achieve high compliance with EU regulations and practices of the central banks in Europe. The system is also compatible with TARGET, and will allow the processing of cross-border payments in euro.
Anti-money laundering
129. The authorities are currently being evaluated under the FATF standards by MONEYVAL. A first evaluation round was conducted in 1999 and the report of the second round was expected to be finalized in May 2004. The third and final round of evaluation is planned for early 2006.
130. Since the 2002 FSAP report, three main legislative reforms were passed:
• In 2003, the law on anti-money laundering (AML) was amended considerably and brought in full compliance with EU standards.

- 87 -
• The Financial Intelligence Agency (FIA) was created and given functional independence from the Ministry of Finance. For this, adequate supervisory and accountability mechanisms were established, whereby the FIA Director must report on the activities of the FIA to a General Inspector (the Deputy Minister of Finance), who has the right to check all FIA files and records but is not allowed to give operational instructions to the FIA Director.
• In 2003, a new law of financing terrorist activities was enacted.
• The Penal Code was amended to criminalize AML activities, including the preparation of and provocation to AML activities. This amendment came in force in March 2004. Nevertheless, it remains difficult to prove that cases are related to AML activities.
131. In line with FSAP recommendations, inter-agency cooperation was strengthened considerably:
• In September 2003, a Liaison Officer from the Ministry of the Interior was appointed to work in the FIA.
• In March 2003, full information exchange, including information protected under the bank secrecy laws, was established between the Ministry of the Interior and the FIA.
• A MoU was signed between the FIA and the BNB, including modalities for information exchange and joint on-site inspections, and introducing reporting requirement for cash transactions above BGN 30,000.
132. In 2003, 236 operational files were opened, almost twice as many as in 2001. Of 45 investigations conducted in 2003, 22 were finalized, of which four were sent to courts (no conviction yet), 7 were sent to prosecutors to request their suspension, and 11 were sent to prosecutors with a request for termination.

- 88 - APPENDIX I
IMPLEMENTATION OF MAIN FSAP RECOMMENDATIONS
Recommended actions Steps taken Improving the legal and institutional framework 2002 • Enactment of amendment to the bankruptcy
provisions (Part IV) of the Commercial Code • Note done. Multi-sector working group is drafting
amendments to the Commercial Code. • Giving greater powers to creditors throughout the
proceedings • Addressed with amendments to the Civil Procedure
Code to improve and speed up executive civil procedures and with new Law on Registered Pledges to strengthen creditors’ rights, including collection-related actions. Implementation remains weak.
• Enactment of an Accounting and Auditing Law • Addressed with implementation of International Accounting Standards (IAS) starting January 2003 for financial sector and January 2005 for corporate sector; new Law of Independent Financial Audit was passed, requiring special registration for bank auditors.
• Development of a plan for financial sector tax reforms to address tax distortions
• Not done. Partial consumer tax benefits harmonization between life insurance and pension fund products. Review of insurance sector tax regime needed.
• Development of Credit Information and Ratings System
• Done. Upgrade and expansion of Credit Registry planned for June 2004, including registration of all consumer loans, and emergence of private-sector credit bureaus aimed at providing rating facilities and credit assessments.
2003 • Enactment of amendments to the foreclosure
provisions of the Civil Procedure Code • Addressed with amendments to Civil Procedure Code.
In addition, a Asset Forfeiture Law draft has been approved by the government and is being presented to Parliament.
• Enactment of legislation to improve the legal framework for mortgage lending
• Not able to collect necessary information.
• Enforcement of the application of international standards in accounting and auditing
• Done with implementation of International Accounting Standards (IAS) by January 2003 for financial sector and January 2005 for corporate sector.
2004 • Implementation of tax reform in the financial sector • No information available. • Enactment of amendments to the Anti-money
Laundering Law • Addressed with amendments to harmonize Anti-Money
Laundering Law with relevant EU Directives (effective April 2003) and new Law for the Measures against Funding of Terrorism (effective February 2003). Further inter-agency cooperation between BNB, FIA, and Ministry of the Interior is needed. No conviction yet.
Sustaining Banking Reform 2002 • Privatization of Biochim Bank • Done (beginning of 2003). • Rationalization of Business Promotion Bank • Not done. Last state-owned bank. Despite plans to
transform entity into nonbank financial institution, it continues to conduct banking activities with focus on

- 89 - APPENDIX I
Recommended actions Steps taken SMEs. Nevertheless, limited market share (less than 1 percent of total assets).
• Upgrade credit registry at BNB • Addressed with inclusion of all loans, including consumer loans, in Credit Registry starting June 2004 and further technological upgrade allowing banks to access information on-line.
• The BNB needs more powers to be able to obtain more information and assess the suitability of the ultimate owners or beneficial owners of banks
• Addressed with amendments to the Banking Law (2002).
• The BNB is encouraged to continue its dialogue with the banks on their risk management practices, which means for some banks that they need to go beyond simple application of the BNB’s loan classification and provisioning rules
• On-going. BNB is reviewing banks’ investment and risk management strategies. No recommendations issued yet.
• In order to monitor increasing use by banks of IT based risk management systems, and increased IT risk in banking, the BNB should consider a unit to study IT issues in banking
• Addressed partially with hiring of one IT specialist. However, additional IT specialists necessary to support on-site supervision teams.
• Expedient passage of the Bank Bankruptcy Law, including the provision allowing application of the new law to the ongoing liquidations
• Addressed with adoption of Bank Bankruptcy Law in Fall of 2002. Implementation remains slow, with four banks remaining to be liquidated since 1999.
• Provide the BNB with legal authority to introduce regulations on good corporate governance in banks
• Not done. Corporate governance provisions were introduced in Law on Commerce. No special regulations for commercial banks and nonbank financial institutions.
• Preparation of procedures to allow seamless taking over of control over the bank by conservator and trustee, minimizing opportunities for looting
• Addressed with new Bank Bankruptcy Law, although no new cases to test effectiveness of new legislation.
• Consider removing the 11 banks from the current trustees and entrusting liquidation to other agencies, for instance the Deposit Insurance Fund (DIF) or the Agency for State Claims
• Partially done. All bank bankruptcy proceedings under the control of the DIF, in accordance to new Bank Bankruptcy Law. Implementation remains slow with four of eleven banks still waiting to be liquidated since 1999.
2003 • Privatization of State Savings Bank • Completed with creation of DSK Bank PLC, fully
private Hungarian-owned commercial bank. Developing Capital Markets 2003 • Enactment of Amendments to the Law on Public
Offering of Securities to improve minority shareholder rights, to authorize the Bulgarian National Securities Commission (BNSC) to take court action on behalf of disadvantaged shareholders in civil actions, to give more power to general shareholder meetings over certain corporate decisions, and to provide new rules for taking companies out of the register of publicly traded companies.
• Addressed with substantial amendments to Law on Public Offering of Securities in 2002 in view of improving minority shareholder rights. Enforcement powers of new supervisory agency, the Financial Sector Commission (FSC), have been strengthened, although effectiveness of these powers only at initial stages of implementation and ultimately rely on weak judicial system.

- 90 - APPENDIX I
Recommended actions Steps taken Developing the Insurance Sector 2002 • Privatization of the State Insurance Institute (DZI) • Completed in 2002. Company was listed on stock
exchange in 2003. • Enactment of amendments to the Insurance Act to
strengthen insurance supervisor • Not done.
• Develop institutional development plan for the insurance supervisor
• Not done.
• Review insurance regulations toward eliminating gaps in the regulatory framework
• Not done. Project to merge various legislations into unified Code on Insurance.
• Develop the actuarial profession • Not done. An ordinance regulating functions and activities of actuaries was passed but implemented only in the context of pension funds (February 2004).
2003 • Reform inconsistencies in tax treatment of certain
insurance products and institutions • Not done. Limited harmonization in tax incentives
between life insurance products and voluntary pension funds. Ongoing discussions to reform tax regime of insurance companies.
Developing the Pension Funds 2002 • Development of institutional development plan for
the State Insurance Supervision Agency (SISA) • Addressed with the creation of joint supervisory body
for nonbank financial institutions, the Financial Sector Commission (FSC) (March 2003).
• Upgrade the regulatory framework for pension funds including allowing greater opportunities for diversification
• Regulatory framework has been upgraded with new Code on Social Insurance, without, however, relaxing investment diversification rules.
2003 • Enactment of amendments to the Mandatory Social
Insurance Code and the Voluntary Pension Code, strengthening pension fund governance and SISA supervision capacity
• Addressed with introduction of new Code on Social Insurance (implemented in 2003), covering both mandatory and voluntary pension fund activities, and creation of new supervisory body for nonbank financial institutions, the FSC.
• Upgrading regulations of private pension funds • Addressed with introduction of new Code on Social Insurance (implemented in 2003).
Developing leasing 2002 Improve legal and institutional framework for
repossession of leased assets • Not done. No specific legislation for leasing activities.
Banks can engage in leasing activities directly or indirectly by acquiring a leasing company. If a leasing company is majority-owned by a bank, these activities are reported on consolidated basis in banks’ financial statements.
• Address VAT issues • Not done. • Conform accounting standards with International
Accounting Standards (IAS) • Not done. IAS will be implemented on all non-financial
companies starting January 2005. Agricultural Credit 2002 • Ensure that license for deposit taking is only limited • Not done. Although in practice, agricultural credit

- 91 - APPENDIX I
Recommended actions Steps taken to commercial banks unions, which are not subject to the same prudential
regulations as those applied to banks, are not allowed to accept deposits, this restriction is not yet enshrined in the law. It is important that the government does not yield to pressures to relax this restriction, as was already recommended in the FSAP.
• Without a deposit taking function, there is no case for establishing a special supervisory regime for these credit institutions.
• This issue, however, will be addressed when the authorities transpose Chapter III (provisions of financial services) of the EU accession negotiations, which provisions are to be implemented upon entry to EU planned for 2007.
Improving Financial Supervision Coordination 2002 • Establishment of a financial supervision coordination
committee • Completed with creation of Council for Financial
Stability, comprised of representatives of Ministry of Finance, BNB, and FSC, and meeting on a quarterly basis. Coordination between BNB and FSC further strengthened with signing of MoUs regarding information exchange and joint on-site inspections.
Strengthen anti-money laundering 2002 • Expand the Law’s scope to lawyers • Addressed with amendments to Anti-Money
Laundering Law (Art.3(28)), requiring lawyers to report suspicious activities to the Financial Investigation Agency (FIA).
• Improve the options for freezing assets during the pre-trial phase
• Addressed with amendments to Anti-Money Laundering Law (Art.12), allowing to freeze assets for three days, during which time suspicious activities are reported to the courts, which are required to issue decision within 24 hours. Implementation remains slow due to lengthy investigation proceedings; no prosecution conducted so far.
• Strengthen the independence and resources of the Bureau and other AML services
• Addressed with creation of functionally independent Financial Investigation Agency (FIA) in April 2003.
• Provide feedback to reporting institutions on use of the suspicious transaction reports
• Not done. Ongoing work in context of the Twinning Project of the EU PHARE Program, Fighting Money Laundering. No feedback on case-by-case base, only general information exchange between banks’ compliance officers and FIA.
Upgrading payments system 2002 • Upgrading payments system • Addressed with successful introduction of Real-time
INterbank Gross Settlement system (RINGS) in June 2003, a system in compliance with EU directives and compatible with TARGET.
Improving Corporate Governance

- 92 - APPENDIX I
Recommended actions Steps taken 2002 • Strengthen Commercial Code to include provisions
on protection of minority shareholder rights, better definition of responsibility of supervisory boards, improved disclosure
• Addressed with amendments to Law on Commerce (see Arts. 221, 223-4, 236-8, 240 and 243) and, in the case of listed companies, to Law on Public Offering of Securities.
• Strengthen Law on public offering of securities to provide BNSC with authority to supervise joint stock companies with more than a certain number shareholders and to initiate lawsuits on behalf of shareholders
• Done. Lawsuits have been initiated but results of legal actions are not clear yet.
• Develop code of corporate governance and establish Institute of Directors
• Not done.
• Provide the financial regulators with authority to issue guidelines on the operation, structure and functioning of (supervisory) boards of directors of their respective commercial banks, insurance companies and pension insurance companies
• Not done. No specific legislation for financial institutions, in addition to general amendments to provisions in Law on Commerce.
Sources: IMF Country Report No. 02/188 and Bulgarian authorities.

- 93 - STATISTICAL APPENDIX
Table A1. Bulgaria: National Accounts, 1999-2003(NCEA, based on NACE, Rev.1)
1999 2000 2001 2002 2003 1/
Agriculture and forestry 3,458 3,301 3,533 3,459 3,435Agriculture, forestry and hunting 3,445 3,289 3,520 3,445 3,422Fishing 12 12 13 14 13
Industry 6,124 7,122 7,804 8,289 9,020Mining and quarrying 403 386 403 412 440Manufacturing 3,582 4,213 4,606 4,966 5,519Electricity, gas and water supply 1,070 1,437 1,591 1,634 1,720Construction 1,069 1,087 1,203 1,276 1,341
Services 11,624 13,273 15,019 16,777 17,633Trade, repair of motor vehicles, personal and household appliances 1,505 1,731 1,937 2,105 2,142Transport 1,316 1,656 1,953 2,131 2,225Communications 801 1,061 1,433 1,819 2,006Financial intermediation and insurance 602 706 831 986 1,105Other services 2 7,400 8,119 8,865 9,737 10,155
Total of economic activity groupings 21,205 23,697 26,356 28,526 30,089Adjustments 2,585 3,056 3,354 3,809 4,321
GDP at market prices 23,790 26,753 29,709 32,335 34,410
Household consumption 16,964 18,506 20,642 22,238 23,772Government consumption 3,937 4,786 5,177 5,832 6,532Gross fixed capital formation 3,600 4,206 5,415 5,909 6,733Changes in inventories 662 688 726 497 743Net exports -1,373 -1,432 -2,250 -2,140 -3,356 Exports of goods and services 10,601 14,902 16,510 17,180 18,314 Imports of goods and services 11,974 16,334 18,760 19,321 21,670Statistical discrepancy 0 0 0 0 -13
GDP at market prices 2.3 5.4 4.1 4.9 4.3Agriculture and forestry 5.5 -10.3 0.3 5.5 -1.3Industry -6.8 11.1 4.1 4.6 7.1Services 5.9 6.4 4.7 5.1 3.5
Household consumption 9.6 4.4 5.2 3.5 6.4Government consumption 5.0 11.7 1.4 4.1 7.1Gross fixed capital formation 20.8 15.4 23.3 8.5 13.8
Implicit GDP deflator 3.7 6.7 6.7 3.8 2.1
Agriculture and forestry 14.5 12.3 11.9 10.7 10.0Industry 25.7 26.7 26.3 25.6 26.2Services 48.9 49.6 50.6 51.9 51.2Total of economic activity groupings 89.1 88.6 88.8 88.2 87.4Adjustments 10.9 11.4 11.2 11.8 12.6GDP at market prices 100.0 100.0 100.0 100.0 100Final consumption 87.9 87.1 86.9 86.8 88.1 Individual consumption 79.0 77.4 77.4 76.8 77.8 Households expenditures 70.9 68.8 69.0 68.3 68.7 NPISHs expenditures 0.4 0.4 0.4 0.4 0.4 Government expenditures 7.7 8.2 8.0 8 8.7 Collective consumption 8.9 9.7 9.5 10.0 10.3Gross fixed capital formation 15.1 15.7 18.3 18.3 21.7Changes in inventories 2.8 2.6 2.4 1.5 19.6Net exports -5.8 -5.4 -7.6 -6.6 2.2 Exports of goods and services 44.5 55.7 55.6 53.1 -9.8 Imports of goods and services 50.3 61.1 63.2 59.8 53.2Statistical discrepancy 0.0 0.0 0.0 0 0
Source: National Statistical Institute.1/ Preliminary.2/ Includes: hotels and restaurants; real estate, renting and business activities, health and education; public administration and defense.
(In percent of GDP)
(Gross value added)(In current prices, in millions of leva)
(Percent change)
(Growth rate in prices of previous year, in percent)

- 94 - STATISTICAL APPENDIX
Table A2: Bulgaria: Selected Transition Economies: Cumulative Change in GDP, 1989-2003
1989-2003 1/ Peak Decline Since 1989 2/
Albania 6 -40
Bulgaria -13 -32 for 1997
Czech Republic 1 -14
Hungary 9 -18
Poland 34 -14
Romania -16 -25
Average (unweighted) 2 -24
2/ Compares the GDP in the year of its lowest level since the beginning of the transition with the level of 1989. 1/ Preliminary data. Sources: NSI - Bulgaria's data; WEO.

- 95 - STATISTICAL APPENDIX
1999 2000 2001 2002 2003 1/
(In current prices, in millions of leva)
Total 6124 7122 7804 8289 9020 Mining and quarrying 403 386 403 412 440 Manufacturing 3582 4213 4606 4966 5519 Electricity, gas and water supply 1070 1437 1591 1634 1720 Construction 1069 1087 1203 1276 1341Public 2899 2305 2255 2163 2170 Mining and quarrying 360 224 219 206 215 Manufacturing 1267 501 415 311 303 Electricity, gas and water supply 1064 1417 1511 1539 1568 Construction 207 163 110 108 85Private 3225 4817 5548 6126 6850 Mining and quarrying 42 161 184 206 225 Manufacturing 2315 3712 4191 4656 5216 Electricity, gas and water supply 5 20 80 96 152 Construction 862 924 1093 1168 1256
(Growth rate in prices of previous year, in percent)
Total -7 11 4 5 7 Mining and quarrying -6 -9 -2 1 6 Manufacturing -6 11 4 7 11 Electricity, gas and water supply -19 29 5 1 -2 Construction 3 1 4 3 3Public -19 -24 -7 -5 -5 Mining and quarrying -9 -39 -11 -9 1 Manufacturing -22 -63 -19 -27 -4 Electricity, gas and water supply -19 28 1 1 -5 Construction -10 -22 -35 -4 -24Private 7 42 9 9 11 Mining and quarrying 23 251 10 13 12 Manufacturing 6 51 7 10 12 Electricity, gas and water supply 0 281 308 3 46 Construction 7 7 11 4 5
(In 5.6 percent of gross value added))Share of economy Total 29 30 30 29 30 Mining and quarrying 2 2 2 1 2 Manufacturing 17 18 18 17 18 Electricity, gas and water supply 5 6 6 6 6 Construction 5 5 5 5 5Share of public sector in total industry 47 32 29 26 24 Mining and quarrying 90 58 54 50 49 Manufacturing 35 12 9 6 6 Electricity, gas and water supply 100 99 95 94 91Construction 19 15 9 9 6Share of private sector in total industry 53 68 71 74 76 Mining and quarrying 11 42 46 50 51 Manufacturing 65 88 91 94 95 Electricity, gas and water supply 1 1 5 6 9 Construction 81 85 91 92 94
Source: National Statistical Institute. 1/ Preliminary.
Table A3. Bulgaria: Gross Value Added in the Industrial Sector, 1999-2003(NCEA, based on NACE, Rev.1)

- 96 - STATISTICAL APPENDIX
Table A4. Bulgaria: Gross Value Added in the Services Sector, 1999-2003
1999 2000 2001 2002 2003 1/
Total 11623.6 13273.1 15019.3 16777.5 17633.4Trade 2/ 1504.6 1731.3 1937.2 2105.2 2142.1Transport 1316.2 1656.5 1953.2 2131.2 2225.0Communications 801.1 1060.6 1432.5 1819.0 2006.0Othee 3/ 8001.8 8824.7 9696.4 10722.1 11260.2
Public 4636.3 4852.4 5224.0 5512.7 5817.3Trade 2/ 110.9 24.2 26.3 23.4 19.8Transport 532.5 599.0 668.1 702.5 671.8Communications 572.3 654.2 709.7 725.5 705.8Other 3/ 3420.6 3574.9 3819.9 4061.3 4419.9
Private 6987.3 8420.7 9795.3 11264.8 11816.1Trade 2/ 1393.7 1707.1 1910.9 2081.7 2122.4Transport 783.7 1057.4 1285.1 1428.7 1553.1Communications 228.8 406.4 722.9 1093.5 1300.2Other 3/ 4581.2 5249.8 5876.4 6660.8 6840.4
Total 5.9 6.4 4.7 5.0 3.5Trade 2/ 13.9 7.8 8.9 5.0 4.4Transport 3.3 2.2 3.8 6.8 3.6Communications 30.3 21.9 21.4 18.2 10.5Other 3/ 3.1 5.3 2.0 2.7 2.1
Public 0.9 -3.3 -0.1 -1.9 1.2Trade 2/ -7.7 -78.7 2.7 -13.4 -13.8Transport -13.0 -7.2 0.2 0.3 -4.8Communications 10.2 5.3 -0.9 -4.7 -3.6Other 3/ 2.7 -1.7 0.0 -1.7 3.1
Private 9.3 12.8 7.4 8.7 4.7Trade 2/ 16.2 14.6 8.9 5.2 4.6Transport 20.1 8.6 5.8 10.1 7.80Communications 158.4 63.2 57.4 40.8 19.80Other 3/ 3.3 10.5 3.4 5.6 1.6
Gross value added 1.8 5.0 3.9 5.0 4.0
Share of economy Total services 54.8 56.0 57.0 58.8 58.6
Trade 2/ 7.1 7.3 7.4 7.4 7.1Transport 6.2 7.0 7.4 7.5 7.4Communications 3.8 4.5 5.4 6.4 6.7Other 3/ 37.7 37.2 36.8 37.6 37.4
Share of public sector 39.9 36.6 34.8 32.9 33.0Trade 2/ 7.4 1.4 1.4 1.1 0.9Transport 40.5 36.2 34.2 33.0 30.2Communications 71.4 61.7 49.5 39.9 35.2Other 3/ 42.7 40.5 39.4 37.9 39.3
Share of private sector 60.1 63.4 65.2 67.1 67.0Trade 2/ 92.6 98.6 98.6 98.9 99.1Transport 59.5 63.8 65.8 67.0 69.8Communications 28.6 38.3 50.5 60.1 64.8Other 3/ 57.3 59.5 60.6 62.1 60.7
Source: National Statistical Institute1/ Preliminary.2/ Including repairs of motor vehicles and personal and household appliances.3/ Includes: housing and municipal services; business services; science; education, culture, and art; health and social security,
sports, recreation and tourism; finance, credit and insurance; government; and NPISNs.
(In percent of gross value added)
(In current prices, in millions of leva)
(Growth rate in prices of previous year, in percent)

- 97 - STATISTICAL APPENDIX
Tabl
e A
5. B
ulga
ria: G
ross
Out
put o
f Ser
vice
s by
Bran
ches
, 199
9-20
03(N
CEA
, bas
ed o
n N
AC
E, R
ev.1
)
1999
2000
2001
2002
2003
1/19
9920
0020
0120
0220
031/
(Gro
wth
rate
in p
rices
of p
revi
ous y
ear,
in p
erce
nt)
(In
curr
ent p
rices
, in
mill
ions
of l
eva)
Gro
ss v
alue
add
ed -
Tota
l ser
vice
s5.
96.
44.
75.
03.
511
624
1327
315
019
1677
717
633
Trad
e, re
pair
of m
otor
veh
icle
s, pe
rson
al a
nd h
ouse
hold
app
lianc
es13
.97.
88.
95.
04.
415
0517
3119
3721
0521
42H
otel
s and
rest
aura
nts
12.0
5.2
3.4
2.8
5.4
486
500
535
563
621
Tran
spor
t and
com
mun
icat
ions
11.2
9.6
10.7
11.6
6.8
2117
2717
3386
3950
4231
Tra
nspo
rt3.
32.
23.
86.
83.
613
1616
5619
5321
3122
25 C
omm
unic
atio
ns30
.321
.921
.418
.210
.580
110
6114
3318
1920
06Fi
nanc
ial i
nter
med
iatio
n an
d in
sura
nce
15.7
9.1
11.6
11.5
8.8
602
706
831
986
1105
Rea
l est
ate,
rent
ing
and
busi
ness
act
iviti
es-1
.42.
60.
50.
10.
837
7540
1243
9147
5147
98of
whi
ch
impu
ted
rent
of o
wne
r occ
upie
d dw
ellin
gs
-1.2
0.4
-5.3
-1.6
0.0
2794
2850
3142
3298
3268
Publ
ic a
dmin
istra
tion
and
defe
nse,
co
mpu
lsor
y so
cial
secu
rity
2.6
7.0
2.7
3.5
3.8
1428
1633
1754
1958
2111
Educ
atio
n5.
812
.7-1
.8-0
.71.
482
799
610
7311
2712
35H
ealth
, soc
ial w
ork
and
vete
rinar
y ac
tiviti
es3.
41.
60.
811
.2-5
.756
259
066
185
887
7O
ther
com
mun
ity, s
ocia
l and
per
sona
l se
rvic
e ac
tiviti
es o
f NG
Os
14.4
9.5
7.6
3.9
6.6
321
390
450
480
513
Inte
rmed
iate
con
sum
ptio
n3.
810
.27.
06.
75.
684
3710
533
1206
213
359
1428
0
Gro
ss o
utpu
t9.
18.
05.
75.
74.
520
060
2380
627
081
3013
631
913
Sour
ce: N
atio
nal S
tatis
tical
Inst
itute
.1/
Pre
limin
ary.

- 98 - STATISTICAL APPENDIX
1999 2000 2001 2002 2003 2/
(In current prices, in millions of leva)Total agriculture Gross output 7,390 7,396 8,073 7,761 7,674 Crops 2,911 2,650 2,974 3,158 3,399 Livestock 2,603 2,783 2,945 2,283 2,041 Services and other 538 576 648 606 599 Secondary activities of households 1,338 1,387 1,505 1,713 1,634 Intermediate consumption 4,020 4,165 4,599 4,370 4,316 Gross value added 3,370 3,231 3,473 3,391 3,358
Private agriculture Gross output 7,272 7,302 7,938 7,631 7,547 Intermediate consumption 3,938 4,094 4,497 4,273 4,221 Gross value added 3,334 3,208 3,441 3,357 3,326
(Growth rate in prices of previous year, in percent)Total agriculture Gross output 2.7 -9.1 -0.1 4.2 -1.4 Crops 4.2 -19.1 7.6 15.5 -0.2 Livestock 0.7 -5.0 -9.9 -7.8 -3.8 Services and other -1.2 -2.5 5.5 -6.6 -0.7 Secondary activities of households 5.9 1.8 2.7 10.1 -0.7 Intermediate consumption 0.2 -8.4 -0.5 3.2 -1.3 Gross value added 5.5 -10.0 0.5 5.5 -1.6
Private agriculture Gross output 3.1 -8.8 -0.6 4.2 -1.4 Intermediate consumption 0.8 -8.1 -1.1 3.2 -1.2 Gross value added 5.7 -9.8 0.2 5.5 -1.6
Source: National Statistical Institute.1/ According to National Classification of Economic Activities.2/ Preliminary.
Table A6. Bulgaria: Total and Private Agricultural Production, 1999-2003 1/

- 99 - STATISTICAL APPENDIX
1999 2000 2001 2002 2003 1/
(Production in thousands of tons)
Wheat 3,155 3,406 4,077 4,123 2,004Maize 1,991 1,098 873 1,288 1,159Barley 627 636 931 1,211 485Sunflower seeds 803 599 405 645 761Sugar beets 53 23 19 51 10Tobacco 55 48 58 62 ...Tomatoes 2/ 446 410 273 245 300Green peppers 2/ 3/ 196 182 144 167 200Potatoes 566 398 600 627 606Apples 2/ 92 89 43 26 24Peaches 2/ 39 42 13 10 15Cherries 2/ 32 28 28 16 21Grapes 2/ 372 451 433 409 374
(Average yield-tons/hectare)
Wheat 2.83 3.04 3.01 3.01 2.38Maize 4.08 1.90 2.47 4.24 2.80Barley 2.57 2.81 3.19 3.12 1.94Sunflower seeds 1.17 1.01 1.04 1.37 1.22Sugar beets 16.77 10.45 14.1 23.74 23.05Tobacco 1.32 1.13 1.27 1.58 ...Tomatoes 2/ 14.45 13.46 16.73 15.21 16.00Green peppers 2/ 3/ 9.74 9.07 11.39 12.73 12.80Potatoes 10.85 7.53 12.39 12.09 11.00Apples 2/ 4.42 4.56 4.33 4.34 4.40Peaches 2/ 3.46 4.40 2.91 2.51 3.20Cherries 2/ 2.16 2.33 2.94 2.27 3.00Grapes 2/ ... ... 3.35 3.56 3.45
Sources: Ministry of Agriculture and Forestry. 1/ Preliminary data. 2/ For the years 1999 and 2000 source is NSI. 3/ Including red peppers.
Table A7. Bulgaria: Production and Average Yields of Selected Agricultural Crops, 1999-2003

- 100 - STATISTICAL APPENDIX
1999 2000 2001 2/ 2002 2003 3/
Total 4601 5409 6694 7221 7042Agriculture 107 111 146 205 182Mining and quarrying 115 116 103 115 83Manufacturing 1025 1291 1549 1921 1800Construction 311 343 419 410 356Electricity, gas, and water supply 418 573 528 503 644Transport 1157 1232 1740 1379 1506Trade 553 778 880 1151 1174Hotels and restaurants 198 233 337 439 301Financial intermediation 107 124 160 130 124Real estate, renting, and business activities 152 224 368 451 313Public administration; compulsory 281 208 166 129 281
social securityHousing, municipal, andconsumer services … … … … …Of which:
Health/sport/leisure 43 55 109 104 85Education 42 32 44 63 52Other community, social, and personal service activities 95 92 145 221 142
Total 19.3 20.2 22.5 22.3 20.5Agriculture 0.4 0.4 0.5 0.6 0.5Mining and quarrying 0.5 0.4 0.3 0.4 0.2Manufacturing 4.3 4.8 5.2 5.9 5.2Construction 1.3 1.3 1.4 1.3 1.0Electricity, gas, and water supply 1.8 2.1 1.8 1.6 1.9Transport 4.9 4.6 5.9 4.3 4.4Trade 2.3 2.9 3.0 3.6 3.4Hotels and restaurants 0.8 0.9 1.1 1.4 0.9Financial intermediation 0.4 0.5 0.5 0.4 0.4Real estate, renting, and business activities 0.6 0.8 1.2 1.4 0.9Public administration; compulsory 1.2 0.8 0.6 0.4 0.8social security 0.0 0.0 0.0 0.0 0.0Housing, municipal, and 0.0 0.0 0.0 0.0 0.0consumer services ... …. ….
Of which: Health/sport/leisure 0.2 0.2 0.4 0.3 0.2Education 0.2 0.1 0.1 0.2 0.1Other community, social, and personal service activities 0.4 0.3 0.5 0.7 0.4
Memorandum item:GDP in millions of leva 23,790.4 26,752.8 29,709.2 32,335.1 34,410.2
Source: National Statistical Institute.1/ These data do not equal gross fixed investment, as they include purchases of existing assets.2/ Including purchase of land since 2001.3/ Preliminary data.
(In percent of GDP)
(In current prices, in millions of leva)
Table A8. Bulgaria: Acquisition of Tangible Fixed Assets, 1999-2003 1/

- 101 - STATISTICAL APPENDIX
Tabl
e A
9. B
ulga
ria: N
atio
nal I
ncom
e A
ccou
nts,
1999
-200
3
1999
2000
2001
2002
2003
1/19
9920
0020
0120
0220
031/
(I
n cu
rren
t pric
es, i
n m
illio
ns o
f lev
a)
(I
n pe
rcen
t)G
DP
2379
026
753
2970
932
335
3441
010
010
010
010
010
0
Gro
ss v
alue
add
ed a
t bas
ic p
rices
2120
523
697
2635
628
526
3008
989
8989
8887
Com
pens
atio
n of
em
ploy
ees
8800
9245
1038
111
034
1175
637
3535
3434
Wag
es a
nd sa
larie
s63
1367
9277
8583
1587
4127
2526
2625
Soci
al c
ontri
butio
ns24
8724
5325
9627
1930
1511
99
89
Net
taxe
s on
prod
uctio
n 2
-239
-347
-365
-435
-616
-1-1
-1-1
-2O
ther
taxe
s on
prod
uctio
n…
…13
817
311
90
01
10
Subs
idie
s23
934
750
360
873
51
12
22
Gro
ss o
pera
ting
surp
lus
1264
414
798
1634
017
927
1894
953
5555
5555
Con
sum
ptio
n of
fixe
d ca
pita
l27
8529
2033
6540
60…
1211
1113
…N
et o
pera
ting
surp
lus
6009
8945
9616
1069
5…
2533
3233
…M
ixed
inco
me,
net
3851
2932
3359
3172
…16
1111
10…
Adj
ustm
ents
2585
3056
3354
3809
4321
1111
1112
13
Impo
rt du
ties
259
221
195
188
231
11
11
1
FIZ
IM-3
59-4
75-5
39-5
96-7
51-2
-2-2
-2-2
V
AT
1981
2467
2641
3000
3407
89
99
10
Net
taxe
s on
prod
ucts
370
584
410
5712
1614
353
34
44
Of w
hich
: Pr
ivat
e se
ctor
GV
A a
t bas
ic p
rices
1357
416
481
1882
320
813
…64
7071
73…
Com
pens
atio
n of
em
ploy
ees
3455
4086
4740
5322
…39
4446
48…
Wag
es a
nd sa
larie
s25
2230
5636
5541
23…
4045
4750
…So
cial
con
tribu
tions
933
1030
1085
1199
…38
4242
44…
Net
taxe
s on
prod
uctio
n 2
-38
-54
21-2
3…
1616
-65
…O
ther
taxe
s on
prod
uctio
n...
...59
88…
……
4351
…Su
bsid
ies
3854
3811
0…
1616
818
…G
ross
ope
ratin
g su
rplu
s10
158
1244
914
062
1551
3…
8084
8687
…C
onsu
mpt
ion
of fi
xed
capi
tal
1482
1727
1934
2446
…53
5958
60…
Net
ope
ratin
g su
rplu
s48
2477
9087
6998
95…
8087
9193
…M
ixed
inco
me,
net
3851
2932
3359
3172
…10
010
010
010
0…
Gro
ss v
alue
add
ed a
t bas
ic p
rices
100.
010
0.0
100.
010
0.0
…10
0.0
100.
010
0.0
100.
0…
Com
pens
atio
n of
em
ploy
ees
70.0
71.5
74.9
74.1
…25
.524
.825
.225
.6…
Wag
es a
nd sa
larie
s49
.751
.854
.854
.4…
18.6
18.5
19.4
19.8
…So
cial
con
tribu
tions
20.4
19.7
20.1
19.7
…6.
96.
25.
85.
8…
Net
taxe
s on
prod
uctio
n 2
-2.6
-4.1
-5.1
-5.4
…-0
.3-0
.30.
1-0
.1…
O
ther
taxe
s on
prod
uctio
n0.
00.
01.
11.
1…
0.0
0.0
0.3
0.4
…Su
bsid
ies
2.6
4.1
6.2
6.5
…0.
30.
30.
20.
5…
Gro
ss o
pera
ting
surp
lus
32.6
32.6
30.2
31.3
…74
.875
.574
.774
.5…
Con
sum
ptio
n of
fixe
d ca
pita
l17
.116
.519
.020
.9…
10.9
10.5
10.3
11.8
…N
et o
pera
ting
surp
lus
15.5
16.0
11.2
10.4
…35
.547
.346
.647
.5…
Mix
ed in
com
e, n
et...
......
……
28.4
17.8
17.8
15.2
…
Sour
ce:
Nat
iona
l Sta
tistic
al In
stitu
te.
1/ P
relim
inar
y.2/
Net
taxe
s on
prod
uctio
n in
clud
e: s
ubsi
dies
(-),
othe
r tax
es o
n pr
oduc
tion
(+)-
- oth
er su
bsid
ies o
n pr
oduc
tion
(-)
3/ N
et ta
xes o
n pr
oduc
ts in
clud
e: -
taxe
s on
prod
ucts
(+)-
-- su
bsid
ies o
n pr
oduc
ts (-
)

- 102 - STATISTICAL APPENDIX
1999
2000
2001
2002
2003
1/20
0020
0120
0220
031/
(In
leva
)(P
erce
nt c
hang
e, d
efla
ted
by C
PI)
Tota
l22
926
329
132
334
34.
02.
94.
83.
9A
gric
ultu
re, h
untin
g an
d fo
rest
ry &
fish
ing
167
194
216
243
248
5.3
3.9
6.3
-0.3
Min
ing
and
quar
ryin
g of
ene
rgy-
prod
ucin
g m
ater
ials
310
385
410
458
470
12.4
-0.9
5.6
0.3
Min
ing
and
quar
ryin
g, e
xcep
t ene
rgy
prod
ucin
g m
ater
ials
306
315
227
242
268
-6.7
-32.
90.
88.
2M
anuf
actu
re o
f foo
d pr
oduc
ts, b
ever
ages
and
toba
cco
305
376
479
518
560
11.5
18.7
2.3
5.6
Man
ufac
ture
of t
extil
es a
nd te
xtile
pro
duct
s12
214
214
215
115
25.
6-6
.90.
6-1
.7M
anuf
actu
re o
f lea
ther
and
leat
her p
rodu
cts
178
213
237
251
247
8.2
3.3
0.4
-4.0
Man
ufac
ture
of w
ood
and
woo
d pr
oduc
ts12
615
615
118
518
712
.3-9
.715
.6-1
.2M
anuf
actu
re o
f pul
p, p
aper
and
pap
er p
rodu
cts;
pub
lishi
ng a
nd p
rintin
g29
638
748
150
751
518
.415
.8-0
.2-0
.8M
anuf
actu
re o
f cok
e, re
fined
pet
role
um p
rodu
cts a
nd n
ucle
ar fu
el53
0…
……
……
…M
anuf
actu
re o
f che
mic
als,
chem
ical
pro
duct
s and
man
-mad
e fib
ers
311
350
315
318
330
1.9
-16.
2-4
.61.
5M
anuf
actu
re o
f rub
ber a
nd p
last
ic p
rodu
cts
216
185
173
170
195
-22.
2-1
3.2
-7.1
12.2
Man
ufac
ture
of o
ther
non
-met
allic
min
eral
pro
duct
s21
124
429
429
434
24.
712
.1-5
.313
.7M
anuf
actu
re o
f bas
ic m
etal
s and
fabr
icat
ed m
etal
pro
duct
s30
433
639
431
831
80.
19.
2-2
3.7
-2.2
Man
ufac
ture
of m
achi
nery
and
equ
ipm
ent n
.e.c
.20
323
627
428
327
65.
28.
2-2
.4-4
.6M
anuf
actu
re o
f ele
ctric
al a
nd o
ptic
al e
quip
men
t18
220
822
729
327
93.
71.
422
.3-7
.0M
anuf
actu
re o
f tra
nspo
rt eq
uipm
ent
237
243
272
295
323
-7.0
4.1
2.4
7.2
Man
ufac
turin
g n.
e.c.
160
178
194
203
277
1.0
1.2
-1.2
33.6
Elec
trici
ty, g
as a
nd w
ater
supp
ly40
641
444
846
751
1-7
.60.
6-1
.36.
9C
onst
ruct
ion
248
239
265
278
278
-12.
63.
3-0
.9-2
.2W
hole
sale
and
reta
il tra
de; r
epai
r of m
otor
veh
icle
s, m
otor
cycl
es a
nd p
erso
nal a
nd
hous
ehol
d go
ods
286
330
371
369
394
4.6
4.5
-5.9
4.4
Hot
els a
nd re
stau
rant
s19
018
521
223
725
4-1
1.5
6.3
5.6
4.9
Tran
spor
t, st
orag
e an
d co
mm
unic
atio
n27
130
233
535
338
10.
83.
3-0
.45.
6Fi
nanc
ial i
nter
med
iatio
n38
146
249
057
859
29.
9-1
.211
.50.
0R
eal e
stat
e, re
ntin
g an
d bu
sine
ss a
ctiv
ities
219
260
268
288
303
7.4
-4.0
1.5
2.9
Publ
ic a
dmin
istra
tion
and
defe
nse;
com
puls
ory
soci
al se
curit
y24
330
533
639
543
413
.42.
711
.07.
5Ed
ucat
ion
171
212
230
267
296
12.8
1.0
9.7
8.2
Hea
lth a
nd so
cial
wor
k15
619
422
626
731
513
.08.
211
.915
.1O
ther
com
mun
ity, s
ocia
l and
per
sona
l ser
vice
act
iviti
es14
619
021
122
917
517
.63.
22.
7-2
5.2
Sou
rce:
Nat
iona
l Sta
tistic
al In
stitu
te.
1/ P
relim
inar
y.
Tabl
e A
10 B
ulga
ria: A
vera
ge M
onth
ly E
arni
ngs i
n th
e St
ate
Sect
or, 1
999-
2003

- 103 - STATISTICAL APPENDIX
1999
2000
2001
2002
2003
1/20
0020
0120
0220
031/
(In le
va)
Tota
l16
819
320
421
824
84.
1-1
.20.
711
.3A
gric
ultu
re, h
untin
g an
d fo
rest
ry &
fish
ing
164
177
180
185
203
-1.9
-5.3
-2.9
7.3
Min
ing
and
quar
ryin
g of
ene
rgy-
prod
ucin
g m
ater
ials
180
8673
267
298
-56.
8-2
0.4
243.
99.
2
Min
ing
and
quar
ryin
g, e
xcep
t ene
rgy
prod
ucin
g m
ater
ials
259
348
369
392
398
21.9
-1.2
0.2
-0.7
Man
ufac
ture
of f
ood
prod
ucts
, bev
erag
es a
nd to
bacc
o17
719
119
320
022
4-2
.4-5
.9-1
.89.
5M
anuf
actu
re o
f tex
tiles
and
text
ile p
rodu
cts
133
147
155
164
177
0.3
-1.4
-0.4
5.7
Man
ufac
ture
of l
eath
er a
nd le
athe
r pro
duct
s12
813
714
615
716
2-3
.2-0
.91.
71.
0M
anuf
actu
re o
f woo
d an
d w
ood
prod
ucts
138
153
160
172
196
0.6
-2.7
1.7
11.3
Man
ufac
ture
of p
ulp,
pap
er a
nd p
aper
pro
duct
s; p
ublis
hing
and
prin
ting
188
209
235
253
286
0.8
4.9
1.5
10.7
Man
ufac
ture
of c
oke,
refin
ed p
etro
leum
pro
duct
s and
nuc
lear
fuel
261
540
580
618
658
87.5
0.0
0.7
4.1
Man
ufac
ture
of c
hem
ical
s, ch
emic
al p
rodu
cts a
nd m
an-m
ade
fiber
s26
730
933
535
237
54.
80.
7-0
.74.
2M
anuf
actu
re o
f rub
ber a
nd p
last
ic p
rodu
cts
183
197
201
216
250
-2.2
-5.1
1.3
13.3
Man
ufac
ture
of o
ther
non
-met
allic
min
eral
pro
duct
s23
524
725
628
031
2-4
.6-3
.83.
68.
8M
anuf
actu
re o
f bas
ic m
etal
s and
fabr
icat
ed m
etal
pro
duct
s20
928
328
932
033
622
.7-4
.84.
62.
6M
anuf
actu
re o
f mac
hine
ry a
nd e
quip
men
t n.e
.c.
209
231
240
264
285
-0.1
-3.2
4.2
5.4
Man
ufac
ture
of e
lect
rical
and
opt
ical
equ
ipm
ent
198
224
249
249
295
2.8
3.5
-5.4
15.7
Man
ufac
ture
of t
rans
port
equi
pmen
t23
626
126
327
930
40.
3-6
.00.
06.
7M
anuf
actu
ring
n.e.
c.13
815
115
816
618
5-0
.9-2
.7-0
.79.
0El
ectri
city
, gas
and
wat
er su
pply
186
293
391
428
488
43.0
24.3
3.4
11.5
Con
stru
ctio
n17
819
119
720
122
6-2
.8-4
.1-3
.39.
7W
hole
sale
and
reta
il tra
de; r
epai
r of m
otor
veh
icle
s, m
otor
cycl
es a
nd
pers
onal
and
hou
seho
ld g
oods
138
150
161
178
219
-1.6
-0.1
4.5
20.4
Hot
els a
nd re
stau
rant
s13
113
214
114
517
9-8
.3-0
.6-3
.020
.6Tr
ansp
ort,
stor
age
and
com
mun
icat
ion
175
198
209
230
299
2.6
-1.6
4.2
27.0
Fina
ncia
l int
erm
edia
tion
336
419
524
545
660
12.8
16.4
-1.6
18.3
Rea
l est
ate,
rent
ing
and
busin
ess a
ctiv
ities
152
186
210
220
251
11.5
4.8
-0.9
11.5
Publ
ic a
dmin
istra
tion
and
defe
nse;
com
puls
ory
soci
al se
curit
y…
……
……
……
……
Educ
atio
n21
826
530
534
340
210
.17.
16.
514
.5H
ealth
and
soci
al w
ork
126
104
133
154
214
-25.
419
.79.
535
.5O
ther
com
mun
ity, s
ocia
l and
per
sona
l ser
vice
act
iviti
es14
718
220
722
526
412
.45.
72.
615
.0
Sou
rce:
Nat
iona
l Sta
tistic
al In
stitu
te.
1/ P
relim
inar
y.
Tabl
e A
11.
Bul
garia
: Ave
rage
Mon
thly
Ear
ning
s in
the
Priv
ate
Sect
or, 1
999-
2003
(Per
cent
cha
nge,
def
late
d by
CPI
)

- 104 - STATISTICAL APPENDIX
1999
2000
2001
2002
2003
1/20
0020
0120
0220
031/
(In le
va)
(Per
cent
cha
nge,
def
late
d by
CPI
)
Tota
l20
122
524
025
828
41.
2-0
.51.
67.
6A
gric
ultu
re, h
untin
g an
d fo
rest
ry &
fish
ing
165
181
185
192
210
-0.6
-4.6
-1.9
6.9
Min
ing
and
quar
ryin
g of
ene
rgy-
prod
ucin
g m
ater
ials
310
385
410
439
453
12.5
-0.9
1.2
0.9
Min
ing
and
quar
ryin
g, e
xcep
t ene
rgy
prod
ucin
g m
ater
ials
292
343
360
387
396
6.3
-2.3
1.6
0.0
Man
ufac
ture
of f
ood
prod
ucts,
bev
erag
es a
nd to
bacc
o20
321
922
623
225
3-1
.9-4
.0-3
.06.
6M
anuf
actu
re o
f tex
tiles
and
text
ile p
rodu
cts
132
147
155
164
177
0.6
-1.5
0.0
5.5
Man
ufac
ture
of l
eath
er a
nd le
athe
r pro
duct
s13
214
214
615
716
2-2
.5-4
.11.
60.
9M
anuf
actu
re o
f woo
d an
d w
ood
prod
ucts
137
153
160
172
196
1.2
-2.8
1.6
11.4
Man
ufac
ture
of p
ulp,
pap
er a
nd p
aper
pro
duct
s; pu
blish
ing
and
prin
ting
207
233
259
273
308
2.2
3.4
-0.4
10.3
Man
ufac
ture
of c
oke,
refin
ed p
etro
leum
pro
duct
s and
nuc
lear
fuel
481
540
580
618
658
1.8
-0.1
0.7
4.1
Man
ufac
ture
of c
hem
ical
s, ch
emic
al p
rodu
cts a
nd m
an-m
ade
fibre
s28
731
833
335
037
30.
2-2
.4-0
.74.
2M
anuf
actu
re o
f rub
ber a
nd p
lasti
c pr
oduc
ts19
119
620
021
524
9-6
.6-5
.21.
613
.2M
anuf
actu
re o
f oth
er n
on-m
etal
lic m
iner
al p
rodu
cts
231
247
258
281
313
-3.0
-2.8
2.9
8.9
Man
ufac
ture
of b
asic
met
als a
nd fa
bric
ated
met
al p
rodu
cts
264
293
301
320
335
0.3
-4.2
0.5
2.3
Man
ufac
ture
of m
achi
nery
and
equ
ipm
ent n
.e.c
.20
623
224
826
828
32.
1-0
.52.
13.
2M
anuf
actu
re o
f ele
ctric
al a
nd o
ptic
al e
quip
men
t19
322
124
625
329
43.
73.
6-2
.813
.6M
anuf
actu
re o
f tra
nspo
rt eq
uipm
ent
236
256
265
281
306
-1.7
-3.8
0.2
6.4
Man
ufac
turin
g n.
e.c.
140
153
159
167
187
-1.4
-3.0
-0.7
9.5
Elec
trici
ty, g
as a
nd w
ater
supp
ly40
641
244
446
450
9-8
.10.
5-1
.27.
2Co
nstru
ctio
n20
320
421
321
523
3-9
.0-2
.9-4
.65.
9W
hole
sale
and
reta
il tra
de; r
epai
r of m
otor
veh
icle
s, m
otor
cycl
es
and
pers
onal
and
hou
seho
ld g
oods
151
158
167
180
220
-5.2
-1.4
1.9
19.5
Hot
els a
nd re
staur
ants
147
140
150
155
186
-13.
6-0
.1-2
.317
.3Tr
ansp
ort,
stor
age
and
com
mun
icat
ion
249
271
294
310
352
-1.4
1.0
-0.3
11.0
Fina
ncia
l int
erm
edia
tion
361
442
510
553
648
10.9
7.6
2.5
14.5
Real
est
ate,
rent
ing
and
busi
ness
act
iviti
es18
021
322
824
026
56.
9-0
.1-0
.57.
9Pu
blic
adm
inist
ratio
n an
d de
fens
e; c
ompu
lsory
soci
al se
curit
y24
330
533
639
543
413
311
7.4
Educ
atio
n17
121
323
226
929
912
.81.
39.
68.
7H
ealth
and
soci
al w
ork
156
190
218
255
303
10.4
7.0
10.6
16.2
Oth
er c
omm
unity
, soc
ial a
nd p
erso
nal s
ervi
ce a
ctiv
ities
147
187
209
227
202
15.3
4.3
2.7
-13.
0
Sou
rce:
Nat
iona
l Sta
tistic
al In
stitu
te.
1/ P
relim
inar
y.
Tabl
e A
12.
Bul
garia
: Ave
rage
Mon
thly
Ear
ning
s in
the
Publ
ic a
nd P
rivat
e Se
ctor
, 199
9-20
03

- 105 - STATISTICAL APPENDIX
Table A13 Bulgaria: Labor Force, Employment, and Unemployment, 1999-2003
1999 2000 2001 2002 2003
(In thousands)
Population 1/ 8,190.9 8,149.5 7,891.1 7,845.8 7,801.3.6 4/
Total labor force 2/ 3,387.9 3,272.2 3,264.7 3,248.6 3,237.1Activity rate (in percent) 3/ 49.2 47.5 48.1 48.4 48.5Employment 2/ 2,811.0 2,735.5 2,628.2 2,704.4 2,825.6
Public 1,446.5 1,277.0 1,037.4 1,005.2 964.7Private 1,354.6 1,445.1 1,584.9 1,694.1 1,854.7Unknown 9.9 13.4 5.9 5.1 6.2
Share of total employmentm (in percent)Public 51.5 46.7 39.5 37.2 34.1Private 48.2 52.8 60.3 62.6 65.6Unknown 0.4 0.5 0.2 0.2 0.2
Unemployed persons 2/ 576.9 536.7 636.5 544.2 411.4Unemployment rate (in percent) 2/ 17.0 16.4 19.5 16.8 12.7
Registered unemployed 1/ 610.6 682.8 662.3 602.5 500.7Official unemployment rate
(in percent) 1/ 16.0 17.9 17.3 16.3 13.5
Unemployment beneficiaries 1/ 178.4 196.9 160.6 116.3 87.2In percent of registered unemployed 29.2 28.8 24.2 19.3 17.4
In percent of labor force (LFS) 5.3 6.0 4.9 3.6 2.7
(Percent change)
Population -0.5 -0.5 -3.2 -0.6 -0.6 4/Labor force -2.6 -3.4 -0.2 -0.5 -0.4Employment -3.8 -2.7 -3.9 2.9 4.5
Of which : Private 6.4 6.7 9.7 6.9 9.5
Sources: National Statistical Institute; and National Employment Service.1/ Labor force as a proportion of the population aged 15 and over.2/ End of period.3/ Data are from the labor force survey; data refers to November 1999, December 2000, December 2001, December 2002, and the fourth Quarter of 2003.
4/ Data for 2003 are provisional .

- 106 - STATISTICAL APPENDIX
Table A14. Bulgaria: Price Indices of Food, Non-Food, and Services, 1999–2004(1995=100)
Food Monthly Change Non-Food Monthly Change Services Monthly ChangePrice Index (In percent) Price Index (In percent) Price Index (In percent)
1999 January 2,880.3 1.6 2,844.4 0.5 4,423.0 7.0
February 2,830.9 -1.7 2,829.4 -0.5 4,463.3 0.9
March 2,768.5 -2.2 2,813.4 -0.6 4,497.4 0.8
April 2,711.2 -2.1 2,828.5 0.5 4,525.7 0.6
May 2,650.6 -2.2 2,832.2 0.1 4,533.2 0.2
June 2,595.3 -2.1 2,827.8 -0.2 4,548.0 0.3
July 2,673.7 3.0 2,896.6 2.4 4,805.0 5.7
August 2,678.3 0.2 2,931.8 1.2 4,847.8 0.9
September 2,734.1 2.1 2,955.6 0.8 4,911.6 1.3
October 2,776.9 1.6 2,955.0 0.0 4,999.4 1.8
November 2,795.8 0.7 2,966.4 0.4 5,009.9 0.2
December 2,865.1 2.5 2,976.7 0.3 5,039.2 0.6
2000 January 2,956.1 3.2 2,985.4 0.3 5,232.7 3.8
February 3,008.2 1.8 2,999.0 0.5 5,270.8 0.7
March 2,961.5 -1.6 3,021.0 0.7 5,300.6 0.6
April 2,889.2 -2.4 3,014.5 -0.2 5,316.4 0.3
May 2,868.8 -0.7 3,052.1 1.2 5,330.8 0.3
June 2,868.9 0.0 3,069.4 0.6 5,345.0 0.3
July 2,908.5 1.4 3,059.8 -0.3 5,373.0 0.5
August 3,067.2 5.5 3,069.1 0.3 5,479.2 2.0
September 3,142.9 2.5 3,140.2 2.3 5,572.1 1.7
October 3,184.5 1.3 3,175.7 1.1 5,629.8 1.0
November 3,189.1 0.1 3,202.6 0.8 5,730.3 1.8
December 3,231.0 1.3 3,185.0 -0.5 5,724.6 -0.1
2001 January 3,253.3 0.7 3,186.0 0.0 5,791.6 1.2
February 3,244.4 -0.3 3,211.4 0.8 5,842.6 0.9
March 3,236.8 -0.2 3,213.2 0.1 5,872.4 0.5
April 3,210.7 -0.8 3,242.1 0.9 5,853.5 -0.3
May 3,193.8 -0.5 3,256.6 0.4 5,891.8 0.7
June 3,183.9 -0.3 3,250.0 -0.2 5,918.6 0.5
July 3,150.3 -1.1 3,278.3 0.9 5,925.8 0.1
August 3,127.0 -0.7 3,345.0 2.0 5,937.4 0.2
September 3,196.1 2.2 3,377.7 1.0 5,945.2 0.1
October 3,222.0 0.8 3,365.5 -0.4 6,292.1 5.8
November 3,235.5 0.4 3,362.8 -0.1 6,302.7 0.2
December 3,317.1 2.5 3,362.7 0.0 6,189.0 -1.8
2002 January 3,414.6 2.9 3,450.1 2.6 6,346.0 2.5
February 3,447.6 1.0 3,586.8 4.0 6,376.8 0.5
March 3,454.4 0.2 3,668.8 2.3 6,393.6 0.3
April 3,425.3 -0.8 3,694.0 0.7 6,412.3 0.3
May 3,266.5 -4.6 3,681.4 -0.3 6,435.6 0.4
June 3,145.6 -3.7 3,669.8 -0.3 6,433.6 0.0
July 3,032.7 -3.6 3,664.6 -0.1 6,852.0 6.5
August 2,994.7 -1.3 3,642.0 -0.6 6,853.6 0.0
September 3,040.0 1.5 3,660.6 0.5 6,858.9 0.1
October 3,095.9 1.8 3,682.6 0.6 6,872.9 0.2
November 3,090.0 -0.2 3,685.0 0.1 6,925.4 0.8
December 3,176.1 2.8 3,712.3 0.7 6,895.7 -0.4
2003 January 3,193.2 0.5 3,732.9 0.6 6,952.9 0.8
February 3,207.3 0.4 3,719.9 -0.3 6,959.9 0.1
March 3,227.2 0.6 3,731.5 0.3 6,969.5 0.1
April 3,254.6 0.8 3,703.7 -0.7 7,003.9 0.5
May 3,229.3 -0.8 3,657.6 -1.2 7,010.9 0.1
June 3,060.9 -5.2 3,635.1 -0.6 7,036.2 0.4
July 3,005.0 -1.8 3,638.4 0.1 7,424.2 5.5
August 3,046.3 1.4 3,652.0 0.4 7,454.9 0.4
September 3,112.9 2.2 3,666.9 0.4 7,453.1 0.0
October 3,155.2 1.4 3,685.9 0.5 7,457.0 0.1
November 3,303.8 4.7 3,690.5 0.1 7,438.4 -0.2
December 3,441.4 4.2 3,702.4 0.3 7,436.6 0.0
2004 January 3,486.3 1.3 3,792.5 2.4 7,467.0 0.4
February 3,498.3 0.3 3,826.3 0.9 7,452.1 -0.2
March 3,488.4 -0.3 3,825.3 0.0 7,462.8 0.1
April
May
Source: National Statistical Institute.

- 107 - STATISTICAL APPENDIX
Consumer Monthly Change 12-month Change Producer Monthly Change 12-month ChangePrice Index in Percent in Percent Price Index 1/ in Percent in Percent
1999January 3,126.4 2.4 1.9 81.5 -0.8 0.4February 3,105.8 -0.7 -0.1 81.1 -0.5 -3.1March 3,075.5 -1.0 -1.2 80.4 -0.9 -2.9April 3,056.2 -0.6 -2.2 80.8 0.5 -2.8May 3,029.0 -0.9 -1.5 82.4 2.0 -1.1June 3,001.5 -0.9 1.2 82.8 0.5 -0.4July 3,103.0 3.4 5.4 84.1 1.5 2.0August 3,126.0 0.7 5.8 87.4 4.0 5.2September 3,173.1 1.5 4.1 88.4 1.1 6.7October 3,209.5 1.1 4.9 88.9 0.6 7.6November 3,224.0 0.5 6.0 90.7 2.0 9.8December 3,267.1 1.3 7.0 92.5 2.0 12.5
2000January 3,345.8 2.4 7.0 93.6 1.3 14.9February 3,382.5 1.1 8.9 94.2 0.5 16.1March 3,372.0 -0.3 9.6 96.8 2.8 20.4April 3,337.2 -1.0 9.2 96.3 -0.5 19.2May 3,341.6 0.1 10.3 98.6 2.3 19.6June 3,349.8 0.2 11.6 98.4 -0.2 18.8July 3,370.5 0.6 8.6 100.4 2.0 19.4August 3,470.8 3.0 11.0 100.7 0.3 15.1September 3,548.9 2.2 11.8 105.3 4.6 19.1October 3,591.8 1.2 11.9 106.8 1.4 20.1November 3,619.3 0.8 12.3 105.6 -1.1 16.5December 3,635.0 0.4 11.3 103.5 -2.0 11.9
2001January 3,657.4 0.6 9.3 101.9 -1.5 8.9February 3,669.5 0.3 8.5 103.4 1.5 9.9March 3,671.4 0.1 8.9 103.8 0.4 7.3April 3,664.7 -0.2 9.8 103.7 -0.1 7.7May 3,666.9 0.1 9.7 104.1 0.4 5.7June 3,664.0 -0.1 9.4 104.2 0.1 6.0July 3,657.0 -0.2 8.5 104.0 -0.2 3.6August 3,668.4 0.3 5.7 104.3 0.3 3.6September 3,714.9 1.3 4.7 105.3 0.9 0.0October 3,778.7 1.7 5.2 104.1 -1.1 -2.5November 3,787.0 0.2 4.6 103.5 -0.6 -2.0December 3,810.3 0.6 4.8 101.6 -1.8 -1.8
2002January 3,912.9 2.7 7.0 102.0 0.3 0.0February 3,976.6 1.6 8.4 103.1 1.2 -0.3March 4,007.6 0.8 9.2 104.1 0.9 0.2April 4,003.0 -0.1 9.2 105.1 1.0 1.4May 3,920.0 -2.1 6.9 104.5 -0.6 0.3June 3,853.8 -1.7 5.2 104.0 -0.5 -0.3July 3,857.9 0.1 5.5 104.4 0.4 0.3August 3,832.4 -0.7 4.5 105.1 0.7 0.8September 3,862.7 0.8 4.0 106.4 1.2 1.1October 3,900.8 1.0 3.2 107.0 0.5 2.8November 3,907.1 0.2 3.2 106.5 -0.5 2.9December 3,955.6 1.2 3.8 108.0 1.4 6.3
2003January 3,981.3 0.6 1.7 109.9 1.8 7.8February 3,986.4 0.1 0.2 111.4 1.3 8.0March 4,001.4 0.4 -0.2 112.5 1.0 8.1April 4,013.0 0.3 0.2 108.4 -3.7 3.1May 3,988.4 -0.6 1.7 107.2 -1.1 2.6June 3,902.0 -2.2 1.2 108.4 1.2 4.3July 3,936.5 0.9 2.0 108.8 0.4 4.3August 3,966.1 0.8 3.5 109.6 0.8 4.3September 4,003.5 0.9 3.6 110.4 0.7 3.8October 4,031.3 0.7 3.3 111.4 0.9 4.1November 4,105.5 1.8 5.1 111.7 0.2 4.8December 4,178.6 1.8 5.6 112.6 0.9 4.3
2004January 4,235.8 1.4 6.4 113.4 0.7 3.2February 4,250.7 0.3 6.6 112.5 -0.8 1.0March 4,247.6 -0.1 6.2
April May
Source: National Statistical Institute. 1/ Since January 2003 National Statistical Institute has changed the base year for the producer price index. The new base year is 2000 and all historical data was recalculated back to 1995 following internationally accepted technique.
Table A15. Bulgaria: Consumer and Producer Price Indices, 1999-2004
1995=100 2000=100

- 108 - STATISTICAL APPENDIX
Table A16. Bulgaria: Estimated Private Sector Sharein GDP in Selected Transition Economies, 1999-2003
1999 2000 2001 2002 2003
(In percent)Bulgaria 1/ 57 62 63 64 64Croatia 60 60 60 60 n.a.Czech Republic 80 80 80 80 n.a.Hungary 80 80 80 80 n.a.Poland 65 70 75 75 n.a.Romania 60 60 65 65 n.a.Slovak Republic 75 80 80 80 n.a.Slovenia 60 65 65 65 n.a.
Sources: NSI - Bulgaria's figures; EBRD Transition report.
1/ Preliminary data for 2003.

- 109 - STATISTICAL APPENDIX
1999 2000 2001 2002 2003Prel.
Revenues 15,243 12,889 13,682 12,966 13,396Operational 13,872 11,425 12,740 12,335 12,576Financial 502 1,185 460 623 796Extraordinary 869 278 483 9 23
Expenditures 15,724 11,974 13,409 11,986 12,229Operational 13,489 10,872 12,371 11,597 11,892Financial 1,252 758 627 373 329 Interest paid on credits 198 137 137 107 ...Extraordinary 982 344 411 17 9
Operational surplus 383 553 369 738 684Net financial revenues -750 427 -167 251 467Net extraordinary -114 -66 72 -8 14
Net revenues -481 915 273 980 1,166
Total losses -1,425 -633 683 275 579
Total profits 944 1,549 955 1,256 1,745
Revenue 66.9 48.2 46.1 40.1 38.9Operational 60.9 42.7 42.9 38.2 36.5Financial 2.2 4.4 1.5 1.9 2.3Extraordinary 3.8 1.0 1.6 0.0 0.1
Expenditures 69.0 44.8 45.1 37.1 35.5Operational 59.2 40.6 41.6 35.9 34.6Financial 5.5 2.8 2.1 1.2 1.0Extraordinary 4.3 1.3 1.4 0.1 0.0
Operational surplus 1.7 2.1 1.2 2.3 2.0Net financial revenues -3.3 1.6 -0.6 0.8 1.4Net extraordinary revenues -0.5 -0.2 0.2 0.0 0.0
Net revenues -2.1 3.4 0.9 3.0 3.4
Total losses -6.3 -2.4 2.3 0.9 1.7
Total profits 4.1 5.8 3.2 3.9 5.1
Memorandum item:GDP (million leva) 22,776 26,753 29,709 32,324 34,410
Sources: National Statistical Institute and Ministry of Finance.
(In percent of GDP)
Table A17. Bulgaria: Financial Performance of State-Owned Enterprises, 1999-2003
(In millions of leva)

- 110 - STATISTICAL APPENDIX
1999 1/ 2000 1/ 2001 2002 2003Prel.
Total change in liabilities -392 -1,040 907 -1,564 -113(in percent of GDP) -1.7 -3.9 3.1 -4.8 -0.3
Changes in bank credit -770 -652 640 -457 20(in percent of GDP) -3.4 -2.4 2.2 -1.4 0.1(in percent of bank liabilities) -40.2 -51.5 33.6 -31.5 1.4
Short-term loans 57 -268 8 -83 16Of which : Arrears 49 -25 -60 -79 2
Long-term loans 116 -384 632 -374 4Of which : Arrears -314 -10 156 -203 5
Other loans -161 98 -151 226 -178
Total change in arrears to banks -264 -35 96 -282 7(in percent of bank credit) -13.8 -2.8 5.0 -19.5 0.4
Total change in nonbank liabilities -404 -486 419 -1,334 45(in percent of GDP) -1.8 -1.8 1.4 -4.1 0.1(in percent of nonbank liabilities) -9.4 -12.7 9.9 -45.8 1.5
Suppliers -56 -462 919 -737 81Personnel 4 39 38 -58 -8Taxes -346 -220 -109 -94 -96Pensions 55 -94 -5 -14 14Other -61 252 -424 -431 55
Total stocks 7,011 5,971 6,879 5,314 5,202(in percent of GDP) 30.8 22.3 23.2 16.4 15.1
Bank credit 1,918 1,266 1,905 1,449 1,469(in percent of GDP) 8.4 4.7 6.4 4.5 4.3(in percent of total stocks) 27.4 21.2 27.7 27.3 28.2
Short-term loans 599 331 339 256 273Of which : Arrears 164 139 79 ... 2
Long-term loans 1,319 935 1,567 1,192 1,196Of which : Arrears 57 47 203 ... 5
Other loans 782 880 729 955 777Total arrears 221 186 282 0 7
(in percent of bank credit) 11.5 14.7 14.8 0.0 0.4
Liabilities to non-banks 4,311 3,825 4,244 2,911 2,956(in percent of GDP) 18.9 14.3 14.3 9.0 8.6(in percent of total stocks) 61.5 64.1 61.7 54.8 56.8
Suppliers 1,599 1,137 2,055 1,318 1,399Personnel 197 236 274 216 208Taxes 971 750 641 547 450Pensions 264 171 166 152 167Other 1,280 1,532 1,108 677 732
Memorandum items:Credit to SOEs 1,319 901 832 715 870
(in percent of GDP) 5.8 3.4 2.8 2.2 2.5
Total lev credit 168 109 137 289 277Lev credit 145 91 123 277 266Lev bad loan bonds 23 19 15 12 11
Total FX credit 1,151 792 695 426 593FX credit 255 96 80 57 76FX bad loan bonds 896 696 615 369 518Total FX credit (in US$ billion) … … … … …
GDP (In billions of leva) 22,776 26,753 29,709 32,324 34,410
Sources: National Statistical Institute; Ministry of Finance; and Bulgarian National Bank.1/ Excluding agriculture.
(Stocks in millions of leva)
Table A18. Bulgaria: Bank and Nonbank Liabilities of State-Owned Enterprises, 1999-2003
(Change from previous year, in millions of leva)

- 111 - STATISTICAL APPENDIX
1999
2000
2001
2002
2003
Tota
l num
ber o
f ent
erpr
ises
1/
2,27
42,
569
2,24
61,
816
1691
Gro
up I
Num
ber
3123
910
327
23Sh
are
in T
otal
, in
perc
ent
1.4
9.3
4.6
1.5
1.4
Gro
up II
Num
ber
743
805
691
268
366
Shar
e in
Tot
al, i
n pe
rcen
t32
.731
.330
.814
.821
.6
Gro
up II
IN
umbe
r73
767
013
326
519
7Sh
are
in T
otal
, in
perc
ent
32.4
26.1
5.9
14.6
11.6
Subt
otal
: Gro
ups I
- II
IN
umbe
r1,
511
1,71
492
756
058
6Sh
are
in T
otal
, in
perc
ent
66.4
66.7
41.3
30.8
34.7
Gro
up IV
Num
ber
163
237
280
249
224
Shar
e in
Tot
al, i
n pe
rcen
t7.
29.
212
.513
.713
.2
Gro
up V
Num
ber
600
618
1,03
91,
007
881
Shar
e in
Tot
al, i
n pe
rcen
t26
.424
.146
.355
.552
.1
Sour
ces:
Nat
iona
l Sta
tistic
al In
stitu
te a
nd M
inist
ry o
f Fin
ance
.1/
Exc
ludi
ng a
gric
ultu
re.
Gro
up I:
E
nter
pris
e w
hose
cur
rent
reve
nues
do
not m
eet c
urre
nt e
xpen
ditu
res o
n m
ater
ial i
nput
s.G
roup
II:
Ent
erpr
ises
that
mee
t the
cos
t of m
ater
ial i
nput
s but
not
hing
els
e.G
roup
III:
Ent
erpr
ises t
hat m
eet t
he c
osts
of m
ater
ial i
nput
s and
wag
es, b
ut a
re u
nabl
e to
cov
er n
on-o
pera
tiona
l exp
endi
ture
.G
roup
IV:
Ente
rpris
es th
at m
eet a
ll co
sts e
xclu
ding
dep
reci
atio
n.G
roup
V:
Ent
epris
es th
at m
eet a
ll co
sts.
Tabl
e A
19.
Bulg
aria
: Sta
te-O
wne
d En
terp
rises
Pro
fitab
ility
and
Prof
it C
ateg
orie
s, 19
99-2
003

- 112 - STATISTICAL APPENDIX
in a
ll St
ate-
Ow
ned
Ente
rpris
es, 1
999-
2002
1/
(In m
illio
ns o
f lev
a, u
nles
s oth
erw
ise
indi
cate
d)
1999
2000
2001
2002
100
Larg
est
All
othe
rLa
rges
t los
s-m
akin
g10
0 La
rges
tA
ll ot
her
Larg
est l
oss-
mak
ing
100
Larg
est
All
othe
rLa
rges
t los
s-m
akin
g10
0 La
rges
tA
ll ot
her
Larg
est l
oss-
mak
ing
loss
-mak
ing
SOEs
SOEs
SOEs
as p
erce
ntag
elo
ss-m
akin
g SO
EsSO
Es
SO
Es a
s per
cent
age
loss
-mak
ing
SOEs
SOEs
SOEs
as p
erce
ntag
elo
ss-m
akin
g SO
EsSO
Es
SO
Es a
s per
cent
age
in m
illio
ns o
f lev
ain
mill
ions
of l
eva
of a
ll SO
Esin
mill
ions
of l
eva
in m
illio
ns o
f lev
aof
all
SOEs
in m
illio
ns o
f lev
ain
mill
ions
of l
eva
of a
ll SO
Esin
mill
ions
of l
eva
in m
illio
ns o
f lev
aof
all
SOEs
Rev
enue
5,77
215
,243
37.9
2,88
512
,889
22.4
2,04
313
,682
14.9
1,90
312
,966
14.7
Ope
ratio
nal
5,07
313
,872
36.6
2,52
111
,425
22.1
1,76
812
,740
13.9
1,84
612
,335
15.0
Fina
ncia
l22
850
245
.326
11,
185
22.0
176
460
38.2
5562
38.
8Ex
traor
dina
ry47
286
954
.310
327
836
.999
483
20.5
29
24.4
Expe
nditu
res
7,12
915
,724
45.3
3,47
911
,974
29.1
2,65
313
,409
19.8
2,15
211
,986
18.0
Ope
ratio
nal
5,42
613
,489
40.2
2,86
210
,872
26.3
2,20
812
,371
17.9
2,08
211
,597
18.0
Fina
ncia
l86
31,
253
68.9
433
758
57.1
292
627
46.6
5737
315
.4Ex
traor
dina
ry84
098
385
.518
434
453
.615
241
137
.112
1771
.7
Ope
ratio
nal s
urpl
us-3
5338
3-9
2.2
-341
554
-61.
6-4
4036
9-1
19.3
-237
738
-32.
1N
et fi
nanc
ial r
even
ues
-635
-750
84.7
-172
427
-40.
2-1
17-1
6769
.7-3
251
-1.0
Net
ext
raor
dina
ry re
venu
es-3
68-1
1432
3.6
-82
-66
124.
5-5
472
-74.
8-1
0-8
122.
5
Net
pro
fits
-1,3
56-4
81-5
9491
5-6
1027
3-2
4998
0
Tota
l non
bank
liab
ilitie
s2,
396
4,31
155
.61,
522
3,82
539
.81,
550
4,07
838
.071
72,
758
26.0
Supp
liers
1,00
01,
599
62.6
453
1,13
739
.982
32,
055
40.0
369
1,31
828
.0Pe
rson
nel
6519
733
.176
236
32.3
8027
429
.166
216
30.5
Bud
get 2
/63
997
165
.831
175
041
.429
264
145
.616
954
730
.9O
ther
3/
691
1,54
444
.768
21,
702
40.1
356
1,10
832
.111
367
716
.6
Sour
ces:
Nat
iona
l Sta
tistic
al In
stitu
te a
nd M
inis
try o
f Fin
ance
.1/
The
100
larg
est l
oss-
mak
ing
SOEs
incl
ude
ente
rpris
es u
nder
Isol
atio
n Pr
ogra
m.
2/ E
xclu
des Z
UN
K c
redi
ts tr
ansf
erre
d fr
om b
anks
to th
e bu
dget
.3/
Thi
s rep
rese
nts a
com
posi
te g
roup
ing
of se
vera
l cat
egor
ies i
nclu
ding
mon
ey re
ceiv
ed fr
om c
usto
mer
s in
adva
nce
but n
ot re
cogn
ized
as r
even
ue fo
r the
yea
r und
erre
view
, and
int
eres
t acc
rued
but
not
act
ually
pai
d to
dep
osit
mon
ey b
anks
.
Tabl
e A
20. B
ulga
ria: S
hare
of t
he 1
00 L
arge
st L
oss-
Mak
ing
Stat
e-O
wne
d En
terp
rises

- 113 - STATISTICAL APPENDIX
1999
2000
2001
2002
2003
2004
Num
ber o
f Priv
atiz
atio
n tra
nsac
tions
2/
In th
e st
ate
sect
or12
1159
023
110
311
831
Of w
hich
: P
rivat
izat
ion
a gen
cy23
093
8376
116
31 M
inis
tries
/Com
mitt
ees
981
497
148
272
0
Priv
atiz
atio
n pr
ocee
ds (U
S$ m
illio
n) 3
/1,
153
441
178
198
268
406
Of w
hich
: P
a ym
ents
con
tract
ed65
439
617
616
326
731
7 C
orpo
rate
Lia
bilit
ies a
ssum
ed49
845
335
189
Cor
pora
te L
iabi
litie
s pai
d1
00
00
0
Lon g
-term
ass
ets p
rivat
ized
(bill
ion
leva
) 4/
9826
67
89
By
priv
atiz
atio
n ag
ency
8113
46
89
By
Min
istri
es/C
omm
ittee
s17
122
10
0B
y C
ente
r for
Mas
s Priv
atiz
atio
n 5/
00
00
00
Lon g
-term
ass
ets p
rivat
ized
(per
cent
of t
otal
) 6/
17.0
4.4
1.0
1.2
1.4
1.5
By
priv
atiz
atio
n ag
ency
14.0
2.3
0.6
1.0
1.4
1.5
By
Min
istri
es/C
omm
ittee
s3.
02.
10.
40.
20.
00.
0B
y C
ente
r for
Mas
s Priv
atiz
atio
n 5/
0.0
0.0
0.0
0.0
0.0
0.0
Sour
ce: P
rivat
izat
ion
Age
ncy.
1/20
04 -
as o
f 29.
02.2
004.
2/ I
nclu
des p
rivat
izat
ion
of w
hole
ent
erpr
ises
and
of p
arts
of e
nter
pris
es.
3/ I
nclu
des c
ash
paym
ents
con
tract
ed a
nd d
ebt i
nstru
men
ts.
4/ A
t end
-199
5 ac
coun
ting
valu
atio
n.5/
Vou
cher
priv
atiz
atio
n.
Tabl
e A
21. B
ulga
ria: P
rivat
izat
ion
of S
tate
-Ow
ned
Ente
rpris
es, 1
999-
2004
1/

- 114 - STATISTICAL APPENDIX
1999 2000 2001 2002 2003
Total revenue 2/ 9,164 10,361 11,164 11,799 13,222 Of which: Tax revenue 6,955 8,005 8,517 8,873 10,267 BNB transfers 90 137 175 173 133
Total expenditure 2/ 9,124 10,532 11,344 12,009 13,221 Of which: Current non-interest 7,067 8,287 9,001 10,071 11,138 Interest 898 1,083 1,106 713 724 External 690 818 853 544 561 Domestic 208 265 253 169 163
Primary balance 2,097 2,075 2,163 1,728 2,084Primary balance excluding BNB transfers 2,007 1,938 1,988 1,556 1,951Overall balance 40 -170 -180 -209 1
Financing -40 170 180 209 -1 External financing (net) 283 -404 -96 481 -2 Domestic financing (net) -583 328 -506 -492 -250 Banking system -583 328 -506 -492 -250 Nonbank Net acquisition and net lending 260 246 102 221 39 o.w.: revenue from privatization 523 345 181 286 189 GSM license and BCC divident (net) ... ... 680 ... ... Receipts from BCC related to bank privatization ... ... ... ... 212
Total revenue 2/ 38.5 38.7 37.6 36.5 38.4 Of which: Tax revenue 29.2 29.9 28.7 27.4 29.8
Total expenditure 2/ 38.4 39.4 38.2 37.2 38.4 Of which: Current non-interest 29.7 31.0 30.3 31.2 32.4 Interest 3.8 4.0 3.7 2.2 2.1 External 2.9 3.1 2.9 1.7 1.6 Domestic 0.9 1.0 0.9 0.5 0.5
Primary balance 8.8 7.8 7.3 5.3 6.1Primary balance excluding BNB transfers 8.4 7.2 6.7 4.8 5.7Overall balance 0.2 -0.6 -0.6 -0.6 0.0
Financing -0.2 0.6 0.6 0.6 0.0 External financing (net) 1.2 -1.5 -0.3 1.5 0.0 Domestic financing (net) -2.5 1.2 -1.7 -1.5 -0.7 Banking system -2.5 1.2 -1.7 -1.5 -0.7 Nonbank ... ... ... ... ... Net acquisition and net lending 1.1 0.9 0.3 0.7 0.1 o.w.: revenue from privatization 2.2 1.3 0.6 0.9 0.5 GSM license and BCC divident (net) ... ... 2.3 ... ... Receipts from BCC related to bank privatization ... ... ... ... 0.6
Memorandum items Government social insurance contributions (in millions of leva) 550 702 674 724 0.1 (in percent of GDP) 2.3 2.6 2.3 2.2 2.5 Nominal GDP (in millions of leva) 23,790 26,753 29,709 32,324 34,410
Source: Bulgarian Ministry of Finance.
1/ Consolidated government from 1998 includes extrabudgetary accounts. 2/ Excluding social insurance contributions paid by the general government on behalf of its employees.
(In percent of GDP)
Table A22. Bulgaria: General Government, 1999-2003 1/
(In millions of leva)

- 115 - STATISTICAL APPENDIX
1999 2000 2001 2002 2003
Total revenue 2/ 9,164 10,361 11,164 11,799 13,222
Tax revenue 2/ 6,955 8,005 8,517 8,873 10,267 Profit taxes 748 736 1,150 976 1,085 Nonfinancial enterprises 636 619 812 871 952 Financial enterprises 112 117 339 105 133 Income taxes 1,056 1,098 1,063 1,052 1,140 VAT/turnover taxes 1,927 2,359 2,454 2,688 3,101 Excise duties (inc.fuel fees) 910 1,131 1,107 1,314 1,544 Customs duties 259 221 195 188 231 Social insurance contributions 2/ 1,846 2,242 2,311 2,352 2,806 Pension fund 1,682 1,795 1,822 1,839 2,192 Health Insurance fund 165 446 489 513 614 Other taxes 210 218 236 303 359
Nontax revenues 2,006 2,153 2,284 2,625 2,644 BNB transfers 90 137 175 173 133 Other 1,916 2,016 2,109 2,452 2,512 Assistance 203 204 363 302 311
Total revenue 2/ 38.5 38.7 37.6 36.5 38.4
Tax revenue 2/ 29.2 29.9 28.7 27.4 29.8 Profit taxes 3.1 2.8 3.9 3.0 3.2 Nonfinancial enterprises 2.7 2.3 2.7 2.7 2.8 Financial enterprises 0.5 0.4 1.1 0.3 0.4 Income taxes 4.4 4.1 3.6 3.3 3.3 VAT/turnover taxes 8.1 8.8 8.3 8.3 9.0 Excise duties (inc.fuel fees) 3.8 4.2 3.7 4.1 4.5 Customs duties 1.1 0.8 0.7 0.6 0.7 Social insurance contributions 2/ 7.8 8.4 7.8 7.3 8.2 Pension fund 7.1 6.7 6.1 5.7 6.4 Health Insurance fund 0.7 1.7 1.6 1.6 1.8 Other taxes 0.9 0.8 0.8 0.9 1.0
Nontax revenues 8.4 8.0 7.7 8.1 7.7 BNB transfers 0.4 0.5 0.6 0.5 0.4 Other 8.1 7.5 7.1 7.6 7.3 Assistance 0.9 0.8 1.2 0.9 0.9
Memorandum item Nominal GDP (in millions of leva) 23,790 26,753 29,709 32,324 34,410
Source: Bulgarian Ministry of Finance.
1/ Consolidated government from 1998 includes extrabudgetary accounts. 2/ Excluding social insurance contributions paid by the general government on behalf of its employees.
(In percent of GDP)
Table A23. Bulgaria: General Government Revenue, 1999-2003 1/
(In millions of leva)

- 116 - STATISTICAL APPENDIX
1999 2000 2001 2002 2003
Total expenditure 2/ 9,124 10,532 11,344 12,008 13,221 Total non-interest expenditure 8,226 9,448 10,238 11,296 12,497 Current non-interest expenditure 7,067 8,287 9,001 10,071 11,138 Compensation 2/ 1,208 1,283 1,196 1,379 1,552 Wages and salaries 1,182 1,256 1,159 1,338 1,506 Scholarships 26 28 37 41 45 Maintenance/operating 1,697 2,037 1,950 2,154 2,408 Defense/security 962 896 957 1,066 1,107 Subsidies 391 295 292 303 439 Subsidies for healt activities ... 62 417 469 501 Social expenditure 2,808 3,713 4,189 4,701 5,131 Pensions 1,953 2,536 2,702 2,944 3,161 Assistance and unemployment 703 901 858 1,007 1,004 Other social security expenditure 59 172 225 185 211 Health Insurance fund 93 104 404 565 755 Capital expenditure (inc.state reserve 1,159 1,161 1,237 1,225 1,359 gain and natural disasters) Interest 898 1,083 1,106 713 724 External 690 818 853 544 561 Domestic 208 265 253 169 163
Total expenditure 2/ 38.4 39.4 38.2 37.2 38.4 Total non-interest expenditure 34.6 35.3 34.5 34.9 36.3 Current non-interest expenditure 29.7 31.0 30.3 31.2 32.4 Compensation 2/ 5.1 4.8 4.0 4.3 4.5 Wages and salaries 5.0 4.7 3.9 4.1 4.4 Scholarships 0.1 0.1 0.1 0.1 0.1 Maintenance/operating 7.1 7.6 6.6 6.7 7.0 Defense/security 4.0 3.3 3.2 3.3 3.2 Subsidies 1.6 1.1 1.0 0.9 1.3 Subsidies for healt activities ... 0.2 1.4 1.5 1.5 Social expenditure 11.8 13.9 14.1 14.5 14.9 Pensions 8.2 9.5 9.1 9.1 9.2 Assistance and unemployment 3.0 3.4 2.9 3.1 2.9 Other social security expenditure 0.2 0.6 0.8 0.6 0.6 Health Insurance fund 0.4 0.4 1.4 1.7 2.2 Capital expenditure (inc.state reserve 4.9 4.3 4.2 3.8 3.9 gain and natural disasters) Interest 3.8 4.0 3.7 2.2 2.1 External 2.9 3.1 2.9 1.7 1.6 Domestic 0.9 1.0 0.9 0.5 0.5
Memorandum item Nominal GDP (in millions of leva) 23,790 26,753 29,709 32,324 34,410
Source: Bulgarian Ministry of Finance. 1/ Consolidated government from 1998 includes extrabudgetary accounts. 2/ Excluding social insurance contributions paid by the general government on behalf of its employees.
(In percent of GDP)
Table A24. Bulgaria; General Government Expenditure, 1999-2003 1/
(In millions of leva)

- 117 - STATISTICAL APPENDIX
1999 2000 2001 2002 2003Prel.
CASH FLOWS FROM OPERATING ACTIVITIESCash receipts from operating activities 9,161 10,311 11,467 12,415 13,817 Taxes 5,108 5,763 6,206 6,666 7,634 Social contributions 2,132 2,469 2,498 3,075 3,654 Grants 201 200 348 302 311 Other receipts 1,720 1,879 2,416 2,372 2,218Cash payments for operating activities 8,349 9,656 10,413 11,662 12,907 Compensation of employees 1,635 1,560 1,483 1,946 2,313 Purchases of goods and services 2,743 2,845 2,718 3,292 3,509 Interest 894 1,077 1,106 712 724 Subsidies .... .... .... 772 940 Grants 1 8 51 0 0 Social benefits .... .... .... 4,696 5,128 Other payments .... .... .... 244 293Net cash inflow from operating activities 812 655 1,055 753 910CASH FLOWS FROM INVESTMENTS IN NONFINANCIAL ASSETSNet cash outflow from investments in nonfinancial assets 772 822 994 961 909 Fixed assets 632 677 834 978 985 Change in inventories -22 1 -1 13 -13 Valuables 0 0 0 0 0 Nonproduced assets 9 9 13 -30 -63Cash surplus / deficit 40 -167 60 -208 1CASH FLOWS FROM FINANCING ACTIVITIESNet Acquisition of Financial Assets other than Cash -251 -260 -557 -1,223 -312 Domestic -242 -234 -530 -211 -250 Foreign -10 -26 -26 -1,012 -62 Monetary gold and SDRs 0 0 0 0 0Net Incurrence of Liabilities 255 -359 -323 -383 237 Domestic -18 74 -201 132 324 Foreign 273 -433 -122 -514 -87Net cash inflow from financing activities 506 -99 234 840 549Net change in the stock of cash 547 -266 294 632 550
CASH FLOWS FROM OPERATING ACTIVITIESCash receipts from operating activities 38.5 38.5 38.6 38.4 40.2 Taxes 21.5 21.5 20.9 20.6 22.2 Social contributions 9.0 9.2 8.4 9.5 10.6 Grants 0.8 0.7 1.2 0.9 0.9 Other receipts 7.2 7.0 8.1 7.3 6.4Cash payments for operating activities 35.1 36.1 35.0 36.1 37.5 Compensation of employees 6.9 5.8 5.0 6.0 6.7 Purchases of goods and services 11.5 10.6 9.1 10.2 10.2 Interest 3.8 4.0 3.7 2.2 2.1 Subsidies .... .... .... 2.4 2.7 Grants 0.0 0.0 0.2 0.0 0.0 Social benefits .... .... .... 14.5 14.9 Other payments .... .... .... 0.8 0.9Net cash inflow from operating activities 3.4 2.4 3.5 2.3 2.6CASH FLOWS FROM INVESTMENTS IN NONFINANCIAL ASSETSNet cash outflow from investments in nonfinancial assets 3.2 3.1 3.3 3.0 2.6 Fixed assets 2.7 2.5 2.8 3.0 2.9 Change in inventories -0.1 0.0 0.0 0.0 0.0 Valuables 0.0 0.0 0.0 0.0 0.0 Nonproduced assets 0.0 0.0 0.0 -0.1 -0.2Cash surplus / deficit 0.2 -0.6 0.2 -0.6 0.0CASH FLOWS FROM FINANCING ACTIVITIESNet Acquisition of Financial Assets other than Cash -1.1 -1.0 -1.9 -3.8 -0.9 Domestic -1.0 -0.9 -1.8 -0.7 -0.7 Foreign 0.0 -0.1 -0.1 -3.1 -0.2 Monetary gold and SDRs 0.0 0.0 0.0 0.0 0.0Net Incurrence of Liabilities 1.1 -1.3 -1.1 -1.2 0.7 Domestic -0.1 0.3 -0.7 0.4 0.9 Foreign 1.1 -1.6 -0.4 -1.6 -0.3Net cash inflow from financing activities 2.1 -0.4 0.8 2.6 1.6Net change in the stock of cash 2.3 -1.0 1.0 2.0 1.6
Nominal GDP (in millions of leva) 23,790 26,753 29,709 32,324 34,410
Source: Ministry of Finance.
Table A25. Bulgaria: Cash Flow Statement -- Consolidated General Government (GFSM 2001 Definition), 1999-2003
(In millions of leva)
(In percent of GDP)
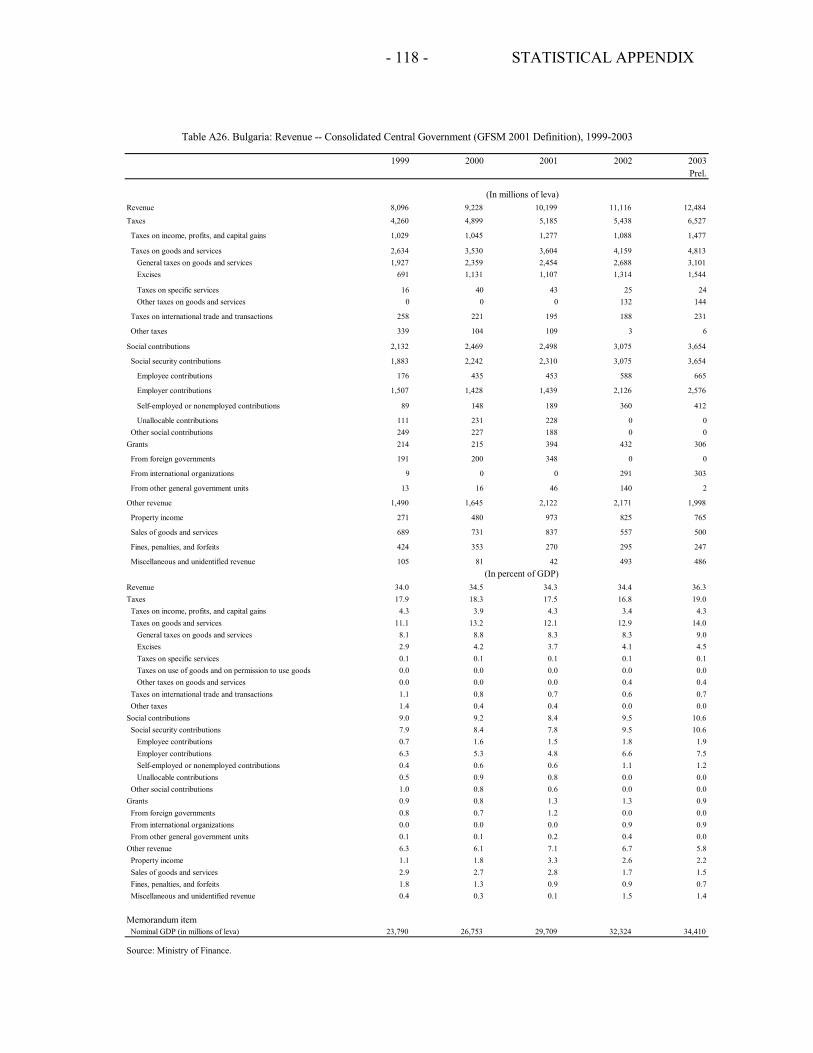
- 118 - STATISTICAL APPENDIX
1999 2000 2001 2002 2003Prel.
Revenue 8,096 9,228 10,199 11,116 12,484
Taxes 4,260 4,899 5,185 5,438 6,527
Taxes on income, profits, and capital gains 1,029 1,045 1,277 1,088 1,477
Taxes on goods and services 2,634 3,530 3,604 4,159 4,813 General taxes on goods and services 1,927 2,359 2,454 2,688 3,101 Excises 691 1,131 1,107 1,314 1,544
Taxes on specific services 16 40 43 25 24 Other taxes on goods and services 0 0 0 132 144
Taxes on international trade and transactions 258 221 195 188 231
Other taxes 339 104 109 3 6
Social contributions 2,132 2,469 2,498 3,075 3,654
Social security contributions 1,883 2,242 2,310 3,075 3,654
Employee contributions 176 435 453 588 665
Employer contributions 1,507 1,428 1,439 2,126 2,576
Self-employed or nonemployed contributions
89 148 189 360 412
Unallocable contributions 111 231 228 0 0 Other social contributions
249 227 188 0 0
Grants
214 215 394 432 306
From foreign governments
191 200 348 0 0
From international organizations 9 0 0 291 303
From other general government units 13 16 46 140 2
Other revenue 1,490 1,645 2,122 2,171 1,998
Property income 271 480 973 825 765
Sales of goods and services 689 731 837 557 500
Fines, penalties, and forfeits 424 353 270 295 247
Miscellaneous and unidentified revenue 105 81 42 493 486
Revenue 34.0 34.5 34.3 34.4 36.3Taxes 17.9 18.3 17.5 16.8 19.0 Taxes on income, profits, and capital gains 4.3 3.9 4.3 3.4 4.3 Taxes on goods and services 11.1 13.2 12.1 12.9 14.0 General taxes on goods and services 8.1 8.8 8.3 8.3 9.0 Excises 2.9 4.2 3.7 4.1 4.5 Taxes on specific services 0.1 0.1 0.1 0.1 0.1 Taxes on use of goods and on permission to use goods 0.0 0.0 0.0 0.0 0.0 Other taxes on goods and services 0.0 0.0 0.0 0.4 0.4 Taxes on international trade and transactions 1.1 0.8 0.7 0.6 0.7 Other taxes 1.4 0.4 0.4 0.0 0.0Social contributions 9.0 9.2 8.4 9.5 10.6 Social security contributions 7.9 8.4 7.8 9.5 10.6 Employee contributions 0.7 1.6 1.5 1.8 1.9 Employer contributions 6.3 5.3 4.8 6.6 7.5 Self-employed or nonemployed contributions
0.4 0.6 0.6 1.1 1.2
Unallocable contributions 0.5 0.9 0.8 0.0 0.0 Other social contributions
1.0 0.8 0.6 0.0 0.0
Grants
0.9 0.8 1.3 1.3 0.9 From foreign governments
0.8 0.7 1.2 0.0 0.0
From international organizations 0.0 0.0 0.0 0.9 0.9 From other general government units 0.1 0.1 0.2 0.4 0.0Other revenue 6.3 6.1 7.1 6.7 5.8 Property income 1.1 1.8 3.3 2.6 2.2 Sales of goods and services 2.9 2.7 2.8 1.7 1.5 Fines, penalties, and forfeits 1.8 1.3 0.9 0.9 0.7 Miscellaneous and unidentified revenue 0.4 0.3 0.1 1.5 1.4
Memorandum item Nominal GDP (in millions of leva) 23,790 26,753 29,709 32,324 34,410
Source: Ministry of Finance.
Table A26. Bulgaria: Revenue -- Consolidated Central Government (GFSM 2001 Definition), 1999-2003
(In millions of leva)
(In percent of GDP)

- 119 - STATISTICAL APPENDIX
1999 2000 2001 2002 2003 Prel.
Total outlays 7,999 9,333 10,139 11,293 12,417 General public services 2,395 2,678 2,475 2,399 2,293 Public debt transactions n.e.c. 893 1,067 1,096 702 721 Transfers of general character between levels of government 722 836 672 1,011 758 Defense 681 644 622 821 815 Public order and safety 533 509 554 865 949 Economic affairs 817 915 1,157 1,318 1,477 Agriculture, forestry, fishing and hunting 148 165 202 322 368 Fuel and energy 189 104 96 55 57 Mining, manufacturing, and construction 1 0 0 0 0 Transport 327 516 490 515 551 Housing and community amenities 109 134 193 105 87 Health 410 524 985 1,228 1,479 Recreation, culture and religion 142 154 143 151 195 Education 348 426 456 568 651 Social protection 2,689 3,461 3,622 3,892 4,637 Statistical discrepancy (sales of nonfinancial assets) -124 -112 -68 -54 -165 Expense 7,380 8,645 9,293 10,533 11,712
Compensation of employees 645 740 783 1,123 1,356 Wages and salaries 645 740 783 856 1,027 Social contributions 0 0 0 267 328 Actual social contributions 0 0 0 267 328 Imputed social contributions 0 0 0 0 0 Use of goods and services 2,068 2,112 2,088 2,535 2,740 Interest 893 1,067 1,096 701 721 Subsidies 388 255 543 587 738 Grants 736 844 723 1,011 758 To foreign governments 14 8 51 0 0 To other general government units 722 836 672 1,011 758 Social benefits 2,514 3,491 3,945 4,349 5,122 Social security benefits .... .... .... 3,672 4,121 Social assistance benefits .... .... .... 250 665 Employer social benefits .... .... .... 427 336 Other expense 136 135 115 227 276
Net Acquisition of Nonfinancial Assets 619 688 846 759 706 Fixed assets 632 677 834 748 721 Change in inventories -22 1 -1 13 -12 Nonproduced assets 9 9 13 -1 -3
Total outlays 33.6 34.9 34.1 34.9 36.1 General public services 10.1 10.0 8.3 7.4 6.7 Public debt transactions n.e.c. 3.8 4.0 3.7 2.2 2.1 Transfers of general character between levels of government 3.0 3.1 2.3 3.1 2.2 Defense 2.9 2.4 2.1 2.5 2.4 Public order and safety 2.2 1.9 1.9 2.7 2.8 Economic affairs 3.4 3.4 3.9 4.1 4.3 Agriculture, forestry, fishing and hunting 0.6 0.6 0.7 1.0 1.1 Fuel and energy 0.8 0.4 0.3 0.2 0.2 Mining, manufacturing, and construction 0.0 0.0 0.0 0.0 0.0 Transport 1.4 1.9 1.6 1.6 1.6 Housing and community amenities 0.5 0.5 0.6 0.3 0.3 Health 1.7 2.0 3.3 3.8 4.3 Recreation, culture and religion 0.6 0.6 0.5 0.5 0.6 Education 1.5 1.6 1.5 1.8 1.9 Social protection 11.3 12.9 12.2 12.0 13.5 Statistical discrepancy (sales of nonfinancial assets) -0.5 -0.4 -0.2 -0.2 -0.5 Expense 31.0 32.3 31.3 32.6 34.0
Compensation of employees 2.7 2.8 2.6 3.5 3.9 Wages and salaries 2.7 2.8 2.6 2.6 3.0 Social contributions 0.0 0.0 0.0 0.8 1.0 Use of goods and services 8.7 7.9 7.0 7.8 8.0 Interest 3.8 4.0 3.7 2.2 2.1 Subsidies 1.6 1.0 1.8 1.8 2.1 Grants 3.1 3.2 2.4 3.1 2.2 To foreign governments 0.1 0.0 0.2 0.0 0.0 To international organizations 0.0 0.0 0.0 0.0 0.0 To other general government units 3.0 3.1 2.3 3.1 2.2 Social benefits 10.6 13.1 13.3 13.5 14.9 Social security benefits .... .... .... 11.4 12.0 Social assistance benefits .... .... .... 0.8 1.9 Employer social benefits .... .... .... 1.3 1.0 Other expense 0.6 0.5 0.4 0.7 0.8
Net Acquisition of Nonfinancial Assets 2.6 2.6 2.8 2.3 2.1 Fixed assets 2.7 2.5 2.8 2.3 2.1 Change in inventories -0.1 0.0 0.0 0.0 0.0 Nonproduced assets 0.0 0.0 0.0 0.0 0.0 Memorandum item Nominal GDP (in millions of leva) 23,790 26,753 29,709 32,324 34,410 Source: Ministry of Finance.
Table A27. Bulgaria: Total Outlays -- Consolidated Centrall Government (GFSM 2001 Definition), 1999-2003
(In millions of leva)
(In percent of GDP)

- 120 - STATISTICAL APPENDIX
1999 2000 2001 2002 2003 Prel.
CASH FLOWS FROM OPERATING ACTIVITIES Cash receipts from operating activities 5,410 6,228 6,940 7,922 8,505 Taxes 4,018 4,805 5,132 5,437 6,527 Social contributions 4 0 0 0 0 Grants 181 67 52 496 61 Other receipts 1,206 1,355 1,756 1,989 1,916 Cash payments for operating activities 4,432 5,832 6,626 7,294 8,030 Compensation of employees 595 700 733 1,082 1,308 Purchases of goods and services 1,789 1,863 1,902 2,425 2,640 Interest 890 1,057 1,094 700 720 Subsidies 326 240 502 552 684 Grants 736 1,710 2,168 2,136 1,958 Social benefits 14 169 134 238 554 Other payments 82 94 93 161 166 Net cash inflow from operating activities 978 396 314 628 475 CASH FLOWS FROM INVESTMENTS IN NONFINANCIAL ASSETSNet cash outflow from investments in nonfinancial assets 308 516 677 598 562 Fixed assets 324 503 665 587 577 Change in inventories -15 2 0 13 -12 Nonproduced assets -1 11 13 -1 -3 Cash surplus / deficit 670 -120 -363 30 -86 CASH FLOWS FROM FINANCING ACTIVITIES Net Acquisition of Financial Assets other than Cash -288 -297 -533 -1,140 -317 Domestic -278 -271 -506 -128 -256 Foreign -10 -26 -26 -1,012 -62 Net Incurrence of Liabilities 115 -513 -318 -402 214 Domestic 59 15 -215 127 304 Foreign 56 -528 -103 -529 -90 Net cash inflow from financing activities 403 -216 215 738 531 Net change in the stock of cash 1,073 -337 -148 768 445
CASH FLOWS FROM OPERATING ACTIVITIES Cash receipts from operating activities 22.7 23.3 23.4 24.5 24.7 Taxes 16.9 18.0 17.3 16.8 19.0 Social contributions 0.0 0.0 0.0 0.0 0.0 Grants 0.8 0.3 0.2 1.5 0.2 Other receipts 5.1 5.1 5.9 6.2 5.6 Cash payments for operating activities 18.6 21.8 22.3 22.6 23.3 Compensation of employees 2.5 2.6 2.5 3.3 3.8 Purchases of goods and services 7.5 7.0 6.4 7.5 7.7 Interest 3.7 3.9 3.7 2.2 2.1 Subsidies 1.4 0.9 1.7 1.7 2.0 Grants 3.1 6.4 7.3 6.6 5.7 Social benefits 0.1 0.6 0.4 0.7 1.6 Other payments 0.3 0.3 0.3 0.5 0.5 Net cash inflow from operating activities 4.1 1.5 1.1 1.9 1.4 CASH FLOWS FROM INVESTMENTS IN NONFINANCIAL ASSETSNet cash outflow from investments in nonfinancial assets 1.3 1.9 2.3 1.9 1.6 Fixed assets 1.4 1.9 2.2 1.8 1.7 Change in inventories -0.1 0.0 0.0 0.0 0.0 Nonproduced assets 0.0 0.0 0.0 0.0 0.0 Cash surplus / deficit 2.8 -0.5 -1.2 0.1 -0.3 CASH FLOWS FROM FINANCING ACTIVITIES Net Acquisition of Financial Assets other than Cash -1.2 -1.1 -1.8 -3.5 -0.9 Domestic -1.2 -1.0 -1.7 -0.4 -0.7 Foreign 0.0 -0.1 -0.1 -3.1 -0.2 Net Incurrence of Liabilities 0.5 -1.9 -1.1 -1.2 0.6 Domestic 0.2 0.1 -0.7 0.4 0.9 Foreign 0.2 -2.0 -0.3 -1.6 -0.3 Net cash inflow from financing activities 1.7 -0.8 0.7 2.3 1.5 Net change in the stock of cash 4.5 -1.3 -0.5 2.4 1.3 Memorandum item Nominal GDP (in millions of leva) 23,790 26,753 29,709 32,324 34,410
Source: Ministry of Finance.
Table A28 Bulgaria: Cash Flow Statement -- Budgetary Central Government (GFSM 2001 Definition), 1999-2003
(In millions of leva)
(In percent of GDP)

- 121 - STATISTICAL APPENDIX
1999 2000 2001 2002 2003Prel.
CASH FLOWS FROM OPERATING ACTIVITIES
Cash receipts from operating activities 665 376 637 390 546 Taxes 243 94 53 2 0 Social contributions 8 0 0 0 0 Grants 194 148 395 369 532 Other receipts 220 134 189 19 14
Cash payments for operating activities 1,121 522 281 527 257 Compensation of employees 27 7 10 7 5 Purchases of goods and services 191 219 153 88 78 Interest 2 9 0 0 0 Subsidies 62 14 40 36 54 Grants 733 213 38 330 9 Social benefits 52 18 19 0 0 Other payments 54 42 22 66 110
Net cash inflow from operating activities -456 -146 356 -137 289CASH FLOWS FROM INVESTMENTS IN NONFINANCIAL ASSETSNet cash outflow from investments in nonfinancial assets 212 144 151 157 142 Fixed assets 221 147 153 157 142 Change in inventories -7 -1 0 0 0 Nonproduced assets -1 -2 -1 0 0
Cash surplus / deficit -668 -290 205 -294 146CASH FLOWS FROM FINANCING ACTIVITIESNet Acquisition of Financial Assets other than Cash 37 37 33 -27 60 Domestic 37 37 33 -27 60Net Incurrence of Liabilities 97 76 40 39 -1 Domestic -9 -8 2 0 -2 Foreign 107 84 38 39 0Net cash inflow from financing activities 61 39 7 66 -61
Net change in the stock of cash -608 -251 212 -228 85
CASH FLOWS FROM OPERATING ACTIVITIES
Cash receipts from operating activities 2.8 1.4 2.1 1.2 1.6 Taxes 1.0 0.4 0.2 0.0 0.0 Social contributions 0.0 0.0 0.0 0.0 0.0 Grants 0.8 0.6 1.3 1.1 1.5 Other receipts 0.9 0.5 0.6 0.1 0.0Cash payments for operating activities 4.7 2.0 0.9 1.6 0.7 Compensation of employees 0.1 0.0 0.0 0.0 0.0 Purchases of goods and services 0.8 0.8 0.5 0.3 0.2 Interest 0.0 0.0 0.0 0.0 0.0 Subsidies 0.3 0.1 0.1 0.1 0.2 Grants 3.1 0.8 0.1 1.0 0.0 Social benefits 0.2 0.1 0.1 0.0 0.0 Other payments 0.2 0.2 0.1 0.2 0.3Net cash inflow from operating activities -1.9 -0.5 1.2 -0.4 0.8CASH FLOWS FROM INVESTMENTS IN NONFINANCIAL ASSETSNet cash outflow from investments in nonfinancial assets 0.9 0.5 0.5 0.5 0.4 Fixed assets 0.9 0.6 0.5 0.5 0.4 Change in inventories 0.0 0.0 0.0 0.0 0.0 Nonproduced assets 0.0 0.0 0.0 0.0 0.0Cash surplus / deficit -2.8 -1.1 0.7 -0.9 0.4CASH FLOWS FROM FINANCING ACTIVITIESNet Acquisition of Financial Assets other than Cash 0.2 0.1 0.1 -0.1 0.2 Domestic 0.2 0.1 0.1 -0.1 0.2Net Incurrence of Liabilities 0.4 0.3 0.1 0.1 0.0 Domestic 0.0 0.0 0.0 0.0 0.0 Foreign 0.4 0.3 0.1 0.1 0.0Net cash inflow from financing activities 0.3 0.1 0.0 0.2 -0.2Net change in the stock of cash -2.6 -0.9 0.7 -0.7 0.2
Memorandum item Nominal GDP (in millions of leva) 23,790 26,753 29,709 32,324 34,410
Source: Ministry of Finance.
Table A28a. Bulgaria: Cash Flow Statement -- Extrabudgetary Accounts (GFSM 2001 Definition), 1999-2003
(In millions of leva)
(In percent of GDP)

- 122 - STATISTICAL APPENDIX
1999 2000 2001 2002 2003Prel.
CASH FLOWS FROM OPERATING ACTIVITIES
Cash receipts from operating activities 2,754 3,703 4,105 4,264 4,646 Taxes 0 0 0 0 0 Social contributions 2,119 2,469 2,498 3,075 3,654 Grants 572 1,078 1,430 1,027 925 Other receipts 63 156 177 162 67
Cash payments for operating activities 2,560 3,370 3,869 4,173 4,637 Compensation of employees 23 34 41 34 43 Purchases of goods and services 88 30 34 21 22 Interest 0 1 2 1 1 Grants 0 0 0 5 4 Social benefits 2,448 3,305 3,793 4,111 4,568 Other payments 0 0 0 0 0
Net cash inflow from operating activities 194 333 235 91 9CASH FLOWS FROM INVESTMENTS IN NONFINANCIAL ASSETSNet cash outflow from investments in nonfinancial assets 98 28 18 4 2 Fixed assets 87 27 17 4 2 Change in inventories 0 0 0 0 0 Valuables 0 0 0 0 0 Nonproduced assets 11 0 1 0 0
Cash surplus / deficit 96 306 218 87 7CASH FLOWS FROM FINANCING ACTIVITIESNet Acquisition of Financial Assets other than Cash 0 0 0 2 -1 Domestic 0 0 0 2 -1Net Incurrence of Liabilities 15 6 1 -1 -9 Domestic 0 -5 -11 0 2 Foreign 15 11 13 -1 -12Net cash inflow from financing activities 15 6 1 -3 -8
Net change in the stock of cash 111 312 219 84 -1
CASH FLOWS FROM OPERATING ACTIVITIES
Cash receipts from operating activities 11.6 13.8 13.8 13.2 13.5 Taxes 0.0 0.0 0.0 0.0 0.0 Social contributions 8.9 9.2 8.4 9.5 10.6 Grants 2.4 4.0 4.8 3.2 2.7 Other receipts 0.3 0.6 0.6 0.5 0.2Cash payments for operating activities 10.8 12.6 13.0 12.9 13.5 Compensation of employees 0.1 0.1 0.1 0.1 0.1 Purchases of goods and services 0.4 0.1 0.1 0.1 0.1 Interest 0.0 0.0 0.0 0.0 0.0 Grants 0.0 0.0 0.0 0.0 0.0 Social benefits 10.3 12.4 12.8 12.7 13.3 Other payments 0.0 0.0 0.0 0.0 0.0Net cash inflow from operating activities 0.8 1.2 0.8 0.3 0.0
CASH FLOWS FROM INVESTMENTS IN NONFINANCIAL ASSETSNet cash outflow from investments in nonfinancial assets 0.4 0.1 0.1 0.0 0.0 Fixed assets 0.4 0.1 0.1 0.0 0.0 Change in inventories 0.0 0.0 0.0 0.0 0.0 Valuables 0.0 0.0 0.0 0.0 0.0 Nonproduced assets 0.0 0.0 0.0 0.0 0.0Cash surplus / deficit 0.4 1.1 0.7 0.3 0.0
CASH FLOWS FROM FINANCING ACTIVITIESNet Acquisition of Financial Assets other than Cash 0.0 0.0 0.0 0.0 0.0 Domestic 0.0 0.0 0.0 0.0 0.0Net Incurrence of Liabilities 0.1 0.0 0.0 0.0 0.0 Domestic 0.0 0.0 0.0 0.0 0.0 Foreign 0.1 0.0 0.0 0.0 0.0Net cash inflow from financing activities 0.1 0.0 0.0 0.0 0.0Net change in the stock of cash 0.5 1.2 0.7 0.3 0.0
Memorandum item Nominal GDP (in millions of leva) 23,790 26,753 29,709 32,324 34,410
Source: Ministry of Finance.
Table A29. Bulgaria: Cash Flow Statement -- Social Security Funds (GFSM 2001 Definition), 1999-2003
(In millions of leva)
(In percent of GDP)

- 123 - STATISTICAL APPENDIX
1999 2000 2001 2002 2003Prel.
CASH FLOWS FROM OPERATING ACTIVITIES
Cash receipts from operating activities 1,800 1,935 1,987 2,451 2,093 Taxes 848 865 1,020 1,227 1,107 Social contributions 0 0 0 0 0 Grants 722 836 673 1,022 766 Other receipts 230 234 294 202 220
Cash payments for operating activities 1,704 1,863 1,839 2,281 1,955 Compensation of employees 990 820 700 823 957 Purchases of goods and services 675 733 630 758 769 Interest 1 10 10 11 2 Subsidies .... .... .... 185 202 Grants 0 16 46 141 2 Social benefits .... .... .... 347 6 Other payments .... .... .... 17 17
Net cash inflow from operating activities 96 72 149 170 138CASH FLOWS FROM INVESTMENTS IN NONFINANCIAL ASSETSNet cash outflow from investments in nonfinancial assets 153 134 148 201 204 Fixed assets 0 0 0 230 264 Nonproduced assets 0 0 0 -29 -60
Cash surplus / deficit -57 -62 1 -31 -66CASH FLOWS FROM FINANCING ACTIVITIESNet Acquisition of Financial Assets other than Cash 0 -1 -56 -53 -55 Domestic 0 -1 -56 -53 -55Net Incurrence of Liabilities 28 71 -46 -14 33 Domestic -68 71 24 10 17 Foreign 96 0 -70 -24 15Net cash inflow from financing activities 28 72 10 39 87
Net change in the stock of cash -29 9 11 8 21
CASH FLOWS FROM OPERATING ACTIVITIES
Cash receipts from operating activities 7.6 7.2 6.7 7.6 6.1 Taxes 3.6 3.2 3.4 3.8 3.2 Social contributions 0.0 0.0 0.0 0.0 0.0 Grants 3.0 3.1 2.3 3.2 2.2 Other receipts 1.0 0.9 1.0 0.6 0.6Cash payments for operating activities 7.2 7.0 6.2 7.1 5.7 Compensation of employees 4.2 3.1 2.4 2.5 2.8 Purchases of goods and services 2.8 2.7 2.1 2.3 2.2 Interest 0.0 0.0 0.0 0.0 0.0 Subsidies .... .... .... 0.6 0.6 Grants 0.0 0.1 0.2 0.4 0.0 Social benefits .... .... .... 1.1 0.0 Other payments .... .... .... 0.1 0.1Net cash inflow from operating activities 0.4 0.3 0.5 0.5 0.4CASH FLOWS FROM INVESTMENTS IN NONFINANCIAL ASSETSNet cash outflow from investments in nonfinancial assets 0.6 0.5 0.5 0.6 0.6 Fixed assets 0.0 0.0 0.0 0.7 0.8 Nonproduced assets 0.0 0.0 0.0 -0.1 -0.2Cash surplus / deficit -0.2 -0.2 0.0 -0.1 -0.2CASH FLOWS FROM FINANCING ACTIVITIESNet Acquisition of Financial Assets other than Cash 0.0 0.0 -0.2 -0.2 -0.2 Domestic 0.0 0.0 -0.2 -0.2 -0.2Net Incurrence of Liabilities 0.1 0.3 -0.2 0.0 0.1 Domestic -0.3 0.3 0.1 0.0 0.1 Foreign 0.4 0.0 -0.2 -0.1 0.0Net cash inflow from financing activities 0.1 0.3 0.0 0.1 0.3Net change in the stock of cash -0.1 0.0 0.0 0.0 0.1
Memorandum item Nominal GDP (in millions of leva) 23,790 26,753 29,709 32,324 34,410
Source: Ministry of Finance.
Table A30. Bulgaria: Cash Flow Statement -- Local Governments (GFSM 2001 Definition), 1999-2003
(In millions of leva)
(In percent of GDP)

- 124 - STATISTICAL APPENDIX
1998 1999 2000 2001 2002 2003
Broad money 1/ 6,647 7,536 9,857 12,401 13,857 16,566Currency outside banks 1,743 1,962 2,374 3,081 3,335 3,874Deposits 4,904 5,574 7,483 9,319 10,519 12,591
in levs 2,395 2,772 3,438 4,400 5,302 6,514in foreign currency 2,509 2,802 4,044 4,919 5,218 6,077
Repos and debt securities issued ... ... ... ... 3 102in levs ... ... ... ... 3 86in foreign currency ... ... ... ... 0 16
Long term financial liabilities ... ... ... 2,888 3,402 3,982Deposits 2/ ... ... ... 15 94 202
in levs ... ... ... 12 74 118in foreign currency ... ... ... 2 20 84
Debt securities issued ... ... ... 6 16 54in levs ... ... ... 0 5 5in foreign currency ... ... ... 6 11 49
Capital and reserves 2,051 2,303 2,684 2,867 3,293 3,726
Net foreign assets 5,638 6,566 8,196 9,454 9,892 10,049BNB 3,390 3,996 4,661 5,485 6,982 8,545DMB 2,247 2,570 3,535 3,969 2,910 1,504
Net domestic assets 3,060 3,273 4,345 5,835 7,368 10,499Domestic credit 3,503 3,640 4,770 6,009 7,656 10,251
Lev credit 1,628 1,335 2,153 3,002 4,227 5,643Government (net) 3/ 179 -402 -19 138 472 218Non-government 1,449 1,737 2,171 2,864 3,755 5,425
Nonfinancial corporations 976 1,220 1,564 1,960 2,437 3,086Nonbank financial corporations 2 3 9 15 33 60Households and NPISHs 472 514 599 888 1,285 2,279
Foreign currency credit 1,874 2,305 2,618 3,006 3,430 4,608Government (net) 3/ 957 1,168 1,426 1,427 788 546Non-government 917 1,137 1,191 1,579 2,642 4,062
Nonfinancial corporations 904 1,116 1,151 1,489 2,472 3,646Nonbank financial corporations 10 14 21 44 70 194Households and NPISHs 4 8 20 46 100 223
Fixed assets 599 674 759 879 951 1,183Other items net -1,042 -1,042 -1,185 -1,052 -1,239 -935
Broad money 11.8 13.4 30.8 25.8 11.7 19.6Lev deposits 9.1 15.7 24.1 28.0 20.5 22.9Foreign currency deposits 3.0 11.7 44.3 21.6 6.1 16.5
Real broad money 9.9 6.0 17.4 20.0 7.6 13.2
Domestic credit -3.4 3.9 31.0 26.0 27.4 33.9Government -43.2 -32.6 83.8 11.2 -19.6 -39.3Non-government 45.5 21.4 17.0 32.1 44.0 48.3
Nonfinancial corporations 29.5 24.3 16.2 27.1 42.3 37.1Nonbank financial corporations 46.5 41.0 74.2 104.7 73.1 146.8Households and NPISHs 184.4 9.7 18.5 51.0 48.3 80.7
Foreign currency deposits 1,284 1,433 2,068 2,515 2,668 3,107(In percent of broad money) 37.7 37.2 41.0 39.7 37.7 36.7
Net foreign assets 2,885 3,357 4,190 4,834 5,058 5,138BNB 1,735 2,043 2,383 2,805 3,570 4,369DMB 1,150 1,314 1,807 2,029 1,488 769
Sources: Bulgarian National Bank; and Fund staff estimates.
1/ In February 2004, monetary data were recast to further harmonize with ECB requirements. Among the changes is the creation of a new category outside broad money called long-term financial liabilities. 2/ Long-term deposits include deposits with agreed maturity over 2 years and deposits redeemable at notice over 3 months which are not included in broad money. 3/ Includes net claims on central government and gross claims on local government and SSF's.
(In millions of euros)
Table A31. Bulgaria: Monetary Survey, 1998-2003
(In millions of leva)
(Percent change from previous year)

- 125 - STATISTICAL APPENDIX
Tabl
e A
32. B
ulga
ria: F
orei
gn A
sset
s of t
he B
anki
ng S
yste
m, 1
998-
2003
Dep
osit
Mon
ey B
anks
Ban
king
Sys
tem
Fore
ign
Inte
rnat
iona
lIM
F
N
et
Fo
reig
nN
et fo
reig
nRe
serv
esFo
reig
nFo
reig
n cu
rren
cyFo
reig
nB
road
as
sets
rese
rves
pu
rcha
ses
rese
rves
1/
liabi
litie
sas
sets
less
gol
das
sets
2/de
posi
ts 3
/as
sets
m
oney
1998
:M
arch
2,73
32,
570
901
1,66
990
11,
832
2,21
91,
382
1,27
43,
952
3,24
1Ju
ne2,
978
2,89
71,
042
1,85
51,
042
1,93
62,
540
1,41
01,
283
4,30
73,
347
Sep.
2,
871
2,78
898
11,
808
981
1,89
02,
401
1,47
31,
338
4,26
13,
630
Dec
.3,
139
3,05
61,
115
1,94
11,
115
2,02
42,
684
1,46
91,
339
4,52
53,
968
1999
:M
arch
2,86
02,
780
1,11
51,
665
1,11
51,
745
2,42
81,
369
1,24
54,
149
3,45
4Ju
ne2,
804
2,72
61,
132
1,59
41,
132
1,67
32,
391
1,33
51,
101
4,06
13,
291
Sep.
2,96
12,
882
1,21
91,
662
1,21
91,
742
2,53
21,
615
1,36
54,
496
3,68
3D
ec.
3,30
23,
222
1,24
91,
972
1,24
92,
052
2,89
21,
492
1,25
24,
713
3,87
1
2000
:M
arch
2,95
12,
875
1,20
91,
666
1,20
91,
742
2,56
11,
755
1,49
54,
630
3,76
5Ju
ne3,
223
3,14
51,
314
1,83
11,
314
1,90
92,
832
1,76
81,
445
4,91
33,
728
Sep.
3,03
82,
959
1,31
61,
643
1,31
61,
722
2,67
12,
064
1,76
45,
023
3,96
7D
ec.
3,54
03,
460
1,32
32,
137
1,32
32,
218
3,15
51,
942
1,70
05,
402
4,68
9
2001
:M
arch
3,16
33,
080
1,28
41,
796
1,28
41,
879
2,79
02,
173
1,83
45,
252
4,61
7Ju
ne3,
123
3,04
01,
261
1,77
91,
261
1,86
22,
761
2,06
91,
826
5,10
84,
537
Sep.
3,20
33,
120
1,22
11,
899
1,22
11,
982
2,82
02,
154
1,80
05,
274
5,18
3D
ec.
3,58
13,
580
1,10
92,
471
1,10
92,
472
3,29
12,
102
1,62
95,
682
5,58
8
2002
:M
arch
3,21
03,
210
1,07
32,
137
1,07
32,
137
2,92
42,
103
1,62
65,
313
5,50
0Ju
ne4,
034
4,03
31,
060
2,97
41,
060
2,97
43,
706
1,88
21,
399
5,91
56,
173
Sep.
4,28
44,
283
1,06
53,
219
1,06
53,
219
3,96
01,
992
1,51
26,
276
6,46
0D
ec.
4,74
74,
747
1,04
33,
704
1,04
33,
704
4,40
72,
018
1,47
96,
764
7,35
2
2003
:M
arch
4,79
34,
792
1,06
93,
724
1,06
93,
724
4,43
52,
108
1,53
86,
900
7,61
1Ju
ne5,
522
5,52
21,
085
4,43
71,
085
4,43
85,
148
1,89
91,
356
7,42
18,
371
Sep.
5,88
85,
887
1,16
94,
718
1,16
94,
719
5,50
52,
097
1,44
37,
985
9,08
1D
ec.
6,70
56,
705
1,18
85,
517
1,18
85,
518
6,29
11,
939
1,19
78,
644
10,6
98
Sour
ces:
Bul
garia
n N
atio
nal B
ank;
and
staf
f cal
cula
tions
.
1/ I
nter
natio
nal r
eser
ves n
et o
f out
stand
ing
purc
hase
s fro
m th
e IM
F.2/
Inc
lude
s cla
ims i
n no
n-co
nver
tible
cur
renc
y an
d ot
her i
lliqu
id a
sset
s in
addi
tion
to c
laim
s on
nonr
esid
ent b
anks
.3/
Incl
udes
ove
rnig
ht d
epos
its, d
epos
its w
ith a
gree
d m
atur
ity a
nd d
epos
its re
deem
able
at n
otic
e in
fore
ign
curr
ency
with
non
-resid
ents
(to
date
, the
latte
r cat
egor
y ha
s bee
n ze
ro).
BN
B In
tern
atio
nal R
eser
ves
(In
mill
ions
of U
.S. d
olla
rs)

- 126 - STATISTICAL APPENDIX
Tabl
e A
33. B
ulga
ria: C
ompo
sitio
n of
Bro
ad M
oney
, 199
8-20
03
Cur
renc
y
N
arro
w
R
epur
chas
eD
ebt s
ecur
ities
Bro
ad m
oney
outs
ide
bank
sin
lev
in fo
reig
n cu
rren
cyto
tal
mon
ey (M
I)in
lev
in fo
reig
n cu
rren
cyto
tal
in le
vin
fore
ign
curr
ency
tota
lM
2ag
reem
ents
issu
ed u
p to
2 y
ears
(M3)
(In
mill
ions
of l
eva)
1998
:M
arch
1,28
793
382
91,
762
3,04
892
81,
358
2,28
523
637
561
15,
945
......
5,94
5Ju
ne1,
417
914
829
1,74
33,
161
912
1,36
32,
275
252
370
622
6,05
8...
...6,
058
Sep.
1,46
489
890
41,
803
3,26
788
31,
309
2,19
125
835
761
46,
073
......
6,07
3D
ec.
1,74
31,
218
745
1,96
33,
706
886
1,38
42,
270
291
380
671
6,64
7...
...6,
647
1999
:M
arch
1,56
81,
034
759
1,79
33,
361
873
1,36
42,
237
306
385
691
6,28
9...
...6,
289
June
1,48
01,
025
769
1,79
53,
275
818
1,43
62,
254
311
393
704
6,23
3...
...6,
233
Sep.
1,68
81,
145
761
1,90
53,
593
907
1,53
02,
437
339
385
725
6,75
5...
...6,
755
Dec
.1,
962
1,34
473
32,
077
4,03
81,
041
1,65
92,
700
387
410
797
7,53
6...
...7,
536
2000
:M
arch
1,82
51,
386
881
2,26
74,
092
1,03
51,
752
2,78
640
542
483
07,
708
......
7,70
8Ju
ne1,
876
1,18
183
52,
017
3,89
21,
058
1,83
72,
895
408
433
842
7,62
9...
...7,
629
Sep.
2,11
11,
429
897
2,32
64,
437
1,47
52,
029
3,50
442
548
591
18,
851
......
8,85
1D
ec.
2,37
41,
602
821
2,42
34,
797
1,38
52,
733
4,11
845
149
094
29,
857
......
9,85
7
2001
:M
arch
2,22
51,
785
899
2,68
44,
909
1,47
42,
859
4,33
347
151
298
310
,225
......
10,2
25Ju
ne2,
428
1,61
01,
001
2,61
25,
039
1,80
42,
576
4,38
048
855
71,
045
10,4
64...
...10
,464
Sep.
2,60
21,
672
1,04
22,
714
5,31
61,
901
2,79
84,
699
509
579
1,08
811
,102
......
11,1
02D
ec.
3,08
11,
802
1,15
02,
952
6,03
32,
050
3,08
55,
135
548
684
1,23
212
,401
......
12,4
01
2002
:M
arch
2,85
51,
737
1,06
92,
806
5,66
12,
075
3,34
55,
420
566
682
1,24
812
,330
......
12,3
30Ju
ne2,
828
1,57
31,
135
2,70
85,
537
2,24
73,
094
5,34
256
466
01,
223
12,1
01...
212
,103
Sep.
3,02
21,
781
1,16
62,
947
5,96
92,
230
3,31
45,
544
590
710
1,30
012
,813
...2
12,8
15D
ec.
3,33
52,
207
1,15
43,
361
6,69
62,
449
3,33
35,
782
645
731
1,37
613
,854
...3
13,8
57
2003
:M
arch
3,08
81,
999
1,18
73,
186
6,27
42,
434
3,43
55,
870
655
742
1,39
713
,542
118
313
,662
June
3,35
62,
227
1,25
13,
479
6,83
42,
530
3,38
55,
915
687
761
1,44
814
,197
128
214
,328
Sep.
3,62
42,
437
1,35
63,
792
7,41
62,
646
3,48
16,
127
728
802
1,53
015
,073
165
515
,243
Dec
.3,
874
2,92
71,
229
4,15
68,
030
2,79
74,
018
6,81
579
083
01,
620
16,4
6599
216
,566
(In
perc
ent o
f bro
ad m
oney
)
1998
:M
arch
21.6
15.7
13.9
29.6
51.3
15.6
22.8
38.4
4.0
6.3
10.3
100.
0...
...10
0.0
June
23.4
15.1
13.7
28.8
52.2
15.1
22.5
37.6
4.2
6.1
10.3
100.
0...
...10
0.0
Sep.
24.1
14.8
14.9
29.7
53.8
14.5
21.5
36.1
4.2
5.9
10.1
100.
0...
...10
0.0
Dec
.26
.218
.311
.229
.555
.813
.320
.834
.14.
45.
710
.110
0.0
......
100.
0
1999
:M
arch
24.9
16.4
12.1
28.5
53.4
13.9
21.7
35.6
4.9
6.1
11.0
100.
0...
...10
0.0
June
23.8
16.5
12.3
28.8
52.5
13.1
23.0
36.2
5.0
6.3
11.3
100.
0...
...10
0.0
Sep.
25.0
16.9
11.3
28.2
53.2
13.4
22.6
36.1
5.0
5.7
10.7
100.
0...
...10
0.0
Dec
.26
.017
.89.
727
.653
.613
.822
.035
.85.
15.
410
.610
0.0
......
100.
0
2000
:M
arch
23.7
18.0
11.4
29.4
53.1
13.4
22.7
36.1
5.3
5.5
10.8
100.
0...
...10
0.0
June
24.6
15.5
10.9
26.4
51.0
13.9
24.1
38.0
5.4
5.7
11.0
100.
0...
...10
0.0
Sep.
23.9
16.1
10.1
26.3
50.1
16.7
22.9
39.6
4.8
5.5
10.3
100.
0...
...10
0.0
Dec
.24
.116
.38.
324
.648
.714
.127
.741
.84.
65.
09.
610
0.0
......
100.
0
2001
:M
arch
21.8
17.5
8.8
26.2
48.0
14.4
28.0
42.4
4.6
5.0
9.6
100.
0...
...10
0.0
June
23.2
15.4
9.6
25.0
48.2
17.2
24.6
41.9
4.7
5.3
10.0
100.
0...
...10
0.0
Sep.
23.4
15.1
9.4
24.4
47.9
17.1
25.2
42.3
4.6
5.2
9.8
100.
0...
...10
0.0
Dec
.24
.814
.59.
323
.848
.716
.524
.941
.44.
45.
59.
910
0.0
......
100.
0
2002
:M
arch
23.2
14.1
8.7
22.8
45.9
16.8
27.1
44.0
4.6
5.5
10.1
100.
0...
...10
0.0
June
23.4
13.0
9.4
22.4
45.7
18.6
25.6
44.1
4.7
5.5
10.1
100.
0...
0.0
100.
0Se
p.23
.613
.99.
123
.046
.617
.425
.943
.34.
65.
510
.110
0.0
...0.
010
0.0
Dec
.24
.115
.98.
324
.348
.317
.724
.141
.74.
75.
39.
910
0.0
...0.
010
0.0
2003
:M
arch
22.6
14.6
8.7
23.3
45.9
17.8
25.1
43.0
4.8
5.4
10.2
99.1
0.9
0.0
100.
0Ju
ne23
.415
.58.
724
.347
.717
.723
.641
.34.
85.
310
.199
.10.
90.
010
0.0
Sep.
23.8
16.0
8.9
24.9
48.7
17.4
22.8
40.2
4.8
5.3
10.0
98.9
1.1
0.0
100.
0D
ec.
23.4
17.7
7.4
25.1
48.5
16.9
24.3
41.1
4.8
5.0
9.8
99.4
0.6
0.0
100.
0
Sour
ces:
Bul
garia
n N
atio
nal B
ank;
and
Fun
d st
aff e
stim
ates
.
Ove
rnig
ht d
epos
itsD
epos
its w
ith a
gree
d m
atur
ity u
p to
2 y
ears
Dep
osits
rede
emab
le a
t not
ice
up to
3 m
onth
s

- 127 - STATISTICAL APPENDIX
Table A34. Bulgaria: Nominal Interest Rates and Exchange Rates, 1998-2004
BNB basic rate DMB lending rate Time deposit rate Time deposit Lev per U.S. dollarMonthly Annual Monthly Annual Monthly Annual U.S. dollar End-month Month average
(In percent, lev denominated unless otherwise noted)
1998: Jan. 0.5 6.6 1.2 14.9 0.2 3.0 4.0 1.8092 1.8121Feb. 0.5 5.9 1.1 14.4 0.2 2.9 3.9 1.8202 1.8149Mar. 0.4 5.5 1.1 13.8 0.2 2.8 3.9 1.8340 1.8264Apr. 0.4 5.5 1.1 14.6 0.2 2.8 3.8 1.7980 1.8179May 0.4 5.4 1.2 15.4 0.2 2.7 3.9 1.7824 1.7756Jun. 0.4 5.3 1.1 14.3 0.2 2.7 3.8 1.8102 1.7906Jul. 0.4 5.3 1.1 13.9 0.2 3.0 3.8 1.7690 1.7992Aug. 0.4 5.3 1.0 13.2 0.3 3.3 3.9 1.7918 1.7890Sep. 0.4 5.2 1.1 13.4 0.3 3.3 3.8 1.6732 1.7076Oct. 0.4 5.3 1.1 14.1 0.3 3.3 3.7 1.6475 1.6389Nov. 0.4 5.4 1.1 14.1 0.3 3.3 3.7 1.7026 1.6792Dec. 0.4 5.2 1.1 13.5 0.3 3.3 3.8 1.6751 1.6703
1999: Jan. 0.4 5.2 1.1 14.4 0.3 3.3 3.6 1.7181 1.6846Feb. 0.4 5.1 1.1 13.7 0.3 3.3 3.5 1.7751 1.7453Mar. 0.4 5.0 1.1 14.6 0.3 3.3 3.5 1.8157 1.7973Apr. 0.4 4.8 1.1 13.8 0.3 3.3 3.5 1.8456 1.8279May 0.4 4.6 1.0 13.3 0.3 3.3 3.4 1.8705 1.8425Jun. 0.4 4.5 1.1 13.8 0.3 3.3 3.5 1.8937 1.8847Jul. 0.4 4.9 1.0 12.4 0.3 3.3 3.5 1.8289 1.8899Aug. 0.4 4.9 1.1 13.8 0.3 3.2 3.5 1.8498 1.8447Sep. 0.4 4.8 1.1 13.6 0.3 3.2 3.5 1.8339 1.8631Oct. 0.4 4.5 1.1 13.4 0.3 3.2 3.5 1.8711 1.8266Nov. 0.4 4.5 1.1 13.5 0.3 3.2 3.5 1.9370 1.8922Dec. 0.4 4.6 1.0 12.4 0.3 3.2 3.5 1.9469 1.9356
2000: Jan. 0.4 4.4 1.0 12.5 0.3 3.2 3.5 1.9976 1.9303Feb. 0.3 3.5 0.9 11.9 0.2 2.8 4.3 2.0134 1.9890Mar. 0.3 3.3 0.8 9.5 0.3 3.3 4.4 2.0474 2.0276Apr. 0.3 3.7 1.1 13.6 0.3 3.1 4.5 2.1528 2.0680May 0.3 3.6 1.1 13.8 0.2 2.9 4.7 2.1024 2.1588Jun. 0.3 3.7 1.0 12.5 0.3 3.3 4.7 2.0467 2.0608Jul. 0.3 3.8 0.9 11.0 0.2 3.0 4.6 2.1160 2.0817Aug. 0.3 3.6 1.0 12.7 0.3 3.4 4.6 2.1961 2.1636Sep. 0.3 4.0 0.9 11.7 0.3 3.3 4.7 2.2314 2.2469Oct. 0.3 4.2 1.0 13.3 0.3 3.2 4.6 2.3237 2.2871Nov. 0.4 4.6 0.9 11.2 0.3 3.5 4.8 2.2522 2.2841Dec. 0.4 4.7 1.0 12.2 0.3 3.3 4.8 2.1019 2.1745
2001: Jan. 0.4 4.6 1.1 14.2 0.3 3.1 4.2 2.1046 2.0855Feb. 0.3 4.2 1.0 12.5 0.3 3.2 4.1 2.1149 2.1223Mar. 0.3 4.3 0.8 10.6 0.3 3.1 4.0 2.2145 2.1513Apr. 0.4 4.4 0.8 9.7 0.3 3.2 3.6 2.1676 2.1928May 0.4 4.5 0.8 10.7 0.3 3.1 3.3 2.3064 2.2351Jun. 0.4 4.6 1.0 12.2 0.3 3.3 3.1 2.3064 2.2925Jul. 0.4 4.6 0.9 11.7 0.3 3.4 2.9 2.2350 2.2730Aug. 0.4 4.7 1.0 12.1 0.3 3.8 2.8 2.1357 2.1734Sep. 0.4 4.8 0.9 11.8 0.2 3.0 2.3 2.1420 2.1464Oct. 0.4 4.7 0.8 9.8 0.2 2.9 2.1 2.1631 2.1594Nov. 0.4 4.8 0.9 11.9 0.2 2.5 1.8 2.1981 2.2020Dec. 0.4 4.8 1.0 13.2 0.3 3.4 1.7 2.2193 2.1903
2002: Jan. 0.4 4.9 0.8 10.1 0.2 2.7 1.7 2.2645 2.2149Feb. 0.4 4.7 0.8 9.8 0.2 2.9 1.6 2.2608 2.2480Mar. 0.4 4.5 0.8 9.7 0.2 2.4 1.7 2.2419 2.2337Apr. 0.3 4.2 0.8 10.1 0.3 3.1 1.6 2.1712 2.2096May. 0.3 4.0 0.8 9.6 0.2 3.0 1.6 2.0836 2.1418Jun. 0.3 3.8 0.8 9.7 0.3 3.2 1.7 1.9607 2.0478Jul. 0.3 3.7 0.8 10.3 0.3 3.5 1.6 1.9992 1.9715Aug. 0.3 3.8 0.8 9.9 0.2 3.0 1.7 1.9891 2.0004Sep. 0.3 3.8 0.8 10.1 0.2 3.0 1.7 1.9836 1.9954Oct. 0.3 3.8 0.7 8.7 0.3 3.2 1.6 1.9828 1.9935Nov. 0.3 3.8 0.7 9.0 0.3 3.1 1.5 1.9702 1.9533Dec. 0.3 3.4 0.8 10.2 0.3 3.2 1.6 1.8850 1.9245
2003: Jan. 0.3 3.3 0.7 8.8 0.3 3.2 1.5 1.8083 1.8417Feb. 0.2 2.5 0.8 9.8 0.3 3.2 1.5 1.8140 1.8155Mar. 0.2 2.6 0.7 9.1 0.3 3.3 1.4 1.7952 1.8103Apr. 0.2 2.6 0.7 8.7 0.3 3.2 1.4 1.7571 1.8035May 0.2 3.0 0.8 10.5 0.3 3.2 1.5 1.6544 1.6836Jun. 0.2 2.9 0.8 10.1 0.3 3.2 1.6 1.7116 1.6772Jul. 0.2 2.5 0.7 8.7 0.3 3.1 1.5 1.7281 1.7200Aug. 0.2 2.6 0.6 7.8 0.3 3.2 1.5 1.7899 1.7564Sep. 0.2 2.6 0.8 9.7 0.2 2.9 1.5 1.6785 1.7455Oct. 0.2 2.6 0.7 8.1 0.2 2.9 1.6 1.6829 1.6729Nov. 0.2 2.6 0.7 9.3 0.2 3.0 1.6 1.6307 1.6718Dec. 0.2 2.7 0.8 9.5 0.3 3.2 1.8 1.5486 1.5931
2004: Jan. 0.2 2.8 0.7 8.9 0.3 3.2 1.8 1.5793 1.5499Feb. 0.2 2.5 0.7 8.9 0.3 3.2 1.8 1.5750 1.5467Mar 0.2 2.4 0.7 9.1 0.3 3.1 1.7 1.6000 1.5945Apr 0.2 2.6 0.7 8.6 0.3 3.2 1.7 1.6371 1.6335
Sources: Bulgarian National Bank.

- 128 - STATISTICAL APPENDIX
Unc
over
ed in
tere
st d
iffer
entia
l 4/
Mon
thly
Ann
ual
Mon
thly
Ann
ual
Mon
thly
Ann
ual
Mon
thly
Ann
ual
(In p
erce
nt)
1998
:M
ar.
0.2
2.8
0.2
15.5
0.1
-11.
04.
1-8
.1-8
.2-6
4.2
Jun.
0.2
2.7
-3.5
-17.
63.
924
.64.
3-3
.9-4
.0-3
8.5
Sep.
0.3
3.3
3.2
11.7
-2.9
-7.5
4.0
3.3
3.2
46.1
Dec
.0.
33.
30.
40.
8-0
.12.
53.
9-5
.8-5
.9-5
1.5
1999
:M
ar.
0.3
3.3
-1.0
2.8
1.3
0.5
3.8
-8.0
-8.0
-63.
4Ju
n.0.
33.
3-0
.9-9
.31.
213
.83.
7-3
.9-3
.9-3
7.9
Sep.
0.3
3.3
1.5
24.9
-1.2
-17.
33.
73.
33.
246
.4D
ec.
0.3
3.3
1.3
12.4
-1.1
-8.1
4.1
-5.8
-5.9
-51.
6
2000
:M
ar.
0.3
3.3
-0.6
13.1
0.8
-8.7
4.4
-4.9
-5.0
-45.
9Ju
n.0.
33.
30.
1-2
.00.
15.
44.
70.
0-0
.1-1
.0Se
p.0.
33.
32.
426
.5-2
.1-1
8.4
4.7
-8.3
-8.4
-65.
0D
ec.
0.3
3.3
1.4
10.0
-1.1
-6.1
4.8
6.2
6.0
102.
0
2001
:M
ar.
0.3
3.1
0.1
4.1
0.2
-0.9
4.0
-5.1
-5.2
-47.
0Ju
n.0.
33.
3-0
.1-0
.80.
34.
13.
1-4
.0-4
.0-3
8.5
Sep.
0.2
3.0
1.3
5.7
-1.0
-2.5
2.3
7.7
7.7
144.
6D
ec.
0.3
3.4
0.6
10.7
-0.3
-6.6
1.7
-3.5
-3.4
-33.
6
2002
:M
ar.
0.2
2.4
0.8
22.4
-0.6
-16.
41.
7-1
.0-1
.0-1
0.9
Jun.
0.3
3.2
-1.7
-14.
52.
020
.71.
714
.314
.540
6.8
Sep.
0.2
3.0
0.8
0.9
-0.5
2.0
1.7
-1.2
-1.0
-11.
8D
ec.
0.3
3.2
1.2
10.0
-1.0
-6.2
1.6
5.2
5.4
87.4
2003
:M
ar.
0.3
3.3
0.4
4.7
-0.1
-1.4
1.4
5.0
5.2
82.9
Jun.
0.3
3.2
-2.2
-9.6
2.5
14.1
1.6
4.9
5.0
79.9
Sep.
0.2
2.9
0.9
10.8
-0.7
-7.2
1.5
2.0
2.1
28.0
Dec
.0.
33.
21.
818
.7-1
.5-1
3.1
1.8
8.4
8.5
166.
5
2004
:M
ar.
0.3
3.1
-0.1
6.8
0.3
-3.4
1.7
-3.2
-3.1
-31.
5
Sour
ces:
Bul
garia
n N
atio
nal B
ank;
and
Fun
d st
aff e
stim
ates
.1/
Cha
nge
in C
PI o
ver p
revi
ous t
hree
mon
ths,
in m
onth
ly a
nd a
nnua
lized
term
s.2/
Ann
ual i
nter
est r
ate
on U
.S. d
olla
r tim
e de
posi
ts, o
r ann
ual r
ate
on th
ree-
mon
th L
IBO
R w
hen
this
is n
ot a
vaila
ble.
3/ M
onth
ly ra
te o
f app
reci
atio
n in
lev
per U
.S. d
olla
r ove
r pre
viou
s thr
ee-m
onth
per
iod.
4/ D
iffer
entia
l in
retu
rn o
n le
v an
d U
.S. d
olla
r tim
e de
posi
ts, b
ased
on
thre
e-m
onth
rate
of e
xcha
nge
rate
app
reci
atio
n (p
ositi
ve if
diff
eren
tial i
n fa
vor o
f lev
).
U.S
. dol
lar d
epos
its 2
/Le
v pe
r U.S
. dol
lar
App
reci
atio
n 3/
Tabl
e A
35. B
ulga
ria: R
eal I
nter
est R
ates
and
Unc
over
ed In
tere
st D
iffer
entia
ls, 1
998-
2004
Lev
time
depo
sit r
ate
CPI
infla
tion
1/R
eal t
ime
depo
sit r
ate
Ann
ual i
nter
est o
n

- 129 - STATISTICAL APPENDIX
2000
2001
Mar
.Ju
n.Se
p.D
ec.
Mar
.Ju
n.Se
p.D
ec.
Mar
.Ju
n.Se
p.D
ec.
Mar
.Ju
n.Se
p.D
ec.
Mar
.Ju
n.Se
p.D
ec.
Mar
.Ju
n.Se
p.D
ec.
Res
erve
mon
ey2,
094
2,07
12,
045
2,38
72,
200
2,16
32,
289
2,72
52,
581
2,61
12,
769
3,02
12,
928
3,08
53,
367
4,03
33,
794
3,69
23,
841
4,48
24,
089
4,30
44,
605
5,26
6Cu
rren
cy in
circ
ulat
ion
1,36
01,
490
1,55
71,
845
1,65
91,
587
1,79
62,
083
1,92
11,
974
2,22
32,
505
2,34
82,
553
2,74
63,
263
3,01
93,
023
3,25
03,
628
3,32
93,
618
3,91
94,
264
DM
B re
serv
es (n
et)
734
581
488
542
541
576
493
642
661
637
546
516
580
533
620
770
775
669
591
854
760
686
686
1,00
2
Net
fore
ign
asse
ts3,
359
3,50
53,
162
3,39
03,
176
3,16
83,
194
3,99
63,
567
3,90
73,
843
4,66
14,
162
4,29
44,
244
5,48
54,
791
5,83
16,
385
6,98
26,
685
7,59
67,
921
8,54
5
Net
dom
estic
ass
ets
-1,2
66-1
,434
-1,1
17-1
,003
-976
-1,0
05-9
05-1
,271
-986
-1,2
96-1
,074
-1,6
40-1
,234
-1,2
09-8
78-1
,453
-997
-2,1
39-2
,544
-2,5
00-2
,596
-3,2
92-3
,315
-3,2
78G
over
nmen
t cre
dit (
net)
-309
-631
-337
-142
-51
-150
28-2
4310
4-4
8722
353
194
145
41,
027
536
958
-195
-360
-251
-358
-1,0
51-1
,068
-508
Clai
ms o
n D
MB
s (FX
)11
198
9291
8686
7979
7979
7649
4932
3218
1818
1515
66
66
Clai
ms o
n D
MB
s (le
va)
5555
5554
5352
4947
4646
4624
2422
2218
99
99
00
00
Oth
er it
ems n
et-1
,122
-956
-927
-1,0
06-1
,065
-993
-1,0
61-1
,155
-1,2
14-9
34-1
,419
-2,2
45-2
,249
-1,7
17-1
,958
-2,0
25-1
,983
-1,9
72-2
,208
-2,2
73-2
,244
-2,2
47-2
,254
-2,7
77
Mem
oran
dum
item
s:B
road
mon
ey0.
01.
90.
29.
4-5
.4-0
.98.
411
.62.
3-1
.016
.011
.43.
72.
36.
111
.7-0
.6-1
.85.
98.
1-1
.44.
96.
48.
7Le
v m
oney
-3.6
3.3
0.2
18.1
-8.6
-3.9
12.2
16.0
-1.7
-2.7
20.3
6.8
2.5
6.3
5.6
11.9
-3.3
-0.3
5.7
13.3
-4.0
7.5
7.0
9.8
Rese
rve
mon
ey-3
.3-1
.1-1
.316
.7-7
.8-1
.75.
819
.0-5
.31.
16.
09.
1-3
.15.
49.
119
.8-5
.9-2
.74.
016
.7-8
.85.
27.
014
.4
Cont
ribut
ions
to re
serv
e m
oney
gro
wth
NFA
11.7
4.3
-9.8
7.2
-6.3
-0.3
0.8
25.1
-10.
79.
5-1
.721
.3-1
0.7
3.2
-1.2
29.2
-12.
721
.79.
59.
3-4
.313
.64.
37.
9 N
DA
50.2
13.3
-22.
1-1
0.2
-2.7
3.0
-10.
040
.5-2
2.5
31.5
-17.
252
.8-2
4.8
-2.0
-27.
465
.5-3
1.4
114.
618
.9-1
.73.
826
.80.
7-1
.1
Rese
rve
mon
ey m
ultip
lier (
Rat
io)
Bro
ad m
oney
2.8
2.9
3.0
2.8
2.9
2.9
3.0
2.8
3.0
2.9
3.2
3.3
3.5
3.4
3.3
3.1
3.2
3.3
3.3
3.1
3.3
3.3
3.3
3.1
Sour
ces:
Bul
garia
n N
atio
nal B
ank;
and
Fun
d sta
ff es
timat
es.
Tabl
e A
36. B
ulga
ria: N
atio
nal B
ank
Bal
ance
She
et, 1
998-
2003
(Per
cent
cha
nge
from
pre
viou
s qua
rter)
2002
2003
(In
mill
ions
of l
eva)
1998
1999

- 130 - STATISTICAL APPENDIX
1998
1999
2000
2001
Dec
.D
ec.
Dec
.D
ec.
Mar
.Ju
n.Se
p.D
ec.
Mar
.Ju
n.Se
p.D
ec.
Liq
uidi
ty R
atio
s and
Cap
ital A
dequ
cyPr
imar
y liq
uidi
ty, p
erce
nt o
f dep
osits
1/
17.1
15.0
10.4
13.5
10.0
10.3
9.0
11.2
9.0
9.8
9.3
12.0
Seco
ndar
y liq
uidi
ty, p
erce
nt o
f dep
osits
2/
57.4
35.2
26.0
25.5
24.3
26.2
26.9
29.3
27.1
26.0
24.3
25.5
Cap
ital b
ase
(in b
illio
ns o
f lev
a)1,
002
1,18
21,
378
1,53
81,
542
1,61
31,
665
1,74
21,
830
1,95
92,
057
2,15
0To
tal r
isk
com
pone
nt (i
n bi
llion
s of l
eva)
2,72
82,
828
3,86
64,
911
5,22
25,
565
6,20
26,
907
7,52
68,
207
8,95
49,
762
Tota
l cap
ital a
dequ
acy
(in p
erce
nt)
36.7
41.8
35.6
31.3
29.5
29.0
26.8
25.2
24.3
23.9
23.0
22.0
Qua
lity
of C
redi
t Por
tfol
ioTo
tal (
in b
illio
ns o
f lev
a)5,
946
5,04
27,
395
8,64
28,
964
8,42
39,
512
9,95
710
,286
10,5
4711
,393
11,9
49St
anda
rd (i
n pe
rcen
t)86
.686
.291
.893
.193
.593
.994
.494
.593
.994
.094
.194
.2W
atch
(in
perc
ent)
3.6
4.4
2.8
2.9
2.8
2.4
2.2
2.3
2.8
2.8
2.6
2.5
Subs
tand
ard
(in p
erce
nt)
1.9
1.4
1.2
0.8
0.8
0.9
0.8
0.9
0.9
0.8
0.9
0.8
Dou
btfu
l (in
per
cent
)0.
60.
90.
80.
60.
80.
60.
60.
50.
60.
60.
80.
5Lo
ss (i
n pe
rcen
t)7.
37.
23.
42.
72.
12.
21.
91.
81.
91.
91.
82.
0Pr
ovis
ions
(in
perc
ent)
…10
.06.
55.
24.
64.
64.
24.
13.
33.
23.
23.
0
Sour
ce: B
ulga
rian
Nat
iona
l Ban
k. 1
/ Prim
ary
liqui
dity
is d
efin
ed a
s the
sum
of c
ash,
bal
ance
s on
settl
emen
t acc
ount
s with
BN
B, a
nd th
e m
inim
um re
serv
es o
ver t
he d
epos
it ba
se.
2/ S
econ
dary
liqu
idity
is d
efin
ed a
s prim
ary
liqui
dity
plu
s the
bal
ance
s on
settl
emen
t acc
ount
s with
oth
er c
omm
erci
al b
anks
, ove
rnig
ht b
ank
depo
sits
,
and
gov
ernm
ent s
ecur
ities
with
mat
urity
of u
p to
3 m
onth
s. Ta
ble
A37
. Bul
garia
: Com
mer
cial
Ban
k In
dica
tors
, 199
8-20
03
2002
2003

- 131 - STATISTICAL APPENDIX
2000
2001
2002
2003
Dec
.M
ar.
Jun.
Sep.
Dec
.M
ar.
Jun.
Sep.
Dec
.M
ar.
Jun.
Sep.
Dec
.
Inte
rest
Inco
me
601
164
336
510
687
169
343
533
738
223
466
726
1,01
5
on
Ban
ks a
nd O
ther
Fin
anci
al In
stitu
tions
193
5410
515
218
727
5581
106
1732
4660
o
n Lo
ans a
nd A
dvan
ces t
o N
on-F
inan
cial
Inst
itutio
ns
a
nd o
ther
Clie
nts
368
100
214
330
465
132
266
416
582
172
358
564
799
In
com
e on
Inve
stm
ent S
ecur
ities
409
1827
359
2235
5034
7611
515
3D
ivid
ent i
ncom
e0
00
00
00
00
00
22
Inte
rest
Exp
ense
187
5110
515
921
250
103
161
222
5912
118
826
1
on
Dep
osits
by
Ban
ks a
nd O
ther
Fin
anci
al In
stitu
tions
328
1014
218
1933
459
1826
38
on
Dep
osits
by
Non
-Fin
anci
al In
stitu
tions
and
Oth
er C
lient
s13
925
5078
103
3673
113
155
4490
141
194
o
n B
orro
win
gs16
32
1823
511
1522
613
2029
Net
Inte
rest
Inco
me
414
113
231
350
475
119
240
372
516
164
346
538
753
Net
Inte
rest
and
Tra
ding
and
Rev
alua
tion
Inco
me
682
268
401
578
744
146
319
483
701
247
451
623
829
O
f whi
ch:
Trad
ing
and
Rev
alua
tion
Prof
it/Lo
ss33
241
8112
117
836
6511
719
833
5666
65
L
ess:
Pro
visi
ons f
or C
redi
t Los
ses
65-1
15-8
9-1
07-9
19
-14
713
-50
-49
-18
-12
Ope
ratin
g In
com
e/Lo
ss B
efor
e Ta
x an
d Ex
traor
dina
ry It
ems
403
198
244
350
409
7116
324
833
315
226
334
945
2
Oth
er N
on-In
tere
st In
com
e19
045
9214
620
752
113
172
229
6514
323
334
0
Ope
ratin
g In
com
e B
efor
e Ex
pens
es87
231
349
372
495
019
843
265
593
0...
......
...
Ove
rhea
d Ex
pens
es46
911
624
937
454
112
826
940
759
716
033
150
771
7
Net
Pro
fit/L
oss
283
158
203
275
319
5713
320
226
712
521
829
438
0
Rev
alua
tion
Extra
ordi
nary
Gai
n/Lo
ss14
1935
2634
49
1214
918
3038
P
rofit
/Los
s Bef
ore
Taxa
tion
417
217
279
376
443
7417
225
934
816
128
137
948
9
Sou
rce:
Bul
garia
n N
atio
nal B
ank.
Tabl
e A
38.
Bul
garia
: C
onso
lidat
ed In
com
e St
atem
ent o
f the
Ban
king
Sys
tem
, 200
0-03
(in m
illio
ns o
f lev
a, c
umul
ativ
e)

- 132 - STATISTICAL APPENDIX
1999 2000 2001 2002 2003
CURRENT ACCOUNT -587 -761 -1,102 -925 -1,498
Trade balance -1,008 -1,280 -1,778 -1,692 -2,196Exports (f.o.b.) 3,734 5,253 5,714 6,063 6,663
y-o-y change (in percent) 0 41 9 6 10Imports (f.o.b.) -4,741 -6,533 -7,493 -7,755 -8,859
y-o-y change (in percent) 16 38 15 3 14
Services, net 306 548 455 486 524Of which: Exports of travel services 881 1,168 1,084 1,203 1,460
Income, net -167 -345 -340 -285 -439Of which: Income to direct investors 20 -116 -166 -237 -346
Current transfers, net 282 316 562 566 613
CAPITAL AND FINANCIAL ACCOUNT 712 924 755 1,843 1,594
Capital transfers, net -2 25 0 0 0Foreign direct investment, net 759 1,100 893 951 1,235
Of which: Privatization receipts
Portfolio investment, net -186 -192 94 -99 -192Other investment, net 142 -10 -232 991 552
General government -97 -243 -343 -144 -96Domestic banks 28 -387 -31 532 546Other private sector 211 620 142 603 102
Errors and omissions -20 26 772 -200 535
OVERALL BALANCE 105 188 425 717 630
FINANCING -105 -188 -425 -717 -630
Gross international reserves (increase: -) 1/ -521 -492 -318 -578 -817Use of Fund credit, net 156 151 -185 -155 35
Purchases 272 303 150 116 130Repurchases -116 -153 -336 -270 -95
Exceptional financing, net 260 153 78 15 151
MEMORANDUM ITEMS
Gross international reserves (stock, e.o.p.) 2/ 3,207 3,719 4,063 4,575 5,309In months of prospective GNFS imports 4.6 4.7 5.0 4.9 ...In percent of short-term debt 254 239 294 260 269
Current account + FDI 172 338 -209 26 -264(in percent of GDP) 1.4 2.5 -1.4 0.2 -1.5
Current account (in percent of GDP) -4.8 -5.6 -7.3 -5.6 -8.5Merchandise trade account (in percent of GDP) -8.3 -9.4 -11.7 -10.2 -12.5
Merchandise exports (in percent of GDP) 30.7 38.5 37.6 36.7 37.9Merchandise imports (in percent of GDP) -39.0 -47.9 49.3 46.9 50.4
Export volume (year-on-year change) -3.7 20.6 11.5 11.6 11.8Import volume (year-on-year change) 11.0 19.6 15.3 6.9 18.0
Gross external debt (stock, e.o.p.) 10,864 12,038 12,046 10,769 10,330(In percent of annual GDP) 89.5 88.2 79.3 65.1 58.7Public 9,411 10,006 9,789 7,961 7,156Private 1,453 2,032 2,257 2,808 3,174
Short-term debt (in percent of total debt, e.o.p.) 11.6 12.9 11.5 16.5 19.1
Net external debt (in percent of GDP) 3/ 50.8 45.7 36.9 26.1 20.2
GDP 12,145 13,646 15,184 16,533 17,594
Sources: BNB, and Fund staff estimates.
1/ Excluding valuation changes.2/ Including valuation changes. 3/ External debt minus gross foreign assets of the banking system.
Table A39 a. Bulgaria: Summary Balance of Payments, 1999-2003(In millions of euros)

- 133 - STATISTICAL APPENDIX
1999 2000 2001 2002 2003
CURRENT ACCOUNT -652 -702 -984 -827 -1,666
Trade balance -1,081 -1,176 -1,580 -1,594 -2,474Exports (f.o.b.) 4,006 4,825 5,113 5,692 7,439
y-o-y change (in percent) -4 20 6 11 31Imports (f.o.b.) -5,087 -6,000 -6,693 -7,287 -9,912
y-o-y change (in percent) 11 18 12 9 36
Services, net 314 506 402 482 600Of which: Exports of travel services 932 1,074 963 1,154 1,658
Income, net -185 -321 -304 -261 -485Of which: Income to direct investors 22 -107 -149 -228 -388
Current transfers, net 300 290 498 547 692
CAPITAL AND FINANCIAL ACCOUNT 731 713 663 1,750 1,853
Capital transfers, net -2 25 0 0 0Foreign direct investment, net 802 1,003 803 876 1,398
Of which: Privatization receipts 227 366 19 136 370
Portfolio investment, net -199 -179 82 -77 -208Other investment, net 131 -137 -223 951 663
General government -105 -224 -310 -131 -105Domestic banks 33 -386 -26 514 663Other private sector 203 473 113 567 106
Errors and omissions 17 126 694 -208 546
OVERALL BALANCE 96 137 373 715 732
FINANCING -96 -137 -373 -715 -732
Gross international reserves (increase: -) 1/ -527 -409 -275 -586 -932Use of Fund credit, net 162 136 -169 -142 36
Purchases 287 274 132 109 144Repurchases -125 -138 -301 -251 -107
Exceptional financing, net 270 136 71 13 164
MEMORANDUM ITEMS
Gross international reserves (stock, e.o.p.) 2/ 3,222 3,460 3,580 4,747 6,705In months of prospective GNFS imports 5.0 4.9 4.7 4.6 ...In percent of short-term debt 254 239 294 258 269
Current account + FDI 150 302 -181 50 -269(in percent of GDP) 1.2 2.4 -1.3 0.3 -1.3
Current account (in percent of GDP) -5.0 -5.6 -7.2 -5.3 -8.4Merchandise trade account (in percent of GDP) -8.3 -9.3 -11.6 -10.2 -12.4
Merchandise exports (in percent of GDP) 30.9 38.3 37.6 36.3 37.3Merchandise imports (in percent of GDP) -39.3 -47.6 49.2 46.4 49.7
Export volume (year-on-year change) -3.7 20.6 11.5 11.6 11.8Import volume (year-on-year change) 11.0 19.6 15.3 6.9 18.0
Gross external debt (stock, e.o.p.) 10,914 11,202 10,616 11,245 13,032(In percent of annual GDP) 84.2 88.9 78.1 71.6 65.3Public 9,454 9,311 8,627 8,331 9,024Private 1,459 1,891 1,989 2,914 4,008
Short-term debt (in percent of total debt, e.o.p.) 12 13 11 16 19
Net external debt (in percent of GDP) 3/ 47.9 46.0 36.3 28.9 22.4
GDP 4/ 12,956 12,605 13,600 15,694 19,954
Sources: BNB, and Fund staff estimates.
1/ Excluding valuation changes.2/ Including valuation changes. 3/ External debt minus gross foreign assets of the banking system.4/ Based on quarterly average exchange rates.
Table A39 b. Bulgaria: Summary Balance of Payments, 1999-2003(In millions of U.S. dollars)

- 134 - STATISTICAL APPENDIX
1999 2000 2001 2002 2003
Current Account -587 -761 -1,102 -925 -1,498
Goods, services, and income, net -869 -1,078 -1,663 -1,491 -2,111Credit 5,669 7,958 8,492 8,874 9,743Debit -6,538 -9,036 -10,156 -10,365 -11,854
Goods, net -1,008 -1,280 -1,778 -1,692 -2,196Credit 3,734 5,253 5,714 6,063 6,663Debit -4,741 -6,533 -7,493 -7,755 -8,859
Services, net 306 548 455 486 524Credit 1,686 2,366 2,385 2,479 2,791
Transportation 490 687 710 762 834Travel 881 1,168 1,084 1,203 1,460Other services 315 511 591 514 497
Debit -1,381 -1,819 -1,930 -1,993 -2,267Transportation -603 -798 -849 -892 -1,019Travel -496 -587 -510 -561 -661Other services -282 -433 -571 -539 -586
Income, net -167 -345 -340 -285 -439Credit 249 339 393 332 290
Monetary authorities ... 106 113 126 145General government ... 78 82 64 48Banks ... 76 78 56 25Other sectors ... 79 121 86 72
Debit -416 -684 -733 -617 -729Monetary authorities ... -6 -5 -1 0General government ... -470 -499 -310 -316Banks ... -26 -197 -115 -135Other sectors ... -182 -32 -191 -278
Current transfers, net 282 316 562 566 613Credit 310 386 674 677 762
General government ... 80 202 146 149Other sectors ... 306 472 530 613
Debit -27 -70 -112 -111 -150General government ... -21 -46 -16 -28Other sectors ... -49 -66 -95 -122
Memorandum items:
Goods, services, and income, net -7.1 -7.9 -11.0 -9.0 -12.0Goods, net -8.3 -9.4 -11.7 -10.2 -12.5Services, net 2.5 4.0 3.0 2.9 3.0Income, net -1.4 -2.5 -2.2 -1.7 -2.5
Current transfers, net 2.3 2.3 3.7 3.4 3.5
Sources: BNB, and Fund staff estimates.
Table A40. Bulgaria: Current Account, 1999-2003(In millions of euros)
(In percent of GDP)

- 135 - STATISTICAL APPENDIX
1999 2000 2001 2002 2003 1/
Export value -0.3 40.7 8.8 6.1 9.9Export price 3.5 16.7 -2.4 -4.9 -1.7Export volume -3.7 20.6 11.5 11.6 11.8
Import value 16.3 37.8 14.7 3.5 14.2Import price 4.8 15.2 -0.6 -3.2 -3.2Import volume 11.0 19.6 15.3 6.9 18.0
Terms of trade -1.3 1.3 -1.9 -1.8 1.6
Memorandum items:
Exports of goods: Volume growth in Bulgaria's export markets 0.6 13.2 -1.3 2.3 4.6 Volume growth in Bulgaria's exports -3.7 20.6 11.5 11.6 11.8 Change in Bulgaria's market share -4.3 6.5 13.0 9.0 6.9
Imports of goods: Real GDP growth in Bulgaria 2.3 5.4 4.1 4.9 4.3 Volume growth in Bulgaria's imports 11.0 19.6 15.3 6.9 18.0 Change in foreign suppliers' share of Bulgarian market 8.5 13.5 10.8 1.9 13.2
Sources: National Statistical Institute, and Fund staff estimates.
1/ Data for 2003 are preliminary.
Table A41. Bulgaria: Trade Volumes and Prices, 1999-2003(percentage changes in euro indices)

- 136 - STATISTICAL APPENDIX
1999
2000
2001
2002
2003
1999
2000
2001
2002
2003
Con
sum
er g
oods
12
4915
6419
1721
3424
4033
.429
.833
.535
.236
.6Fo
od18
217
221
924
729
94.
93.
33.
84.
14.
5To
bacc
o35
3621
1617
0.9
0.7
0.4
0.3
0.3
Bev
erag
es86
8377
7573
2.3
1.6
1.4
1.2
1.1
Clo
thin
g an
d fo
otw
ear
620
858
1140
1258
1458
16.6
16.3
20.0
20.8
21.9
Med
icin
es a
nd c
osm
etic
s13
717
818
016
816
33.
73.
43.
12.
82.
4Fu
rnitu
re a
nd h
ouse
hold
app
lianc
es93
114
147
211
246
2.5
2.2
2.6
3.5
3.7
Oth
ers
9612
513
215
918
42.
62.
42.
32.
62.
8
Raw
mat
eria
ls
1567
2322
2331
2535
2755
42.0
44.2
40.8
41.8
41.3
Iron
and
stee
l24
642
039
639
354
16.
68.
06.
96.
58.
1O
ther
met
als
263
536
475
470
535
7.0
10.2
8.3
7.8
8.0
Che
mic
als
140
216
226
216
228
3.8
4.1
3.9
3.6
3.4
Plas
tics a
nd ru
bber
113
136
144
153
172
3.0
2.6
2.5
2.5
2.6
Ferti
lizer
s34
104
9763
800.
92.
01.
71.
01.
2Te
xtile
s12
815
820
624
027
83.
43.
03.
64.
04.
2R
aw m
ater
ials
for t
he fo
od in
dust
ry18
314
617
232
121
84.
92.
83.
05.
33.
3W
ood
prod
ucts
, pap
er a
nd p
aper
boar
d12
314
714
215
819
73.
32.
82.
52.
63.
0C
emen
t25
3633
2929
0.7
0.7
0.6
0.5
0.4
Raw
toba
cco
6050
4550
501.
61.
00.
80.
80.
7O
ther
s25
337
439
544
342
66.
87.
16.
97.
36.
4
Inve
stm
ent g
oods
571
600
699
802
912
15.3
11.4
12.2
13.2
13.7
Mac
hine
s and
equ
ipm
ent
199
234
263
298
310
5.3
4.5
4.6
4.9
4.7
Elec
trica
l mac
hine
s53
6782
6711
21.
41.
31.
41.
11.
7V
ehic
les
4424
3668
691.
20.
50.
61.
11.
0Sp
are
parts
and
equ
ipm
ent
8611
915
617
119
22.
32.
32.
72.
82.
9O
ther
s18
915
516
319
922
85.
13.
02.
83.
33.
4
Tota
l non
ene
rgy
com
mod
ities
3387
4486
4947
5472
6106
90.7
85.4
86.6
90.3
91.6
Min
eral
fuel
s, oi
ls a
nd e
lect
ricity
346
767
767
591
556
9.3
14.6
13.4
9.7
8.4
Petro
leum
pro
duct
s27
258
850
735
838
57.
311
.28.
95.
95.
8O
ther
s74
179
261
233
172
2.0
3.4
4.6
3.8
2.6
TOTA
L EX
POR
TS, F
OB
3734
5253
5714
6063
6663
100.
010
0.0
100.
010
0.0
100.
0
Sour
ce: B
NB
.
In m
illio
ns o
f eur
osIn
per
cent
of t
otal
exp
orts
Tabl
e A
42. B
ulga
ria: C
omm
odity
Com
posi
tion
of E
xpor
ts, 1
999-
2003

- 137 - STATISTICAL APPENDIX
1999
2000
2001
2002
2003
1999
2000
2001
2002
2003
Con
sum
er g
oods
69
386
411
40.0
1252
.614
74.3
13.5
12.2
14.0
14.9
15.4
Food
, drin
ks a
nd to
bacc
o13
617
220
8.6
235.
226
4.1
2.6
2.4
2.6
2.8
2.8
Furn
iture
and
hou
seho
ld a
pplia
nces
130
161
206.
125
0.6
320.
12.
52.
32.
53.
03.
3M
edic
ines
and
cos
met
ics
156
204
285.
629
4.6
315.
13.
02.
93.
53.
53.
3C
loth
ing
and
foot
wea
r33
3849
.578
.410
9.5
0.6
0.5
0.6
0.9
1.1
Aut
omob
iles
122
158
214.
120
4.0
244.
32.
42.
22.
62.
42.
5O
ther
s11
713
217
6.0
189.
922
1.2
2.3
1.9
2.2
2.3
2.3
Raw
mat
eria
ls
1886
2557
3129
.632
66.6
3845
.536
.736
.138
.538
.840
.1O
res
157
237
278.
320
8.7
312.
63.
13.
33.
42.
53.
3Iro
n an
d st
eel
8614
416
4.7
166.
524
7.7
1.7
2.0
2.0
2.0
2.6
Oth
er m
etal
s36
7090
.583
.196
.10.
71.
01.
11.
01.
0Te
xtile
s58
981
210
60.1
1162
.613
19.9
11.5
11.5
13.0
13.8
13.7
Woo
d pr
oduc
ts, p
aper
and
pap
erbo
ard
126
169
189.
319
8.0
211.
92.
52.
42.
32.
42.
2C
hem
ical
s 15
218
720
6.8
215.
523
2.1
3.0
2.6
2.5
2.6
2.4
Plas
tics a
nd ru
bber
205
265
319.
536
2.6
439.
14.
03.
73.
94.
34.
6R
aw m
ater
ials
for t
he fo
od in
dust
ry12
415
117
2.4
191.
719
6.2
2.4
2.1
2.1
2.3
2.0
Raw
skin
s40
6088
.186
.310
1.2
0.8
0.8
1.1
1.0
1.1
Raw
toba
cco
3130
28.8
30.5
20.4
0.6
0.4
0.4
0.4
0.2
Oth
ers
341
433
531.
056
1.1
668.
36.
66.
16.
56.
77.
0
Inve
stm
ent g
oods
1407
1729
2037
.621
10.3
2461
.427
.424
.425
.125
.125
.6M
achi
nes a
nd e
quip
men
t55
566
770
5.0
809.
893
7.0
10.8
9.4
8.7
9.6
9.8
Elec
trica
l mac
hine
s19
920
635
6.6
282.
031
6.7
3.9
2.9
4.4
3.4
3.3
Veh
icle
s29
935
445
3.1
438.
054
1.5
5.8
5.0
5.6
5.2
5.6
Spar
e pa
rts a
nd e
quip
men
t19
422
427
3.4
309.
936
0.1
3.8
3.2
3.4
3.7
3.8
Oth
ers
161
278
249.
527
0.7
306.
23.
13.
93.
13.
23.
2
Tota
l non
ene
rgy
com
mod
ities
3986
5150
6307
.266
29.5
7781
.377
.672
.777
.678
.881
.1
Min
eral
fuel
s, oi
ls a
nd e
lect
rici
ty11
5419
3518
20.6
1674
.616
91.3
22.4
27.3
22.4
19.9
17.6
Fuel
s11
0217
7216
10.7
1573
.715
31.0
21.4
25.0
19.8
18.7
15.9
Cru
de o
il an
d N
atur
al g
as93
215
7213
89.6
1362
.113
02.3
18.1
22.2
17.1
16.2
13.6
Coa
l10
614
116
9.7
162.
218
3.8
2.1
2.0
2.1
1.9
1.9
Oth
ers
6460
210.
010
0.9
160.
31.
20.
82.
61.
21.
7O
ther
s52
163
210.
010
0.9
160.
31.
02.
32.
61.
21.
7
TOTA
L IM
POR
T, C
IF51
4070
8581
27.8
8411
.296
00.5
100.
010
0.0
100.
010
0.0
100.
0
Sour
ce: B
NB
.
In m
illio
ns o
f eur
osIn
per
cent
of t
otal
impo
rts
Tabl
e A
43. B
ulga
ria: C
omm
odity
Com
posi
tion
of Im
ports
, 199
9-20
03

- 138 - STATISTICAL APPENDIX
Ex
ports
Impo
rtsEx
ports
Impo
rtsEx
ports
Impo
rtsEx
ports
Impo
rtsEx
ports
Impo
rts
OEC
D c
ount
ries 2
/66
.459
.067
.953
.469
.257
.171
.059
.172
.062
.3O
f whi
ch:
Aus
tria
1.7
3.0
1.4
2.2
1.7
2.0
1.7
2.1
2.0
2.2
Bel
gium
4.4
1.7
6.2
1.3
4.9
1.5
4.8
1.4
6.1
1.4
Fran
ce4.
55.
24.
84.
95.
66.
05.
35.
75.
15.
6G
erm
any
9.8
14.9
9.0
13.9
9.5
15.3
9.5
14.3
10.8
14.3
Gre
ece
8.6
5.6
7.8
4.9
8.8
5.7
9.2
6.0
10.4
6.6
Italy
13.9
8.4
14.2
8.5
15.0
9.6
15.4
11.3
14.0
10.2
Japa
n0.
61.
20.
41.
00.
31.
10.
21.
10.
21.
3N
ethe
rland
s2.
12.
01.
81.
71.
61.
81.
82.
01.
51.
8Sp
ain
2.7
1.4
2.1
1.5
3.3
1.7
3.4
1.9
2.7
2.2
Turk
ey7.
33.
010
.33.
38.
13.
89.
34.
99.
26.
1U
nite
d St
ates
3.7
3.5
3.9
2.9
5.6
2.6
4.7
2.2
4.5
2.6
Uni
ted
Kin
gdom
2.5
2.4
2.4
2.1
2.6
2.5
2.9
2.6
2.5
2.5
Non
-OEC
D c
ount
ries
33.6
41.0
32.1
46.6
30.8
42.9
29.0
40.9
28.0
37.7
Of w
hich
:C
zech
Rep
ublic
0.4
1.8
0.3
1.8
0.4
1.6
0.5
1.6
0.6
1.6
Hun
gary
0.6
0.9
0.6
0.9
0.6
1.1
0.7
1.3
0.8
1.2
Mac
edon
ia2.
60.
52.
30.
42.
20.
32.
20.
22.
10.
2Po
land
0.7
1.4
0.6
1.4
0.7
1.5
0.7
1.3
0.8
1.4
Rom
ania
1.4
1.3
1.8
3.6
2.5
2.4
2.8
2.0
3.0
2.4
Rus
sia
4.7
20.2
2.5
24.4
2.3
20.0
1.6
14.7
1.4
12.6
Serb
ia/M
onte
negr
o4.
20.
37.
80.
34.
10.
33.
00.
33.
30.
3U
krai
ne1.
72.
61.
22.
81.
23.
20.
93.
10.
83.
2
Tot
al10
0.0
100.
010
0.0
100.
010
0.0
100.
010
0.0
100.
010
0.0
100.
0
Mem
oran
dum
item
s:
Euro
pean
Uni
on52
.048
.451
.144
.054
.849
.455
.750
.356
.649
.5
CEF
TA m
embe
rs 3
/4.
46.
44.
08.
84.
87.
65.
47.
35.
97.
9
Sour
ce: B
NB,
for 2
001
- 200
3 in
Eur
o an
d 19
99 -
2000
in U
S do
llars
.
1/ Im
ports
and
exp
orts
reco
rded
acc
ordi
ng to
the
date
at w
hich
goo
ds c
ross
the
bord
er.
2/ E
xclu
ding
Cze
ch R
epub
lic, H
unga
ry, P
olan
d, a
nd S
lova
k R
epub
lic.
3/ E
xclu
ding
new
ent
rant
s (C
ypru
s, C
zech
Rep
ublic
, Est
onia
, Hun
gary
, Lat
via,
Lith
uani
a, M
alta
, Pol
and,
Slo
vak
Rep
ublic
, Slo
veni
a).
Incl
udes
Cze
ch R
epub
lic, H
unga
ry, P
olan
d, R
oman
ia, S
lova
k R
epub
lic, a
nd S
love
nia.
(In p
erce
nt o
f tot
al)
Tabl
e A
44. B
ulga
ria: D
irect
ion
of T
rade
, 199
9-20
03 1
/
2003
2001
2000
1999
2002

- 139 - STATISTICAL APPENDIX
1999
2000
2001
2002
2003
1999
2000
2001
2002
2003
Num
ber o
f tou
rist a
rriv
als
2,08
52,
354
2,75
62,
993
3,53
25.
712
.917
.18.
618
.0O
f whi
ch:
Euro
pean
Uni
on67
279
71,
008
1,24
31,
558
11.1
18.6
26.5
23.4
25.3
Of w
hich
:G
reec
e29
432
134
439
154
815
.39.
27.
213
.840
.0G
erm
any
206
263
374
480
535
19.1
27.7
42.2
28.5
11.4
Uni
ted
Kin
gdom
5352
6911
115
9-2
2.1
-2.1
32.9
60.7
43.4
Rus
sia
…10
613
199
121
……
23.9
-24.
021
.7M
aced
onia
…65
864
362
267
2…
…-2
.3-3
.38.
1Se
rbia
and
Mon
tene
gro
…21
835
953
559
2…
…64
.649
.010
.7
Mem
oran
dum
item
:Tr
avel
rece
ipts
(in
mill
ions
of e
uros
)88
11,
168
1,08
412
03.3
1/
1460
1/
-8.8
32.6
-7.2
11.0
21.3
Euro
pean
Uni
on32
.233
.936
.641
.644
.1O
f whi
ch:
Gre
ece
14.1
13.6
12.5
13.1
15.5
Ger
man
y9.
911
.213
.616
.115
.1U
nite
d K
ingd
om2.
52.
22.
53.
74.
5R
ussi
a…
4.5
4.7
3.3
3.4
Mac
edon
ia…
28.0
23.3
20.8
19.0
FR Y
ugos
lavi
a…
9.3
13.0
17.9
16.8
Sour
ce: M
inis
try o
f Eco
nom
y.
Tabl
e A
45. B
ulga
ria: T
ouris
m In
dica
tors
, 199
9-20
03
(In p
erce
nt o
f tot
al)
(Per
cent
cha
nge)
(Tho
usan
ds)

- 140 - STATISTICAL APPENDIX
1999 2000 2001 2002 2003
Financial Account 715 898 755 1,843 1,594
Direct investment abroad -16 -4 -11 -29 -19Direct investment in Bulgaria 775 1,103 903 980 1,254
Portfolio investment assets -195 -56 -25 227 -69Equity securities 0 -10 -40 -15 -13Debt securities -195 -46 16 243 -56
Portfolio investment liabilities 9 -135 119 -326 -123Equity securities 2 5 -10 -24 -22Debt securities 7 -140 129 -302 -101
Other investment assets -50 -342 -117 332 139Trade credits -1 121 0 -2 0Loans 11 -8 18 -18 -29
General Government 0 0 0 0 0Banks 0 -8 0 -44 -31Other sectors 11 0 18 26 2
Currency and deposits -47 -446 -108 333 181General Government 0 0 0 0 0Banks 17 -498 -149 346 281Other sectors -64 51 41 -13 -101
Other forex deposits 0 0 0 0 0Other assets -13 -9 -27 18 -12Other 0 0 0 0 0
Other investment liabilities 192 333 -115 659 413Trade credits 104 146 -130 204 -83Loans 70 67 -193 161 149
Monetary authorities 0 0 0 0 0General Government -97 -235 -340 -144 -96Banks 0 42 9 42 41Other sectors 167 260 138 263 205
Currency and deposits 41 75 47 98 259Other liabilities -23 44 161 196 88Other 0 0 0 0 0
Source: BNB.
Table A46. Bulgaria: Financial Account, 1999-2003(In millions of euros)

- 141 - STATISTICAL APPENDIX
1999 2000 2001 2002 2003
Foreign direct investment by sector:Financial intermediation 11.9 44.9 15.1 14.8 34.6Transport, storage and communication 2.0 6.9 27.5 23.1 13.3Wholesale and retail trade; repair of motor vehicles, motorcyc 16.4 11.6 14.5 25.2 15.2Manufacturing 53.5 18.2 31.7 8.4 18.2Electricity, gas and water supply -0.6 -2.0 0.3 7.4 2.7Hotels and restaurants 1.9 1.5 2.2 0.9 1.4Real estate, renting and business activities 4.8 4.3 1.6 6.2 6.3Construction 2.4 4.8 2.1 3.4 0.8Other 7.5 9.8 4.9 10.5 7.4Total 100.0 100.0 100.0 100.0 100.0
Foreign direct investment by country of origin:Austria 9.1 7.0 11.5 17.8 5.0Belgium and Luxembourg 0.0 10.0 7.5 0.0 1.2Cyprus 19.8 7.5 2.2 -0.9 4.4France 9.5 3.7 1.9 1.0 0.3Germany 4.9 3.9 8.3 9.4 2.6Greece 0.3 9.9 29.6 24.2 16.2Hungary 0.9 0.2 0.1 1.1 28.1Italy 0.8 33.8 18.0 2.8 6.3Korea 0.5 0.4 -1.1 0.0 0.0Netherlands 12.9 -1.0 9.9 3.4 14.8Spain 0.4 0.1 0.6 0.0 0.3Switzerland 1.1 2.5 4.1 4.0 8.3Turkey 1.5 2.5 -1.2 1.7 0.6United Kingdom 3.4 -0.3 2.5 0.1 3.8United States 6.7 5.8 5.5 6.2 2.7
Other countries 28.1 14.1 0.7 29.2 5.5Total 100.0 100.0 100.0 100.0 100.0
Foreign direct investment by capital type:Equity capital 61.1 75.4 69.7 65.0 52.4
Of which: from privatization 27.7 36.5 2.4 15.0 26.1Other capital 42.9 18.8 29.5 25.7 40.3Reinvested earnings -4.0 5.8 0.8 9.3 7.3Total 100.0 100.0 100.0 100.0 100.0
Memorandum items:Inward direct investment (in millions of euros) 775 1103 903 980 1254Bulgarian direct investment abroad (in millions of euros) 16 4 11 29 19
Sources: BNB.
Table A47. Bulgaria: Foreign Direct Investment by Sector and Country of Origin, 1999-2003 (In percent of total)

- 142 - STATISTICAL APPENDIX
1999 2000 2001 2002 2003
Gross External Debt Stock 10,864 12,038 12,046 10,769 10,330Public Sector 9,411 10,006 9,789 7,961 7,156
Government Debt 8,331 8,849 9,225 7,746 6,903Loans 3,377 3,502 3,578 3,099 2,978Bonds 4,955 5,348 5,647 4,646 3,925
Government-guaranteed Debt 579 680 371 383 396Loans 579 680 371 383 396
Monetary Authorities 116 111 75 20 0Other Public Debt 384 366 118 -188 -143
Municipalities 27 28 15 0 7Loans 0 0 0 0 7Bonds 27 28 15 0 0
Commercial Banks 200 115 10 8 15Loans 169 108 3 7 15Non-residents' Deposits 31 8 7 1 0
Companies 79 124 106 89 127Intra Company Loans 0 0 0 1 2Other Loans 28 55 54 32 77Trade credits 51 69 52 56 48
Other 78 98 -13 -284 -293Private Sector 1,453 2,032 2,257 2,808 3,174
Commercial Banks 147 289 347 440 659Intra Company Loans 45 64 68 41 30Other Loans 3 46 53 103 133Bonds 0 0 0 0 0Non-residents' Deposits 98 180 226 297 497
Companies 1,306 1,743 1,910 2,368 2,514Intra Company Loans 330 397 601 635 970Other Loans 320 515 553 682 763Trade credits 655 831 756 1,050 778Bonds 0 0 0 0 3
Gross External Debt Stock 10,864 12,038 12,046 10,769 10,330Long-term Debt 9,602 10,480 10,663 8,996 8,358
Official creditors 4,026 4,236 3,882 3,291 3,115International financial institutions 2,878 3,237 3,121 2,710 2,628
International Monetary Fund 1,243 1,421 1,259 1,005 940International Bank for Reconstruction and Develop 892 986 1,078 972 1,003European Union 400 460 390 390 350Other international financial institutions 343 369 394 343 335
Bilateral 1,148 999 761 582 486Paris Club and nonrescheduled debt 811 645 434 285 219Other bilateral 337 354 327 297 268
Private creditors 5,576 6,244 6,781 5,705 5,244Brady Bonds 4,955 5,348 5,400 2,399 1,890Eurobonds 0 0 247 247 247Global Bonds ... ... ... 2,001 1,788Other Bonds 27 28 15 0 0Other treasury securities 78 98 -13 -284 -293То commercial banks 46 100 113 137 171To companies 470 670 1,020 1,206 1,440
Financial credits 433 634 954 1,155 1,427Trade credits 37 36 66 50 11Bonds 0 3
Short-term Debt 1,262 1,558 1,383 1,772 1,972Official creditors 0 0 0 0 0Private creditors 1,262 1,558 1,383 1,772 1,972
To commercial banks 301 304 244 311 503To companies 961 1,254 1,138 1,461 1,468
Financial credits 292 390 396 406 653Trade credits 669 864 743 1,055 815
Treasury securities 0 0 0 0 0
Sources: BNB, and Fund staff estimates.
(By Debtor)
(By Creditor)
(in millions of euros)Table A48. Bulgaria: External Debt Stock, 1999-2003 1/

- 143 - STATISTICAL APPENDIX
(In m
illio
ns o
f eur
os)
Am
ortiz
atio
nsIn
tere
stTo
tal
1999
2000
2001
2002
2003
1999
2000
2001
2002
2003
1999
2000
2001
2002
2003
GR
OSS
EX
TER
NA
L D
EBT
525
709
1102
1026
798
454
558
587
377
388
980
1267
1690
1403
1186
Long
term
deb
t42
351
387
182
159
743
155
358
136
637
085
410
6614
5211
8896
7O
ffici
al c
redi
tors
348
441
745
543
354
166
213
214
143
108
514
653
959
686
462
Inte
rnat
iona
l fin
anci
al in
stitu
tions
168
230
498
388
275
108
159
165
118
9227
638
966
350
636
7IM
F 11
615
033
627
095
4167
6335
2215
821
739
930
511
7W
orld
Ban
k21
3644
4746
3548
5142
3356
8595
8979
EU0
070
040
1115
2114
1011
1591
1450
Oth
er IF
I31
4448
7194
2028
2927
2851
7277
9812
2Bi
late
ral c
redi
tors
179
211
247
155
7958
5449
2516
238
264
297
180
95Pa
ris C
lub
and
nonr
esch
edul
ed d
ebt
155
167
209
143
6248
4439
1710
203
210
248
160
72O
ther
s25
4439
1117
1010
108
635
5448
1923
Priv
ate
cred
itors
7572
126
278
243
265
341
367
224
261
340
413
493
502
505
Brad
y Bo
nds
00
1887
9324
330
432
817
556
243
304
346
262
148
Oth
er b
onds
330
625
21
128
1516
735
1214
4016
9C
omm
erci
al b
anks
00
2346
221
49
66
14
3252
28C
ompa
nies
4272
7912
112
621
2122
2832
6292
100
148
159
Shor
t-ter
m D
ebt
103
196
231
205
201
234
610
1812
620
123
821
521
8
Sour
ces:
BN
B, a
nd F
und
staf
f est
imat
es.
Tabl
e A
49. B
ulga
ria: E
xter
nal D
ebt S
ervi
ce, 1
999-
2003
1/

- 144 - STATISTICAL APPENDIX
1999 2000 2001 2002 2003
Gross external debtEuro ... ... 21.3 38.1 47.6U.S. Dollar ... ... 64.0 48.6 39.4SDR ... ... 11.2 9.8 9.0Japanese Yen ... ... 2.6 2.4 2.1Other ... ... 0.8 1.1 1.8
Public sectorEuro 15.4 16.6 17.5 31.8 38.5U.S. Dollar 65.5 65.6 66.2 52.2 45.2SDR 13.8 13.6 12.9 12.7 13.1Japanese Yen 4.1 3.4 3.0 3.1 3.0Other 1.2 0.8 0.3 0.2 0.2
Private sector, totalEuro ... ... 48.9 59.0 67.8U.S. Dollar ... ... 47.1 37.0 26.6BGN ... ... 2.9 2.0 3.3CHF ... ... 0.6 1.2 1.2Other ... ... 0.6 0.9 1.1
Private sector, commercial banksEuro ... ... 49.8 54.7 69.6U.S. Dollar ... ... 38.2 30.8 13.1BGN ... ... 11.0 10.2 11.3CHF ... ... 0.4 3.6 3.9Other ... ... 0.6 0.7 2.1
Private sector, companiesEuro ... ... 48.4 59.5 67.4U.S. Dollar ... ... 50.3 38.3 29.9Other ... ... 1.3 2.2 2.7
Source: BNB, and Ministry of Finance.
Table A50. Bulgaria: Currency Composition of External Debt, 1999-2003(In percent of total; end of period)

- 145 - - 145 - STATISTICAL APPENDIX
(In m
illio
ns o
f U.S
. dol
lars
)
Cla
ims o
f Bul
garia
Cla
ims o
n B
ulga
ria19
9920
0020
0120
0220
0319
9920
0020
0120
0220
0319
9920
0020
0120
0220
03
Afg
hani
stan
44.1
44.9
45.5
46.0
46.5
0.1
0.1
0.1
0.1
0.1
44.0
44.8
45.4
45.9
46.4
Alg
eria
32.2
29.0
29.0
27.2
21.9
0.0
0.0
0.0
0.0
0.0
32.2
29.0
29.0
27.2
21.9
Ang
ola
94.8
96.9
99.1
101.
310
2.4
0.0
0.0
0.0
0.0
0.0
94.8
96.9
99.1
101.
310
2.4
Ban
glad
esh
0.3
0.3
0.3
0.3
0.3
0.0
0.0
0.0
0.0
0.0
0.3
0.3
0.3
0.3
0.3
Con
go1.
31.
31.
31.
31.
30.
00.
00.
00.
00.
01.
31.
31.
31.
31.
3
Egyp
t0.
30.
30.
30.
30.
30.
00.
00.
00.
00.
00.
30.
30.
30.
30.
3Et
hiop
ia56
.156
.155
.956
.70.
00.
60.
60.
60.
60.
055
.555
.555
.356
.10.
0G
hana
0.0
0.0
0.0
0.0
0.0
8.6
2.1
0.0
0.0
0.0
-8.6
-2.1
0.0
0.0
0.0
Gui
nea
10.6
10.9
11.1
11.4
11.5
0.0
0.0
0.0
0.0
0.0
10.6
10.9
11.1
11.4
11.5
Guy
ana
1.0
1.1
1.2
1.3
1.3
0.0
0.0
0.0
0.0
0.0
1.0
1.1
1.2
1.3
1.3
Indi
a0.
10.
10.
10.
10.
10.
00.
00.
00.
00.
00.
10.
10.
10.
10.
1In
done
sia
0.0
0.0
0.0
0.0
0.0
0.0
0.0
0.0
0.0
0.0
0.0
0.0
0.0
0.0
0.0
Iran
0.7
0.7
0.7
0.7
0.7
0.0
0.0
0.0
0.0
0.0
0.7
0.7
0.7
0.7
0.7
Iraq
1,44
7.2
1,47
6.9
1,50
6.6
1,53
6.4
1,58
2.0
0.0
0.0
0.0
0.0
0.0
1,44
7.2
1,47
6.9
1,50
6.6
1,53
6.4
1,58
2.0
Liby
a52
.653
.153
.654
.054
.60.
00.
00.
00.
00.
052
.653
.153
.654
.054
.6
Nic
arag
ua23
7.9
239.
124
1.0
0.0
0.0
0.0
0.0
0.0
0.0
0.0
237.
923
9.1
241.
00.
00.
0N
iger
ia35
.631
.326
.926
.926
.90.
00.
00.
00.
00.
035
.631
.326
.926
.926
.9M
ozam
biqu
e34
.441
.342
.745
.547
.70.
00.
00.
00.
00.
034
.441
.342
.745
.547
.7Pa
kist
an0.
00.
00.
00.
00.
00.
00.
00.
00.
00.
00.
00.
00.
00.
00.
0Pe
ru0.
30.
30.
00.
00.
00.
00.
00.
00.
00.
00.
30.
30.
00.
00.
0
Som
alia
8.0
8.1
8.2
8.4
8.5
0.0
0.0
0.0
0.0
0.0
8.0
8.1
8.2
8.4
8.5
Syria
82.6
82.7
82.9
82.9
82.9
0.0
0.0
0.0
0.0
0.0
82.6
82.7
82.9
82.9
82.9
Tanz
ania
27.3
27.3
26.1
29.7
30.5
0.3
0.3
0.3
0.3
0.3
27.0
27.0
25.8
29.4
30.2
Tuni
sia
0.1
0.0
0.0
0.0
0.0
0.0
0.0
0.0
0.0
0.0
0.1
0.0
0.0
0.0
0.0
Yem
en95
.495
.497
.097
.097
.90.
00.
00.
00.
00.
095
.495
.497
.097
.097
.9Za
mbi
a5.
75.
75.
76.
56.
70.
00.
00.
00.
00.
05.
75.
75.
76.
506.
7
Tota
l2,
268.
72,
302.
82,
335.
22,
133.
92,
124.
09.
63.
11.
01.
00.
42,
259.
12,
299.
72,
334.
22,
132.
92,
123.
6
Sour
ce: D
ata
prov
ided
by
the
Bulg
aria
n au
thor
ities
.
1/ G
over
nmen
t cre
dits
and
cle
arin
g an
d ba
rter a
rran
gem
ents
; end
of p
erio
d.2/
A n
egat
ive
sign
indi
cate
s a n
et d
ebto
r pos
ition
of B
ulga
ria.
Bal
ance
2/
Tabl
e A
51. B
ulga
ria: C
onve
rtibl
e C
urre
ncy
Posi
tion
with
Dev
elop
ing
Cou
ntrie
s 199
9–20
03 1
/

- 146 - STATISTICAL APPENDIX
1999 2000 2001 2002 2003
All products: Minimum MFN tariff rate 0 0 0 0 0 Maximum MFN tariff rate 74 74 74 74 75 Simple average MFN tariff rate 2/ 15.4 13.8 12.4 11.1 10.5 Number of tariff lines 10,765 10,538 10,499 10,620 10,373
Industrial products: Minimum MFN tariff rate 0 0 0 0 0 Maximum MFN tariff rate 35 30 30 40 27 Simple average MFN tariff rate 2/ 12.6 11.0 10.0 8.6 8.6 Number of tariff lines 8,254 8,130 8,112 8,179 7,962
Agricultural products: Minimum MFN tariff rate 0 0 0 0 0 Maximum MFN tariff rate 74 74 74 74 75 Simple average MFN tariff rate 2/ 24.6 24.0 21.9 21.3 22.9 Number of tariff lines 2,511 2,408 2,387 2,441 2,411
Sources: Customs agency, and Fund staff estimates
1/ Applied ad valorem tariffs as at 1 January each year.2/ Excluding the ad-valorem equivalent of mixed tariffs.
Table A52. Bulgaria: Import Tariffs, 1999-2003 1/(In percent unless otherwise indicated)