Embed Size (px)
Citation preview

Imaging and EEG in Post-traumatic Epilepsy
Michael R. Sperling, M.D.
Thomas Jefferson University
Philadelphia, PA
American Epilepsy Society | Annual Meeting

Disclosure
Name Upsher-Smith
Sunovion, Eisai, UCB
Pharma, Neuronex, Vertex, Upsher-Smith, Lundbeck, Neuropace,
Medtronics
American Epilepsy Society | Annual Meeting 2012
Nature of Relationship
Consulting
Research Contracts with university
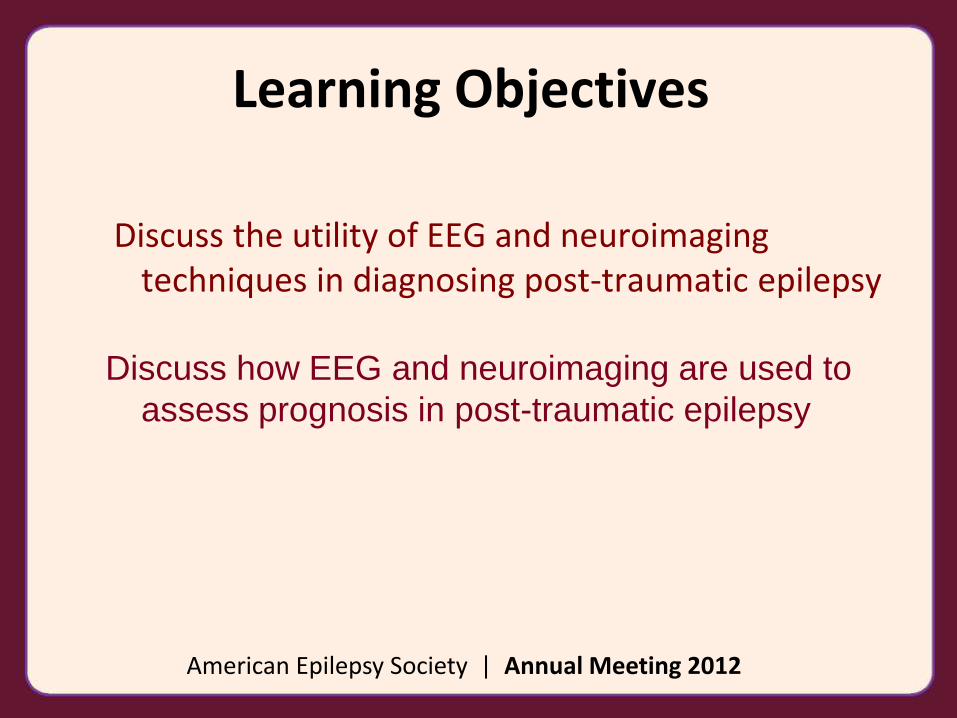
Learning Objectives
Discuss the utility of EEG and neuroimaging techniques in diagnosing post-traumatic epilepsy
Discuss how EEG and neuroimaging are used to
assess prognosis in post-traumatic epilepsy
American Epilepsy Society | Annual Meeting 2012

Diagnosis
Diagnosis is clinically driven
Reliance upon history
Interictal EEG may aid in confirming clinical suspicion
Interictal spikes, focal slow waves, normal
Ictal EEG may be necessary to establish diagnosis
Verify diagnosis of epileptic seizure
Verify diagnosis of psychogenic seizure or other non-epileptic event, e.g., syncope

Interictal EEG
Interictal spikes consistent with frontal or temporal contusions

Interictal EEG
EEG may suggest another etiology

EEG and Brain Volume Loss in ml Vietnam Series
EEG Total 0-25 25-50 50-75 > 75 Abnormally slow 173 62 51 24 36 (36%) (30%) (14%) (21%) Epileptiform with 49 8 11 7 23 or without slowing (14%) (22%) (14%) (47%)
Jabbari et al Electroenceph Clin Neurophys 1986

EEG and Seizures in PTE Vietnam Series
Measure Normal N = 239
Gen/foc slow
N = 173
Epileptiform N = 49
P value
Total Volume Loss (mean in
ml)
26 50 76 0.0001
Seizure 35% 63% 84% 0.0001
Jabbari et al Electroenceph Clin Neurophys 1986

Ictal EEG-Video
Confirm diagnosis of epileptic seizure
Confirm classification of epilepsy (focal vs. generalized)
Yields clue regarding possible localization, which may be consistent with a traumatic etiology

MRI
Provides evidence for the presence of a structural lesion
Supports presumed diagnosis of post-traumatic epilepsy
Location of lesion may be typical for PTE
Frontal, temporal or occipital pole
Beneath a depressed skull fracture
Establishes presence of blood or hemisiderin
If atypical, may lead to questioning diagnosis

CT: Contusion

MRI: Contusion

MRI
Certain MRI findings may lead to questioning diagnosis of PTE

MRI Lesion and PTE
Lesion location and development of PTE
Cortical vs subcortical vs both
Single vs multiple lesions
Subdural hematoma vs intraparenchymal lesion
Presence of hemosiderin and development of PTE
Location and prevalence limit accurate assessment
Walled vs incompletely walled lesions

Cumulative Probability of Developing PTE at 60 Months (20/184)
Variables N
No. with PTE
Prob at 60 mo (%) 95% CI (%)
p Value (log-rank test)
Sequelae of sSDH-C
Yes 23 9 39.13 19.19-59.08 <0.001
No 112 11 9.82 4.31-15.33
No MRI lesion verses 21 1 4.76 0-13.87
H+G lesions only 29 7 24.14 8.56-39.71 0.067
G only 9 1 11.11 0-31.64 0.508
H only 33 2 6.06 0-14.2 0.824
H+G lesions + H 34 6 17.65 4.83-30.46 0.167
SDH-C: subdural/contusion; H: hemosiderin; G: gliosis Messori et al 2005

Incomplete vs Complete Wall Around Hemosiderin Deposit
Complete wall around hemosiderin Incomplete wall around hemosiderin
Incomplete wall lesions (and IW that later transform to CW lesions)
have greater probability of developing PTE Messori et al 2005

Blood-Brain Barrier and PTE
sLORETA identified delta and
contrast enhancement with MRI Tomkins et al. JNNP 2012

Blood-Brain Barrier Disruption and PTE
Tomkins et al. JNNP 2012
32 patients with head trauma – 17 had PTE
Patients studied at varying intervals after trauma – 5 days to 18 years, though most late
80% of patients with PTE had MRI lesion
30.8% of patients without PTE had MRI lesion
76.9% of patients with PTE had BBB disruption vs. 33.3% of patients without PTE (p < 0.05)
Volume of BBB disruption was significantly larger in patients with PTE (9.8 + 2.6 vs 1.7 + 0.6 cm3, p = 0.001

Diffuse Axonal Injury
Paterakis. J Trauma 2000 Effect on cortical connections

MRI Ascertainment of Lesions
A. Small hemorrhagic lesion in left occipital lobe
B. DWI shows same lesion
C. Trace map of diffusion shows same lesion
D. Lattice index (fractional anisotropy) shows decreased
anisotropy in left internal capsule and anterior callosum
Arfanakis et al. AJNR 2002

Multimodal Imaging
Storti et al. Magn Reson Mater Phy 2012 High density EEG, fMRI

Relative Risk of PTE in 137 Patients
Variables Relative risk 95% CI Early seizures 8.58 2.87-25.65 Single CT lesion 3.43 1.23-9.57 Focal EEG 3.49 1.10-11.05 GCS 0.93 0.30-2.96
Angeleri F et al. Epilepsia 1999

Management
Antiepileptic drugs – mainstay of therapy
Surgery – for medically refractory cases
Best prognosis with single lesion
Multifocal EEG probably worse prognosis
History of trauma or other injury in adults associated with better surgical outcome (Mathern et al)
Role of multimodal assessment tools to be defined

Impact on Clinical Care and Practice
EEG and MRI are used to aid in diagnosis and management of postraumatic epilepsy
Different techniques elucidate different lesion types
– Lesion type influences risk of PTE
– Provide data to identify those at risk for developing PTE
May be used to identify candidates for therapeutic intervention, e.g., anti-epileptogenesis


![NSF Project EEG CIRCUIT DESIGN. Micro-Power EEG Acquisition SoC[10] Electrode circuit EEG sensing Interference](https://img.pdfslide.us/doc/110x75/56649cfb5503460f949ccecd/nsf-project-eeg-circuit-design-micro-power-eeg-acquisition-soc10-electrode.jpg)