Embed Size (px)
Citation preview

Image Processing Image Processing
Intensity TransformationsIntensity TransformationsCh 3Ch 3Chapter 3Chapter 3
Prof. Vidya ManianDept. of Electrical and Comptuer Engineering
INEL 5327 Intensity Transformations ‐ 1ECE, UPRM

OverviewOverview
• BackgroundBackground
• Basic intensity transformation functions
i i• Histogram processing
INEL 5327 ECE, UPRM 2
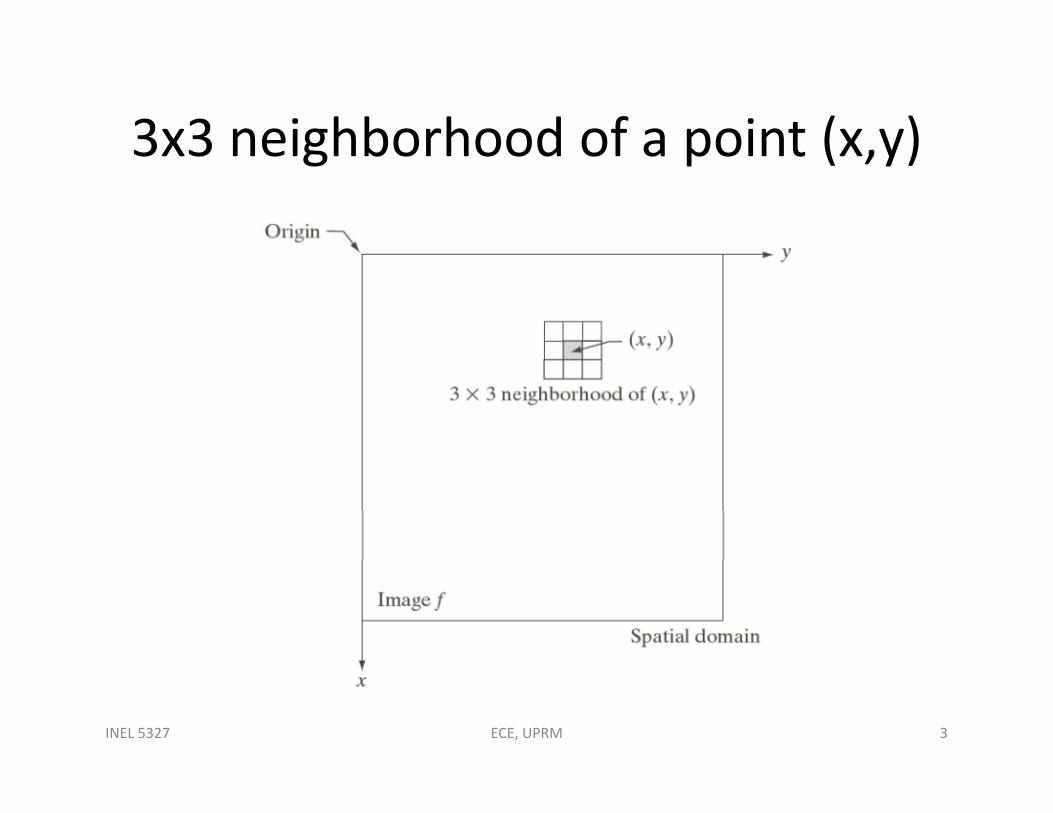
3x3 neighborhood of a point (x,y)3x3 neighborhood of a point (x,y)
INEL 5327 ECE, UPRM 3

Intensity or gray‐level or mapping f ftransformation function
• S=T(r)S=T(r)
• Resulting image has higher contrast by darkening the intensity levels below k anddarkening the intensity levels below k and brightening the levels above k
C hi l f l h k• Contrast stretching‐values of r lower than k are compressed by the transformation f i i f dfunction into a narrow range of s, toward black, vice versa for values of r higher than k
INEL 5327 ECE, UPRM 4

Contrast stretching and thresholdingffunctions
INEL 5327 ECE, UPRM 5
Thresholding functionThresholding function
• T(r) produces a two‐level (binary) image –T(r) produces a two level (binary) image limiting case
• Intensity transformations are used for image• Intensity transformations are used for image enhancement
Al f i i• Also for image segmentation
• Two types: point processing and neighborhood processing
INEL 5327 ECE, UPRM 6

Basic intensity transformation ffunctions
• S=T(r)S=T(r)
• Mapping from r to s are implemented via a lookup tablelookup table
• For 8‐bits, lookup table has 256 entries.
• Types of functions: linear (negative and identity transformations)
• Power‐law (nth power and nth root transformations))
INEL 5327 ECE, UPRM 7

Basic intensity transformation ffunctions
INEL 5327 ECE, UPRM 8
Image negativesImage negatives
• Negative transformation s=L‐1‐rg• Log transformation: s=c log (1+r)• c is a constant, r≥0• Maps range of low intensity values in the input to wider range of output levelsE d d k i l i i d• Expands dark pixels in an image and compresses the higher‐level values (white pixels)
• Useful for Fourier spectrum: spectra values rangeUseful for Fourier spectrum: spectra values range from 0 to 10^6 or higher.
• Detail lost in the display of Fourier spectrum
INEL 5327 ECE, UPRM 9

Original image and negative image obtained using the negativeobtained using the negative
transormation
INEL 5327 ECE, UPRM 10

Fourier spectrum and log ftransformation
INEL 5327 ECE, UPRM 11

• Fourier spectrum with values in range of 0 toFourier spectrum with values in range of 0 to 1.5 x 10^6 (Fig. 3.5 a) only few pixels are whitewhite.
• First use log transformation with c=1, range of values become 0 to 6 2values become 0 to 6.2
• Fig 3.5b has better scaling and shows more d ildetail.
INEL 5327 ECE, UPRM 12

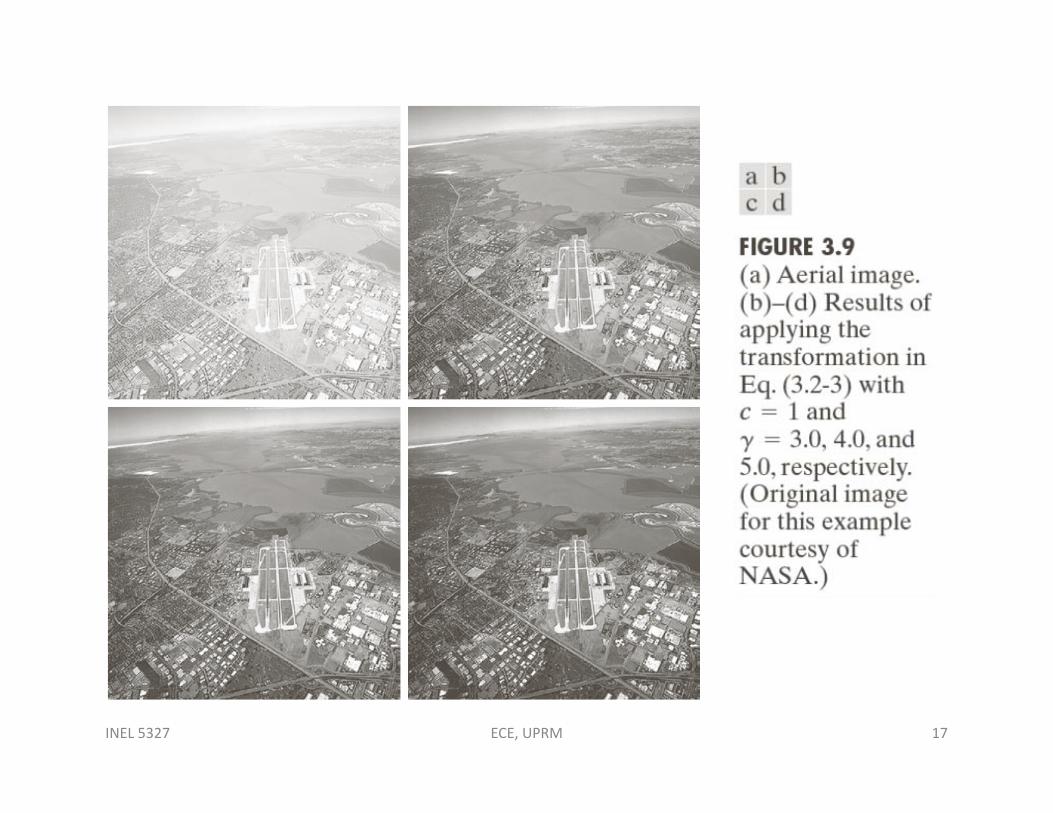
Power law (Gamma) transformationsPower law (Gamma) transformations
• s=cr
Where c and are positive constants. • s=c(r+) to account for an offset due to display calibrationcalibration
• power‐law curves with fractional values of map a narrow range of dark input values to a wider range of
t t l d it f hi h l f i toutput values, and opposite for higher values of input levels
• >1 has opposite effect of <1. Also called Gamma pp correction
• Device dependent, CRT displays, image capture, printingprinting
INEL 5327 ECE, UPRM 13

INEL 5327 ECE, UPRM 14

• Preprocess image before input to monitor by p g p ys=r^(1/2.5)=r^(0.4)
• Gamma corrected output has appearance close to originalto original
• Applicable to scanners, printers• Use of digital images for commercial purpose• Use of digital images for commercial purpose over Internet has increased
• Solution –display image after gamma correction p y g gto value that represents “average” of the types of monitors and computer systems to be used to display the imagedisplay the image.
INEL 5327 ECE, UPRM 15

INEL 5327 ECE, UPRM 16
INEL 5327 ECE, UPRM 17

Contrast stretchingContrast stretching
INEL 5327 ECE, UPRM 18
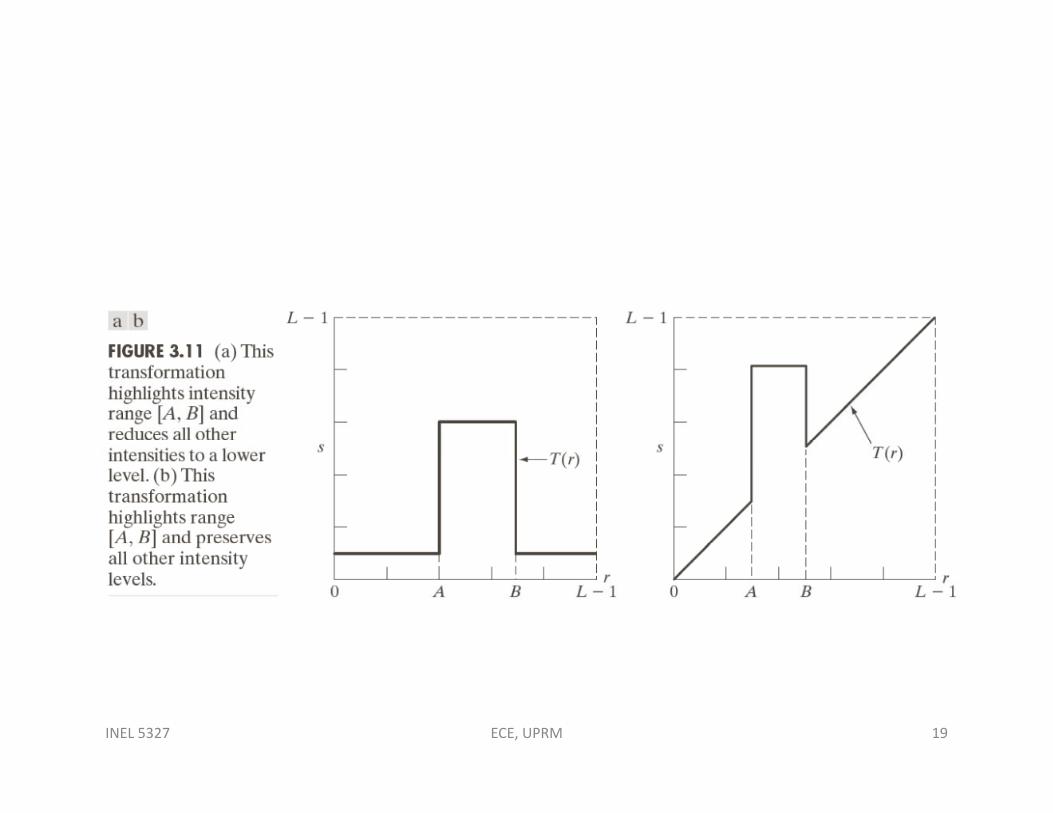
INEL 5327 ECE, UPRM 19
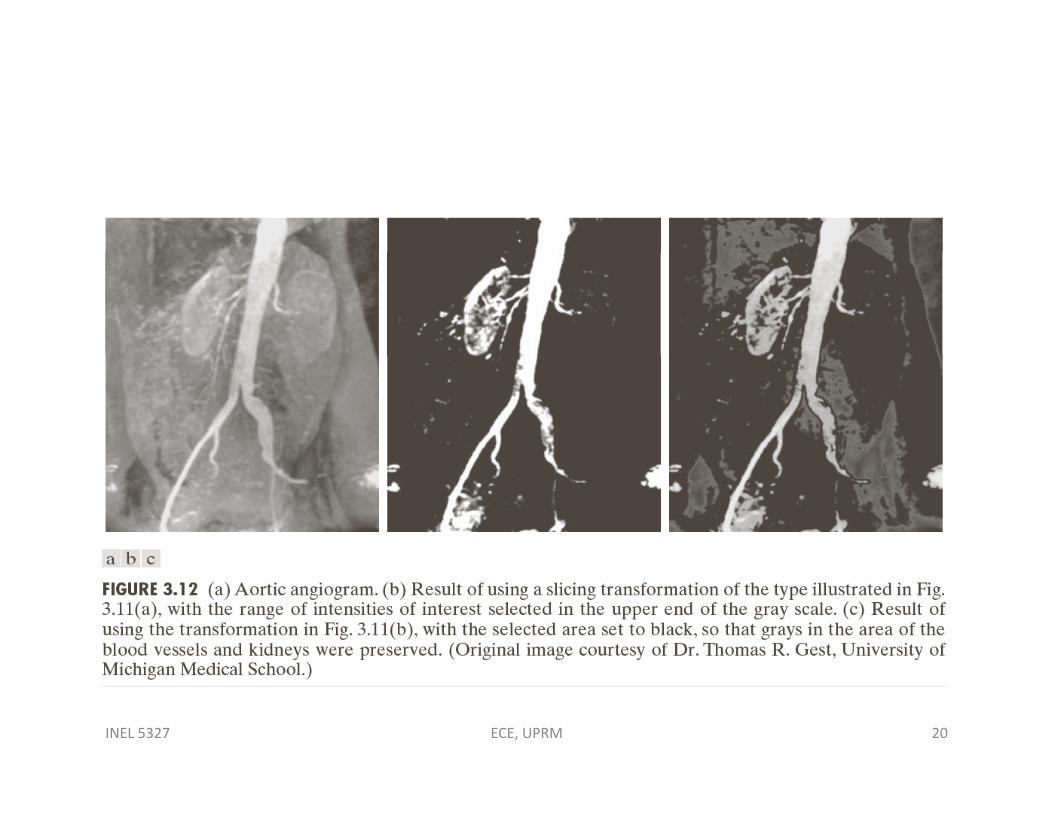
INEL 5327 ECE, UPRM 20

Bit plane representation of an 8‐bit image
INEL 5327 ECE, UPRM 21

INEL 5327 ECE, UPRM 22

INEL 5327 ECE, UPRM 23
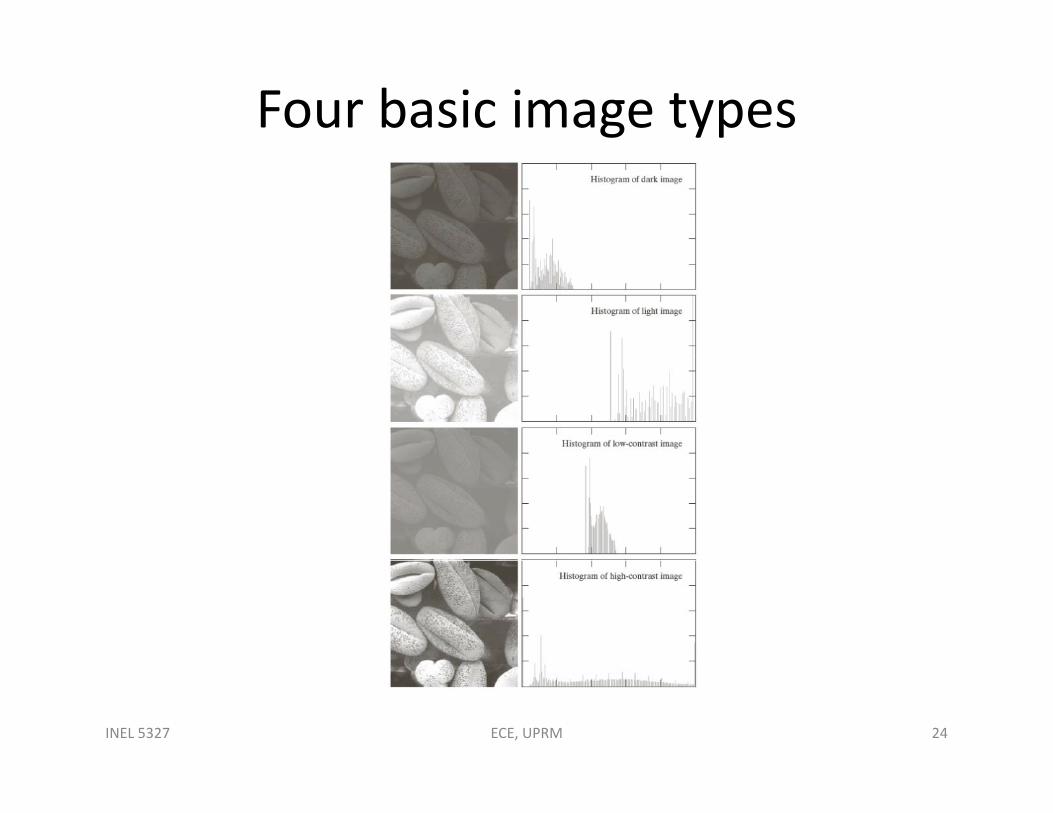
Four basic image types
INEL 5327 ECE, UPRM 24

Histogram equalizationHistogram equalization
INEL 5327 ECE, UPRM 25

Transformation functions for lHistogram equalization in Fig. 3. 20
INEL 5327 ECE, UPRM 26

Example of histogram equalizationExample of histogram equalization
INEL 5327 ECE, UPRM 27

HistogramHistogram
INEL 5327 ECE, UPRM 28

Histogram equalized imageHistogram equalized image
INEL 5327 ECE, UPRM 29

Specified HistogramSpecified Histogram
INEL 5327 ECE, UPRM 30

Steps for Histogram MatchingSteps for Histogram Matching• Obtain Pr(r) from input image and obtain values of s• Use specified pdf to obtain the transformation function• Use specified pdf to obtain the transformation function G(z)
• Obtain the inverse transformation z=G‐1(s); mapping ( ); pp gfrom s to z
• Obtain output image by first equalizing input image . F h i l ith l f i iFor each pixel with value s, perform inverse mapping z=G‐1(s) to obtain corresponding output pixel
• When all pixels are processed the pdf of output imageWhen all pixels are processed the pdf of output image is equal to specified pdf
INEL 5327 ECE, UPRM 31
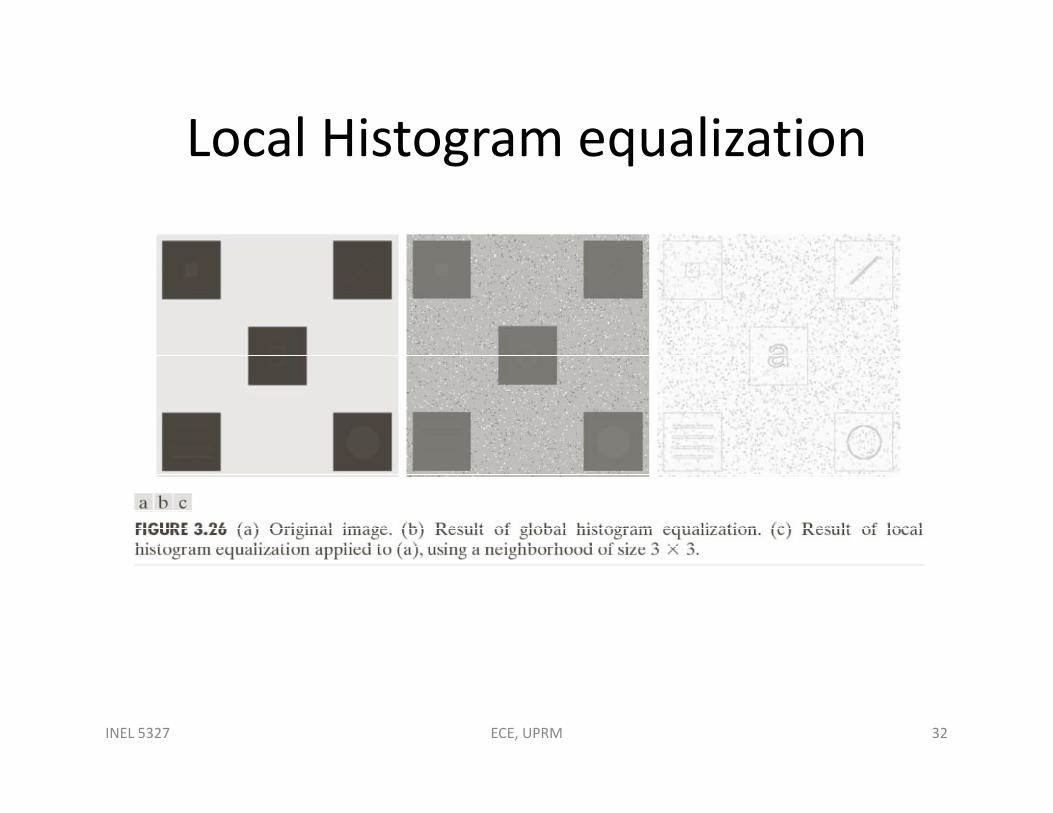
Local Histogram equalizationLocal Histogram equalization
INEL 5327 ECE, UPRM 32

Global and local histogram lequalization
INEL 5327 ECE, UPRM 33
Fundamentals of spatial filteringFundamentals of spatial filtering
• Filter: accepting(passing) or rejecting certainFilter: accepting(passing) or rejecting certain frequency components
• Spatial filter consists of (1) a neighborhood (a• Spatial filter consists of (1) a neighborhood (a small rectangle) and (2) predefined operation performed on the image pixels encompassedperformed on the image pixels encompassed by the neighborhood
Li d li fil• Linear and non‐linear filters
INEL 5327 ECE, UPRM 34

Basics of Spatial FilteringBasics of Spatial Filtering
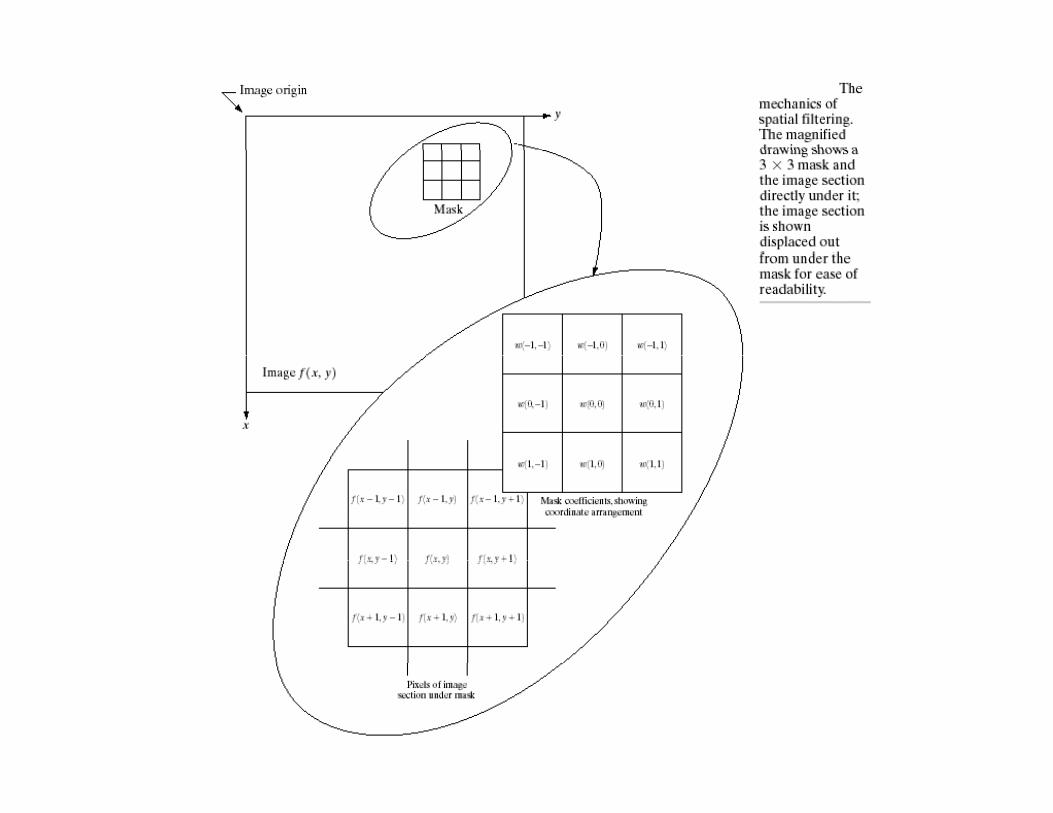
• Neighborhood subimage‐filter, mask, kernel,Neighborhood subimage filter, mask, kernel, template, or window
• Values in mask –coefficientsValues in mask coefficients• Response R of linear filtering with the filter mask at a point (x,y) in the image is:mask at a point (x,y) in the image is:
• R=w(‐1,‐1)f(x‐1,y‐1)+w(‐1,0)f(x‐1,y)+…• +w(0 0)f(x y)+ +w(1 0)f(x+1 y)+w(1 1)f(x+1 y+• +w(0,0)f(x,y)+…+w(1,0)f(x+1,y)+w(1,1)f(x+1,y+1)
INEL 5327 35ECE, UPRM

Mechanics of spatial filteringMechanics of spatial filtering
• W(0 0) center coefficient of the filterW(0,0) center coefficient of the filter
• Mask of size mxm, m=2a+1 and n=2b+1, where a and b are positive integerswhere a and b are positive integers
• Smallest size 3x3
INEL 5327 ECE, UPRM 36
Spatial correlation and convolutionSpatial correlation and convolution
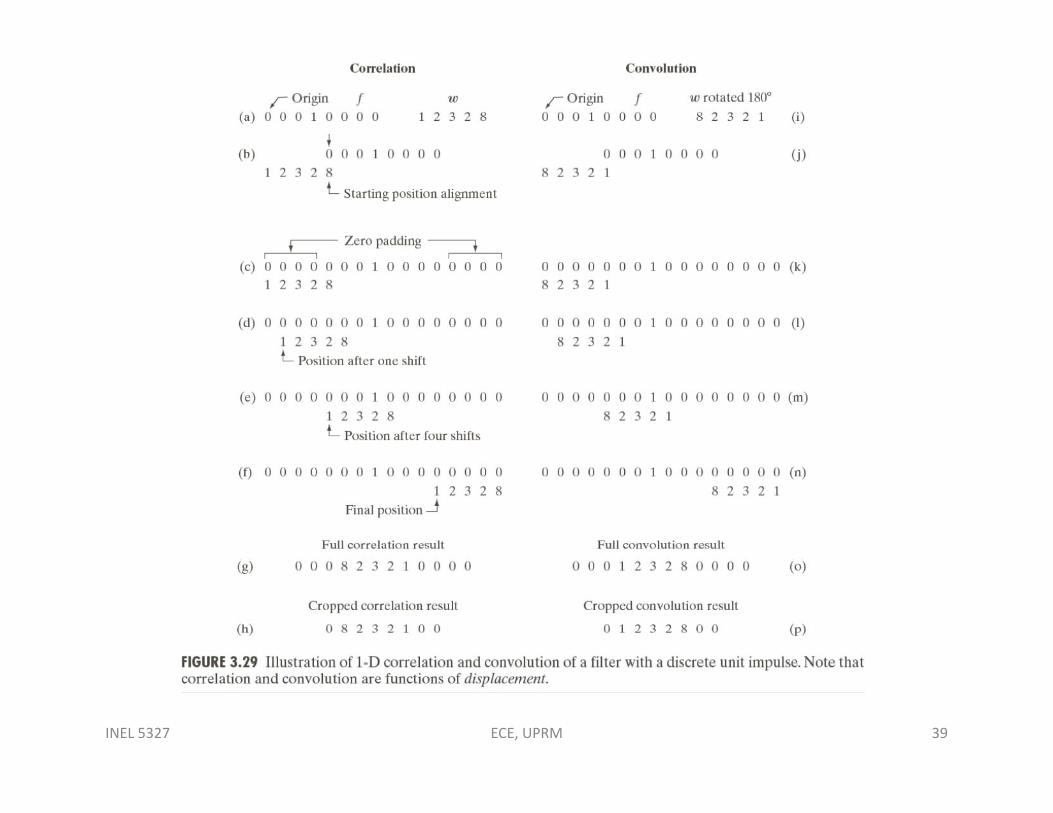
• Correlation is the process of moving a filter mask Co e at o s t e p ocess o o g a te asover the image and computing the sum of products at each location.
• Convolution is the same except that the filter is rotated by 180 degrees.
• Rotation is equivalent to horizontal flipping• In 2Drotation is equivalent to flipping the mask
l i d th th thalong one axis and then the other• Fig. 3.29 shows 1‐D convolution and correlation
INEL 5327 ECE, UPRM 38
INEL 5327 ECE, UPRM 39

Correlation and convolutionCorrelation and convolution
INEL 5327 ECE, UPRM 40

Smoothing spatial filters

Smoothing linear filtersSmoothing linear filters
• An mxn mask would have a normalizingAn mxn mask would have a normalizing constant equal to 1/mn.
• A spatial averaging filter in which allA spatial averaging filter in which all coefficients are equal is called a box filter
• The diagonal terms are further away fromThe diagonal terms are further away from center and hence are weighted less than the immediate neighbors
• Sum of coefficients =16 is useful for easy computer implementation ( a power of 2)
INEL 5327 42ECE, UPRM
Effect of smoothing as a function of f lfilter size
• Average filters of sizes m=3,5,9,15 and 35Average filters of sizes m 3,5,9,15 and 35 pixels
• Larger size windows for blurring removesLarger size windows for blurring removes smaller objects from image
• A gross representation of objects of interest isA gross representation of objects of interest is obtained
• Intensity of smaller objects blends withIntensity of smaller objects blends with background and larger objects become bloblike
INEL 5327 ECE, UPRM 43

INEL 5327 44ECE, UPRM

Order‐statistics (nonlinear) filtersOrder statistics (nonlinear) filters
• Response of nonlinear filters based on pordering(ranking) the pixels contained in the image area encompassed by the filter
• Median filter to remove impulse noise (salt and• Median filter‐ to remove impulse noise (salt and pepper noise)
• Sort the pixel values in the window (say 3x3 ) andSort the pixel values in the window (say 3x3 ) and assign the median value to the center pixel
• Forces pixels with distinct intensity levels to be lik i i hbmore like its neighbors
• Max, min filters
INEL 5327 ECE, UPRM 45

Image filtered with a 15x15 averaging kmask
INEL 5327 ECE, UPRM 46

INEL 5327 ECE, UPRM 47

Sharpening spatial filtersSharpening spatial filters
• Highlights transition in intensitiesHighlights transition in intensities
• Blurring by pixel averaging
Sh i b i l diff i i• Sharpening by spatial differentiation
• Enhances edges and other discontinuities such as noise
• Based on first and second order derivatives
INEL 5327 ECE, UPRM 48

First and second derivatives of a 1D lsignal
INEL 5327 ECE, UPRM 49

Sharpening spatial filtersSharpening spatial filters
f ( 1) ( )f f x f xx
2
2 ( 1) ( 1) 2 ( )f f x f x f xx
xChange between adjacent pixelsFirst and second derivativeFirst and second derivative(1) Must be zero in flat areas;(2) Non zero at the onset of gray‐level step or ramp(3) First derivative‐non zero along ramps; second derivative‐Zero along ramps of cnstant slope
INEL 5327 50ECE, UPRM

The Laplacian for enhancement (the d d i i )second derivative)
2 22
2 2
f ffx y
2
2
the x direction
( 1, ) ( 1, ) 2 ( , )
x yIn
f f x y f x y f x yx
2
2
In the y direction
( , 1) ( , 1) 2 ( , )
x
f f x y f x y f x yx
2
min[ ( , 1) ( , 1) ( 1, ) ( 1, )] 4 ( , )
xSum g
f f x y f x y f x y f x y f x y
INEL 5327 51ECE, UPRM
INEL 5327 52ECE, UPRM

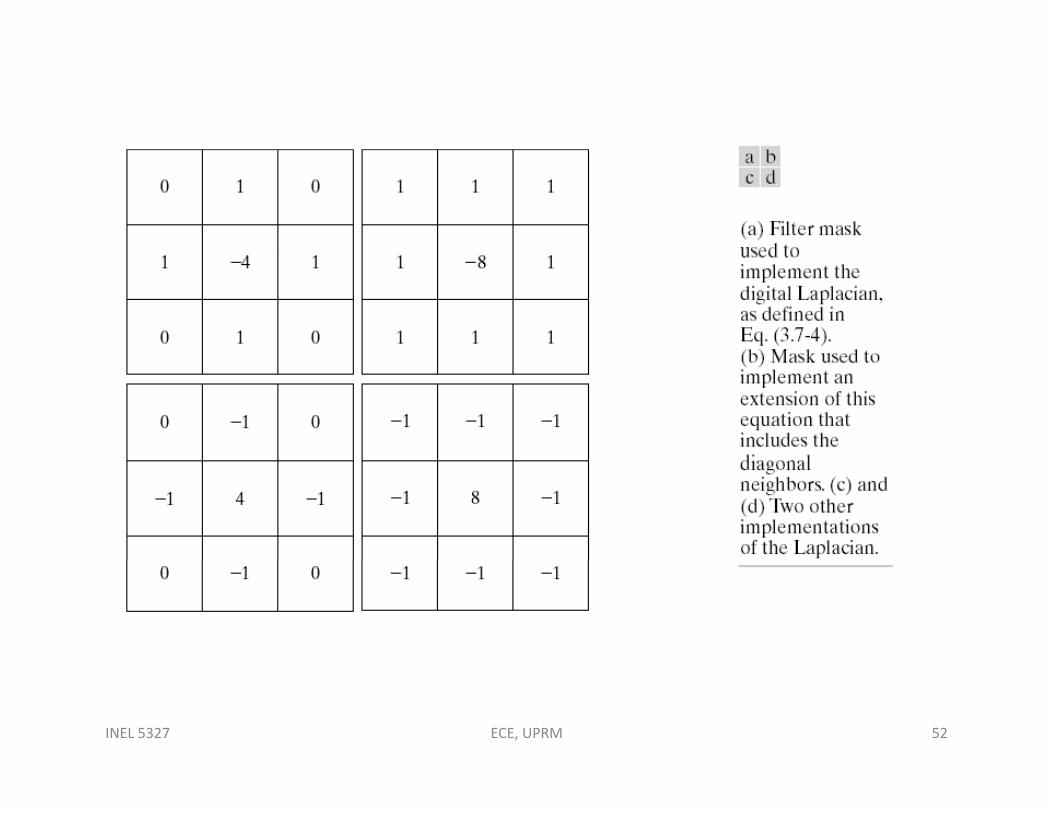
Second derivative‐the LaplacianSecond derivative the Laplacian
INEL 5327 ECE, UPRM 53
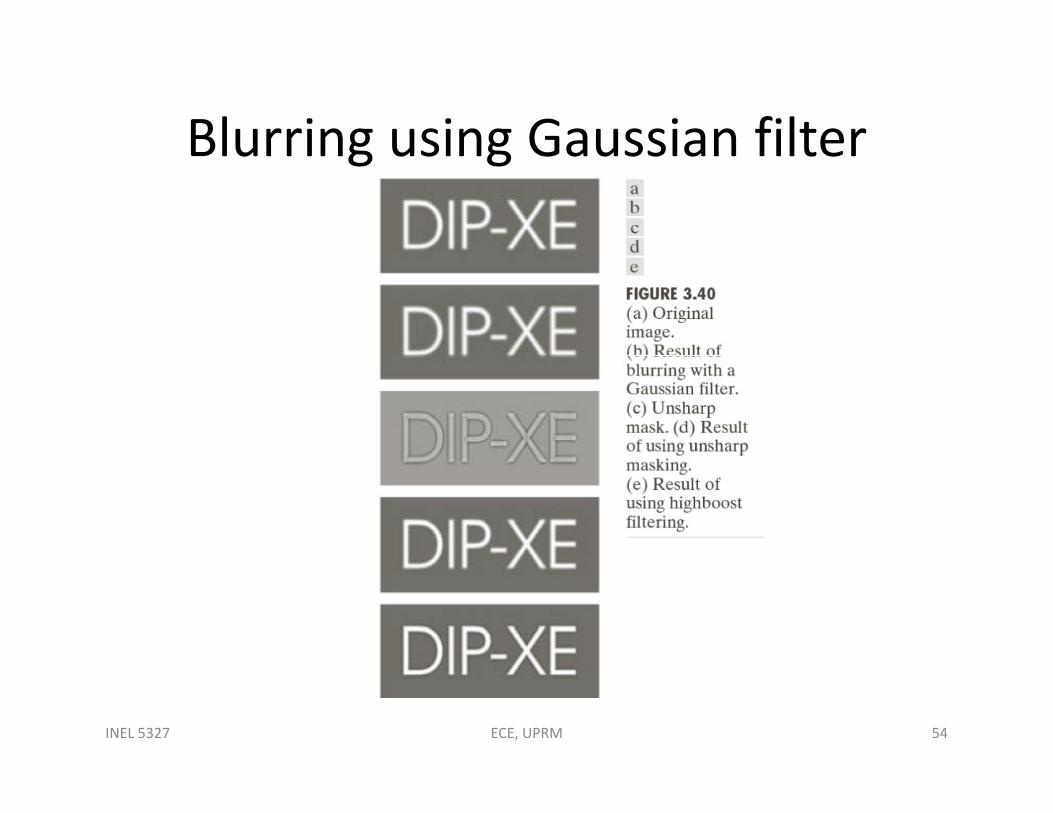
Blurring using Gaussian filterBlurring using Gaussian filter
INEL 5327 ECE, UPRM 54

INEL 5327 55ECE, UPRM

The Gradient for enhancement (the first d i i )derivative)
x
fG xf
fG
( )
y fGy
f mag f
2 2 1/ 2
1/ 222
( )[ ]x y
f mag fG G
22f f
x y
7 8 9 1 1 3 3 6 9 1 4 7( 2 ) ( 2 ) ( 2 ) ( 2 )f z z z z z z z z z z z z INEL 5327 56ECE, UPRM

INEL 5327 57ECE, UPRM
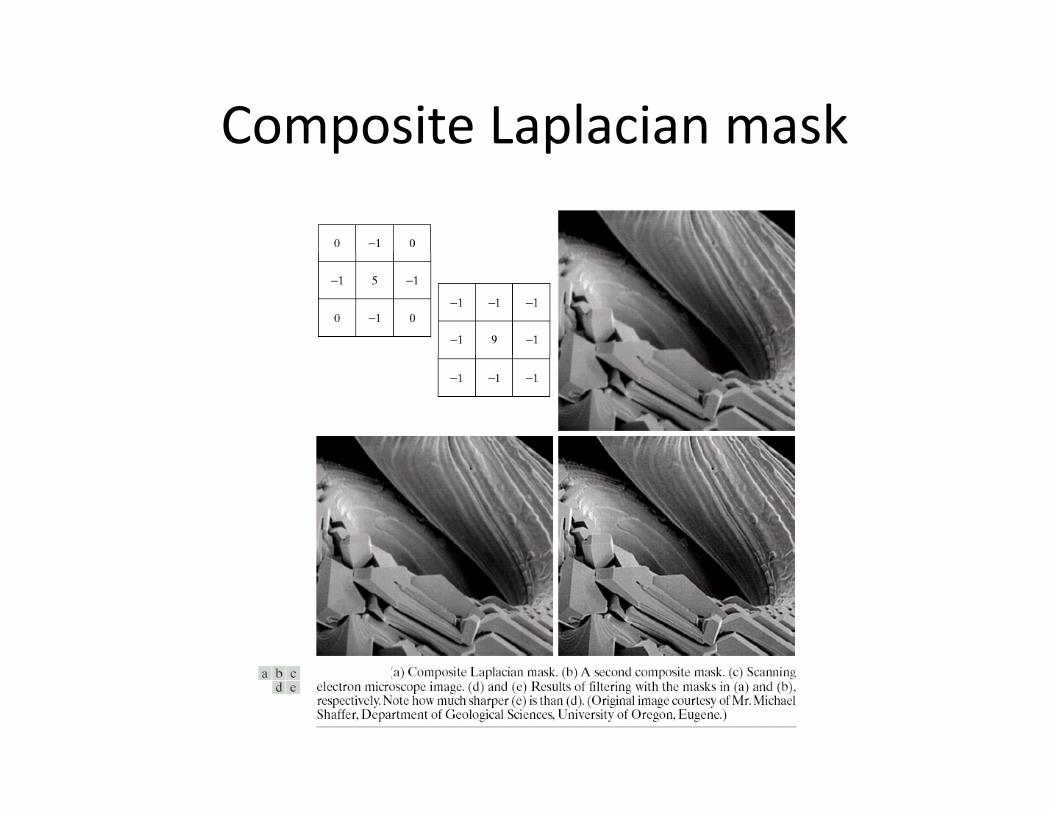
Composite Laplacian maskp p

Sobel gradientSobel gradient
INEL 5327 ECE, UPRM 59
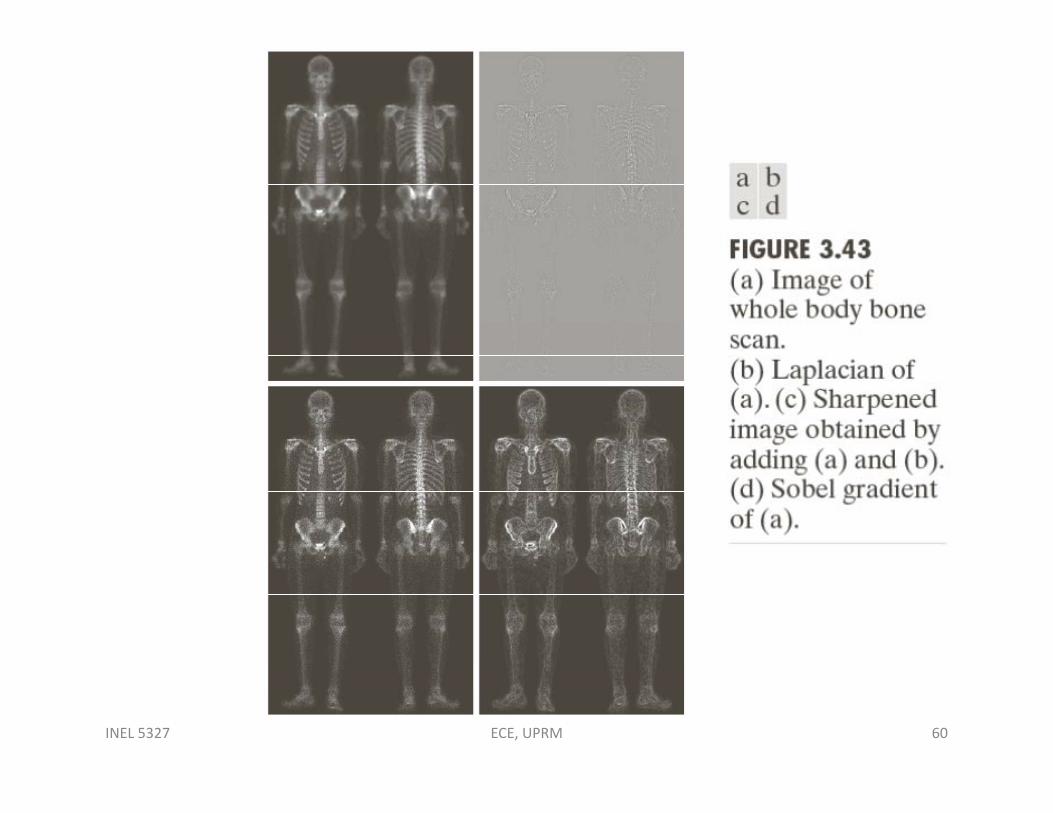
INEL 5327 ECE, UPRM 60

INEL 5327 61ECE, UPRM
Exercise in groupExercise in group
• Propose a set of intensity‐slicingPropose a set of intensity slicing transformations capable of producing all the individual bit planes of an 8bit monochrome image. T(r)=0 in range [0,127] and T(r)=255 for r in range [128,255] produces an image of the 8th bi l i 8 bi i8th bit plane in an 8‐bit image.
• Given the Gaussian pdf what is the f i f i ld ftransformation function you would use for
histogram equalization.
INEL 5327 ECE, UPRM 62

Exercises on spatial filteringExercises on spatial filtering
• 3 1 3 2 3 4 3 5 3 6 3 7 3 8 to 3 11 3 133.1,3.2,3.4, 3.5, 3.6, 3.7, 3.8 to 3.11, 3.13
• 3.15, 3.17, 3.19,
• 3.21, 3.23, 3.24, 3.25, 3.27, 3.28, 3.29
INEL 5327 ECE, UPRM 63

• 3 1)Give a single intensity transformation3.1)Give a single intensity transformation function for spreading the intensities of an image so the lowest intensity is 0 and highestimage so the lowest intensity is 0 and highest is L‐1.
• 3 5) What effect would setting to zero the• 3.5) What effect would setting to zero the lower‐order bit planes have on the histogram of an image in generalof an image in general.
INEL 5327 ECE, UPRM 64

• 3 6) Explain why discrete histogram3.6) Explain why discrete histogram equalization does not in general yield a flat histogramhistogram.
• Answer: To get a flat histogram, pixel intensities should be redistributed so thatintensities should be redistributed so that there are L groups of n/L pixels with same intensity and n=MNintensity and n=MN.
INEL 5327 ECE, UPRM 65

• 3 7) Suppose that a digital image is subjected3.7) Suppose that a digital image is subjected to histogram equalization. Show that a second pass of histogram equalization (on thepass of histogram equalization (on the histogram equalized image) will produce exactly the same result as the first passexactly the same result as the first pass.
INEL 5327 ECE, UPRM 66