Embed Size (px)
Citation preview
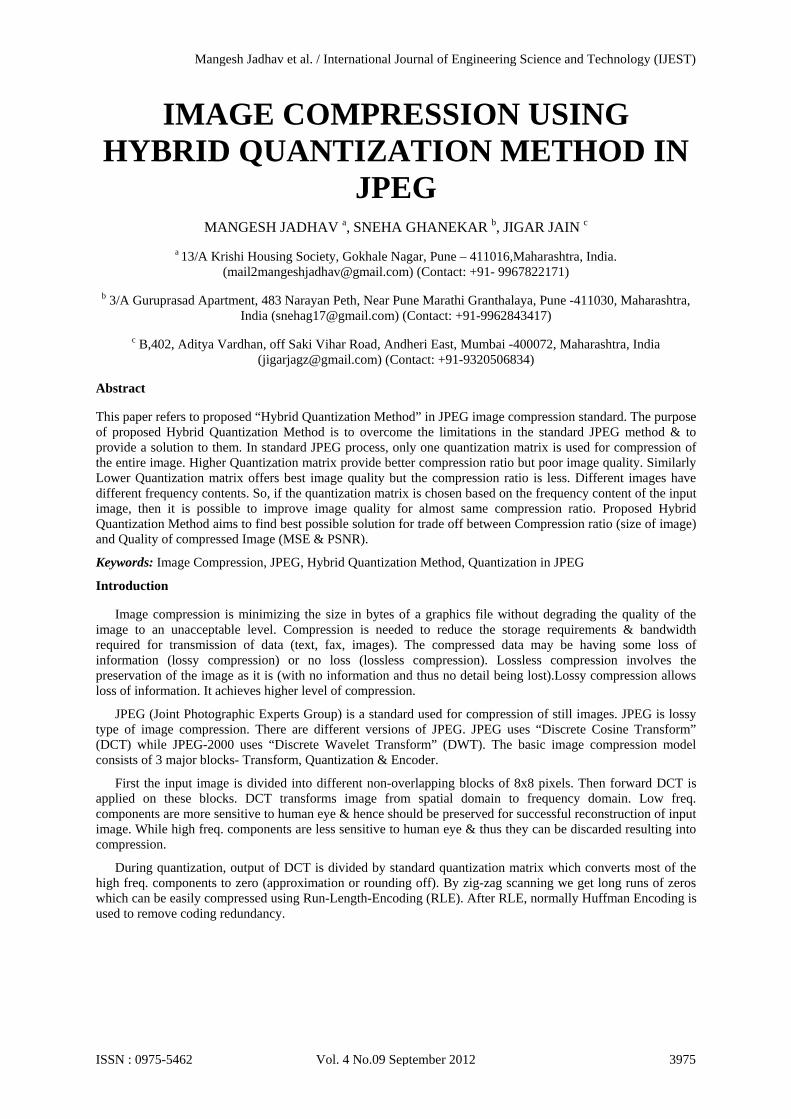
IMAGE COMPRESSION USING HYBRID QUANTIZATION METHOD IN
JPEG MANGESH JADHAV a, SNEHA GHANEKAR b, JIGAR JAIN c
a 13/A Krishi Housing Society, Gokhale Nagar, Pune – 411016,Maharashtra, India. ([email protected]) (Contact: +91- 9967822171)
b 3/A Guruprasad Apartment, 483 Narayan Peth, Near Pune Marathi Granthalaya, Pune -411030, Maharashtra, India ([email protected]) (Contact: +91-9962843417)
c B,402, Aditya Vardhan, off Saki Vihar Road, Andheri East, Mumbai -400072, Maharashtra, India ([email protected]) (Contact: +91-9320506834)
Abstract
This paper refers to proposed “Hybrid Quantization Method” in JPEG image compression standard. The purpose of proposed Hybrid Quantization Method is to overcome the limitations in the standard JPEG method & to provide a solution to them. In standard JPEG process, only one quantization matrix is used for compression of the entire image. Higher Quantization matrix provide better compression ratio but poor image quality. Similarly Lower Quantization matrix offers best image quality but the compression ratio is less. Different images have different frequency contents. So, if the quantization matrix is chosen based on the frequency content of the input image, then it is possible to improve image quality for almost same compression ratio. Proposed Hybrid Quantization Method aims to find best possible solution for trade off between Compression ratio (size of image) and Quality of compressed Image (MSE & PSNR).
Keywords: Image Compression, JPEG, Hybrid Quantization Method, Quantization in JPEG
Introduction
Image compression is minimizing the size in bytes of a graphics file without degrading the quality of the image to an unacceptable level. Compression is needed to reduce the storage requirements & bandwidth required for transmission of data (text, fax, images). The compressed data may be having some loss of information (lossy compression) or no loss (lossless compression). Lossless compression involves the preservation of the image as it is (with no information and thus no detail being lost).Lossy compression allows loss of information. It achieves higher level of compression.
JPEG (Joint Photographic Experts Group) is a standard used for compression of still images. JPEG is lossy type of image compression. There are different versions of JPEG. JPEG uses “Discrete Cosine Transform” (DCT) while JPEG-2000 uses “Discrete Wavelet Transform” (DWT). The basic image compression model consists of 3 major blocks- Transform, Quantization & Encoder.
First the input image is divided into different non-overlapping blocks of 8x8 pixels. Then forward DCT is applied on these blocks. DCT transforms image from spatial domain to frequency domain. Low freq. components are more sensitive to human eye & hence should be preserved for successful reconstruction of input image. While high freq. components are less sensitive to human eye & thus they can be discarded resulting into compression.
During quantization, output of DCT is divided by standard quantization matrix which converts most of the high freq. components to zero (approximation or rounding off). By zig-zag scanning we get long runs of zeros which can be easily compressed using Run-Length-Encoding (RLE). After RLE, normally Huffman Encoding is used to remove coding redundancy.
Mangesh Jadhav et al. / International Journal of Engineering Science and Technology (IJEST)
ISSN : 0975-5462 Vol. 4 No.09 September 2012 3975
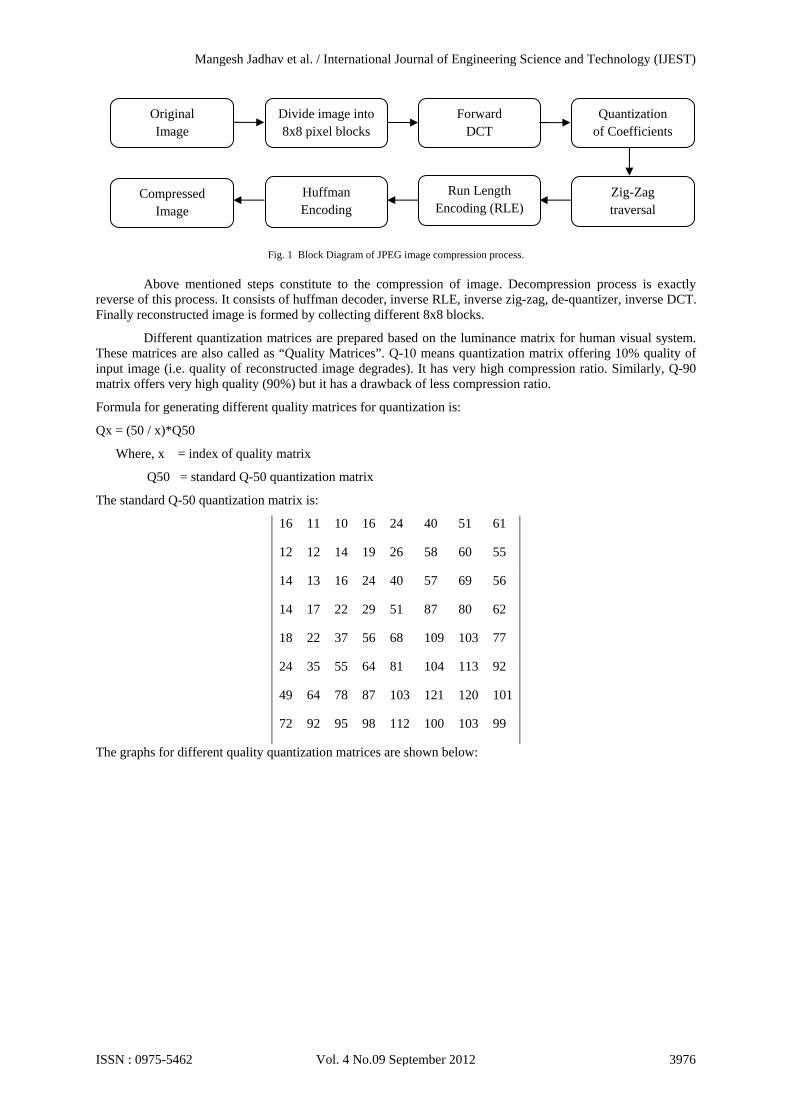
Fig. 1 Block Diagram of JPEG image compression process.
Above mentioned steps constitute to the compression of image. Decompression process is exactly
reverse of this process. It consists of huffman decoder, inverse RLE, inverse zig-zag, de-quantizer, inverse DCT. Finally reconstructed image is formed by collecting different 8x8 blocks.
Different quantization matrices are prepared based on the luminance matrix for human visual system. These matrices are also called as “Quality Matrices”. Q-10 means quantization matrix offering 10% quality of input image (i.e. quality of reconstructed image degrades). It has very high compression ratio. Similarly, Q-90 matrix offers very high quality (90%) but it has a drawback of less compression ratio.
Formula for generating different quality matrices for quantization is:
Qx = (50 / x)*Q50
Where, x = index of quality matrix
Q50 = standard Q-50 quantization matrix
The standard Q-50 quantization matrix is:
16 11 10 16 24 40 51 61
12 12 14 19 26 58 60 55
14 13 16 24 40 57 69 56
14 17 22 29 51 87 80 62
18 22 37 56 68 109 103 77
24 35 55 64 81 104 113 92
49 64 78 87 103 121 120 101
72 92 95 98 112 100 103 99
The graphs for different quality quantization matrices are shown below:
Original Image
Divide image into 8x8 pixel blocks
Forward DCT
Quantization of Coefficients
Zig-Zag traversal
Run Length Encoding (RLE)
Huffman Encoding
Compressed Image
Mangesh Jadhav et al. / International Journal of Engineering Science and Technology (IJEST)
ISSN : 0975-5462 Vol. 4 No.09 September 2012 3976
10 20 30 40 50 60 70 80 902
2.5
3
3.5
4
4.5
5
5.5
6
6.5
Quality Matrices
Com
pres
sion
Rat
io
Fig. 2 Graph of Compression ratio v/s different quality quantization matrices
It is observed that the compression ratio decreases while using quantization matrices offering better quality.
10 20 30 40 50 60 70 80 9010
20
30
40
50
60
70
80
90
Quality Matrices
Mea
n S
quar
ed E
rror
(M
SE
)
Fig. 3 Graph of Mean Squared Error (MSE) v/s different quality quantization matrices
As compression ratio decreases from Q-10 to Q-90, the value of mean squared error (MSE) also decreases. MSE is image quality parameter. Lower values of MSE indicate high quality of image.
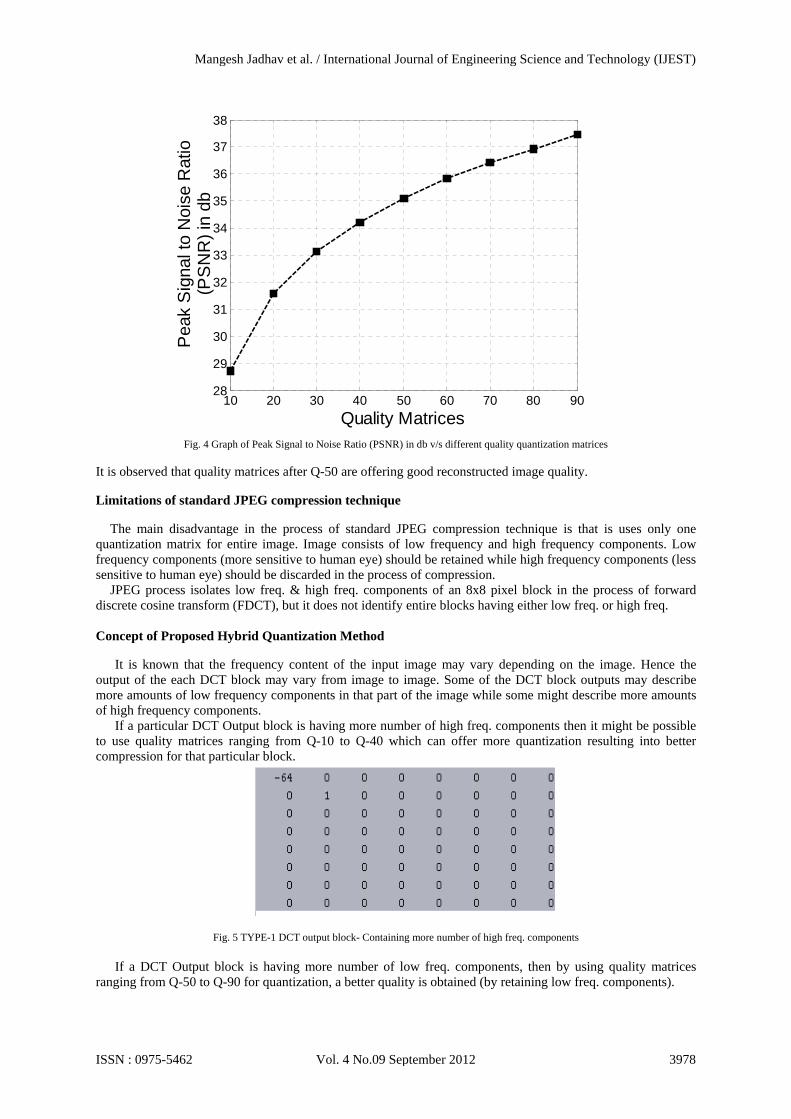
Peak Signal to Noise Ratio (PSNR) is also a parameter for judging image quality. It is measured in decibels (db). Generally images having PSNR above 25 or 30 are supposed to be good quality images.
Mangesh Jadhav et al. / International Journal of Engineering Science and Technology (IJEST)
ISSN : 0975-5462 Vol. 4 No.09 September 2012 3977
10 20 30 40 50 60 70 80 9028
29
30
31
32
33
34
35
36
37
38
Quality Matrices
Pea
k S
igna
l to
Noi
se R
atio
(PS
NR
) in
db
Fig. 4 Graph of Peak Signal to Noise Ratio (PSNR) in db v/s different quality quantization matrices
It is observed that quality matrices after Q-50 are offering good reconstructed image quality.
Limitations of standard JPEG compression technique
The main disadvantage in the process of standard JPEG compression technique is that is uses only one quantization matrix for entire image. Image consists of low frequency and high frequency components. Low frequency components (more sensitive to human eye) should be retained while high frequency components (less sensitive to human eye) should be discarded in the process of compression.
JPEG process isolates low freq. & high freq. components of an 8x8 pixel block in the process of forward discrete cosine transform (FDCT), but it does not identify entire blocks having either low freq. or high freq.
Concept of Proposed Hybrid Quantization Method
It is known that the frequency content of the input image may vary depending on the image. Hence the output of the each DCT block may vary from image to image. Some of the DCT block outputs may describe more amounts of low frequency components in that part of the image while some might describe more amounts of high frequency components.
If a particular DCT Output block is having more number of high freq. components then it might be possible to use quality matrices ranging from Q-10 to Q-40 which can offer more quantization resulting into better compression for that particular block.
Fig. 5 TYPE-1 DCT output block- Containing more number of high freq. components
If a DCT Output block is having more number of low freq. components, then by using quality matrices
ranging from Q-50 to Q-90 for quantization, a better quality is obtained (by retaining low freq. components).
Mangesh Jadhav et al. / International Journal of Engineering Science and Technology (IJEST)
ISSN : 0975-5462 Vol. 4 No.09 September 2012 3978
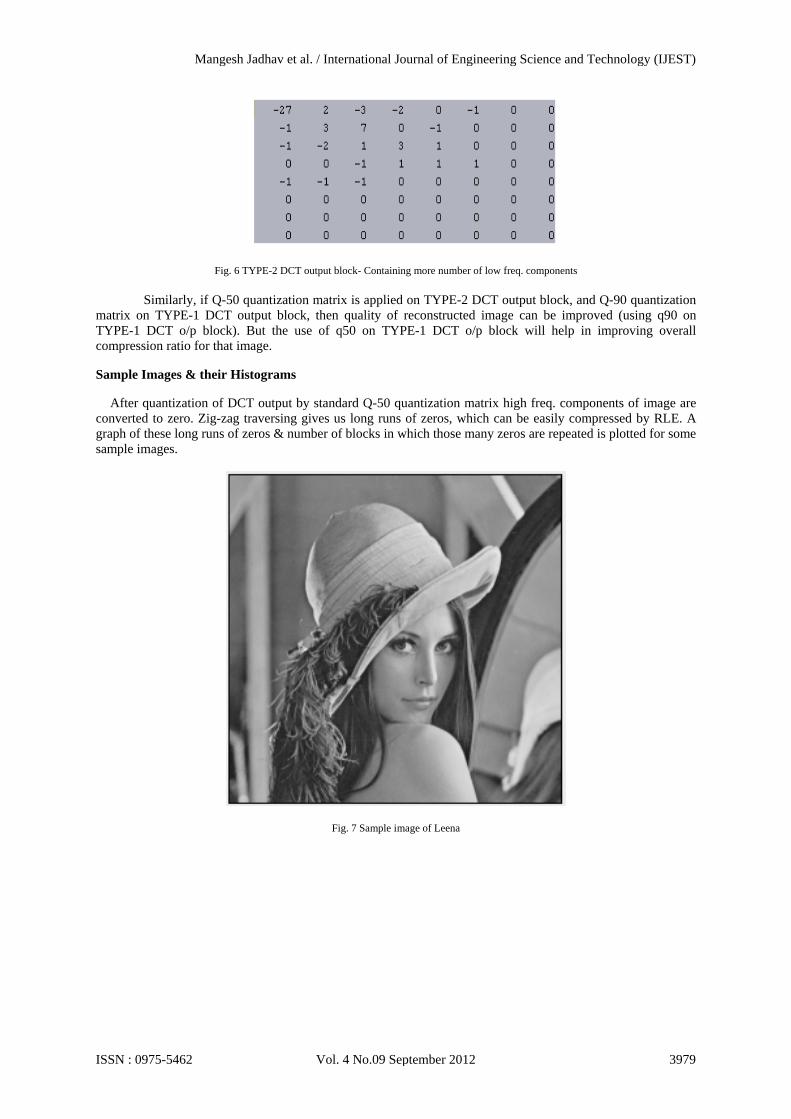
Fig. 6 TYPE-2 DCT output block- Containing more number of low freq. components
Similarly, if Q-50 quantization matrix is applied on TYPE-2 DCT output block, and Q-90 quantization
matrix on TYPE-1 DCT output block, then quality of reconstructed image can be improved (using q90 on TYPE-1 DCT o/p block). But the use of q50 on TYPE-1 DCT o/p block will help in improving overall compression ratio for that image.
Sample Images & their Histograms
After quantization of DCT output by standard Q-50 quantization matrix high freq. components of image are converted to zero. Zig-zag traversing gives us long runs of zeros, which can be easily compressed by RLE. A graph of these long runs of zeros & number of blocks in which those many zeros are repeated is plotted for some sample images.
Fig. 7 Sample image of Leena
Mangesh Jadhav et al. / International Journal of Engineering Science and Technology (IJEST)
ISSN : 0975-5462 Vol. 4 No.09 September 2012 3979
35 40 45 50 55 60 650
10
20
30
40
50
60
70
80
90
100
No. of zeros
No.
of b
lock
s co
ntai
ning
that
man
y ze
roes
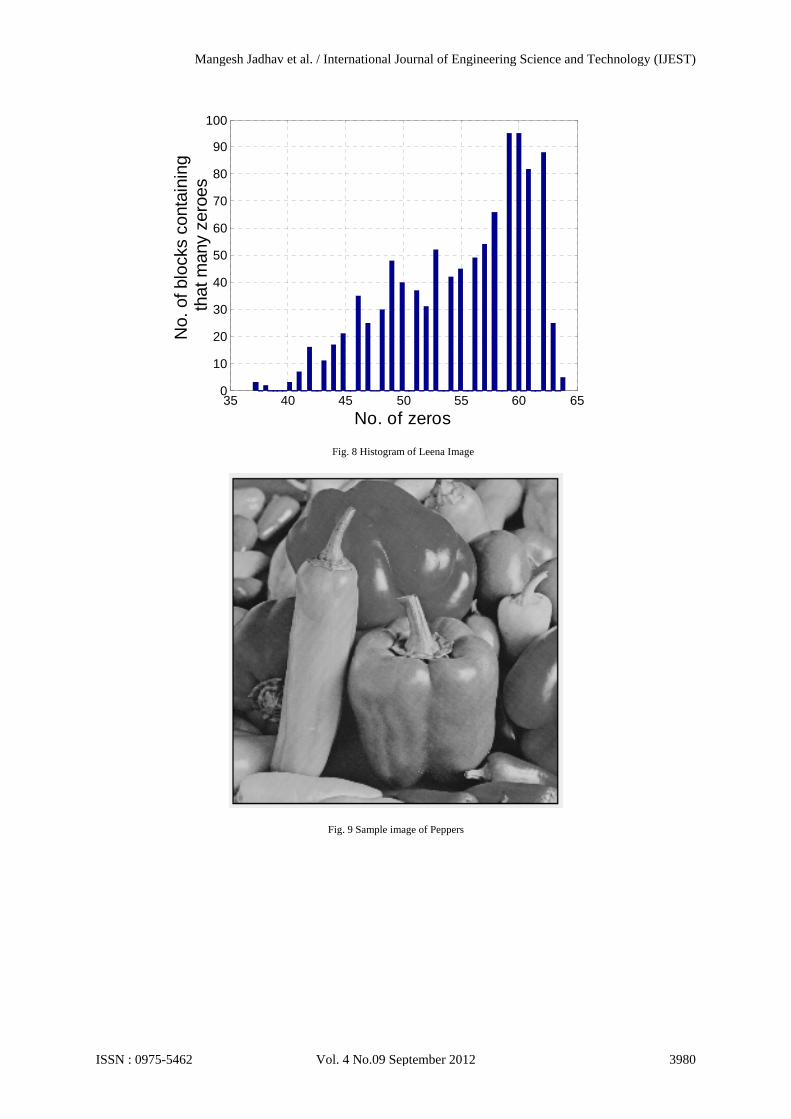
Fig. 8 Histogram of Leena Image
Fig. 9 Sample image of Peppers
Mangesh Jadhav et al. / International Journal of Engineering Science and Technology (IJEST)
ISSN : 0975-5462 Vol. 4 No.09 September 2012 3980
35 40 45 50 55 60 650
10
20
30
40
50
60
70
80
90
100
No. of zeros
No.
of b
lock
s co
ntai
ning
that
man
y ze
roes
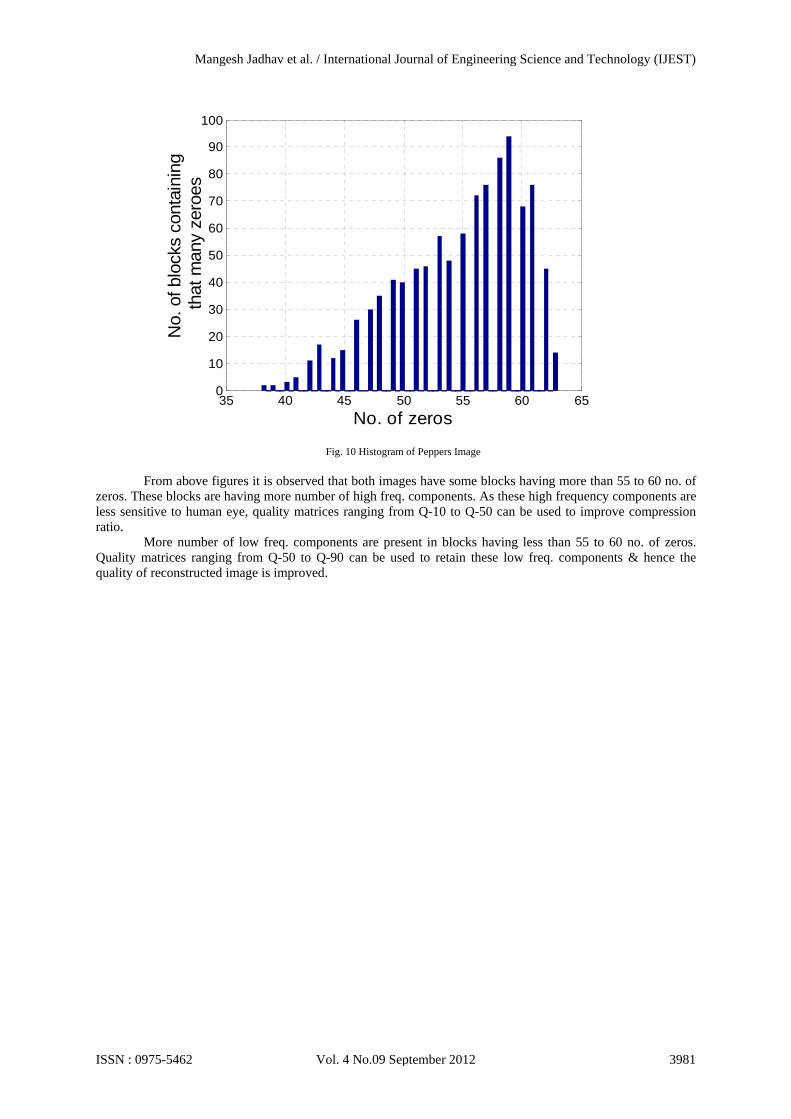
Fig. 10 Histogram of Peppers Image
From above figures it is observed that both images have some blocks having more than 55 to 60 no. of
zeros. These blocks are having more number of high freq. components. As these high frequency components are less sensitive to human eye, quality matrices ranging from Q-10 to Q-50 can be used to improve compression ratio.
More number of low freq. components are present in blocks having less than 55 to 60 no. of zeros. Quality matrices ranging from Q-50 to Q-90 can be used to retain these low freq. components & hence the quality of reconstructed image is improved.
Mangesh Jadhav et al. / International Journal of Engineering Science and Technology (IJEST)
ISSN : 0975-5462 Vol. 4 No.09 September 2012 3981
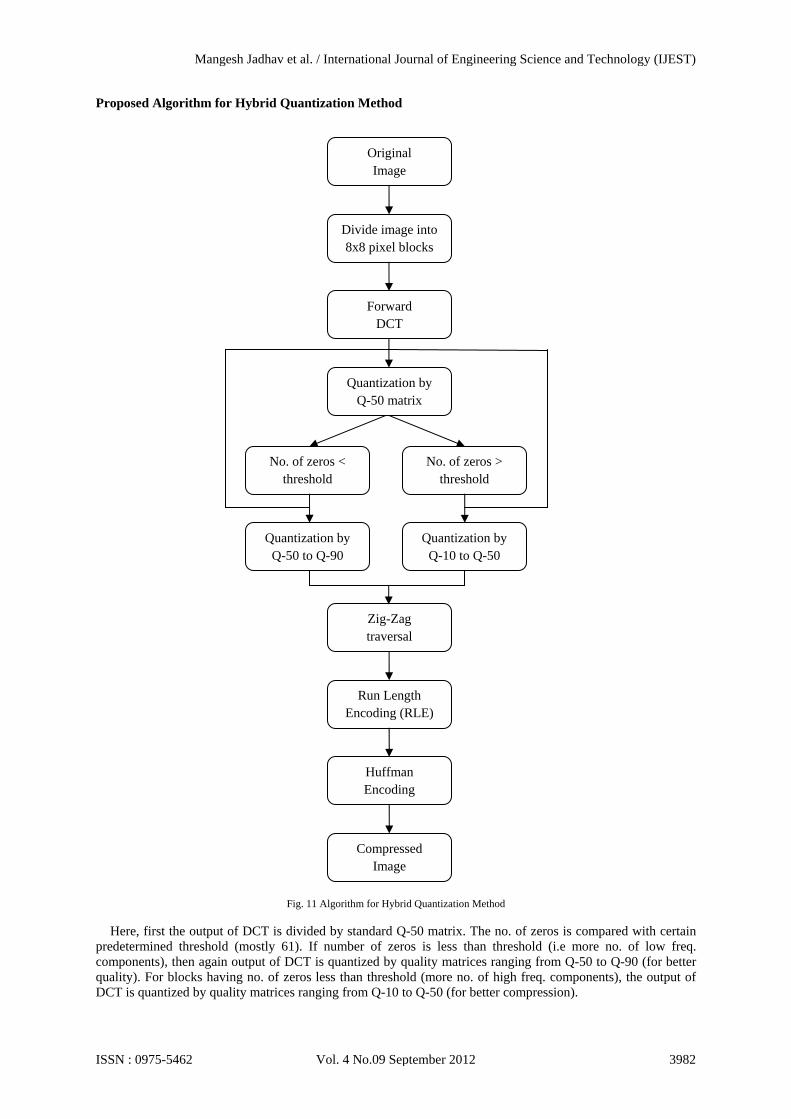
Proposed Algorithm for Hybrid Quantization Method
Fig. 11 Algorithm for Hybrid Quantization Method
Here, first the output of DCT is divided by standard Q-50 matrix. The no. of zeros is compared with certain predetermined threshold (mostly 61). If number of zeros is less than threshold (i.e more no. of low freq. components), then again output of DCT is quantized by quality matrices ranging from Q-50 to Q-90 (for better quality). For blocks having no. of zeros less than threshold (more no. of high freq. components), the output of DCT is quantized by quality matrices ranging from Q-10 to Q-50 (for better compression).
Original Image
Divide image into 8x8 pixel blocks
Forward DCT
Quantization by Q-50 matrix
Zig-Zag traversal
Run Length Encoding (RLE)
Huffman Encoding
Compressed Image
No. of zeros < threshold
No. of zeros > threshold
Quantization by Q-50 to Q-90
Quantization by Q-10 to Q-50
Mangesh Jadhav et al. / International Journal of Engineering Science and Technology (IJEST)
ISSN : 0975-5462 Vol. 4 No.09 September 2012 3982
The decompression process is exactly reverse of this process. The selection of quantization matrices for decompression is also based on threshold & no. of zeros in the output of inverse zigzag. Results for Hybrid Quantization Method (HQM)
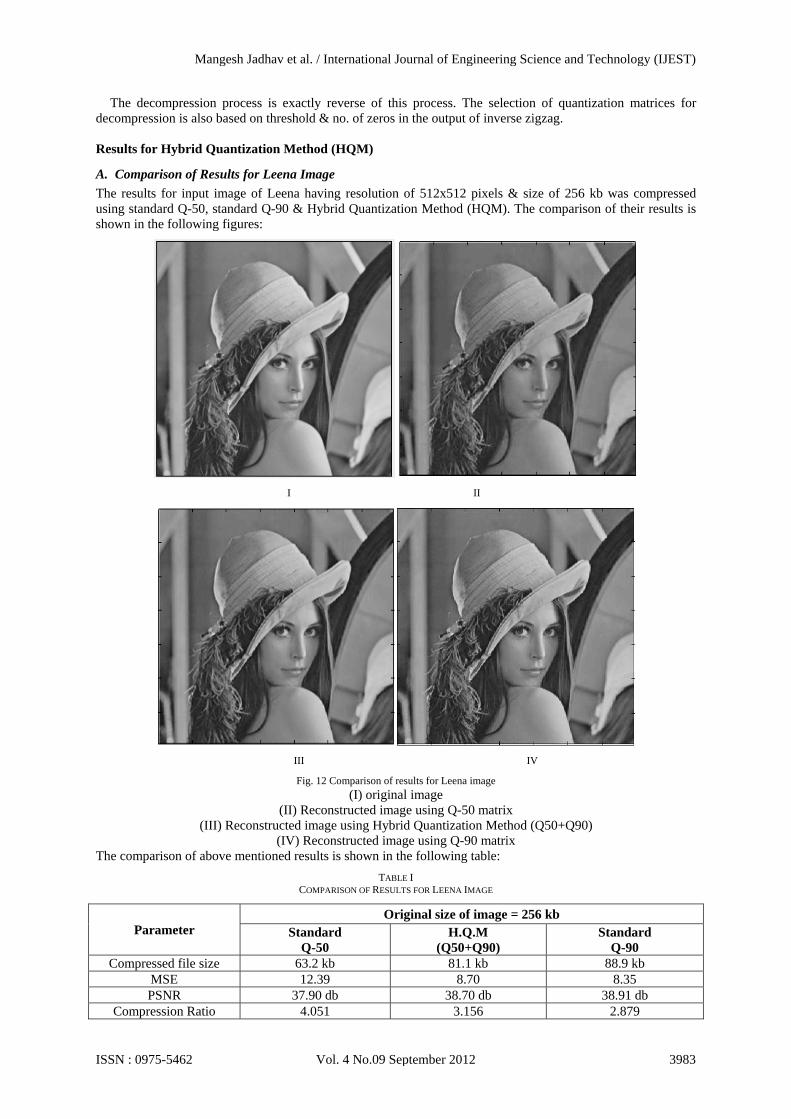
A. Comparison of Results for Leena Image
The results for input image of Leena having resolution of 512x512 pixels & size of 256 kb was compressed using standard Q-50, standard Q-90 & Hybrid Quantization Method (HQM). The comparison of their results is shown in the following figures:
I II
III IV
Fig. 12 Comparison of results for Leena image
(I) original image (II) Reconstructed image using Q-50 matrix
(III) Reconstructed image using Hybrid Quantization Method (Q50+Q90) (IV) Reconstructed image using Q-90 matrix
The comparison of above mentioned results is shown in the following table:
TABLE I COMPARISON OF RESULTS FOR LEENA IMAGE
Parameter Original size of image = 256 kb
Standard Q-50
H.Q.M (Q50+Q90)
Standard Q-90
Compressed file size 63.2 kb 81.1 kb 88.9 kb MSE 12.39 8.70 8.35 PSNR 37.90 db 38.70 db 38.91 db
Compression Ratio 4.051 3.156 2.879
Mangesh Jadhav et al. / International Journal of Engineering Science and Technology (IJEST)
ISSN : 0975-5462 Vol. 4 No.09 September 2012 3983
It is observed that for almost same value of mean squared error (MSE) & peak signal to noise ratio (PSNR) the compressed file size for compression using Hybrid Quantization Method reduces by almost 10% of the compressed file size obtained by compression using standard Q-90 matrix.
B. Results for Different Sizes of Leena Image
The Hybrid Quantization Method (HQM) was applied on different sizes (i.e. resolutions) of Leena image. The table for input image of Leena having resolution of 256x256 pixels & size of 65 kb is shown below:
. TABLE III COMPARISON OF RESULTS FOR LEENA IMAGE (256X256)
Parameter Original size of image = 65 kb
Standard Q-50
H.Q.M (Q50+Q90)
Standard Q-90
Compressed file size 22.8 kb 29.7 kb 30.4 kb MSE 27.2 16.49 16.34 PSNR 33.70 db 35.95 db 35.99 db
Compression Ratio 2.850 2.188 2.138
The table for input image of leena having resolution of 512x512 pixels & size of 256 kb is shown below:
. TABLE IIIII COMPARISON OF RESULTS FOR LEENA IMAGE (512X512)
Parameter Original size of image = 256 kb
Standard Q-50
H.Q.M (Q50+Q90)
Standard Q-90
Compressed file size 63.2 kb 81.1 kb 88.9 kb MSE 12.39 8.70 8.35 PSNR 37.90 db 38.70 db 38.91 db
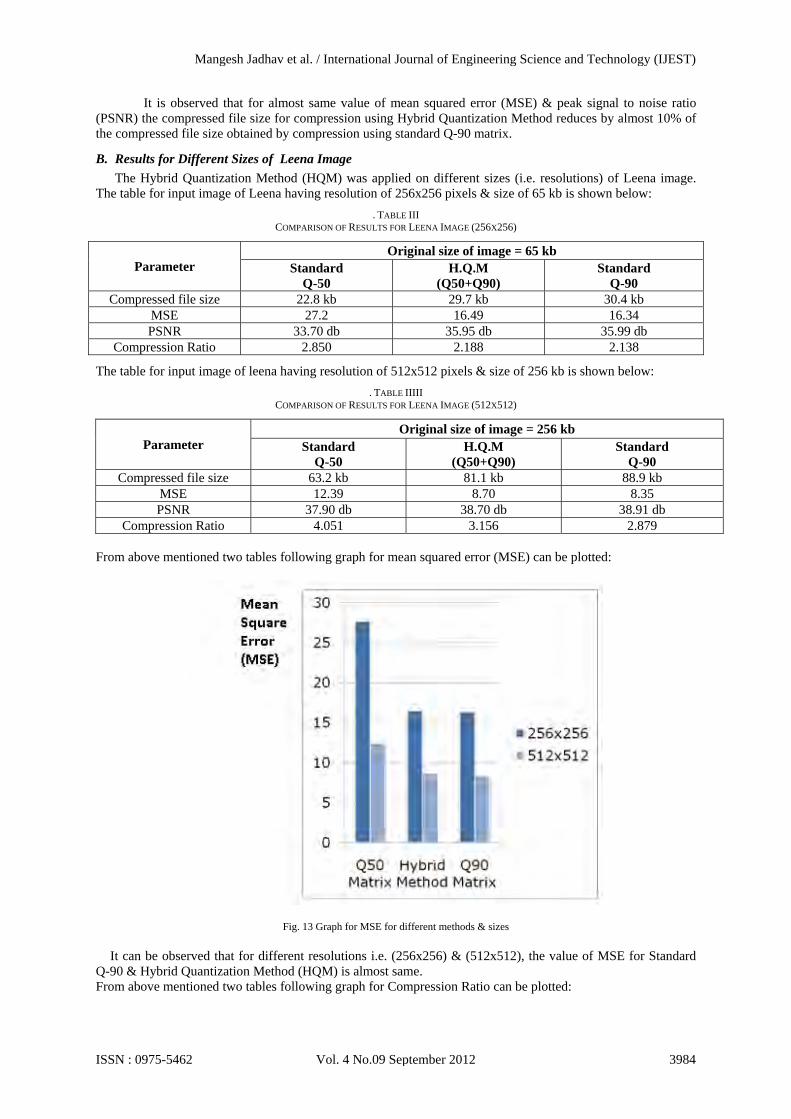
Compression Ratio 4.051 3.156 2.879 From above mentioned two tables following graph for mean squared error (MSE) can be plotted:
Fig. 13 Graph for MSE for different methods & sizes
It can be observed that for different resolutions i.e. (256x256) & (512x512), the value of MSE for Standard
Q-90 & Hybrid Quantization Method (HQM) is almost same. From above mentioned two tables following graph for Compression Ratio can be plotted:
Mangesh Jadhav et al. / International Journal of Engineering Science and Technology (IJEST)
ISSN : 0975-5462 Vol. 4 No.09 September 2012 3984
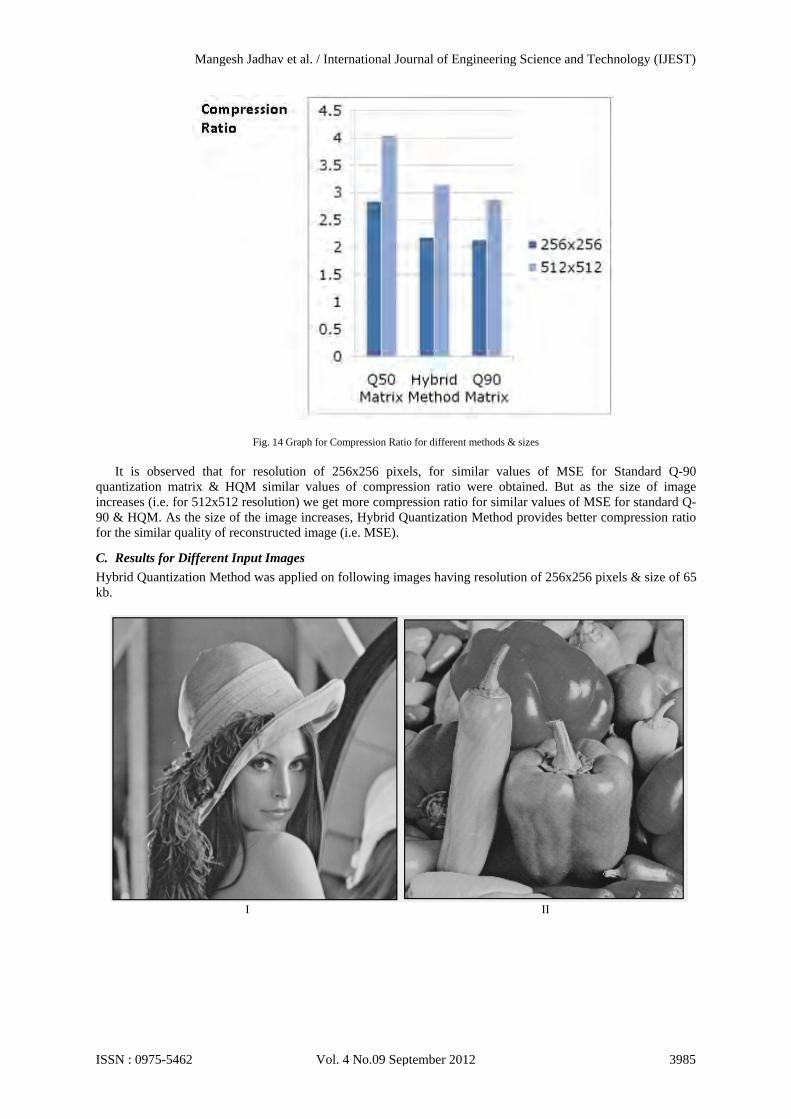
Fig. 14 Graph for Compression Ratio for different methods & sizes
It is observed that for resolution of 256x256 pixels, for similar values of MSE for Standard Q-90
quantization matrix & HQM similar values of compression ratio were obtained. But as the size of image increases (i.e. for 512x512 resolution) we get more compression ratio for similar values of MSE for standard Q-90 & HQM. As the size of the image increases, Hybrid Quantization Method provides better compression ratio for the similar quality of reconstructed image (i.e. MSE).
C. Results for Different Input Images
Hybrid Quantization Method was applied on following images having resolution of 256x256 pixels & size of 65 kb.
I II
Mangesh Jadhav et al. / International Journal of Engineering Science and Technology (IJEST)
ISSN : 0975-5462 Vol. 4 No.09 September 2012 3985
III
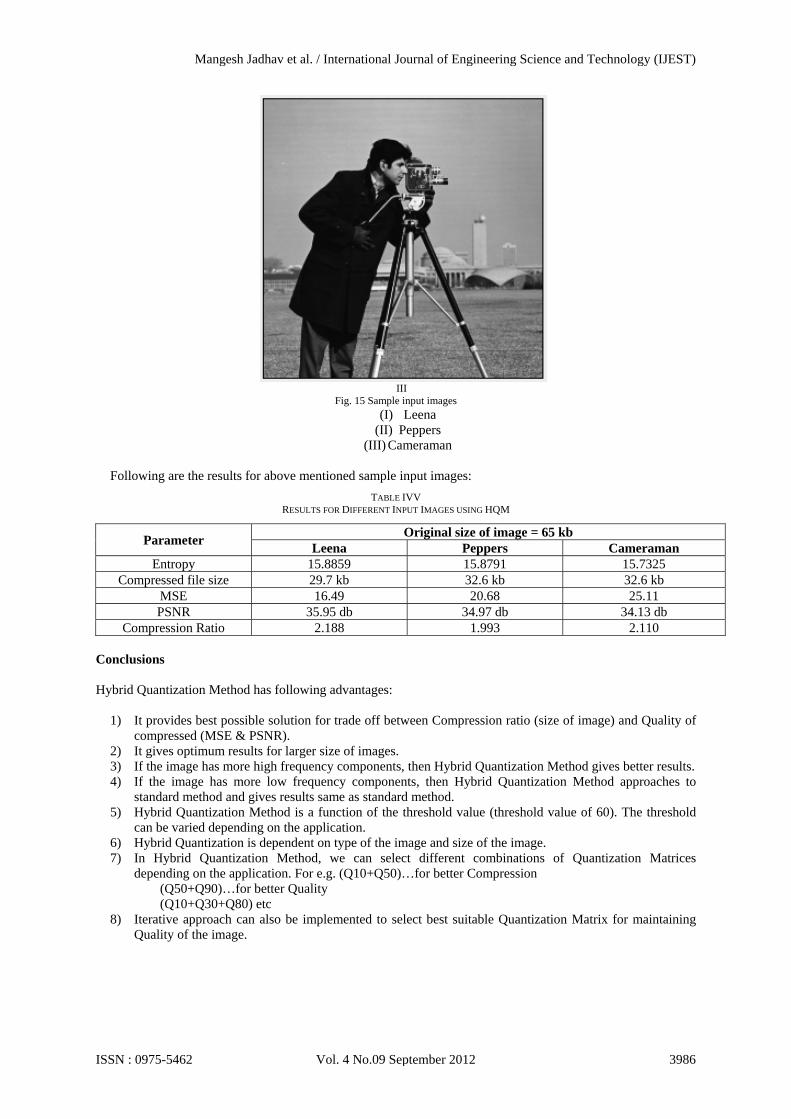
Fig. 15 Sample input images
(I) Leena (II) Peppers
(III) Cameraman
Following are the results for above mentioned sample input images:
TABLE IVV RESULTS FOR DIFFERENT INPUT IMAGES USING HQM
Parameter Original size of image = 65 kb
Leena Peppers Cameraman Entropy 15.8859 15.8791 15.7325
Compressed file size 29.7 kb 32.6 kb 32.6 kb MSE 16.49 20.68 25.11 PSNR 35.95 db 34.97 db 34.13 db
Compression Ratio 2.188 1.993 2.110 Conclusions Hybrid Quantization Method has following advantages:
1) It provides best possible solution for trade off between Compression ratio (size of image) and Quality of compressed (MSE & PSNR).
2) It gives optimum results for larger size of images. 3) If the image has more high frequency components, then Hybrid Quantization Method gives better results. 4) If the image has more low frequency components, then Hybrid Quantization Method approaches to
standard method and gives results same as standard method. 5) Hybrid Quantization Method is a function of the threshold value (threshold value of 60). The threshold
can be varied depending on the application. 6) Hybrid Quantization is dependent on type of the image and size of the image. 7) In Hybrid Quantization Method, we can select different combinations of Quantization Matrices
depending on the application. For e.g. (Q10+Q50)…for better Compression (Q50+Q90)…for better Quality (Q10+Q30+Q80) etc 8) Iterative approach can also be implemented to select best suitable Quantization Matrix for maintaining
Quality of the image.
Mangesh Jadhav et al. / International Journal of Engineering Science and Technology (IJEST)
ISSN : 0975-5462 Vol. 4 No.09 September 2012 3986
References [1] N. Ahmed, T. Natarajan, and K. R. Rao, “Discrete cosine transform”, IEEE Trans. Comput., vol. 23, no. 1, pp. 90-93, 1974. [2] Gregory K. Wallace, “The JPEG Still Picture Compression Standard”, IEEE Transactions on Consumer Electronics, Vol. 38, No. 1,
FEBRUARY 1992. [3] Okan K. Ersoy, “Image Coding with the Discrete Cosine-I11 Transform”, IEEE Journal On Selected Areas In Communications, Vol.
Io. No. 5, June 1992. [4] Rafael C. Gonzalez, Richard E. Woods. (2002): “Digital Image processing”, Second Edition. Prentice Hall International. [5] Anil K. Jain, “Fundamentals of Digital Image Processing”. [6] Madhuri Joshi, “Digital Image Processing- An algorithmic Approach”. [7] Khalid Syood, “Introduction to Data Compression”. [8] http://computer.howstuffworks.com/question289.htm [9] http://www.data-compression.com/image.shtml [10] http://bretl.com/mpeghtml/DCxfrm.HTM [11] http://en.wikipedia.org/wiki/Discrete_cosine_transform
Mangesh Jadhav et al. / International Journal of Engineering Science and Technology (IJEST)
ISSN : 0975-5462 Vol. 4 No.09 September 2012 3987


![[CSCI 6990-DC] 09: Scalar Quantizationcmliu/Courses/Compression/... · 2009-04-27 · Vector Quantization (c.1) Vector quantization the vector quantization of x may be viewed as a](https://img.pdfslide.us/doc/110x75/5e5f90da59224a0df964048d/csci-6990-dc-09-scalar-quantization-cmliucoursescompression-2009-04-27.jpg)
![Compressing Unknown Images With Product …openaccess.thecvf.com/content_CVPR_2019/papers/Li...2.2. Vector Quantization Vector Quantization (VQ) [25] has been widely used in data compression](https://img.pdfslide.us/doc/110x75/5f35621b877e0f70241cbf60/compressing-unknown-images-with-product-22-vector-quantization-vector-quantization.jpg)


![Quantization Considerations for Distortion-Controlled Data ... · constraint has been called \L1-constrained compression" [17] and \near-lossless compression." The primary purpose](https://img.pdfslide.us/doc/110x75/5ebdd912accba7164d16af3a/quantization-considerations-for-distortion-controlled-data-constraint-has-been.jpg)
![Deep Task-Based Quantization · deep learning for quantization typically focus on image compression [20]–[24], where the goal is to represent the analog image using a single quantization](https://img.pdfslide.us/doc/110x75/5ed13db502542b27df4b4de2/deep-task-based-quantization-deep-learning-for-quantization-typically-focus-on-image.jpg)