Embed Size (px)
Citation preview

Image analysis methods for localization of
visual codes
Theses of PhD Dissertation
Péter Bodnár
Advisor: László G. Nyúl, Ph.D.
PhD School in Computer Science
Department of Image Processing and Computer Graphics
Faculty of Science and Informatics
University of Szeged
Szeged, 2015.


1 Introduction
The application of computer-readable visual codes has become common in our every-day lives. Their importance has increased not only within industrial environment,but in private use as well [15]. Computer-readable visual codes are universal, andtheir production is less expensive than using other technologies, such as radio fre-quency identi�cation (RFID) [13]. They provide simple and reliable identi�cationof items at postal services, point of sale (PoS) terminals, and warehouses of vari-ous products. The availability of codes using desktop printers, and penetration ofautomatic checkout systems at supermarkets [25] also greatly contributed to thepopularity of these codes.
We have to take two steps to regain the data embedded in the visual code, namely,localization and data decoding. In the �rst step, the presence of the barcode, andthe location of the barcode to the sensor has to be recognized. In most cases,we also apply transformations, like noise reduction, sharpening, normalization, andcorrection of distortions. After this step, the processed image piece containing thecode is passed to the detector that looks up the pattern for valid character data.
When proper localization and pre-processing is applied, then the latter step isrelatively straightforward since characters are easily recognizable thanks to the max-imized hamming-distances between entities. In addition, most bar code standardsalso provide redundant information for error correction purposes. Localization stephas more di�culties due to the variety of code types, cameras and scenes.
In the early age of barcodes, localization was manual. A data terminal or aportable barcode scanner was positioned and oriented against the item having thecode object, in order to recognize it. Barcode reading on recent smartphones is stillat this stage.
Since the past couple of years, image acquisition techniques and computer hard-ware have also improved signi�cantly, automatic reading of visual codes becameavailable [36], however, it raised the localization problem to the next level of di�-culty. Visual codes have to be reliably found without human assistance, based on thesensor data. Each application has its properties, like, the expected type of barcode,type of the sensor, and constraints of size, orientation, and number of codes presentwithin the observed area. After the successful localization of the code, the decodingstep follows, which means retrieval of the embedded data by the software. Whilethe localization step became more complex due to the expectation of automatism,the reliability of decoding can be contributed to the availability of more accuratesensory data and additional computational capacity.
As applications impose special problems, there is a continuous need for solutionswith improved e�ectiveness. There are several methods for barcode localizationthat are characterized by the processing techniques they use, accuracy and speed.However, state of the art algorithms, while giving e�cient methods to the decoding
1

step, still lack universal solutions for localization. This implies the need of researchin that step of the reading process. The primary objective of this thesis is to ex-amine and improve existing algorithms for barcode localization, and to design newones. Recent trends in computational capacity also allow using machine learningapproaches and classi�ers based on more complex features [3,30] than the ones usedat barcode scanner devices.
Barcode localization methods have two objectives, speed and accuracy. For in-dustrial environment, accuracy is crucial since undetected (missed) codes may leadto loss of pro�t. Processing speed is a secondary desired property of the detectors.On smartphones, accuracy is not so critical, since the device interacts with the userand re-shooting is easily done, nevertheless, fast (and reasonably accurate) barcodedetection is desirable.
2 Results of the dissertation
2.1 Simple algorithms based on global information
In this section, methods are presented that use features based on global information,which means all sensor data is available for the algorithm at the same time. Thevery �rst idea was the scan-line analysis, that came from the early age of computervision, where mathematical morphology [29] was too time-consuming to perform onhigh resolutions. However, the spreading of embedded systems renewed the interestof these simple algorithms, and gave motivation to improve existing algorithms anddevelop new ones. Moreover, these algorithms can be designed, veri�ed and �ne-tuned more easily than machine learning approaches.
There is a wide selection of papers on scan-line analysis [16, 31, 32], having thesame simple idea. Scanned lines form 1D intensity pro�les (Fig. 1(b) and (c)).Barcode detector algorithms [1,22,32] work on these pro�les to �nd an ideal binaryfunction that represents the original encoded data. The main idea is to �nd peaklocations in blurry barcode models, then thresholding the intensity pro�le adaptivelyto produce binary values.
Although scan-line based solutions are fast, they have low tolerance to noise andsmoothing. I examined the scan-line method and evaluated possible modi�cations.I introduced scan-line analysis for 3 and 4 directions, and instead of density images,proposed grouping of line segments using endpoint and proximity conditions (Fig. 2).
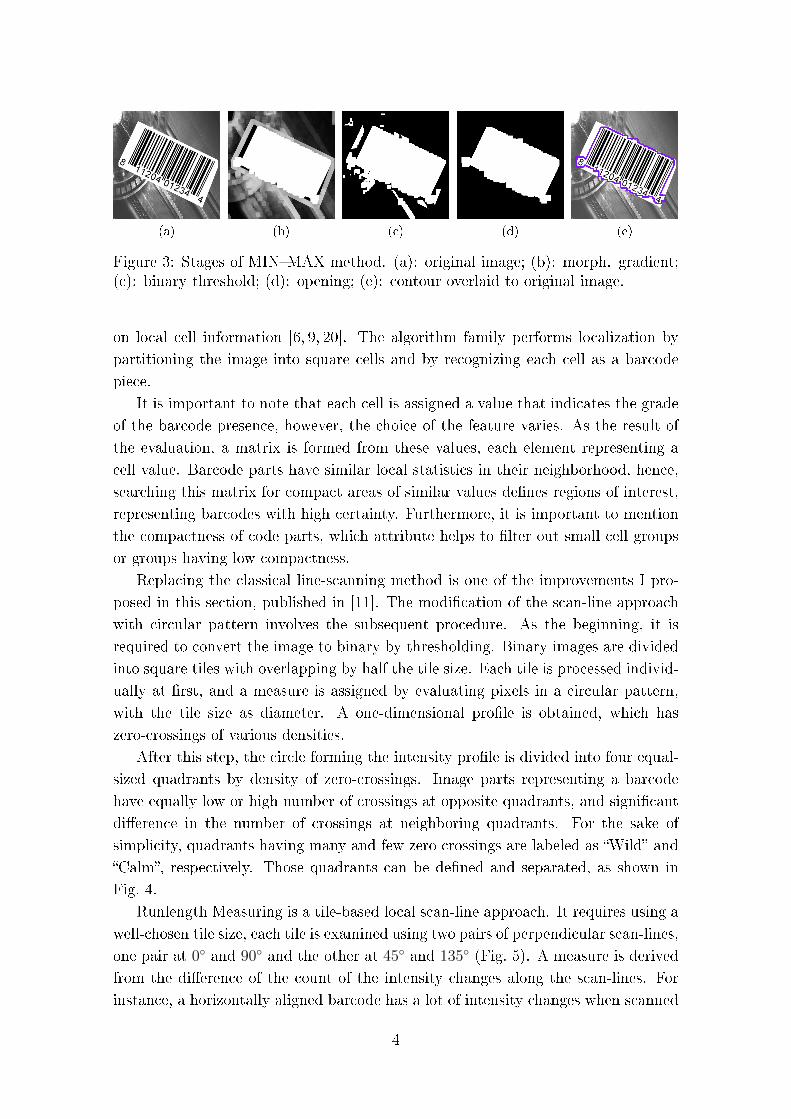
Methods involving mathematical morphology use operations derived from erosionand dilation [21,23,27]. This group of algorithms has the common properties of largercomputational cost and higher level of robustness. I also proposed an algorithminvolving morphology [9], that uses morphological gradient, opening and contourdetection. Its steps are summarized in Fig. 3.
2

0.00
0.40
0.80
1.20
0 50 100 150 200 250
0.00
0.40
0.80
1.20
0 50 100 150 200 250
Figure 1: The idea of scan-line analysis. Scan-lines sweep through the code, �ndingareas with frequent intensity changes (ROI). ROI endpoints are also barcode contourpoints. Each scan-line makes an 1D intensity pro�le.
Figure 2: Scan-line analysis of real-life example. Original image (left) and thefeature image (right), with line segments, endpoints, center for the horizontal linegroup (green, �lled disc), and center for the 60◦ line segment group (red circle),dropped due to proximity to existing center point.
Additionally, one shall not forget to mention the existence of algorithms thatinvolve Hough transformation [2,24,35], which results in a set of line segments, thatcan be further processed [34]. I introduced and evaluated the capabilities of Houghtransformation for barcode localization in images.
2.2 Algorithms using image tessellation
End-user applications mostly have limited resources, like memory and processingpower. Not all hardware setups let to store the whole image in memory, some evendrop information as new sensory data is acquired, thus providing only partial databy time.
Image tessellation (partitioning the image to uniform cells) is a wide-spread ideaof pattern recognition, which can be used as the base of barcode localization. Thisapproach is applicable because most barcodes, just like areas covered with textures,can be easily identi�ed by observing only small parts of them. These barcode partstogether form the desired barcode region with known height and width.
I presented methods that work with image tesselation and make decisions based
3
(a) (b) (c) (d) (e)
Figure 3: Stages of MIN�MAX method. (a): original image; (b): morph. gradient;(c): binary threshold; (d): opening; (e): contour overlaid to original image.
on local cell information [6, 9, 20]. The algorithm family performs localization bypartitioning the image into square cells and by recognizing each cell as a barcodepiece.
It is important to note that each cell is assigned a value that indicates the gradeof the barcode presence, however, the choice of the feature varies. As the result ofthe evaluation, a matrix is formed from these values, each element representing acell value. Barcode parts have similar local statistics in their neighborhood, hence,searching this matrix for compact areas of similar values de�nes regions of interest,representing barcodes with high certainty. Furthermore, it is important to mentionthe compactness of code parts, which attribute helps to �lter out small cell groupsor groups having low compactness.
Replacing the classical line-scanning method is one of the improvements I pro-posed in this section, published in [11]. The modi�cation of the scan-line approachwith circular pattern involves the subsequent procedure. As the beginning, it isrequired to convert the image to binary by thresholding. Binary images are dividedinto square tiles with overlapping by half the tile size. Each tile is processed individ-ually at �rst, and a measure is assigned by evaluating pixels in a circular pattern,with the tile size as diameter. A one-dimensional pro�le is obtained, which haszero-crossings of various densities.
After this step, the circle forming the intensity pro�le is divided into four equal-sized quadrants by density of zero-crossings. Image parts representing a barcodehave equally low or high number of crossings at opposite quadrants, and signi�cantdi�erence in the number of crossings at neighboring quadrants. For the sake ofsimplicity, quadrants having many and few zero crossings are labeled as �Wild� and�Calm�, respectively. Those quadrants can be de�ned and separated, as shown inFig. 4.
Runlength Measuring is a tile-based local scan-line approach. It requires using awell-chosen tile size, each tile is examined using two pairs of perpendicular scan-lines,one pair at 0◦ and 90◦ and the other at 45◦ and 135◦ (Fig. 5). A measure is derivedfrom the di�erence of the count of the intensity changes along the scan-lines. Forinstance, a horizontally aligned barcode has a lot of intensity changes when scanned
4

w
cc
w
S
S1
2
Figure 4: Zones and symmetries of the circular intensity pro�le. Wild (w) and calm(c) zones, symmetry at pixel level (S1) and between quadrants S2.
Figure 5: Two pairs of scan-lines sweep through the image. One of them has signi�-cantly higher number of zero-crossings in case of positive response. In this example,the barcode is fully recognized by the �rst pair of scan-lines.
with a horizontal scan-line, but has few or none with a vertical (Fig. 5).With the 2 pairs of scan-lines, barcode pieces of any orientation can be safely
recognized. The �nal measure assigned to a tile is the maximum of the two di�er-ences. This measure gives 1 if parallel lines are present on an image tile, and 0 if atile contains a homogeneous area, or noise.
Local pixel clustering [9] is the most simplistic algorithm based on image tiling.It divides cells into black and white segments. An image region that contains abarcode part has many similar stretched clusters.
I also propose an algorithm for localization based solely on distance transforma-tion [14]. It can be used individually with limited performance, or as an intermediate�ltering step for creating more sophisticated algorithms.
Furthermore, I introduced a new algorithm based on cell histograms. In case ofan ideal cell containing a part of a visual code, only black and white intensities arepresent cell-wise in roughly 1:1 proportion. Due to the variability of the code object
5

Figure 6: Aztec code part with 25% uniform noise and Gaussian blur (σ = 2) (left),its 256-bin histogram (top-right), and 8-bin histogram (bottom-right).
0.0
0.2
0.4
0.6
0.8
1.0
0.0 0.2 0.4 0.6 0.8 1.0
Figure 7: Expected probability functions. Red solid curve: small C (expectedsmoothing) with moderate amount of expected noise C = 0.1, σ = 0.15 (examplefor dirty environment), blue dashed curve: larger C with smaller amount of expectednoise C = 0.3, σ = 0.01 (example for low quality phone camera).
and imperfections of image acquisition devices, the intensity histogram deviates fromthis ideal case (Fig. 6). To take the e�ects of image acquisition �aws, a formula canbe introduced to model theoretical cell histograms as
UC,σ(x) = C + (1− C)
(e− x2
(ε+σ)2 + e− (1−x)2
(ε+σ)2
), (1)
where C and σ are set according to the level of noise and smoothing, respectively.Di�erent values of σ and C lead to di�erent distributions (Fig. 7).
Speed is a primary or secondary objective in most cases. Algorithms of thischapter use simple features and thanks to the local measurements, they can beparallelized easily.
Simple detectors can be aggregated in many ways, such as, majority voting, usingthe maximum value of all, or weighted voting [5]. Each approach is appropriate forful�lling di�erent goals. Majority voting can be applied with good results whenthe single detectors have relatively low precision with a moderate or high recall
6

rate. In this thesis pixels with higher certainty are classi�ed in this way, whilekeeping false positives at low rate. Using the maximum value of the feature imagesproduced by the individual detectors is good for maximizing the recall, for example,detecting all possible ROIs, but it dramatically decreases precision when the singledetectors are weak on that property. However, we can use that approach in industrialsetups, where detecting all barcode locations is of crucial importance. One can alsoexperiment with weighted sum of the feature images.
2.3 Neural networks for the localization task
Both 1D and 2D visual codes have high variability regarding element layout. It wouldbe problematic to manually enumerate all con�gurations or to construct features thatgive positive response to all of those con�gurations. However, with neural networks,learning the layout can be automatic and de�nition of patterns is not necessary.
During the last few years, there has been a renewed interest in applying neuralnetworks, especially deep neural networks, for various tasks. As their name suggests,deep neural networks (DNN) di�er from conventional ones (ANN) in that they con-sist of several hidden layers. However, if we want to train these deep networksproperly, we have to be aware of the fact that the training method requires modi�-cations as the conventional back-propagation algorithm encounters di�culties, likethe so-called �vanishing gradient� and the �explaining away� e�ects.
Similarly to the presented methods based on image tessellation, the input vectorsof the neural network are formed on block level. For each block, the neural networkassigns a measure which re�ects the probability of presence of a QR code part inthat block, resulting in the feature matrix (feature image), that represents regionsof interest (Fig. 8). The next step of the process is to �nd clusters in this matrixthat have su�cient size, compactness and high values of probability to form a QRcode. The �nal step is the same as the one for previously presented approaches.More precisely, the cluster centers that satisfy the above conditions are returned,and the bounding boxes for the QR code area candidates are given.
JPEG [33] is one of the most common still image formats, and provides e�cientdata storage and transfer. Most cameras can acquire images directly to JPEGformat, and some devices can even output a stream of JPEG images, which motivatesresearch into image processing methods using this format.
Neural networks are also capable of learning in the frequency domain, and JPEGformat can be handled as a subset of that domain, also having �xed 8×8 px blocksize for input. For this case, one of the deep recti�er networks proposed in this thesisworks directly with the DCT coe�cients of the JPEG image. Using this approach,only the �rst steps of the decompression have to be performed for code localization,while the most complex step, inverse DCT can be skipped.
7
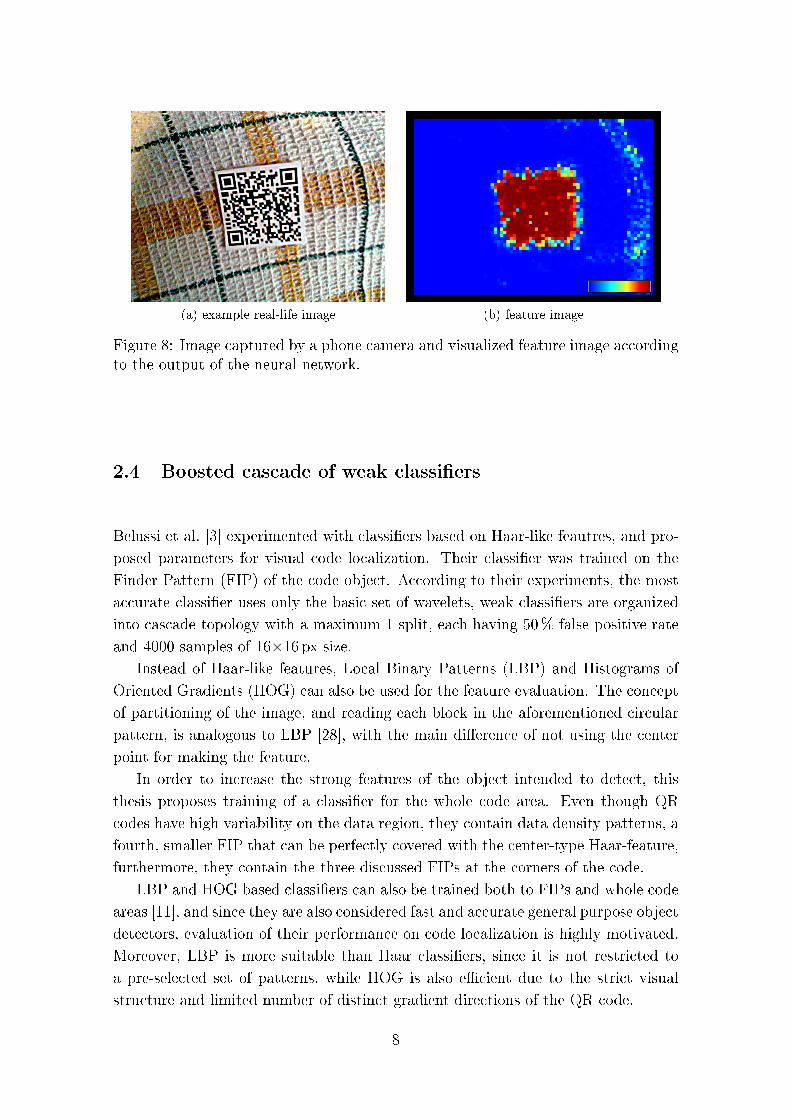
(a) example real-life image (b) feature image
Figure 8: Image captured by a phone camera and visualized feature image accordingto the output of the neural network.
2.4 Boosted cascade of weak classi�ers
Belussi et al. [3] experimented with classi�ers based on Haar-like feautres, and pro-posed parameters for visual code localization. Their classi�er was trained on theFinder Pattern (FIP) of the code object. According to their experiments, the mostaccurate classi�er uses only the basic set of wavelets, weak classi�ers are organizedinto cascade topology with a maximum 1 split, each having 50% false positive rateand 4000 samples of 16×16 px size.
Instead of Haar-like features, Local Binary Patterns (LBP) and Histograms ofOriented Gradients (HOG) can also be used for the feature evaluation. The conceptof partitioning of the image, and reading each block in the aforementioned circularpattern, is analogous to LBP [28], with the main di�erence of not using the centerpoint for making the feature.
In order to increase the strong features of the object intended to detect, thisthesis proposes training of a classi�er for the whole code area. Even though QRcodes have high variability on the data region, they contain data density patterns, afourth, smaller FIP that can be perfectly covered with the center-type Haar-feature,furthermore, they contain the three discussed FIPs at the corners of the code.
LBP and HOG based classi�ers can also be trained both to FIPs and whole codeareas [11], and since they are also considered fast and accurate general purpose objectdetectors, evaluation of their performance on code localization is highly motivated.Moreover, LBP is more suitable than Haar classi�ers, since it is not restricted toa pre-selected set of patterns, while HOG is also e�cient due to the strict visualstructure and limited number of distinct gradient directions of the QR code.
8

(a) (b)
Figure 9: Printed QR code on tablecloth (a) and its FIS feature image (b).
2.5 Fuzzy Inference Systems
A simple approach to identify textures is using various stochastic measures [18],while Wang [19] introduced a more sophisticated texture �ltering algorithm usingTexture Spectrum as a general measure for texture properties, and Texture Units
that express local intensity relations within an image cell. Lee et al. [26] evenintroduced the Fuzzy Uncertainty Texture Spectrum and Fuzzy Texture Units, a moregeneralized way of texture identi�cation involving evolutionary algorithms and fuzzylogic. However, the computation of these features would take a notable amount oftime on embedded systems and make on-line processing very hard to implement.Instead, terms of fuzzy theory can be applied in order to detect barcodes and FuzzyInference Systems (FIS) can perform evaluation rapidly, regarding the features theyuse.
The use of fuzzy algorithms are already proven to be e�cient for QR code local-ization [37]. I propose a Fuzzy Inference System (FIS) based on the most simplistic,attentive features of a QR code, but this approach can be adapted to all 2D codetypes mentioned above [8].
The algorithm is e�cient with respect to computation time and storage, and mostof the computed features can be approximated using only a subset of pixels, thatallows �ne-tuning of the application to be faster or more accurate. These propertiescan make FIS-based localization a preferred choice over other fast algorithms.
The proposed FIS consists of three input and one output variables. Membershipfunction (MF) parameters are tuned each time to the end-user setup using statisticsof a few input images. For the selection of properties, simple features that repre-sent humanly observable properties are pursued. The three properties that can besummarized in the following statement: QR code parts consist of mostly black andwhite pixels of similar amounts, while having from moderate to high contrast andlow saturation.
9

The feature set is extensible. For cases where the aforementioned principles donot have the required classi�cation power, runlength measuring can also be usedtogether with the basic rule set.
3 Summary of the thesis points
1. I introduced 3 new algorithms for barcode localization in image using globalinformation. These, respectively, are based on scan-line analysis with newfeatures, Hough transformation, and mathematical morphology operations.The latter two outperform state-of-the-art algorithms in terms of accuracyand recall, while the scan-line approach is very fast and is also reasonablyaccurate.
2. I proposed new algorithms for the localization of visual codes using the ideaof image tessellation. The proposed algorithms have low computational andstorage requirements, and can be easily adapted for parallel computation.
2.1. I proposed cell histograms, distance transformation and a modi�ed scan-line approach for local feature formation. I have also shown that anensemble of simple detectors can have higher precision or recall thanstate-of-the-art algorithms, depending on the type of aggregation andinvolved features.
2.2. I implemented a rotation-invariant feature adapted from the scan-lineapproach. The new feature uses local intensity pro�les read along a cir-cular pattern, and takes advantage of symmetries and neighboring cellinformation.
3. I introduced and evaluated neural networks for visual code localization inimages.
3.1. Through the experiments I have shown that the use of Deep Recti�erNetworks is a viable option for barcode localization, both in image spaceand in the frequency domain, even with binary images.
3.2. I have also shown that Deep Recti�er Networks can be trained on JPEGDCT vectors, that eliminates the need of the inverse DCT step of theJPEG decoding process.
4. I evaluated the performance of cascade classi�ers and their usability for bar-code localization, and proposed new extensions.
4.1. I proposed 2 new features for the training, namely, Local Binary Patterns(LBP) and Histograms of Oriented Gradients (HOG). They are proven
10

to be more accurate compared to Haar-wavelets, which is presented incascade classi�ers from the state-of-the-art.
4.2. I proposed learning on the full code object instead of learning on the�nder patterns exclusively, which greatly simpli�ed post-processing.
5. I introduced Fuzzy Inference Systems for barcode localization, that providesfast execution and a �exible model construction.
Publications by the author, related to theses
PublicationThesis point
Type1 2.1 2.2 3.1 3.2 4 5
[9] • • conference paper[5] • conference paper[6] • conference paper[11] • conference paper[10] • • • journal paper[17] • conference paper[4] • • conference paper[7] • conference paper[8] • conference paper[12] • journal paper
References
[1] Robert Adelmann. Toolkit for bar code recognition and resolving on camera. InPhones � Jump Starting the Internet of Things. In: Informatik 2006 workshop
on Mobile and Embedded Interactive Systems, 2006.
[2] D.H. Ballard. Generalizing the hough transform to detect arbitrary shapes.Pattern Recognition, 13(2):111�122, 1981.
[3] Luiz F. F. Belussi and Nina S. T. Hirata. Fast QR code detection in arbitrar-ily acquired images. In Graphics, Patterns and Images (Sibgrapi), 2011 24th
SIBGRAPI Conference on, pages 281�288, 2011.
[4] Péter Bodnár, Tamás Grósz, László Tóth, and László G Nyúl. Localizationof visual codes in the dct domain using deep recti�er neural networks. Inter-
national Workshop on Arti�cial Neural Networks and Intelligent Information
Processing: Proceedings of ANNIIP, pages 37�44, 2014.
11

[5] Péter Bodnár and László G Nyúl. Improving barcode detection with combina-tion of simple detectors. In The 8th International Conference on Signal Image
Technology (SITIS 2012), pages 300�306, 2012.
[6] Péter Bodnár and László G Nyúl. Barcode detection with uniform partitioningand distance transformation. IASTED International Conference on Computer
Graphics and Imaging, pages 48�53, 2013.
[7] Péter Bodnár and László G Nyúl. QR code localization using boosted cascadeof weak classi�ers. In Image Analysis and Recognition, pages 338�345. SpringerInternational Publishing, 2014.
[8] Péter Bodnár and László G Nyúl. Localization of visual codes using fuzzy infer-ence system. In VISAPP 2015 Proceedings of the 10th International Conference
on Computer Vision Theory and Applications, pages 345�352. SciTePress, 2015.
[9] Péter Bodnár and László G. Nyúl. Barcode detection with morphological op-erations and clustering. In Signal Processing, Pattern Recognition, and Appli-
cations, Proceedings of the Ninth IASTED International Conference on, pages51�57, 2012.
[10] Péter Bodnár and László G. Nyúl. Barcode detection using local analysis,mathematical morphology, and clustering. Acta Cybernetica, 21:21�35, 2013.
[11] Péter Bodnár and László G. Nyúl. A novel method for barcode localizationin image domain. In Image Analysis and Recognition, volume 7950 of LectureNotes in Computer Science, pages 189�196. Springer Berlin Heidelberg, 2013.
[12] Péter Bodnár and László G. Nyúl. Improved QR code localization using boostedcascade of weak classi�ers. Acta Cybernetica, 22:21�33, 2015.
[13] Richard L. Dunlap and William A. Slat. Application of radio frequency identi-�cation, April 24 2012. US Patent 8,164,457.
[14] Pedro F. Felzenszwalb and Daniel P. Huttenlocher. Distance transforms of sam-pled functions. Technical report, Cornell Computing and Information Science,2004.
[15] Orazio Gallo and Roberto Manduchi. Image-based barcode reader, January 272011. WO Patent App. PCT/US2010/002,023.
[16] Orazio Gallo and Roberto Manduchi. Reading 1D barcodes with mobilephones using deformable templates. IEEE Trans. Pattern Anal. Mach. Intell.,33(9):1834�1843, 2011.
12
[17] Tamás Grósz, Péter Bodnár, László Tóth, and László G Nyúl. QR code local-ization using deep neural networks. In Machine Learning for Signal Processing
(MLSP), 2014 IEEE International Workshop on, pages 1�6. IEEE, 2014.
[18] Robert M Haralick. Statistical and structural approaches to texture. Proceed-ings of the IEEE, 67(5):786�804, 1979.
[19] Dong-Chen He and Li Wang. Texture features based on texture spectrum.Pattern Recognition, 24(5):391�399, 1991.
[20] Pavel �imurda. Barcode localization in image. In Information Sciences and
Technologies Bulletin of the ACM Slovakia, volume 3, pages 55�56, 2011.
[21] Xiaojun Qi James Juett. Barcode localization using bottom-hat �lter. NSF
Research Experience for Undergraduates, 2005.
[22] Eugene Joseph and Theo Pavlidis. Bar code waveform recognition using peaklocations. Pattern Analysis and Machine Intelligence, IEEE Transactions on,16(6):630�640, 1994.
[23] Melinda Katona and László G. Nyúl. A novel method for accurate and e�cientbarcode detection with morphological operations. In The 8th International
Conference on Signal Image Technology (SITIS 2012), pages 307�314, 2012.
[24] Nahum Kiryati, Yuval Eldar, and Alfred M. Bruckstein. A probabilistic houghtransform. Pattern Recognition, 24(4):303�316, 1991.
[25] Chuck Kurtz, Gary E. Desjardins, and Stephen J. Sanchez. Self checkout systemwith automated transportation conveyor, April 17 2007. US Patent 7,204,346.
[26] Yih-Gong Lee, Jia-Hong Lee, and Yuang-Cheh Hsueh. Texture classi�cation us-ing fuzzy uncertainty texture spectrum. Neurocomputing, 20(1):115�122, 1998.
[27] Daw-Tung Lin, Min-Chueh Lin, and Kai-Yung Huang. Real-time automaticrecognition of omnidirectional multiple barcodes and dsp implementation. Ma-
chine Vision and Applications, 22:409�419, 2011.
[28] T. Ojala, M. Pietikainen, and D. Harwood. Performance evaluation of texturemeasures with classi�cation based on kullback discrimination of distributions.In Pattern Recognition, 1994. Vol. 1 - Conference A: Computer Vision and
Image Processing., Proceedings of the 12th IAPR International Conference on,volume 1, pages 582�585 vol.1, Oct 1994.
[29] Jean Serra. Image analysis and mathematical morphology. Academic Press,Inc., 1983.
13

[30] István Szentandrási, Adam Herout, and Markéta Dubská. Fast detection andrecognition of QR codes in high-resolution images. In Proceedings of the 28th
Spring Conference on Computer Graphics, SCCG '12, pages 129�136, NewYork, NY, USA, 2013. ACM.
[31] Ender Tekin and James M. Coughlan. A mobile phone application enablingvisually impaired users to �nd and read product barcodes. In Proceedings of the
12th international conference on Computers helping people with special needs,pages 290�295, Berlin, Heidelberg, 2010. Springer-Verlag.
[32] Timothy R. Tuinstra. Reading barcodes from digital imagery. Technical report,Cedarville University, 2006.
[33] Gregory K. Wallace. The JPEG still picture compression standard. Consumer
Electronics, IEEE Transactions on, 38(1):xviii�xxxiv, Feb 1992.
[34] Sherin M. Youssef and Rana M. Salem. Automated barcode recognition forsmart identi�cation and inspection automation. Expert Systems with Applica-
tions, 33(4):968�977, 2007.
[35] Alessandro Zamberletti, Ignazio Gallo, Simone Albertini, and Lucia Noce. Neu-ral 1D barcode detection using the hough transform. Information and Media
Technologies, 10(1):157�165, 2015.
[36] Chunhui Zhang, Jian Wang, Shi Han, Mo Yi, and Zhengyou Zhang. Automaticreal-time barcode localization in complex scenes. In Proceedings of InternationalConference on Image Processing, pages 497�500, 2006.
[37] Bin Zhou, Shumei Lan, Kai Sun, Jie Cao, Huajun Yu, and Yongliang Chen.Double thresholds with a membership function applied to qr image recogni-tion. In The Fuzzy Systems, Knowledge Discovery, and Natural Computation
Symposium, pages 59�63, 2013.
14


![Robust Visual Localization with Dynamic Uncertainty ...oa.upm.es/52666/1/INVE_MEM_2017_283898.pdf · Robust Visual Localization with Dynamic Uncertainty ... [1,32]. The core of the](https://img.pdfslide.us/doc/110x75/5f3ae7a8ab42636b3535ec4e/robust-visual-localization-with-dynamic-uncertainty-oaupmes526661invemem2017.jpg)