Embed Size (px)
Citation preview
National Centre of Competence in Research (NCCR) Challenges to Democracy in the 21st Century
Working Paper No. 48
More than toys: a first assessment of voting advice applications’ impact on the electoral decision of voters
Jan Fivaz, IDHEAP, University of Lausanne Joëlle Pianzola, IDHEAP, University of Lausanne Andreas Ladner, IDHEAP, University of Lausanne
October 2010
- 1 -
Contents 1 Introduction ................................................................................................................... 2 2 Theoretical background ............................................................................................... 4 3 Available Data................................................................................................................ 6 4 A first assessment of VAAs’ impact on the electoral choice .................................... 6 4.1 Direct measure: impact on voting decision by smartvote ............................................. 6�
4.2 Indirect measure: swing voters among smartvote users ............................................ 11�
5 Conclusion and outlook on the 2nd phase project .................................................. 16 6 References ................................................................................................................... 17
- 2 -
1 Introduction In 1998, the first online Voting Advice Application (VAA) went online and operational; the Dutch Stemwijzer (http://www.stemwijzer.nl). During the last twelve years, VAAs like the Stemwijzer have become increasingly popular all over Europe. Today, there is hardly any country in Europe without at least one own operational VAA during its electoral campaigns.
VAAs are websites providing voters with information about which political party or which candidate comes closest to their own political values and policy preferences. In order to do so, they proceed in three steps: First, the voters are asked to create their political pro-file by filling in a questionnaire on different political issues. Second, the VAA compares their answers with the positions of parties or candidates on these issues. And finally, voters are provided with a voting recommendation in form of a list ranking parties or candidates accord-ing to the degree of their issue congruence with the particular voter.
When the Stemwijzer went online for the first time in 1998, it provided 250’000 voting advices. Eight years later, during the campaign to the 2006 elections, this figure exploded to 4.7 million voting advices – this equals 40% of the Dutch electorate (Walgrave et al. 2008:52). In 2006 additional 1.5 million voting advices were provided by a second Dutch VAA called Kieskompas (http://www.kieskompas.nl) (Kleinnijenhuis et al. 2007). In Switzerland the VAA smartvote (http://www.smartvote.ch) was launched in 2003 and could increase the number of generated voting advices from 255’000 in 2003 to almost one million in 2007 (Ladner et al. 2010), whereas in Germany the Wahl-O-Mat (http://www.wahl-o-mat.de) started with 3.6 million voting advices in the 2002 elections (Marschall 2005), and delivered over 6.7 million voting advices during the campaign of the 2009 elections (Marschall 2009). These are just a few examples for the fast-growing popularity of VAAs. Beside the mentioned countries, VAAs have also become a common part of electoral campaigns in countries like Austria, Belgium, Finland and Luxembourg.
Despite this obvious popularity of VAAs, there is up to now no such thing as an estab-lished field of research dealing with questions, which arise around this new type of websites. Until some years ago this issue was widely neglected by political scientists. Only very few scholars took notice of the existence of VAAs, but usually only in the footnotes and not as their main research focus (e.g. Klein 2006: 595; Lau and Redlawsk 2006: 262). However, in the last couple of years VAAs are receiving more and more attention from scholars.
A ‘first wave’ of publications on VAAs was focusing mainly on descriptions of VAAs and their functionality instead of on quantitatively oriented analyses (e.g. Liebhart and Wassermair 2003; Jeitziner and Fivaz 2005; Fivaz and Schwarz 2007). During this first phase of VAA related research, it was more important to establish a research framework for following studies in the near future. One problem at the beginning was that a common lan-guage among the involved scientists had to be found. There was for example for years not even a common agreement of how such websites should be called. The term ‘Voting Advice Applications’ was introduced and broadly accepted only about three years ago.
Since two or three years, one can speak of a second wave of research publications on VAAs. This second wave is not only larger in regard to the number of published studies, the specific publications are also gaining in regard of their analytical depth by focusing in-
- 3 -
creasingly on empirical analyses and developing a more critical perspective towards their research object.
Rütsche (2008; see also section 2.1 in this paper), for instance is addressing the legal foundations of VAAs and is debating the requirement of certain standards to which VAAs should adapt. From his point of view, any particular VAA should guarantee equal treatment of all parties and candidates, and also a high level of transparency with regard to the applied statistical methods of the issue-matching procedure, as well as regarding how and by whom it is financed.
Another critical article is the one of Ramonaité (2010). On the basis of data from the Lithuanian VAA Manobalsas (http://www.manobalsas.lt) she sees some evidence that VAAs offer some advantages to populist parties and the danger of promoting strategic behavior of such parties. In contrast to other parties, populist parties can switch their policy positions to the supposed positions of the median voter on short notice before the elections and therefore benefit particularly from the services offered by VAAs.
In regard to Ramonaité’s findings, a study of Switzerland by Schwarz et al. (2010; see also section 2.2 in this paper) shows – at least partly – contradictory results. Schwarz et al. compared the policy positions of candidates before elections (based on their answers to a Swiss VAA) with the legislative behavior of the elected candidates/MPs after elections (based on roll-call data). There were no signs of a widespread use of strategic behavior of candidates. On the contrary, the overwhelming majority of elected candidates acted, once they were in parliament, according to their policy preferences revealed in the VAA before the elections.
Most of the VAAs claim to contribute to an increased political interest and participa-tion among voters by offering an additional channel of information and a new way of support in their decision-making process. And indeed, first evidence indicates a positive relation be-tween the use of VAAs and voter turnout. The analyses for the 2006 elections in the Nether-lands of Rusuuvirta and Rosema (2009) suggest that VAAs have a modest effect on voter turnout. This finding is supported by similar analyses for Switzerland. It can be shown that the use of VAAs goes together with a higher voter turnout. The strongest effects in this re-gard were found among women as well as young and first-time voters (Fivaz 2008, Fivaz and Nadig 2010, Ladner et al. 2010).
In this working paper the question about the impact of VAAs on the voters electoral decision is being addressed. With other words, the question is “Do voters take a VAAs’ vot-ing advice seriously into consideration, when they are making up their minds in regard to their electoral decision?” In respect of the nature of the services VAAs provide, this seems a crucial and quite self-evident question. It is somewhat surprising that it was up to now only a side issue of VAA related research. This may be connected with different perceptions of VAAs in different countries. A comparison between the perceptions of VAAs in Switzerland and Germany can serve as a useful example. In Germany, the Wahl-O-Mat has the status of toy, which offers a new and above all entertaining approach to bring politics and political par-ties closer to the voters. Correspondingly, even German scholars conducting research on VAAs, use the term ‘playing the Wahl-O-Mat’ to name the activity of voters on the website. Also the term ‘Wahlempfehlung’ (voting recommendation) is avoided by them, because this
- 4 -
stands in contrast to the prevailing perception of the predominant intention of VAA, which is generating interest in politics and providing information but definitely not interfering directly in voters decision-making processes by giving them recommendations for which party they should vote (Marschall 2009 and 2010). In contrast, in Switzerland smartvote is seen – by candidates as well as by voters – predominantly as a serious tool, which delivers a needed and reliable service for voters. Subsequently, there is a completely different picture prevailing in Switzerland what the functions of a VAA should be. For example almost all candidates share the expectation that voters will follow – at least partially – the voting advice they re-ceive from smartvote (Ladner et al. 2010). Thus, from our point of view, it is time to draw more attention to the potential impact that VAAs could have on voters’ electoral choice.
The next section gives a short introduction into the theoretical background, whereas the third section provides a description of the available data. The forth section presents some first empirical results. In the conclusions the results of the forth section are discussed and a very brief outlook on the further developments of the project in the years to come is provided.
2 Theoretical background Since there is hardly any theoretical oriented literature on VAAs to be found, we are bound to apply findings and debates out of the general literature on electoral behavior in order to gain some theoretical foundations for the above raised question on the expected impact of VAAs on electoral decision-making.
What determines the electoral choice of voters? State-of-the-art theories on electoral behavior stress – besides other factors such as party attachment, and the affection to candi-dates – the prominent role of issue voting (Niemi and Weisberg 2001: 14). A large number of studies show the crucial importance of political parties’ issue positions in regard to a voter’s electoral choice (e.g. Alvarez and Nagler 2000, Powell 2000, Kriesi and Sciarini 2003 (for the case of Switzerland), or Schoen and Weiss 2005).
Klein (2006: 595) emphasizes also the importance of issue voting and describes, ac-cording to normative democratic theories, the ideal voter as follows: The ideal voter informs himself carefully about all the pressing political issues and the positions of political parties towards them. Then the voter compares the parties’ positions with his own preferences and makes the voting decision based on this matching. Furthermore Klein offers a direct link to VAAs by remarking that the services provided by VAAs come very close to this normative ideal type for electoral decision-making. And Klein is not alone with this point of view (see e.g. Jeitziner 2004).
All VAAs are based on conceptions of spatial voting or to be more precise on the fa-mous proximity voting-model of Downs (1957). Downs’ original model was a very simple one based on an election with only one issue dimension (usually the left-right dimension) and only two competing candidates. According to Downs a voter will vote for the candidate, which is closer to his own position on the issue dimension. Over the following decades the model was adapted to more and more complex electoral systems (e.g. multi-seats and multi-party systems, or systems with open lists; see e.g. Cox 1997), and the model was also extended to
- 5 -
include multiple issue dimensions instead of only one. Today the proximity-voting model is often criticized on the grounds that the average voter is not willing or even capable to gather and process all the necessary information to perform the demanded comparison of policy positions. This might be possible in the original model, but clearly not in elections with multi-ple parties debating on a large number of political issues (Rabinowitz and MacDonald 1989).
With regard to this critique concerning voters’ limited information collecting and infor-mation processing capacities, VAAs seem to offer an interesting solution. VAAs reduce vot-ers’ information and transaction costs at large. They provide easy accessible information on policy positions of political parties and not only for one issue but for a large number of issues. Supported by a VAA, everyone is capable to conduct his own, personalized issue matching with all the relevant political parties within a couple of minutes. The large number of voters using VAAs (see the examples in the preceding section) seems to support this view. VAAs are obviously offering services needed and appreciated by voters. This leads us to the fol-lowing twofold assumption: First, we suppose that voters see VAAs not merely as toys, which offer entertainment for people interested in politics, but they see them as serious tools, pro-viding needed advice. And second, we assume that VAAs have an impact on the electoral choice of voters using them.
The assumption that VAAs have an impact on the electoral choice is backed up by the observation of voters’ party attachment. Party attachment is seen within the social-psychological theory of voting as one of the main factors to explain voting decisions (e.g. Schoen and Weiss 2005). However, the last ten to 20 years showed a constant decline of voters’ party attachments (e.g. a decline in party memberships or an increasing number of swing voters) in almost all advanced democracies (e.g. Dalton and Wattenberg 2000, or Dal-ton 2006). Since this evident decline, the explanatory power of party attachments for the electoral choice seems questionable.
Even though there are – from a theoretical point of view – several good reasons to assume that VAAs affect voters’ electoral choice, the results of the few existing empirical studies on this topic show mixed results. Walgrave et al. (2008) analysed the Belgian VAA Stemtest (‘Do the Vote Test’) and its impact on voters during the 2004 election campaign in Belgium. They found indeed evidence that the Stemtest had affected Belgian voters in their electoral choice but only on a very modest level. These findings about a limited effect of VAAs are somewhat in contrast to other studies. Both Kleinnijenhuis et al. (2007) as well as Rusuuvirta and Rosema (2009) found evidence that in elections in the Netherlands, VAAs played an important role and had a clear impact on the voting decision of Dutch voters.
- 6 -
3 Available Data The empirical analyses presented in this working paper are based on three online-surveys conducted among voters using smartvote before and after the 2007 elections. All surveys were conducted in close cooperation with Politools – the NGO operating smartvote.
The first survey was pre-electoral. When voters received their voting recommendation on the smartvote website, they were asked to participate in this additional scientific survey. 13’361 voters did fill in the survey. At the end of this survey, the respondents were asked if they would also answer a second survey after the elections. 4’331 voters also participated in this second, post-electoral survey.
Parallel to this a third, also post-electoral survey was conducted among all the smart-vote users, who had created a user account on the website. Shortly after the elections, all of the 80’225 voters with a smartvote user account were asked by e-mail to support the re-search project by answering an online survey. A total of 13’959 filled in this third survey.
The three surveys were designed in such a way that we could merge them into one combined dataset with a total of 27’320 respondents. Whereas questions about the socio-demographic characteristics were part of all three questionnaires, some questions were only asked in the pre-electoral survey (e.g. voting intentions) or in the two post-electoral surveys (e.g. actual participation in the election or the actual voting decision). Answers to participa-tion and voting decision are available for about half of the sample.
Using this data we have to address an important issue: the explanatory power of this dataset. The design of the data collection does of course not permit analyses concerning the whole electorate. But this working paper focuses on a sub-group of the electorate, the smart-vote users, and not on the electorate as a whole. Is it possible to draw a representative pic-ture of those based on this data? In regard of the existing self-selection processes within the data collecting process it is clear that a large number of respondents does not automatically guarantee a sufficient representativeness of the dataset. However, if we compare the re-spondents’ socio-demographic characteristics with findings of similar studies for other coun-tries and other VAAs as well as with results from studies on Internet use in general (e.g. Marschall 2005 or Wall et al. 2009) we find very similar patterns. Therefore, we can assume that this dataset offers a sufficient quality for analyses among smartvote users, which is at least comparable with the state of the art of research on VAAs in other countries.
4 A first assessment of VAAs’ impact on the electoral choice 4.1 Direct measure: impact on voting decision by smartvote The conducted post-electoral surveys among smartvote users contained a number of ques-tions aiming directly on measuring the potential impact of smartvote. One part of these ques-tions focused on the impact on political participation. Previous studies indicate that there is a positive effect with regard to the political participation especially among young and first time voters and women (Fivaz 2008, Fivaz and Nadig 2010). Another part of these surveys ad-
- 7 -
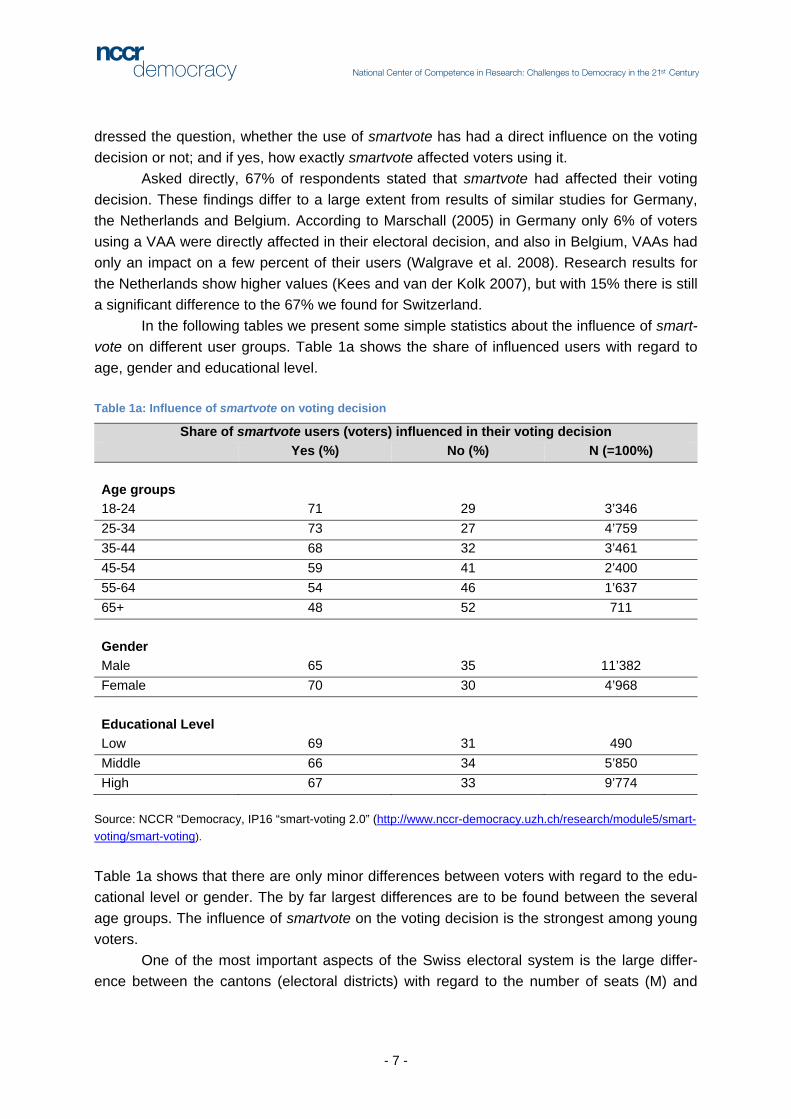
dressed the question, whether the use of smartvote has had a direct influence on the voting decision or not; and if yes, how exactly smartvote affected voters using it.
Asked directly, 67% of respondents stated that smartvote had affected their voting decision. These findings differ to a large extent from results of similar studies for Germany, the Netherlands and Belgium. According to Marschall (2005) in Germany only 6% of voters using a VAA were directly affected in their electoral decision, and also in Belgium, VAAs had only an impact on a few percent of their users (Walgrave et al. 2008). Research results for the Netherlands show higher values (Kees and van der Kolk 2007), but with 15% there is still a significant difference to the 67% we found for Switzerland.
In the following tables we present some simple statistics about the influence of smart-vote on different user groups. Table 1a shows the share of influenced users with regard to age, gender and educational level. Table 1a: Influence of smartvote on voting decision
Share of smartvote users (voters) influenced in their voting decision Yes (%) No (%) N (=100%) Age groups 18-24 71 29 3’346 25-34 73 27 4’759 35-44 68 32 3’461 45-54 59 41 2’400 55-64 54 46 1’637 65+ 48 52 711 Gender Male 65 35 11’382 Female 70 30 4’968 Educational Level Low 69 31 490 Middle 66 34 5’850 High 67 33 9’774
Source: NCCR “Democracy, IP16 “smart-voting 2.0” (http://www.nccr-democracy.uzh.ch/research/module5/smart-voting/smart-voting).
Table 1a shows that there are only minor differences between voters with regard to the edu-cational level or gender. The by far largest differences are to be found between the several age groups. The influence of smartvote on the voting decision is the strongest among young voters.
One of the most important aspects of the Swiss electoral system is the large differ-ence between the cantons (electoral districts) with regard to the number of seats (M) and
- 8 -
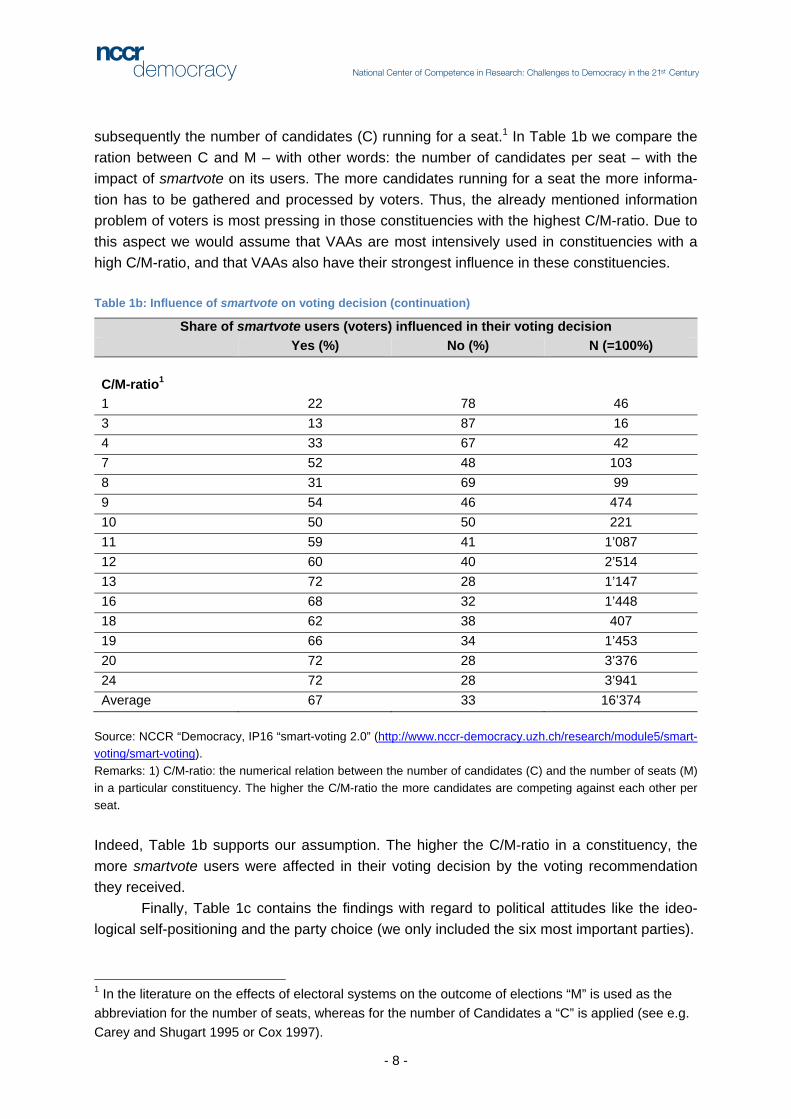
subsequently the number of candidates (C) running for a seat.1 In Table 1b we compare the ration between C and M – with other words: the number of candidates per seat – with the impact of smartvote on its users. The more candidates running for a seat the more informa-tion has to be gathered and processed by voters. Thus, the already mentioned information problem of voters is most pressing in those constituencies with the highest C/M-ratio. Due to this aspect we would assume that VAAs are most intensively used in constituencies with a high C/M-ratio, and that VAAs also have their strongest influence in these constituencies. Table 1b: Influence of smartvote on voting decision (continuation)
Share of smartvote users (voters) influenced in their voting decision Yes (%) No (%) N (=100%) C/M-ratio1 1 22 78 46 3 13 87 16 4 33 67 42 7 52 48 103 8 31 69 99 9 54 46 474 10 50 50 221 11 59 41 1’087 12 60 40 2’514 13 72 28 1’147 16 68 32 1’448 18 62 38 407 19 66 34 1’453 20 72 28 3’376 24 72 28 3’941 Average 67 33 16’374
Source: NCCR “Democracy, IP16 “smart-voting 2.0” (http://www.nccr-democracy.uzh.ch/research/module5/smart-voting/smart-voting). Remarks: 1) C/M-ratio: the numerical relation between the number of candidates (C) and the number of seats (M) in a particular constituency. The higher the C/M-ratio the more candidates are competing against each other per seat. Indeed, Table 1b supports our assumption. The higher the C/M-ratio in a constituency, the more smartvote users were affected in their voting decision by the voting recommendation they received.
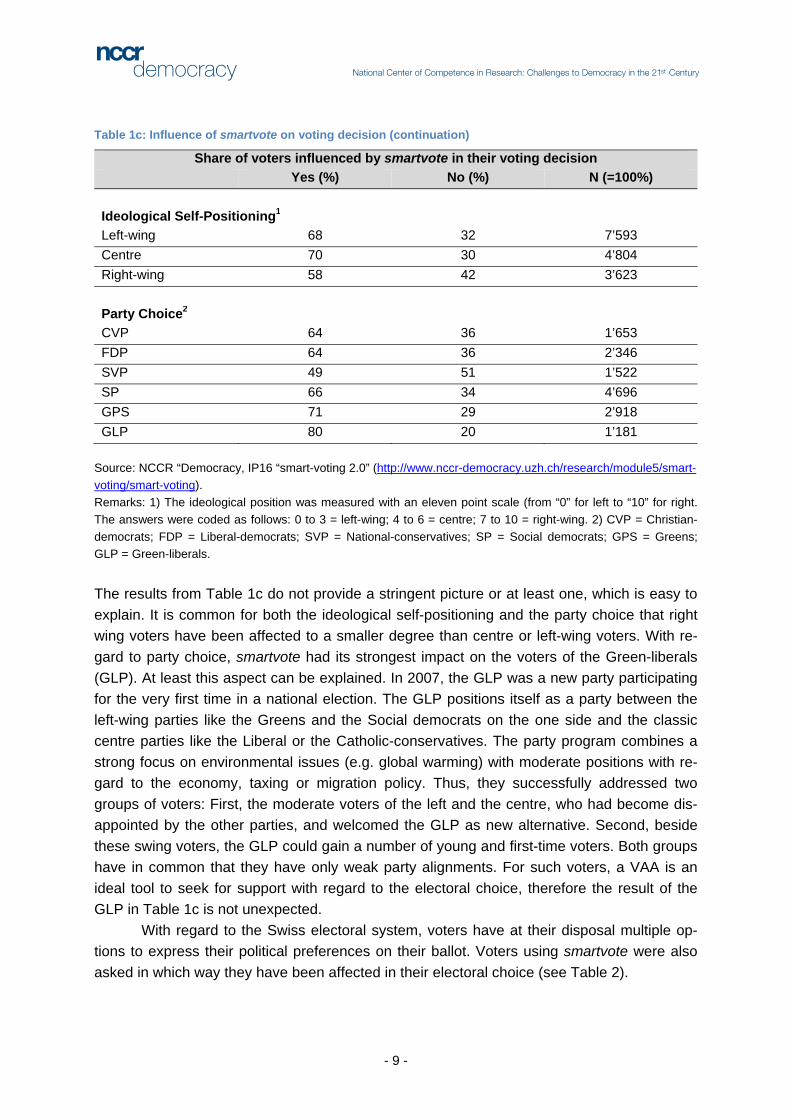
Finally, Table 1c contains the findings with regard to political attitudes like the ideo-logical self-positioning and the party choice (we only included the six most important parties).
1 In the literature on the effects of electoral systems on the outcome of elections “M” is used as the abbreviation for the number of seats, whereas for the number of Candidates a “C” is applied (see e.g. Carey and Shugart 1995 or Cox 1997).
- 9 -
Table 1c: Influence of smartvote on voting decision (continuation)
Share of voters influenced by smartvote in their voting decision Yes (%) No (%) N (=100%)
Ideological Self-Positioning1 Left-wing 68 32 7’593 Centre 70 30 4’804 Right-wing 58 42 3’623
Party Choice2 CVP 64 36 1’653 FDP 64 36 2’346 SVP 49 51 1’522 SP 66 34 4’696 GPS 71 29 2’918 GLP 80 20 1’181
Source: NCCR “Democracy, IP16 “smart-voting 2.0” (http://www.nccr-democracy.uzh.ch/research/module5/smart-voting/smart-voting). Remarks: 1) The ideological position was measured with an eleven point scale (from “0” for left to “10” for right. The answers were coded as follows: 0 to 3 = left-wing; 4 to 6 = centre; 7 to 10 = right-wing. 2) CVP = Christian-democrats; FDP = Liberal-democrats; SVP = National-conservatives; SP = Social democrats; GPS = Greens; GLP = Green-liberals. The results from Table 1c do not provide a stringent picture or at least one, which is easy to explain. It is common for both the ideological self-positioning and the party choice that right wing voters have been affected to a smaller degree than centre or left-wing voters. With re-gard to party choice, smartvote had its strongest impact on the voters of the Green-liberals (GLP). At least this aspect can be explained. In 2007, the GLP was a new party participating for the very first time in a national election. The GLP positions itself as a party between the left-wing parties like the Greens and the Social democrats on the one side and the classic centre parties like the Liberal or the Catholic-conservatives. The party program combines a strong focus on environmental issues (e.g. global warming) with moderate positions with re-gard to the economy, taxing or migration policy. Thus, they successfully addressed two groups of voters: First, the moderate voters of the left and the centre, who had become dis-appointed by the other parties, and welcomed the GLP as new alternative. Second, beside these swing voters, the GLP could gain a number of young and first-time voters. Both groups have in common that they have only weak party alignments. For such voters, a VAA is an ideal tool to seek for support with regard to the electoral choice, therefore the result of the GLP in Table 1c is not unexpected.
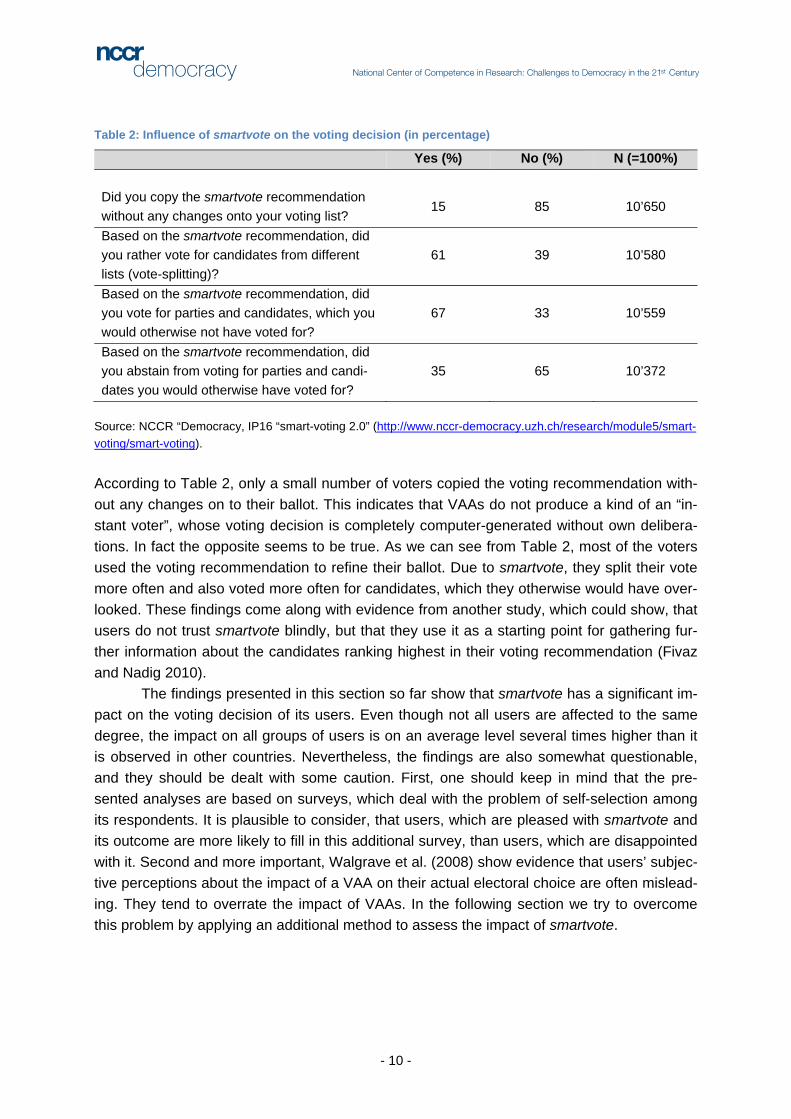
With regard to the Swiss electoral system, voters have at their disposal multiple op-tions to express their political preferences on their ballot. Voters using smartvote were also asked in which way they have been affected in their electoral choice (see Table 2).
- 10 -
Table 2: Influence of smartvote on the voting decision (in percentage)
Yes (%) No (%) N (=100%) Did you copy the smartvote recommendation without any changes onto your voting list?
15 85 10’650
Based on the smartvote recommendation, did you rather vote for candidates from different lists (vote-splitting)?
61 39 10’580
Based on the smartvote recommendation, did you vote for parties and candidates, which you would otherwise not have voted for?
67 33 10’559
Based on the smartvote recommendation, did you abstain from voting for parties and candi-dates you would otherwise have voted for?
35 65 10’372
Source: NCCR “Democracy, IP16 “smart-voting 2.0” (http://www.nccr-democracy.uzh.ch/research/module5/smart-voting/smart-voting). According to Table 2, only a small number of voters copied the voting recommendation with-out any changes on to their ballot. This indicates that VAAs do not produce a kind of an “in-stant voter”, whose voting decision is completely computer-generated without own delibera-tions. In fact the opposite seems to be true. As we can see from Table 2, most of the voters used the voting recommendation to refine their ballot. Due to smartvote, they split their vote more often and also voted more often for candidates, which they otherwise would have over-looked. These findings come along with evidence from another study, which could show, that users do not trust smartvote blindly, but that they use it as a starting point for gathering fur-ther information about the candidates ranking highest in their voting recommendation (Fivaz and Nadig 2010).
The findings presented in this section so far show that smartvote has a significant im-pact on the voting decision of its users. Even though not all users are affected to the same degree, the impact on all groups of users is on an average level several times higher than it is observed in other countries. Nevertheless, the findings are also somewhat questionable, and they should be dealt with some caution. First, one should keep in mind that the pre-sented analyses are based on surveys, which deal with the problem of self-selection among its respondents. It is plausible to consider, that users, which are pleased with smartvote and its outcome are more likely to fill in this additional survey, than users, which are disappointed with it. Second and more important, Walgrave et al. (2008) show evidence that users’ subjec-tive perceptions about the impact of a VAA on their actual electoral choice are often mislead-ing. They tend to overrate the impact of VAAs. In the following section we try to overcome this problem by applying an additional method to assess the impact of smartvote.
- 11 -
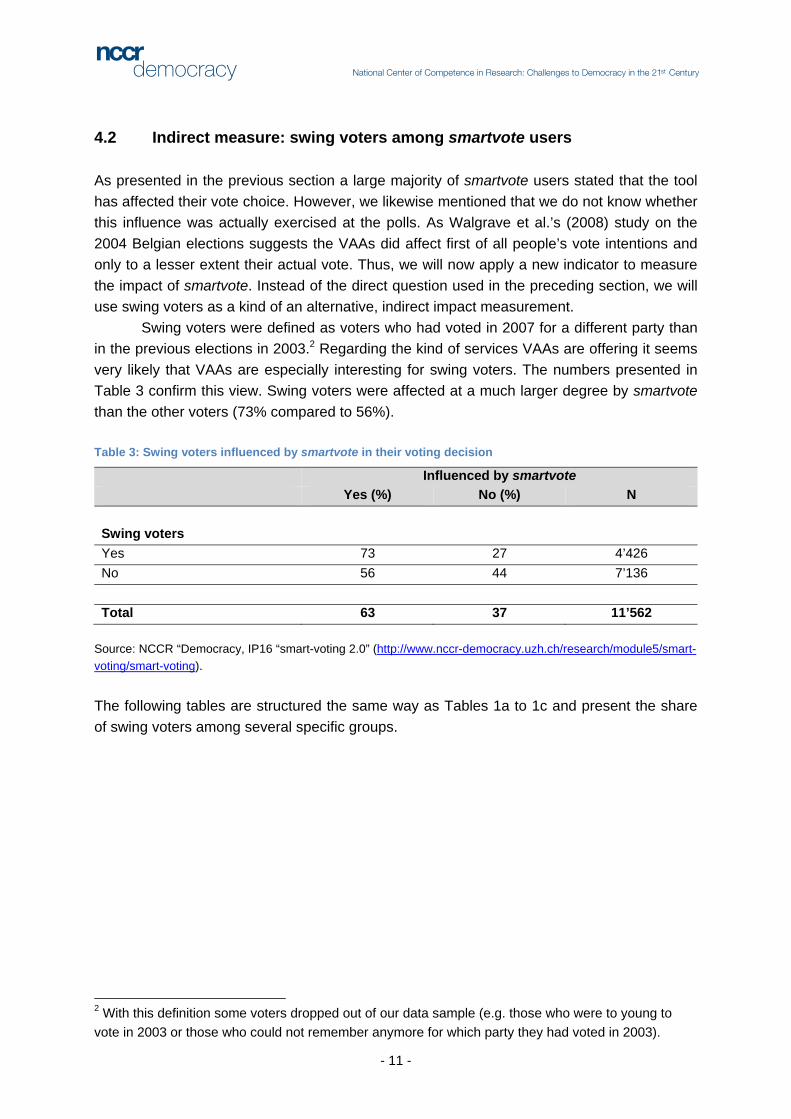
4.2 Indirect measure: swing voters among smartvote users As presented in the previous section a large majority of smartvote users stated that the tool has affected their vote choice. However, we likewise mentioned that we do not know whether this influence was actually exercised at the polls. As Walgrave et al.’s (2008) study on the 2004 Belgian elections suggests the VAAs did affect first of all people’s vote intentions and only to a lesser extent their actual vote. Thus, we will now apply a new indicator to measure the impact of smartvote. Instead of the direct question used in the preceding section, we will use swing voters as a kind of an alternative, indirect impact measurement.
Swing voters were defined as voters who had voted in 2007 for a different party than in the previous elections in 2003.2 Regarding the kind of services VAAs are offering it seems very likely that VAAs are especially interesting for swing voters. The numbers presented in Table 3 confirm this view. Swing voters were affected at a much larger degree by smartvote than the other voters (73% compared to 56%). Table 3: Swing voters influenced by smartvote in their voting decision
Influenced by smartvote Yes (%) No (%) N Swing voters Yes 73 27 4’426 No 56 44 7’136 Total 63 37 11’562
Source: NCCR “Democracy, IP16 “smart-voting 2.0” (http://www.nccr-democracy.uzh.ch/research/module5/smart-voting/smart-voting). The following tables are structured the same way as Tables 1a to 1c and present the share of swing voters among several specific groups.
2 With this definition some voters dropped out of our data sample (e.g. those who were to young to vote in 2003 or those who could not remember anymore for which party they had voted in 2003).
- 12 -
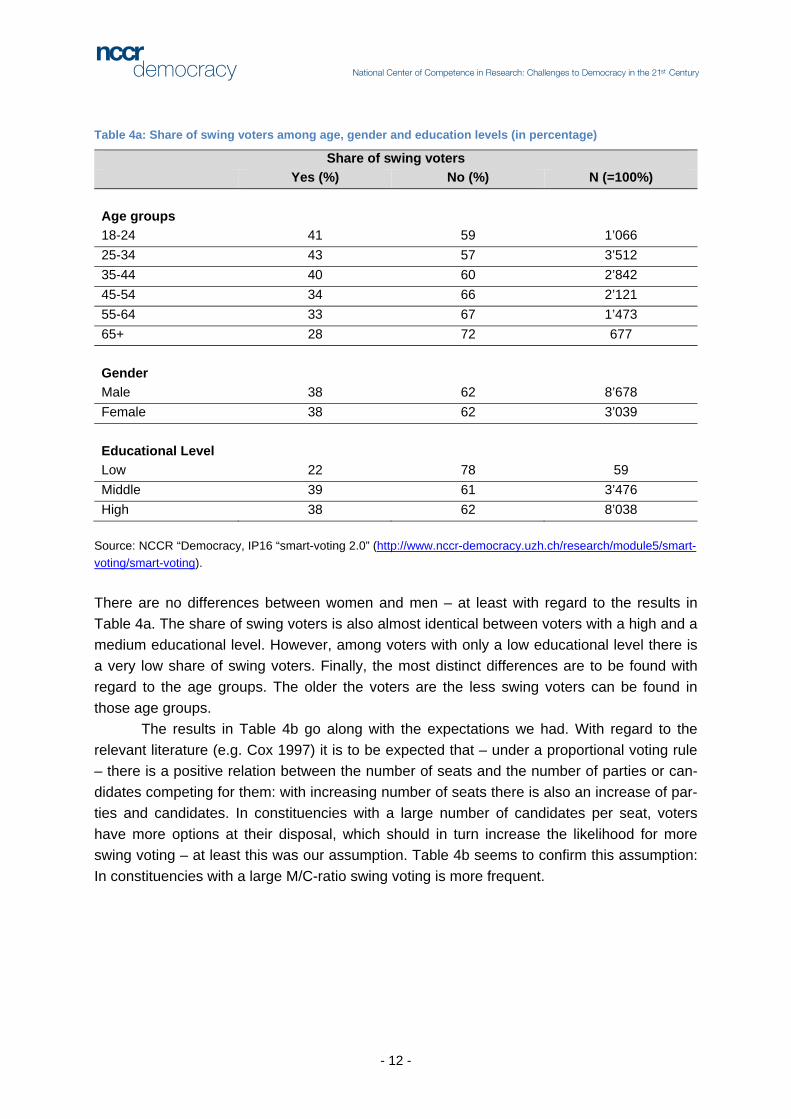
Table 4a: Share of swing voters among age, gender and education levels (in percentage)
Share of swing voters Yes (%) No (%) N (=100%) Age groups 18-24 41 59 1’066 25-34 43 57 3’512 35-44 40 60 2’842 45-54 34 66 2’121 55-64 33 67 1’473 65+ 28 72 677 Gender Male 38 62 8’678 Female 38 62 3’039 Educational Level Low 22 78 59 Middle 39 61 3’476 High 38 62 8’038
Source: NCCR “Democracy, IP16 “smart-voting 2.0” (http://www.nccr-democracy.uzh.ch/research/module5/smart-voting/smart-voting). There are no differences between women and men – at least with regard to the results in Table 4a. The share of swing voters is also almost identical between voters with a high and a medium educational level. However, among voters with only a low educational level there is a very low share of swing voters. Finally, the most distinct differences are to be found with regard to the age groups. The older the voters are the less swing voters can be found in those age groups.
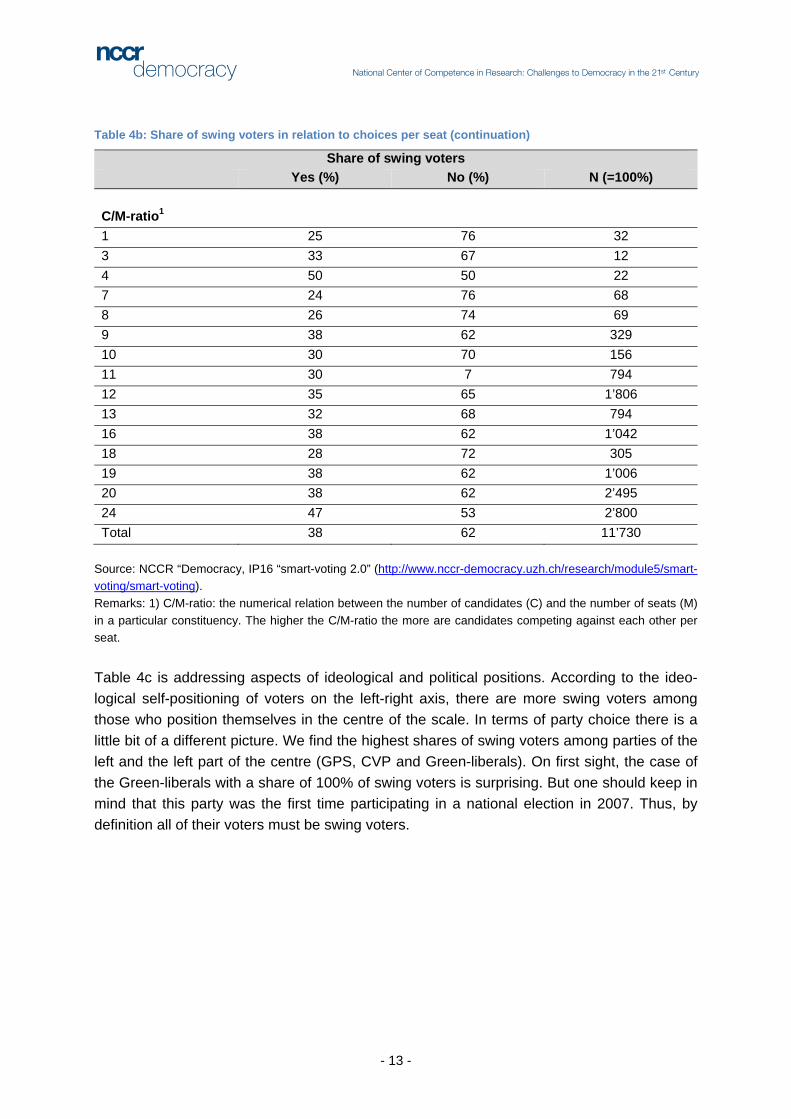
The results in Table 4b go along with the expectations we had. With regard to the relevant literature (e.g. Cox 1997) it is to be expected that – under a proportional voting rule – there is a positive relation between the number of seats and the number of parties or can-didates competing for them: with increasing number of seats there is also an increase of par-ties and candidates. In constituencies with a large number of candidates per seat, voters have more options at their disposal, which should in turn increase the likelihood for more swing voting – at least this was our assumption. Table 4b seems to confirm this assumption: In constituencies with a large M/C-ratio swing voting is more frequent.
- 13 -
Table 4b: Share of swing voters in relation to choices per seat (continuation)
Share of swing voters Yes (%) No (%) N (=100%) C/M-ratio1 1 25 76 32 3 33 67 12 4 50 50 22 7 24 76 68 8 26 74 69 9 38 62 329 10 30 70 156 11 30 7 794 12 35 65 1’806 13 32 68 794 16 38 62 1’042 18 28 72 305 19 38 62 1’006 20 38 62 2’495 24 47 53 2’800 Total 38 62 11’730
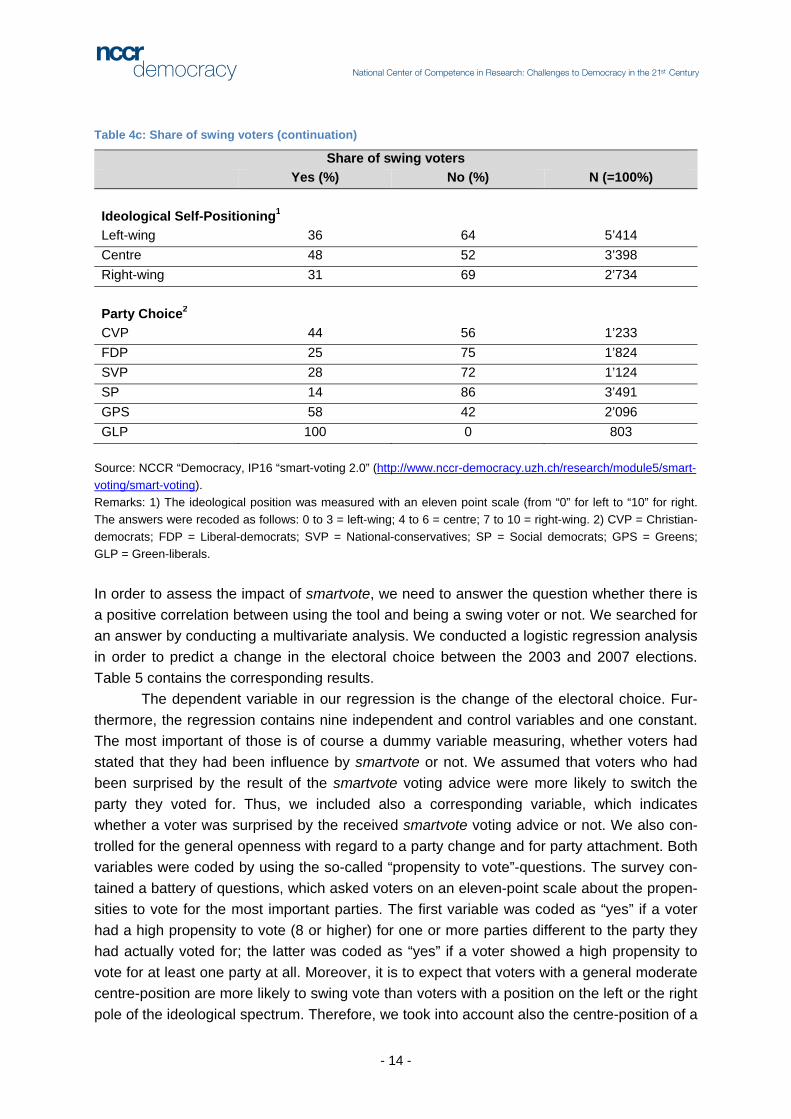
Source: NCCR “Democracy, IP16 “smart-voting 2.0” (http://www.nccr-democracy.uzh.ch/research/module5/smart-voting/smart-voting). Remarks: 1) C/M-ratio: the numerical relation between the number of candidates (C) and the number of seats (M) in a particular constituency. The higher the C/M-ratio the more are candidates competing against each other per seat. Table 4c is addressing aspects of ideological and political positions. According to the ideo-logical self-positioning of voters on the left-right axis, there are more swing voters among those who position themselves in the centre of the scale. In terms of party choice there is a little bit of a different picture. We find the highest shares of swing voters among parties of the left and the left part of the centre (GPS, CVP and Green-liberals). On first sight, the case of the Green-liberals with a share of 100% of swing voters is surprising. But one should keep in mind that this party was the first time participating in a national election in 2007. Thus, by definition all of their voters must be swing voters.
- 14 -
Table 4c: Share of swing voters (continuation)
Share of swing voters Yes (%) No (%) N (=100%) Ideological Self-Positioning1 Left-wing 36 64 5’414 Centre 48 52 3’398 Right-wing 31 69 2’734 Party Choice2 CVP 44 56 1’233 FDP 25 75 1’824 SVP 28 72 1’124 SP 14 86 3’491 GPS 58 42 2’096 GLP 100 0 803
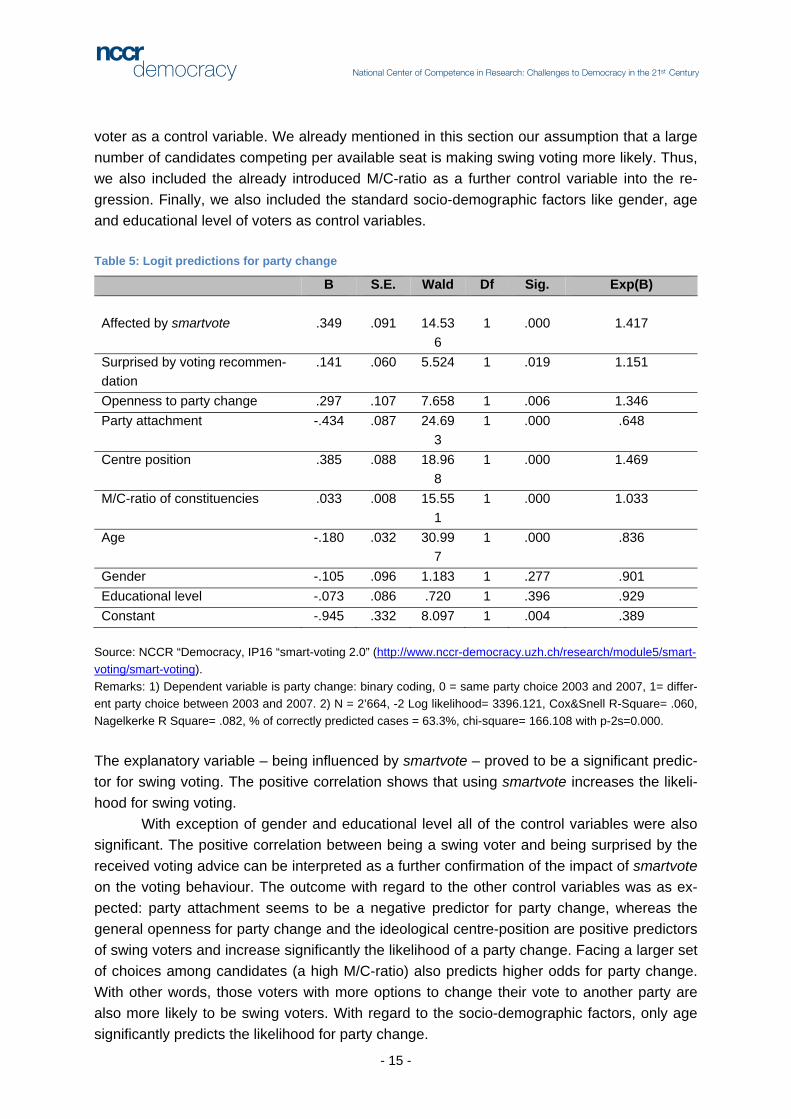
Source: NCCR “Democracy, IP16 “smart-voting 2.0” (http://www.nccr-democracy.uzh.ch/research/module5/smart-voting/smart-voting). Remarks: 1) The ideological position was measured with an eleven point scale (from “0” for left to “10” for right. The answers were recoded as follows: 0 to 3 = left-wing; 4 to 6 = centre; 7 to 10 = right-wing. 2) CVP = Christian-democrats; FDP = Liberal-democrats; SVP = National-conservatives; SP = Social democrats; GPS = Greens; GLP = Green-liberals. In order to assess the impact of smartvote, we need to answer the question whether there is a positive correlation between using the tool and being a swing voter or not. We searched for an answer by conducting a multivariate analysis. We conducted a logistic regression analysis in order to predict a change in the electoral choice between the 2003 and 2007 elections. Table 5 contains the corresponding results.
The dependent variable in our regression is the change of the electoral choice. Fur-thermore, the regression contains nine independent and control variables and one constant. The most important of those is of course a dummy variable measuring, whether voters had stated that they had been influence by smartvote or not. We assumed that voters who had been surprised by the result of the smartvote voting advice were more likely to switch the party they voted for. Thus, we included also a corresponding variable, which indicates whether a voter was surprised by the received smartvote voting advice or not. We also con-trolled for the general openness with regard to a party change and for party attachment. Both variables were coded by using the so-called “propensity to vote”-questions. The survey con-tained a battery of questions, which asked voters on an eleven-point scale about the propen-sities to vote for the most important parties. The first variable was coded as “yes” if a voter had a high propensity to vote (8 or higher) for one or more parties different to the party they had actually voted for; the latter was coded as “yes” if a voter showed a high propensity to vote for at least one party at all. Moreover, it is to expect that voters with a general moderate centre-position are more likely to swing vote than voters with a position on the left or the right pole of the ideological spectrum. Therefore, we took into account also the centre-position of a
- 15 -
voter as a control variable. We already mentioned in this section our assumption that a large number of candidates competing per available seat is making swing voting more likely. Thus, we also included the already introduced M/C-ratio as a further control variable into the re-gression. Finally, we also included the standard socio-demographic factors like gender, age and educational level of voters as control variables. Table 5: Logit predictions for party change
B S.E. Wald Df Sig. Exp(B) Affected by smartvote .349 .091 14.53
6 1 .000 1.417
Surprised by voting recommen-dation
.141 .060 5.524 1 .019 1.151
Openness to party change .297 .107 7.658 1 .006 1.346 Party attachment -.434 .087 24.69
3 1 .000 .648
Centre position .385 .088 18.968
1 .000 1.469
M/C-ratio of constituencies .033 .008 15.551
1 .000 1.033
Age -.180 .032 30.997
1 .000 .836
Gender -.105 .096 1.183 1 .277 .901 Educational level -.073 .086 .720 1 .396 .929 Constant -.945 .332 8.097 1 .004 .389
Source: NCCR “Democracy, IP16 “smart-voting 2.0” (http://www.nccr-democracy.uzh.ch/research/module5/smart-voting/smart-voting). Remarks: 1) Dependent variable is party change: binary coding, 0 = same party choice 2003 and 2007, 1= differ-ent party choice between 2003 and 2007. 2) N = 2’664, -2 Log likelihood= 3396.121, Cox&Snell R-Square= .060, Nagelkerke R Square= .082, % of correctly predicted cases = 63.3%, chi-square= 166.108 with p-2s=0.000. The explanatory variable – being influenced by smartvote – proved to be a significant predic-tor for swing voting. The positive correlation shows that using smartvote increases the likeli-hood for swing voting.
With exception of gender and educational level all of the control variables were also significant. The positive correlation between being a swing voter and being surprised by the received voting advice can be interpreted as a further confirmation of the impact of smartvote on the voting behaviour. The outcome with regard to the other control variables was as ex-pected: party attachment seems to be a negative predictor for party change, whereas the general openness for party change and the ideological centre-position are positive predictors of swing voters and increase significantly the likelihood of a party change. Facing a larger set of choices among candidates (a high M/C-ratio) also predicts higher odds for party change. With other words, those voters with more options to change their vote to another party are also more likely to be swing voters. With regard to the socio-demographic factors, only age significantly predicts the likelihood for party change.
- 16 -
All things considered, the regression analysis supports our assumption that voters see smartvote as a serious and useful tool for their decision-making and that it affects also their actual vote. Thus, the findings in this section come along with those of the previous sec-tion. And there is also a further argument that supports our assumption. As already men-tioned our definition of swing voters excluded all the young voters who were eligible to vote in 2007 for the first time. On the other hand, above all the young voters are those who are most affected by smartvote as seen in Table 1a. Thus, it is not to be expected that analyses that include the young voters would come to totally different findings. Although we do find signifi-cant effects in our analysis presented above, we have to state that the overall model quality is weak (see remarks for Table 5).
5 Conclusion and outlook on the 2nd phase project VAAs have become increasingly popular and have emerged as indispensable elements in pre-election periods in many countries. But up to now only very few studies have focused on the impact of VAAs on the actual electoral choice of their users. In this working paper we addressed the question whether there is such an impact or not, based on the example of the Swiss VAA smartvote.
We found strong evidence that smartvote users are indeed affected by the voting ad-vice they receive. 67% of voters using the tool stated that it influenced their party choice. This figure is several times higher compared with the findings of similar studies from other countries (Marschall 2005, Kees and van der Kolk 2007, Walgrave et al. 2008, and Rusuu-virta and Rosema 2009). We found further confirmation for our findings by additional analy-ses based on swing voters. We could show that the use of smartvote during the 2007 elec-tion campaign had a significant positive correlation with being a swing voter. However, we had to deal with several problems in regard to the quality of the available data (e.g. self-selection processes among respondents). Thus, we can only provide first and no final an-swers.
With a view to further research on this topic during the second phase of the NCCR Democracy, we suggest at least three aspects from where future studies should proceed. First, it is necessary to improve the quality of available data. Most studies use only data from online surveys with all the well-known problems of lacking representativeness. Thus, studies should use combined online and offline data whenever possible. The study of Walgrave et al. (2008) for the 2004 Belgian elections demonstrates impressively the advantages of such a research design. Second, regarding the large differences between our findings on the impact of smartvote and the findings for VAAs in other countries we should pay more attention to international comparisons and the search for an explanation of these differences. In order to support comparative studies research projects, VAAs should intensify their cooperation. A first step could be to develop comparable questionnaires and data sets. Third, concerning the presented results indicating a clear impact of VAAs on the electoral choice we should also draw our attention to the question, whether this leads to ‘better’ voting decisions at all – a question, which becomes increasingly pressing.
- 17 -
6 References Alvarez, Michael, and Jonathan Nagler. 2000. “A New Approach for Modelling Strategic Vot-
ing in Multiparty Elections.” British Journal of Political Science 30: 57-75. Carey, John M., and Matthew Soberg Shugart. 1995. “Incentives to Cultivate a Personal
Vote: a Rank Ordering of Electoral Formulas.” Electoral Studies 14 (4): 417-439. Cox, Gary W. 1997. Making Votes Count. Strategic Coordination in the World's Electoral
Systems. Cambridge: Cambridge University Press. Dalton, Russell J. ,and Martin Wattenberg. 2000. Parties Without Partisans. Political Change
in Advanced Industrial Democracies. Oxford: Oxford University Press. Dalton, Russel J. 2006. Citizen Politics. Public Opinion and Political Parties in Advanced In-
dustrial Democracies. Washington D.C.: CQ Press. Downs, Anthony. 1957. An Economic Theory of Democracy. New York: Harper and Brothers. Fivaz, Jan, and Giorgio Nadig. 2010. “Impact of Internet-based Instruments on Civic Literacy
and Voter Turnout.” Policy & Internet (forthcoming). Fivaz, Jan. 2008. “Impact of “smart-voting” on Political Participation.” Presented at the Civic
Education and Political Participation Workshop at the Université de Montréal; Mont-real, June 17-19.
Fivaz, Jan, and Daniel Schwarz. 2007. “Nailing the Pudding to the Wall – E-Democracy as Catalyst for Transparency and Accountability.” Presented at the International Confer-ence on Direct Democracy in Latin America, Buenos Aires, March 14-15.
Fivaz, Jan, and Bruno Jeitziner. 2005. “E-Democracy Beyond E-Voting.” In Innovation and the Knowledge Economy. Issues, Applications, Case Studies, eds. Paul Cunnigham, and Miriam Cunnigham. Amsterdam: IOS Press, 590-597.
Jeitziner, Bruno. 2004. “Wahlen im Internetzeitalter. Informationsvermittler als politische Be-rater von Wählern und Politikern.” In Perspektiven der Wirtschaftspolitik. Festschrift zum 65. Geburtstag von Prof. Dr. René L. Frey, eds. Christoph A. Schaltegger, and Stephan C. Schaltegger. Zürich: vdf Hochschulverlag, 47-64.
Kees, Aart, and Henk van der Kolk. 2007. “The parliamentary election in the Netherlands, 22 November 2006.” Electoral Studies 26: 797-837.
Klein, Markus. 2006. “Jenseits von Distanz und Richtung. Die Verbundmessung von Politik-präferenzen im Vergleich mit dem Distanz- und Richtungsmodell des Wählens – em-pirische Befunde eines Methodenexperiments.” Politische Vierteljahresschrift 47 (4): 595-617.
Kleinnijenhuis, Jan, Otto Scholten, Wouter van Atteveldt, Anita van Hoof, André Krouwel, Dirk Oegema, Jan A. de Ridder, Nel Ruigrok, and Janet Takens. 2007. Nederland vijfstromenland. De rol van de media en stemwijzers bij de verkiezingen van 2006. Amstderdam: Uitgeverij Bert Bakker.
Kriesi, Hanspeter, and Pascal Sciarini. 2003. “Auswirkungen von Sachpräferenzen auf die Wahlentscheidung.” In Schweizer Wahlen 1999, eds. Pascal Sciarini, Sibylle Hard-meier, and Adrian Vatter. Bern: Haupt, 321-328.
- 18 -
Ladner, Andreas, Jan Fivaz, and Joëlle Pianzola. 2010. “Impact of Voting Advice Applica-tions on Voters’ Decision-Making.” Presented at the conference Internet, Politics, Pol-icy 2010: An Impact Assessment, Oxford, September 16-17.
Ladner, Andreas, Gabriela Felder, and Jan Fivaz. 2010. “More Than Toys? A First Assess-ment of Voting Advice Applications in Switzerland.” In Voting Advice Applications in Europe. The State of the Art, eds. Lorella Cedroni, and Diego Garzia. ScriptaWeb (E-Book).
Ladner, Andreas, Gabriela Felder, and Jan Fivaz. 2010c. Die politische Positionierung der europäischen Parteien im Vergleich. Eine Analyse der politischen Positionen der eu-ropäischen Parteien anlässlich der Wahlen des Europäischen Parlaments 2009 mit besonderer Berücksichtigung der Schweizer Parteien. Chavannes-Lausanne: IDHEAP.
Lau, Richard R., and David P. Redlawsk. 2006. How Voters Decide. Information Processing during Election Campaigns. Cambridge: Cambridge University Press.
Liebhart, Karin, and Martin Wassermair. 2003. “Wahlkabine.at – Eine Online-Wahlhilfe er-weckt neues Interesse an Politik.” In Kopf an Kopf. Meinungsforschung im Medien-wahlkampf, eds. Sieglinde K. Rosenberger, and Gilg Seeber. Wien, Czernin, 103-124.
Marschall, Stefan, and Christian K. Schmidt. 2010. “The Impact of Voting Indicators: The Case of the German Wahl-O-Mat.” In Voting Advice Applications in Europe. The State of the Art, eds. Lorella Cedroni, and Diego Garzia. ScriptaWeb (E-Book), 61-86.
Marschall, Stefan. 2009. “Der Wahl-O-Mat als Instrument der Gesellschaftsberatung – Po-tenziale und Grenzen.” Zeitschrift für Politikberatung 2: 485-492.
Marschall, Stefan. 2005. “Idee und Wirkung des Wahl-O-Mat.” Aus Politik und Zeitgeschichte 51-52: 41-46.
Niemi, Richard G., and Herbert F. Weisberg, eds. 2001. Controversies in Voting Behavior. Washington D.C.: CQ Press.
Powell, G. Bingham Jr.. 2000. Elections as Instruments of Democracy. Majoritarian and Pro-portional Visions. New Haven: Yale University Press.
Rabinowitz, George, and Stuart Elaine Macdonald. 1989. “A Directional Theory of Issue Vot-ing.” American Political Science Review 83 (1): 93-121.
Ramonaitè, Ainè. 2010. “Voting Advice Applications in Lithuania: Promoting Programmatic Competition or Breeding Populism?” Policy & Internet 2 (1): 117-147.
Rütsche, Bernhard. 2008. Elektronische Wahlhilfen in der Demokratie. Beurteilung im Lichte der Wahl- und Abstimmungsfreiheit, Spannungsverhältnis zu den politischen Partie-en, Fragen staatlicher Regulierung. Basel: Helbing Lichtenhahn.
Ruusuvirta, Outi, and Martin Rosema. 2009. “Do online vote selectors influence electoral participation and the direction of the vote?” Presented at the European Consortium for Political Research (ECPR) General Conference, Potsdam, September 10-12.
Schoen, Harald, and Cornelia Weiss. 2005. “Der sozialpsychologische Anasatz zur Erklärung von Wahlverhalten”. In Handbuch Wahlforschung, eds. Jürgen W. Falter, and Harald Schoen. Wiesbaden, VS Verlag für Sozialwissenschaften, 187-242.
- 19 -
Schwarz, Daniel, Lisa Schädel, and Andreas Ladner. 2010 (forthcoming). “Pre-Election Posi-tions and Voting Behavior in Parliament: Explaining Positional Congruence and Changes among Swiss MPs.” Swiss Political Science Review 16(4).
Walgrave, Stefaan, Peter van Aelst, and Michiel Nuytemans. 2008. “’Do the Vote Test’: The Electoral Effects of a Popular Vote Advice Application at the 2004 Belgian Elections”. Acta Politica 43: 50-70.
Wall, Matthew, Maria Laura Sudulich, Rory Costello, and Enrique Leon. 2009. “Picking your party online – An investigation of Ireland’s first online voting advice application.” In-formation Polity 14: 203-218.