Embed Size (px)
Citation preview

Illinois State Board of Education 100 North First Street • Springfield, Illinois 62777-0001 www.isbe.net James T. Meeks Tony Smith, Ph.D. Chairman State Superintendent of Education
February 23, 2018
M E M O R A N D U M
TO: The Honorable Bruce Rauner, Governor The Honorable John J. Cullerton, Senate President The Honorable William E. Brady, Senate Minority Leader The Honorable Michael J. Madigan, Speaker of the House The Honorable Jim Durkin, House Minority Leader
FROM: Tony Smith, Ph.D.
State Superintendent of Education
SUBJECT: 2017 Educator Supply and Demand Report
The Illinois State Board of Education respectfully submits this detailed report to the Governor, the General Assembly, and institutions of higher education in fulfillment of the requirements of Section 2-3.11c of the School Code [105 ILCS 5/2-3.11c]. This report addresses the relative supply and demand for education staff of Illinois public schools.
Specifically, this report provides information on
1. The relative supply and demand for teachers, administrators, and other certificated and non-certificated personnel by fields, content areas, and level;
2. State and regional analyses of fields, content areas, and levels;
3. Projections of likely high/low demand for educators in a manner sufficient to advise the public, individuals, and institutions regarding career opportunities in education.
This report is a more detailed version of the Executive Summary that was submitted on December 28, 2017. If you have any questions regarding this report, please contact Amanda Elliott or Sarah Hartwick at (217) 782-6510.
cc: Tim Anderson, Secretary of the Senate Timothy Mapes, Clerk of the House Legislative Research Unit State Government Report Center


Issued: February 23, 2018
2018
Educator Supply and Demand in Illinois
2018 TRIENNIAL REPORT


3
FOREWORD
The Illinois State Board of Education (ISBE) respectfully submits this report to the Governor, the General Assembly, and institutions of higher education in fulfillment of the requirements of Section 2‐3.11c of the School Code [105 ILCS 5/2‐3.11c]. This report addresses the relative supply and demand for education staff in Illinois public schools. Specifically, this report provides information on: 1. the relative supply and demand for teachers, administrators, and other licensed and non‐
licensed personnel by field, content area, and levels; 2. state and regional analyses of fields, content areas, and levels with an over/undersupply of
educators; and 3. projections of likely high/low demand for educators in a manner sufficient to advise the public,
individuals, and institutions regarding career opportunities in education.
Important notes about this report:
ISBE issued the Executive Summary for this report on December 29, 2017. This full report includes tables and details that support the statements in the Executive Summary.
ISBE transitioned its educator information system from the Teacher Service Record (TSR) to the Employment Information System (EIS) in school year 2012‐131. The transition from a flat data collection system (TSR) to relational databases (EIS) provides more flexibility and improved data quality going forward. However, due to initial collection issues, particularly with administrator data, made some calculations (such as ones pertaining to retention) difficult. They were also problematic when a longitudinal analysis between TSR and EIS data was attempted. As a result, our analysis is primarily focused on school years 2015‐16 and 2016‐17.
Similarly, ISBE transitioned its teacher licensing system from the Teacher Certification Information System (TCIS) to the Educator Licensure Information System (ELIS) in school year 2012‐13 and transitioned from a certificate‐based system to a license‐based system2. Again, the transition from a flat data collection system (TCIS) to relational databases (ELIS) provides more flexibility and improved data quality going forward. However, the conversion of certificates to licenses in school year 2013‐14 makes longitudinal analysis from certificates to licenses difficult because certificates converted to licenses are indistinguishable from new licenses in ELIS. As a result, we primarily focused our analysis on school years 2014‐15, 2015‐16, and 2016‐17.
The information in this report and additional detailed information can be found at www.ISBE.net/EdSupplyDemand. Additional information is currently offered as an enhancement to the Educator Supply and Demand Report.
Questions about this report may be referred to the ISBE Data Strategies and Analytics Division at (217) 782‐3950.
1 Please see Appendix C for a further description of this issue. 2 Please see Appendix C for a further description of this issue.

4

5
Table of Contents FOREWORD ..................................................................................................................................................... 3
Table of Tables .................................................................................................................................................... 6
Summary of Findings .......................................................................................................................................... 7
I. Relative Supply and Demand for Educators ....................................................................................... 7
Supply Indicators ........................................................................................................................................ 7
Demand Factors .......................................................................................................................................... 8
II. Over/Undersupply of Educators ......................................................................................................... 8
III. Projections of Likely High Demand ..................................................................................................... 8
I. Relative Supply and Demand for Educators ............................................................................................. 10
Supply Indicators ...................................................................................................................................... 10
Demand Factors ........................................................................................................................................ 14
II. Over/Undersupply of Educators ............................................................................................................... 19
III. Projections of Likely High Demand ................................................................................................... 22
References ........................................................................................................................................................ 23
Definitions of Terms ......................................................................................................................................... 24
Supply ........................................................................................................................................................... 24
Demand ........................................................................................................................................................ 24
Appendix A: Unfilled Positions 2015‐16 and 2016‐17 in Detail ........................................................................ 25
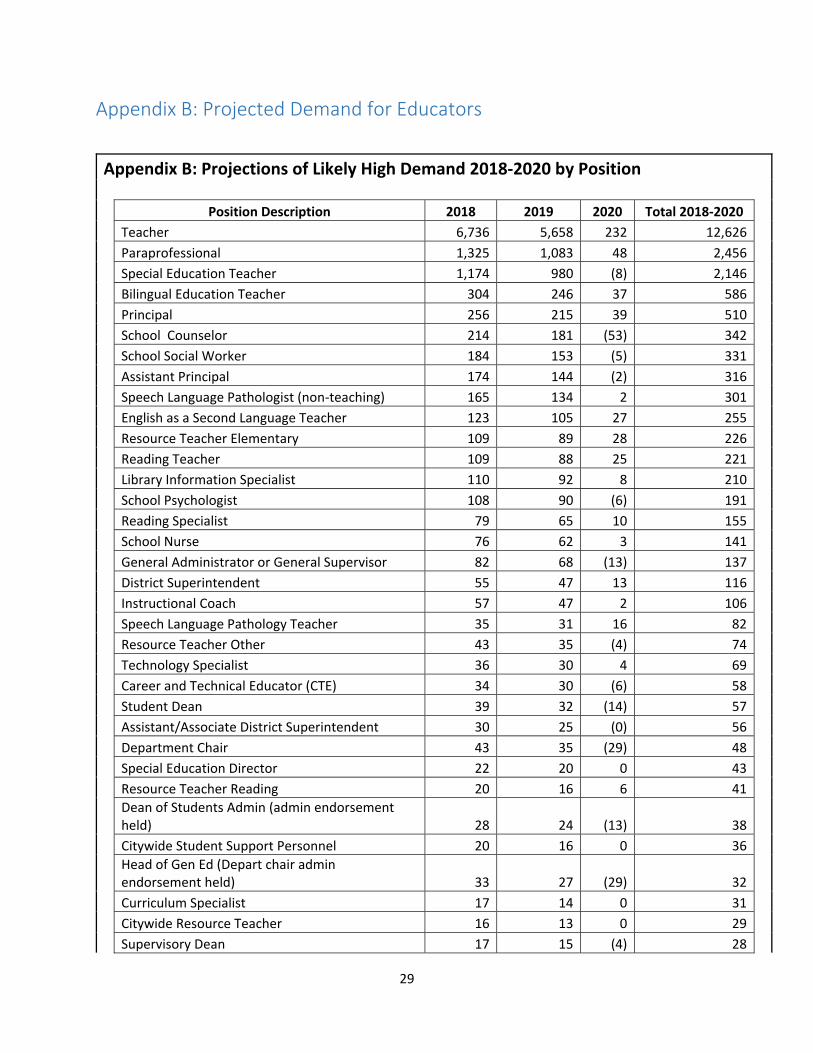
Appendix B: Projected Demand for Educators ................................................................................................. 29
Appendix C: EIS and ELIS System Changes ....................................................................................................... 31
Teacher Service Record (TSR) conversion to Educator Information System (EIS) .................................... 31
Teacher Certificate Information System (TCIS) conversion to Educator Licensure Information System
(ELIS) ......................................................................................................................................................... 31

6
Table of Tables
Table 1: Retention and Attrition FY 2015‐16 …………………………………………………………………………………… 10
Table 2: 2016‐17 Total FTE and Supply Source by Position ………………………………………………………………… 11
Table 3: Licenses Issued by Method and Endorsements by Type …………………………………………………….. 12
Table 4: Re‐entries hired from 2008 to 2012 …………………………………………………………………………………… 13
Table 5: Re‐entries hired in 2016‐17 by Position ……………………………………………………………………………… 13
Table 6: Program Completers and Supply Capture …………………………………………………………………………… 14
Table 7: Enrollment Projections through 2020 ………………………………………………………………………………… 15
Table 8: Educator Workforce Growth ……………………………………………………………………………………………… 16
Table 9: Teacher Workforce Growth Rates ……………………………………………………………………………………… 17
Table 10: Administrator Workforce Growth Rates …………………………………………………………………………… 18
Table 11: Unfilled Positions 2016‐17 and 2015‐16 …………………………………………………………………………… 19
Table 12: Greatest Number of Unfilled Positions 2015‐16 and 2016‐17 …………………………………………… 20
Table 13: Unfilled Positions by Region ……………………………………………………………………………………………… 20
Table 14: Projected Areas of Highest Need Through 2019‐20……………………………………………………………. 22

7
Summary of Findings
Pursuant to Section 2‐3.11c of the School Code [105 ILCS 5/2‐3.11c], the following is a summary of findings in the 2018 Triennial Report on Educator Supply and Demand.
I. Relative Supply and Demand for Educators
Supply Indicators
Supply includes all educational personnel available to the schools, regardless of whether they are currently employed by schools or not. Indicators of supply include (1) personnel retained from the previous year; (2) newly endorsed personnel; (3) re‐entering personnel, i.e., newly hired educators with prior experience; and (4) students in the pipeline, i.e., those currently enrolled in professional preparation programs and recent program completers.
(1) Retention rates remain high. The largest supply of educators is the previous year’s workforce. The average annual retention rate for Illinois educators has been 93 percent for more than 10 years. In 2016‐17, 93 percent of the previous year’s workforce was retained in Illinois public schools. For teachers, 89 percent were retained in the same position and 4 percent were retained, but in a different position.
(2) The total number of licenses is down from 2015‐16 to 2016‐17. The second largest source of supply is newly licensed educators. The number of new licenses declined by 4 percent from 2015‐16 to 2016‐17. The largest source of newly licensed educators remains educators who graduated from out‐of‐state institutions, which represent 76 percent of all new licenses issued in 2016‐17. Out‐of‐state licenses declined by almost 3 percent from 2015‐16 to 2016‐17, while licenses issued to educators completing in‐state programs declined by 10 percent from 2015‐16 to 2016‐17.
(3) The decline of re‐entrants hired has continued. The third major source of supply includes educators returning to the profession. We have a data gap from 2011‐12 to 2015‐16 due to the changeover from TSR to EIS in 2012‐13. The number of re‐entrants hired in 2016‐17 was down to 2,644 from 3,855 in 2011‐12.
(4) The pipeline data indicates resiliency as the number of program completers decline, but the number of licenses issued to educators completing in‐state programs increase. In 2016‐17, 59 educational institutions reported more than 6,000 program completers, which represents a decline from almost 8,000 in 2014‐15. However, supply capture, the percentage of completers issued in‐state licenses, increased from 61 percent in 2014‐15 to 81 percent in 2016‐17, resulting in an increased number of Entitlement Licenses going from 4,749 issued in 2014‐15 to 5,392 in 2016‐17.

8
Demand Factors
Demand refers to the need for educational personnel to fill positions. Demand factors include (1) changes in student enrollments and (2) workforce growth.
(1) K‐12 student enrollments peaked in 2006‐07 and then began a decline, which will continue through 2019‐20. K‐12 enrollments peaked in 2006‐07 after increasing for 17 years. Since then, they have decreased by approximately 100,000 students. ISBE projects a decline of an additional 57,000 K‐12 students between 2016‐17 and 2019‐20.
(2) The teacher workforce remained relatively stable from 2012‐13 to 2016‐17. Teacher workforce, the largest component of educator workforce, changed by less than 1 percent from 2012‐13 to 2016‐17. This continues a long‐term trend of a slowly declining teacher workforce since it peaked in 2008‐09.
II. Over/Undersupply of Educators
Educator shortages were analyzed by reviewing unfilled positions.
Unfilled positions were examined to see where regional shortages exist, i.e., where supply has not met local demand despite the relatively large number of teachers entering the workforce each year.
Illinois school districts reported 2,014.6 unfilled positions for school year 2016‐17. The following areas or subjects had the greatest number of unfilled positions:
Paraprofessional 467.1Special Ed ‐ LBS I 271.6Bilingual Education 125.3Speech/Lang. Pathologist (non‐teaching) 124.7
Psychologist 104.4
The plurality of unfilled positions (43 percent) were in the City of Chicago School District 299. Suburban Cook and the collar counties accounted for 27 percent while districts in the rest of the state had 30 percent of the total.
The number of unfilled positions increased by almost 8 percent from 2015‐16 to 2016‐17. The increase was driven by an increase in unfilled positions among school support personnel.
III. Projections of Likely High Demand
Projections of likely high‐demand areas are made in order to advise the public of future career opportunities in education. Projected demand for the next three years is less than the demand forecast in the 2014 report.
It is estimated that Illinois will need approximately 2,000 special and 12,000 regular education teachers through 2019‐20. Overall, Illinois will need between 20,000 and 24,000 new educators through 2019‐20. But due to demographic decline in K‐12 enrollment and educator attrition, 2019‐20 could mark an
9
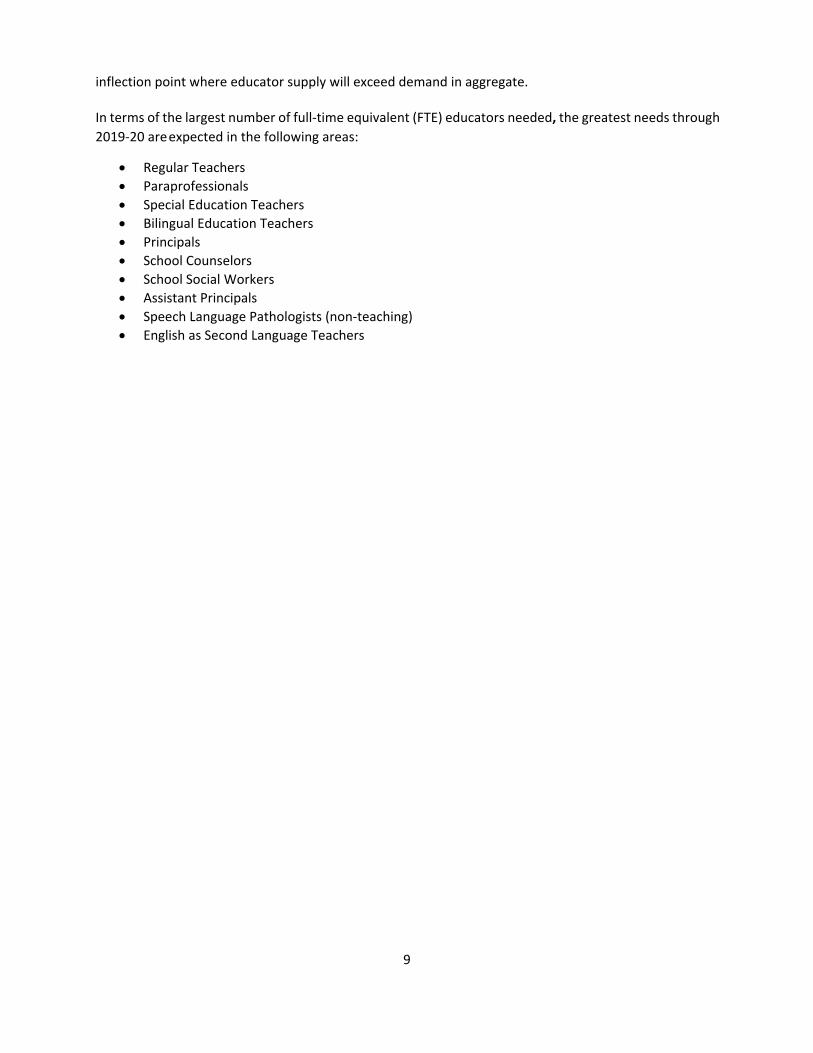
inflection point where educator supply will exceed demand in aggregate. In terms of the largest number of full‐time equivalent (FTE) educators needed, the greatest needs through
2019‐20 are expected in the following areas:
Regular Teachers
Paraprofessionals
Special Education Teachers
Bilingual Education Teachers
Principals
School Counselors
School Social Workers
Assistant Principals
Speech Language Pathologists (non‐teaching)
English as Second Language Teachers

10
I. Relative Supply and Demand for Educators
Supply Indicators
Supply, in its broadest sense, includes all educational personnel available to the schools, regardless of whether they are currently employed within the school system. This section provides information on various indicators of supply, including (1) personnel retained from the previous year; (2) newly licensed educators; (3) re‐entering personnel, i.e., newly hired educators who had prior experience; and (4) students in the pipeline, i.e., recent program completers.
Teacher retention remains high in Illinois. Table 1 demonstrates that of the 171,475 FTE educators in school year 2015‐16, 88.77 percent were retained in their position and 4.20 percent changed positions but remained employed in Illinois. We consider total retention to be 92.97 percent. Illinois experienced a 7.03 percent attrition rate as more than 12,000 educators left the state or education.
Table 1: Retention and Attrition FY 2015‐16
Retention Change in Position Attrition Total
FY16 FTE
N % N % N % District Superintendent 646 92.82% 5 0.72% 45 6.47% 696
Elementary Teacher 62,878 91.03% 2,170 3.14% 4,023 5.82% 69,071
High School Teacher 27,888 90.30% 1,143 3.70% 1,854 6.00% 30,885
Other Certified Staff 20,924 84.24% 1,024 4.12% 2,892 11.64% 24,840
Prekindergarten Teacher 1,147 76.67% 255 17.05% 94 6.28% 1,496
Principal 3,138 88.27% 226 6.36% 191 5.37% 3,555
Regular Education Admin 4,430 77.97% 648 11.40% 604 10.63% 5,682
Special Education Admin 768 83.57% 87 9.47% 64 6.96% 919
Special Education Teacher 18,967 88.55% 1,119 5.22% 1,333 6.22% 21,419
Student Support Personnel 11,439 88.59% 522 4.04% 951 7.37% 12,912
Total 152,225 88.77% 7,199 4.20% 12,051 7.03% 171,475
Table 2 shows the source of educators for 2016‐17. Of the 172,328 FTE educators in 2016‐17, 93.03 percent were retained from 2015‐16 (88.94 percent in the same positions and 4.09 percent in different positions)3. More than 12,000 (almost 7 percent) were teachers newly hired in Illinois, of which 1.53 percent were re‐entering educational professionals and more than 5.45 percent were hired in Illinois for the first time.
3 It’s important to note the difference between Table 1 “Retention and Attrition FY 2015‐16” and Table 2 “2016‐17 Total FTE and Supply Source by Position.” Retention represents FTE educators in 2016 who are employed as a FTE educator or part‐time educator in 2017. This is consistent with historic practice. “Retained from 2015‐16” while similar is a different number and therefore the two do not match. “Retained from 2015‐16” represents FTE educators in 2016‐17 who were full‐time or part time in 2015‐16.

11
Table 2: 2016‐17 Total FTE and Supply Source by Position
Position New IL Educators Retained from 2015‐16 Changed Position from
2016 Total FTE 2017
N % N % N %
District Superintendent 9 1.33% 621 91.59% 53 7.82% 678
Elementary Teacher 3,534 5.12% 63,464 91.86% 2,098 3.04% 69,089
High School Teacher 1,528 4.99% 27,998 91.41% 1,112 3.63% 30,630
Other Certified Staff 4,286 16.60% 21,005 81.33% 518 2.01% 25,826
Prekindergarten Teacher 168 10.97% 1,156 75.46% 212 13.85% 1,532
Principal 85 2.36% 3,173 88.21% 342 9.57% 3,597
Regular Education Admin 201 3.78% 4,428 83.30% 658 12.54% 5,316
Special Education Admin 31 3.02% 767 74.83% 224 21.92% 1,025
Special Education Teacher 1,213 5.64% 19,200 89.26% 1,122 5.22% 21,511
Student Support Personnel 976 7.44% 11,458 87.31% 698 5.33% 13,124 12,031 6.98% 153,270 88.94% 7,037 4.09% 172,328
N
% of Total FT
New IL Educators 12,031 6.98%
Re‐entries Hired 2,644 1.53%
First‐Time IL Teachers 9,387 5.45%
Personnel Retained from the Previous Year
The largest supply of educators is the previous year’s workforce. The total educator workforce includes teachers, administrators, school service personnel, and other licensed staff. As shown in Table 1, 89 percent of the 2015‐16 educational workforce was employed in the same position in 2016‐17. In addition, 4 percent were retained in Illinois public districts, but in a different position. In sum, 93 percent of the 2015‐16 workforce was still in Illinois public schools in 2016‐17. This rate is identical to the 2011‐12 retention rate (93 percent).
Newly Licensed Educators
The second largest source of supply is newly licensed educators. The number of new licenses issued in Illinois is counted annually according to the fiscal year, i.e., July 1 through June 30. Teachers had to be licensed in the previous fiscal year, i.e., July 2016 through June 2017, in order to be considered as supply for school year 2017‐18.
ISBE transitioned from the TCIS system to ELIS for educator licensure in school year 2012‐13. The conversion of certificate to licenses, which occurred in 2013‐14, makes long‐term trend analysis difficult so we use 2014‐15 as the baseline year for comparison. The supply of new educators declined by 4 percent from 2015‐16 to 2016‐17. “Entitlement Licenses,” those issued to educators completing an in‐state education preparation program, declined 10 percent from 2015‐16 to 2016‐17. “Evaluation Licenses,” those issued to educators receiving an Illinois license who completed an out‐of‐state preparation program, also declined by almost 3 percent but remain the largest source of new educator licenses. Evaluation Licenses made up 76 percent of all new educator licenses issued in Illinois in 2016‐17. Some of the decline in Entitlement and Evaluation Licenses was mitigated by

12
steady gains in “Exchange Licenses” issued. Exchange Licenses are licenses that are converted from provisional licenses. (See Table 3.)
The total number of endorsements declined by 3 percent from 2015‐16 to 2016‐17. The endorsements that saw the biggest declines were Administrative (‐38.90 percent), Transitional Bilingual (‐30.12 percent), and Special (‐25.84 percent). Despite the overall decline, secondary endorsements increased by 35.77 percent and Other increased by 6.53 percent.
Table 3: Licenses Issued by Method and Endorsements by Type Licenses Issued by Method 2014‐15 2015‐16 2016‐17
N % N %
Evaluation 10,664 21,059 97.48% 20,501 ‐2.65%
Entitlement 4,749 6,011 26.57% 5,392 ‐10.30%
Exchange 206 895 334.47% 952 6.37%
Total 15,619 27,965 79.04% 26,845 ‐4.01%
Endorsements by Type
Elementary 3,283 3,524 7.34% 3,347 ‐5.02%
Secondary 5,349 2,625 ‐50.93% 3,564 35.77%
Early Childhood 438 677 54.57% 599 ‐11.52%
Special 2,682 3,622 35.05% 2,686 ‐25.84%
School Service 1,225 1,298 5.96% 1,190 ‐8.32%
Administrative 1,595 1,843 15.55% 1,126 ‐38.90%
Transitional Bilingual 444 508 14.41% 355 ‐30.12%
Substitute 10,111 10,078 ‐0.33% 9,972 ‐1.05%
Other (Paraprofessional, Career and Tech, etc.) 6,081 6435 5.82% 6855 6.53%
Total 31,208 30,610 ‐1.92% 29,694 ‐2.99%
Re‐entering Personnel
Educators returning to the profession after a year or more’s absence are another source of supply. In addition to being an important source of new hires, the number of re‐entries is an important indicator of another facet of supply — the reserve pool. The majority of re‐entries are teachers, but more than 200 were school support personnel and more than 100 were principals or other administrators. (See Table 4.)
ISBE changed from TSR to EIS in school year 2012‐13. It is impossible to calculate re‐entries with fidelity for school years 2013‐2016 due to initial reporting anomalies related to the conversion and a lack of grade level assignments. Table 4 shows historical re‐entries from 2008 to 2012 to illustrate the long‐term decline in re‐entries.

13
Table 4: Re‐entries hired from 2008 to 2012
Position 2007‐08 2008‐09 2009‐10 2010‐11 2011‐12 % Change from 2008
to 2012
Administrative 469 198 204 186 222 ‐52.7%
Instructional 4,982 4,084 3,544 2,773 3,272 ‐34.3%
Other Certified Staff
96 91 67 83 91 ‐5.2%
School Service Personnel
366 376 329 78 270 ‐26.2%
All Educators 5,913 4,749 4,144 3,341 3,855 ‐34.8%
Based on the historic trend data, it is not surprising that there were only 2,644 re‐entries hired in 2016‐17. Table 5 provides additional detail on the position of re‐entrants hired in 2016‐17.
Table 5: Re‐entries hired in 2016‐17 by Position
Position Total FTE 2016‐17
2016‐17 Re‐entrants
Number of re‐entrants % of Full‐Time
District Superintendent 678 3 0.44%
Elementary Teacher 69,089 876 1.27%
High School Teacher 30,630 357 1.17%
Other Certified Staff 25,826 613 2.37%
Prekindergarten Teacher 1,532 38 2.48%
Principal 3,597 66 1.83%
Regular Education Admin 5,316 108 2.03%
Special Education Admin 1,025 19 1.85%
Special Education Teacher 21,511 338 1.57%
Student Support Personnel 13,124 226 1.72%
All Educators 172,328 2,644 1.53%
Students in the Pipeline and Supply Capture
Students currently enrolled in Illinois professional preparation programs are an indicator of future supply. Tracking enrollment trends in teacher preparation programs helps predict whether the educator supply is likely to increase or decrease in the next three to four years. Students who have recently completed an approved education program in Illinois, i.e., program completers, are a good indicator of the potential number of new teachers. Comparing the number of completers to the actual number of Entitlement Licenses issued determines Illinois supply capture, the percentage of in‐state program completers who receive Illinois licenses.
The 59 institutions of higher education in Illinois that provide educator preparation programs reported more
than 6,600 program completers in 2016‐17, a 6 percent decrease from 2015‐16. Program completers declined

14
by 15.4 percent in 2016‐17 when compared to 2014‐15. Despite the number of program completers declining
from 2014‐15 to 2016‐17, supply capture has increased from 60.7 percent in 2014‐15 to 81.4 percent in 2016‐
17. Despite fewer completers, Entitlement Licenses are up from 4,749 in 2014‐15 to 5,392 in 2016‐17. (See
Table 6.)
Table 6: Program Completers and Supply Capture
Program Completers 2014‐15 2015‐16 2016‐17
N N % N %
Elementary Teaching 2,242 2,144 ‐4.4% 2,054 ‐4.2%
Early Childhood Teaching 2,430 1,561 ‐35.8% 1,457 ‐6.7%
Secondary Teaching 291 374 28.5% 318 ‐15.0%
Special Teaching 1,420 1,411 ‐0.6% 1,205 ‐14.6%
School Service Personnel 633 758 19.7% 760 0.3%
Administrative 811 826 1.8% 829 0.4%
Total 7,827 7,074 ‐9.6% 6,623 ‐6.4%
Entitlement Licenses Issued 4,749 6,011 26.6% 5,392 ‐10.3%
Supply Capture 60.7% 85.0% 81.4%
Demand Factors
Demand refers to the need for educational personnel to fill positions. The most straightforward method of observing the demand for educators is measuring the number of educators hired. Additional factors are observed to provide more context. This section presents information on the various factors of demand, including changing student enrollment patterns and changes in the teacher and administrator workforce.
The enrollment data in this section came from the fall enrollment counts between 2012‐13 and 2016‐17. Staff data came from the 2015‐16 and the 2016‐17 EIS data collections. EIS contains employment data on all certified Illinois public school personnel and is collected each year by ISBE. ISBE changed educator information systems in school year 2012‐13. The initial years of implementation saw underreported administrator positions and a lack of grade level assignments for educators, which make comparing data from prior to 2014‐15 difficult. As a result, we primarily focus on school years 2015‐16 and 2016‐17.
Changes in Student Enrollments
There is a direct relationship between student enrollment and demand for educators at the aggregate level. Illinois public school enrollments peaked in 2006‐07 after increasing every year since 1989‐90.
The K‐12 Illinois public school enrollment for school year 2016‐17 was 1,942,593, more than 11,000 fewer

15
students than 2015‐16 (a less than 1 percent change) and approximately 100,000 fewer students than 2006‐07 (an almost 5 percent decline). This translates to approximately 5,200 fewer teachers needed in Illinois, based on the statewide pupil/teacher ratio (19:1 in 2016‐17). Secondary enrollment declined by 1,807 students from 2015‐16 to 2016‐17 and elementary enrollment declined by 9,786 students. (See Table 7.) Total K‐12 enrollments are expected to decline over the next three years by an average of approximately 19,000 students per year (approximately 1 percent), based on enrollment projections using cohort survival analysis and kindergarten trend analysis. We project more than 57,000 fewer K‐12 students (3 percent) in Illinois in 2019‐20, almost 51,000 fewer in grades K‐8 (almost 4 percent), and almost 7,000 fewer in grades 9‐12 (just over 1 percent).
Table 7: Enrollment Projections through 2020
2016 2017 Difference %
2020 Projected
Difference from 2017
%
K‐8 Enrollment
1,334,894 1,325,108 ‐9,786 ‐0.73% 1,274,300 ‐50,808 ‐3.83%
9‐12 Enrollment
619,292 617,485 ‐1,807 ‐0.29% 610,782 ‐6,703 ‐1.09%
Total K‐12 1,954,186 1,942,593 ‐11,593 ‐0.59% 1,885,082 ‐57,511 ‐3.05%
As can be seen in Figure 1, both elementary and secondary enrollments are expected to decline over the next three years. However, elementary enrollments are expected to decline more.
Secondary enrollments decreased by 7,194 students between school years 2012‐13 and 2016‐17, or 1.15 percent. Secondary enrollments have been decreasing by less than 0.5 percent per year since 2012‐13 and are projected to continue their slow decline through 2019‐20. The cumulative effect of this decline is projected to be almost 14,000 students, or more than 2 percent, fewer secondary students in Illinois in 2019‐20 as compared to 2012‐13. Elementary enrollments are decreasing faster than secondary enrollments. Elementary enrollments decreased by 41,620 students from school years 2012‐13 to 2016‐17, or 3.05 percent. Elementary enrollments have been decreasing by almost 1 percent per year on average from 2012‐13 to 2016‐17 and
0
200,000
400,000
600,000
800,000
1,000,000
1,200,000
1,400,000
1,600,000
2012‐13 2013‐14 2014‐15 2015‐16 2016‐17 2017‐18 2018‐19 2019‐20
Figure 1: Secondary and Elementary Enrollment
K‐8 TOTAL HS TOTAL
Projected Enrollment

16
their decrease is projected to accelerate from 2016‐17 through 2019‐20. The cumulative effect of this decline is projected to be more than 92,000 students, or almost 7 percent, fewer elementary students in Illinois in 2019‐20 as compared to 2012‐13.
Workforce Growth
Total Educator Workforce
The educational workforce has increased since 1990‐91 in response to growth in student enrollments and increases in educational spending. Student enrollment peaked in 2006‐07 and workforce growth peaked in 2008‐09. The workforce has declined since then.
Illinois’ educator workforce stood at 174,068 in 2014‐15 and decreased by 1.49 percent in 2015‐16 to 171,475. The workforce remained relatively stable, growing by 853 FTE educators, or 0.50 percent, from 2015‐16 to 2016‐17. However, within the overall workforce administrators have declined by 4.93 percent and 2.17 percent in 2015‐16 and 2016‐17, respectively. Teacher workforce, the largest component of educator workforce, declined by 2.01 percent from 2014‐15 to 2015‐16 and 0.09 percent from 2015‐16 to 2016‐17. (See Table 8.)
Table 8: Educator Workforce Growth
Full Time 2014‐15 2015‐16 2016‐17
Teachers 125,392 122,871 122,762
Administrators 11,415 10,852 10,616
Other Certified Staff
24,465 24,840 25,826
School Service Personnel
12,796 12,912 13,124
Total 174,068 171,475 172,328
Change from Previous Year
N % N %
Teachers ‐2,620 ‐2.01% ‐109 ‐0.09%
Administrators ‐563 ‐4.93% ‐236 ‐2.17%
Other Certified Staff
375 1.53% 986 3.96%
School Service Personnel
116 0.91% 212 1.64%
Total ‐2,593 ‐1.49% 853 0.50%
Changes in the teacher and administrator categories are examined in more detail below.
Teacher Workforce Growth
Illinois public schools employed 122,717 FTE teachers in 2012‐13. The teacher workforce peaked in 2008‐09 and has declined from 2008‐09 to 2016‐17 by 7.38 percent. The teacher workforce has remained relatively stable since the transition to EIS (2012‐13), increasing by only 45 teachers from 2012‐13 to 2016‐17. (See Table 9.)

17
Table 9: Teacher Workforce Growth Rates
State Downstate Chicago4
Total‐FT Growth
Total‐FT Growth
Total‐FT Growth
1997‐98 118,091 2.10% 94,622 2.70% 23,469 ‐0.20%
1998‐99 121,179 2.60% 97,540 3.10% 23,639 0.70%
1999‐00 124,279 2.60% 100,711 3.30% 23,568 ‐0.30%
2000‐01 127,323 2.40% 103,247 2.50% 24,076 2.20%
2001‐02* 127,408 0.10% 105,190 1.90% 22,218 ‐7.70%
2002‐03 130,773 2.60% 106,189 0.90% 24,584 10.60%
2003‐04** 122,040 ‐6.70% 104,148 ‐1.90% 17,892 ‐27.20%
2004‐05 128,497 5.30% 103,953 ‐0.20% 24,544 37.20%
2005‐06 127,130 ‐1.10% 104,967 1.00% 22,163 ‐9.70%
2006‐07 129,068 1.50% 106,866 1.80% 22,202 0.20%
2007‐08 131,478 1.90% 108,890 1.90% 22,588 1.70%
2008‐09 132,549 0.80% 111,063 2.00% 21,486 ‐4.90%
2009‐10 131,785 ‐0.60% 110,550 ‐0.50% 21,235 ‐1.20%
2010‐11 129,264 ‐1.90% 107,014 ‐3.20% 22,250 4.80%
2011‐12 128,162 ‐0.90% 106,039 ‐0.90% 22,123 ‐0.60%
2012‐13*** 122,717 ‐4.25% 103,565 ‐2.33% 19,152 ‐13.43%
2013‐14 125,613 2.36% 105,762 2.12% 19,851 3.65%
2014‐15 125,392 ‐0.18% 105,790 0.03% 19,602 ‐1.25%
2015‐16 122,871 ‐2.01% 105,272 ‐0.49% 17,599 ‐10.22%
2016‐17 122,762 ‐0.09%
105,963 0.66%
16,799 ‐4.55%
*Chicago used TSR codes for the first time and underreported teachers.
**TSR assignment and position codes changed significantly as did Chicago's definition of full‐time teacher.
*** TSR system replaced by EIS.
Administrator Workforce Growth
The administrator workforce peaked in 2014‐15 after a period of anomalous data reporting coinciding with the switch from TSR to EIS. Administrator workforce stood at 10,352 in 2011‐12 and declined by 33.68 percent in 2012‐13 (the first year of EIS) before recovering in 2014‐15 with 47.94 percent growth. As a result, we focus our analysis on 2015‐17.
There were 11,415 administrators employed in the State of Illinois in 2014‐15. The number of administrators employed in the state has declined since 2014‐15 by 799 (7.00 percent). (See Table 10.)
4 “Chicago” refers to the geographic region bounded by the city limits of the City of Chicago. This definition is a close approximation of City of Chicago District 299 (CPS) but it is not identical. The figures displayed here are inclusive of CPS and other educational entities located in the city.

18
Table 10: Administrator Workforce Growth Rates
State Downstate Chicago5
FT Change
FT Change
FT Change
1998‐99 8,100 2.90% 7,113 2.60% 987 5.40%
1999‐00 8,315 2.70% 7,299 2.60% 1,016 2.90%
2000‐01 8,551 2.80% 7,492 2.60% 1,059 4.20%
2001‐02* 9,411 10.10% 7,569 1.00% 1,842 73.90%
2002‐03 9,438 0.30% 7,656 1.10% 1,782 ‐3.30%
2003‐04** 10,400 10.20% 8,527 11.40% 1,873 5.10%
2004‐05 10,311 ‐0.90% 8,432 ‐1.10% 1,879 0.30%
2005‐06 10,063 ‐2.40% 8,386 ‐0.50% 1,677 ‐10.80%
2006‐07 9,659 ‐4.00% 8,596 2.50% 1,063 ‐36.60%
2007‐08 10,266 6.30% 8,750 1.80% 1,516 42.60%
2008‐09 10,558 2.80% 8,915 1.90% 1,643 8.40%
2009‐10 10,356 ‐1.90% 8,821 ‐1.10% 1,535 ‐6.60%
2010‐11 10,434 0.80% 8,668 ‐1.70% 1,766 15.00%
2011‐12 10,352 ‐0.80% 8,612 ‐0.60% 1,740 ‐1.50%
2012‐13*** 6,865 ‐33.68% 5,597 ‐35.01% 1,268 ‐27.13%
2013‐14 7,716 12.40% 6,172 10.27% 1,544 21.77%
2014‐15 11,415 47.94% 9,218 49.35% 2,197 42.29%
2015‐16 10,852 ‐4.93% 9,331 1.23% 1,521 ‐30.77%
2016‐17 10,616 ‐2.17%
9,318 ‐0.14%
1,298 ‐14.66%
*Chicago used TSR codes for the first time and underreported teachers in 2001‐02.
**TSR assignment and position codes changed significantly. The position of Coordinator was changed from OCS to Admin.
*** TSR system replaced by EIS.
5 “Chicago” refers to the geographic region bounded by the city limits of the City of Chicago. This definition is a close approximation of CPS but it is not identical. The figures displayed here are inclusive of CPS and other educational entities located in the city.

19
II. Over/Undersupply of Educators
This section presents information on the relative over‐ and undersupply of teachers and administrators in Illinois. The supply and demand of educators in Illinois is a fundamentally regional problem as supply in one part of the state is not necessarily available to meet demand in another part and vice versa. We examine unfilled position data that identifies regional shortages, i.e., where supply has not met local demand.
Regional Shortages: Unfilled Positions
ISBE collects information each year from school districts on positions not filled as of October 1. Unfilled positions are positions that were budgeted by districts for the school year, but were not filled because of a lack of qualified applicants. They are the bottom line in the supply‐demand equation because they show where supply has not met demand at the local level — regardless of the number of new teachers produced at the state level.
The number of unfilled positions increased by 137.8 FTE (8 percent) from 2015‐16 to 2016‐17. The primary driver of the increase was an increase in unfilled school service personnel staff, which increased by 51 percent from 592 in 2015‐16 to 892.4 in 2016‐17. The increase in school service personnel staff was offset by a 17 percent decrease in unfilled instructional staff positions, declining from 1,201.4 in 2015‐16 to 999.8 in 2016‐17. (See Table 11.)
Table 11: Unfilled Positions 2016‐17 and 2015‐16
2016‐17 % Change from Previous Year
2015‐16
Administrative Staff 30 130% 13 Instructional Staff 999.8 ‐17% 1,201.4 Other Certificated Staff 92.4 54% 60 School Service Personnel Staff 892.4 51% 592 Total 2,014.6 7.9% 1,866.4
Illinois public districts reported a total of 2,014.6 unfilled positions in 2016‐17, the plurality of which were
instructional positions (49.6 percent). The next largest group was school service personnel staff, which
account for 44.3 percent of the total.
The areas with the greatest number of unfilled positions in school years 2015‐16 and 2016‐17 are in Table 12.

20
Table 12: Greatest Number of Unfilled Positions 2015‐16 and 2016‐17
Staff Position Description 2016‐17 Unfilled
Positions Staff Position Description
2015‐16 Unfilled Positions
Paraprofessional 467.1 Special Ed ‐ LBS I 500.9
Special Ed ‐ LBS I 271.6 Paraprofessional 299.3
Bilingual Education 125.3 Speech/Lang. Pathologist (non‐teaching) 120.9
Speech/Lang. Pathologist (non‐teaching) 124.7 Bilingual Education 101.9
Psychologist 104.4 Elementary ‐ Standard Elementary Instructor 101.0
Unfilled positions are the bottom line in educator supply and demand because they represent the shortfall of available resources to fill open positions. But unfilled positions are a fundamentally regional problem as supply in one part of the state will not likely be able to meet demand in another part of the state. Table 13 demonstrates how unfilled positions affect different parts of the state.
Table 13: Unfilled Positions by Region
City of Chicago Northeast Northwest West Central
East Central Southwest Southeast
Total by Position
Administrative Staff
83% 13% 3% 0% 0% 0% 0% 100%
Instructional Staff 43% 19% 9% 12% 11% 3% 4% 100%
Other Certificated Staff
38% 28% 2% 19% 7% 5% 1% 100%
School Service Personnel Staff
43% 35% 9% 5% 5% 2% 1% 100%
Grand Total 43% 27% 9% 9% 8% 2% 2% 100%
In Table 13 we see that Chicago is overrepresented by unfilled positions based on student population and workforce representation. Forty‐three percent of all unfilled positions are in Chicago compared to approximately 14 percent of teacher workforce and almost 19 percent of the state student population. The regions are defined as follows:
City of Chicago: City of Chicago
Northeast: Cook County not including Chicago, McHenry, Lake, Kane, DuPage, Grundy, Kendall, Will
Northwest: Boone Winnebago, Carroll, Jo Daviess, Stephenson, DeKalb, Lee, Ogle, Whiteside, Bureau, Henry, Stark, LaSalle, Marshall, Putnam, Rock Island
West Central: Henderson, Knox, Mercer, Warren, Peoria, Mason, Tazewell, Woodford, Hancock, Fulton, Schuyler, McDonough, Menard, Sangamon, Adams, Brown, Cass, Morgan, Pike, Scott
East Central: Iroquois, Kankakee, DeWitt, Livingston, Logan, McLean, Champaign, Ford, Vermilion, Macon, Piatt, Clark, Coles, Cumberland, Douglas, Edgar, Moultrie, Shelby
Southwest: Calhoun, Greene, Jersey, Macoupin, Madison, St. Clair, Monroe, Randolph, Bond, Christian, Effingham, Fayette, Montgomery

21
Southeast: Clay, Crawford, Jasper, Lawrence, Richland, Clinton, Jefferson, Marion,
Washington, Edwards/Gallatin/Hardin/Pope/Saline/Wabash/Wayne/White
ROE, Franklin/Williamson ROE, Alexander, Jackson, Pulaski, Perry, Union
For the complete list of unfilled positions by subject area, see Appendix A.

22
III. Projections of Likely High Demand
This section presents data on the future need for educators in Illinois elementary and secondary schools. The previous section looked at the demand for educators relative to the supply of educators and indicated areas of shortage. This section presents data on the future need for educators in Illinois elementary and secondary schools irrespective of supply. Thus, high demand does not necessarily mean there is a shortage.
ISBE changed the projection methodology for areas of likely high demand for this report. Historically, the average number of new educators hired was used to determine likely demand. This year we partnered with researchers from Southern Illinois University in Edwardsville to project likely high demand for school years 2017‐18, 2018‐19, and 2019‐20 by examining historical student teacher ratios by district, grade level, and subject area.
The projections estimate the total number of FTEs needed to maintain the historical student: educator ratio. This is a new methodology, so rather than focus on the prediction of actual FT numbers, we examined the relative change from the baseline prediction. An assumption about future attrition based on historical data as well as student enrollment projections to model future demand were used to predict areas of likely high demand.
It is estimated that Illinois will need approximately 7,000 new educators a year or between 20,000 and 24,000 new educators through 2019‐20. The number needed through 2019‐20 is about 3,000 fewer per year than was forecast in the 2014 study. This is due to Illinois’ declining K‐12 enrollment. Illinois public schools will need approximately 12,000 regular teachers, approximately 2,400 paraprofessionals, and approximately 2,100 special education teachers during the next three years. It is estimated that Illinois will also need approximately 800 principals and assistant principals and approximately 600 school counselors and school social workers through 2019‐20. (See Table 14.)
Table 14: Projected Areas of Highest Need Through 2019‐20 Position Description Total Estimated FT needed through 2019‐20
Teacher 12,626
Paraprofessional 2,456
Special Education Teacher 2,146
Bilingual Education Teacher 586
Principal 510
School Counselor 342
School Social Worker 331
Assistant Principal 316
Speech Language Pathologist (non‐teaching) 301
English as a Second Language Teacher 255

23
References
Illinois State Board of Education. (2014). Educator Supply and Demand. Springfield, IL.
Illinois State Board of Education. (2001‐17). Fall Enrollment Counts. Unpublished raw data.
Springfield, IL.
Illinois State Board of Education. (2015‐17). Educator Licensure Information System.
Unpublished raw data. Springfield, IL.
Illinois State Board of Education. (2013‐17). Educator Information System. Unpublished raw data.
Springfield, IL.
Illinois State Board of Education. (2016‐17). Unfilled Positions Survey. Unpublished raw data.
Springfield, IL.

24
Definitions of Terms
Supply Endorsements: A credential on a certificate indicating the educator has met the minimum
requirements for that assignment. These counts may be duplicates as one person can hold an unlimited number of certificates or endorsements.
New Supply: The number of newly certified individuals in a fiscal year (July 1 through June 30).
Pipeline: A source of future educator supply consisting of students enrolled in professional preparation programs in Illinois and current program completers who have not yet received certification.
Program Completer: In Illinois, a person who has met all the requirements of a state‐approved teacher preparation program. Program requirements vary widely between certificates and between endorsement areas.
Supply Capture: Supply capture, as defined for this report, represents the percentage of students completing an educator preparation program (completers) who are then licensed in the State of Illinois. It is defined as “entitlement licenses/completers.”
Demand Attrition: An educator who was employed in Illinois in one year, but leaves the
following year. Educator: For the purposes of this study, educators are personnel employed in Illinois
public schools in one of the following four categories: administrators, teachers, school service personnel, or other certified staff.
Full‐Time: An indicator of educator status defined by two EIS fields: Months Employed and Full‐Time Equivalent (FTE). The definition for full‐time status is {Months Employed > 8 and FTE > 99%}
First Time: A newly hired educator with one year or less of experience. This status is calculated by summing two fields in EIS, InStateExp (in‐state experience) and DecOutOfStateExp (out‐of‐state experience). The definition is {experience is less than or equal to one year}.
Re‐entry: A newly hired educator who has more than one year of teaching experience, but was not employed in an Illinois public school the prior year.
Retention: An educator who was employed in both the previous and current year. In order to reduce confusion, both part‐time and full‐time personnel are included in the calculation, e.g., a part‐timer could be retained the next year as a full‐timer.
Unfilled Position: Number of budgeted positions (in full‐time equivalent) reported unfilled as of October 1 by each Illinois public school district on the Unfilled Positions Survey.

25
Appendix A: Unfilled Positions 2015‐16 and 2016‐17 in Detail
Appendix A1: Unfilled Positions 2016‐17
Position Descriptions Sum of Unfilled Positions FT
Paraprofessional 467.1
Special Ed ‐ LBS I 271.6
Bilingual Education 125.3
Speech/Lang. Pathologist (non‐teaching) 124.7
Psychologist 104.4
Nurse 95.4
Elementary ‐ Standard Elementary Instructor 79
Special Ed ‐ Other 49.7
Social Worker 46.4
Foreign Language ‐ Spanish 37.8
Science ‐ General 34.4
Art 31.9
z‐ Other Professional Staff (not listed) 26.4
Elementary ‐ Physical Education (K‐8) 26
Math ‐ Basic/General 24.4
English ‐ Language Arts 24.3
English as a Second Language 24.3
Special Ed ‐ Hearing Impairment 20.4
Occupational Therapist 18.5
Special Ed ‐ Speech & Lang. Teacher 17.4
z‐ Other Certificated Staff (not listed) 17
Guidance Counselor 16
Special Ed ‐ Bilingual 14
Science ‐ Biology 13.2
Special Ed ‐ LBS II 13
At Risk (Pre‐K) 12.5
Voc Tech ‐ Family & Consumer Sciences 12.2
Instructional Coach 12
Librarian/Media Specialist 11.5
Music 11.4
Interpreter for the Deaf 10.8
Science ‐ Other 10.6
Reading Specialist 10
Foreign Language ‐ Other 9.5
Mathematics 9
Physical Education 8.8

26
Social Science 8.5
Career and Technical Educator 8.1
Elementary ‐ Music (K‐8) 8
Math ‐ Other 7
Physical Education (9‐12) 7
Principal ‐ Elementary 7
Physical Therapist 6.5
Speech/Language Paraprofessional 6.4
Voc Tech ‐ Industrial Occupations 6.2
Computer Literacy/Technology 6
Math ‐ Algebra 6
z‐Other Administrator (not listed) 6
Voc Tech ‐ Business, Marketing, Management 5.7
Music ‐ Vocal 5.4
Science ‐ Chemistry 5.1
Chicago Citywide Resource Teacher (CPS) 5
Voc Tech ‐ Health Occupations 4.8
Director 4
English ‐ English 4
Science ‐ Physics 4
Intern Social Worker 3.6
Administrator in a Bilingual Education Program 3.5
Principal ‐ Assistant Elementary 3.5
Coordinator 3
Principal ‐ High School 3
z‐Other Subject or Program Area Not Listed 3
Health Education 2.7
English ‐ Other 2.6
Voc Tech ‐ Agriculture 2.5
English ‐ Reading 2
Gifted Education 2
Intern Psychologist 2
Math ‐ Geometry 2
Principal ‐ Assistant High School 2
Voc Tech ‐ Misc. 2
Vocational Coordinator 1.6
Driver Education 1.5
Adult Education 1
Business Manager 1
Computer Programming 1
Head Teacher 1
Music ‐ Instrumental 1
Resource Teacher Elementary 1
Resource Teacher Foreign Language (6‐12) 1
Resource Teacher Math 1

27
Resource Teacher Reading (6‐12) 1
Title I ‐ Remedial Reading 1
Technology Specialist 0.5
Grand Total 2,014.6
Appendix A2: Unfilled Positions 2015‐16
Position Descriptions Sum of Unfilled Positions FT
Special Ed ‐ LBS I 500.9
Paraprofessional 299.3
Speech/Lang. Pathologist (non‐teaching) 120.9
Bilingual Education 101.9
Elementary ‐ Standard Elementary Instructor 101
Psychologist 72.4
Nurse 46.8
Foreign Language ‐ Spanish 36.3
Social Worker 33
Math ‐ Basic/General 32
Elementary ‐ Physical Education (K‐8) 28.1
Science ‐ General 26.5
Special Ed ‐ Speech & Lang. Teacher 25.5
Special Ed ‐ Other 24.1
Computer Literacy/Technology 20.8
Social Science 19.8
English ‐ English 19.7
Art 19.3
Special Ed ‐ Bilingual 19
At Risk (Pre‐K) 18
z‐ Other Certificated Staff (not listed) 17.5
Foreign Language ‐ Other 17.4
English as a Second Language 17.1
z‐ Other Professional Staff (not listed) 15.6
Elementary ‐ Music (K‐8) 15.5
English ‐ Language Arts 13.3
Librarian/Media Specialist 13
Special Ed ‐ LBS II 11.9
Special Ed ‐ Hearing Impairment 11
Occupational Therapist 10
Physical Education (9‐12) 8.9
Voc Tech ‐ Industrial Occupations 8.9
Mathematics 8
Voc Tech ‐ Family & Consumer Sciences 8
Title I ‐ Remedial Reading 6.3

28
English ‐ Reading 6
Voc Tech ‐ Business, Marketing, Management 6
Science ‐ Biology 5.8
Science ‐ Physics 5.7
Physical Education 5.5
Reading Specialist 5.5
Science ‐ Chemistry 5.5
Music ‐ Instrumental 5
Physical Therapist 5
z‐Other Subject or Program Area Not Listed 5
Math ‐ Other 4.2
Instructional Coach 4
Principal ‐ Assistant Elementary 4
Science ‐ Other 4
Music 3.7
z‐Other Administrator (not listed) 3
English ‐ Other 2.5
Learning/Resource Center 2.5
Voc Tech ‐ Misc. 2.4
Health Education 2.1
Math ‐ Algebra 2.1
Alternative Education 2
Business Manager 2
Computer Programming 2
Intern Psychologist 2
Intern Social Worker 2
Resource Teacher Elementary 2
Technology Specialist 2
Title I ‐ Remedial Math 2
Assistant Director (Special Education) 1
Bilingual Administrator 1
Driver Education 1
Interpreter for the Deaf 1
Music ‐ Vocal 1
Principal ‐ Jr. High 1
Resource Teacher Foreign Language (6‐12) 1
Resource Teacher Visual Arts, Music, Drama, Theater 1
Superintendent ‐ Other 1
Supervisor (Program or Staff) 1
Supervisor multiple Student Support Program Areas 1
Voc Tech ‐ Health Occupations 1
Math ‐ Geometry 0.7
Voc Tech ‐ Agriculture 0.5
Grand Total 1,866.4
29
Appendix B: Projected Demand for Educators
Appendix B: Projections of Likely High Demand 2018‐2020 by Position
Position Description 2018 2019 2020 Total 2018‐2020
Teacher 6,736 5,658 232 12,626
Paraprofessional 1,325 1,083 48 2,456
Special Education Teacher 1,174 980 (8) 2,146
Bilingual Education Teacher 304 246 37 586
Principal 256 215 39 510
School Counselor 214 181 (53) 342
School Social Worker 184 153 (5) 331
Assistant Principal 174 144 (2) 316
Speech Language Pathologist (non‐teaching) 165 134 2 301
English as a Second Language Teacher 123 105 27 255
Resource Teacher Elementary 109 89 28 226
Reading Teacher 109 88 25 221
Library Information Specialist 110 92 8 210
School Psychologist 108 90 (6) 191
Reading Specialist 79 65 10 155
School Nurse 76 62 3 141
General Administrator or General Supervisor 82 68 (13) 137
District Superintendent 55 47 13 116
Instructional Coach 57 47 2 106
Speech Language Pathology Teacher 35 31 16 82
Resource Teacher Other 43 35 (4) 74
Technology Specialist 36 30 4 69
Career and Technical Educator (CTE) 34 30 (6) 58
Student Dean 39 32 (14) 57
Assistant/Associate District Superintendent 30 25 (0) 56
Department Chair 43 35 (29) 48
Special Education Director 22 20 0 43
Resource Teacher Reading 20 16 6 41
Dean of Students Admin (admin endorsement held) 28 24 (13) 38
Citywide Student Support Personnel 20 16 0 36
Head of Gen Ed (Depart chair admin endorsement held) 33 27 (29) 32
Curriculum Specialist 17 14 0 31
Citywide Resource Teacher 16 13 0 29
Supervisory Dean 17 15 (4) 28

30
Special Education Supervisor 16 13 (2) 28
Chief School Business Official 14 12 (2) 24
Resource Teacher Math 13 11 (4) 20
Assistant Special Education Director 11 9 (2) 17
Resource Teacher English/Language Arts 13 11 (9) 16
Bilingual Special Education Teacher 9 7 (1) 15
Sign Language Interpreter 8 7 (1) 14
Administrator in a Bilingual Education Program 6 5 0 12
Speech/Language Paraprofessional 7 6 (1) 11
Supervisor of More Than One School Support Personnel Area 6 5 (0) 11
In‐Service Coordinator 6 5 1 11
Resource Teacher Arts(Visual Art, Music, Drama, and Theatre) 5 4 1 10
Head Teacher 4 4 1 9
Resource Teacher Foreign Language 3 2 0 5
Supervisor of One School Support Personnel Area 3 3 (1) 5
Resource Teacher Science (all sciences) 4 4 (3) 4
Citywide Administrator 2 2 0 4
Supervisor of One Field in Career and Technical Education 1 1 0 3
Vocational Coordinator 2 2 (1) 3
Director Area Voc Cent or Supervisor or More 1 field in CTE 1 1 (0) 2
Resource Teacher History 1 1 (0) 2
Ed360 District Admin 1 1 0 2
School Social Worker Intern 1 1 0 2
Resource Teacher Government/Civics/Political Science 1 1 (1) 1
Ed360 School Admin 0 0 0 1
Speech/Language Assistant 1 1 0 1
Cued Speech Interpreter 0 0 0 1
Chief Executive Officer 0 0 0 1
School Psychology Intern 0 0 (0) 0
Resource Teacher Economics 0 0 0 0
Assistant Regional Superintendent 0 0 0 0
School Counselor Intern 0 0 0 0
Speech Language Pathologist Intern 0 0 0 0
Pre‐Kindergarten Teacher 0 0 0 0
Visiting International Teacher 2 1 (3) (0)
Grand Total 12,015 10,030 287 22,331
31
Appendix C: EIS and ELIS System Changes Teacher Service Record (TSR) conversion to Educator Information System (EIS) The Teacher Service Record (TSR) was implemented as a paper data collection approximately 50 years
ago. Over time it was transitioned into a computerized flat data collection. Flat data collection systems
have operational limitations; EIS was conceived and implemented in order to take advantage of more
modern relational databases. ISBE stopped using TSR as the educator information system of record in
school year 2012‐13 and began using EIS. The initial business rules set up in EIS did not allow the
collection of teacher grade level, which prevented accurate retention calculations.
Teacher Certificate Information System (TCIS) conversion to Educator Licensure Information
System (ELIS) The transition from Teacher Certificate Information System (TCIS) to the Educator Licensure information
system (ELIS) was predicated on a statutory change, 105 ILCS 5/21B‐20, which required the endorsements
attached to educators’ licenses to replace certificates. TCIS could not satisfy the new statutory
requirements. ELIS was designed and implemented specifically to meet the new requirements that the
licensure system required.
This conversion caused educators to “exchange” their certificates for endorsements attached to their new
licenses. This report begins reviewing the new teacher licensure information beginning in 2014‐15
because most conversions had taken place by that time so it made a natural starting point.