Embed Size (px)
Citation preview
ILLINOIS INDUSTRIAL COMMISSIONFY02 ANNUAL REPORT
ROD R. BLAGOJEVICHGOVERNOR
DENNIS R. RUTHCHAIRMAN
TABLE OF CONTENTS
LETTER ................................................................................ 1
HIGHLIGHTS .................................................................... 2
MISSION STATEMENT .................................................. 2
BOARD MEMBERS ........................................................ 3
OVERVIEW OFWORKERS' COMPENSATION ...................................... 4
FINANCES ........................................................................ 5
INSURANCE .................................................................... 8
ADMINISTRATION .................................................... 10
STATISTICS ...................................................................... 13
INTERSTATE COMPARISONS .................................. 22
INDUSTRIAL COMMISSION OFFICES
100 W. Randolph #8-200 202 N.E. Madison Ave. #201 701 S. Second St.Chicago, IL 60601 Peoria, IL 61602 Springfield, IL 62704312/814-6611 309/671-3019 217/785-7087
1014 Eastport Plaza Drive 200 S. WymanCollinsville, IL 62234 Rockford, IL 61101618/346-3450 815/987-7292
Web site: www.state.il.us/agency/iic
This report was printed by the authority of the State of Illinois. 1,000 copies of this report were printed on recycled paper. June 2003.
2
HIGHLIGHTS
• Illinois workers are experiencing fewer accidents and less severe injuries. Employees benefit byavoiding the pain and uncertainty involved in injuries, while employers benefit through lowerinsurance premiums. In fact, after adjusting for inflation, the 2003 Illinois advisory rate forworkers' compensation insurance represents a 35% decrease since 1990.
• In Illinois, the workers' compensation insurance business is highly competitive. More carrierswrite workers' compensation policies in Illinois than in any other state. In addition, Illinois has asmaller residual market than most states, indicating that employers can buy insurance with relativeease.
• Since 1996, the Commission has enforced the law requiring employers to obtain workers'compensation insurance. Approximately $400,000 has been collected in fines against employersthat fail to carry workers' compensation insurance, bringing employees important protection andother employers a more fair competitive arena.
• Employers can dramatically reduce their workers' compensation costs by taking steps to preventaccidents. Costs vary more within a state than from state to state.
• Proportionately, Illinois spends less on the administration of the workers' compensation programthan nearly every other state in the country.
MISSION STATEMENT
The Industrial Commission resolves disputes that occur between injured workers and their employersregarding workers' compensation. The Commission strives to assure financial protection to injuredworkers and their dependents at a reasonable cost to employers.The Commission performs four main functions:1) Resolve disputes. The Commission strives to provide a fair, timely process by which disputed
claims may be resolved.2) Ensure compliance with the law. The Commission protects the rights of employees and
employers under the Illinois Workers' Compensation and Occupational Diseases Acts.3) Administer self-insurance. The Commission evaluates and approves eligible employers that
wish to insure themselves for their workers' compensation liabilities.4) Collect statistics. The Commission compiles information on work-related injuries and diseases.The Commission intends to accomplish these goals while looking constantly for ways to improvethe quality of service and treating the public and co-workers with respect. The success of thisorganization depends on the commitment and full participation of every member.
3
BOARD MEMBERS
We are grateful to the individuals who serve on our boards. All serve without compensation. Thechairman of the Industrial Commission also serves as chairman of each board.
COMMISSION REVIEW BOARD
The board investigates complaints made against arbitrators and commissioners. The governorappoints two public members, the senior labor and business commissioners serve by statute, and thearbitrators elect one Chicago and one Downstate arbitrator.
Robert HanafordAttorney, Robert H. Hanaford, Ltd.
Jacqueline A. KinnamanSenior Labor Commissioner
Joseph ReichartChicago Arbitrator
Douglas F. StevensonSenior Business Commissioner
Ann Marie WalshAttorney, Lord, Bissell & Brook
Ruth WhiteDownstate Arbitrator
SELF-INSURERS ADVISORY BOARD
The board reviews applications from private companies for the self-insurance privilege and makesrecommendations to the chairman. The board also ensures the continued payment of benefits toworkers of bankrupt self-insurers.
Alex G. AlexandrouDirector of Risk Management, City of Aurora
Curtis C. BeamClaims Manager, Archer Daniels Midland Co.
Margaret BlacksherePresident, Illinois State AFL-CIO
Gerald F. CooperAttorney, Scopelitis, Garvin, Light & Hanson
Andrew J. GeryolVice-President of Finance, Heinemann's, Inc.
David TaylorMgr. of Workers’ Comp. and Disability,International Truck and Engine Corp.
4
OVERVIEW OF
WORKERS' COMPENSATION
Workers' compensation laws were the first acts of social legislation passed in the United States, and theyhave always been controversial. At the beginning of the 20th century, employers feared the assumption ofliability for work-related injuries would destroy their businesses, while workers feared financial ruin fromdisabling injuries.Before the laws took effect, an injured worker seeking compensation had to file a lawsuit against his orher employer in court. At the time, the common law held that the employer had a duty to provide a safeplace to work and safe tools; to give warnings of dangers; and to provide a sufficient number ofappropriate fellow servants to perform the tasks.In court, the employee had to prove negligence. The employer could present a defense that blamed theinjured worker's contributory negligence, or attributed the injury to the negligence of a fellow servant, orargued that the employee assumed certain risks in accepting the job. The process was prolonged anduncertain, with large risks to both employee and employer.The high injury and death rates throughout the Industrial Revolution and growing dissatisfaction with thecommon law gradually led to the enactment of employer liability acts. Employers were held moreresponsible for negligence, but employees still had to file lawsuits for damages.The first workers' compensation laws originated in Germany in 1884 with a compulsory system ofaccident insurance covering all employees in manufacturing, mining, and transportation. Similar lawspassed in other European countries.In the U.S., laws were passed on a state-by-state basis. Most of the early laws covered only hazardousoccupations and were frequently challenged as unconstitutional. Maryland passed the first act in 1902,which was restricted to fatal cases. The first law of general application that withstood legal challenges wasWisconsin's act of 1911. Illinois passed its law in 1911, effective May 1, 1912. It took until 1948 for allstates to establish a workers' compensation law.Workers' compensation laws contain two tradeoffs:1. Employees gave up their right to sue and potentially win large awards in court in exchange for more
modest but prompt compensation;2. Employers gave up their common law defenses in exchange for limits on their liabilities.Workers' compensation was established as a no-fault system. The theory behind the law is that the costof work-related injuries or illnesses should be part of the cost of the product or service.Originally, the courts administered the Illinois act. The volume overwhelmed the courts, however, and onJuly 1, 1913, a three-member Industrial Board was created. In 1917, a five-member IndustrialCommission was created within the Illinois Department of Labor. In 1957, the Commission separatedfrom the Department of Labor and became a self-standing agency.Almost every employee who is hired, injured, or whose employment is localized in Illinois is covered byworkers' compensation. For the most part, benefits are paid for accidental injuries that are caused, inwhole or in part, by the employee's work. This includes the aggravation of a pre-existing condition andinjuries brought on by the repetitive use of a part of the body.Illinois employers pay for workers' compensation benefits through insurance policies or by self-insurance. Benefits are based on the worker's earnings, subject to certain limits. Cases are first heard byarbitrators, whose decisions may be appealed to commissioners. If warranted, cases may proceed on tothe circuit court, Illinois Appellate Court, and the Illinois Supreme Court. Most cases, however, are settledbetween the parties.
5
FINANCES
In FY02, Illinois was one of only a handful of states that rely entirely on General Revenue Funds for theadministration of their workers' compensation programs. Most other states fund their workers'compensation agencies through assessments on insurers and self-insured employers. Bipartisan studygroups have recommended assessments for over 30 years.According to a U.S. Department of Labor study, state agencies that are funded by assessments have,proportionately, headcounts that are twice as big and budgets over four times larger than GRF states.1We are pleased to report that, as we go to press, the legislature has just approved an independent fundingsource for the Commission.
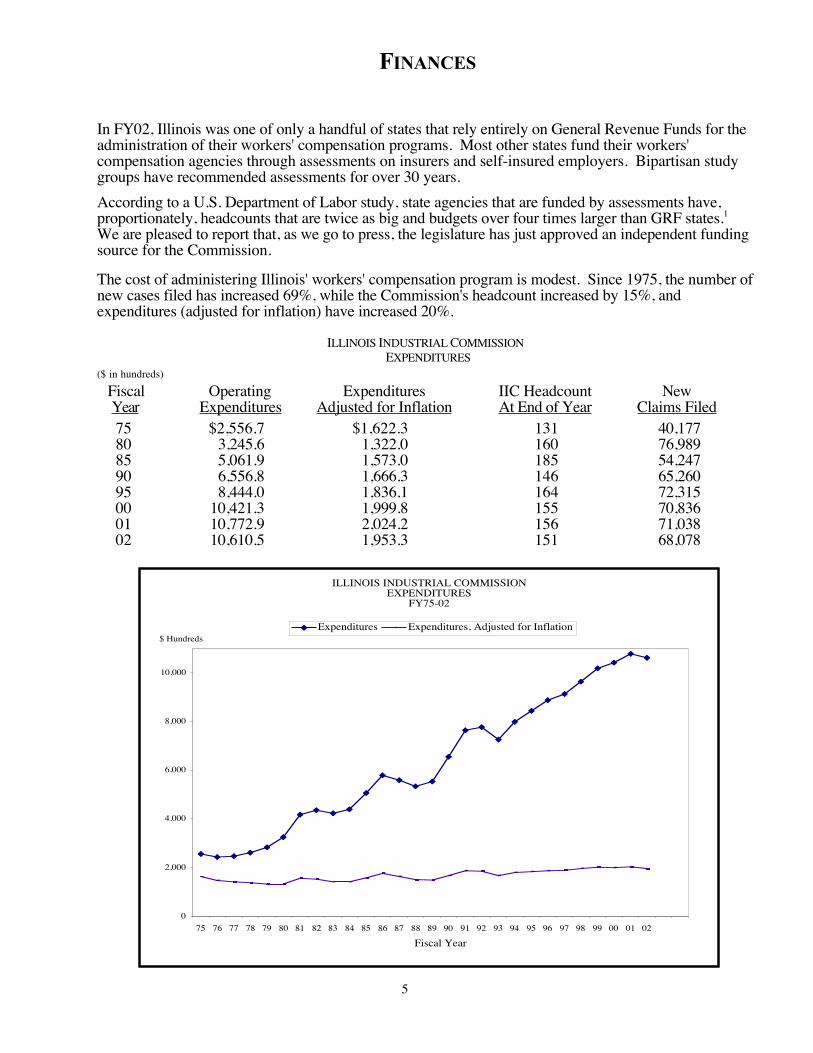
The cost of administering Illinois' workers' compensation program is modest. Since 1975, the number ofnew cases filed has increased 69%, while the Commission's headcount increased by 15%, andexpenditures (adjusted for inflation) have increased 20%.
ILLINOIS INDUSTRIAL COMMISSIONEXPENDITURES
($ in hundreds)
Fiscal Operating Expenditures IIC Headcount NewYear Expenditures Adjusted for Inflation At End of Year Claims Filed75 $2,556.7 $1,622.3 131 40,17780 3,245.6 1,322.0 160 76,98985 5,061.9 1,573.0 185 54,24790 6,556.8 1,666.3 146 65,26095 8,444.0 1,836.1 164 72,31500 10,421.3 1,999.8 155 70,83601 10,772.9 2,024.2 156 71,03802 10,610.5 1,953.3 151 68,078
ILLINOIS INDUSTRIAL COMMISSION EXPENDITURES
FY75-02
0
2,000
4,000
6,000
8,000
10,000
75 76 77 78 79 80 81 82 83 84 85 86 87 88 89 90 91 92 93 94 95 96 97 98 99 00 01 02
Fiscal Year
Expenditures Expenditures, Adjusted for Inflation$ Hundreds
6
SPECIAL FUNDS
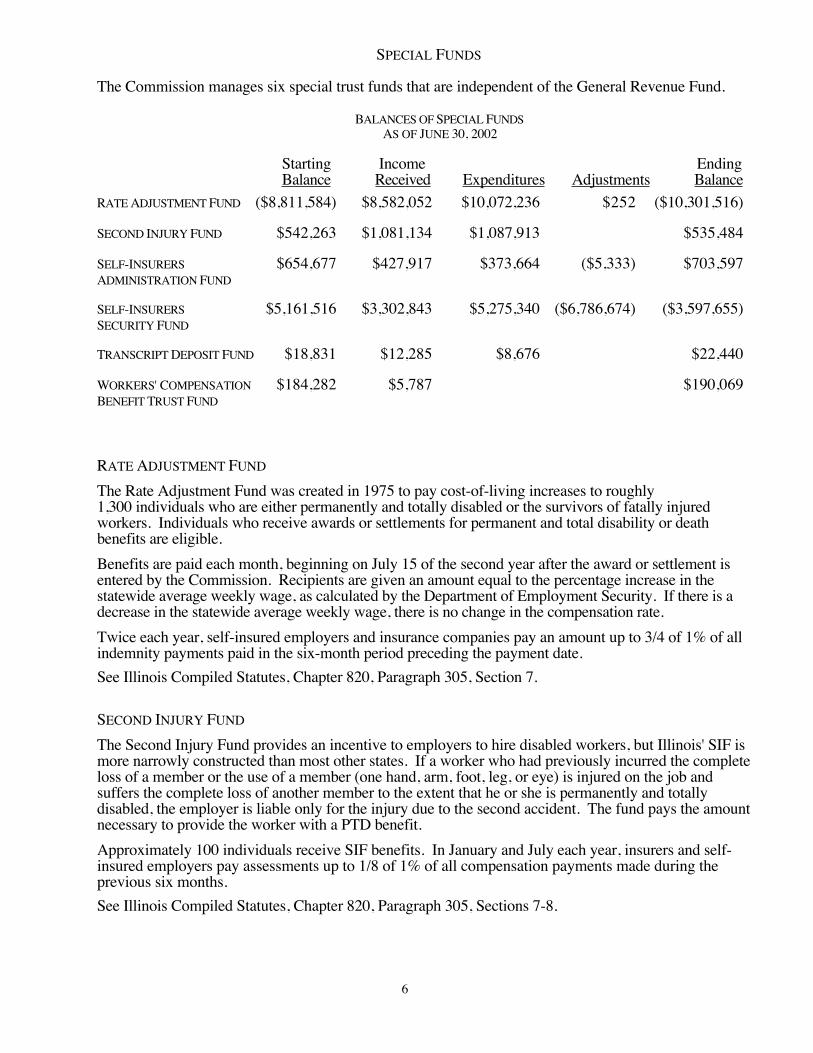
The Commission manages six special trust funds that are independent of the General Revenue Fund.
BALANCES OF SPECIAL FUNDSAS OF JUNE 30, 2002
Starting Income EndingBalance Received Expenditures Adjustments Balance
RATE ADJUSTMENT FUND ($8,811,584) $8,582,052 $10,072,236 $252 ($10,301,516)
SECOND INJURY FUND $542,263 $1,081,134 $1,087,913 $535,484
SELF-INSURERS $654,677 $427,917 $373,664 ($5,333) $703,597ADMINISTRATION FUND
SELF-INSURERS $5,161,516 $3,302,843 $5,275,340 ($6,786,674) ($3,597,655)SECURITY FUND
TRANSCRIPT DEPOSIT FUND $18,831 $12,285 $8,676 $22,440
WORKERS' COMPENSATION $184,282 $5,787 $190,069BENEFIT TRUST FUND
RATE ADJUSTMENT FUND
The Rate Adjustment Fund was created in 1975 to pay cost-of-living increases to roughly1,300 individuals who are either permanently and totally disabled or the survivors of fatally injuredworkers. Individuals who receive awards or settlements for permanent and total disability or deathbenefits are eligible.Benefits are paid each month, beginning on July 15 of the second year after the award or settlement isentered by the Commission. Recipients are given an amount equal to the percentage increase in thestatewide average weekly wage, as calculated by the Department of Employment Security. If there is adecrease in the statewide average weekly wage, there is no change in the compensation rate.Twice each year, self-insured employers and insurance companies pay an amount up to 3/4 of 1% of allindemnity payments paid in the six-month period preceding the payment date.See Illinois Compiled Statutes, Chapter 820, Paragraph 305, Section 7.
SECOND INJURY FUND
The Second Injury Fund provides an incentive to employers to hire disabled workers, but Illinois' SIF ismore narrowly constructed than most other states. If a worker who had previously incurred the completeloss of a member or the use of a member (one hand, arm, foot, leg, or eye) is injured on the job andsuffers the complete loss of another member to the extent that he or she is permanently and totallydisabled, the employer is liable only for the injury due to the second accident. The fund pays the amountnecessary to provide the worker with a PTD benefit.Approximately 100 individuals receive SIF benefits. In January and July each year, insurers and self-insured employers pay assessments up to 1/8 of 1% of all compensation payments made during theprevious six months.See Illinois Compiled Statutes, Chapter 820, Paragraph 305, Sections 7-8.
7
SELF-INSURERS ADMINISTRATION FUND
The Self-Insurers Administration Fund was created in 1988 to pay the administrative costs of theCommission's self-insurance program. Private self-insured employers pay a fee of $500 per entity whenapplying for or renewing the self-insurance privilege.See Illinois Compiled Statutes, Chapter 820, Paragraph 305, Section 4a-6.1.
SELF-INSURERS SECURITY FUND
The Self-Insurers Security Fund was created in 1986 to pay benefits to employees of private self-insurersthat became insolvent after 1986. Self-insured employers pay assessments based on their indemnitypayments, up to a maximum of 1.2% of indemnity benefits paid during the preceding year.See Illinois Compiled Statutes, Chapter 820, Paragraph 305, Section 4a-5, 6.
TRANSCRIPT DEPOSIT FUND
The Transcript Deposit Fund was created under the State Finance Act. When a case is appealed to thecircuit court, the fund receives $35 from the appealing party and pays this fee to Commission courtreporters for preparing the files.
WORKERS' COMPENSATION BENEFIT TRUST FUND
Created under the State Finance Act, the Workers' Compensation Benefit Trust Fund pays benefits toemployees of private self-insurers that became insolvent before 1986. Benefits are paid from securitiesposted by the self-insurers; any unused funds are then returned to the insolvent estate.
8
INSURANCE
Employers are responsible for the payment of benefits to injured workers; they must either purchaseinsurance or obtain the Commission's approval to self-insure.
INSURANCE
The workers' compensation insurance business in Illinois is healthy and highly competitive. Moreinsurance companies sell workers' compensation policies in Illinois than in any other state.2
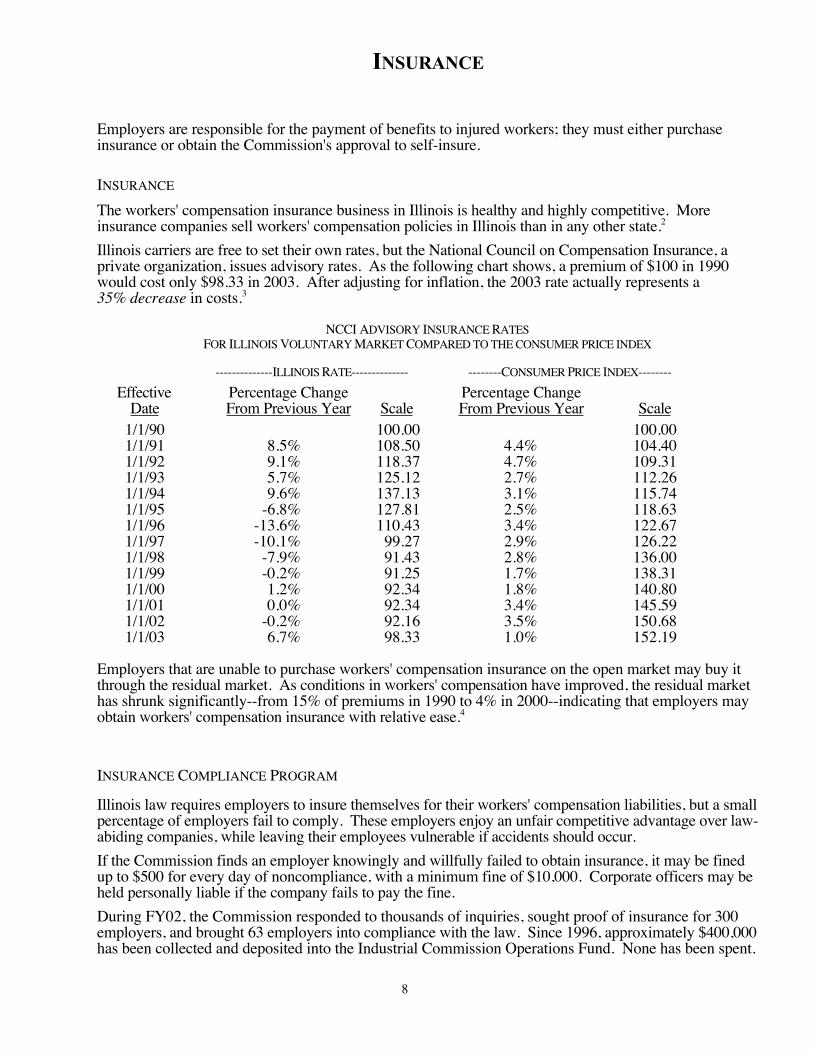
Illinois carriers are free to set their own rates, but the National Council on Compensation Insurance, aprivate organization, issues advisory rates. As the following chart shows, a premium of $100 in 1990would cost only $98.33 in 2003. After adjusting for inflation, the 2003 rate actually represents a35% decrease in costs.3
NCCI ADVISORY INSURANCE RATESFOR ILLINOIS VOLUNTARY MARKET COMPARED TO THE CONSUMER PRICE INDEX
--------------ILLINOIS RATE-------------- --------CONSUMER PRICE INDEX--------Effective Percentage Change Percentage Change
Date From Previous Year Scale From Previous Year Scale1/1/90 100.00 100.001/1/91 8.5% 108.50 4.4% 104.401/1/92 9.1% 118.37 4.7% 109.311/1/93 5.7% 125.12 2.7% 112.261/1/94 9.6% 137.13 3.1% 115.741/1/95 -6.8% 127.81 2.5% 118.631/1/96 -13.6% 110.43 3.4% 122.671/1/97 -10.1% 99.27 2.9% 126.221/1/98 -7.9% 91.43 2.8% 136.001/1/99 -0.2% 91.25 1.7% 138.311/1/00 1.2% 92.34 1.8% 140.801/1/01 0.0% 92.34 3.4% 145.591/1/02 -0.2% 92.16 3.5% 150.681/1/03 6.7% 98.33 1.0% 152.19
Employers that are unable to purchase workers' compensation insurance on the open market may buy itthrough the residual market. As conditions in workers' compensation have improved, the residual markethas shrunk significantly--from 15% of premiums in 1990 to 4% in 2000--indicating that employers mayobtain workers' compensation insurance with relative ease.4
INSURANCE COMPLIANCE PROGRAM
Illinois law requires employers to insure themselves for their workers' compensation liabilities, but a smallpercentage of employers fail to comply. These employers enjoy an unfair competitive advantage over law-abiding companies, while leaving their employees vulnerable if accidents should occur.If the Commission finds an employer knowingly and willfully failed to obtain insurance, it may be finedup to $500 for every day of noncompliance, with a minimum fine of $10,000. Corporate officers may beheld personally liable if the company fails to pay the fine.During FY02, the Commission responded to thousands of inquiries, sought proof of insurance for 300employers, and brought 63 employers into compliance with the law. Since 1996, approximately $400,000has been collected and deposited into the Industrial Commission Operations Fund. None has been spent.
9
BALANCE BILLING
By law, employers are responsible for the payment of all medical services reasonably necessary to cure orrelieve the injured worker from the effects of the injury. In some cases, however, the medical provider orinsurer will try to get the injured worker to pay any unpaid balances of medical bills. Workers may bepursued by collection agencies, and their credit records may be damaged, for bills that were never theirresponsibility.
SELF-INSURANCE
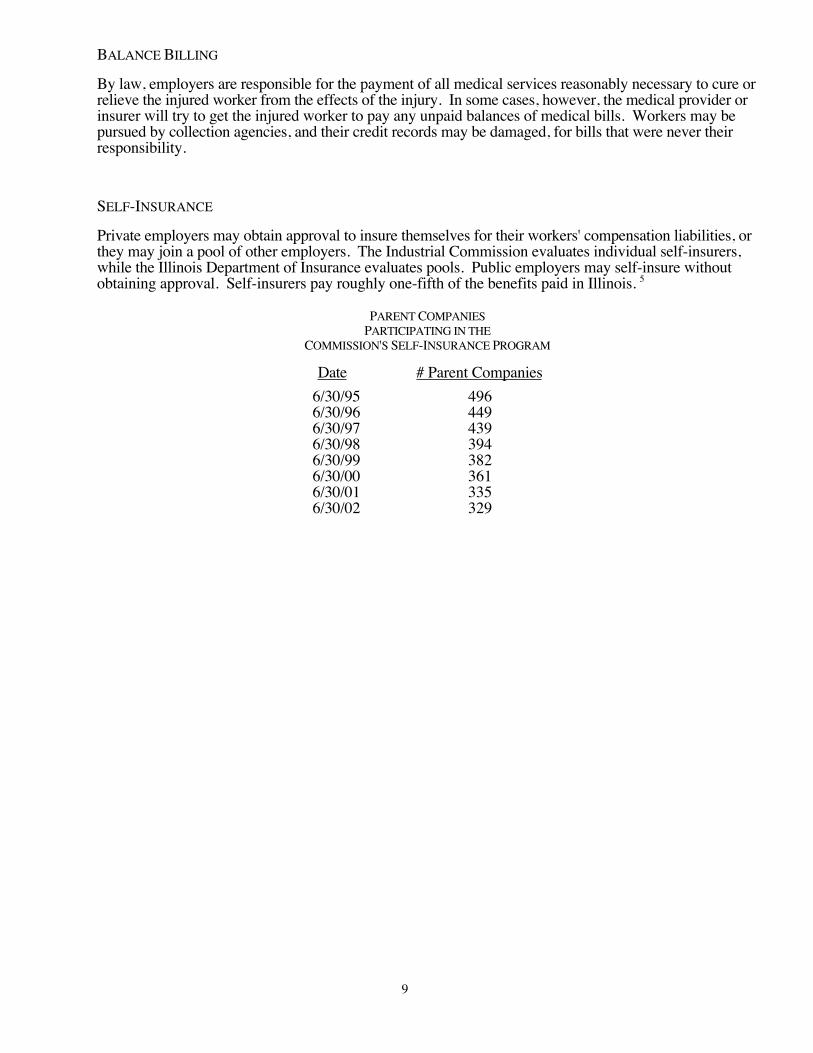
Private employers may obtain approval to insure themselves for their workers' compensation liabilities, orthey may join a pool of other employers. The Industrial Commission evaluates individual self-insurers,while the Illinois Department of Insurance evaluates pools. Public employers may self-insure withoutobtaining approval. Self-insurers pay roughly one-fifth of the benefits paid in Illinois. 5
PARENT COMPANIESPARTICIPATING IN THE
COMMISSION'S SELF-INSURANCE PROGRAM
Date # Parent Companies6/30/95 4966/30/96 4496/30/97 4396/30/98 3946/30/99 3826/30/00 3616/30/01 3356/30/02 329
10
ADMINISTRATION
ADMINISTRATIVE ACCOMPLISHMENTS
• The Commission has taken a number of steps to move cases through its system more quickly:
• Parties present and ready for trial are given priority over all other matters.
• Special "Settlement Days" are held for participants to resolve issues in an informal environment.
• Each day, a Chicago arbitrator is on call to promptly review "Settlement Day" contracts and contractsinvolving claimants without attorneys.
• Since 1989, the number of cases pending on the commissioner level has fallen 75%.
• People now have better access to Commission information than ever before.
• The Commission's Web site contains the act, rules, forms, handbook, rates, calendars, call sheets, andother important information.
• The act and rules were reprinted and widely distributed, and are updated regularly.
• Each year, the Commission sends out over 150,000 handbooks that explain the rights andresponsibilities of workers and employers under the program. Upon receipt of an accident report, wesend a handbook to the injured worker. Thanks to improvements we have made in our processing,handbooks are getting out in half the time it used to take.
• Each year, hundreds of people come to the Commission for educational programs, we send speakersout upon request, and we answer 100,000 phone calls and letters.
• Since 1996, the Commission has taken steps to see that all employers have workers' compensationinsurance, as required by law. So far, the Commission has collected approximately $400,000 in finesagainst noncomplying employers, bringing workers the proper legal protection and other employers amore fair competitive environment.
ORGANIZATIONAL STRUCTURE
At the end of FY02, the Industrial Commission consisted of the chairman, six commissioners,151 regular employees, and eight employees in the separately-funded Self-Insurance Division, for a totalof 166 people.
CHAIRMAN'S OFFICEDennis R. Ruth, Chairman Headcount: 3Working in the Chairman's Office are Linda Freeman, administrative assistant; Kathryn Kelley, legalcounsel; and Dirk May, legislative liaison.
FISCAL OFFICECharles Kusar, Manager Headcount: 9The unit maintains the Commission's budget, manages the appropriations process, administers theCommission's seven trust funds, and handles payroll and purchasing.
11
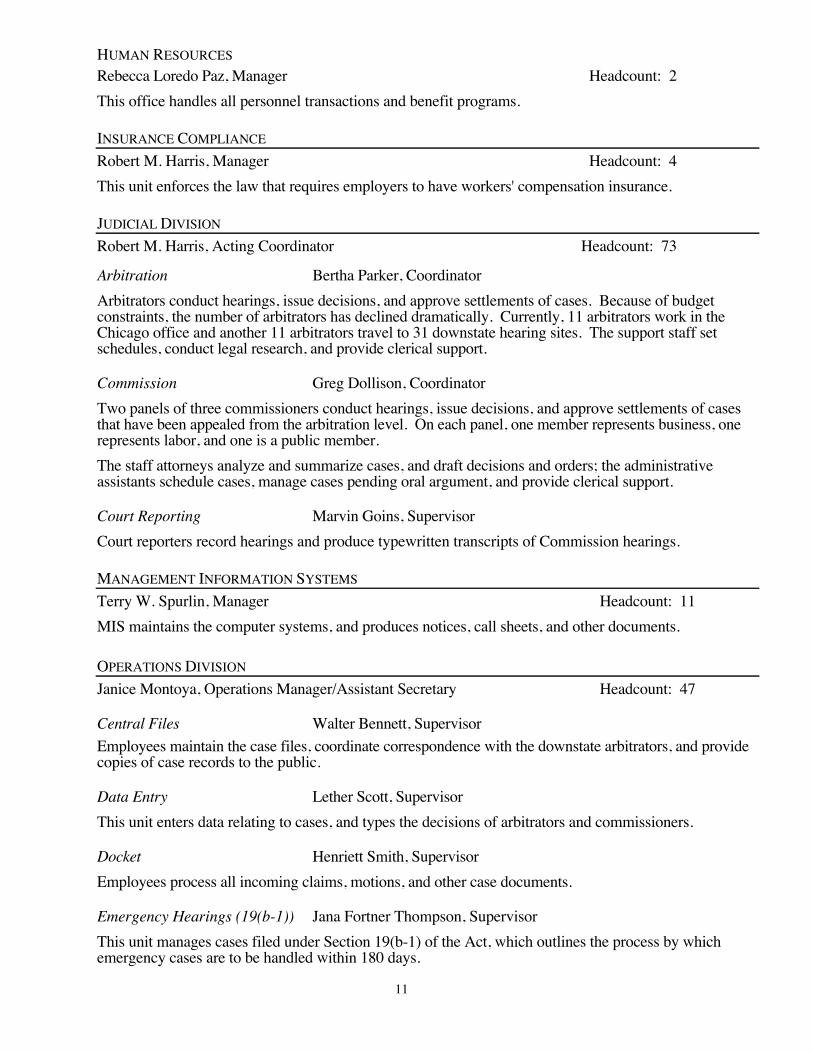
HUMAN RESOURCESRebecca Loredo Paz, Manager Headcount: 2This office handles all personnel transactions and benefit programs.
INSURANCE COMPLIANCERobert M. Harris, Manager Headcount: 4This unit enforces the law that requires employers to have workers' compensation insurance.
JUDICIAL DIVISIONRobert M. Harris, Acting Coordinator Headcount: 73
Arbitration Bertha Parker, CoordinatorArbitrators conduct hearings, issue decisions, and approve settlements of cases. Because of budgetconstraints, the number of arbitrators has declined dramatically. Currently, 11 arbitrators work in theChicago office and another 11 arbitrators travel to 31 downstate hearing sites. The support staff setschedules, conduct legal research, and provide clerical support.
Commission Greg Dollison, CoordinatorTwo panels of three commissioners conduct hearings, issue decisions, and approve settlements of casesthat have been appealed from the arbitration level. On each panel, one member represents business, onerepresents labor, and one is a public member.The staff attorneys analyze and summarize cases, and draft decisions and orders; the administrativeassistants schedule cases, manage cases pending oral argument, and provide clerical support.
Court Reporting Marvin Goins, SupervisorCourt reporters record hearings and produce typewritten transcripts of Commission hearings.
MANAGEMENT INFORMATION SYSTEMSTerry W. Spurlin, Manager Headcount: 11MIS maintains the computer systems, and produces notices, call sheets, and other documents.
OPERATIONS DIVISIONJanice Montoya, Operations Manager/Assistant Secretary Headcount: 47
Central Files Walter Bennett, SupervisorEmployees maintain the case files, coordinate correspondence with the downstate arbitrators, and providecopies of case records to the public.
Data Entry Lether Scott, SupervisorThis unit enters data relating to cases, and types the decisions of arbitrators and commissioners.
Docket Henriett Smith, SupervisorEmployees process all incoming claims, motions, and other case documents.
Emergency Hearings (19(b-1)) Jana Fortner Thompson, SupervisorThis unit manages cases filed under Section 19(b-1) of the Act, which outlines the process by whichemergency cases are to be handled within 180 days.
12
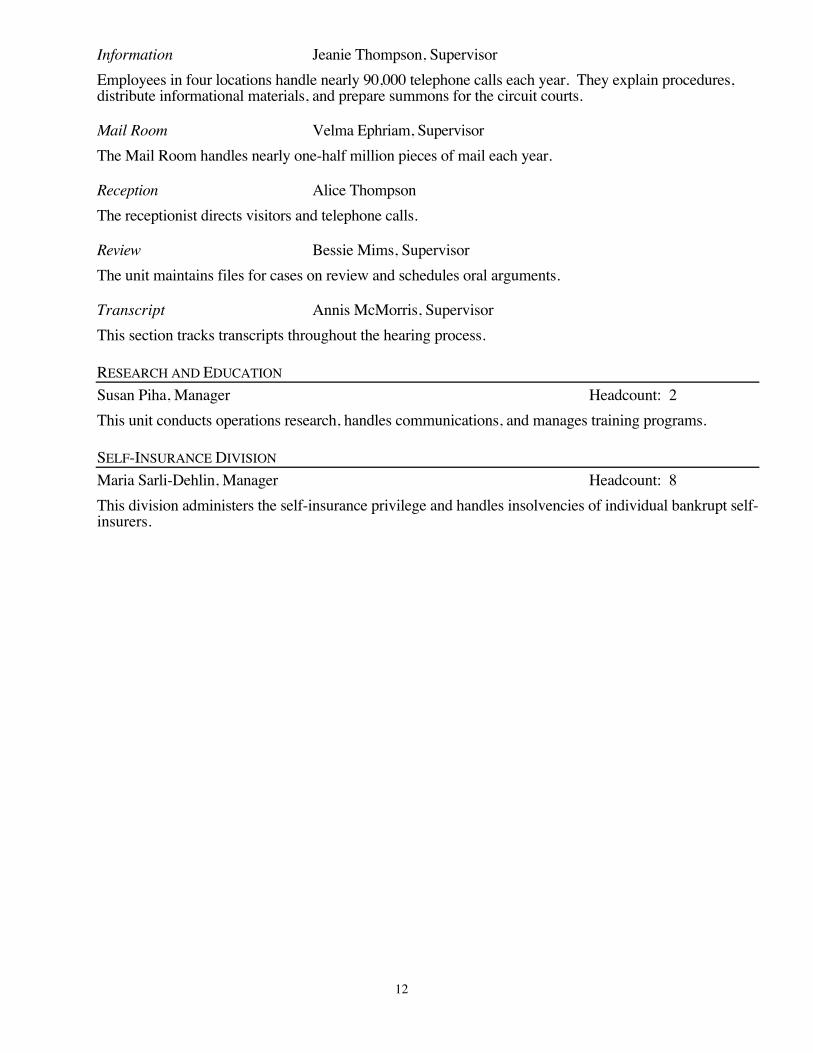
Information Jeanie Thompson, SupervisorEmployees in four locations handle nearly 90,000 telephone calls each year. They explain procedures,distribute informational materials, and prepare summons for the circuit courts.
Mail Room Velma Ephriam, SupervisorThe Mail Room handles nearly one-half million pieces of mail each year.
Reception Alice ThompsonThe receptionist directs visitors and telephone calls.
Review Bessie Mims, SupervisorThe unit maintains files for cases on review and schedules oral arguments.
Transcript Annis McMorris, SupervisorThis section tracks transcripts throughout the hearing process.
RESEARCH AND EDUCATIONSusan Piha, Manager Headcount: 2This unit conducts operations research, handles communications, and manages training programs.
SELF-INSURANCE DIVISIONMaria Sarli-Dehlin, Manager Headcount: 8This division administers the self-insurance privilege and handles insolvencies of individual bankrupt self-insurers.
13
STATISTICS
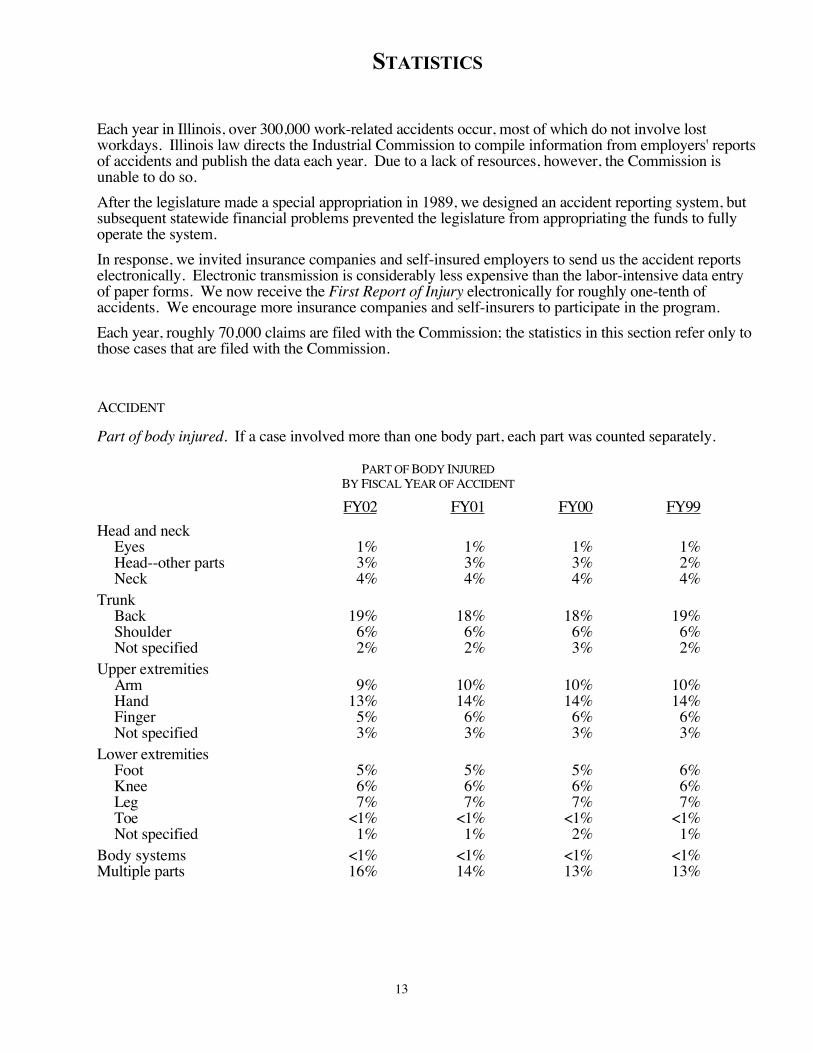
Each year in Illinois, over 300,000 work-related accidents occur, most of which do not involve lostworkdays. Illinois law directs the Industrial Commission to compile information from employers' reportsof accidents and publish the data each year. Due to a lack of resources, however, the Commission isunable to do so.After the legislature made a special appropriation in 1989, we designed an accident reporting system, butsubsequent statewide financial problems prevented the legislature from appropriating the funds to fullyoperate the system.In response, we invited insurance companies and self-insured employers to send us the accident reportselectronically. Electronic transmission is considerably less expensive than the labor-intensive data entryof paper forms. We now receive the First Report of Injury electronically for roughly one-tenth ofaccidents. We encourage more insurance companies and self-insurers to participate in the program.Each year, roughly 70,000 claims are filed with the Commission; the statistics in this section refer only tothose cases that are filed with the Commission.
ACCIDENT
Part of body injured. If a case involved more than one body part, each part was counted separately.
PART OF BODY INJUREDBY FISCAL YEAR OF ACCIDENT
FY02 FY01 FY00 FY99Head and neck
Eyes 1% 1% 1% 1%Head--other parts 3% 3% 3% 2%Neck 4% 4% 4% 4%
TrunkBack 19% 18% 18% 19%Shoulder 6% 6% 6% 6%Not specified 2% 2% 3% 2%
Upper extremitiesArm 9% 10% 10% 10%Hand 13% 14% 14% 14%Finger 5% 6% 6% 6%Not specified 3% 3% 3% 3%
Lower extremitiesFoot 5% 5% 5% 6%Knee 6% 6% 6% 6%Leg 7% 7% 7% 7%Toe <1% <1% <1% <1%Not specified 1% 1% 2% 1%
Body systems <1% <1% <1% <1%Multiple parts 16% 14% 13% 13%

14
Location of accident. Cases are assigned to the hearing site nearest the site of the accident. If theaccident occurred outside of Illinois, the case is assigned to the hearing site closest to the petitioner'shome; if the petitioner lives outside of Illinois, the case is set at the site most convenient to the parties.The following table groups the 1,200 cities and towns in Illinois by the 32 hearing sites to which theclaims were assigned, and indicates where accidents occur.
LOCATION BY FISCAL YEAR OF ACCIDENT
Hearing Site* FY02 FY01 FY00 FY991. Belleville 3% 2% 3% 3%2. Bloomington 2% 3% 3% 3%3. Carlinville 1% 1% 1% 1%4. Carlyle 1% 1% 1% 1%5. Chicago 44% 42% 42% 42%6. Clinton <1% <1% <1% <1%7. Collinsville 3% 3% 3% 3%8. Danville 1% 1% 1% 1%9. Decatur 1% 2% 2% 2%10. De Kalb 1% 1% 1% 1%11. Galesburg 1% 1% 1% 1%12. Geneva 4% 4% 4% 4%13. Herrin 1% 2% 1% 1%14. Jacksonville 1% 1% 1% 1%15. Joliet 4% 4% 4% 4%16. Kankakee 1% 1% 1% 1%17. Lawrenceville <1% 1% 1% 1%18. Mattoon 2% 2% 2% 2%19. Mt. Vernon 1% 1% 1% 1%20. Ottawa 1% 1% 1% 1%21. Peoria 4% 4% 4% 4%22. Quincy 1% 1% 1% 1%23. Rock Falls 1% 1% 1% 1%24. Rock Island 1% 1% 1% 1%25. Rockford 4% 4% 4% 4%26. Springfield 2% 2% 2% 2%27. Taylorville <1% <1% <1% <1%28. Urbana 1% 2% 1% 1%29. Waukegan 4% 4% 4% 4%30. Wheaton 6% 6% 6% 6%31. Whittington 2% 2% 2% 2%32. Woodstock 1% 2% 2% 1%* Cases that were formerly heard in Alton and Granite City now go to Collinsville. The Galva hearing site was eliminated and its casesredistributed among several other sites.
ATTORNEY INVOLVEMENT
Most employees and employers who have workers' compensation cases on file with the Commissionretain legal counsel, and the vast majority of cases going to trial involve attorneys. If the employee obtainsa lawyer, Illinois law governs the relationship. Generally, the attorney's fee is limited to 20% of theamount recovered, unless the Commission authorizes additional fees.
CASES IN WHICH PETITIONER HAS AN ATTORNEY
FY02 FY01 FY00 FY99 FY98 FY97 FY96Cases filed during FY 83% 83% 84% 83% 84% 84% 85%Original settlements OK’d 6% 6% 7% 8% 8% 9% 12%
15
AVERAGE WEEKLY WAGE
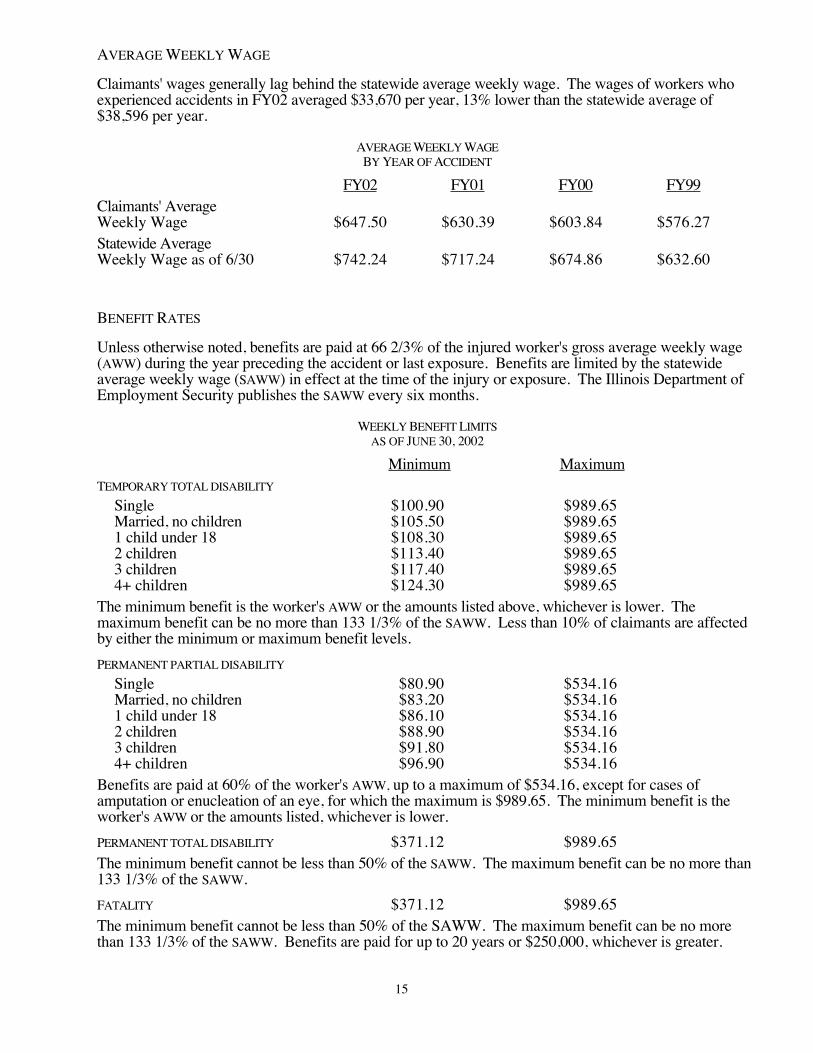
Claimants' wages generally lag behind the statewide average weekly wage. The wages of workers whoexperienced accidents in FY02 averaged $33,670 per year, 13% lower than the statewide average of$38,596 per year.
AVERAGE WEEKLY WAGEBY YEAR OF ACCIDENT
FY02 FY01 FY00 FY99Claimants' AverageWeekly Wage $647.50 $630.39 $603.84 $576.27Statewide AverageWeekly Wage as of 6/30 $742.24 $717.24 $674.86 $632.60
BENEFIT RATES
Unless otherwise noted, benefits are paid at 66 2/3% of the injured worker's gross average weekly wage(AWW) during the year preceding the accident or last exposure. Benefits are limited by the statewideaverage weekly wage (SAWW) in effect at the time of the injury or exposure. The Illinois Department ofEmployment Security publishes the SAWW every six months.
WEEKLY BENEFIT LIMITSAS OF JUNE 30, 2002
Minimum MaximumTEMPORARY TOTAL DISABILITY
Single $100.90 $989.65Married, no children $105.50 $989.651 child under 18 $108.30 $989.652 children $113.40 $989.653 children $117.40 $989.654+ children $124.30 $989.65
The minimum benefit is the worker's AWW or the amounts listed above, whichever is lower. Themaximum benefit can be no more than 133 1/3% of the SAWW. Less than 10% of claimants are affectedby either the minimum or maximum benefit levels.PERMANENT PARTIAL DISABILITY
Single $80.90 $534.16Married, no children $83.20 $534.161 child under 18 $86.10 $534.162 children $88.90 $534.163 children $91.80 $534.164+ children $96.90 $534.16
Benefits are paid at 60% of the worker's AWW, up to a maximum of $534.16, except for cases ofamputation or enucleation of an eye, for which the maximum is $989.65. The minimum benefit is theworker's AWW or the amounts listed, whichever is lower.PERMANENT TOTAL DISABILITY $371.12 $989.65The minimum benefit cannot be less than 50% of the SAWW. The maximum benefit can be no more than133 1/3% of the SAWW.FATALITY $371.12 $989.65The minimum benefit cannot be less than 50% of the SAWW. The maximum benefit can be no morethan 133 1/3% of the SAWW. Benefits are paid for up to 20 years or $250,000, whichever is greater.
16
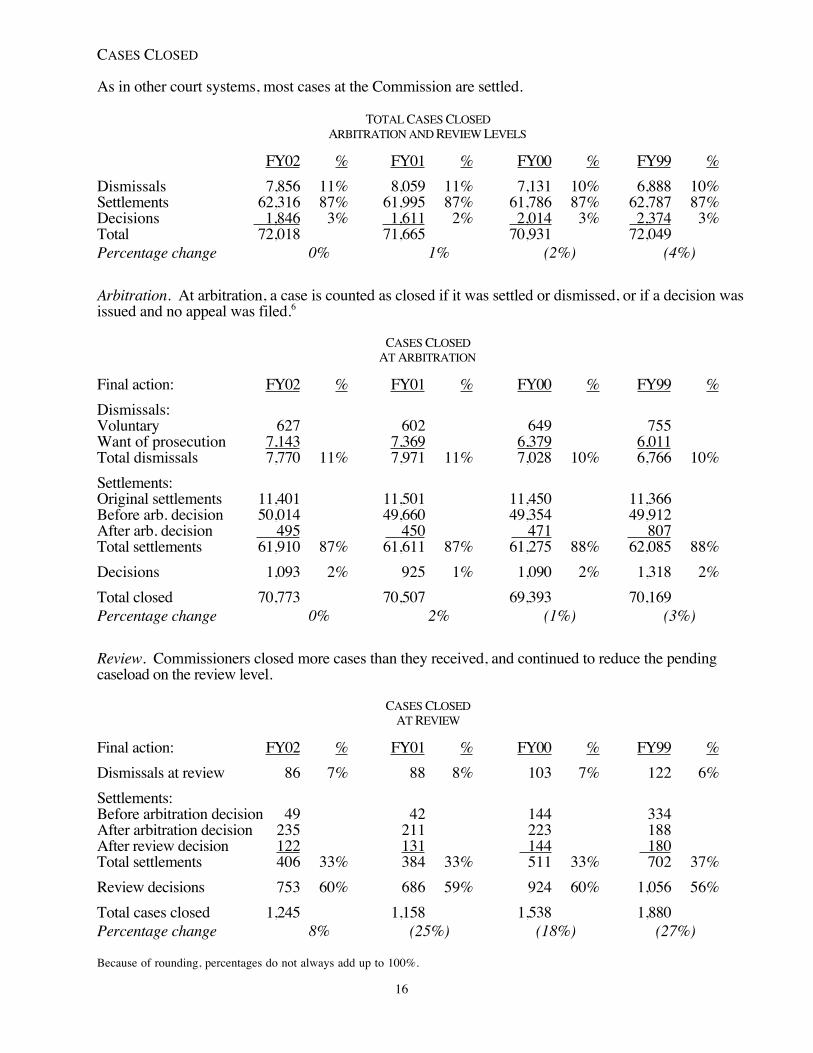
CASES CLOSED
As in other court systems, most cases at the Commission are settled.
TOTAL CASES CLOSEDARBITRATION AND REVIEW LEVELS
FY02 % FY01 % FY00 % FY99 %Dismissals 7,856 11% 8,059 11% 7,131 10% 6,888 10%Settlements 62,316 87% 61,995 87% 61,786 87% 62,787 87%Decisions 1,846 3% 1,611 2% 2,014 3% 2,374 3%Total 72,018 71,665 70,931 72,049Percentage change 0% 1% (2%) (4%)
Arbitration. At arbitration, a case is counted as closed if it was settled or dismissed, or if a decision wasissued and no appeal was filed.6
CASES CLOSEDAT ARBITRATION
Final action: FY02 % FY01 % FY00 % FY99 %Dismissals:Voluntary 627 602 649 755Want of prosecution 7,143 7,369 6,379 6,011Total dismissals 7,770 11% 7,971 11% 7,028 10% 6,766 10%Settlements:Original settlements 11,401 11,501 11,450 11,366Before arb. decision 50,014 49,660 49,354 49,912After arb. decision 495 450 471 807Total settlements 61,910 87% 61,611 87% 61,275 88% 62,085 88%Decisions 1,093 2% 925 1% 1,090 2% 1,318 2%Total closed 70,773 70,507 69,393 70,169Percentage change 0% 2% (1%) (3%)
Review. Commissioners closed more cases than they received, and continued to reduce the pendingcaseload on the review level.
CASES CLOSEDAT REVIEW
Final action: FY02 % FY01 % FY00 % FY99 %Dismissals at review 86 7% 88 8% 103 7% 122 6%Settlements:Before arbitration decision 49 42 144 334After arbitration decision 235 211 223 188After review decision 122 131 144 180Total settlements 406 33% 384 33% 511 33% 702 37%Review decisions 753 60% 686 59% 924 60% 1,056 56%Total cases closed 1,245 1,158 1,538 1,880Percentage change 8% (25%) (18%) (27%)
Because of rounding, percentages do not always add up to 100%.
17
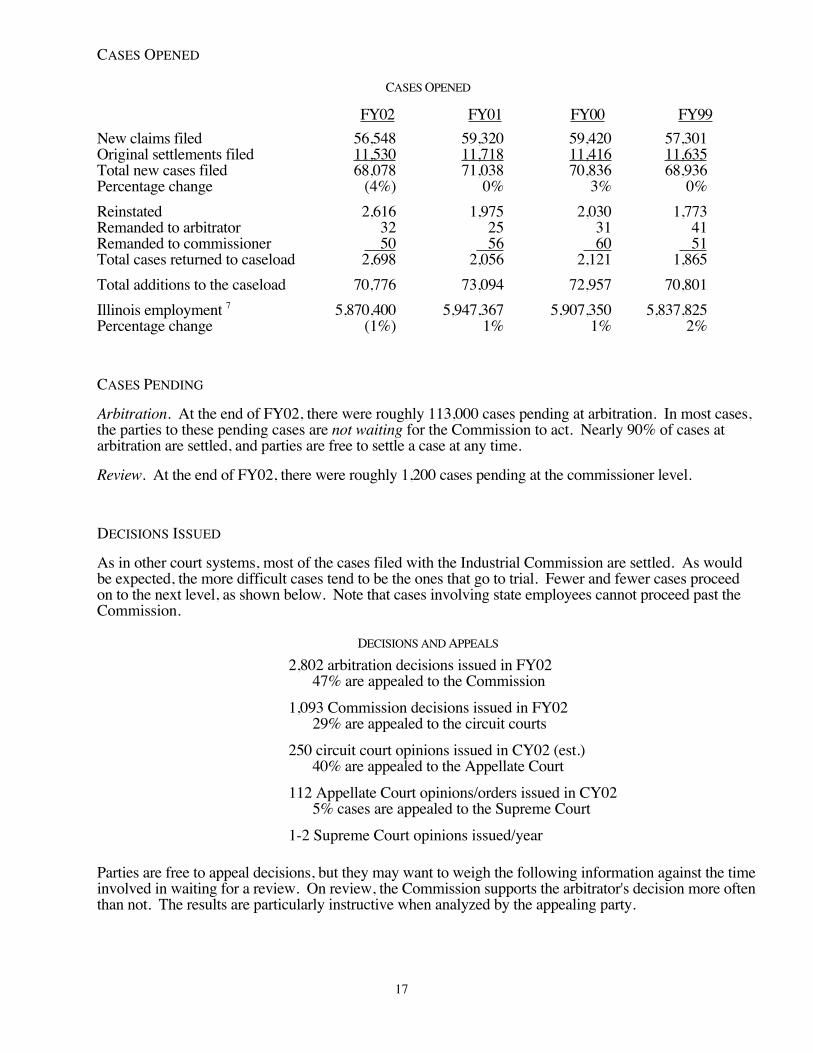
CASES OPENED
CASES OPENED
FY02 FY01 FY00 FY99New claims filed 56,548 59,320 59,420 57,301Original settlements filed 11,530 11,718 11,416 11,635Total new cases filed 68,078 71,038 70,836 68,936Percentage change (4%) 0% 3% 0%Reinstated 2,616 1,975 2,030 1,773Remanded to arbitrator 32 25 31 41Remanded to commissioner 50 56 60 51Total cases returned to caseload 2,698 2,056 2,121 1,865Total additions to the caseload 70,776 73,094 72,957 70,801Illinois employment 7 5,870,400 5,947,367 5,907,350 5,837,825Percentage change (1%) 1% 1% 2%
CASES PENDING
Arbitration. At the end of FY02, there were roughly 113,000 cases pending at arbitration. In most cases,the parties to these pending cases are not waiting for the Commission to act. Nearly 90% of cases atarbitration are settled, and parties are free to settle a case at any time.
Review. At the end of FY02, there were roughly 1,200 cases pending at the commissioner level.
DECISIONS ISSUED
As in other court systems, most of the cases filed with the Industrial Commission are settled. As wouldbe expected, the more difficult cases tend to be the ones that go to trial. Fewer and fewer cases proceedon to the next level, as shown below. Note that cases involving state employees cannot proceed past theCommission.
DECISIONS AND APPEALS
2,802 arbitration decisions issued in FY0247% are appealed to the Commission
1,093 Commission decisions issued in FY0229% are appealed to the circuit courts
250 circuit court opinions issued in CY02 (est.)40% are appealed to the Appellate Court
112 Appellate Court opinions/orders issued in CY025% cases are appealed to the Supreme Court
1-2 Supreme Court opinions issued/year
Parties are free to appeal decisions, but they may want to weigh the following information against the timeinvolved in waiting for a review. On review, the Commission supports the arbitrator's decision more oftenthan not. The results are particularly instructive when analyzed by the appealing party.
18
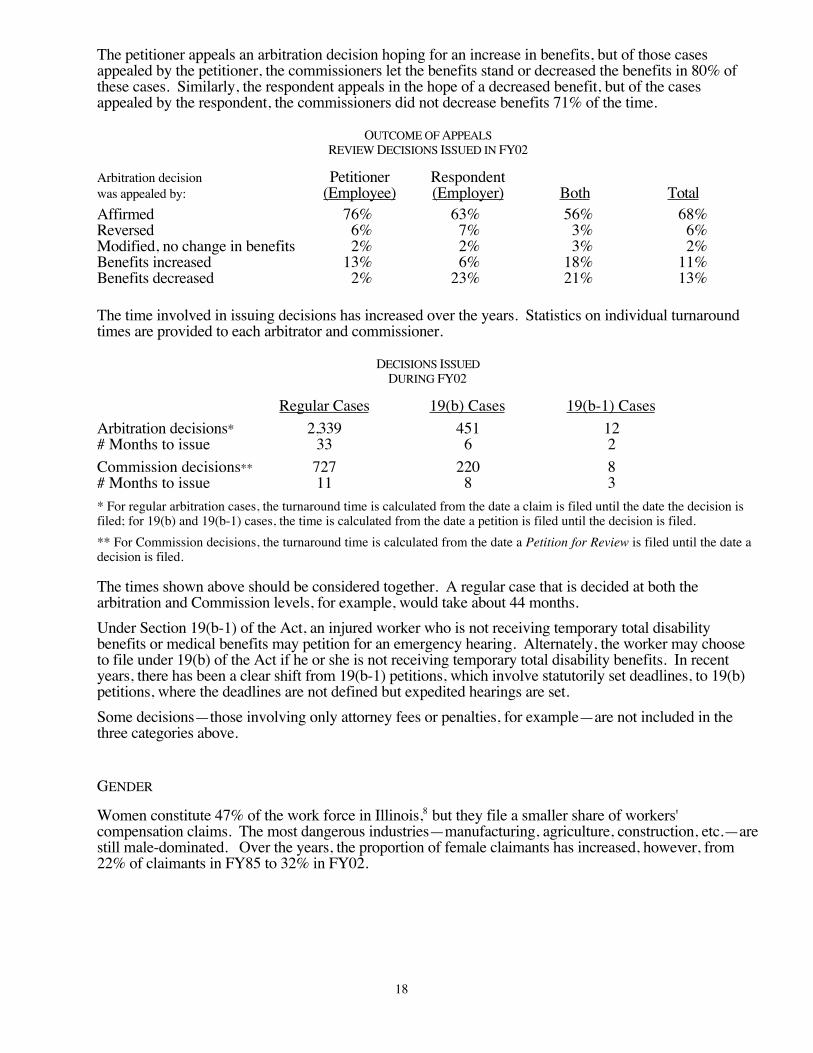
The petitioner appeals an arbitration decision hoping for an increase in benefits, but of those casesappealed by the petitioner, the commissioners let the benefits stand or decreased the benefits in 80% ofthese cases. Similarly, the respondent appeals in the hope of a decreased benefit, but of the casesappealed by the respondent, the commissioners did not decrease benefits 71% of the time.
OUTCOME OF APPEALSREVIEW DECISIONS ISSUED IN FY02
Arbitration decision Petitioner Respondentwas appealed by: (Employee) (Employer) Both TotalAffirmed 76% 63% 56% 68%Reversed 6% 7% 3% 6%Modified, no change in benefits 2% 2% 3% 2%Benefits increased 13% 6% 18% 11%Benefits decreased 2% 23% 21% 13%
The time involved in issuing decisions has increased over the years. Statistics on individual turnaroundtimes are provided to each arbitrator and commissioner.
DECISIONS ISSUEDDURING FY02
Regular Cases 19(b) Cases 19(b-1) CasesArbitration decisions* 2,339 451 12# Months to issue 33 6 2Commission decisions** 727 220 8# Months to issue 11 8 3* For regular arbitration cases, the turnaround time is calculated from the date a claim is filed until the date the decision isfiled; for 19(b) and 19(b-1) cases, the time is calculated from the date a petition is filed until the decision is filed.** For Commission decisions, the turnaround time is calculated from the date a Petition for Review is filed until the date adecision is filed.
The times shown above should be considered together. A regular case that is decided at both thearbitration and Commission levels, for example, would take about 44 months.Under Section 19(b-1) of the Act, an injured worker who is not receiving temporary total disabilitybenefits or medical benefits may petition for an emergency hearing. Alternately, the worker may chooseto file under 19(b) of the Act if he or she is not receiving temporary total disability benefits. In recentyears, there has been a clear shift from 19(b-1) petitions, which involve statutorily set deadlines, to 19(b)petitions, where the deadlines are not defined but expedited hearings are set.Some decisions—those involving only attorney fees or penalties, for example—are not included in thethree categories above.
GENDER
Women constitute 47% of the work force in Illinois,8 but they file a smaller share of workers'compensation claims. The most dangerous industries—manufacturing, agriculture, construction, etc.—arestill male-dominated. Over the years, the proportion of female claimants has increased, however, from22% of claimants in FY85 to 32% in FY02.
19
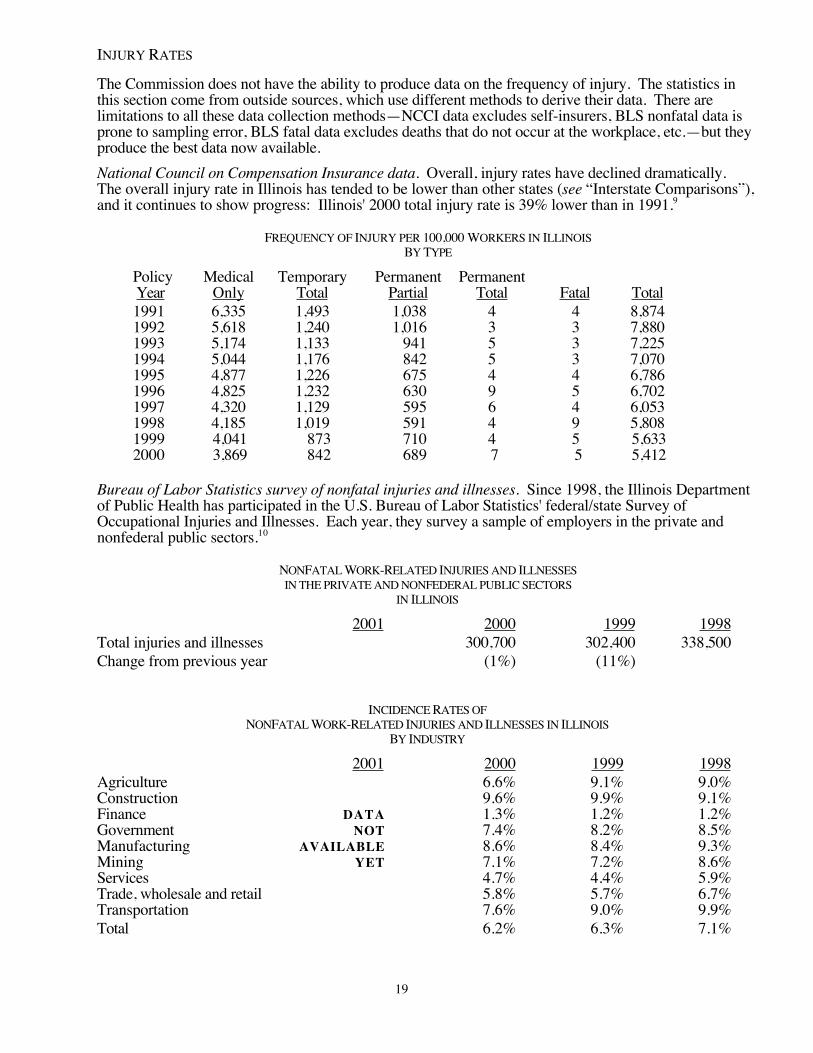
INJURY RATES
The Commission does not have the ability to produce data on the frequency of injury. The statistics inthis section come from outside sources, which use different methods to derive their data. There arelimitations to all these data collection methods—NCCI data excludes self-insurers, BLS nonfatal data isprone to sampling error, BLS fatal data excludes deaths that do not occur at the workplace, etc.—but theyproduce the best data now available.National Council on Compensation Insurance data. Overall, injury rates have declined dramatically.The overall injury rate in Illinois has tended to be lower than other states (see “Interstate Comparisons”),and it continues to show progress: Illinois' 2000 total injury rate is 39% lower than in 1991.9
FREQUENCY OF INJURY PER 100,000 WORKERS IN ILLINOISBY TYPE
Policy Medical Temporary Permanent Permanent Year Only Total Partial Total Fatal Total1991 6,335 1,493 1,038 4 4 8,8741992 5,618 1,240 1,016 3 3 7,8801993 5,174 1,133 941 5 3 7,2251994 5,044 1,176 842 5 3 7,0701995 4,877 1,226 675 4 4 6,7861996 4,825 1,232 630 9 5 6,7021997 4,320 1,129 595 6 4 6,0531998 4,185 1,019 591 4 9 5,8081999 4,041 873 710 4 5 5,6332000 3,869 842 689 7 5 5,412
Bureau of Labor Statistics survey of nonfatal injuries and illnesses. Since 1998, the Illinois Departmentof Public Health has participated in the U.S. Bureau of Labor Statistics' federal/state Survey ofOccupational Injuries and Illnesses. Each year, they survey a sample of employers in the private andnonfederal public sectors.10
NONFATAL WORK-RELATED INJURIES AND ILLNESSESIN THE PRIVATE AND NONFEDERAL PUBLIC SECTORS
IN ILLINOIS
2001 2000 1999 1998Total injuries and illnesses 300,700 302,400 338,500Change from previous year (1%) (11%)
INCIDENCE RATES OFNONFATAL WORK-RELATED INJURIES AND ILLNESSES IN ILLINOIS
BY INDUSTRY
2001 2000 1999 1998Agriculture 6.6% 9.1% 9.0%Construction 9.6% 9.9% 9.1%Finance DATA 1.3% 1.2% 1.2%Government NOT 7.4% 8.2% 8.5%Manufacturing AVAILABLE 8.6% 8.4% 9.3%Mining YET 7.1% 7.2% 8.6%Services 4.7% 4.4% 5.9%Trade, wholesale and retail 5.8% 5.7% 6.7%Transportation 7.6% 9.0% 9.9%Total 6.2% 6.3% 7.1%
20
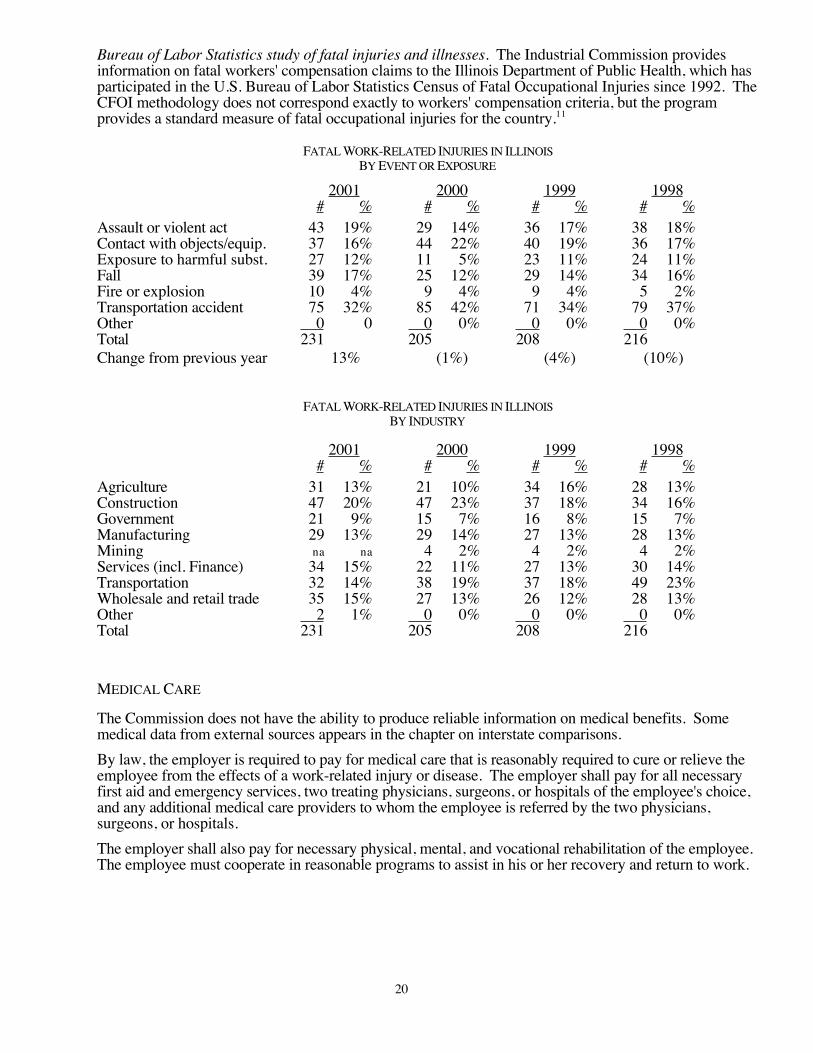
Bureau of Labor Statistics study of fatal injuries and illnesses. The Industrial Commission providesinformation on fatal workers' compensation claims to the Illinois Department of Public Health, which hasparticipated in the U.S. Bureau of Labor Statistics Census of Fatal Occupational Injuries since 1992. TheCFOI methodology does not correspond exactly to workers' compensation criteria, but the programprovides a standard measure of fatal occupational injuries for the country.11
FATAL WORK-RELATED INJURIES IN ILLINOISBY EVENT OR EXPOSURE
2001 2000 1999 1998# % # % # % # %
Assault or violent act 43 19% 29 14% 36 17% 38 18%Contact with objects/equip. 37 16% 44 22% 40 19% 36 17%Exposure to harmful subst. 27 12% 11 5% 23 11% 24 11%Fall 39 17% 25 12% 29 14% 34 16%Fire or explosion 10 4% 9 4% 9 4% 5 2%Transportation accident 75 32% 85 42% 71 34% 79 37%Other 0 0 0 0% 0 0% 0 0%Total 231 205 208 216Change from previous year 13% (1%) (4%) (10%)
FATAL WORK-RELATED INJURIES IN ILLINOISBY INDUSTRY
2001 2000 1999 1998# % # % # % # %
Agriculture 31 13% 21 10% 34 16% 28 13%Construction 47 20% 47 23% 37 18% 34 16%Government 21 9% 15 7% 16 8% 15 7%Manufacturing 29 13% 29 14% 27 13% 28 13%Mining na na 4 2% 4 2% 4 2%Services (incl. Finance) 34 15% 22 11% 27 13% 30 14%Transportation 32 14% 38 19% 37 18% 49 23%Wholesale and retail trade 35 15% 27 13% 26 12% 28 13%Other 2 1% 0 0% 0 0% 0 0%Total 231 205 208 216
MEDICAL CARE
The Commission does not have the ability to produce reliable information on medical benefits. Somemedical data from external sources appears in the chapter on interstate comparisons.By law, the employer is required to pay for medical care that is reasonably required to cure or relieve theemployee from the effects of a work-related injury or disease. The employer shall pay for all necessaryfirst aid and emergency services, two treating physicians, surgeons, or hospitals of the employee's choice,and any additional medical care providers to whom the employee is referred by the two physicians,surgeons, or hospitals.The employer shall also pay for necessary physical, mental, and vocational rehabilitation of the employee.The employee must cooperate in reasonable programs to assist in his or her recovery and return to work.
21
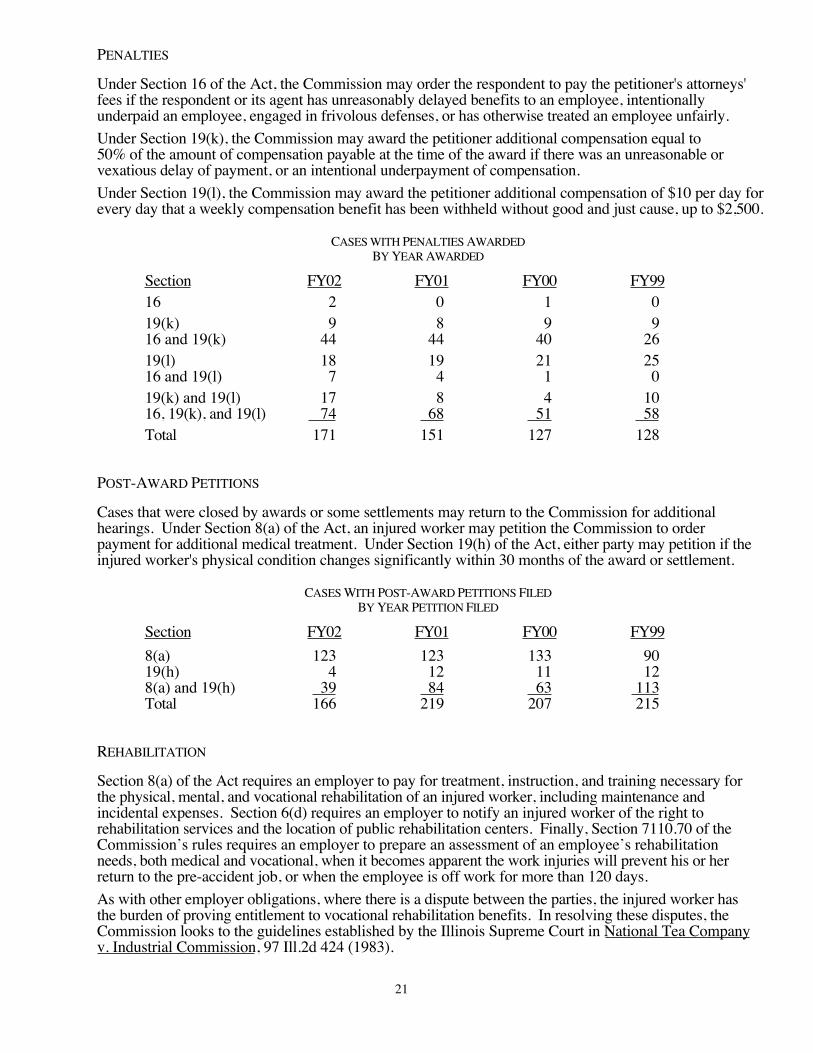
PENALTIES
Under Section 16 of the Act, the Commission may order the respondent to pay the petitioner's attorneys'fees if the respondent or its agent has unreasonably delayed benefits to an employee, intentionallyunderpaid an employee, engaged in frivolous defenses, or has otherwise treated an employee unfairly.Under Section 19(k), the Commission may award the petitioner additional compensation equal to50% of the amount of compensation payable at the time of the award if there was an unreasonable orvexatious delay of payment, or an intentional underpayment of compensation.Under Section 19(l), the Commission may award the petitioner additional compensation of $10 per day forevery day that a weekly compensation benefit has been withheld without good and just cause, up to $2,500.
CASES WITH PENALTIES AWARDEDBY YEAR AWARDED
Section FY02 FY01 FY00 FY9916 2 0 1 019(k) 9 8 9 916 and 19(k) 44 44 40 2619(l) 18 19 21 2516 and 19(l) 7 4 1 019(k) and 19(l) 17 8 4 1016, 19(k), and 19(l) 74 68 51 58Total 171 151 127 128
POST-AWARD PETITIONS
Cases that were closed by awards or some settlements may return to the Commission for additionalhearings. Under Section 8(a) of the Act, an injured worker may petition the Commission to orderpayment for additional medical treatment. Under Section 19(h) of the Act, either party may petition if theinjured worker's physical condition changes significantly within 30 months of the award or settlement.
CASES WITH POST-AWARD PETITIONS FILEDBY YEAR PETITION FILED
Section FY02 FY01 FY00 FY998(a) 123 123 133 9019(h) 4 12 11 128(a) and 19(h) 39 84 63 113Total 166 219 207 215
REHABILITATION
Section 8(a) of the Act requires an employer to pay for treatment, instruction, and training necessary forthe physical, mental, and vocational rehabilitation of an injured worker, including maintenance andincidental expenses. Section 6(d) requires an employer to notify an injured worker of the right torehabilitation services and the location of public rehabilitation centers. Finally, Section 7110.70 of theCommission’s rules requires an employer to prepare an assessment of an employee’s rehabilitationneeds, both medical and vocational, when it becomes apparent the work injuries will prevent his or herreturn to the pre-accident job, or when the employee is off work for more than 120 days.As with other employer obligations, where there is a dispute between the parties, the injured worker hasthe burden of proving entitlement to vocational rehabilitation benefits. In resolving these disputes, theCommission looks to the guidelines established by the Illinois Supreme Court in National Tea Companyv. Industrial Commission, 97 Ill.2d 424 (1983).
22
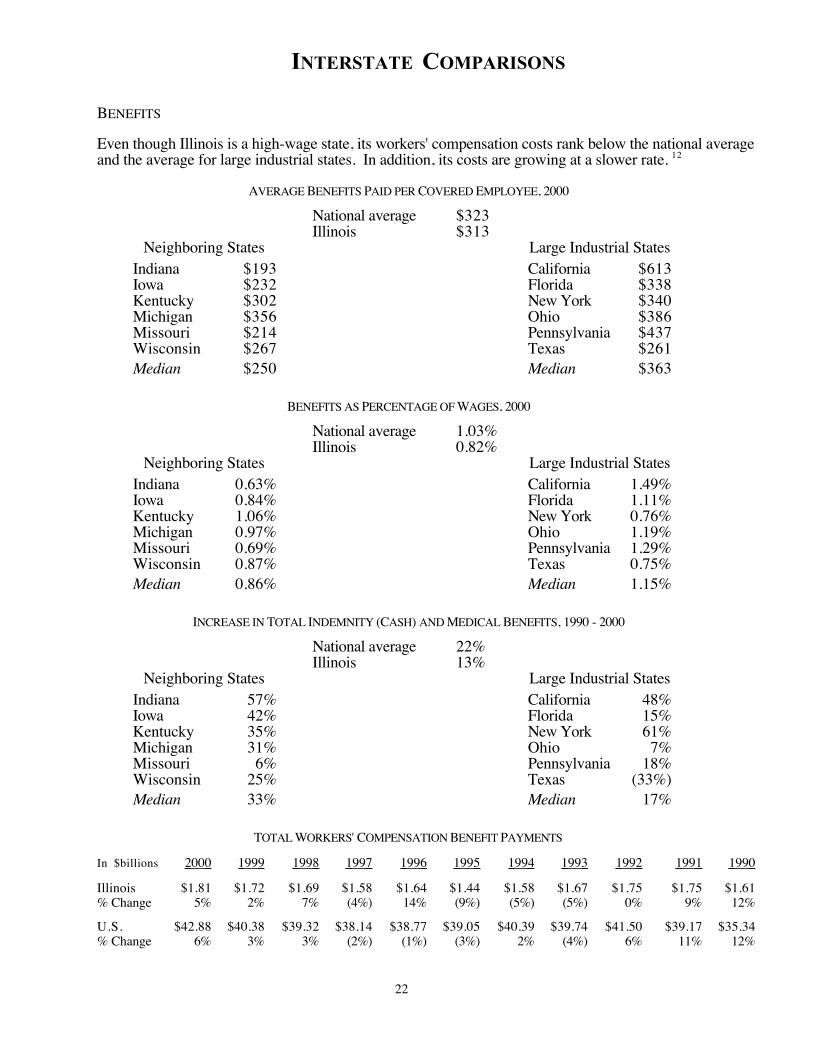
INTERSTATE COMPARISONS
BENEFITS
Even though Illinois is a high-wage state, its workers' compensation costs rank below the national averageand the average for large industrial states. In addition, its costs are growing at a slower rate. 12
AVERAGE BENEFITS PAID PER COVERED EMPLOYEE, 2000
National average $323Illinois $313
Neighboring States Large Industrial StatesIndiana $193 California $613Iowa $232 Florida $338Kentucky $302 New York $340Michigan $356 Ohio $386Missouri $214 Pennsylvania $437Wisconsin $267 Texas $261Median $250 Median $363
BENEFITS AS PERCENTAGE OF WAGES, 2000
National average 1.03%Illinois 0.82%
Neighboring States Large Industrial StatesIndiana 0.63% California 1.49%Iowa 0.84% Florida 1.11%Kentucky 1.06% New York 0.76%Michigan 0.97% Ohio 1.19%Missouri 0.69% Pennsylvania 1.29%Wisconsin 0.87% Texas 0.75%Median 0.86% Median 1.15%
INCREASE IN TOTAL INDEMNITY (CASH) AND MEDICAL BENEFITS, 1990 - 2000
National average 22%Illinois 13%
Neighboring States Large Industrial StatesIndiana 57% California 48%Iowa 42% Florida 15%Kentucky 35% New York 61%Michigan 31% Ohio 7%Missouri 6% Pennsylvania 18%Wisconsin 25% Texas (33%)Median 33% Median 17%
TOTAL WORKERS' COMPENSATION BENEFIT PAYMENTS
In $billions 2000 1999 1998 1997 1996 1995 1994 1993 1992 1991 1990
Illinois $1.81 $1.72 $1.69 $1.58 $1.64 $1.44 $1.58 $1.67 $1.75 $1.75 $1.61% Change 5% 2% 7% (4%) 14% (9%) (5%) (5%) 0% 9% 12%
U.S. $42.88 $40.38 $39.32 $38.14 $38.77 $39.05 $40.39 $39.74 $41.50 $39.17 $35.34% Change 6% 3% 3% (2%) (1%) (3%) 2% (4%) 6% 11% 12%
23
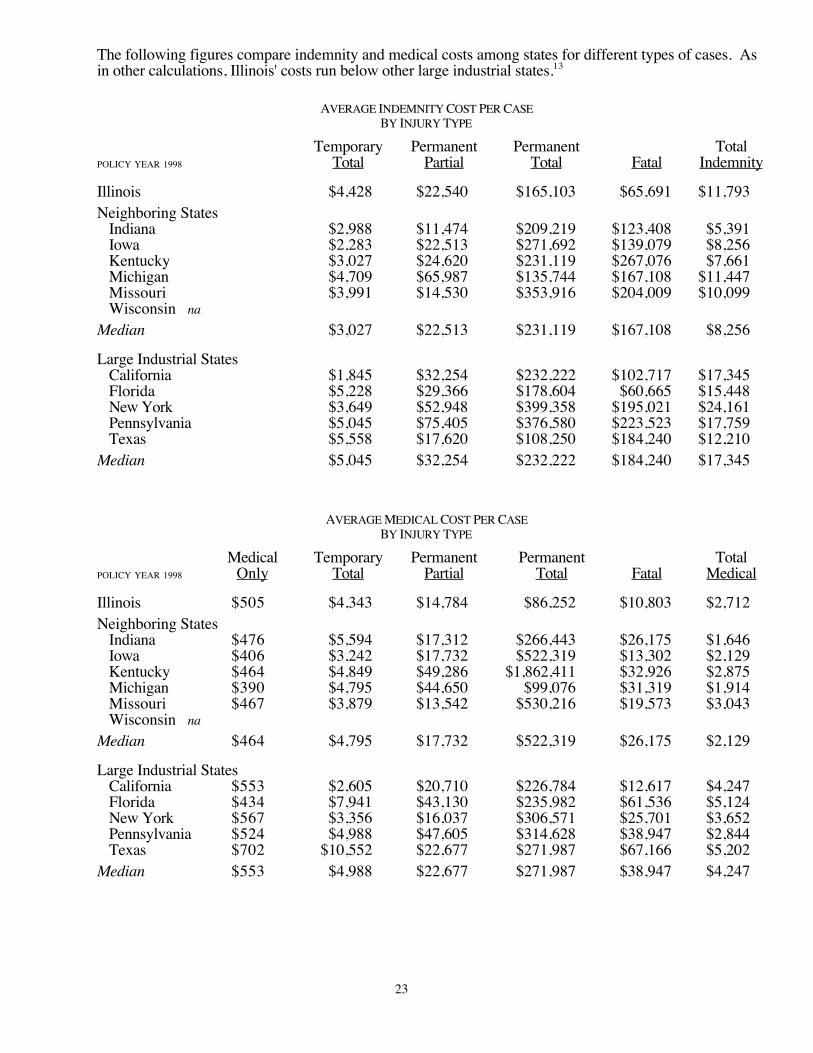
The following figures compare indemnity and medical costs among states for different types of cases. Asin other calculations, Illinois' costs run below other large industrial states.13
AVERAGE INDEMNITY COST PER CASEBY INJURY TYPE
Temporary Permanent Permanent TotalPOLICY YEAR 1998 Total Partial Total Fatal Indemnity
Illinois $4,428 $22,540 $165,103 $65,691 $11,793Neighboring States
Indiana $2,988 $11,474 $209,219 $123,408 $5,391Iowa $2,283 $22,513 $271,692 $139,079 $8,256Kentucky $3,027 $24,620 $231,119 $267,076 $7,661Michigan $4,709 $65,987 $135,744 $167,108 $11,447Missouri $3,991 $14,530 $353,916 $204,009 $10,099Wisconsin na
Median $3,027 $22,513 $231,119 $167,108 $8,256
Large Industrial StatesCalifornia $1,845 $32,254 $232,222 $102,717 $17,345Florida $5,228 $29,366 $178,604 $60,665 $15,448New York $3,649 $52,948 $399,358 $195,021 $24,161Pennsylvania $5,045 $75,405 $376,580 $223,523 $17,759Texas $5,558 $17,620 $108,250 $184,240 $12,210
Median $5,045 $32,254 $232,222 $184,240 $17,345
AVERAGE MEDICAL COST PER CASEBY INJURY TYPE
Medical Temporary Permanent Permanent TotalPOLICY YEAR 1998 Only Total Partial Total Fatal Medical
Illinois $505 $4,343 $14,784 $86,252 $10,803 $2,712Neighboring States
Indiana $476 $5,594 $17,312 $266,443 $26,175 $1,646Iowa $406 $3,242 $17,732 $522,319 $13,302 $2,129Kentucky $464 $4,849 $49,286 $1,862,411 $32,926 $2,875Michigan $390 $4,795 $44,650 $99,076 $31,319 $1,914Missouri $467 $3,879 $13,542 $530,216 $19,573 $3,043Wisconsin na
Median $464 $4,795 $17,732 $522,319 $26,175 $2,129
Large Industrial StatesCalifornia $553 $2,605 $20,710 $226,784 $12,617 $4,247Florida $434 $7,941 $43,130 $235,982 $61,536 $5,124New York $567 $3,356 $16,037 $306,571 $25,701 $3,652Pennsylvania $524 $4,988 $47,605 $314,628 $38,947 $2,844Texas $702 $10,552 $22,677 $271,987 $67,166 $5,202
Median $553 $4,988 $22,677 $271,987 $38,947 $4,247
24
COMPLIANCE WITH 1972 RECOMMENDATIONS
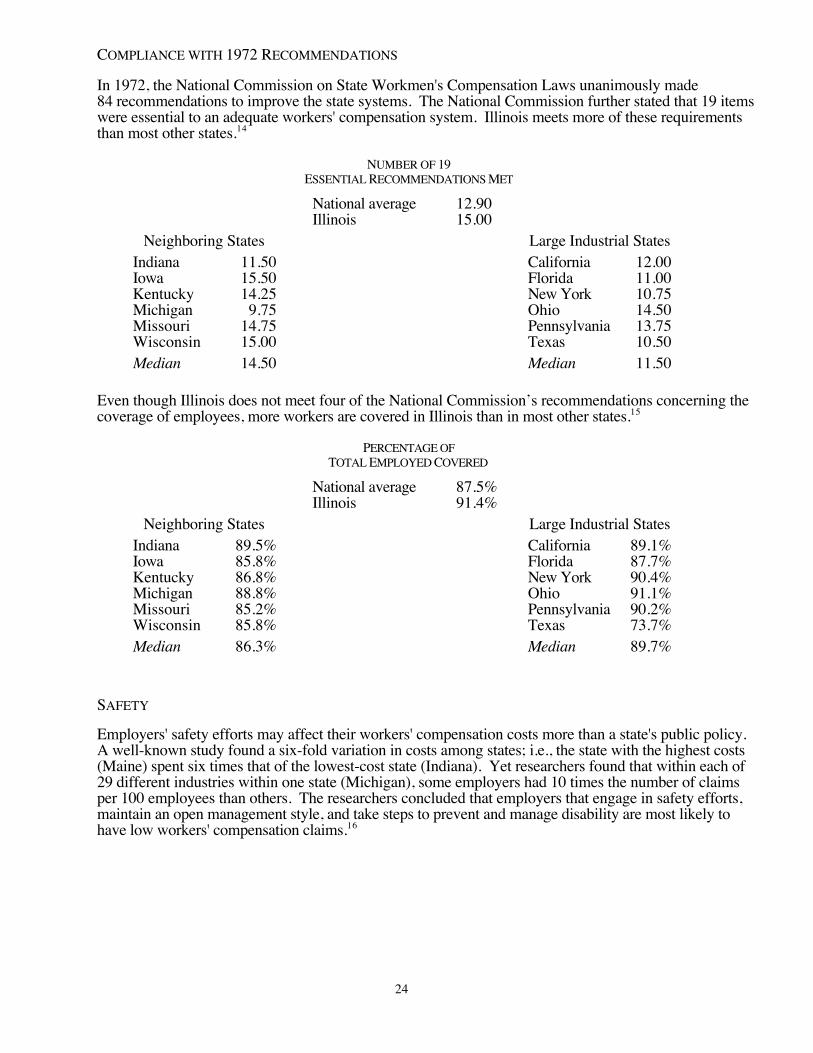
In 1972, the National Commission on State Workmen's Compensation Laws unanimously made84 recommendations to improve the state systems. The National Commission further stated that 19 itemswere essential to an adequate workers' compensation system. Illinois meets more of these requirementsthan most other states.14
NUMBER OF 19ESSENTIAL RECOMMENDATIONS MET
National average 12.90Illinois 15.00
Neighboring States Large Industrial StatesIndiana 11.50 California 12.00Iowa 15.50 Florida 11.00Kentucky 14.25 New York 10.75Michigan 9.75 Ohio 14.50Missouri 14.75 Pennsylvania 13.75Wisconsin 15.00 Texas 10.50Median 14.50 Median 11.50
Even though Illinois does not meet four of the National Commission’s recommendations concerning thecoverage of employees, more workers are covered in Illinois than in most other states.15
PERCENTAGE OFTOTAL EMPLOYED COVERED
National average 87.5%Illinois 91.4%
Neighboring States Large Industrial StatesIndiana 89.5% California 89.1%Iowa 85.8% Florida 87.7%Kentucky 86.8% New York 90.4%Michigan 88.8% Ohio 91.1%Missouri 85.2% Pennsylvania 90.2%Wisconsin 85.8% Texas 73.7%Median 86.3% Median 89.7%
SAFETY
Employers' safety efforts may affect their workers' compensation costs more than a state's public policy.A well-known study found a six-fold variation in costs among states; i.e., the state with the highest costs(Maine) spent six times that of the lowest-cost state (Indiana). Yet researchers found that within each of29 different industries within one state (Michigan), some employers had 10 times the number of claimsper 100 employees than others. The researchers concluded that employers that engage in safety efforts,maintain an open management style, and take steps to prevent and manage disability are most likely tohave low workers' compensation claims.16
25
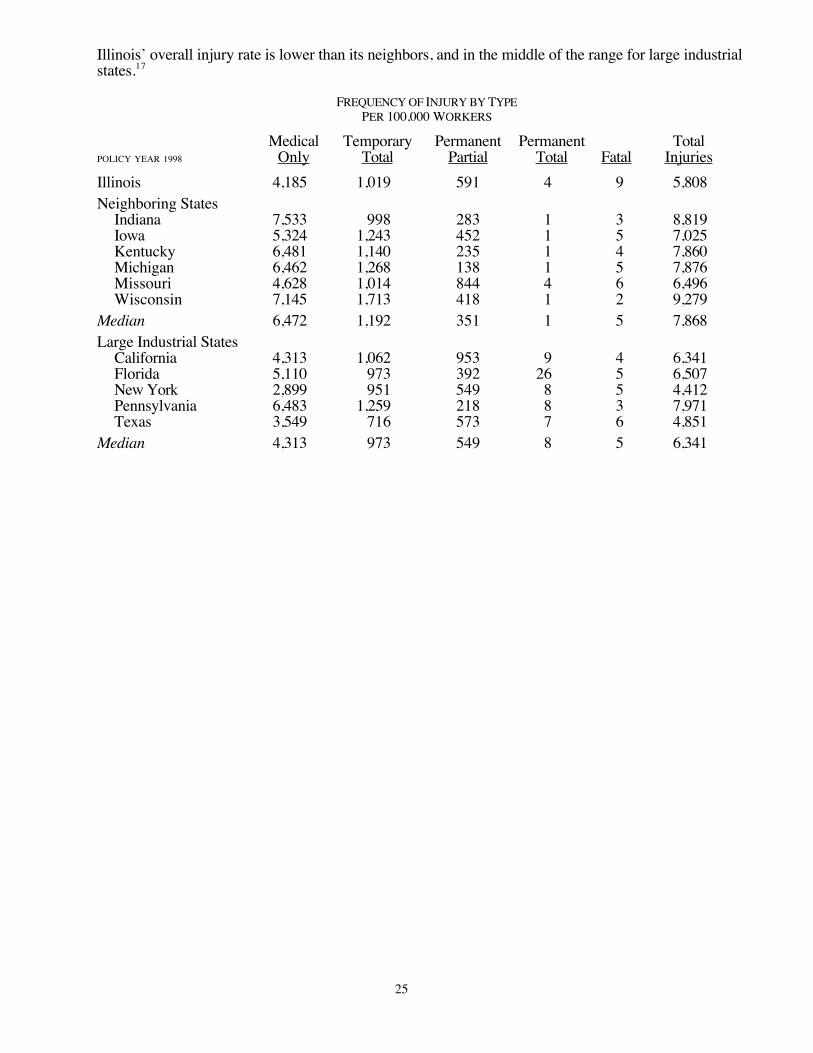
Illinois’ overall injury rate is lower than its neighbors, and in the middle of the range for large industrialstates.17
FREQUENCY OF INJURY BY TYPEPER 100,000 WORKERS
Medical Temporary Permanent Permanent TotalPOLICY YEAR 1998 Only Total Partial Total Fatal InjuriesIllinois 4,185 1,019 591 4 9 5,808Neighboring States
Indiana 7,533 998 283 1 3 8,819Iowa 5,324 1,243 452 1 5 7,025Kentucky 6,481 1,140 235 1 4 7,860Michigan 6,462 1,268 138 1 5 7,876Missouri 4,628 1,014 844 4 6 6,496Wisconsin 7,145 1,713 418 1 2 9,279
Median 6,472 1,192 351 1 5 7,868Large Industrial States
California 4,313 1,062 953 9 4 6,341Florida 5,110 973 392 26 5 6,507New York 2,899 951 549 8 5 4,412Pennsylvania 6,483 1,259 218 8 3 7,971Texas 3,549 716 573 7 6 4,851
Median 4,313 973 549 8 5 6,341
26
1 State Workers' Compensation Administrative Profiles, U.S. Department of Labor, October 2002, pp. 391 - 399;2002 Analysis of Workers' Compensation Laws, U.S. Chamber of Commerce, Chart XIV. Averages were calculated fromthe 44 states for which information was available. Five states run exclusive funds, in which the state manages all liabilitiesfor workers' compensation; in the 12 competitive fund states, employers may purchase insurance either through the state oron the private market; in the 27 private insurance states (of which six are GRF-funded), the state does not operate aninsurance fund.2"Workers' Compensation, Top Writers by State--2000," Best's Review, November 2001, p. 92; see also: "All IllinoisLicensed Companies--Illinois Workers' Compensation," Illinois Department of Insurance, 1994-2001 reports.3 National Council on Compensation Insurance filings with the Illinois Department of Insurance. Before 1/1/1990, therates for the assigned risk plan and the voluntary market fluctuated. (The assigned risk plan (residual market) consists ofhigh-risk companies that cannot obtain workers' compensation insurance on the open market.) From 1/1/1990 - 1/1/2002,the assigned risk plan was set at 20% higher than the voluntary market, and the same percentage change applied to both.Beginning 1/1/2002, the rates again fluctuate: there was a 0.2% decrease in the voluntary market and a 4.0% increase in theresidual market. For more information, call the Illinois Department of Insurance (217/524-8361). For information aboutthe assigned risk pool, see NCCI's Annual Statistical Bulletin, Ex. XIII.CPI 1982-84 = 100 Midwest Urban Area--All Urban Consumers, not seasonally adjusted.4 Annual Statistical Bulletin, 1996 - 2003 editions, National Council on Compensation Insurance, Exhibit XIII.5 "Fiscal Data for State Workers' Compensation Systems, 1990-2000," Research Bulletin, National Foundation forUnemployment Compensation and Workers' Compensation, September 2002, Table 19.6 In FY95, a change was made in the way dismissals are counted. All dismissals are now counted as closing a case; if acase is reopened, it is counted in the number of cases added to the caseload (see Cases Opened).7 “Monthly Statewide and MSA data (1988-present),” Illinois Department of Employment Security Web site. These figuresrepresent the average annual nonagricultual nonfederal employment. (DES is unable to estimate agricultural employment;federal workers are covered under a federal workers' compensation program.)8 “Workforce Availability Information, 2002,” Illinois Department of Employment Security, Table II.9 Annual Statistical Bulletin, Exhibit XII. This information refers only to the experience of employers with insurance, notself-insurers. Data is not available for Ohio because the state runs an exclusive state w.c. insurance fund. The figures forfatalities and PTDs come from a small number of cases and should be viewed with caution.10 Workplace Nonfatal Injuries and Illnesses, 1998-2000 editions, Illinois Department of Public Health, Tables 1, 2, 9.For more information, contact the IDPH Division of Epidemiologic Studies at 217/785-1873. Reports are available atwww.idph.state.il.us .11 Census of Fatal Occupational Injuries and Illnesses, 1997-2001 editions, Illinois Department of Public Health. Data for2001 occupational fatalities for the mining industry was not available.`12 "Fiscal Data for State Workers' Compensation Systems, 1990-2000," Tables 4, 11, 12.13 Annual Statistical Bulletin, Exhibit XI.14 "State Workers’ Compensation Laws in Effect January 1, 2002,” U.S. Department of Labor, Office of Workers'Compensation Programs, Table 1. In 1972, the National Commission on Workmen’s Compensation issued 84recommendations concerning the coverage of employees and diseases, income protection, medical care, worker safety, andprogram administration. They identified 19 of the 84 recommendations as essential to ensuring a minimum level ofprotection. As of January 1, 2002, compliance levels range from 7.25 in Mississippi to 16.50 in Nebraska. Illinois doesnot comply with the National Commission's recommendations 2.4 (Illinois exempts farm workers below a certain numberof hours), 2.5 (Illinois exempts household workers and casual workers below a certain number of days), 2.6 (Illinoisexempts some governmental employees (Chicago police and fire fighters)) and 2.7 (Illinois exempts certain classes ofemployees, such as those noted above). The report may be found at www.workerscompresources.com .15 “Workers’ Compensation Coverage by State,” Workers’ Compensation Data Fact Sheet, No. 1, National Academy ofSocial Insurance, October 2002, Table 1, column 5.16 Why Some Employers Have a Better Workers' Compensation Experience Than Others, Edw. M. Welch, 1991, pp. 3-7.17 Annual Statistical Bulletin, Exhibit XII.