Embed Size (px)
Citation preview
Illinois DOT
From the AASHO Road Test
To 20 Years of Mechanistic Pavement Experience
……and Counting
David L. Lippert, PE
Bureau of Materials and Physical Research Illinois Department of Transportation
Transportation Research Board
87th Annual Meeting January 13, 2008
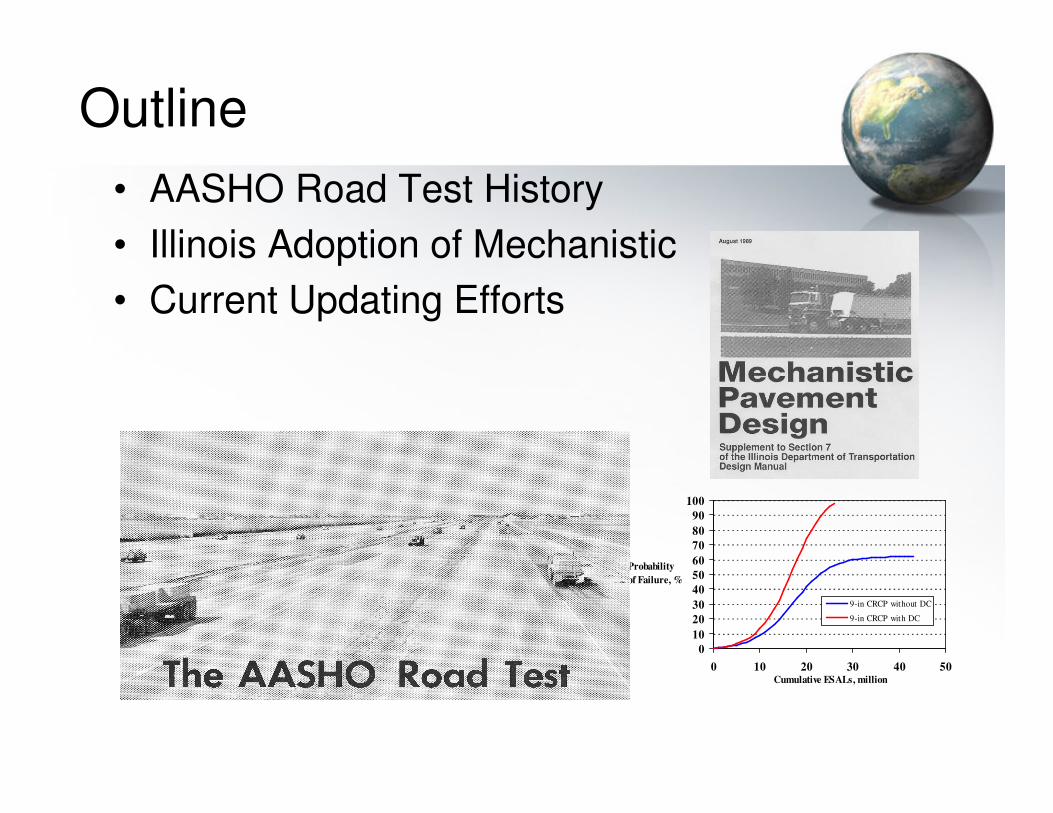
Outline
• AASHO Road Test History
• Illinois Adoption of Mechanistic
• Current Updating Efforts
0
10
20
30
40
50
60
70
80
90
100
0 10 20 30 40 50Cumulative ESALs, million
Probability
of Failure, %
9-in CRCP without DC
9-in CRCP with DC
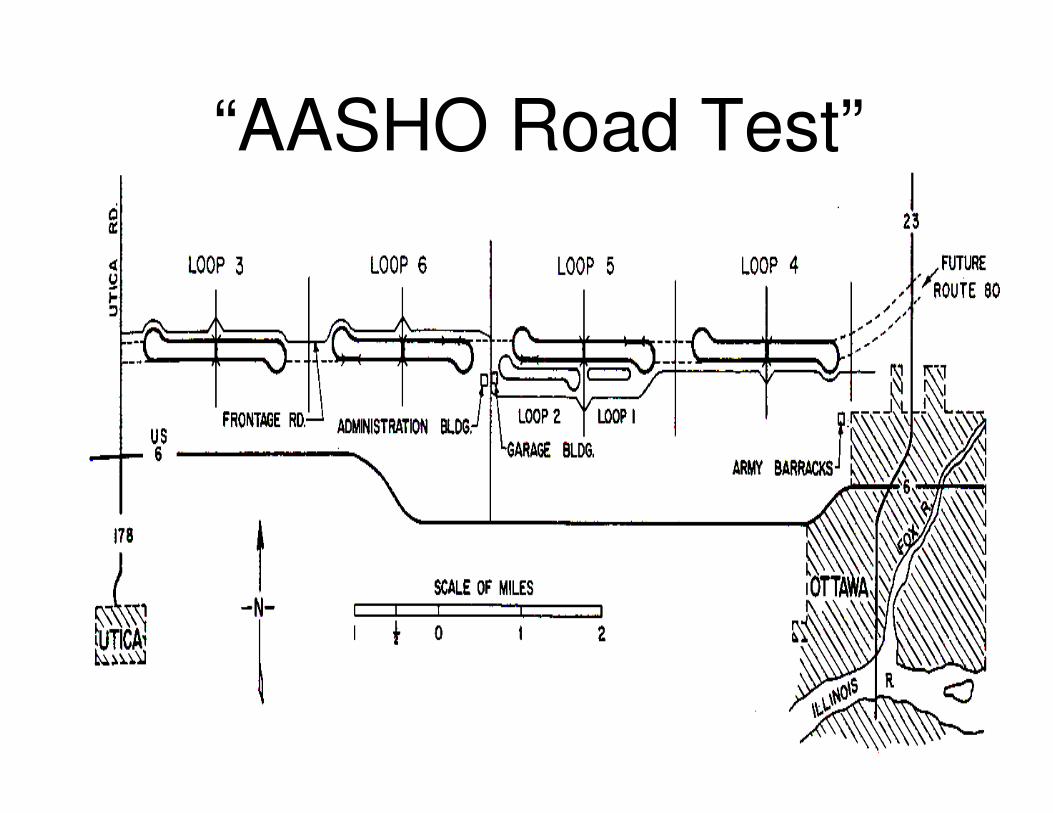
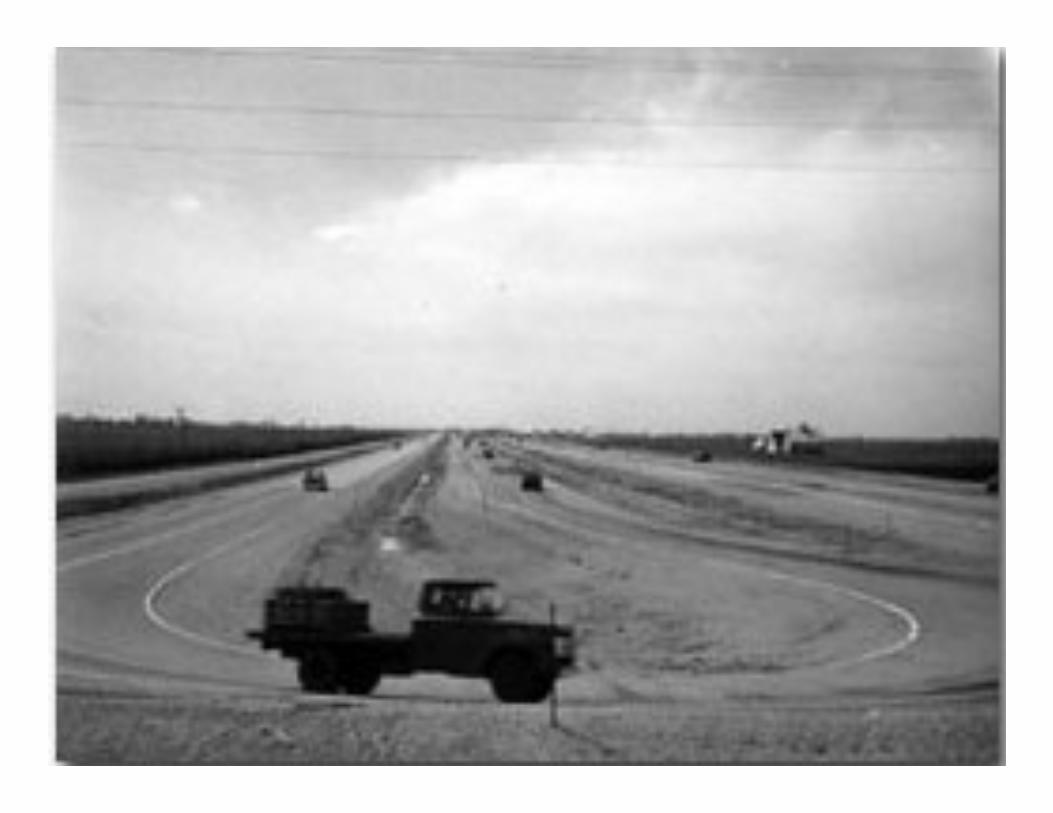
“AASHO Road Test”
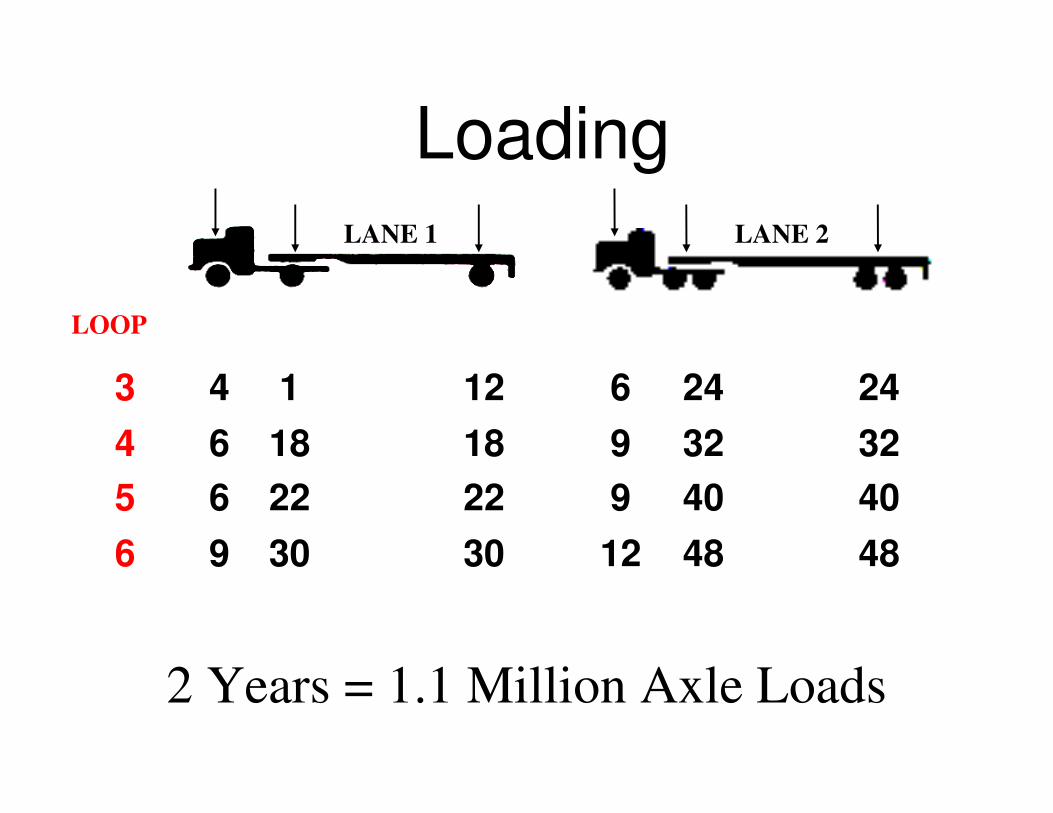
LANE 1 LANE 2
2 Years = 1.1 Million Axle Loads
Loading
LOOP
303096
222265
181864
12143
484812
40409
32329
24246
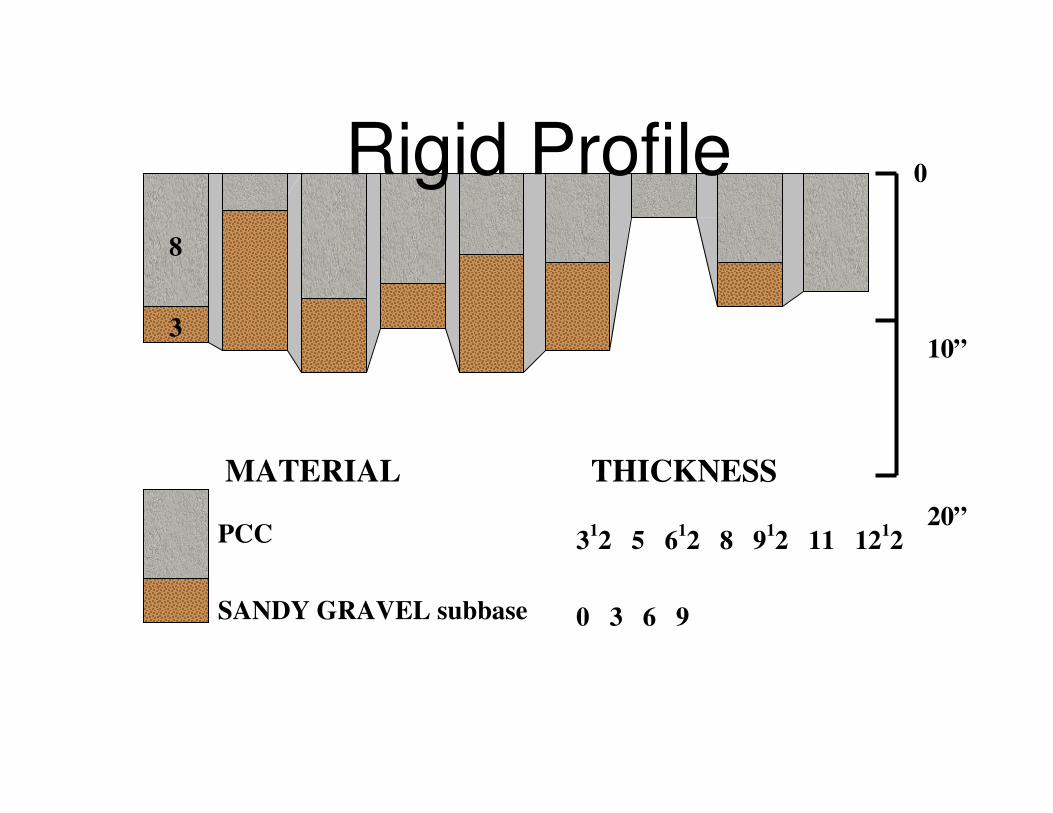
312 5 6
12 8 9
12 11 12
12
0 3 6 9
10”
20”
THICKNESS
0
8
3
PCC
SANDY GRAVEL subbase
MATERIAL
Rigid Profile
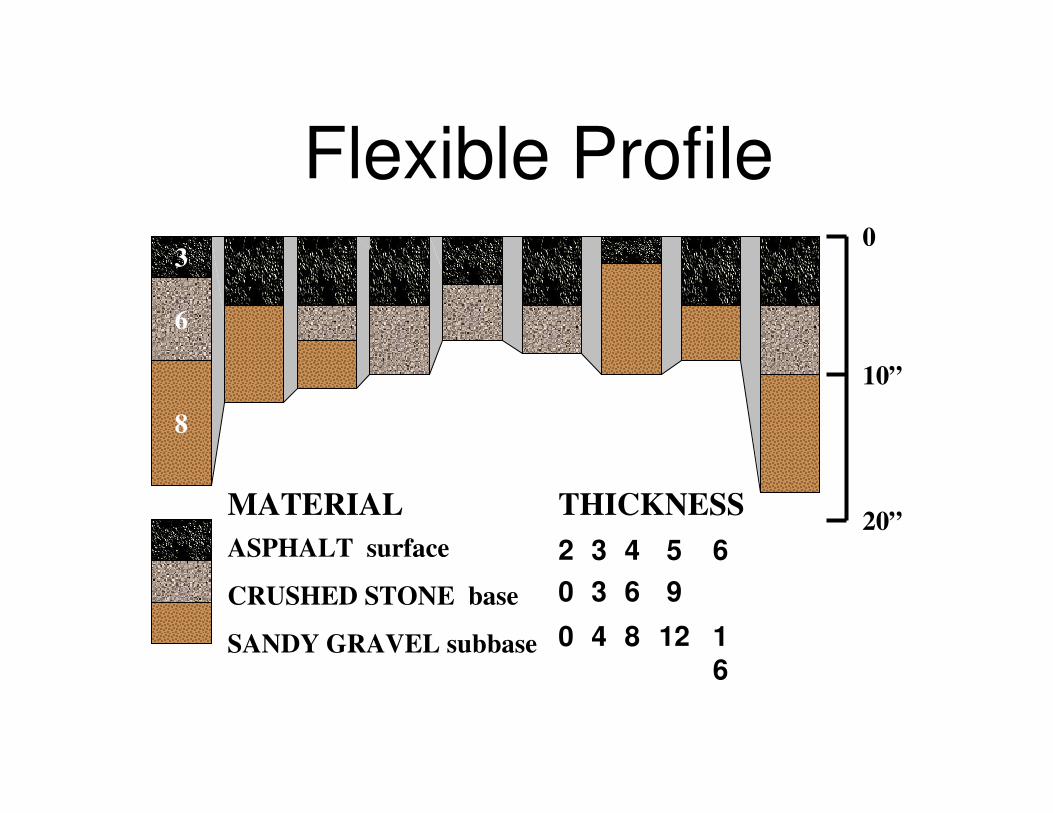
ASPHALT surface
CRUSHED STONE base
SANDY GRAVEL subbase 1
6
12840
9630
65432
MATERIAL THICKNESS
0
10”
20”
3
6
8
Flexible Profile
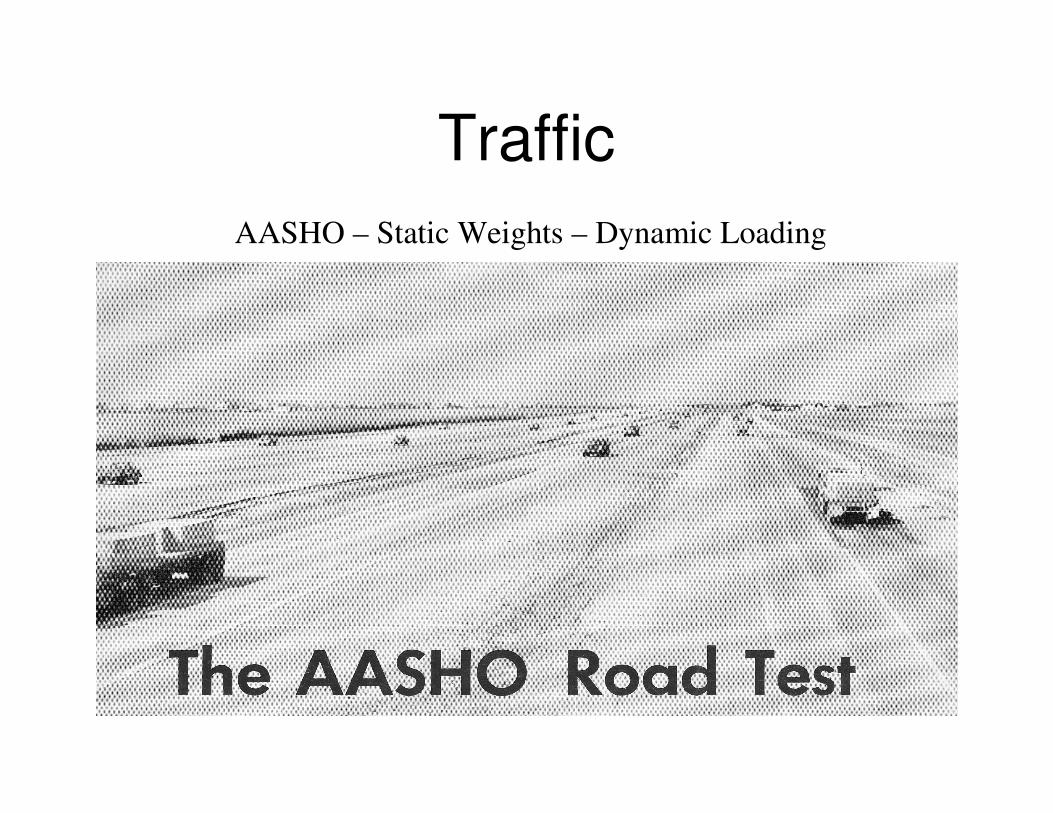
Traffic
AASHO – Static Weights – Dynamic Loading
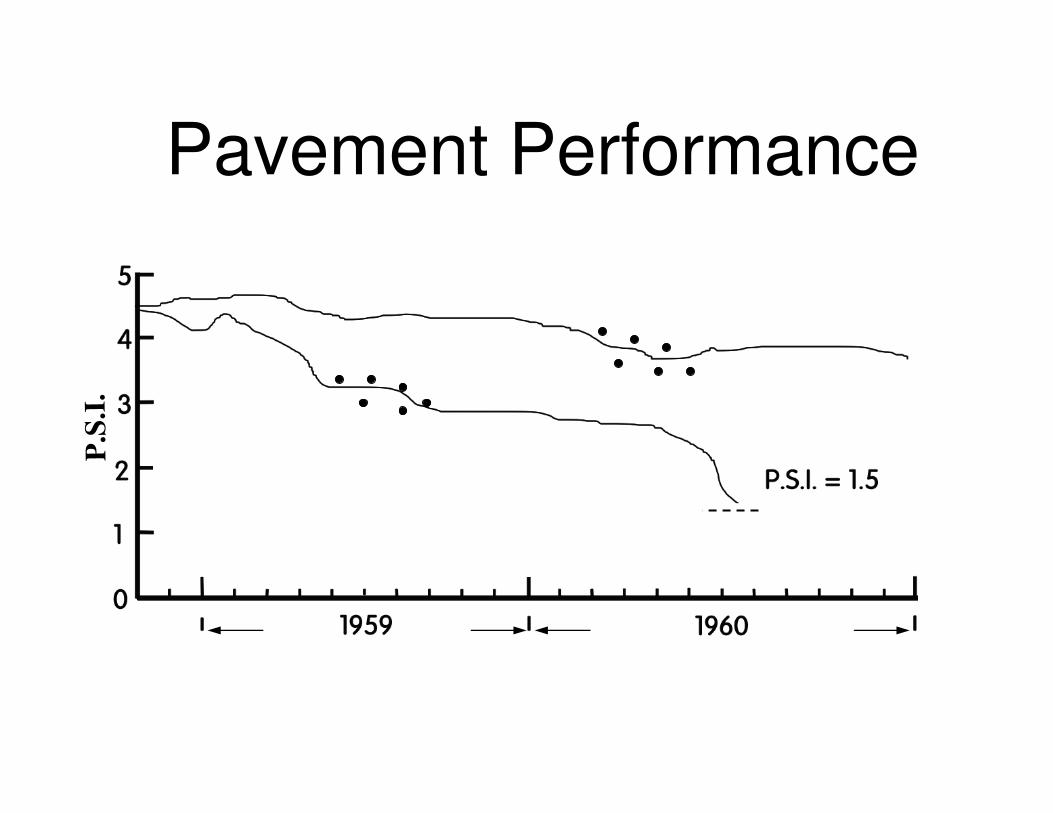
Pavement PerformanceP
.S.I
.
PSR = 0.0?
PSR = 0.0?
18,000 Pounds
80 PSI
Rigid
Tandem
ESAL’s
Flex
Tandem
ESAL’s
Rigid
Single
ESAL’s
Flex
Single
ESAL’s
Axle Load
Pounds
4.552.5132.225.642,000
2.431.3817.113.936,000
1.140.6588.287.0030,000
0.4440.2603.363.0324,000
0.1330.0771.001.0018,000
0.0260.0140.1760.18912,000
0.0020.0010.010.0106,000
0.00010.00000.00020.00022,000
ESAL’s
Illinois Method of Calculating
ESAL’s• Collect static weight data from enforcement
scales.
• Load spectrum by axle/vehicle type. – Single.
– Tandem.
– Triple.
• ESAL factor by FHWA vehicle class & road type.– Class I – Interstate and multi lane.
– Class II – Two lane over 2000 ADT.
– Class III - 750 to 2000 ADT.
– Class IV – Under 750 ADT.
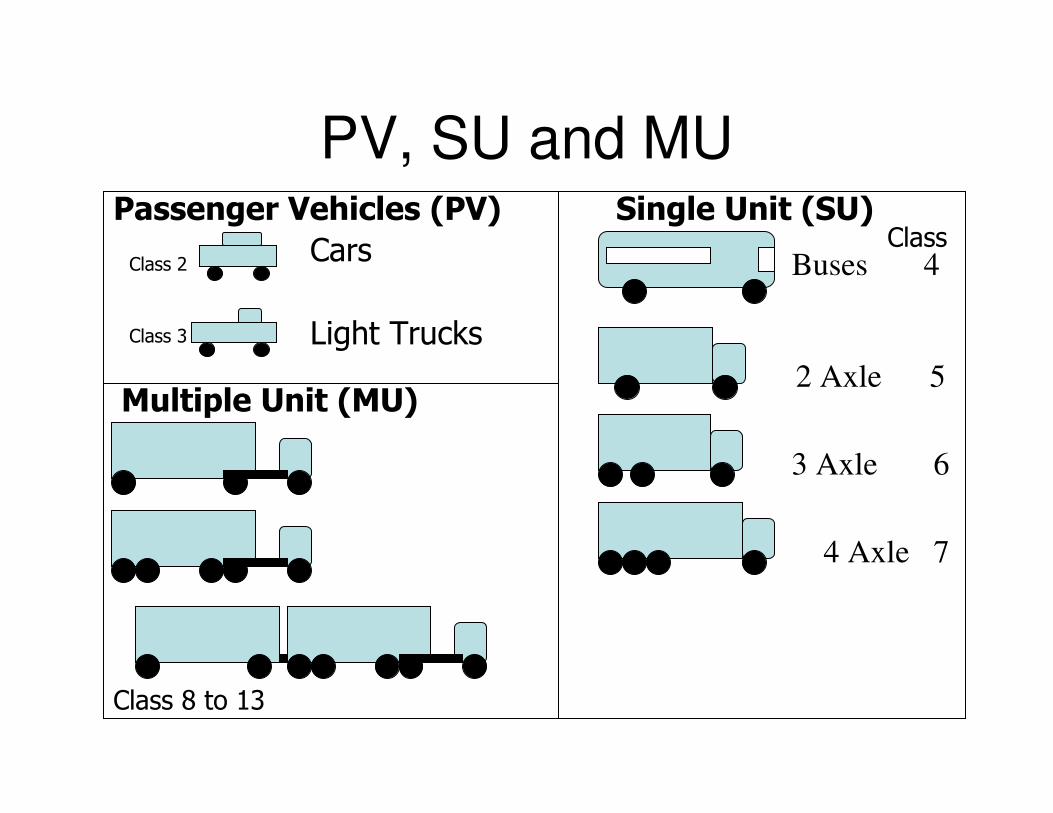
• Summarize into PV, SU and MU groups.

PV, SU and MUPassenger Vehicles (PV)
Cars
Light Trucks
Buses 4
2 Axle 5
3 Axle 6
4 Axle 7
Single Unit (SU)
Class 2
Class 3
Class
Multiple Unit (MU)
Class 8 to 13
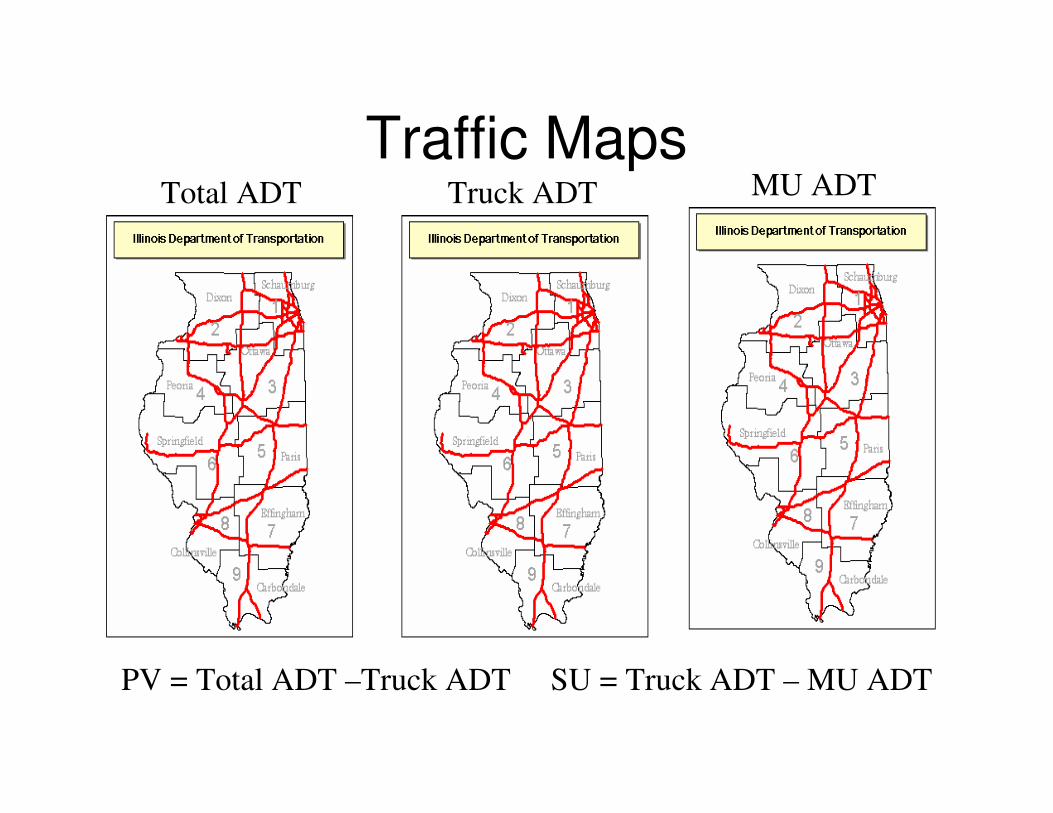
Traffic MapsTotal ADT MU ADTTruck ADT
PV = Total ADT –Truck ADT SU = Truck ADT – MU ADT
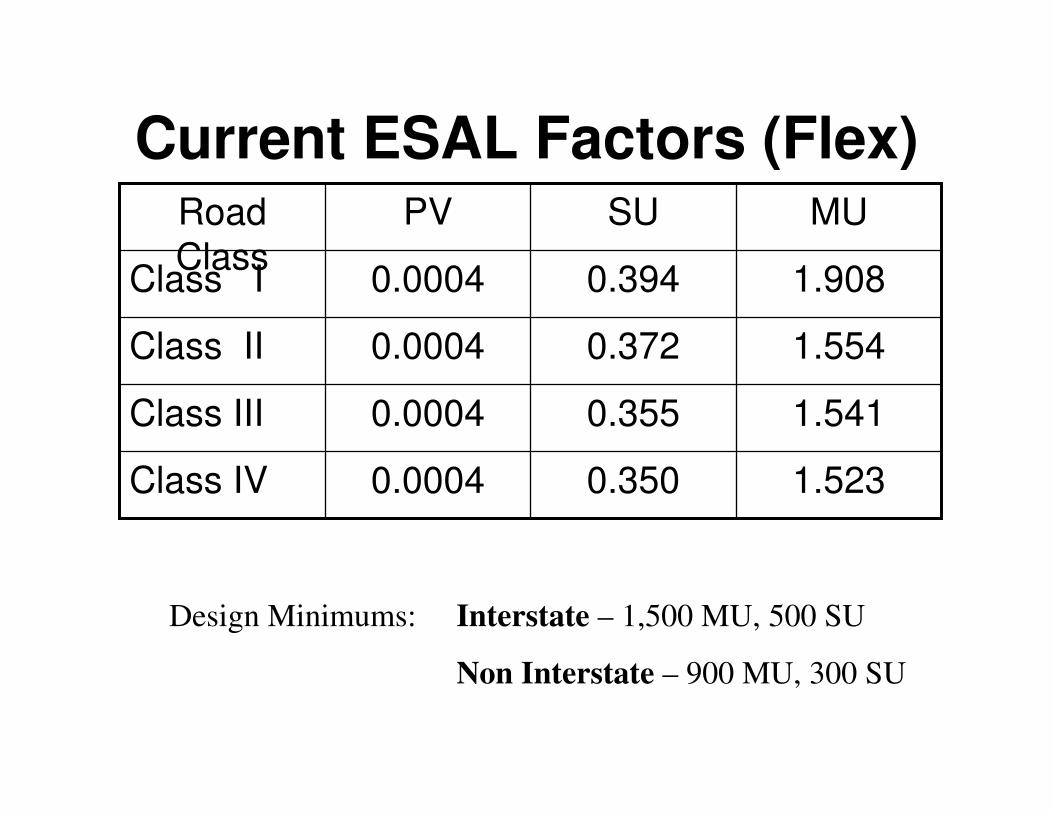
Current ESAL Factors (Flex)
1.5230.3500.0004Class IV
1.5410.3550.0004Class III
1.5540.3720.0004Class II
1.9080.3940.0004Class I
MUSUPVRoad
Class
Design Minimums: Interstate – 1,500 MU, 500 SU
Non Interstate – 900 MU, 300 SU
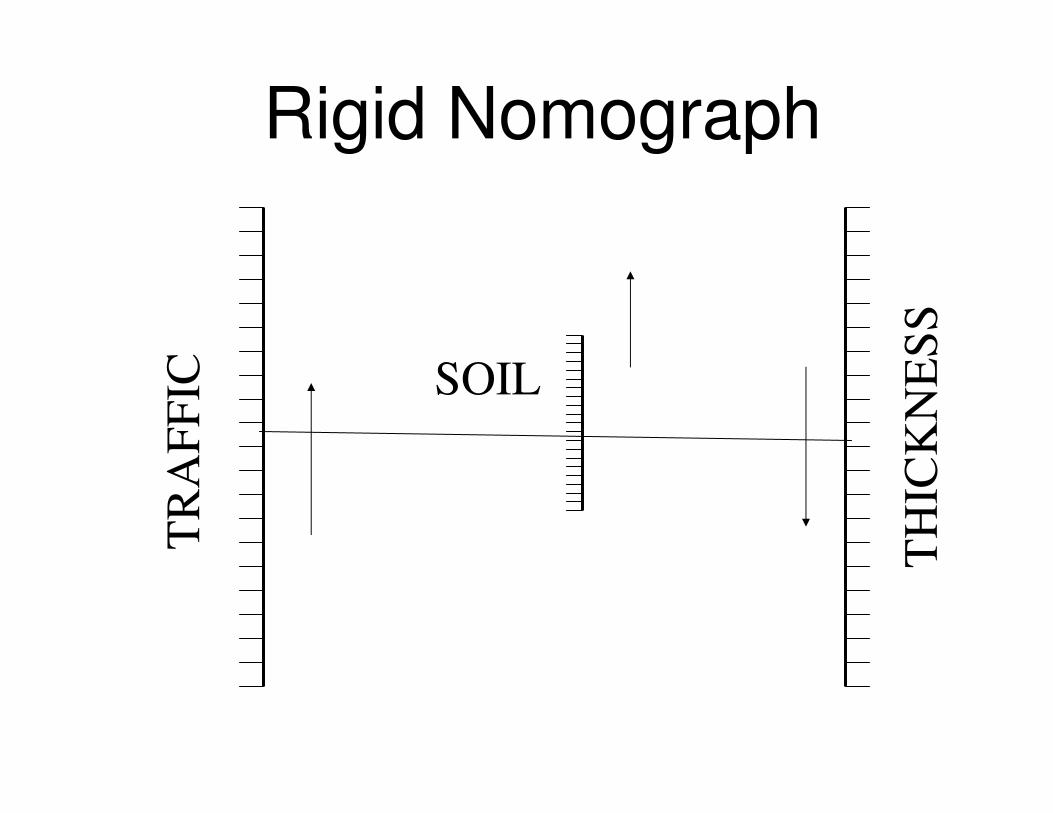
SOIL
TR
AF
FIC
TH
ICK
NE
SS
Rigid Nomograph
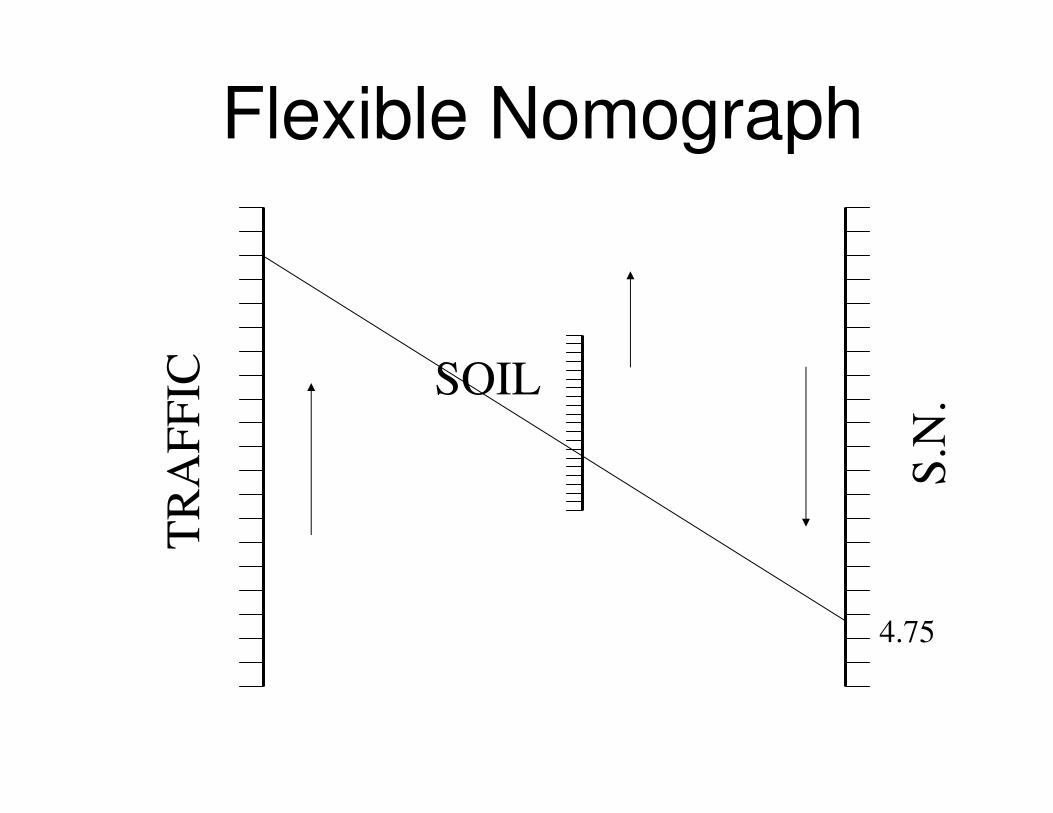
S.N
.
TR
AF
FIC SOIL
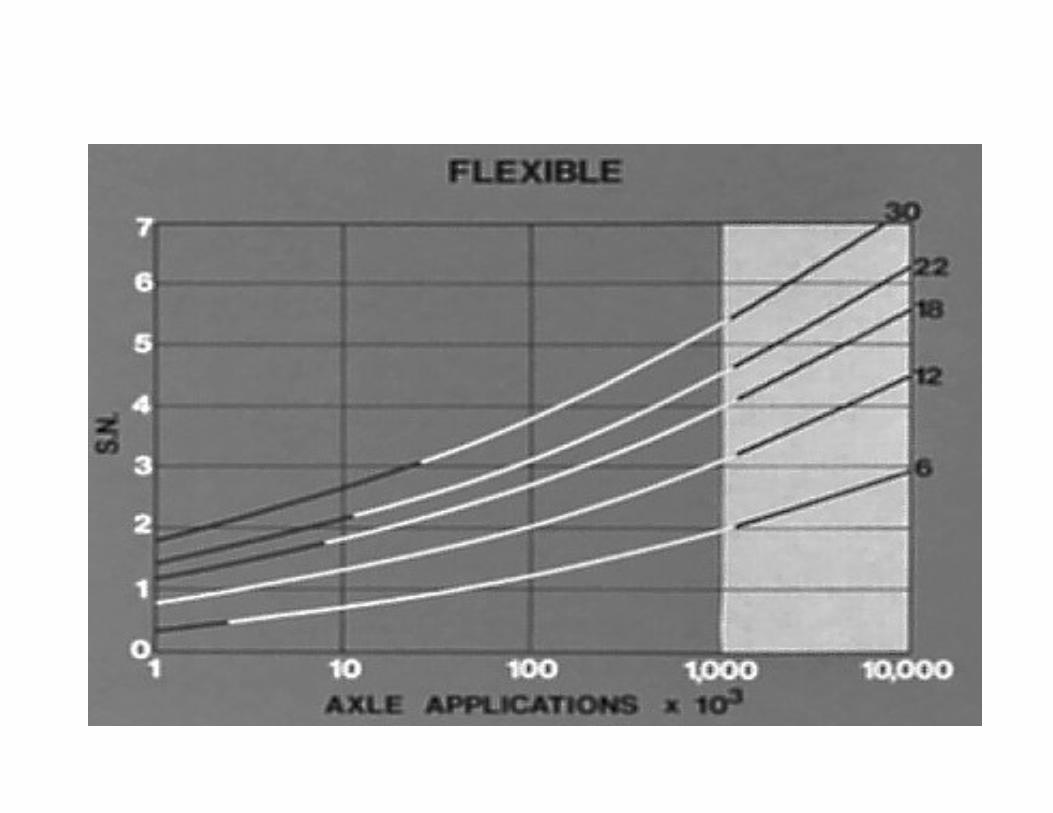
Flexible Nomograph
4.75
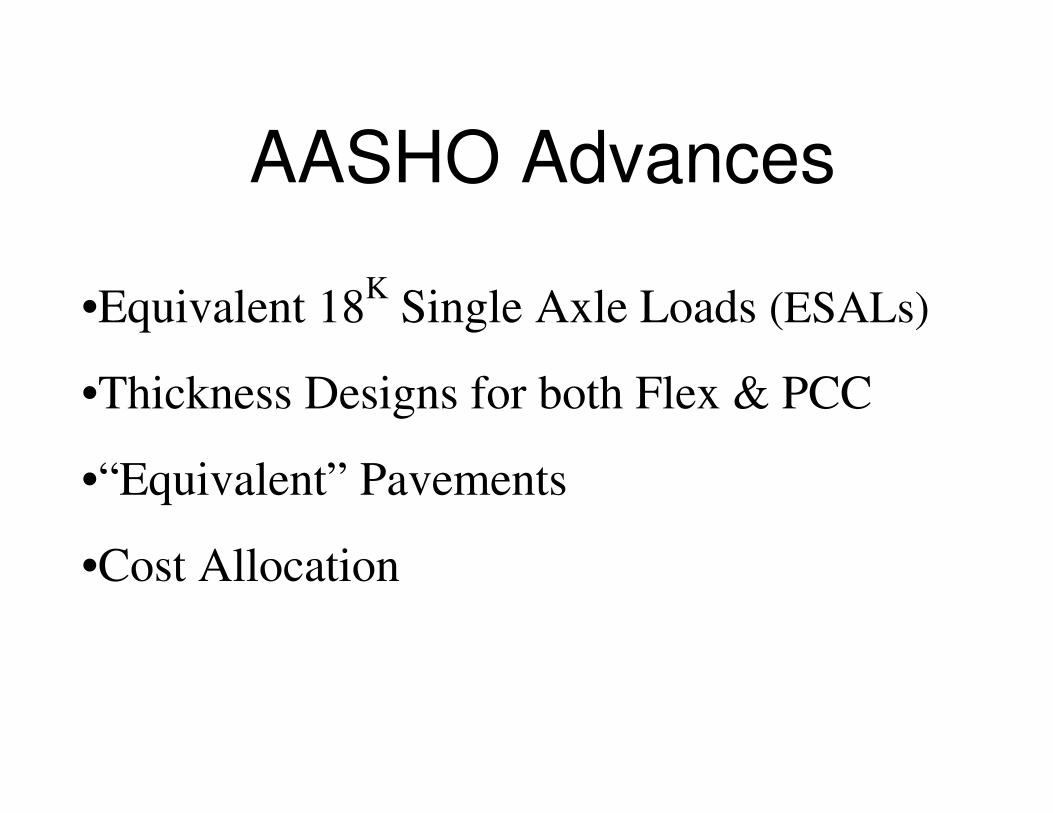
•Equivalent 18K
Single Axle Loads (ESALs)
•Thickness Designs for both Flex & PCC
•“Equivalent” Pavements
•Cost Allocation
AASHO Advances
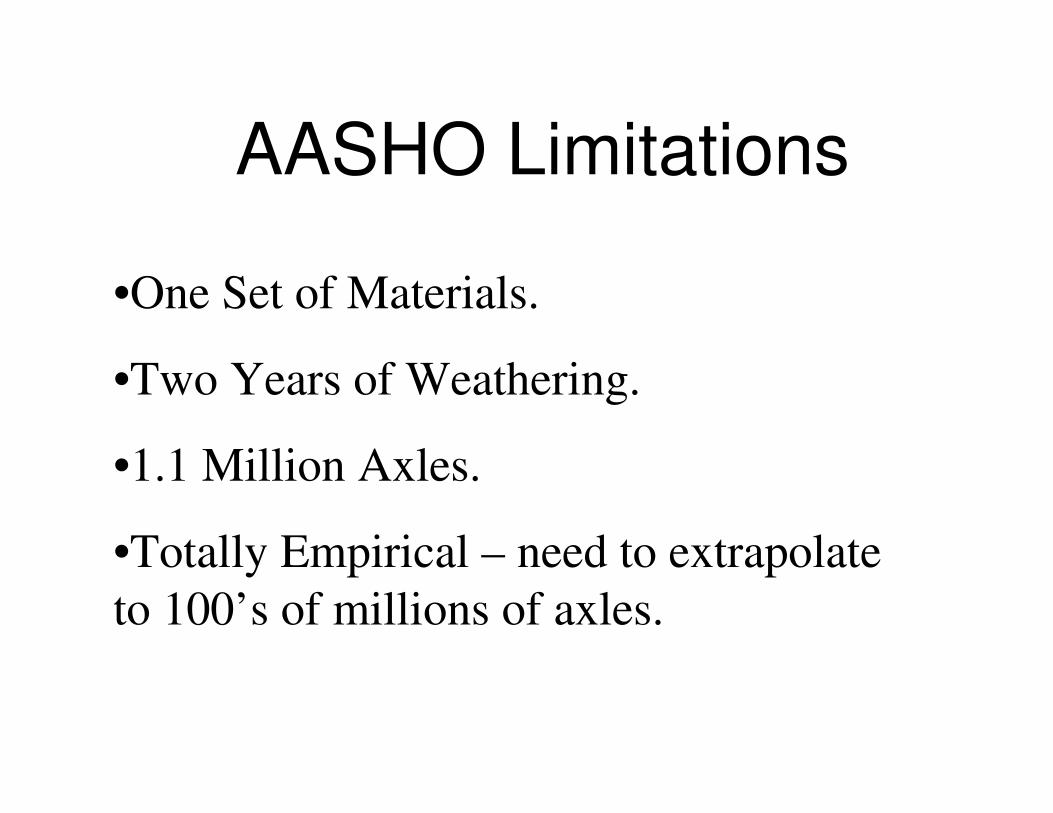
•One Set of Materials.
•Two Years of Weathering.
•1.1 Million Axles.
•Totally Empirical – need to extrapolate
to 100’s of millions of axles.
AASHO Limitations
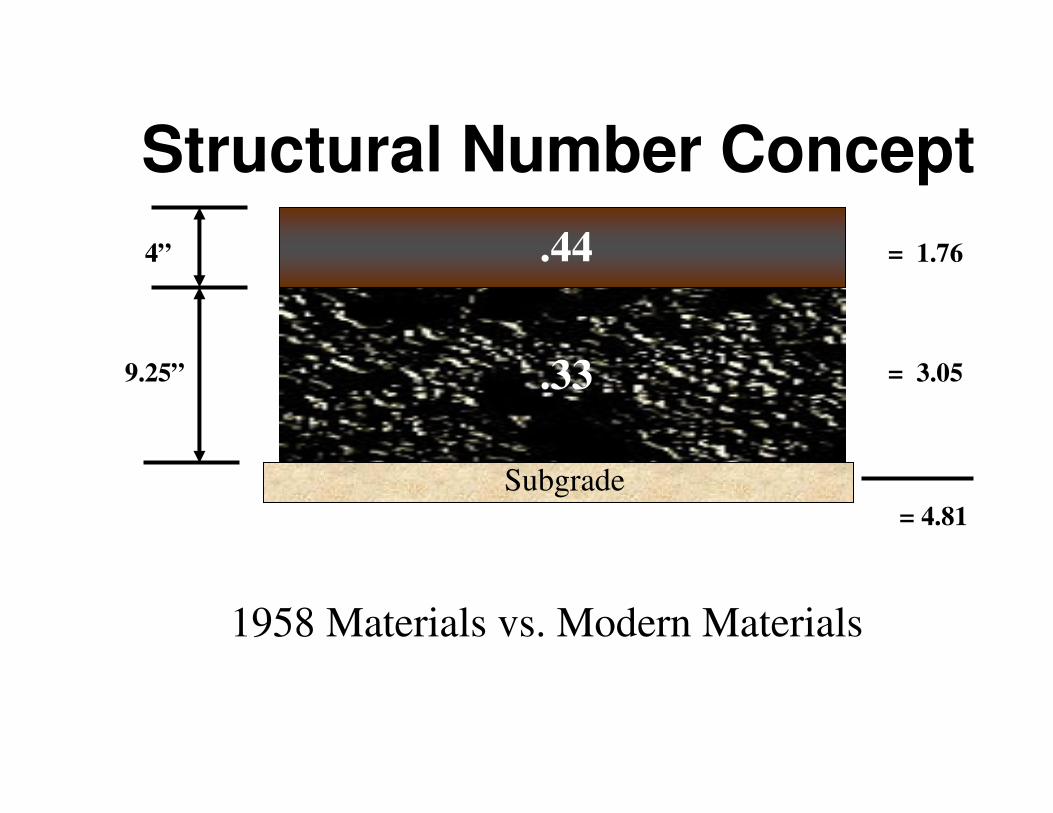
Structural Number Concept
.444”
9.25”
= 1.76
= 4.81
= 3.05.33
Subgrade
1958 Materials vs. Modern Materials
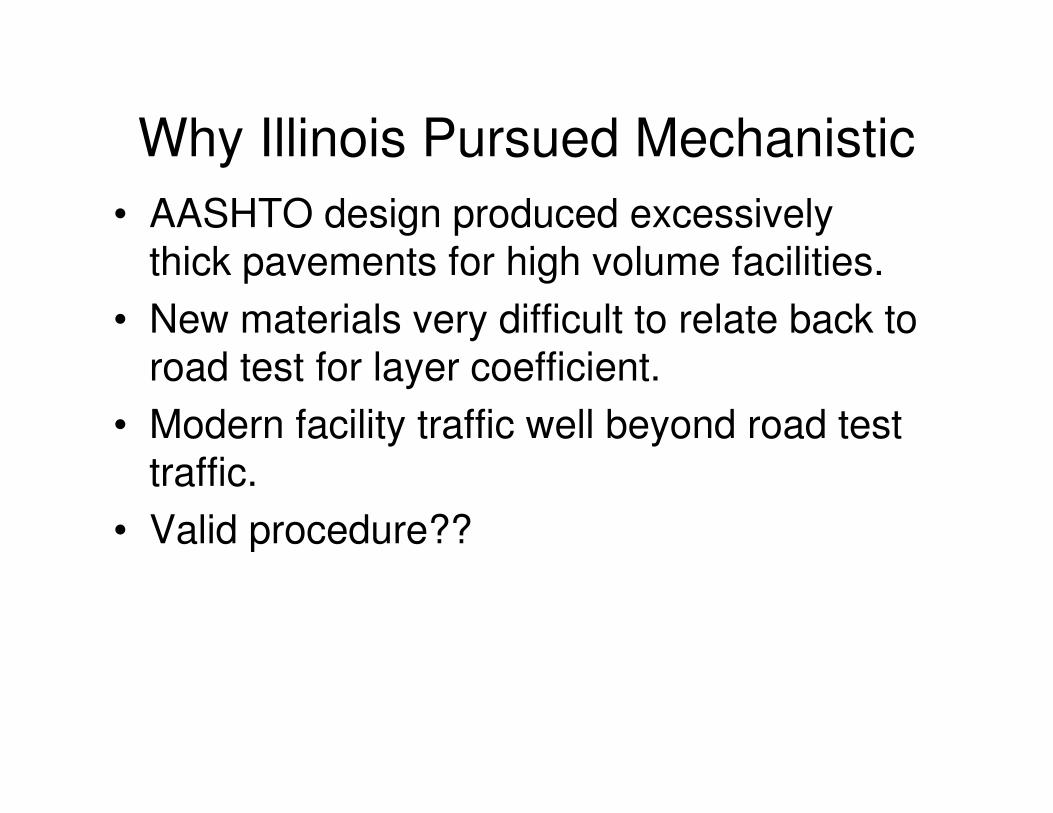
Why Illinois Pursued Mechanistic
• AASHTO design produced excessively
thick pavements for high volume facilities.
• New materials very difficult to relate back to
road test for layer coefficient.
• Modern facility traffic well beyond road test
traffic.
• Valid procedure??
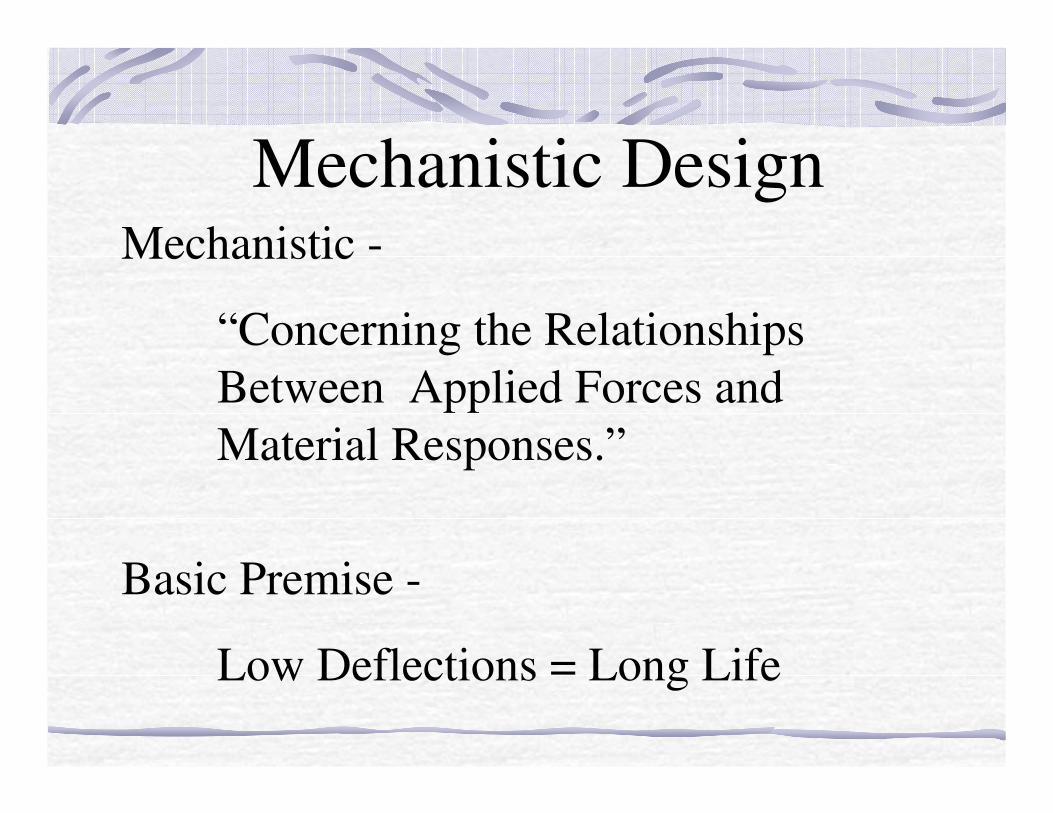
Mechanistic -
“Concerning the Relationships
Between Applied Forces and
Material Responses.”
Basic Premise -
Low Deflections = Long Life
Mechanistic Design

Mechanistic EngineeringMechanistic Engineering
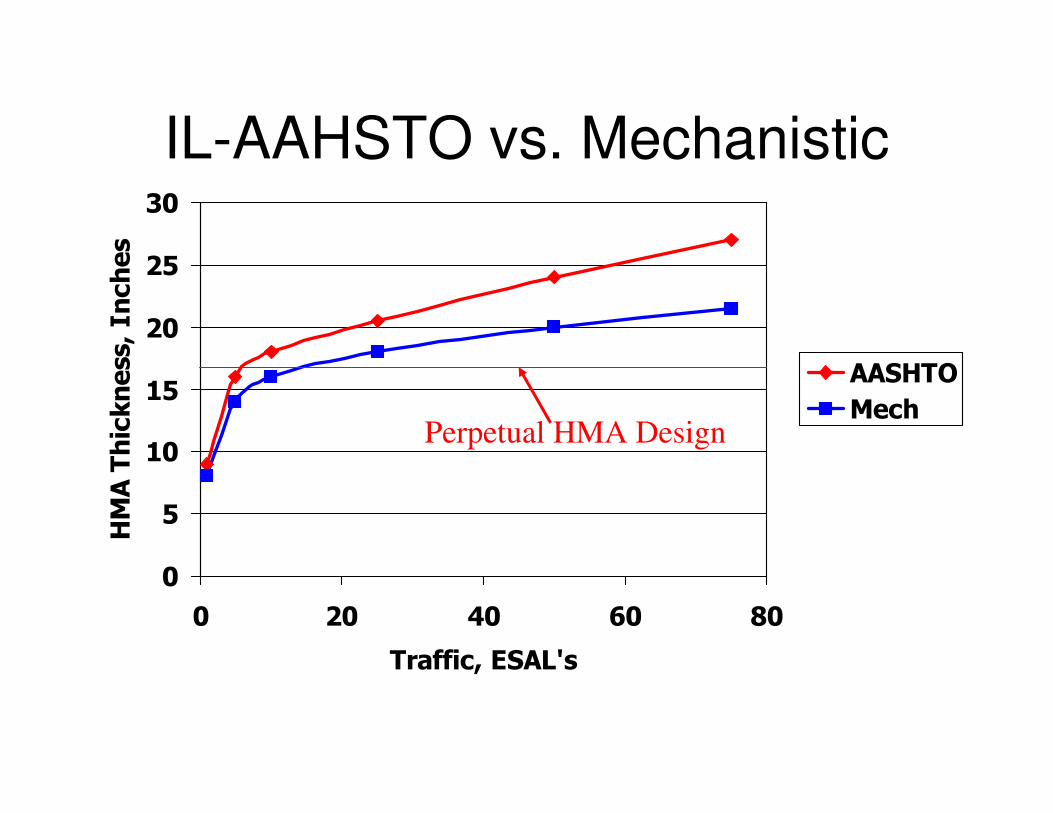
IL-AAHSTO vs. Mechanistic
0
5
10
15
20
25
30
0 20 40 60 80
Traffic, ESAL's
HM
A T
hic
kness, Inches
AASHTO
MechPerpetual HMA Design
Illinois Mechanistic-Empirical
Design• Research completed in 1987.
• Load spectrum discussed – dismissed.
• Designs based upon 18K ESAL’s.
• Results very complex.
• Many designer inputs.
• Policy decisions needed to simplify.
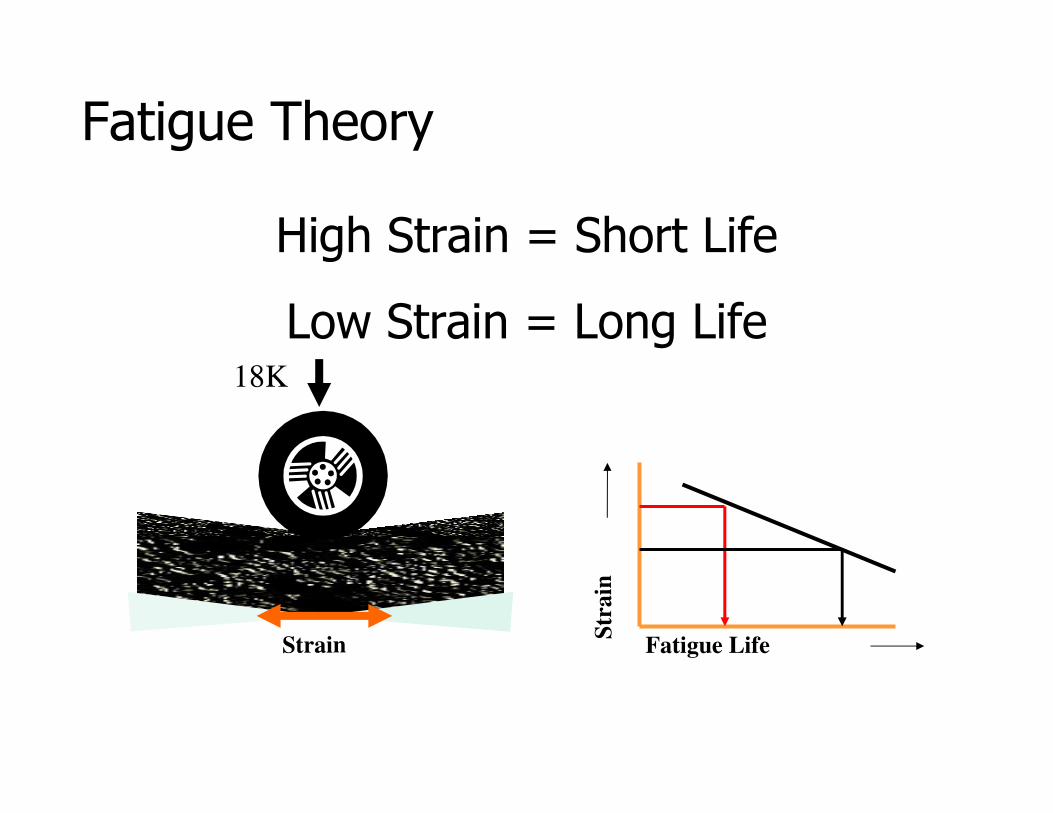
Strain Fatigue Life
Str
ain
High Strain = Short Life
Low Strain = Long Life
Fatigue Theory
18K
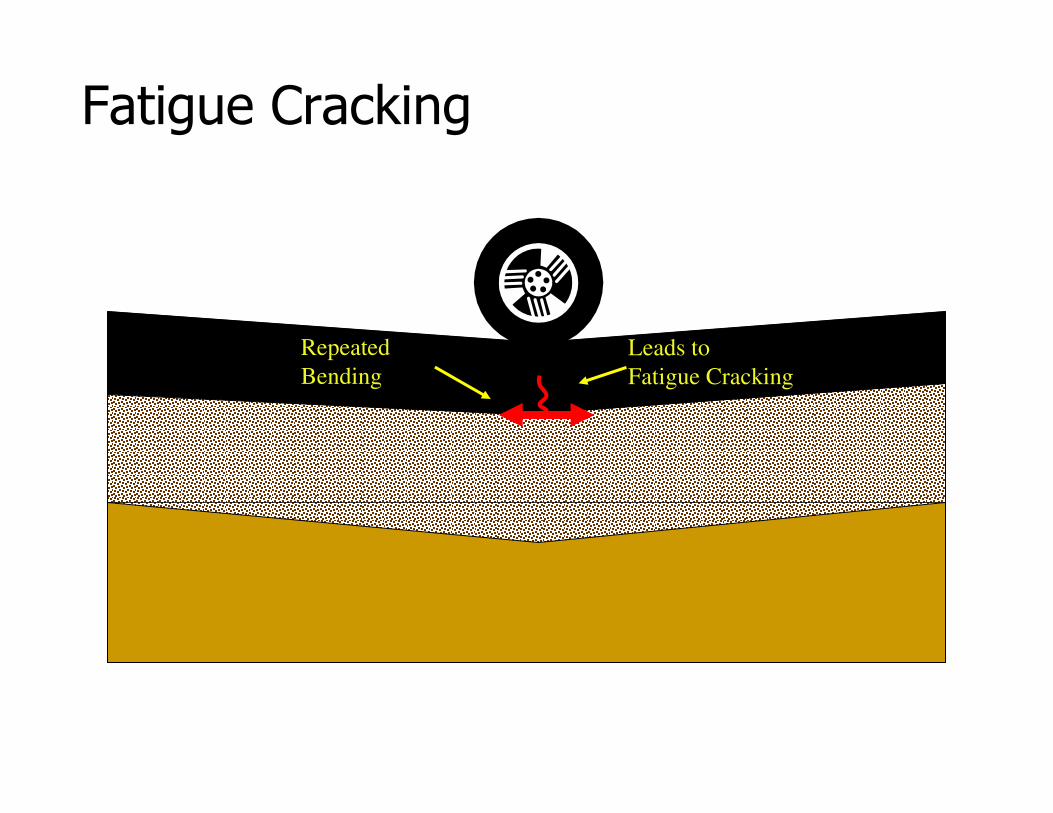
Fatigue Cracking
Repeated
Bending
Leads to
Fatigue Cracking
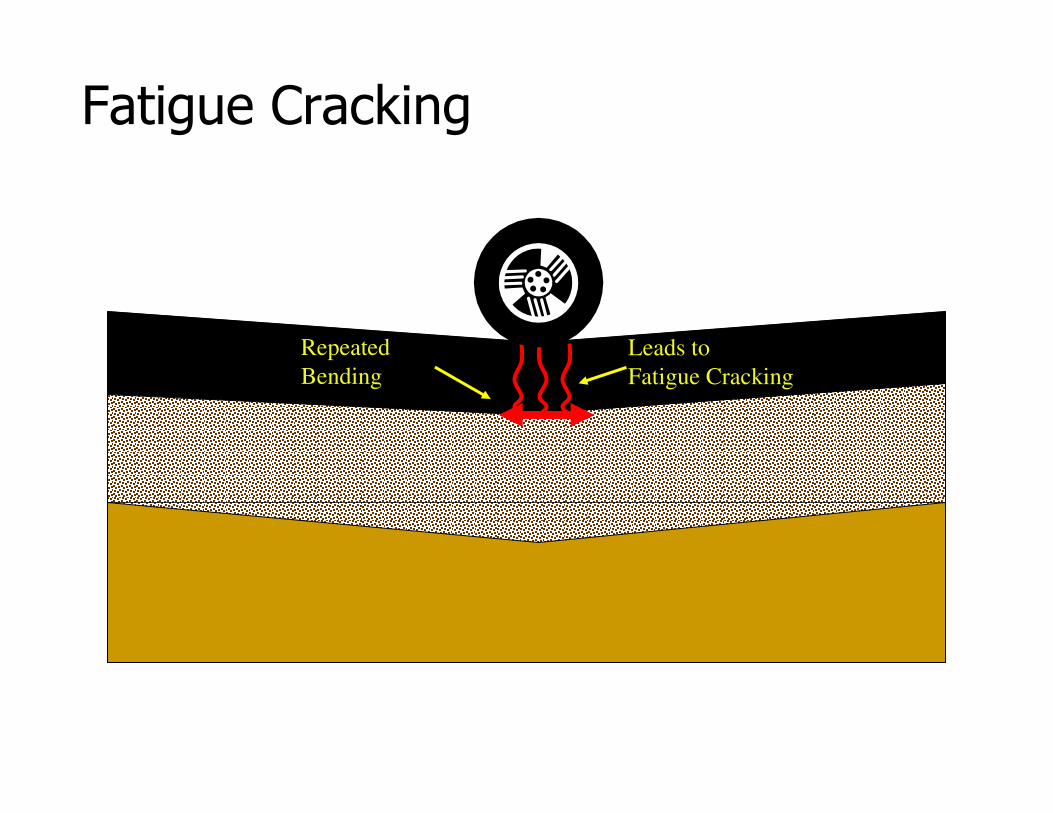
Repeated
Bending
Leads to
Fatigue Cracking
Fatigue Cracking
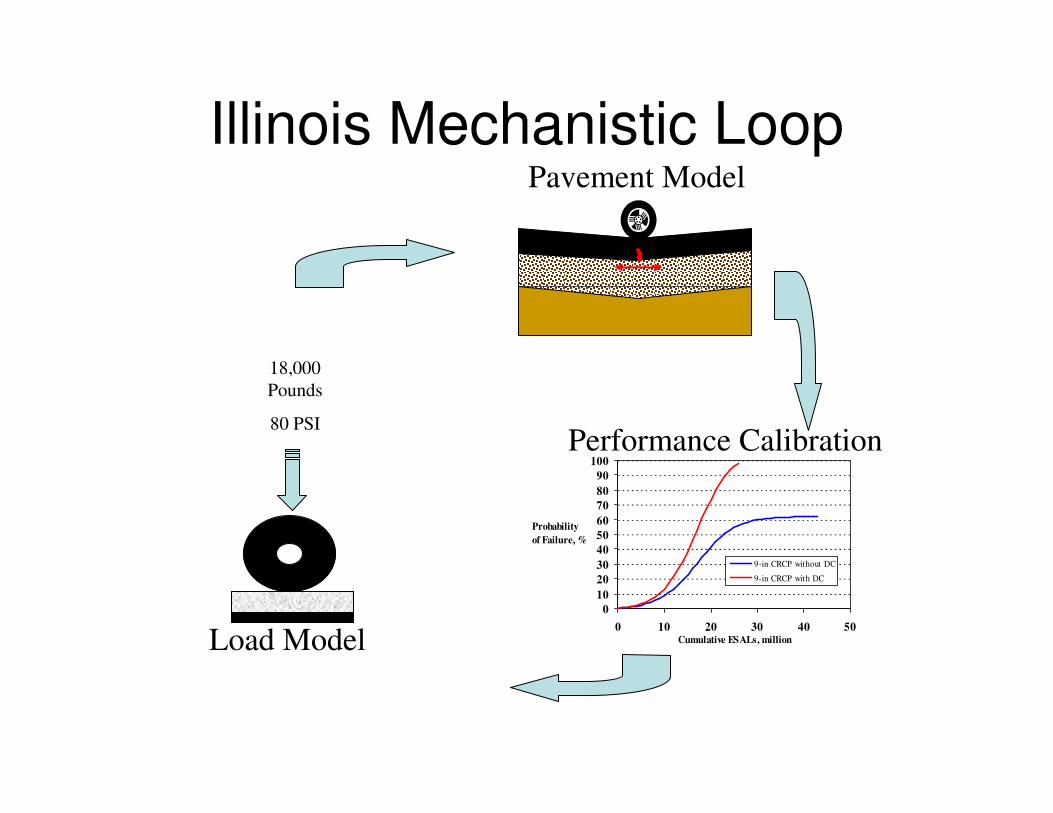
Illinois Mechanistic Loop
18,000
Pounds
80 PSI
Load Model
0
10
20
30
40
50
60
70
80
90
100
0 10 20 30 40 50Cumulative ESALs, million
Probability
of Failure, %
9-in CRCP without DC
9-in CRCP with DC
Pavement Model
Performance Calibration
Why Load Spectrum Not
Used• Data reliability.
– Calibration.
– Maintenance of equipment.
• Limited data collection ability.
– Expense.
– People – Head count limits.
• Data fit into performance calibration??
• Department understanding of ESAL’s.
Inputs – Full-Depth Asphalt
• Traffic.
• Soil Support (Eri).
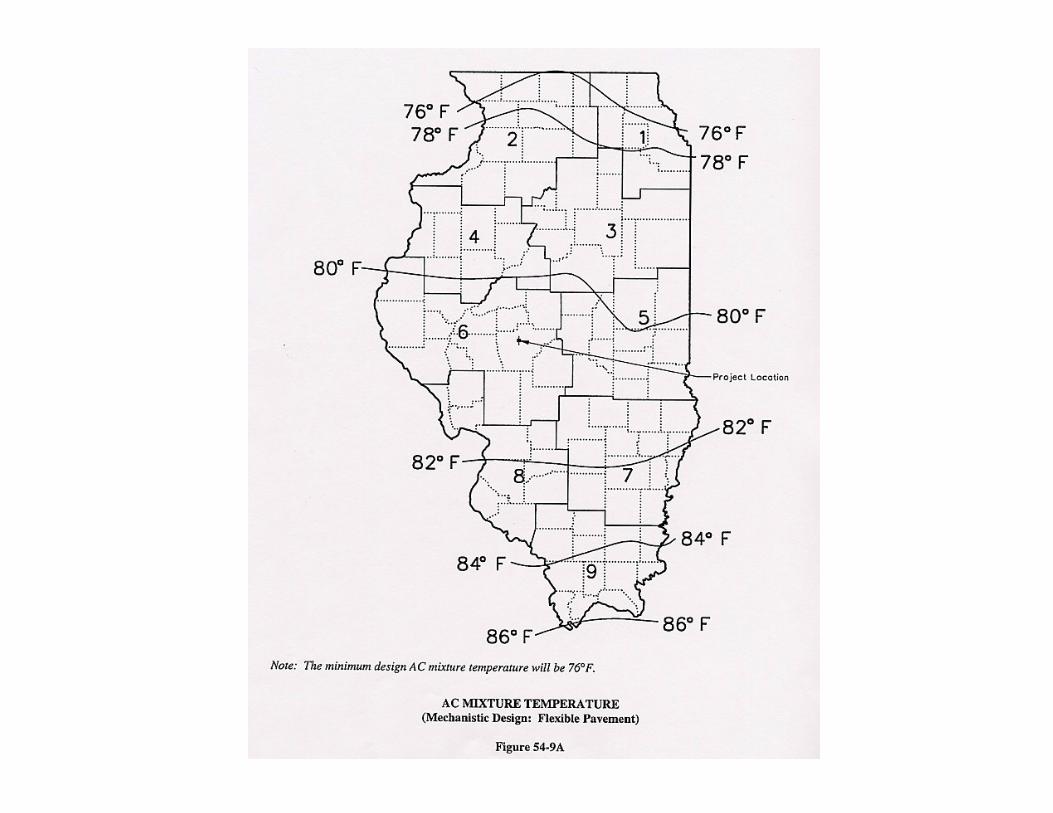
• Location (temperature/modulus relations).
• Asphalt grade.
• Mix air voids and gradation.
• Crack initiation at bottom of HMA.
• Reliability.
Inputs – Jointed Concrete
• Traffic.
• Soil support (k).
• Joint spacing.
• Joint load transfer.
• Edge support.
• Drainage conditions.
• Concrete strength .
• Slab cracking.
• Reliability.
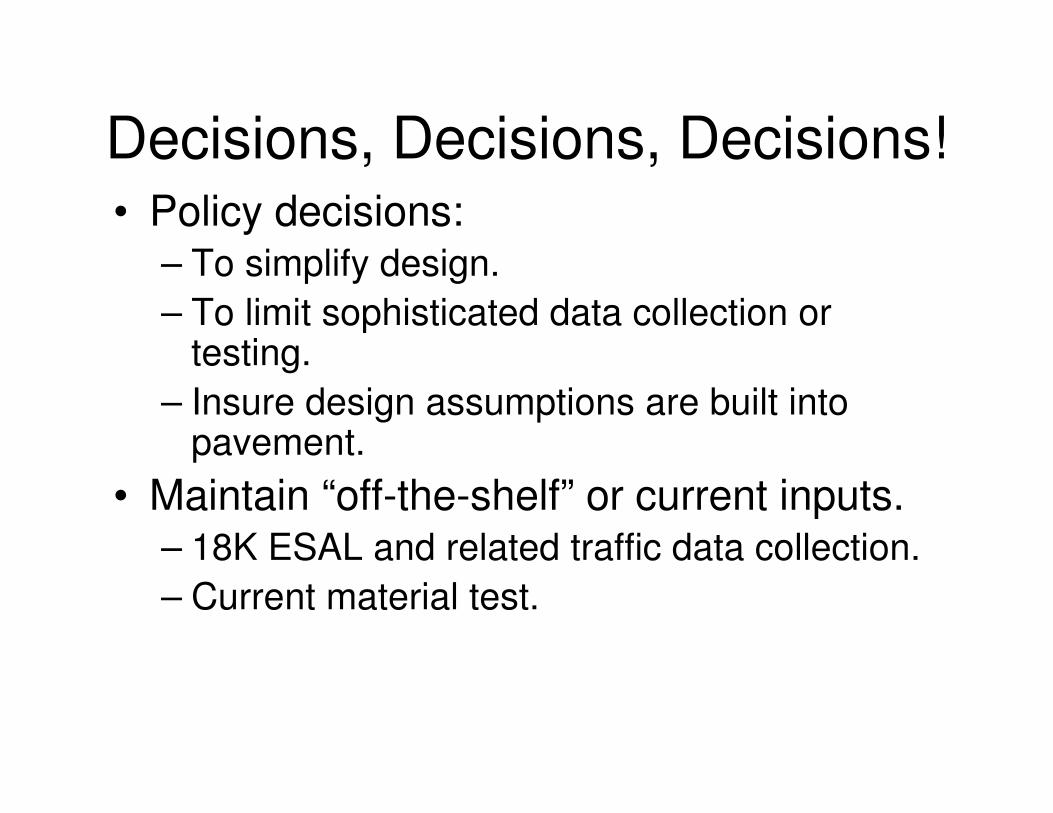
Decisions, Decisions, Decisions!• Policy decisions:
– To simplify design.
– To limit sophisticated data collection or testing.
– Insure design assumptions are built into pavement.
• Maintain “off-the-shelf” or current inputs.– 18K ESAL and related traffic data collection.
– Current material test.
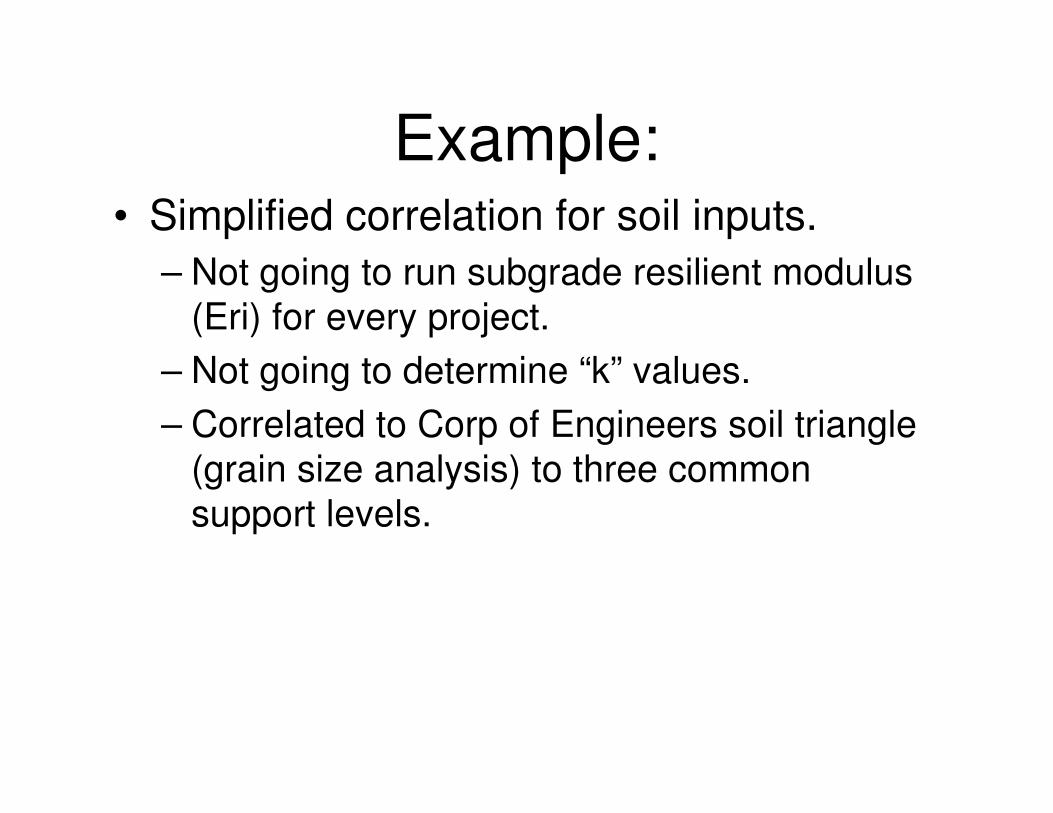
Example:• Simplified correlation for soil inputs.
– Not going to run subgrade resilient modulus
(Eri) for every project.
– Not going to determine “k” values.
– Correlated to Corp of Engineers soil triangle
(grain size analysis) to three common
support levels.

Soil Input 0
Percent Sand
0100
Per
cent
Cla
y Percent S
ilt
0
50
100
Poor
Fair
Gran
100
50
50
27% Clay
28% Sand
45% Silt
“Poor”
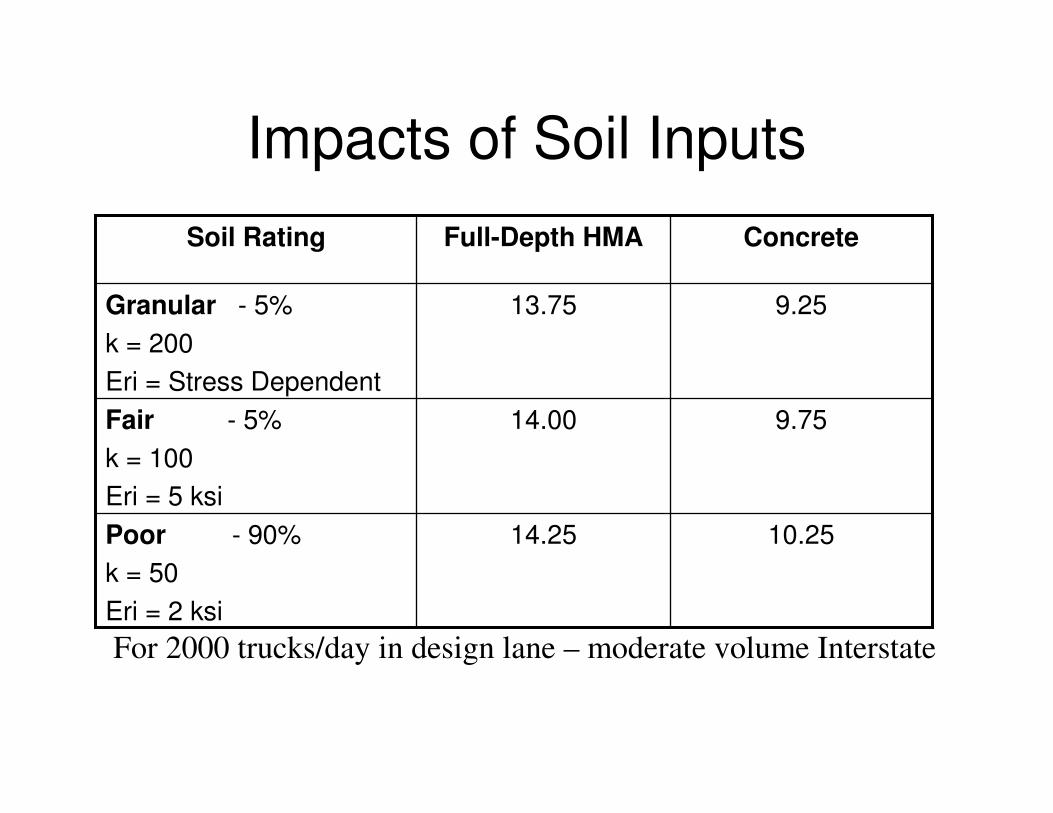
Impacts of Soil Inputs
10.2514.25Poor - 90%
k = 50
Eri = 2 ksi
9.7514.00Fair - 5%
k = 100
Eri = 5 ksi
9.2513.75Granular - 5%
k = 200
Eri = Stress Dependent
ConcreteFull-Depth HMASoil Rating
For 2000 trucks/day in design lane – moderate volume Interstate
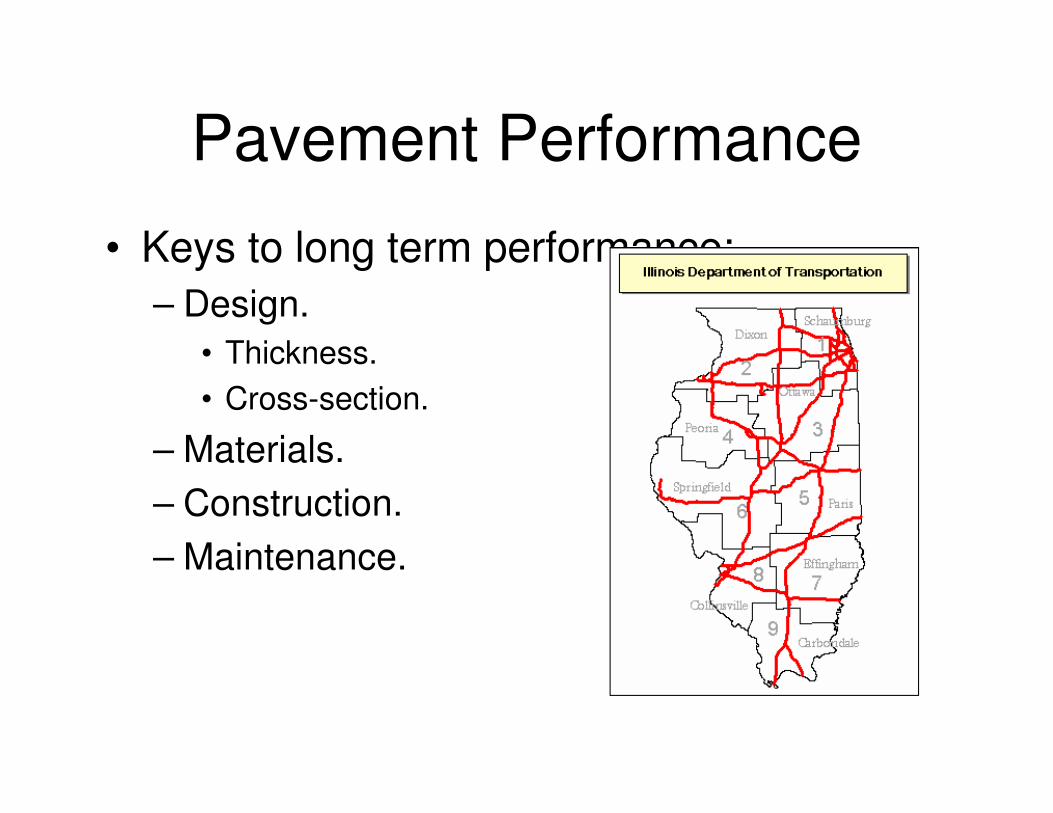
Pavement Performance
• Keys to long term performance:
– Design.
• Thickness.
• Cross-section.
– Materials.
– Construction.
– Maintenance.
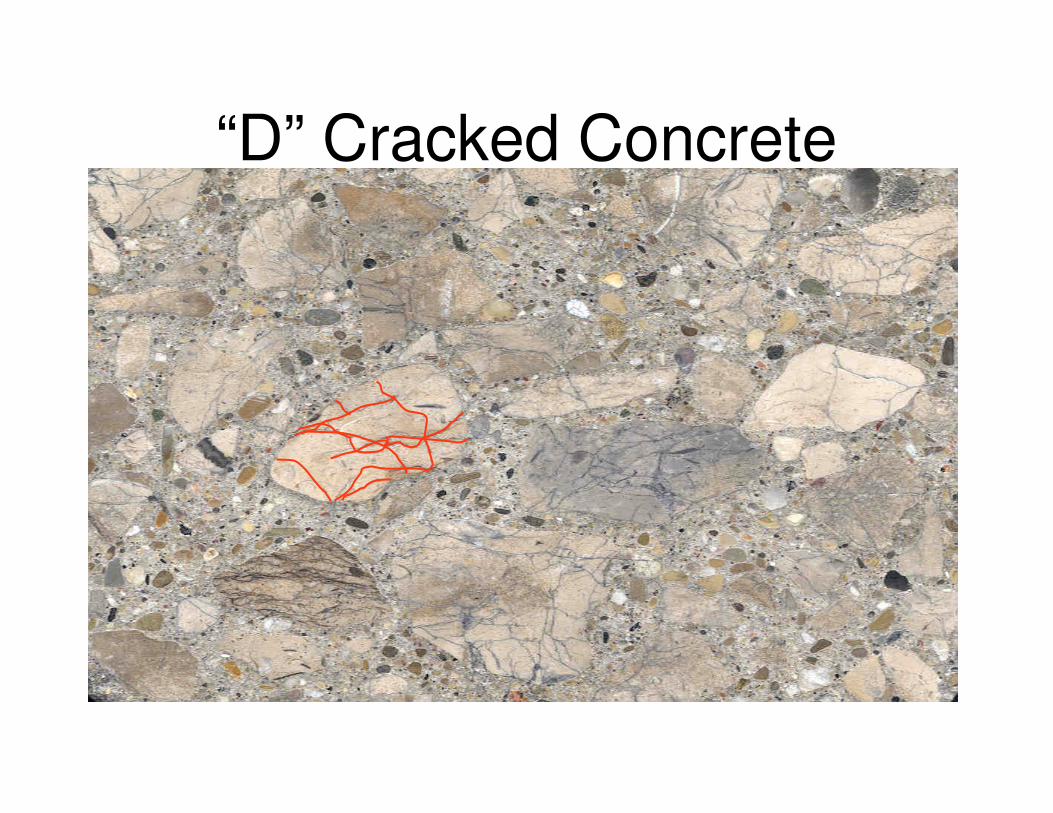
“D” Cracked Concrete
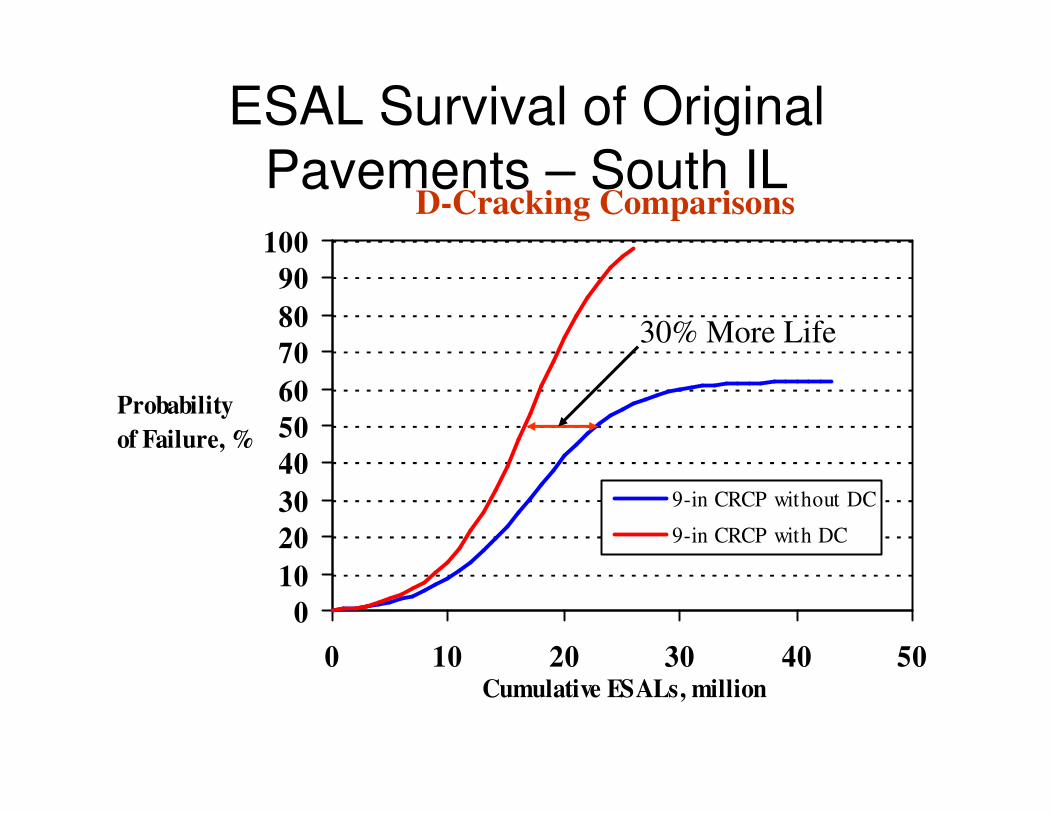
ESAL Survival of Original
Pavements – South IL
0
10
20
30
40
50
60
70
80
90
100
0 10 20 30 40 50Cumulative ESALs, million
Probability
of Failure, %
9-in CRCP without DC
9-in CRCP with DC
D-Cracking Comparisons
30% More Life
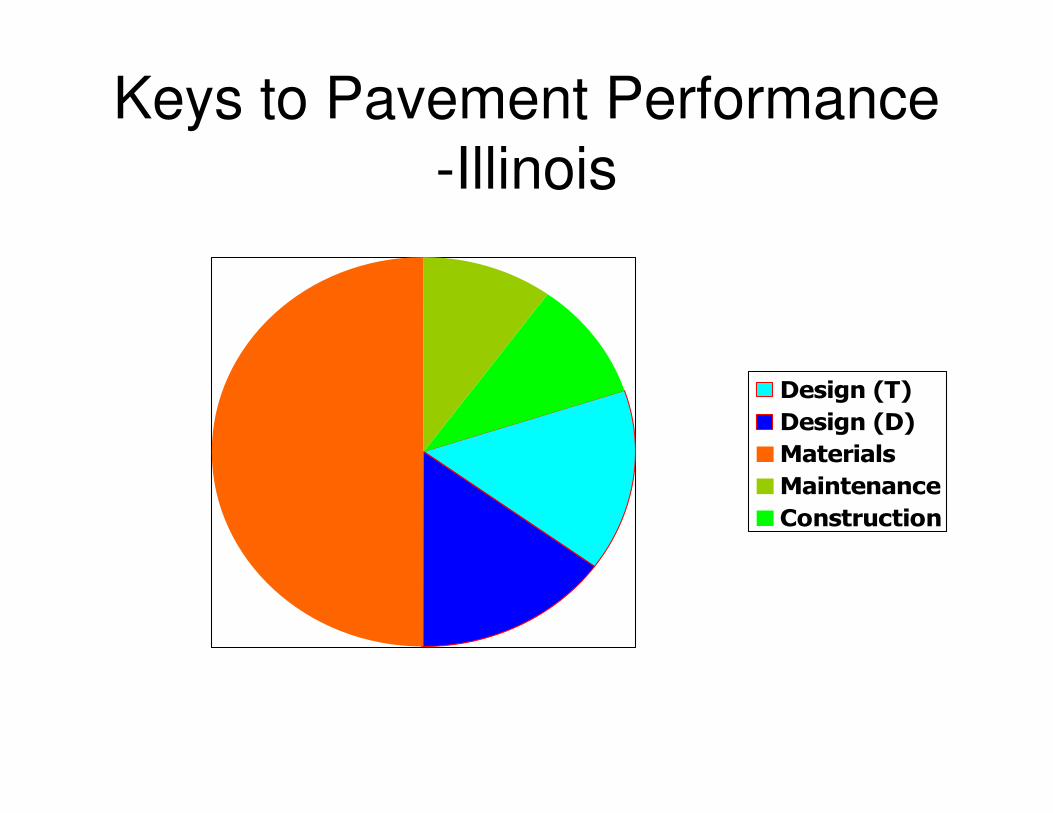
Keys to Pavement Performance
-Illinois
Design (T)
Design (D)
Materials
Maintenance
Construction
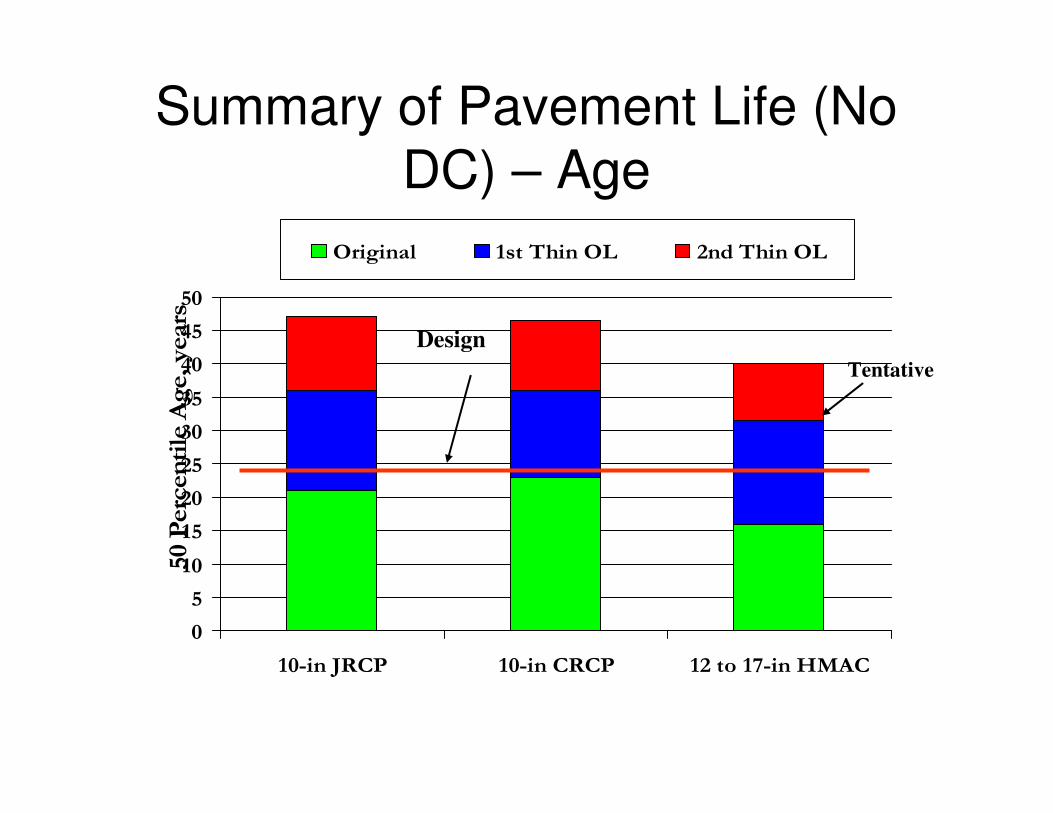
Summary of Pavement Life (No
DC) – Age
0
5
10
15
20
25
30
35
40
45
50
10-in JRCP 10-in CRCP 12 to 17-in HMAC
50 Percentile Age, years
Original 1st Thin OL 2nd Thin OL
Tentative
Design
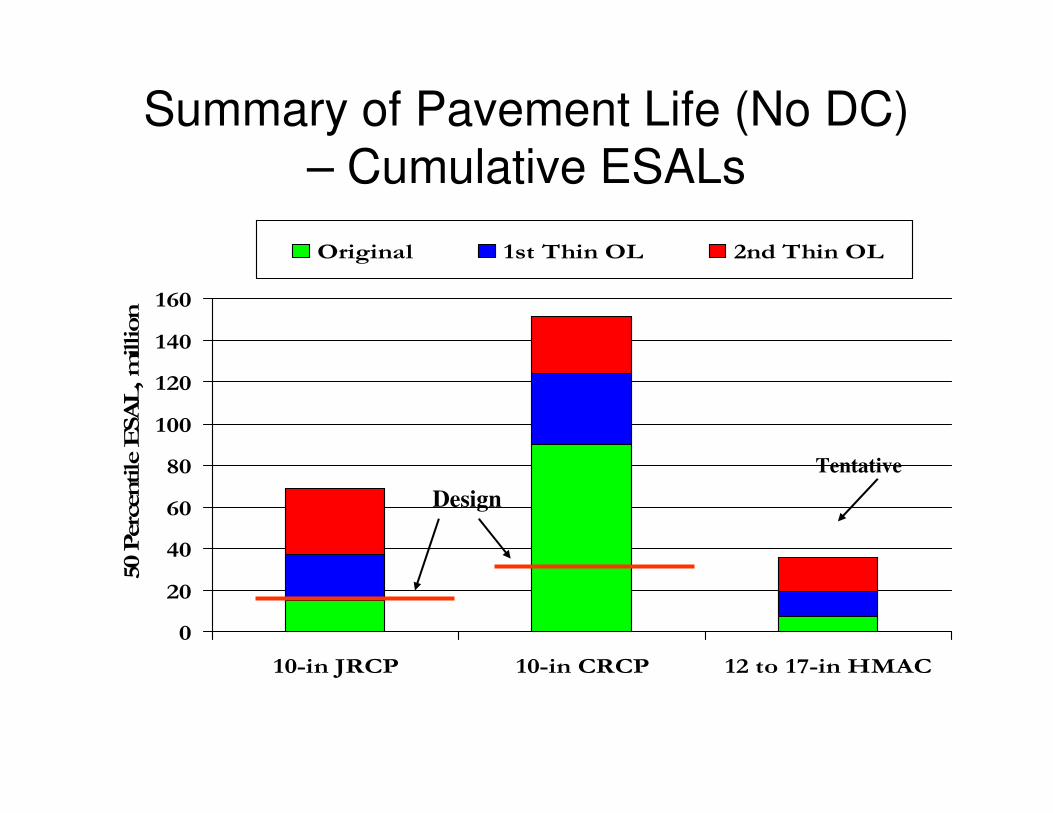
Summary of Pavement Life (No DC)
– Cumulative ESALs
0
20
40
60
80
100
120
140
160
10-in JRCP 10-in CRCP 12 to 17-in HMAC
50 Percentile ESAL, million
Original 1st Thin OL 2nd Thin OL
Tentative
Design
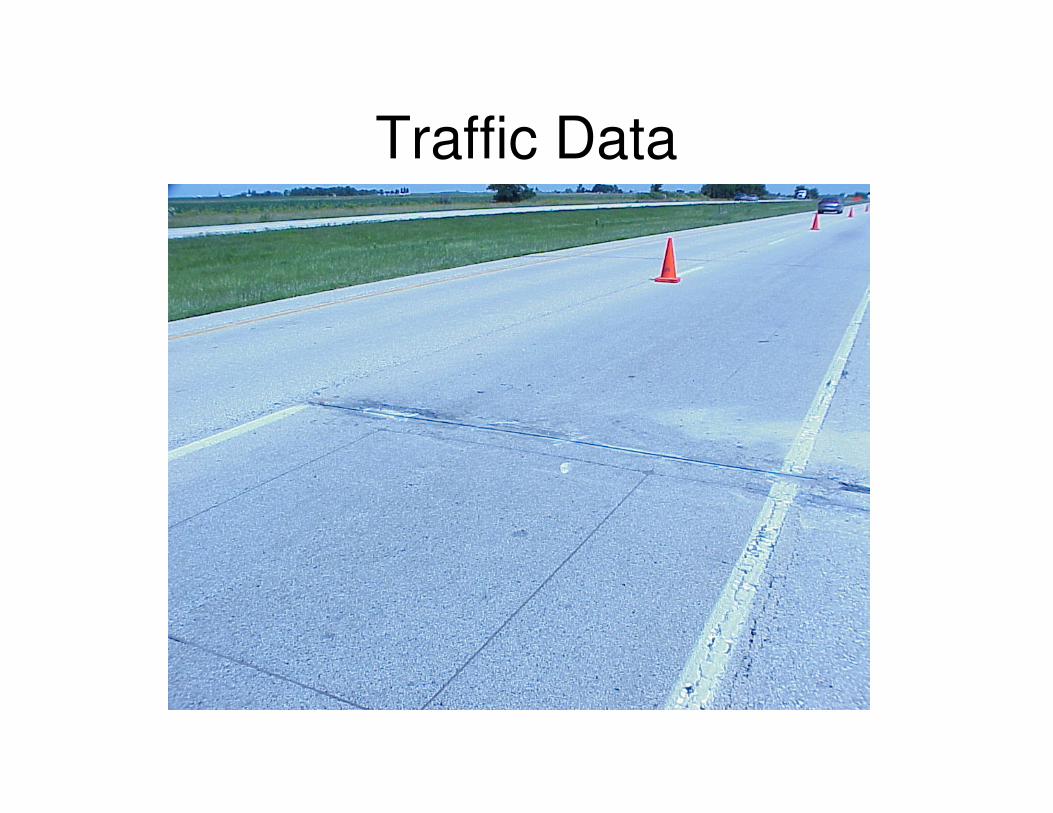
Traffic Data
Search for New Portable
Equipment
• Safety of the worker
• Quality and Quantity of data collected
• Cost to the Department
• Comply with new FHWA’s Traffic Monitoring Guide (TMG)
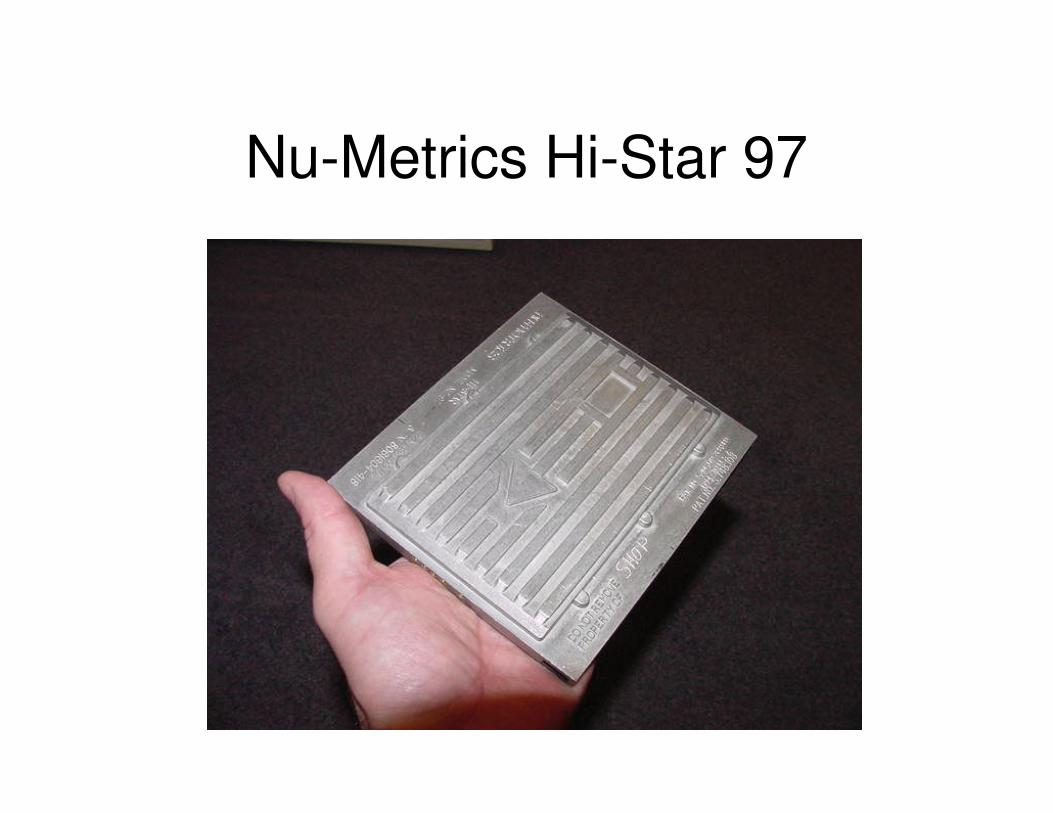
Nu-Metrics Hi-Star 97
PV, SU and MUPassenger Vehicles (PV)
Cars
Light Trucks
Buses 4
2 Axle 5
3 Axle 6
4 Axle 7
Single Unit (SU)
Class 2
Class 3
Class
Multiple Unit (MU)
Class 8 to 13
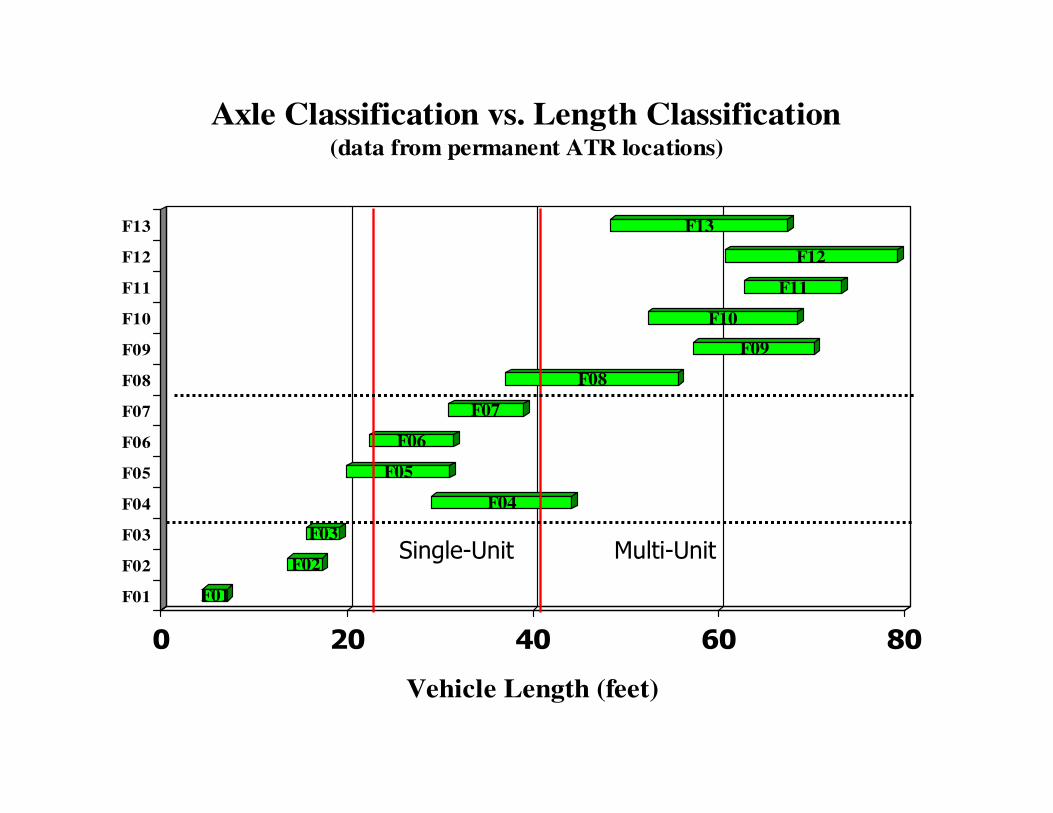
F01
F02
F03
F04
F05
F06
F07
F08
F09
F10
F11
F12
F13
0 20 40 60 80
Vehicle Length (feet)
F01
F02
F03
F04
F05
F06
F07
F08
F09
F10
F11
F12
F13
Axle Classification vs. Length Classification(data from permanent ATR locations)
Single-Unit Multi-Unit
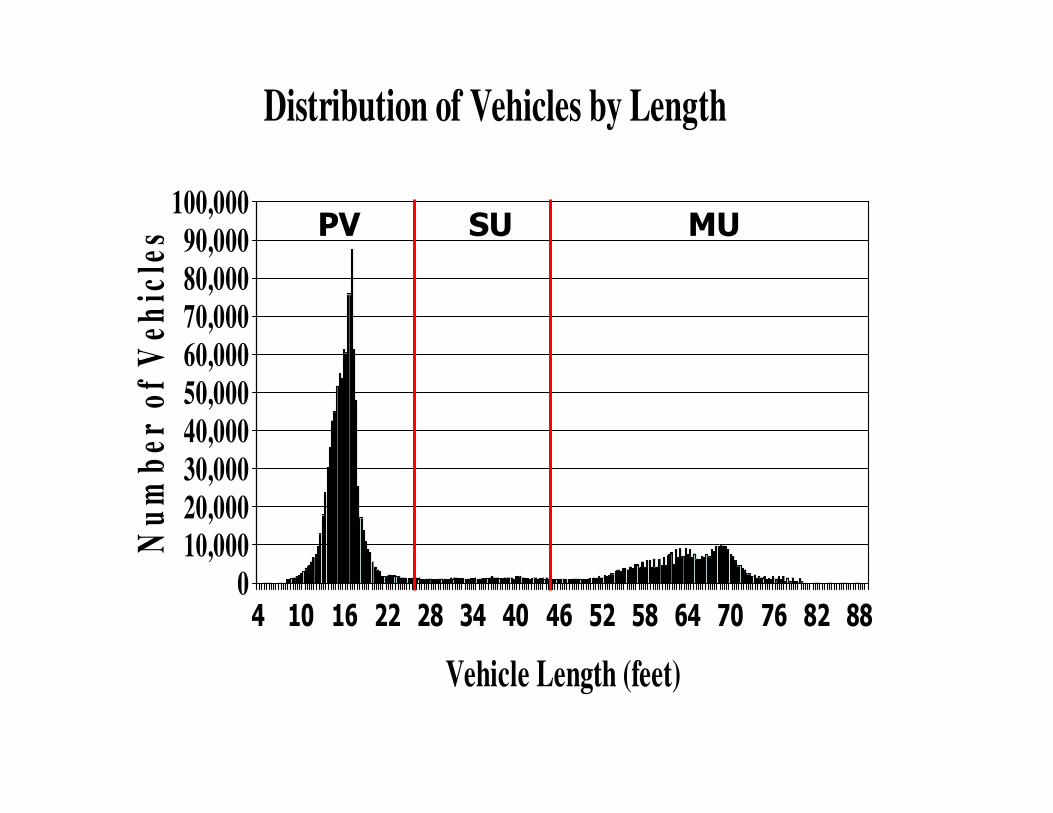
0
10,000
20,000
30,000
40,000
50,000
60,000
70,000
80,000
90,000
100,000
Nu
mb
er
of
Ve
hic
les
4 10 16 22 28 34 40 46 52 58 64 70 76 82 88
Vehicle Length (feet)
Distribution of Vehicles by Length
PV SU MU
Minimum Designs:
Former procedure:
Minimum thickness by facility type
Same statewide
Industry issues
Illinois Mechanistic Design
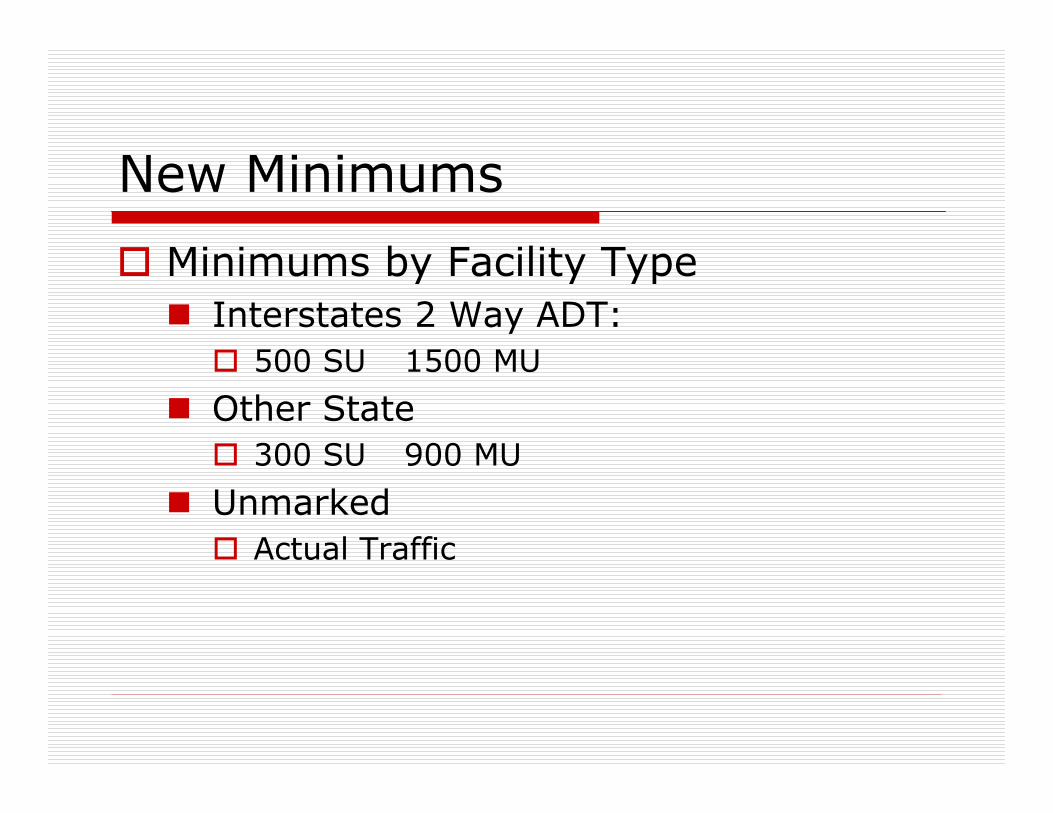
New Minimums
� Minimums by Facility Type
� Interstates 2 Way ADT:
� 500 SU 1500 MU
� Other State
� 300 SU 900 MU
� Unmarked
� Actual Traffic
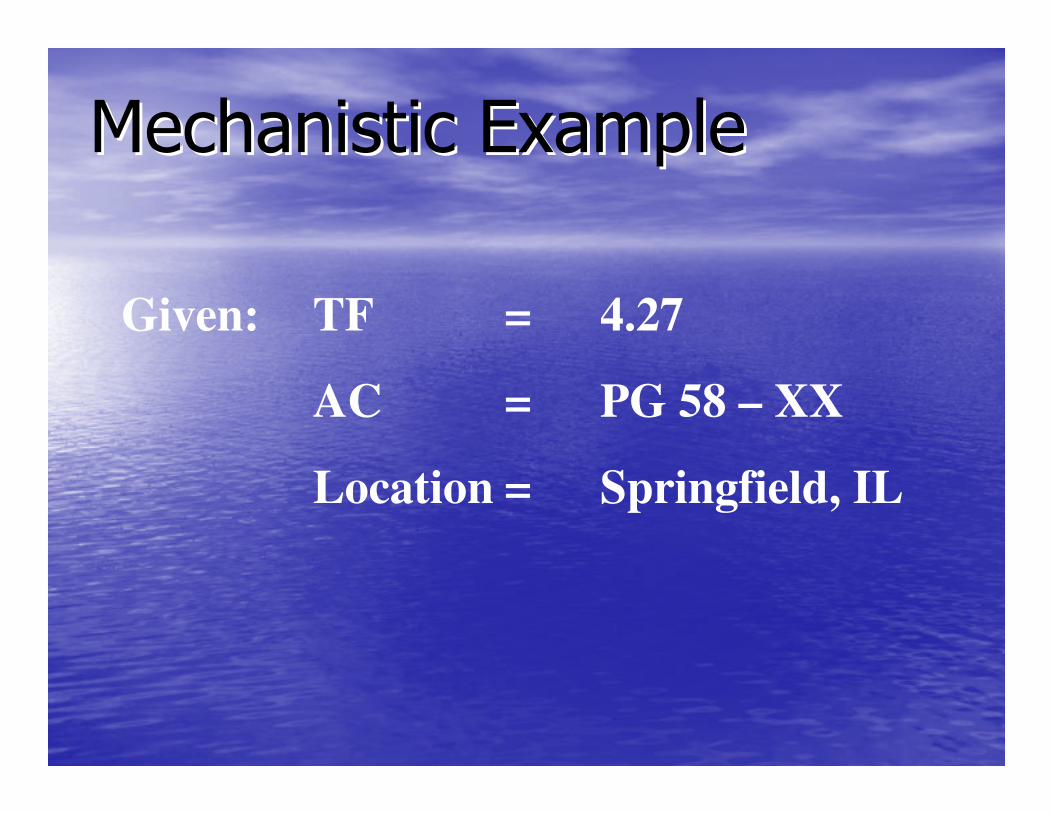
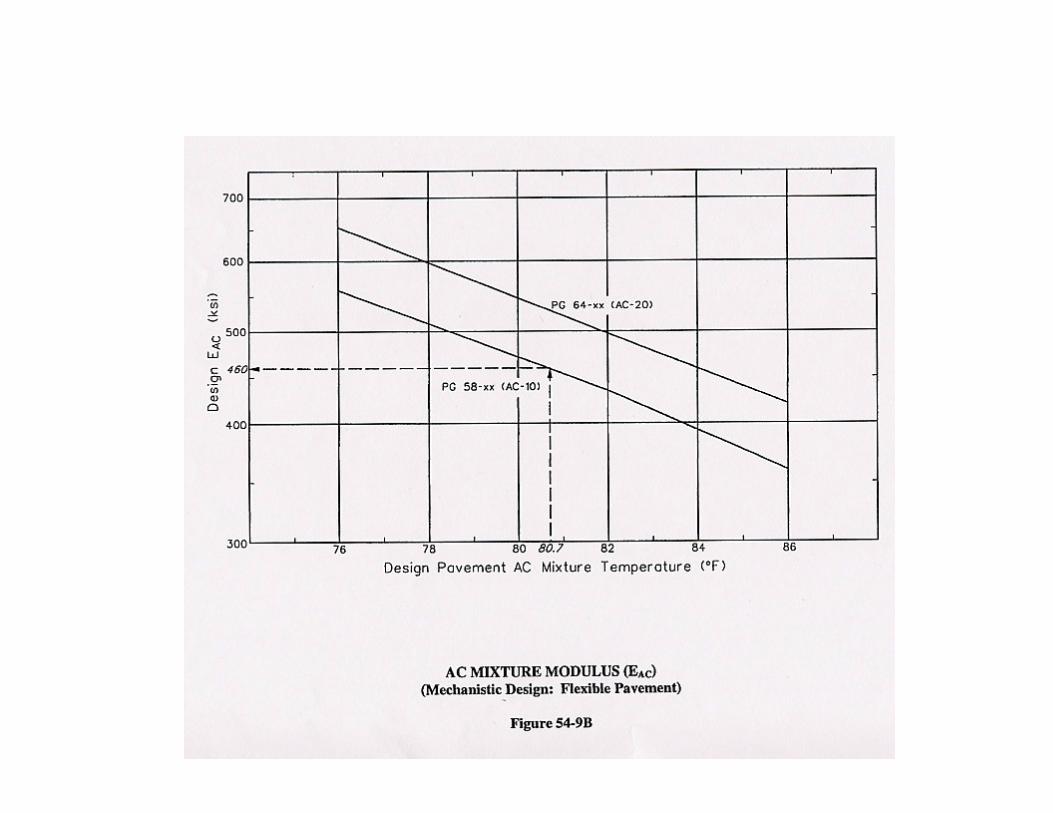
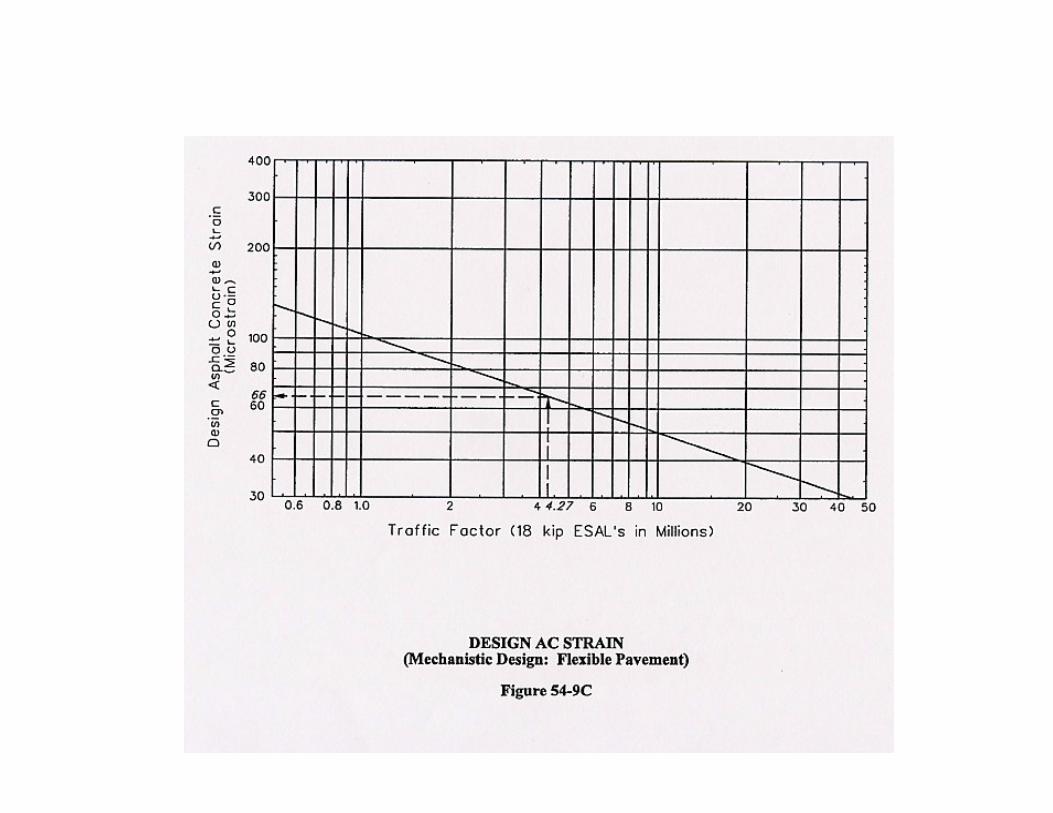
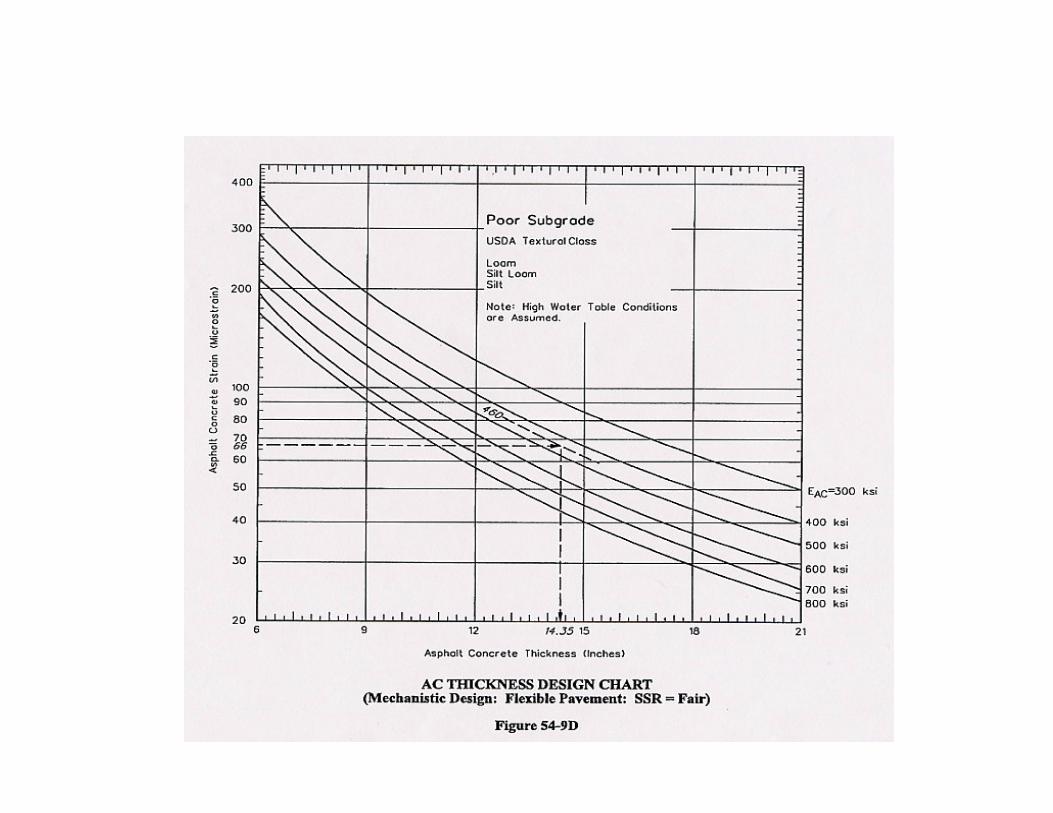
Mechanistic ExampleMechanistic Example
Given: TF = 4.27
AC = PG 58 – XX
Location = Springfield, IL
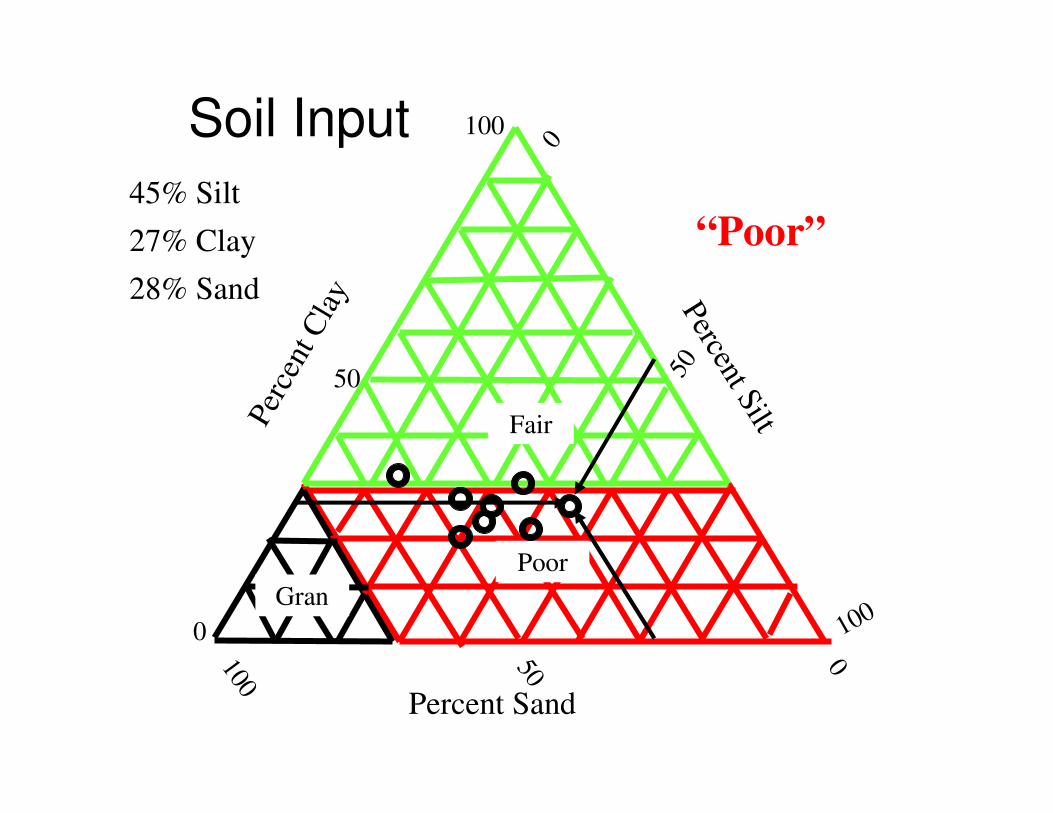
Soil Input
0
Percent Sand
0100
Per
cent
Cla
y Percent S
ilt
0
50
100
Poor
Fair
Gran
100
50
50
27% Clay
28% Sand
45% Silt
“Poor”
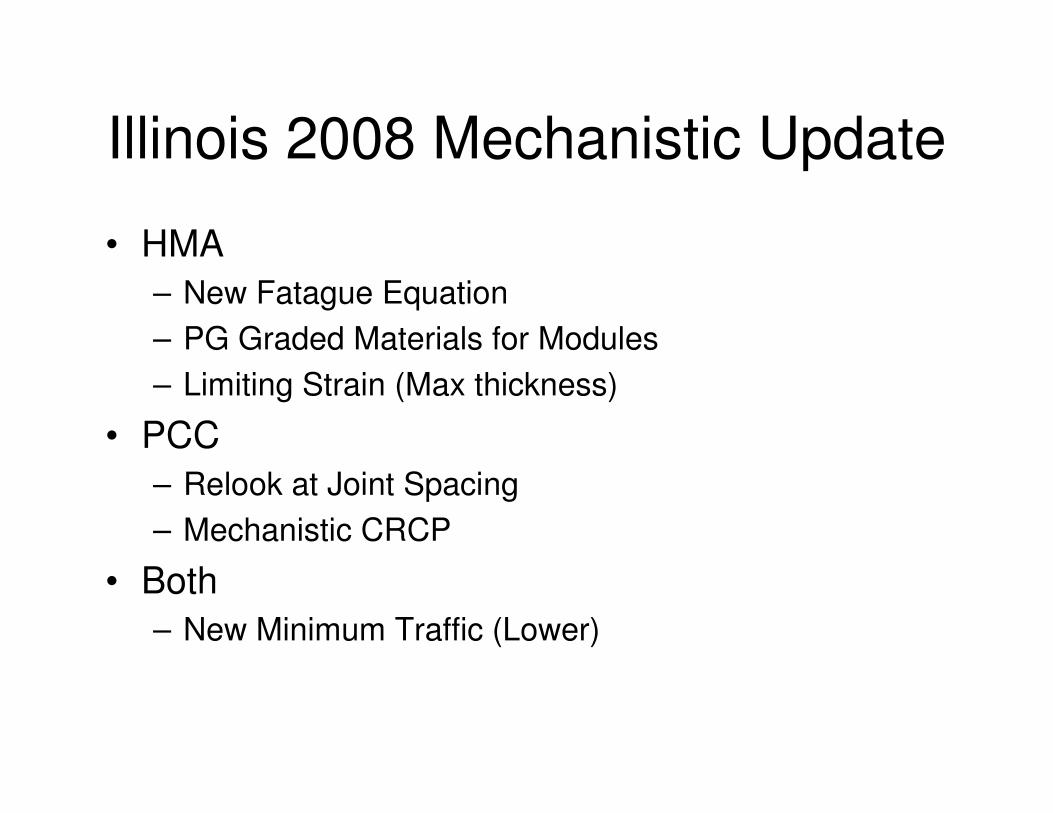
Illinois 2008 Mechanistic Update
• HMA
– New Fatague Equation
– PG Graded Materials for Modules
– Limiting Strain (Max thickness)
• PCC
– Relook at Joint Spacing
– Mechanistic CRCP
• Both
– New Minimum Traffic (Lower)
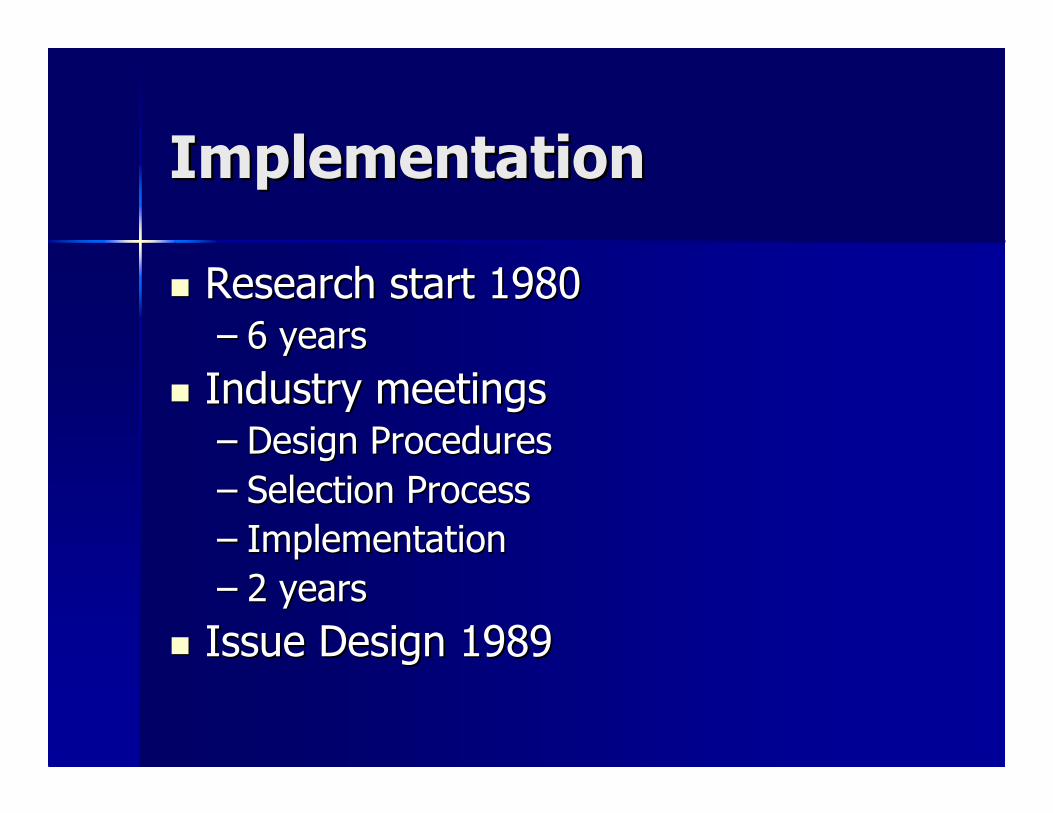
ImplementationImplementation
�� Research start 1980Research start 1980–– 6 years6 years
�� Industry meetingsIndustry meetings–– Design ProceduresDesign Procedures
–– Selection ProcessSelection Process
–– ImplementationImplementation
–– 2 years2 years
�� Issue Design 1989Issue Design 1989
Issues after Issues after
ImplementationImplementation
�� Industry questionsIndustry questions
�� FHWA/IDOT reviewFHWA/IDOT review
�� Revisions 1992Revisions 1992
Summary/Suggestions
• Review design.
• Determine where performance gains needed in your state.– Durability (materials)
– Design
– Other
• Determine merits of each design input and worth of refinement.
• Involve industry
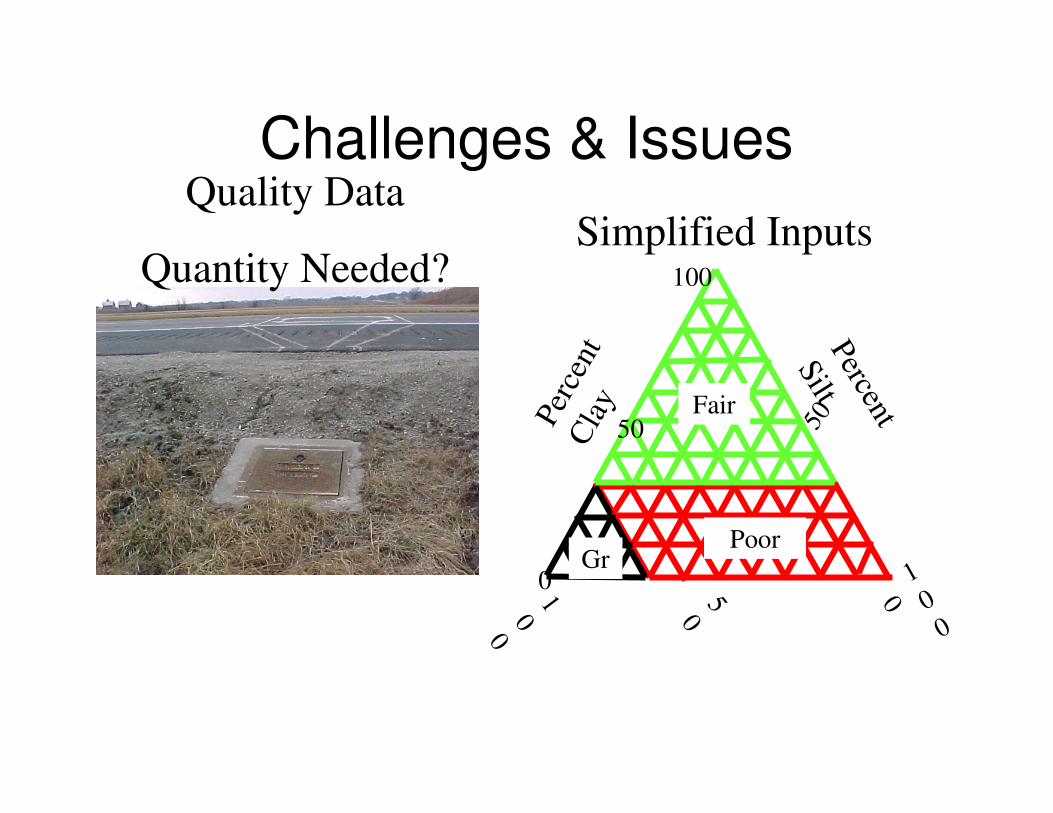
Challenges & IssuesQuality Data
Quantity Needed?
010
0Per
cent
C
lay
Percent
Silt
0
50
100
Poor
Fair
Gr1
00
50
50
Simplified Inputs

Lincoln’s Home
Springfield, Illinois
Questions?