Embed Size (px)
Citation preview

8/8/2019 IJCN v1 i1
http://slidepdf.com/reader/full/ijcn-v1-i1 1/89
8/8/2019 IJCN v1 i1
http://slidepdf.com/reader/full/ijcn-v1-i1 2/89
Editor in Chief Associate Professor Min Song
International Journal of Computer
Networks (IJCN)
Book: 2008 Volume 1, Issue 1
Publishing Date: 30-11-2009
Proceedings
ISSN (Online): 1985-4129
This work is subjected to copyright. All rights are reserved whether the whole orpart of the material is concerned, specifically the rights of translation, reprinting,
re-use of illusions, recitation, broadcasting, reproduction on microfilms or in any
other way, and storage in data banks. Duplication of this publication of parts
thereof is permitted only under the provision of the copyright law 1965, in its
current version, and permission of use must always be obtained from CSC
Publishers. Violations are liable to prosecution under the copyright law.
IJCN Journal is a part of CSC Publishers
http://www.cscjournals.org
©IJCN Journal
Published in Malaysia
Typesetting: Camera-ready by author, data conversation by CSC Publishing
Services – CSC Journals, Malaysia
CSC Publishers
8/8/2019 IJCN v1 i1
http://slidepdf.com/reader/full/ijcn-v1-i1 3/89
Table of Contents
Volume 1, Issue 1, November 2009.
Pages
1 - 20
66 - 84
21 - 35
Deterministic Formulization of End-to-End Delay and Bandwidth
Efficiency for Multicast Systems
Syed S. Rizvi, Aasia Riasat, Khaled M. Elleithy
Soft Real-Time Guarantee for Control Applications Using Both
Measurement and Analytical Techniques.
Baek-Young Choi, Sejun Song
Achieving Energy Proportionality In Server Clusters
Xinying Zheng, Yu Cai
46 - 65 Network Service Description and Discovery for the Next
Generation Internet
Enyue Lu, Qiang Duan

8/8/2019 IJCN v1 i1
http://slidepdf.com/reader/full/ijcn-v1-i1 4/89
36 - 45 A Cross-Layer Packet Loss Identification Scheme to Improve TCP
Veno Performance
Sachin Shetty, Ying Tang, William Collani
International Journal of Computer Networks (IJCN), Volume (1), Issue (1)
8/8/2019 IJCN v1 i1
http://slidepdf.com/reader/full/ijcn-v1-i1 5/89
Syed S. Rizvi, Aasia Riasat, & Khaled M. Elleithy
International Journal of Computer Networks (IJCN), Volume (1): Issue (1) 1
Deterministic Formulization of End-to-End Delay andBandwidth Efficiency for Multicast Systems
Syed S. Rizvi [email protected] Science and Engineering Department University of Bridgeport Bridgeport, CT 06601, USA
Aasia Riasat [email protected] Science Department Institute of Business Management Karachi, 78100, Pakistan
Khaled M. Elleithy [email protected] Science and Engineering Department
University of Bridgeport Bridgeport, CT 06601, USA
Abstract
End-System multicasting (ESM) is a promising application-layer scheme that hasbeen recently proposed for implementing multicast routing in the application layeras a practical alternative to the IP multicasting. Moreover, ESM is an efficientapplication layer solution where all the multicast functionality is shifted to the endusers. However, the limitation in bandwidth and the fact that the message needsto be forwarded from host-to-host using unicast connection, and consequentlyincrementing the end-to-end delay of the transmission process, contribute to theprice to pay for this new approach. Therefore, supporting high-speed real-timeapplications such as live streaming multimedia, videoconferencing, distributedsimulations, and multiparty games require a sound understanding of thesemulticasting schemes such as IP multicast and ESM and the factors that mightaffect the end-user requirements. In this paper, we present both the analyticaland the mathematical models for formalizing the end-to-end delay and thebandwidth efficiency of both IP and ESM multicast system. For the sake of theexperimental verifications of the proposed models, numerical and simulationresults are presented in this paper. Finally, the proposed formulization can beused to design and implement a more robust and efficient multicast systems forthe future networks. Keywords: Bandwidth Analysis, End-to-End Delay, End System Multicast, IP Multicast, Overlay Networks.
1. INTRODUCTION
There is an emerging class of Internet and Intranet multicast applications that are designed tofacilitate the simultaneous delivery of information from a single or multiple senders to multiple

8/8/2019 IJCN v1 i1
http://slidepdf.com/reader/full/ijcn-v1-i1 6/89
Syed S. Rizvi, Aasia Riasat, & Khaled M. Elleithy
International Journal of Computer Networks (IJCN), Volume (1): Issue (1) 2
receivers. Different approaches of multicasting have been suggested to improve the overallperformance of networks especially the Internet [1, 2, 3, 4]. These approaches are: multipleunicast, IP multicast, and end-system multicast. All of these methods have some advantages anddisadvantages but the last two approaches (IP multicast, and end-system multicast) mentionedabove have had more research effort in terms of performance evaluation of networks. Multipleunicast can be described as a service where one source sends the same copy of the message tomultiple destinations. There is a one to one connection all the way from the source to thedestination. No special configuration is required. In IP multicast, one source sends data to aspecific group of receivers. In this case, a unique and special IP address is used, a class Daddress for the entire group. In addition, there is a special configuration adopted for efficiencyreasons. A tree rooted at the source is constructed and only one copy of the message is sentsince the routers along the paths to the destinations performed the necessary replicationfunctionalities.
Finally, the end-system multicasting is a very promising application layer solution where all themulticast functionality is shifted to the end users [7]. In an end-system multicasting approach,host participating in an application session have the responsibility to forward information to otherhosts depending on the role assigned by a central data and control server [15]. In this case, thearchitecture adopted is similar to that of IP multicast with the difference that only IP unicastservice is required. End-system multicast uses an overlay structure, which is established on top
of the traditional unicast services. In this way, every pair of edges (source-destination) is aunicast connection. The overlay has its meaning from the fact that the same link can havemultiple unicast connections for multiple pair of edges. Although, end-system multicast seems tohave many advantages (no further changes to the network are required, user has more control ofthe application layer, no need of special multicast router capability, etc), there is a penalty to pay.In the overlay structure, hosts are able to multicast information and consequently use the samelink to redirect packets increasing the end-to-end delay of the entire transmission process [3, 8].Another problem is the number of receivers that a potential “multicast” host can support. Endusers have a limited bandwidth and suffer the last mile problem [9].
While these different multicast approaches can displace some of the costs of face-to-facecommunications, their true potential business benefit lies in improving the accessibility andtimeliness of information, vastly increasing its value to both the organization and individual
employees. Although research on multicast dates back to the early days of the Internet, it has yetto produce a multicast service that is ubiquitously and economically available. In spite of theperformance advantages, commercial deployment of multicast has not yet been fully realized.One of factors that prevent the wide-range deployment of multicast is the difficulty in providingreliable multicast transport.
Fortunately, recently there has been a renewed effort to realize different approaches ofmulticasting. In this paper, we are also going to analyze these different methods of multicastingwith respect to their performance differences.
2. THEORETICAL ANALYSIS OF MULTICAST SYSTEMS
The Internet consists of interconnected LANs. A LAN may or may not have native multicastingsupport and the same holds for the IP layer on top of the LAN. In this section, we will theoreticallyanalyze the problems of different level of multicasting, which hinder their performance withrespect to the bandwidth utilization and latency.
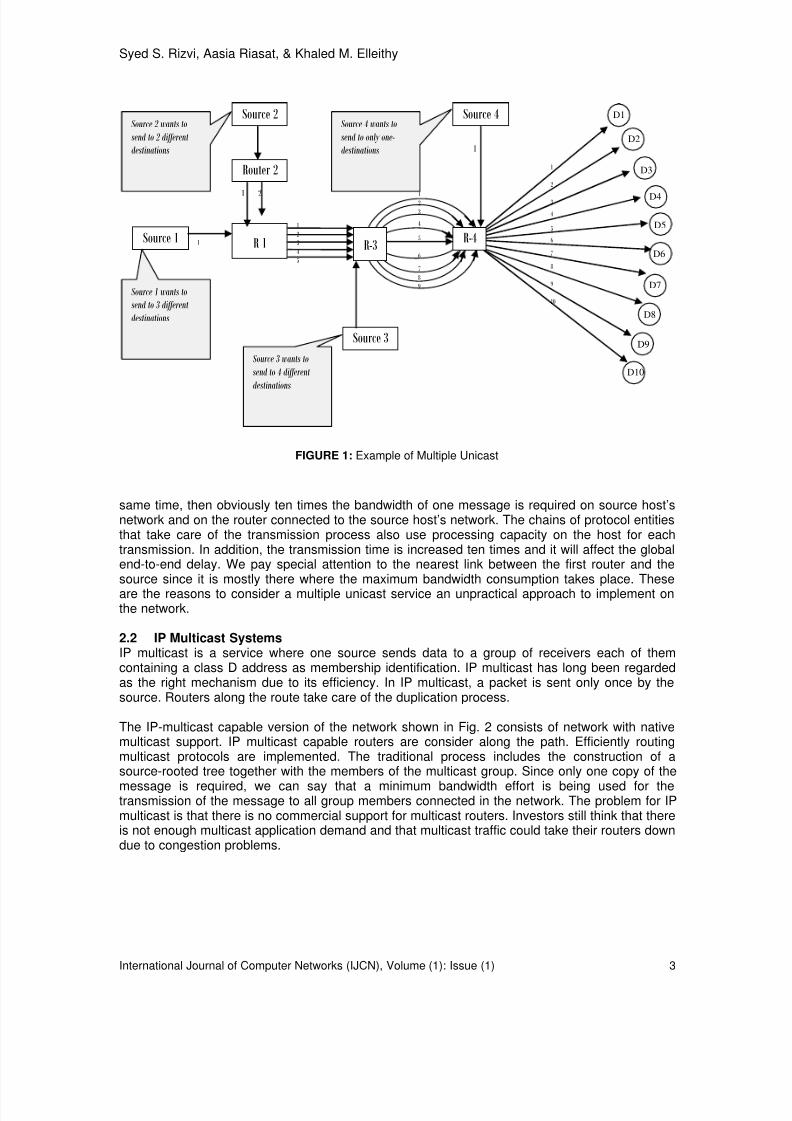
2.1 Multiple Unicast SystemsIn the unicast IP network, the host acting as the source transmits a copy of the message to eachdestination host as shown in Fig. 1. No special configuration is needed either in the source or inthe core network. The intermediate routers will have to carry all these messages to the properdestinations. If, for example, the source host transmits ten copies of the same message at the
8/8/2019 IJCN v1 i1
http://slidepdf.com/reader/full/ijcn-v1-i1 7/89
Syed S. Rizvi, Aasia Riasat, & Khaled M. Elleithy
International Journal of Computer Networks (IJCN), Volume (1): Issue (1) 3
same time, then obviously ten times the bandwidth of one message is required on source host’snetwork and on the router connected to the source host’s network. The chains of protocol entitiesthat take care of the transmission process also use processing capacity on the host for eachtransmission. In addition, the transmission time is increased ten times and it will affect the globalend-to-end delay. We pay special attention to the nearest link between the first router and thesource since it is mostly there where the maximum bandwidth consumption takes place. These
are the reasons to consider a multiple unicast service an unpractical approach to implement onthe network.
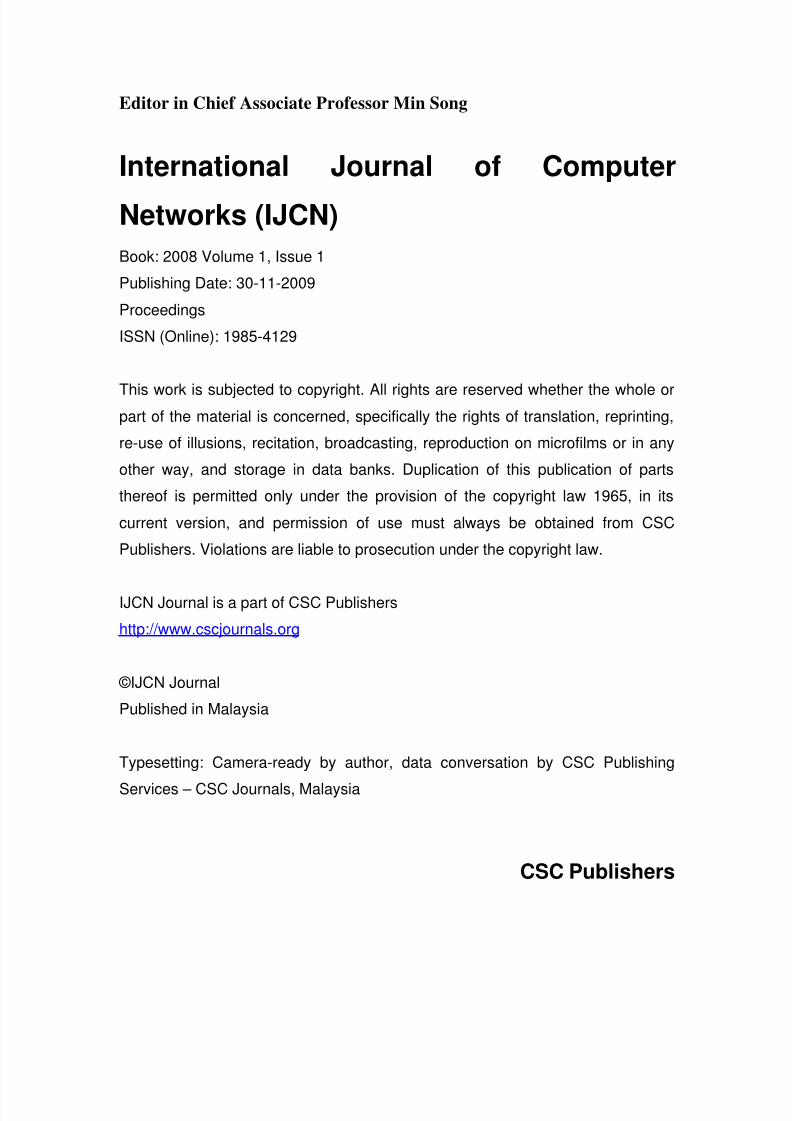
2.2 IP Multicast SystemsIP multicast is a service where one source sends data to a group of receivers each of themcontaining a class D address as membership identification. IP multicast has long been regardedas the right mechanism due to its efficiency. In IP multicast, a packet is sent only once by thesource. Routers along the route take care of the duplication process.
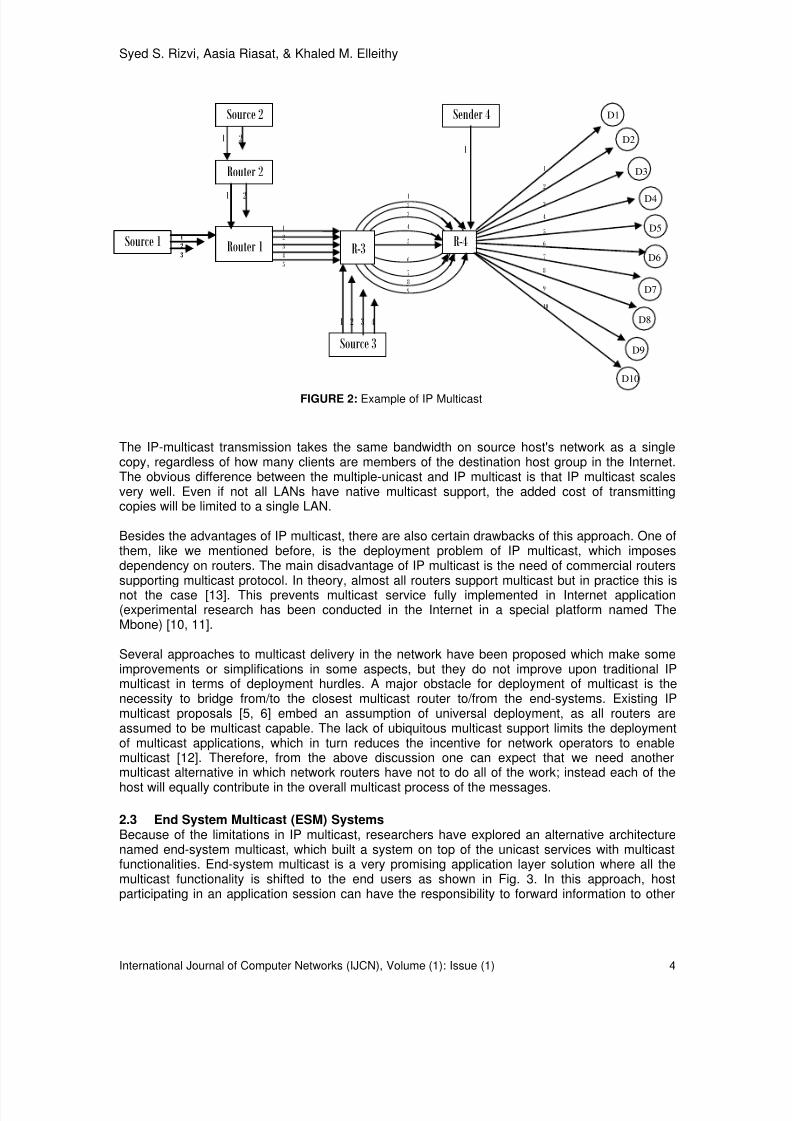
The IP-multicast capable version of the network shown in Fig. 2 consists of network with nativemulticast support. IP multicast capable routers are consider along the path. Efficiently routingmulticast protocols are implemented. The traditional process includes the construction of asource-rooted tree together with the members of the multicast group. Since only one copy of the
message is required, we can say that a minimum bandwidth effort is being used for thetransmission of the message to all group members connected in the network. The problem for IPmulticast is that there is no commercial support for multicast routers. Investors still think that thereis not enough multicast application demand and that multicast traffic could take their routers downdue to congestion problems.
Source 1R 1
Source 2
Router 2
Source 3
Source 4
1
2
3
4
5
1
1 2
Source 1 wants to
send to 3 different
destinations
Source 3 wants to
send to 4 different
destinations
Source 2 wants to
send to 2 different
destinations
Source 4 wants to
send to only one-
destinations
1
2
3
4
5
6
7
8
9
10
1
12
3
4
5
6
7
8
9
R-4R-3
D10
D9
D7
D6
D5
D4
D3
D2
D1
D8
FIGURE 1: Example of Multiple Unicast
8/8/2019 IJCN v1 i1
http://slidepdf.com/reader/full/ijcn-v1-i1 8/89
Syed S. Rizvi, Aasia Riasat, & Khaled M. Elleithy
International Journal of Computer Networks (IJCN), Volume (1): Issue (1) 4
The IP-multicast transmission takes the same bandwidth on source host's network as a singlecopy, regardless of how many clients are members of the destination host group in the Internet.The obvious difference between the multiple-unicast and IP multicast is that IP multicast scalesvery well. Even if not all LANs have native multicast support, the added cost of transmittingcopies will be limited to a single LAN.
Besides the advantages of IP multicast, there are also certain drawbacks of this approach. One ofthem, like we mentioned before, is the deployment problem of IP multicast, which imposesdependency on routers. The main disadvantage of IP multicast is the need of commercial routerssupporting multicast protocol. In theory, almost all routers support multicast but in practice this isnot the case [13]. This prevents multicast service fully implemented in Internet application(experimental research has been conducted in the Internet in a special platform named TheMbone) [10, 11].
Several approaches to multicast delivery in the network have been proposed which make someimprovements or simplifications in some aspects, but they do not improve upon traditional IPmulticast in terms of deployment hurdles. A major obstacle for deployment of multicast is thenecessity to bridge from/to the closest multicast router to/from the end-systems. Existing IPmulticast proposals [5, 6] embed an assumption of universal deployment, as all routers areassumed to be multicast capable. The lack of ubiquitous multicast support limits the deploymentof multicast applications, which in turn reduces the incentive for network operators to enablemulticast [12]. Therefore, from the above discussion one can expect that we need anothermulticast alternative in which network routers have not to do all of the work; instead each of the
host will equally contribute in the overall multicast process of the messages.
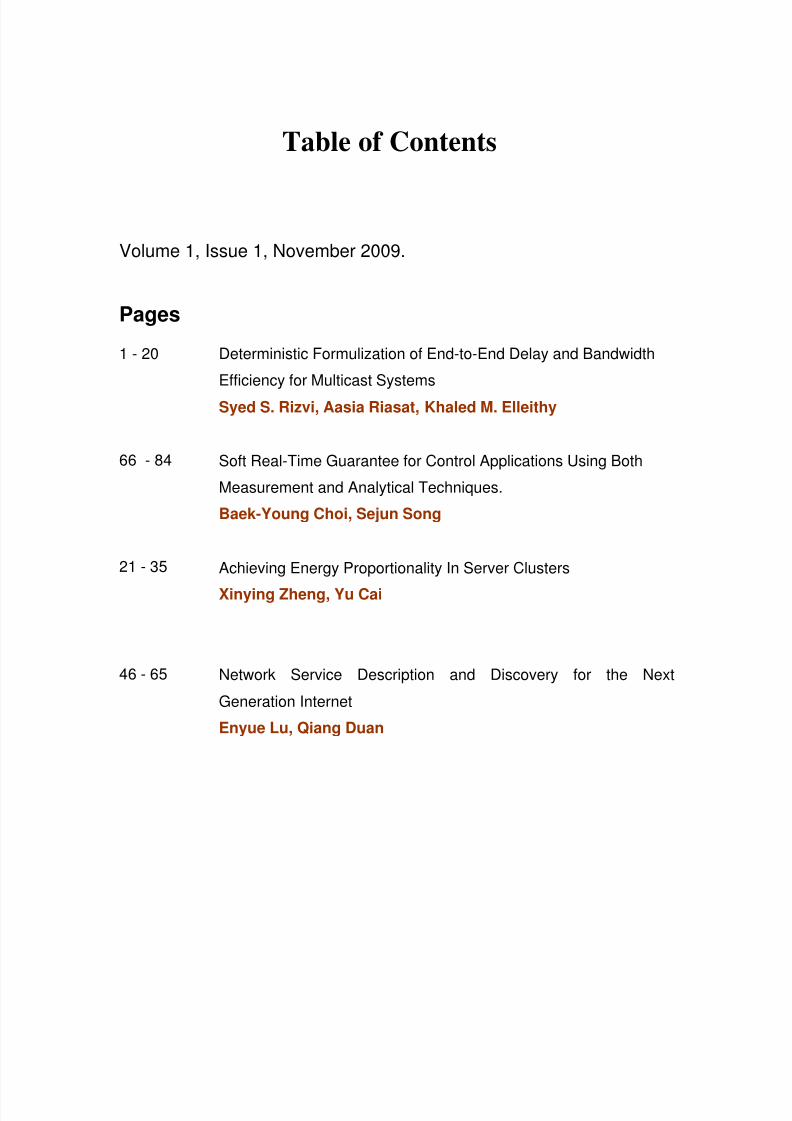
2.3 End System Multicast (ESM) SystemsBecause of the limitations in IP multicast, researchers have explored an alternative architecturenamed end-system multicast, which built a system on top of the unicast services with multicastfunctionalities. End-system multicast is a very promising application layer solution where all themulticast functionality is shifted to the end users as shown in Fig. 3. In this approach, hostparticipating in an application session can have the responsibility to forward information to other
R-3R-4
Source 3
Sender 4
1
2
3
4
5
1
2
3
4
5
6
7
8
9
10
D10
D9
Source 1Router 1
Source 2
Router 2
1
2
3
1 2
1 2
1 2 3 4
1
2
3
4
5
6
7
8
9
1
2
3
1
D8
D7
D6
D5
D4
D3
D2
D1
FIGURE 2: Example of IP Multicast

8/8/2019 IJCN v1 i1
http://slidepdf.com/reader/full/ijcn-v1-i1 9/89
Syed S. Rizvi, Aasia Riasat, & Khaled M. Elleithy
International Journal of Computer Networks (IJCN), Volume (1): Issue (1) 5
hosts. Here, end users who participate in the multicast group communicate through an overlay structure.
However, doing multicasting at end-hosts incurs in some performance penalties. Generally, end-hosts do not handle routing information as routers do. In addition, the limitation in bandwidth andthe fact that the message needs to be forwarded from host-to-host using unicast connection, andconsequently incrementing the end-to-end delay of the transmission process, contribute to theprice to pay for this new approach. These reasons make end-system multicast less efficient thanIP multicast.
The structure of the end-system multicast is an overlay in a sense that each of the paths betweenthe end systems corresponds to a unicast path [14]. In other words, end-system multicast is builton top of the unicast services provided by network on transport layer. Here the membership andreplication functionality is performed by the end receivers, which connect together over unicastchannels to form a multicast tree, rooted at one data source. The end receivers could play therole of parent or children nodes. The parent nodes perform the membership and replicationprocess. The children nodes are receivers who are getting data directly from the parent nodes.There is one central control server and one central data server residing in the same root source.Any receiver can play the role of parent to forward data to its children. Each client has twoconnections: a control connection and a data connection.
3. END-TO-END DELAY APPROXIMATION FOR MULTICAST SYSTEMS
This section presents the mathematical model for approximating the end-to-end delays for allmulticasting schemes. For the ease of simplicity, we divide our approximation for each type ofmulticasting approach such as unicast, multiple unicast, IP multicast, and ESM.
3.1 Model and AssumptionsLet G is an irregular graph that represents a network with a set of N vertices and M edges such
as: { },G N M = . Let L is a direct communication link between a single pair of source (s ) and
FIGURE 3: Example of ESM, Solid Lines Represent 2 Way Packet Transmission, Dotted Lines RepresentOne Way Packet Transmission.
8/8/2019 IJCN v1 i1
http://slidepdf.com/reader/full/ijcn-v1-i1 10/89
Syed S. Rizvi, Aasia Riasat, & Khaled M. Elleithy
International Journal of Computer Networks (IJCN), Volume (1): Issue (1) 6
destination (d ) where both source and destination belong to N such as: { },s d N ∈ . In addition,
each packet transmitted between source (s ) and destination (d ) must traverse one or morecommunication links in order to reach the final destination.
Let the value of D(L) denotes packet-delay (we sometime refer it as link delay) that is associatedwith each direct communication link. Therefore, each transmitted packet will typically experience
a delay of D(L) on a particular link. The delay includes transmission, processing, and propagationdelays such as: Link-Delay = D(L) = Transmission Delay + Propagation Delay + Processing Delaywhere L ∈ M . In connection less communication such as IP network, there might be multipleroutes exist between a pair of source and destination. As a result, each packet might follow adifferent route in order to reach the final destination where each route requires traversing of oneor more communication links (L). A single route between a pair of source and destination can be
defined as: { } { }, , R s d where s d N ∈ . System parameters along with their definitions are
presented in Table 1 and Table 2.
3.2 Mathematical Model for a Unicast SystemIn unicast, a packet is sent from one point (source) to another point (destination). As mentionedearlier, when packet transmit from one source (s ) to a specified destination (d ), there exist
multiple routes where each route can have multiple links. This implies that the packet-delay forunicast is entirely dependent on the number of links a packet needs to traverse in order to reachthe final destination system. Based on the above argument, one can define the packet delay such
as:1 2
( ) ( ) ( ) ......... ( )n D R D L D L D L= + + + where n is the maximum number of links that need to be
traversed on route R between s and d . The delay can be generalized for one particular route (R )that exist between source (s ) and destination (d ) such as:
1
( ) ( )n
i
i
D R D L=
= ∑ (1)
{ }1 2
1
( ) ......n
i n
i
where L L L L M =
= + + + ∈∑
Equation (1) can be further expressed as:
( ) ( )( )
s d L R s d Delay D D L
− ∈ −= = ∑ (2)
where ( ) L R s d ∈ − represents the value of the total delay associated with the route R between
source s and destination d .
Based on (1) and (2), one can also simply derive a mathematical expression for estimating anaverage-delay (denoted by AD ) which each packet may typically experience if it traverses one ofthe available routes. The mathematical expression for an estimated AD is as follows:
( ) ( )1
y
is d i
AD D R y−
=
∑ (3)
where y represents the maximum number of possible routes between source s and destination d .
In addition to the average delay, one can also chose the optimal route with respect to theminimum delay that each packet may experience when traverse from one particular source s to adestination d such as:
8/8/2019 IJCN v1 i1
http://slidepdf.com/reader/full/ijcn-v1-i1 11/89
Syed S. Rizvi, Aasia Riasat, & Khaled M. Elleithy
International Journal of Computer Networks (IJCN), Volume (1): Issue (1) 7
( ) ( )1
y
is d
i
OD Min D R−
=
= ∑ (4)
Equation (4) gives minimum delay that each packet experiences when transmitting between apair of s and d . We refer this as an optimal delay (OD) for a pair of s and d . The above derivationscan be further extended for the multiple unicast system where a single source ( s ) can transfer apacket simultaneously to multiple destinations. This hypothesis leads us to the followingargument: multiple routes can be established between the source (s ) and each destinationsystem. The following mathematical expression can be used to estimate the total delay that theentire packet transmission will experience in a multiple unicast system:
( )( )
1 2
( ), ,......,
1 y
y
Total MU imultiples d d d
i
D D D R →
=
= = ∑ (5)
where y in (5) is the maximum available unicast routes between a particular source ( s ) andmultiple destinations.
Although, in multiple unicast system, a single packet can be transmitted from one source tomultiple destinations, the transmitted packet may follow a different route in order to reach theappropriate destination. Consequently, each packet transmission may yield a different delaydepending on the number of links the packet needs to traverse on the chosen unicast route. Thisleads us to the following mathematical expression for an average delay:
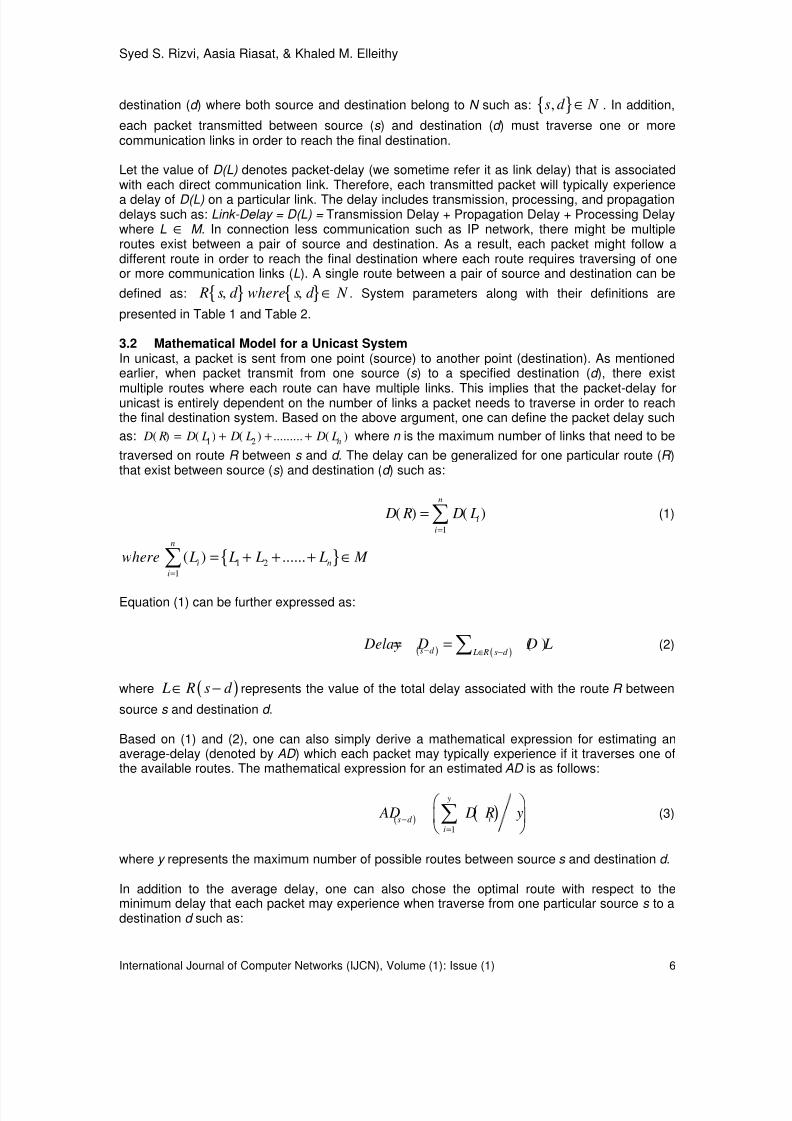
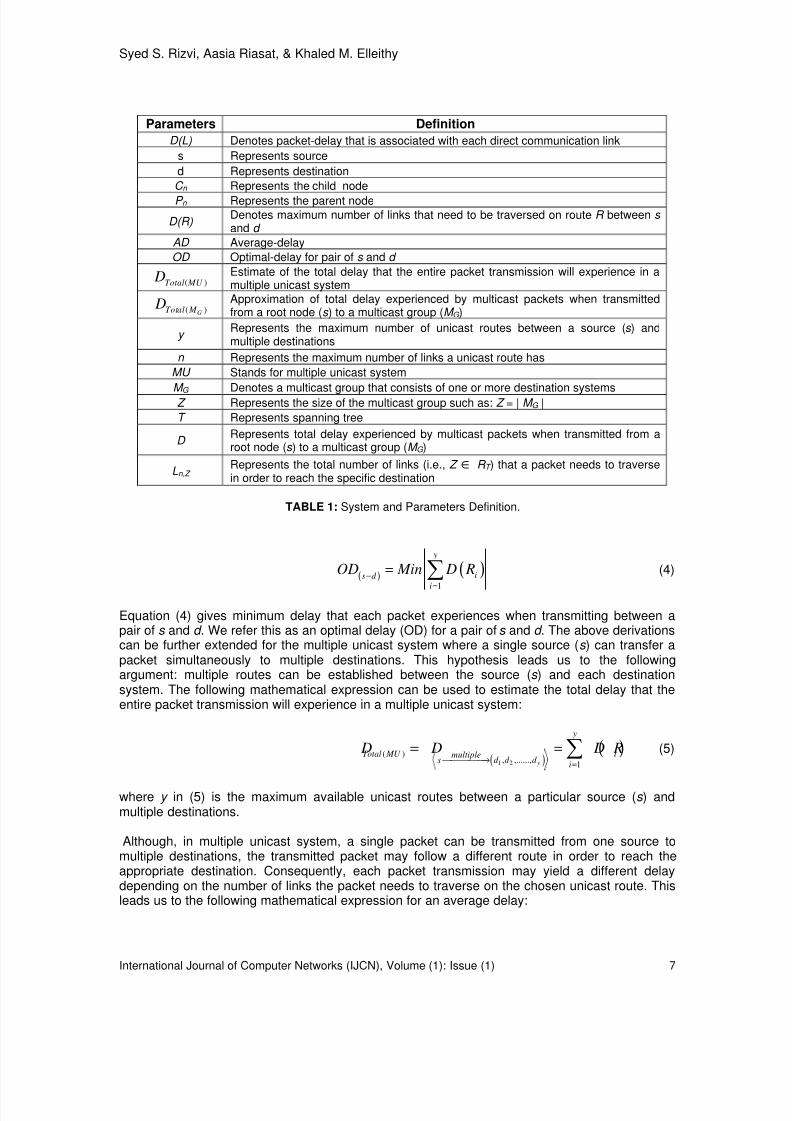
Parameters Definition
D(L) Denotes packet-delay that is associated with each direct communication link
s Represents source
d Represents destination
C n Represents the child node
P n Represents the parent node
D(R)Denotes maximum number of links that need to be traversed on route R between s and d
AD Average-delay
OD Optimal-delay for pair of s and d
( )Total MU D
Estimate of the total delay that the entire packet transmission will experience in amultiple unicast system
( )GTotal M D Approximation of total delay experienced by multicast packets when transmittedfrom a root node (s ) to a multicast group (M G )
y Represents the maximum number of unicast routes between a source (s ) andmultiple destinations
n Represents the maximum number of links a unicast route has
MU Stands for multiple unicast system
M G Denotes a multicast group that consists of one or more destination systemsZ Represents the size of the multicast group such as: Z = | M G |
T Represents spanning tree
D Represents total delay experienced by multicast packets when transmitted from aroot node (s ) to a multicast group (M G )
Ln,Z Represents the total number of links (i.e., Z ∈ R T ) that a packet needs to traversein order to reach the specific destination
TABLE 1: System and Parameters Definition.
8/8/2019 IJCN v1 i1
http://slidepdf.com/reader/full/ijcn-v1-i1 12/89
Syed S. Rizvi, Aasia Riasat, & Khaled M. Elleithy
International Journal of Computer Networks (IJCN), Volume (1): Issue (1) 8
( )
( )( ) ( )
1 1
y n
i
i is d i i
D R AD where D R D L
y−
= =
=
∑ ∑ (6)
where y represents the maximum number of unicast routes between a source (s ) and multipledestinations and n represents the maximum number of links a unicast route has.
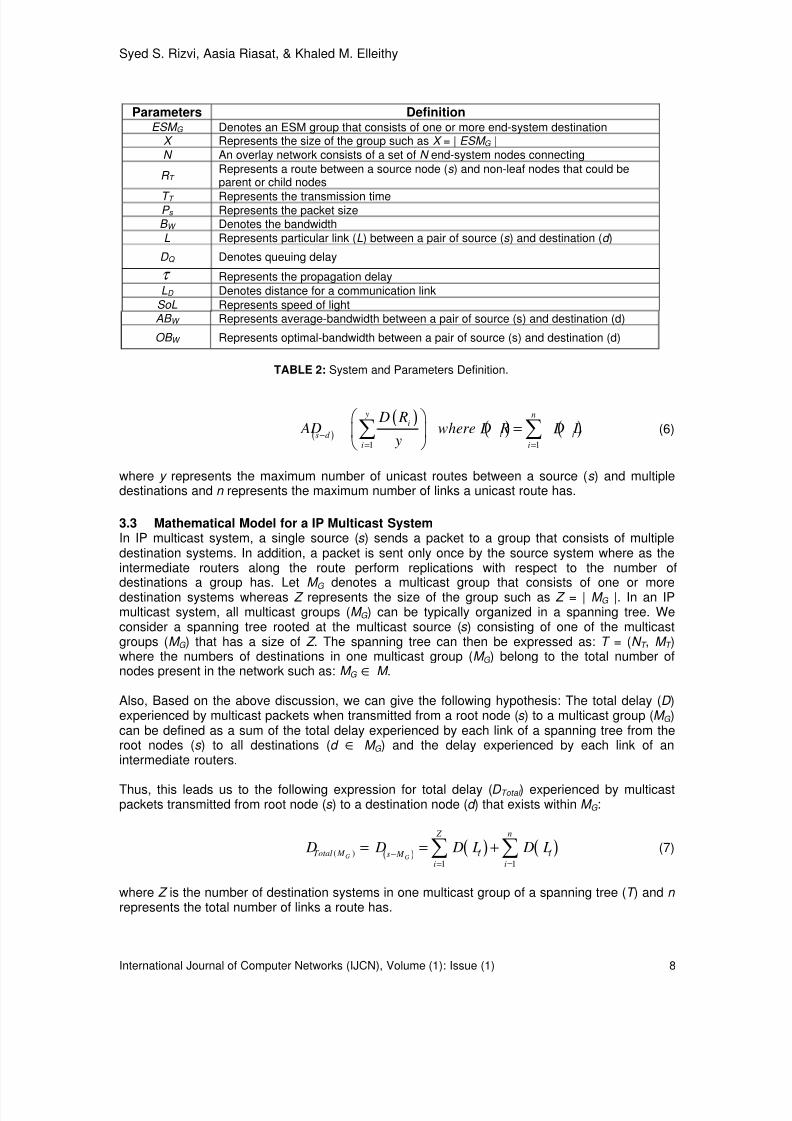
3.3 Mathematical Model for a IP Multicast SystemIn IP multicast system, a single source (s ) sends a packet to a group that consists of multipledestination systems. In addition, a packet is sent only once by the source system where as theintermediate routers along the route perform replications with respect to the number of
destinations a group has. Let M G denotes a multicast group that consists of one or moredestination systems whereas Z represents the size of the group such as Z = | M G |. In an IPmulticast system, all multicast groups (M G ) can be typically organized in a spanning tree. Weconsider a spanning tree rooted at the multicast source (s ) consisting of one of the multicastgroups (M G ) that has a size of Z . The spanning tree can then be expressed as: T = (N T , M T )where the numbers of destinations in one multicast group (M G ) belong to the total number ofnodes present in the network such as: M G ∈ M .
Also, Based on the above discussion, we can give the following hypothesis: The total delay (D )experienced by multicast packets when transmitted from a root node (s ) to a multicast group (M G )can be defined as a sum of the total delay experienced by each link of a spanning tree from theroot nodes (s ) to all destinations (d ∈ M G ) and the delay experienced by each link of anintermediate routers.
Thus, this leads us to the following expression for total delay (D Total ) experienced by multicastpackets transmitted from root node (s ) to a destination node (d ) that exists within M G :
( ) ( ) ( )( )
1 1G G
Z n
Total M i is M i i
D D D L D L−
= =
= = +∑ ∑ (7)
where Z is the number of destination systems in one multicast group of a spanning tree (T ) and n represents the total number of links a route has.
Parameters DefinitionESM G Denotes an ESM group that consists of one or more end-system destination
X Represents the size of the group such as X = | ESM G |
N An overlay network consists of a set of N end-system nodes connecting
R T Represents a route between a source node (s ) and non-leaf nodes that could beparent or child nodes
T T Represents the transmission timeP s Represents the packet sizeB W Denotes the bandwidth
L Represents particular link (L) between a pair of source (s ) and destination (d )
D Q Denotes queuing delay
τ Represents the propagation delay
LD Denotes distance for a communication link
SoL Represents speed of lightAB W Represents average-bandwidth between a pair of source (s) and destination (d)
OB W
Represents optimal-bandwidth between a pair of source (s) and destination (d)
TABLE 2: System and Parameters Definition.
8/8/2019 IJCN v1 i1
http://slidepdf.com/reader/full/ijcn-v1-i1 13/89
Syed S. Rizvi, Aasia Riasat, & Khaled M. Elleithy
International Journal of Computer Networks (IJCN), Volume (1): Issue (1) 9
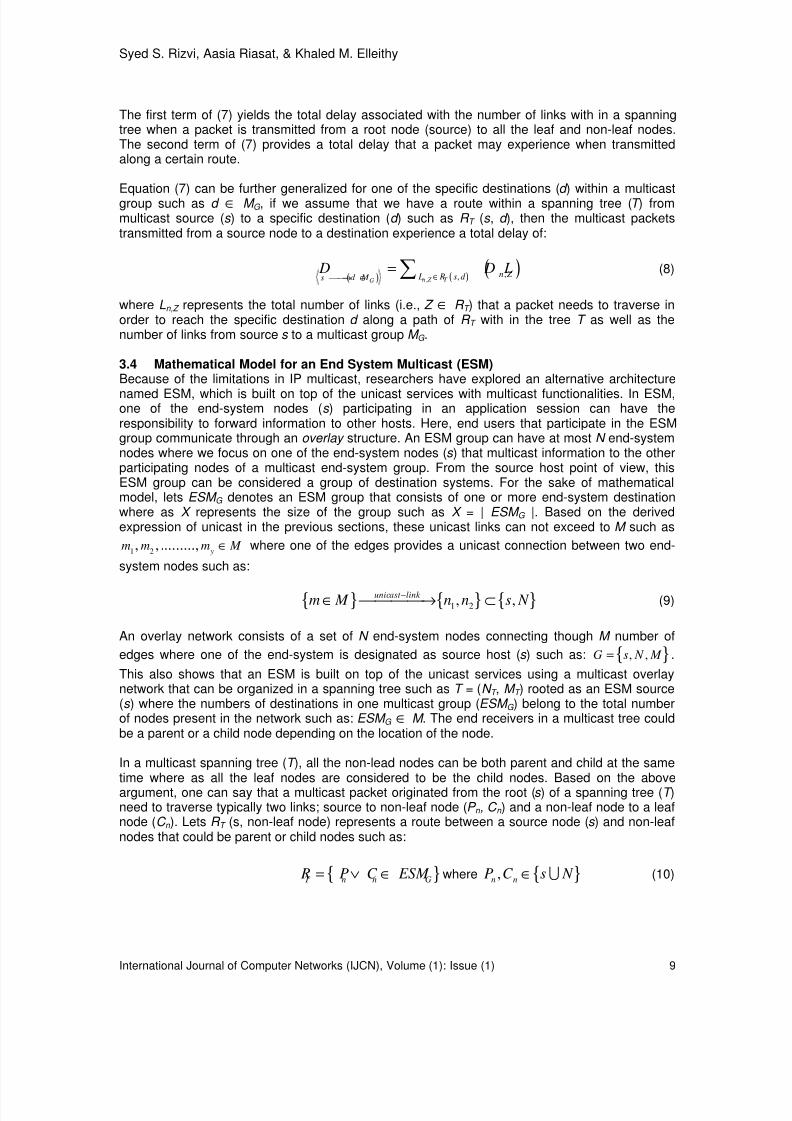
The first term of (7) yields the total delay associated with the number of links with in a spanningtree when a packet is transmitted from a root node (source) to all the leaf and non-leaf nodes.The second term of (7) provides a total delay that a packet may experience when transmittedalong a certain route.
Equation (7) can be further generalized for one of the specific destinations (d ) within a multicastgroup such as d ∈ M G , if we assume that we have a route within a spanning tree (T ) frommulticast source (s ) to a specific destination (d ) such as R T (s , d ), then the multicast packetstransmitted from a source node to a destination experience a total delay of:
( )( )
( ),,,n Z T G
n Z L R s d s d M D D L
∈ → ∈
= ∑ (8)
where Ln,Z represents the total number of links (i.e., Z ∈ R T ) that a packet needs to traverse inorder to reach the specific destination d along a path of R T with in the tree T as well as thenumber of links from source s to a multicast group M G .
3.4 Mathematical Model for an End System Multicast (ESM)Because of the limitations in IP multicast, researchers have explored an alternative architecture
named ESM, which is built on top of the unicast services with multicast functionalities. In ESM,one of the end-system nodes (s ) participating in an application session can have theresponsibility to forward information to other hosts. Here, end users that participate in the ESMgroup communicate through an overlay structure. An ESM group can have at most N end-systemnodes where we focus on one of the end-system nodes (s ) that multicast information to the otherparticipating nodes of a multicast end-system group. From the source host point of view, thisESM group can be considered a group of destination systems. For the sake of mathematicalmodel, lets ESM G denotes an ESM group that consists of one or more end-system destinationwhere as X represents the size of the group such as X = | ESM G |. Based on the derivedexpression of unicast in the previous sections, these unicast links can not exceed to M such as
1 2, , .........,
ym m m M ∈ where one of the edges provides a unicast connection between two end-
system nodes such as:
{ } { } { }1 2, ,
unicast link m M n n s N
−
∈ → ⊂ (9)
An overlay network consists of a set of N end-system nodes connecting though M number of
edges where one of the end-system is designated as source host (s ) such as: { }, ,G s N M = .
This also shows that an ESM is built on top of the unicast services using a multicast overlaynetwork that can be organized in a spanning tree such as T = (N T , M T ) rooted as an ESM source(s ) where the numbers of destinations in one multicast group (ESM G ) belong to the total numberof nodes present in the network such as: ESM G ∈ M . The end receivers in a multicast tree couldbe a parent or a child node depending on the location of the node.
In a multicast spanning tree (T ), all the non-lead nodes can be both parent and child at the sametime where as all the leaf nodes are considered to be the child nodes. Based on the aboveargument, one can say that a multicast packet originated from the root (s ) of a spanning tree (T )need to traverse typically two links; source to non-leaf node (P n , C n ) and a non-leaf node to a leafnode (C n ). Lets R T (s, non-leaf node) represents a route between a source node (s ) and non-leafnodes that could be parent or child nodes such as:
{ }T n n G R P C ESM = ∨ ∈ where { },n nP C s N ∈ U (10)

8/8/2019 IJCN v1 i1
http://slidepdf.com/reader/full/ijcn-v1-i1 14/89
Syed S. Rizvi, Aasia Riasat, & Khaled M. Elleithy
International Journal of Computer Networks (IJCN), Volume (1): Issue (1) 10
where, R T (P n , C n ) in (10) represents a route from a parent node to a child node such as:
{ },T n n G R P C ESM = ∈ .
Equations (9) and (10) lead us to the following expression for computing the total delay involve intransmitting a multicast packet from a source node to one or more parent nodes (i.e., the delayassociated with the first link of transmission):
( ) { } ( ) ( )( )
, ,1 1
n n n nn n
y n
imultiple unicast i s P C ii s P C s P C s N i i
D D R where D R D L−
→ → → ∨ ∈
= =
=
∑ ∑
U
A (11)
In (11), y is the maximum unicast routes between a source (s ) and one or more non-leaf nodesand n represents the maximum number of links a unicast route can have. Similarly, the total delayexperience by a multicast packet transmitted from a parent node to a child node can beapproximated as follows:
( )( )( ) ( )( ) ( ), ,
1 1
n n n n
n n
y n
imultiple unicast i P C i P C P C
i i
D D R where D R D L−
→= =
= ∑ ∑A (12)
By combining (11) and (12), the total delay experience by a multicast packet that transmitted froma source node (s ) to a child node (C n ) can be approximated as:
( ) { } ( ) ( )( ),,,1 1
+n nn nn n
n n
multiple unicast i P C i s P C s C s P N i i
D D L D L−
→ → ∈
= =
=
∑ ∑
U
(13)
4. FORMULIZATION OF BANDWIDTH EFFICIENCY FOR MULTICASTSYSTEMS
This section presents the formulization of the bandwidth efficiency for all multicasting schemes.
For the ease of simplicity, we divide our proposed formulization for each type of multicastingapproach such as unicast, multiple unicast, IP multicast, and ESM.
4.1 Generic System ModelIn order to approximate the bandwidth for Unicast, multicast, and ESM, we use the classicaldefinition of computing the transmission time. Based on this definition, the transmission time (T T )can be defined as a product of the packet size (P s ) which we transmit between a pair of source(s ) and destination (d ) and the inverse of the bandwidth (B W ). Mathematically, this can be
expressed as follows: ( ) 1T s
W
T P B
=
Let the value of ((s d)
D→
) denotes the total packet-delay which is associated with each direct
communication link. Therefore, each transmitted packet will typically experience a delay of
(s d) D
→
on a particular link (L) between a pair of source (s ) and destination (d ). This delay is the
sum of the transmission time, the queuing and the propagation delays such as:(s d)
D→
=
Transmission Time ( T T ) + Propagation Delay (τ ) + Queuing Delay ( Q D ). Also, it can be
expressed as:(s d)
T Q
D T Dτ →
= + + . Changing the above expression for the transmission
delay, we got

8/8/2019 IJCN v1 i1
http://slidepdf.com/reader/full/ijcn-v1-i1 15/89
Syed S. Rizvi, Aasia Riasat, & Khaled M. Elleithy
International Journal of Computer Networks (IJCN), Volume (1): Issue (1) 11
( ) ( )(s d)( )
T QT D Dτ
→
= − − (14)
Recall our classical definition for the transmission time, (14) can be rewritten as the product ofbandwidth and packet size:
( ) ( )(s d)
1( )s Q
W
P D D B
τ →
= − −
(15)
Solving (15) for approximating the bandwidth, we got
( ) ( )(s d)
( )
sW
Q
P B
D Dτ →
=
− −
(16)
It should be noted that the propagation delay (τ ) is a ration between the distance for a
communication link (LD ) and the speed of light (SoL). This allows us to further extend (16) as
follows.
(s d)
( )
sW
DQ
P B
L D D
SoL→
=
− −
(17)
Simplifying the above equation (17), we got
( ) ( )
( ) (s d)( ) – ( )( )
s
W
D Q
P SoL B
SoL D L SoL D→
=
−
(18)
For the sake of simplicity, we can ignore the queuing delay. Equation (18) can now be written as:
( )( )
( ) (s d)
( ) –
s
W
D
P SoL B
SoL D L→
= (19)
4.2 Bandwidth Efficiency Formulization for a Unicast SystemIn unicast, a packet is sent from one point (source) to another point (destination). As mentionedearlier, when packet transmit from one source (s ) to a specified destination (d ), there existmultiple routes where each route can have multiple links. This implies that the packet-delay forunicast is entirely dependent on the number of links a packet needs to traverse in order to reachthe final destination system. Based on the above argument, one can define the packet delay such
as:1 2( ) ( ) ( ) ......... ( )n D R D L D L D L= + + + where n is the maximum number of links that need
to be traversed on route R between s and d .
We generalize the delay for one particular route (R ) that exists between source (s ) and
destination (d ) such as:1
( ) ( )n
i
i
D R D L=
= ∑ where1 2
1
( ) ......n
i n L L L L M = + + + ∈∑
8/8/2019 IJCN v1 i1
http://slidepdf.com/reader/full/ijcn-v1-i1 16/89
Syed S. Rizvi, Aasia Riasat, & Khaled M. Elleithy
International Journal of Computer Networks (IJCN), Volume (1): Issue (1) 12
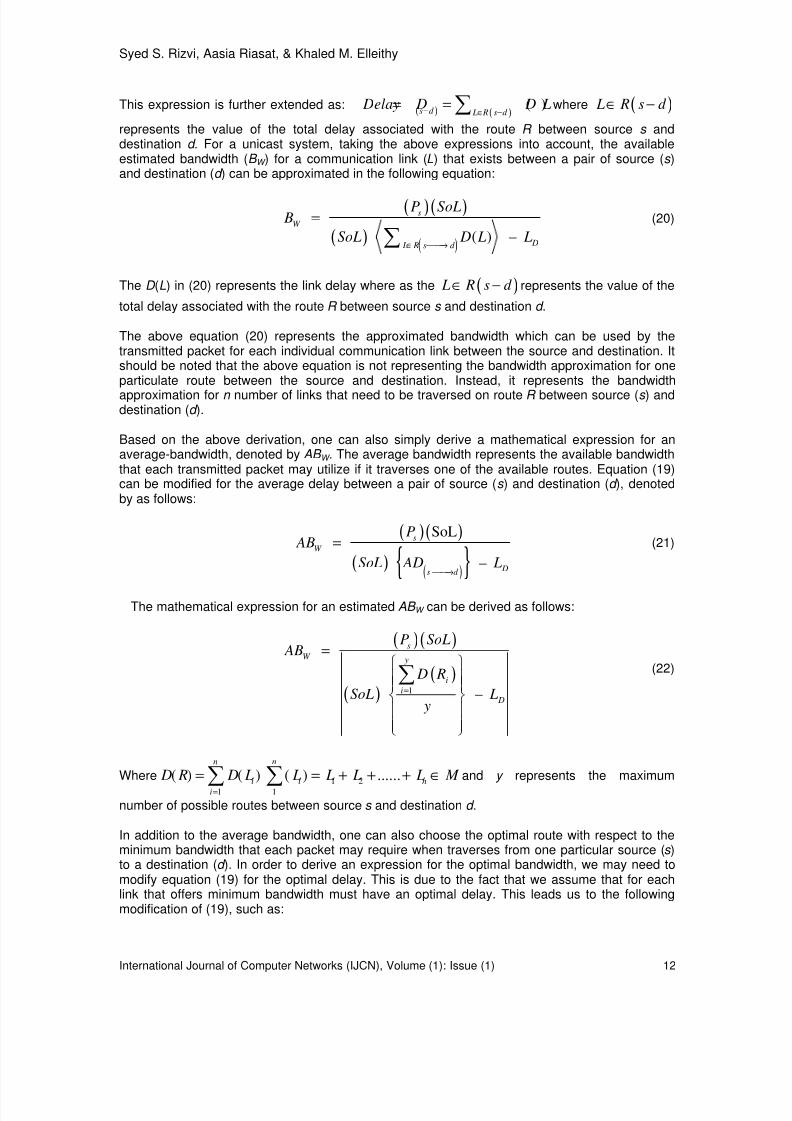
This expression is further extended as:( ) ( )
( )s d L R s d
Delay D D L− ∈ −
= = ∑ where ( ) L R s d ∈ −
represents the value of the total delay associated with the route R between source s anddestination d . For a unicast system, taking the above expressions into account, the availableestimated bandwidth (B W ) for a communication link (L) that exists between a pair of source (s )and destination (d ) can be approximated in the following equation:
( ) ( )
( ) ( )
( ) –
s
W
D L R s d
P SoL B
SoL D L L∈ →
=
∑(20)
The D (L) in (20) represents the link delay where as the ( ) L R s d ∈ − represents the value of the
total delay associated with the route R between source s and destination d .
The above equation (20) represents the approximated bandwidth which can be used by thetransmitted packet for each individual communication link between the source and destination. Itshould be noted that the above equation is not representing the bandwidth approximation for oneparticulate route between the source and destination. Instead, it represents the bandwidth
approximation for n number of links that need to be traversed on route R between source (s ) anddestination (d ).
Based on the above derivation, one can also simply derive a mathematical expression for anaverage-bandwidth, denoted by AB W . The average bandwidth represents the available bandwidththat each transmitted packet may utilize if it traverses one of the available routes. Equation (19)can be modified for the average delay between a pair of source ( s ) and destination (d ), denotedby as follows:
( ) ( )
( )( ){ }
SoL
–
s
W
Ds d
P AB
SoL AD L→
= (21)
The mathematical expression for an estimated AB W can be derived as follows:
( ) ( )
( )( )
1
–
s
W y
i
i D
P SoL AB
D R
SoL L y
=
=
∑ (22)
Where1
( ) ( )n
i
i
D R D L=
= ∑ 1 2
1
( ) ......n
i n L L L L M = + + + ∈∑ and y represents the maximum
number of possible routes between source s and destination d .
In addition to the average bandwidth, one can also choose the optimal route with respect to theminimum bandwidth that each packet may require when traverses from one particular source (s )to a destination (d ). In order to derive an expression for the optimal bandwidth, we may need tomodify equation (19) for the optimal delay. This is due to the fact that we assume that for eachlink that offers minimum bandwidth must have an optimal delay. This leads us to the followingmodification of (19), such as:

8/8/2019 IJCN v1 i1
http://slidepdf.com/reader/full/ijcn-v1-i1 17/89
Syed S. Rizvi, Aasia Riasat, & Khaled M. Elleithy
International Journal of Computer Networks (IJCN), Volume (1): Issue (1) 13
( ) ( )
( ) (s d)
( ) –
s
W
D
P SoLOB
SoL OD L→
= (23)
where(s d)
OD→
represents the optimal delay with respect to the minimum delay that each
packet may experience when traverses from one particular source to a destination.
Based on (23), we can derive an expression for the optimal bandwidth, denoted by W OB ,
between a pair of source (s) and destination (d) such as:
( )( )
( ) ( )1
–
s
W y
i D
i
P SoLOB
SoL Min D R L=
=
∑(24)
where 1 2( ) ( ) ( ) ......... ( )n
D R D L D L D L= + + + and n is the maximum number of links that need
to be traversed on route R between s and d .
4.3 Bandwidth Efficiency Formulization for a Multiple Unicast SystemIn addition to unicast systems, we can derive the similar mathematical expressions for themultiple unicast system where a single source (s ) can transfer a packet simultaneously to multipledestinations. In other words, in a multiple unicast system, there exist a unicast route between asource (s ) and one of the destinations. This hypothesis leads us to the following argument:multiple routes can be established between the source (s ) and each destination (d 1, d 1,
d 1,…….,d y ) where y represents the maximum number of unicast routes established in multipleunicast. Based on this hypothesis, we can modify (19) that account the total delay such as:
( )
( ) ( )
( )( )
1 2
1 2
, ,......,
, ,......,
– y
y
s
multipleW s d d d
multiple Ds d d d
P SoL B
SoL D L →
→
= (25)
The following mathematical expression can be used to estimate the total bandwidth that the entirepacket transmission utilizes in a multiple unicast system:
( )
( )( )
( ) ( ), ,......,
1 2
1
–s
s
WB ymultipleW d d d
y
i D
i
P SoL B
SoL D R L →
=
=
∑(26)
Although, in multiple unicast system, a single packet can be transmitted from one source tomultiple destinations, the transmitted packet may follow a different route in order to reach theappropriate destination. In particular, a bandwidth is always associated with links rather than thecomplete routes between the source and destinations.
As a result, each transmitted packet may use a different amount of bandwidth with respect to thenumber of links that the packet needs to traverse on the chosen unicast route. This implies that,in order to estimate an average bandwidth that each packer might utilize, one should consider thenumber of maximum links a unicast route has. This leads us to the following mathematicalexpression for an average available bandwidth for the multiple unicast system:

8/8/2019 IJCN v1 i1
http://slidepdf.com/reader/full/ijcn-v1-i1 18/89
Syed S. Rizvi, Aasia Riasat, & Khaled M. Elleithy
International Journal of Computer Networks (IJCN), Volume (1): Issue (1) 14
( ) ( )
( )( ){ }
SoL
–
s
W
Ds d
P AB
SoL AD L→
=
(27)
Further, solving (26) for average bandwidth approximation results (27) such as:
( )
( ) ( )
( )( )
( ) ( )1
1
–
ns
i i yW s d i
i
i D
P SoL AB where D R D L
D R
SoL L y
→
=
=
= ∑∑
A
(28)
where y represents the maximum number of unicast routes between a source (s ) and multipledestinations and n represents the maximum number of links that a unicast route has.
4.4 Bandwidth Efficiency Formulization for IP Multicast SystemIn IP multicast system, a single source (s ) sends a packet to a group that consists of multipledestination systems. In addition, a packet is sent only once by the source system where as theintermediate routers along the route perform replications with respect to the number ofdestinations a group has. Lets M G denotes a multicast group that consists of one or moredestination systems whereas Z represents the size of the group such as Z = | M G |. In an IPmulticast system, in order to efficiently transmit a packet from a specific multicast source to allmulticast destinations, all multicast groups (M G ) can be typically organized in a spanning tree (T ).For the ease of mathematical expression, we only consider a spanning tree rooted at themulticast source (s ) consisting of one of the multicast groups (M G ) that has a size of Z .
Based on the above discussion, we describe the spanning tree such as: T = (N T , M T ) rooted asmulticast source (s ) where the numbers of destinations in one multicast group (M G ) belong to thetotal number of nodes present in the network such as: M G ∈ M where M represents the total
edges that the network has. The terms N T and M T represent the vertices and the edges of thespanning tree (T ), respectively. It should be noted that we consider a spanning tree (T ) thatincludes only the multicast destinations of a multicast group (M G ) with the exception ofintermediate routers. In other words, we assume that N T of the spanning tree (T ) only consists ofone or more destination nodes. The reason for this assumption is to simplify the process ofestimating the total available bandwidth involves with the packet transmission in an IP multicastsystem.
Based on the above proposed model, we can give the following hypothesis: The total available bandwidth (TB W ) utilizes by multicast packets when transmitted from a root node (s ) to a multicast group (M G ) can be defined as a ration of packet size and the available bandwidth on each link of a spanning tree (T) from the root nodes (s ) to all destinations (d ∈ M G ) with the bandwidth available to one or more intermediate routers of each link .
The above hypothesis leads us to the following expression for total available bandwidth (TB W )utilizes by multicast packets transmitted from root node (s ) to a destination node (d ):
( ) ( )
( ) (s )
( ) –
G
s
W
M D
P SoLTB
SoL D L→
= (29)
8/8/2019 IJCN v1 i1
http://slidepdf.com/reader/full/ijcn-v1-i1 19/89
Syed S. Rizvi, Aasia Riasat, & Khaled M. Elleithy
International Journal of Computer Networks (IJCN), Volume (1): Issue (1) 15
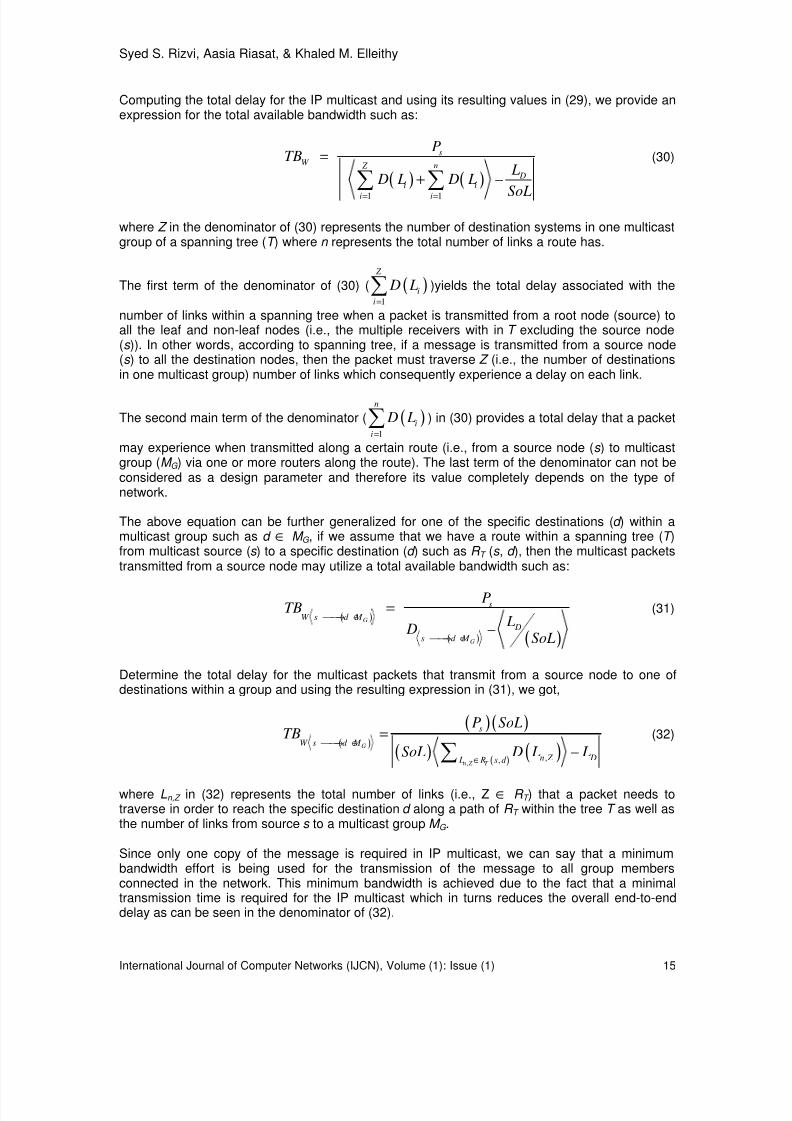
Computing the total delay for the IP multicast and using its resulting values in (29), we provide anexpression for the total available bandwidth such as:
( ) ( )1 1
–
sW Z n
Di i
i i
PTB
L D L D L
SoL= =
=
+∑ ∑(30)
where Z in the denominator of (30) represents the number of destination systems in one multicastgroup of a spanning tree (T ) where n represents the total number of links a route has.
The first term of the denominator of (30) ( ( )1
Z
i
i
D L=
∑ )yields the total delay associated with the
number of links within a spanning tree when a packet is transmitted from a root node (source) toall the leaf and non-leaf nodes (i.e., the multiple receivers with in T excluding the source node(s )). In other words, according to spanning tree, if a message is transmitted from a source node(s ) to all the destination nodes, then the packet must traverse Z (i.e., the number of destinationsin one multicast group) number of links which consequently experience a delay on each link.
The second main term of the denominator ( ( )1
n
i
i
D L=
∑ ) in (30) provides a total delay that a packet
may experience when transmitted along a certain route (i.e., from a source node ( s ) to multicastgroup (M G ) via one or more routers along the route). The last term of the denominator can not beconsidered as a design parameter and therefore its value completely depends on the type ofnetwork.
The above equation can be further generalized for one of the specific destinations (d ) within amulticast group such as d ∈ M G , if we assume that we have a route within a spanning tree (T )from multicast source (s ) to a specific destination (d ) such as R T (s , d ), then the multicast packetstransmitted from a source node may utilize a total available bandwidth such as:
( )
( ) ( )
–G
G
s
W s d M
D
s d M
PTB
L D
SoL
→ ∈
→ ∈
= (31)
Determine the total delay for the multicast packets that transmit from a source node to one ofdestinations within a group and using the resulting expression in (31), we got,
( )
( )( )
( ) ( )( ),
,,
–G
n Z T
s
W s d M
n Z D L R s d
P SoLTB
SoL D L L → ∈
∈
=
∑(32)
where Ln,Z in (32) represents the total number of links (i.e., Z ∈ R T ) that a packet needs totraverse in order to reach the specific destination d along a path of R T within the tree T as well asthe number of links from source s to a multicast group M G .
Since only one copy of the message is required in IP multicast, we can say that a minimumbandwidth effort is being used for the transmission of the message to all group membersconnected in the network. This minimum bandwidth is achieved due to the fact that a minimaltransmission time is required for the IP multicast which in turns reduces the overall end-to-enddelay as can be seen in the denominator of (32).
8/8/2019 IJCN v1 i1
http://slidepdf.com/reader/full/ijcn-v1-i1 20/89
Syed S. Rizvi, Aasia Riasat, & Khaled M. Elleithy
International Journal of Computer Networks (IJCN), Volume (1): Issue (1) 16
4.5 Bandwidth Efficiency Formulization for End System Multicast (ESM) SystemAn ESM group can have at most N end-system nodes where we focus on one of the end-systemnodes (s ) that multicast information to the other participating nodes of a multicast end-systemgroup. From the source host point of view, this ESM multicast group can be considered a groupof destination systems. For the sake of mathematical model, lets ESM G denotes an ESM groupthat consists of one or more end-system-destinations where as X represents the size of the groupsuch as X = | ESM G |.
In an overlay network, all participating end-system nodes are fully connected to each other via theunicast links. Based on the derived expression of unicast in the previous sections, these unicastlinks that provide connection between end-system nodes can not exceed to M such
as:{ }1 2, , .........,
ym m m M ∈ where one of the edges (m) provides a unicast connection between
the two end-system nodes such as: { } { } { }1 2, ,
unicast link m M n n s N
−
∈ → ⊂ .
The structure of the ESM is an overlay network in a sense that each of the paths between theend-systems corresponds to a unicast path. This implies that an overlay network consisting of aset of N end-system nodes connecting though M number of edges where one of the end-system
is designated as a source host (s ) can be expressed as: { }, ,G s N M = .
This also shows that an ESM is built on top of the unicast services using a multicast overlaynetwork that can be organized in a spanning tree such as T = (N T , M T ) rooted as an ESM source(s ) where the numbers of destinations in one multicast group (ESM G ) belong to the total numberof nodes present in the network such as: ESM G ∈ M . Here, the membership and replicationfunctionality is performed by the ESM receivers, which connect together over unicast channels toform a multicast tree (T ), rooted at one data source (s ). The end receivers (i.e., the number ofend-systems in ESM G ) in a multicast tree could be a parent or a child node depending on thelocation of the node. In a multicast spanning tree (T ), all the non-leaf nodes can be both parentand child at the same time where as all the leaf nodes are considered to be the child nodes. Inother words, the parent nodes perform the membership and replication process where as thechildren nodes are receivers that receives multicast packet from the parent nodes.
Based on the above argument, one can say that a multicast packet originated from the root ( s ) ofa spanning tree (T ) need to traverse typically two links; source to non-leaf node (P n , C n ) and anon-leaf node to a leaf node (C n ). Lets R T (s, non-leaf node) represents a route between a sourcenode (s ) and non-leaf nodes that could be parent or child nodes such as:
{ }T n n G R P C ESM = ∨ ∈ where { },n nP C s N ∈ U
Similarly, R T (P n , C n ) represents a route from a parent node to a child node such as:
{ },T n n G R P C ESM = ∈ . The above arguments lead us to the following expression for computing
the total bandwidth available for transmitting a multicast packet from a source node to one ormore parent nodes (i.e., the bandwidth associated with the first link of transmission):
( ) { }
( ) { }
–n n
n n
s
multiple unicast W s P C s N
Dmultiple unicast
s P C s N
PTB
L D
SoL
− → ∨ ∈
− → ∨ ∈
=
U
U
(33)
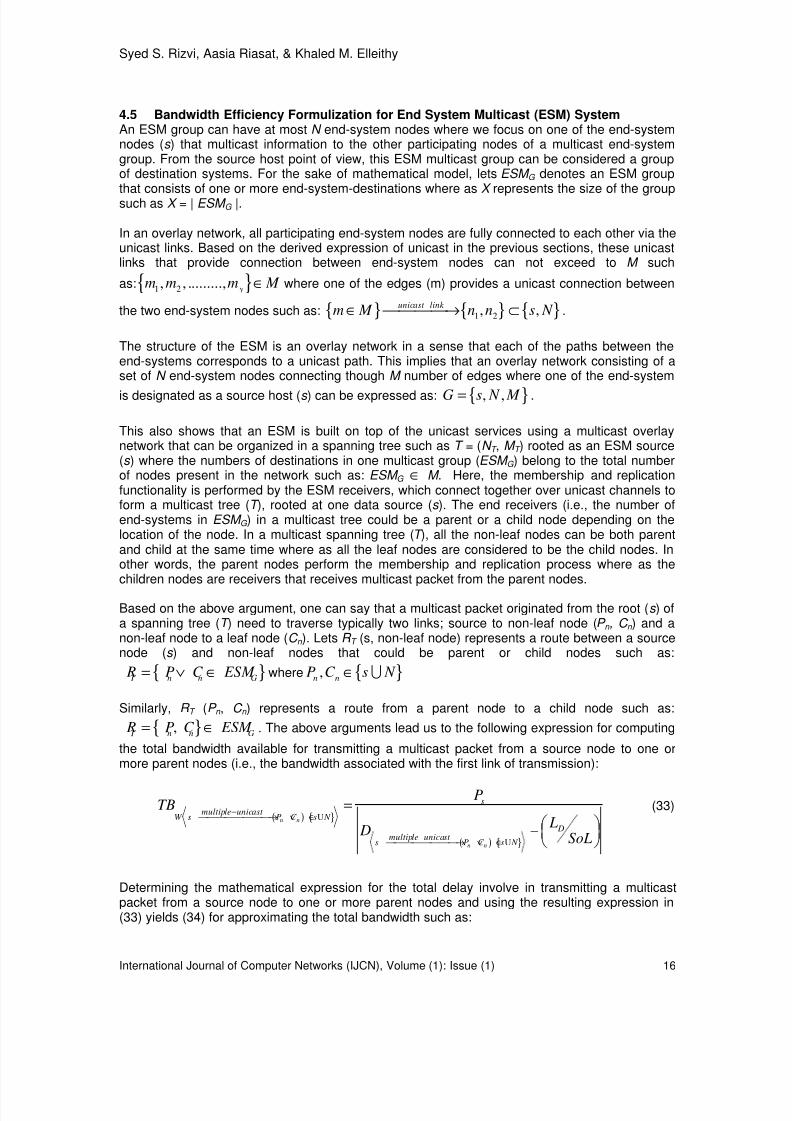
Determining the mathematical expression for the total delay involve in transmitting a multicastpacket from a source node to one or more parent nodes and using the resulting expression in(33) yields (34) for approximating the total bandwidth such as:
8/8/2019 IJCN v1 i1
http://slidepdf.com/reader/full/ijcn-v1-i1 21/89
Syed S. Rizvi, Aasia Riasat, & Khaled M. Elleithy
International Journal of Computer Networks (IJCN), Volume (1): Issue (1) 17
( ) { }
( )
( )
( )
,1
,1
–
n n
n n
n n
s
multiple unicast yW s P C s N D
i s P C i
n
iii s P C i
PTB
L D R
SoL
where D R D L
− → ∨ ∈
→
=
→
=
=
∑
∑
U
A
(34)
where y in (34) represents the maximum unicast routes between a source (s ) and one or morenon-leaf nodes and n represents the maximum number of links a unicast route can have.
Based on (34), we can derive a similar mathematical expression for approximating the totalbandwidth available for a multicast packet which is transmitted from a parent node to a child nodeas follows:
( )
( )( )( )( ) ( ),
1
,1
–n n
n n
n n
ns
imultiple unicast i P C yW P C i D
i P C i
PTB where D R D L
L D R
SoL
− →
=
=
=
∑∑
A (35)
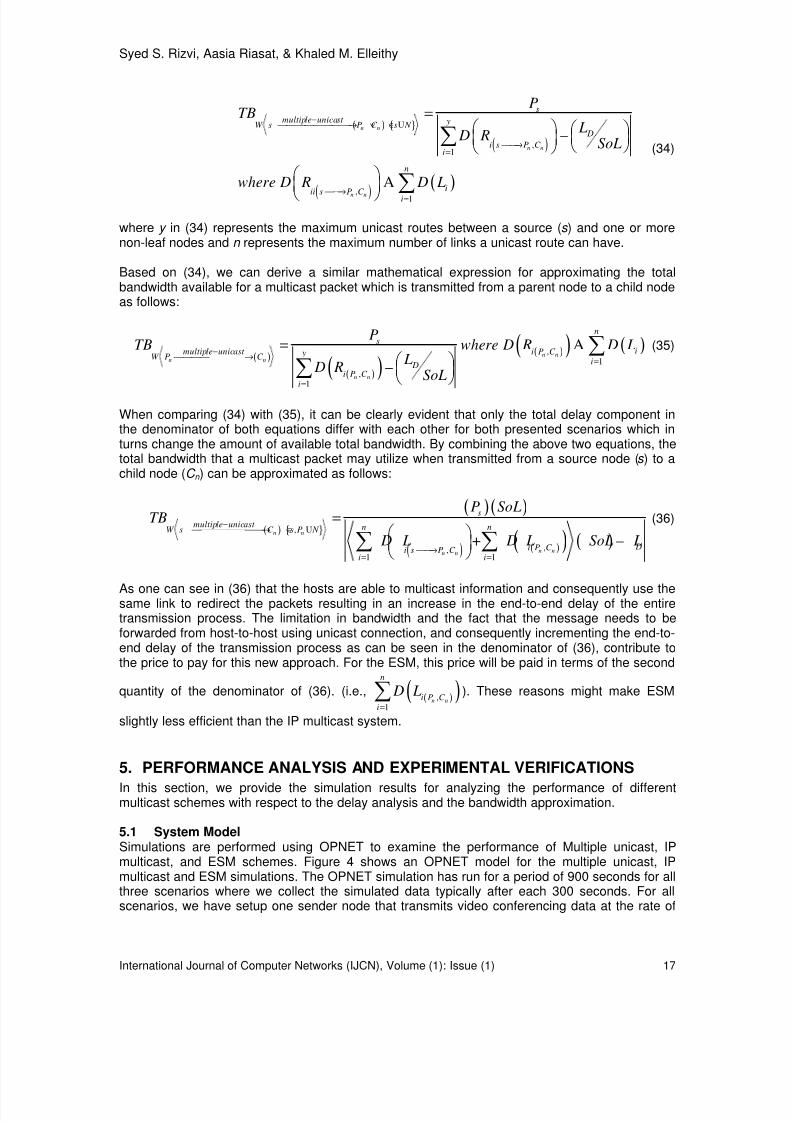
When comparing (34) with (35), it can be clearly evident that only the total delay component inthe denominator of both equations differ with each other for both presented scenarios which inturns change the amount of available total bandwidth. By combining the above two equations, thetotal bandwidth that a multicast packet may utilize when transmitted from a source node (s ) to achild node (C n ) can be approximated as follows:
( ) { }
( ) ( )
( ) ( )( ) ( ),
,,1 1
+ –n n
n nn n
s
multiple unicast n nW s C s P N
Di P C i s P C i i
P SoLTB
D L D L SoL L
− → ∈
→
= =
=
∑ ∑U
(36)
As one can see in (36) that the hosts are able to multicast information and consequently use thesame link to redirect the packets resulting in an increase in the end-to-end delay of the entiretransmission process. The limitation in bandwidth and the fact that the message needs to beforwarded from host-to-host using unicast connection, and consequently incrementing the end-to-end delay of the transmission process as can be seen in the denominator of (36), contribute tothe price to pay for this new approach. For the ESM, this price will be paid in terms of the second
quantity of the denominator of (36). (i.e.,( )( ),
1n n
n
i P C i
D L=
∑ ). These reasons might make ESM
slightly less efficient than the IP multicast system.
5. PERFORMANCE ANALYSIS AND EXPERIMENTAL VERIFICATIONS
In this section, we provide the simulation results for analyzing the performance of differentmulticast schemes with respect to the delay analysis and the bandwidth approximation.
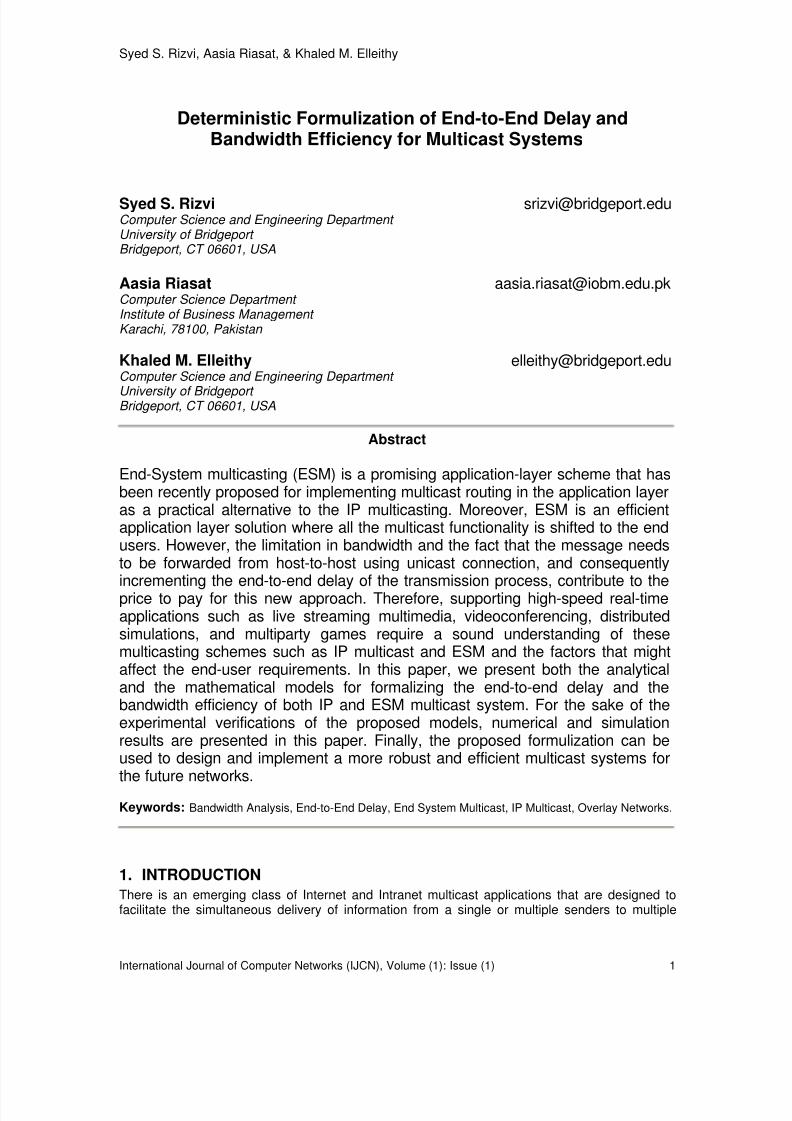
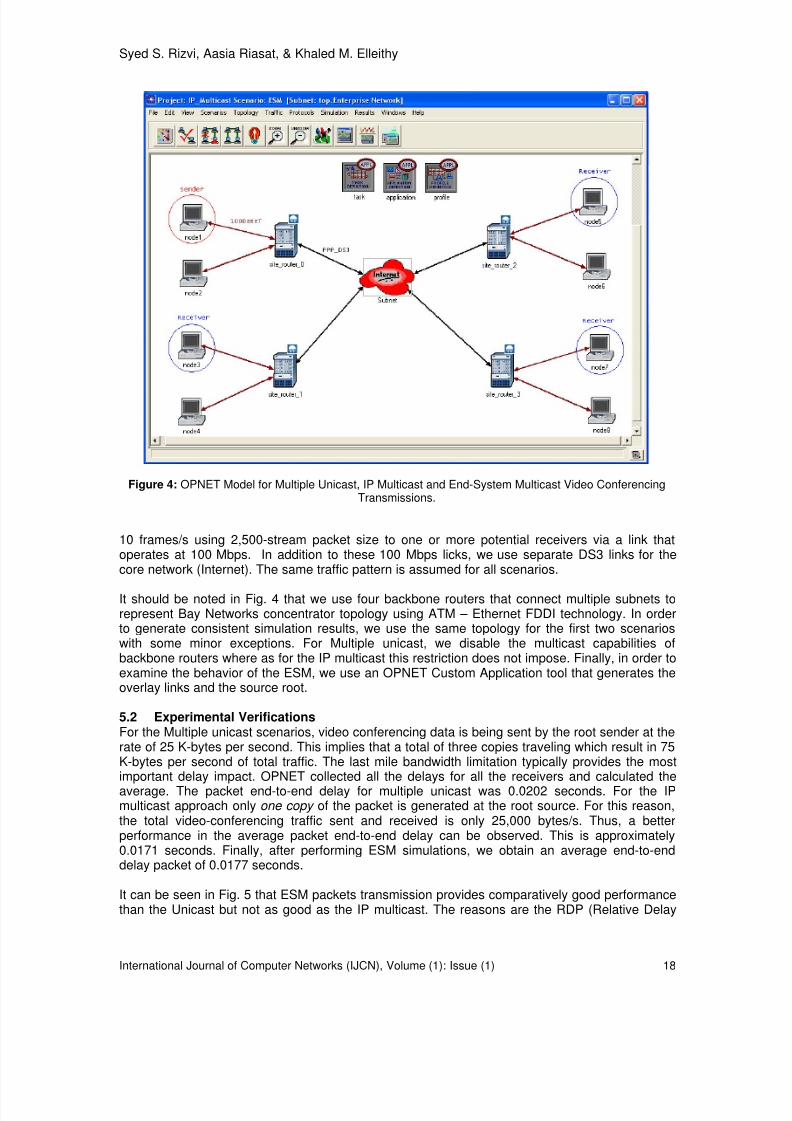
5.1 System ModelSimulations are performed using OPNET to examine the performance of Multiple unicast, IPmulticast, and ESM schemes. Figure 4 shows an OPNET model for the multiple unicast, IPmulticast and ESM simulations. The OPNET simulation has run for a period of 900 seconds for allthree scenarios where we collect the simulated data typically after each 300 seconds. For allscenarios, we have setup one sender node that transmits video conferencing data at the rate of
8/8/2019 IJCN v1 i1
http://slidepdf.com/reader/full/ijcn-v1-i1 22/89
Syed S. Rizvi, Aasia Riasat, & Khaled M. Elleithy
International Journal of Computer Networks (IJCN), Volume (1): Issue (1) 18
10 frames/s using 2,500-stream packet size to one or more potential receivers via a link thatoperates at 100 Mbps. In addition to these 100 Mbps licks, we use separate DS3 links for thecore network (Internet). The same traffic pattern is assumed for all scenarios.
It should be noted in Fig. 4 that we use four backbone routers that connect multiple subnets torepresent Bay Networks concentrator topology using ATM – Ethernet FDDI technology. In orderto generate consistent simulation results, we use the same topology for the first two scenarioswith some minor exceptions. For Multiple unicast, we disable the multicast capabilities ofbackbone routers where as for the IP multicast this restriction does not impose. Finally, in order toexamine the behavior of the ESM, we use an OPNET Custom Application tool that generates theoverlay links and the source root.
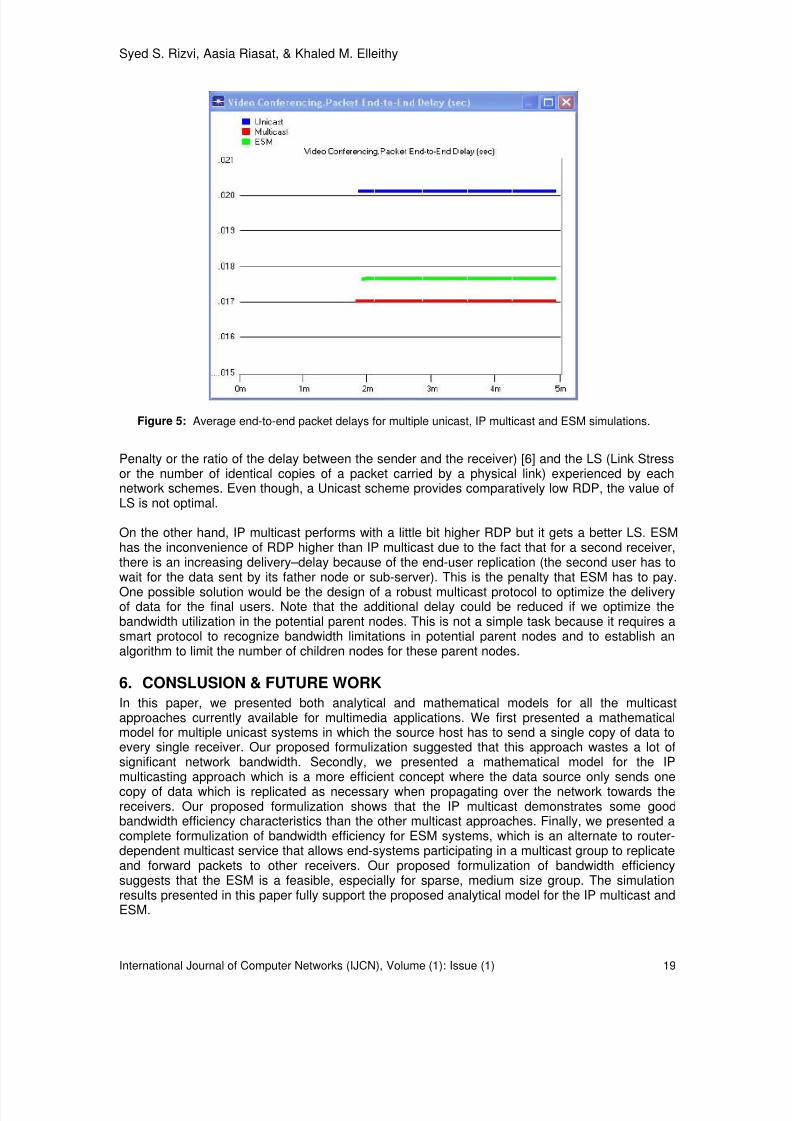
5.2 Experimental VerificationsFor the Multiple unicast scenarios, video conferencing data is being sent by the root sender at therate of 25 K-bytes per second. This implies that a total of three copies traveling which result in 75K-bytes per second of total traffic. The last mile bandwidth limitation typically provides the mostimportant delay impact. OPNET collected all the delays for all the receivers and calculated theaverage. The packet end-to-end delay for multiple unicast was 0.0202 seconds. For the IPmulticast approach only one copy of the packet is generated at the root source. For this reason,the total video-conferencing traffic sent and received is only 25,000 bytes/s. Thus, a betterperformance in the average packet end-to-end delay can be observed. This is approximately0.0171 seconds. Finally, after performing ESM simulations, we obtain an average end-to-enddelay packet of 0.0177 seconds.
It can be seen in Fig. 5 that ESM packets transmission provides comparatively good performancethan the Unicast but not as good as the IP multicast. The reasons are the RDP (Relative Delay
Figure 4: OPNET Model for Multiple Unicast, IP Multicast and End-System Multicast Video ConferencingTransmissions.
8/8/2019 IJCN v1 i1
http://slidepdf.com/reader/full/ijcn-v1-i1 23/89
Syed S. Rizvi, Aasia Riasat, & Khaled M. Elleithy
International Journal of Computer Networks (IJCN), Volume (1): Issue (1) 19
Penalty or the ratio of the delay between the sender and the receiver) [6] and the LS (Link Stressor the number of identical copies of a packet carried by a physical link) experienced by eachnetwork schemes. Even though, a Unicast scheme provides comparatively low RDP, the value ofLS is not optimal.
On the other hand, IP multicast performs with a little bit higher RDP but it gets a better LS. ESMhas the inconvenience of RDP higher than IP multicast due to the fact that for a second receiver,there is an increasing delivery–delay because of the end-user replication (the second user has towait for the data sent by its father node or sub-server). This is the penalty that ESM has to pay.
One possible solution would be the design of a robust multicast protocol to optimize the deliveryof data for the final users. Note that the additional delay could be reduced if we optimize thebandwidth utilization in the potential parent nodes. This is not a simple task because it requires asmart protocol to recognize bandwidth limitations in potential parent nodes and to establish analgorithm to limit the number of children nodes for these parent nodes.
6. CONSLUSION & FUTURE WORK
In this paper, we presented both analytical and mathematical models for all the multicastapproaches currently available for multimedia applications. We first presented a mathematicalmodel for multiple unicast systems in which the source host has to send a single copy of data toevery single receiver. Our proposed formulization suggested that this approach wastes a lot ofsignificant network bandwidth. Secondly, we presented a mathematical model for the IPmulticasting approach which is a more efficient concept where the data source only sends onecopy of data which is replicated as necessary when propagating over the network towards thereceivers. Our proposed formulization shows that the IP multicast demonstrates some goodbandwidth efficiency characteristics than the other multicast approaches. Finally, we presented acomplete formulization of bandwidth efficiency for ESM systems, which is an alternate to router-dependent multicast service that allows end-systems participating in a multicast group to replicateand forward packets to other receivers. Our proposed formulization of bandwidth efficiencysuggests that the ESM is a feasible, especially for sparse, medium size group. The simulationresults presented in this paper fully support the proposed analytical model for the IP multicast andESM.
Figure 5: Average end-to-end packet delays for multiple unicast, IP multicast and ESM simulations.

8/8/2019 IJCN v1 i1
http://slidepdf.com/reader/full/ijcn-v1-i1 24/89
Syed S. Rizvi, Aasia Riasat, & Khaled M. Elleithy
International Journal of Computer Networks (IJCN), Volume (1): Issue (1) 20
7. REFERENCES
1. Y. Ma, R. Chbeir, and K. Yetongnon. “An improved cluster-based P2P multicasting approach ”. Proceedings of the 2nd international conference on Scalable information systems,Vol. 304, No. 59, June 2007.
2. D. Kostić, A. Snoeren, A. Vahdat, R. Braud, C. Killian, J. Anderson, J. Albrecht, A. Rodriguez,E. Vandekieft. “High-bandwidth data dissemination for large-scale distributed systems ”.Transactions on Computer Systems (TOCS), 26(1), February 2008.
3. S. Fahmy and M. Kwon. “Characterizing overlay multicast networks and their costs.”IEEE/ACM Transactions on Networking (TON), 15(2):373 – 386, April 2007.
4. S. Rizvi, A. Riasat, and M. Elleithy. “Deterministic formulization of end-to-end delay for multicast systems.” Accepted in International journal of Computer Networks &Communications, Vol. 2, No.1, 2010.
5. H. Holbroo and D. Cheriton. “IP multicast channels: EXPRESS support for large-scale single- source applications .” In Proceedings of SIGCOMM, 1999.
6. B. Fenner, M. Handley, H. Holbrook and I. Kouvelas. “Protocol independent multicast-sparsemode (PIM-SM): protocol specification (Revised).” IETF Internet Draft, work in progress,March 2003, draft-ietf-pim-sm-v2-new-07.txt
7. D. Kosiur. “IP Multicasting: The complete guide to interactive corporate networks.” New York:John Wiley & Sons, Inc., 1998.
8. J. Saltzer, D. Reed, and D. Clark. “End-to-End arguments in system design .” ACMTransactions on Computer Systems, 2(4):195–206, 1984.
9. Y. Chua, S.Rao, S.Sechan and H. Zhang. “Enabling conferencing applications on the internet using an overlay multicast architecture.” Proceedings of the ACM SIGCOMM’01, San Diego,CA, August 2001.
10. S. Deering. “Multicast routing in inter-networks and extended LANs .” Proceedings of the ACMSIGCOMM 88, pp. 55–64, Stanford, CA, August 1988.
11. Y. Chu, S. Rao, and H. Zhang. “A case for end system multicast .” Proceedings of ACMSigmetrics, June 2000.
12. S. Y. Shi and J.S. Turner. “Multicast routing and bandwidth dimensioning in overlay networks .” IEEE Journal on Selected Areas in Communications (JSAC), 20(8):1444–1455,October 2002.
13. S. Shi. “Design of overlay networks for Internet multicast.” PhD dissertation, Washington University in St. Louis , August 2002.
14. M. Blumenthal and D. Clark. “Rethinking the design of the Internet: The end-to-end argument vs. the brave new world .” ACM Transactions on Internet Technology, 1(1): 70–109, August2001.
15. M. Kwon and S. Fahmy. “Topology-aware overlay networks for group communication.”Proceedings of the 12th international workshop on Network and operating systems supportfor digital audio and video, pp. 127 – 136, May 2002.

8/8/2019 IJCN v1 i1
http://slidepdf.com/reader/full/ijcn-v1-i1 25/89
Baek-Young Choi & Sejun Song
International Journal of Computer Networks (IJCN), Volume (1): Issue (1) 66
Soft Real-Time Guarantee for Control Applications Using BothMeasurement and Analytical Techniques
Baek-Young Choi [email protected] of Missouri,Kansas City, MO, 64110, USA
Sejun Song [email protected] A&M University,College Station, TX, 77843, USA
Abstract
In this paper, we present a probabilistic admission control algorithm overswitched Ethernet to support soft real-time control applications withheterogeneous periodic flows. Our approach is purely end host based, and itenables real-time application-to-application QoS management over switchedEthernet without sophisticated packet scheduling or resource reservationmechanisms in Ethernet switches or middleware on end hosts. In designing theprobabilistic admission control algorithm, we employ both measurement andanalytical techniques. In particular, we provide a new and efficient method toidentify and estimate the queueing delay probability inside Ethernet switches forheterogeneous periodic flows with variable message sizes and periods. Weimplemented the probabilistic admission control algorithm on the Windowsoperating system, and validated its efficacy through extensive experiments.
Keywords: soft real-time, probabilistic admission control, periodic flows.
1. INTRODUCTION
A typical mission-critical real-time control system consists of sensors, actuators, controllers, data-intensive devices, and instrumentation devices. It works with the combination of periodic closedcontrol loops. Controllers receive inputs from various sensors and data-intensive devices andperform control logic that determines how actuators and instrumentation devices should beoperated. Each control loop has its Quality-of-Service (QoS) requirements, in particular, timingrequirements including delay, jitter, and loss for a certain size message transmission.Traditionally, the mission-critical real-time control systems are designed to support the hard guarantee of their QoS requirements. However, for many practical real-time control systems
found in industrial process controls, real-time signal processing, and telecommunications, a hard guarantee could be considered overly stringent by requiring excessive system resources. Thestatistical or soft guarantee accepts the performance as long as the violation probability of QoSrequirements is below the pre-specified level. It is desirable to be designed and utilized for manyreal-time control applications to allow an efficient resource usage. In this paper, we focus on real-time control systems with soft QoS requirements, more specifically, soft delay guarantees.
Various real-time control networks have been developed with proprietary hardware and protocolsolutions to provide deterministic controls for the specific applications. However, recent trends inthe mission-critical control system industry replace proprietary networks with commercial-off-the-
8/8/2019 IJCN v1 i1
http://slidepdf.com/reader/full/ijcn-v1-i1 26/89
Baek-Young Choi & Sejun Song
International Journal of Computer Networks (IJCN), Volume (1): Issue (1) 67
shelf (COTS) or open networks so as to reduce product development cycle time and cost as wellas to achieve system interoperability. Moreover, high-bandwidth sensors (e.g., infrared video,acoustic, and color sensors) are becoming increasingly common in control networks. Due to itsubiquity, simplicity and low cost, Ethernet has become a de facto choice for developing openmission-critical network strategies [2], [20], [13]. However, as the traditional Ethernet is a sharedcommunication network using the CSMA/CD (Carrier Sense Media Access/Collision Detect) MACprotocol, packets to be transmitted may be held back arbitrarily long due to the randomexponential back-off algorithm used to avoid collision. In other words, packet transmission delayover the traditional Ethernet is unpredictable, which makes it difficult to build a real-time controlnetwork over the traditional Ethernet. A better way to build real-time control systems over a localarea network (LAN) is to use the switched Ethernet technology. Because of its switching capacity,an Ethernet switch not only enables fast packet transmission, but also reduces the chance ofpacket collision. Furthermore, with its internal buffer, a switched Ethernet can temporarily bufferpackets that are competing for the same output port, further reducing the chance of an insideswitch packet collision. However, a shared buffer inside of Ethernet switches introduces variablequeueing delays of the packet transmission [16]. To build real-time control systems over switchedEthernet, it needs additional mechanisms to orchestrate competing resources according to theQoS requirements. However, QoS aware reservations or admission mechanisms are notavailable at Ethernet switches, unlike IP based solutions on more sophisticated IP routers.
In this paper, we propose a novel probabilistic admission control approach on the switchedEthernet environments to enable soft real-time guarantees for the mission-critical controlapplications. The proposed approach is designed for the typical control applications, which havevarious periodic packet flows with different packet sizes . It performs an admission control on theend control host, that starts a periodic real-time control flow, to determine whether a newconnection (or a flow ) between two control end hosts can be established. This admissibility checkensures that the application-to-application delay requirements of the new and existing flows canbe guaranteed within a pre-specified probabilistic delay bound. The probabilistic admissioncontrol algorithm on the end control host works as follows. It first measures the baseline delaydistribution when there are no competing flows in the switched Ethernet control network. Thisinitial measurement of the baseline delay distribution captures the “fixed” delay components,including propagation delay, packet transmission time, and operating system overhead.According to the baseline delay distribution and the information regarding flow requests, it then
estimates the probability of a queueing delay at the Ethernet switches when there are multiplecompeting flows for the same output port. It provides an efficient method to estimate theprobability of a queueing delay for heterogeneous periodic flows in order to obtain a probabilisticdelay bound.
The proposed approach is a pure end-host based solution that does not require any software orhardware modification to the Ethernet switches. For easy deployment, it is designed in theapplication layer that does not require any sophisticated middleware installation in the end hostOperating System kernel. We implement the admission control algorithm on the COTS OS basedend-hosts and conduct extensive experiments over the switched Ethernet environments. Throughthe experiments, we validate the effectiveness of the proposed probabilistic admission controlapproach.
The remainder of the paper is organized as follows. We first discuss the related work on real-timescheduling and admission control in a LAN control network environment in Section 2. In Section3, we describe the problem setting, the queueing analysis and the proposed admission controlalgorithm in detail. The software design and implementation is presented in Section 4. In Section5, we describe the experiment design and results. The paper is concluded with a summary of thework and future research directions in Section 6.
8/8/2019 IJCN v1 i1
http://slidepdf.com/reader/full/ijcn-v1-i1 27/89
Baek-Young Choi & Sejun Song
International Journal of Computer Networks (IJCN), Volume (1): Issue (1) 68
2. RELATED WORK
In the area of real-time research, a lot of efforts have been made to provide hard deadlineguarantees over Ethernet with the expense of resource utilization and average performance.Most of the earlier work [21], [17], [7] modified the Ethernet MAC sub-layer to achieve a boundedchannel access time. These proprietary approaches are quite costly compared to using the well-established and widely-used current Ethernet standard. Both [24], [6], [15] proposed a virtual non-
collision token ring implementation over the collision-based Ethernet. Since the tokenmanagement protocol is executed by the higher-layer (OS kernel of the hosts) rather than theMAC, the approach does not need to modify the network hardware architecture. The majorshortcomings of this approach are the overhead of heavy token management including the tokenrelay among the hosts and the restoration of the lost token and the performance limitation due tothe overly conservative network usage. Recent studies try to achieve the hard real-timeguarantee without modifying network hardware architecture. [12] proposed a traffic shapingsoftware on the Ethernet switch to achieve hard guarantees with bounded delays and reservedbandwidths. The proposed solution in [8] designed on standard Ethernet switches with Layer 2QoS/CoS protocol for traffic prioritization (IEEE 802.1p). It requires a separate queue for eachpriority class on the switch, but it cannot be smoothly deployed with currently widespreadEthernet switches that have a common buffer to share all priority classes. It may lead to the missof QoS guarantees for high priority packets; for example, if the common buffer is already packed
by the lower priority packets. [9] tried to resolve the problem of the shared buffer by usingadditional traffic shaping mechanisms available in other higher layer network elements such asrouters.
While there is a lot of research on designing, validating, and facilitating traditional hard real-timesystems, only few such techniques exist on soft real-time systems in spite of the recentproliferation of soft real-time applications. The existing soft real-time research mostly is focusedon schedulability analysis techniques. Probabilistic Time Demand Analysis (PTDA) [23] andStatistical Rate Monotonic Scheduling (SRMS) [3] are the algorithms about the statisticalbehavior of periodic tasks to facilitate better design of soft real-time systems.
PTDA attempts to provide a lower bound of the missing deadline probability that is determined bythe time supply that equals or exceeds the time demand at the deadline of the task. The timedemand is computed by convolving the probability density functions of the execution times. Itassumes that the relative deadline of all tasks are less than or equal to their period. SRMSattempts to schedule tasks with highly variable execution times in such a way that the portion ofthe processor time allocated to each task is met on the average. Variable execution times aresmoothed by aggregating the executions of several jobs in a task and allocating an executiontime budget for the aggregate. A job is released only if its task contains a sufficient budget tocomplete it in time and if higher priority jobs will not prevent its timely completion.
In a statistical real-time guarantee work [10], they analyzed the Ethernet MAC protocol using asemi-Markov process model and derived a network-wide input limit for achieving a targettransmission success ratio. The network-wide input limit is kept by enforcing each componentstation to control its instantaneous traffic arrival rate under its station-wide input limit. To this end,they implemented a traffic smoothing middleware between the transport layer and the Ethernetdata link layer at each station. The middleware keeps the traffic arrival rate under the station-wide
input limit by smoothing a busty packet stream. An enhancement on the traffic smoother is madeby [5]. They used the overall throughput in tandem with the number of collisions as network loadindicators to feed into their fuzzy traffic smoother to give the flexibility on the sporadic trafficprocess. Unlike our approach based on switched Ethernet, these studies focused on designing atraffic smoother using an ordinary shared Ethernet hub.

8/8/2019 IJCN v1 i1
http://slidepdf.com/reader/full/ijcn-v1-i1 28/89
Baek-Young Choi & Sejun Song
International Journal of Computer Networks (IJCN), Volume (1): Issue (1) 69
Queueing system studies on multiplexing periodic flows have been limited to flows with the same
packet size [14] (N ∗ D/D/1, ∑ Di /D/1 queue) in the past. A relevant work in the switch can be
found in Raha et al.’s work on real-time ATM [19], [18]. Their research focuses on the worst casequeuing analysis. They devised Gamma functions to represent the flows’ worst-case bandwidthrequirements across different time scales. These gamma functions can be used to compute theworst-case queueing delay in an ATM switch buffer. Since ATM cells are of fixed size, theswitch’s processing rate is constant. Therefore, the worst-case delay on each node can becomputed. Since the exact gamma functions are too complex to compute, they designed threeapproximation methods. However, their analysis based on gamma functions only works for fixedpacket size such as ATM cells. It is therefore not applicable for switched Ethernet with variablepacket size.
3. PROBABILISTIC ADMISSION CONTROL APPROACH
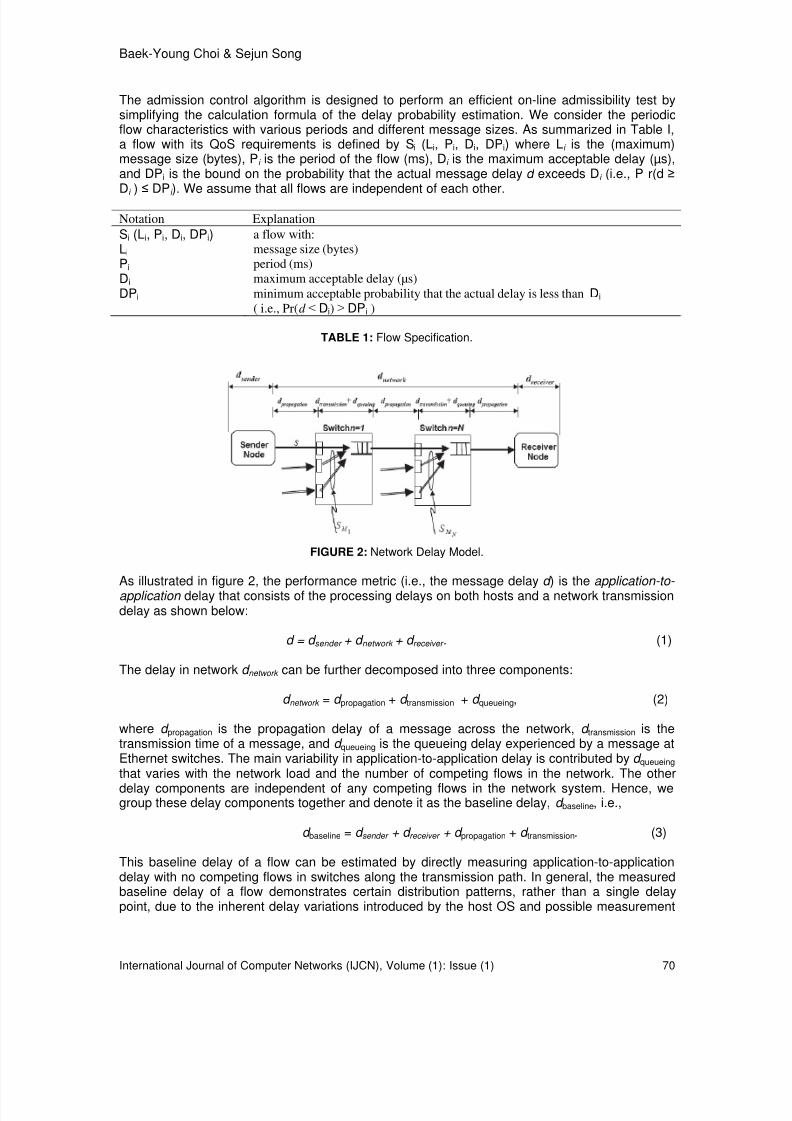
3.1 Problem SettingAlthough the proposed probabilistic admission control approach can be implemented in either adistributed or a centralized fashion, figure 1 illustrates a distributed approach based controlnetwork environment. The control network environment has several control application hostsconnected by a typical Ethernet switch with simple FIFO port buffers. The probabilistic admissioncontrol software is distributed to each control host running on the application layer. Each controlhost also maintains the control flow information database that is synchronized over the entirecontrol network. Flow is used to refer to a connection between two control applications to transmitperiodic messages. When a flow is requested on a control host, the host performs an admissibility test to check whether its delay requirement can be satisfied within the pre-specified probabilisticdelay bound. If the flow request is admitted, a broadcast message of flow addition is sent to othercontrol hosts in order to update their flow information database. When a flow is terminated, abroadcast message of flow deletion is sent to remove the flow from the distributed hosts’ flowinformation database. In general, since a distributed approach has multiple admission controlpoints (on each control host) over the control system network, the concurrent flow requests on thedistributed control hosts can potentially lead to unexpected QoS violations. To deal with thisissue, there is a proposal [11] to utilize a safety margin in order to absorb the potential impact ofconcurrency.
FIGURE 1: Network System Architecture.
8/8/2019 IJCN v1 i1
http://slidepdf.com/reader/full/ijcn-v1-i1 29/89
Baek-Young Choi & Sejun Song
International Journal of Computer Networks (IJCN), Volume (1): Issue (1) 70
The admission control algorithm is designed to perform an efficient on-line admissibility test bysimplifying the calculation formula of the delay probability estimation. We consider the periodicflow characteristics with various periods and different message sizes. As summarized in Table I,a flow with its QoS requirements is defined by Si (Li, Pi, Di, DPi) where Li is the (maximum)message size (bytes), Pi is the period of the flow (ms), D i is the maximum acceptable delay (µs),and DPi is the bound on the probability that the actual message delay d exceeds Di (i.e., P r(d ≥ D
i ) ≤ DP
i ). We assume that all flows are independent of each other.
Notation Explanation
Si (Li, Pi, Di, DPi) a flow with:
Li message size (bytes)
Pi period (ms)
Di maximum acceptable delay (µs)
DPi minimum acceptable probability that the actual delay is less than Di
( i.e., Pr(d ≤ Di) ≥ DPi )
TABLE 1: Flow Specification.
FIGURE 2: Network Delay Model.
As illustrated in figure 2, the performance metric (i.e., the message delay d ) is the application-to- application delay that consists of the processing delays on both hosts and a network transmissiondelay as shown below:
d = d sender + d network + d receiver . (1)
The delay in network d network can be further decomposed into three components:
d network = d propagation + d transmission + d queueing, (2)
where d propagation is the propagation delay of a message across the network, d transmission is thetransmission time of a message, and d queueing is the queueing delay experienced by a message atEthernet switches. The main variability in application-to-application delay is contributed by d queueing that varies with the network load and the number of competing flows in the network. The other
delay components are independent of any competing flows in the network system. Hence, wegroup these delay components together and denote it as the baseline delay, d baseline, i.e.,
d baseline = d sender + d receiver + d propagation + d transmission. (3)
This baseline delay of a flow can be estimated by directly measuring application-to-applicationdelay with no competing flows in switches along the transmission path. In general, the measuredbaseline delay of a flow demonstrates certain distribution patterns, rather than a single delaypoint, due to the inherent delay variations introduced by the host OS and possible measurement
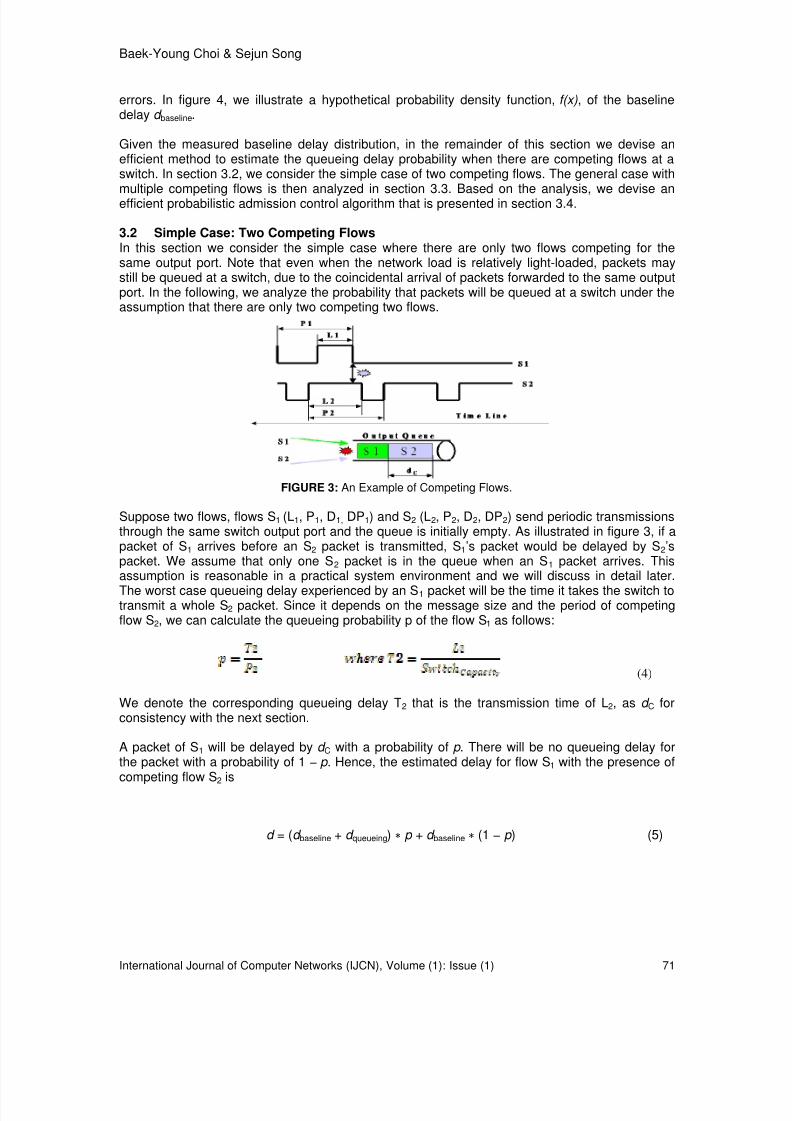
8/8/2019 IJCN v1 i1
http://slidepdf.com/reader/full/ijcn-v1-i1 30/89
Baek-Young Choi & Sejun Song
International Journal of Computer Networks (IJCN), Volume (1): Issue (1) 71
errors. In figure 4, we illustrate a hypothetical probability density function, f(x), of the baselinedelay d baseline.
Given the measured baseline delay distribution, in the remainder of this section we devise anefficient method to estimate the queueing delay probability when there are competing flows at aswitch. In section 3.2, we consider the simple case of two competing flows. The general case withmultiple competing flows is then analyzed in section 3.3. Based on the analysis, we devise anefficient probabilistic admission control algorithm that is presented in section 3.4.
3.2 Simple Case: Two Competing FlowsIn this section we consider the simple case where there are only two flows competing for thesame output port. Note that even when the network load is relatively light-loaded, packets maystill be queued at a switch, due to the coincidental arrival of packets forwarded to the same outputport. In the following, we analyze the probability that packets will be queued at a switch under theassumption that there are only two competing two flows.
FIGURE 3: An Example of Competing Flows.
Suppose two flows, flows S1 (L1, P1, D1, DP1) and S2 (L2, P2, D2, DP2) send periodic transmissionsthrough the same switch output port and the queue is initially empty. As illustrated in figure 3, if apacket of S1 arrives before an S2 packet is transmitted, S1’s packet would be delayed by S2’spacket. We assume that only one S2 packet is in the queue when an S1 packet arrives. Thisassumption is reasonable in a practical system environment and we will discuss in detail later.
The worst case queueing delay experienced by an S1 packet will be the time it takes the switch totransmit a whole S2 packet. Since it depends on the message size and the period of competingflow S2, we can calculate the queueing probability p of the flow S1 as follows:
(4)
We denote the corresponding queueing delay T2 that is the transmission time of L2, as d C forconsistency with the next section.
A packet of S1 will be delayed by d C with a probability of p . There will be no queueing delay forthe packet with a probability of 1 − p . Hence, the estimated delay for flow S1 with the presence ofcompeting flow S2 is
d = (d baseline + d queueing) ∗ p + d baseline ∗ (1 − p ) (5)

8/8/2019 IJCN v1 i1
http://slidepdf.com/reader/full/ijcn-v1-i1 31/89
Baek-Young Choi & Sejun Song
International Journal of Computer Networks (IJCN), Volume (1): Issue (1) 72
FIGURE 4: Probability Density Function for Baseline Delay.
FIGURE 5: Partial Probability Density Function for No-Queuing Case.
As we will see in section 5, d baseline, the measured delay of a certain flow without interference fromother flows, demonstrates certain distribution patterns rather than a single delay point, due to thevariation of the delay factors. In figure 4, we illustrate a hypothetical probability density function,f(x), of the baseline distribution, d baseline. The partial probability density function of the no-queuing
case f(x) ∗ (1 − p) is illustrated in figure 5. The partial probability density function of the queuing
case, f(x − d C ) ∗ p is equivalent to shifting f(x) by d C and multiplying by p as shown in figure 6. As
illustrated in figure 7, the estimated delay distribution density function f f (x) in the presence of the
competing flow is derived by adding up partial delay distributions.
f f (x) = f(x − d C ) ∗ p + f(x) ∗ (1 − p) (6)
FIGURE 6: Partial Probability Density Function for Queuing Case.
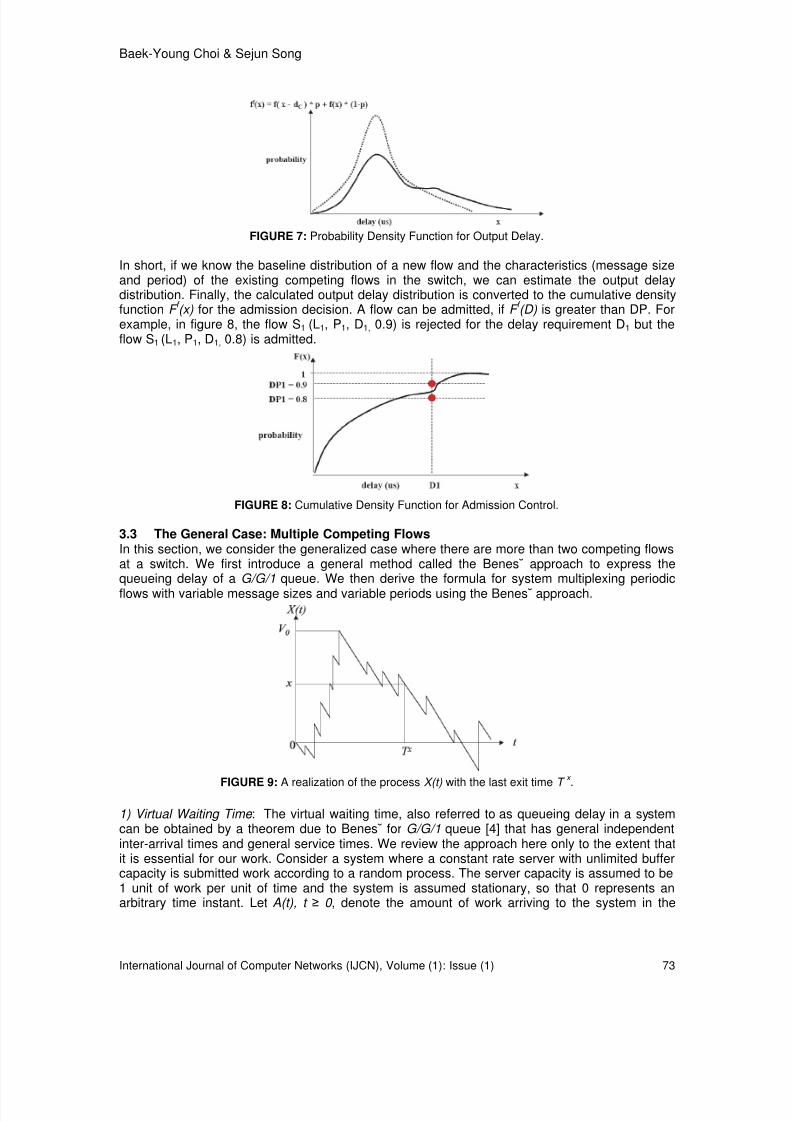
8/8/2019 IJCN v1 i1
http://slidepdf.com/reader/full/ijcn-v1-i1 32/89
Baek-Young Choi & Sejun Song
International Journal of Computer Networks (IJCN), Volume (1): Issue (1) 73
FIGURE 7: Probability Density Function for Output Delay.
In short, if we know the baseline distribution of a new flow and the characteristics (message sizeand period) of the existing competing flows in the switch, we can estimate the output delaydistribution. Finally, the calculated output delay distribution is converted to the cumulative densityfunction F
f (x) for the admission decision. A flow can be admitted, if F
f (D) is greater than DP. For
example, in figure 8, the flow S1 (L1, P1, D1, 0.9) is rejected for the delay requirement D1 but theflow S1 (L1, P1, D1, 0.8) is admitted.
FIGURE 8: Cumulative Density Function for Admission Control.
3.3 The General Case: Multiple Competing FlowsIn this section, we consider the generalized case where there are more than two competing flowsat a switch. We first introduce a general method called the Benes˘ approach to express thequeueing delay of a G/G/1 queue. We then derive the formula for system multiplexing periodic
flows with variable message sizes and variable periods using the Benes˘ approach.
FIGURE 9: A realization of the process X(t) with the last exit time T
x
.
1) Virtual Waiting Time : The virtual waiting time, also referred to as queueing delay in a systemcan be obtained by a theorem due to Benes˘ for G/G/1 queue [4] that has general independentinter-arrival times and general service times. We review the approach here only to the extent thatit is essential for our work. Consider a system where a constant rate server with unlimited buffercapacity is submitted work according to a random process. The server capacity is assumed to be1 unit of work per unit of time and the system is assumed stationary, so that 0 represents anarbitrary time instant. Let A(t), t ≥ 0 , denote the amount of work arriving to the system in the
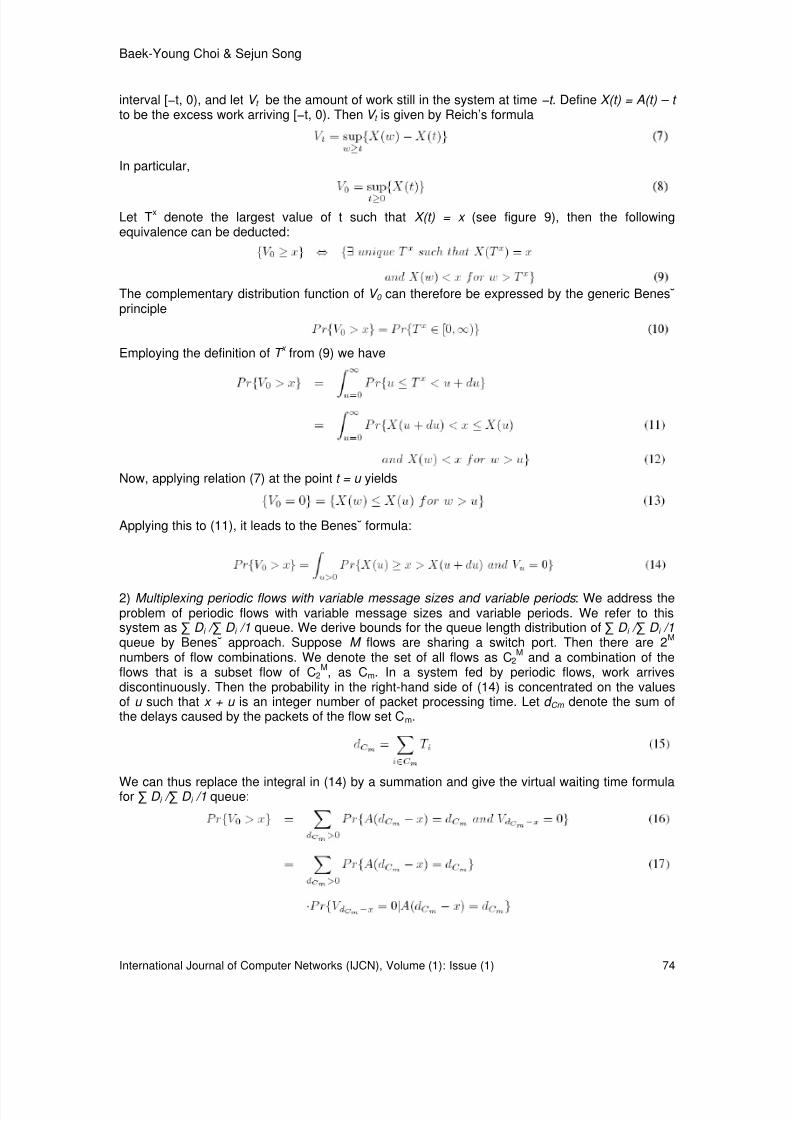
8/8/2019 IJCN v1 i1
http://slidepdf.com/reader/full/ijcn-v1-i1 33/89
Baek-Young Choi & Sejun Song
International Journal of Computer Networks (IJCN), Volume (1): Issue (1) 74
interval [−t, 0), and let V t be the amount of work still in the system at time −t . Define X(t) = A(t) – t to be the excess work arriving [−t, 0). Then V t is given by Reich’s formula
In particular,
Let Tx
denote the largest value of t such that X(t) = x (see figure 9), then the followingequivalence can be deducted:
The complementary distribution function of V 0 can therefore be expressed by the generic Benes˘principle
Employing the definition of T x
from (9) we have
Now, applying relation (7) at the point t = u yields
Applying this to (11), it leads to the Benes˘ formula:
2) Multiplexing periodic flows with variable message sizes and variable periods : We address theproblem of periodic flows with variable message sizes and variable periods. We refer to thissystem as ∑ D i / ∑ D i /1 queue. We derive bounds for the queue length distribution of ∑ D i / ∑ D i /1 queue by Benes˘ approach. Suppose M flows are sharing a switch port. Then there are 2
M
numbers of flow combinations. We denote the set of all flows as C2M
and a combination of theflows that is a subset flow of C2
M, as Cm. In a system fed by periodic flows, work arrives
discontinuously. Then the probability in the right-hand side of (14) is concentrated on the valuesof u such that x + u is an integer number of packet processing time. Let d Cm denote the sum ofthe delays caused by the packets of the flow set Cm.
We can thus replace the integral in (14) by a summation and give the virtual waiting time formulafor ∑ D i / ∑ D i /1 queue:
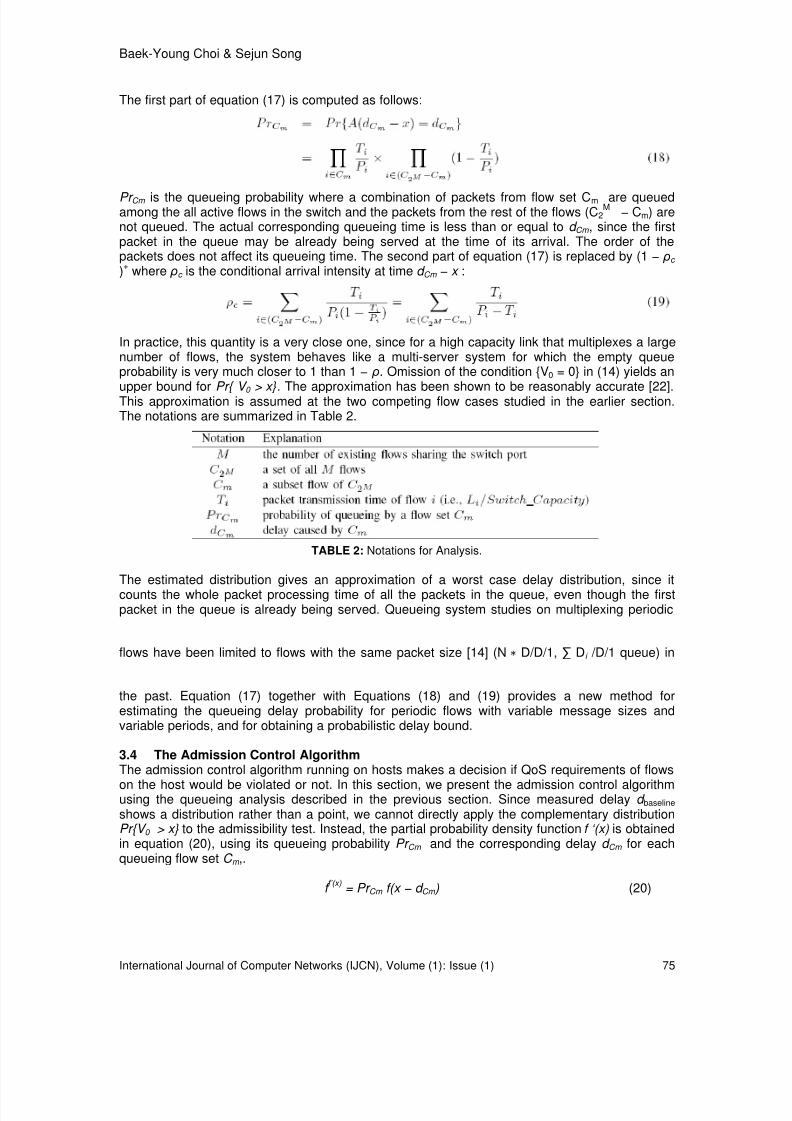
8/8/2019 IJCN v1 i1
http://slidepdf.com/reader/full/ijcn-v1-i1 34/89
Baek-Young Choi & Sejun Song
International Journal of Computer Networks (IJCN), Volume (1): Issue (1) 75
The first part of equation (17) is computed as follows:
Pr Cm is the queueing probability where a combination of packets from flow set C m are queuedamong the all active flows in the switch and the packets from the rest of the flows (C 2
M− Cm) are
not queued. The actual corresponding queueing time is less than or equal to d Cm , since the firstpacket in the queue may be already being served at the time of its arrival. The order of thepackets does not affect its queueing time. The second part of equation (17) is replaced by (1 − ρc )+
where ρc is the conditional arrival intensity at time d Cm − x :
In practice, this quantity is a very close one, since for a high capacity link that multiplexes a largenumber of flows, the system behaves like a multi-server system for which the empty queueprobability is very much closer to 1 than 1 − ρ. Omission of the condition {V0 = 0} in (14) yields an
upper bound for Pr{ V 0 > x}. The approximation has been shown to be reasonably accurate [22].This approximation is assumed at the two competing flow cases studied in the earlier section.The notations are summarized in Table 2.
TABLE 2: Notations for Analysis.
The estimated distribution gives an approximation of a worst case delay distribution, since itcounts the whole packet processing time of all the packets in the queue, even though the firstpacket in the queue is already being served. Queueing system studies on multiplexing periodic
flows have been limited to flows with the same packet size [14] (N ∗ D/D/1, ∑ Di /D/1 queue) in
the past. Equation (17) together with Equations (18) and (19) provides a new method forestimating the queueing delay probability for periodic flows with variable message sizes andvariable periods, and for obtaining a probabilistic delay bound.
3.4 The Admission Control AlgorithmThe admission control algorithm running on hosts makes a decision if QoS requirements of flows
on the host would be violated or not. In this section, we present the admission control algorithmusing the queueing analysis described in the previous section. Since measured delay d baseline shows a distribution rather than a point, we cannot directly apply the complementary distributionPr{V 0 > x} to the admissibility test. Instead, the partial probability density function f ‘(x) is obtainedin equation (20), using its queueing probability Pr Cm and the corresponding delay d Cm for eachqueueing flow set C m ,.
f f’(x)
= Pr Cm f(x − d Cm ) (20)

8/8/2019 IJCN v1 i1
http://slidepdf.com/reader/full/ijcn-v1-i1 35/89
Baek-Young Choi & Sejun Song
International Journal of Computer Networks (IJCN), Volume (1): Issue (1) 76
The partial probability density functions are summed up to be the output delay distribution f f (x).
The output delay distribution is converted to the cumulative density function F f (D) to see if the
deadline is satisfied with the required probability. The probability that the delay is less than thedeadline D is evaluated from the final cumulative density function F
f as below (equation 22):
The algorithm is particularly complex to evaluate, since the number of possible queueingcombinations grows exponentially with the number of competing flows. For each possiblecompeting flow combination, the algorithm needs computation process and memory usage tomodify the partial probability density function (to be shifted and to be multiplied) and to convert itto the cumulative density function.
To make this approach practical, we made a couple of improvements to the algorithm. First, weobserved that the packet queuing probability, due to a large number of other competing flows isvery small when the stable network condition is satisfied. In most of the experiment settings, thepacket queuing probability due to more than five competing flows was less than 10
−10. Therefore,
the computation of those combinations can be waived. More importantly, we found a derivationthat enables us to make the admission decision without handling partial probability densityfunction modifications and the cumulative density function conversion. In the following derivation(equation (23)), the admission decision is made by using the cumulative density function of thebaseline distribution. Only one point (D − d C) of the baseline distribution needs to be evaluated foreach modification of the competing flow combinations.
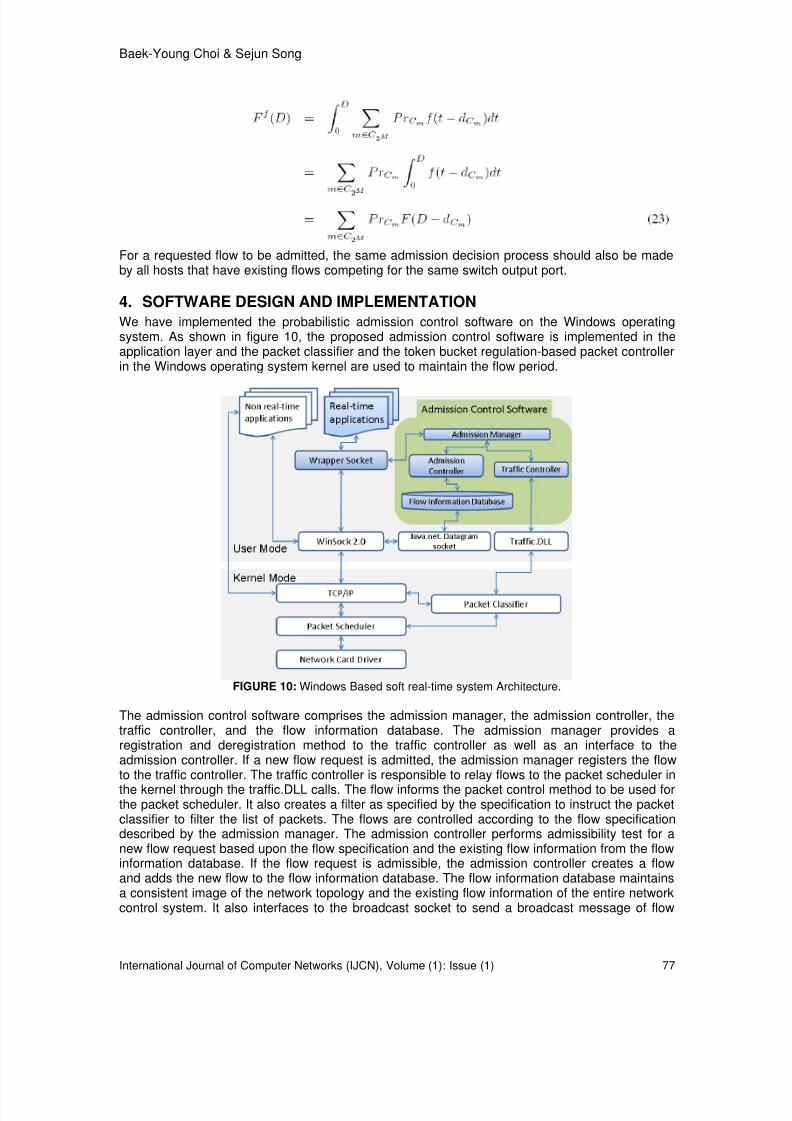
8/8/2019 IJCN v1 i1
http://slidepdf.com/reader/full/ijcn-v1-i1 36/89
Baek-Young Choi & Sejun Song
International Journal of Computer Networks (IJCN), Volume (1): Issue (1) 77
For a requested flow to be admitted, the same admission decision process should also be madeby all hosts that have existing flows competing for the same switch output port.
4. SOFTWARE DESIGN AND IMPLEMENTATION
We have implemented the probabilistic admission control software on the Windows operatingsystem. As shown in figure 10, the proposed admission control software is implemented in theapplication layer and the packet classifier and the token bucket regulation-based packet controllerin the Windows operating system kernel are used to maintain the flow period.
FIGURE 10: Windows Based soft real-time system Architecture.
The admission control software comprises the admission manager, the admission controller, thetraffic controller, and the flow information database. The admission manager provides aregistration and deregistration method to the traffic controller as well as an interface to theadmission controller. If a new flow request is admitted, the admission manager registers the flowto the traffic controller. The traffic controller is responsible to relay flows to the packet scheduler in
the kernel through the traffic.DLL calls. The flow informs the packet control method to be used forthe packet scheduler. It also creates a filter as specified by the specification to instruct the packetclassifier to filter the list of packets. The flows are controlled according to the flow specificationdescribed by the admission manager. The admission controller performs admissibility test for anew flow request based upon the flow specification and the existing flow information from the flowinformation database. If the flow request is admissible, the admission controller creates a flowand adds the new flow to the flow information database. The flow information database maintainsa consistent image of the network topology and the existing flow information of the entire networkcontrol system. It also interfaces to the broadcast socket to send a broadcast message of flow

8/8/2019 IJCN v1 i1
http://slidepdf.com/reader/full/ijcn-v1-i1 37/89
Baek-Young Choi & Sejun Song
International Journal of Computer Networks (IJCN), Volume (1): Issue (1) 78
addition to other control hosts in order to update their flow information database. The admissioncontrol software is used by the real-time applications via Wrapper Socket API calls that are theJava-based wrapper APIs implemented above Winsock 2. The Wrapper Sockets pass the flowspecification to the admission manager along with the source and destination IP addresses,destination port, and QoS enable indication. It relays the application flows to the Winsock 2according to the admission decision.
5. EXPERIM ENTS AND RESULTS
To validate the efficiency of the proposed probabilistic admission control approach, we haveconducted extensive experiments on the real networks. In this section, we present theexperimental settings design and results. As illustrated in figure 11, 9 PCs are connected to a 12port Intel express 520T fast Ethernet switch. A test flow generator generates a test message flowto a test flow receiver. Other 7 PCs are used to inject competing traffic flows. Competing flowsare generated by seven other hosts and ten flows are generated per host. Competing flows aresent to the same receiving host as the test flow, ensuring that all competing flows use the sameoutput port of a switch. A combined time delay of the hosts, network, and switch buffer ismeasured using time-stamps derived from the TrueTime
TM[1] clock synchronization tool that
provides one microsecond time resolution. To capture variability of flows both in terms ofmessage size and period, we utilize an extensive set of experimental parameters. The
experimental parameters, such as system environment and flow specifications, are summarizedin Table 3. Although the algorithm can be applied to the flows with various periods with differentmessage sizes, we have conducted the experiments with the same message size and period toillustrate the behavior of the delay as a function of message size and period. For the experimentalparameters, we choose the message size less than the maximum packet fragmentation size(1500 bytes) in order not to introduce additional unnecessary complexity. We also keep theperiod greater than 10 milliseconds due to host delay stability issues (the flow control resolutionof Windows). In a practical control system, most control message sizes are less than themaximum packet fragmentation size and the periodicity constraints are greater than tens ofmilliseconds [2].
FIGURE 11: Testbed Configuration.

8/8/2019 IJCN v1 i1
http://slidepdf.com/reader/full/ijcn-v1-i1 38/89
Baek-Young Choi & Sejun Song
International Journal of Computer Networks (IJCN), Volume (1): Issue (1) 79
TABLE 3: Experiment Parameters.
5.1 Baseline and Competing Flow ExperimentsWe first generate the baseline delay probability distributions that characterize a singlesender/receiver host pair without any other competing flows. This baseline distribution is used toestimate the theoretical distribution with competing flows. We then conduct experiments tomeasure delay distributions with competing flows to validate the theoretical distributionestimations. Each experiment is performed for 30 minutes with 5 minute warm-up interval. Thedelay distributions captured on the receiver are presented as PDF (Probability Density Function)and CDF (Cumulative Density Function).
FIGURE 12: Baseline Distributions: PDFs and CDFs: Fixed Message Size (1400/500/50B from the top row),Variable Periods.
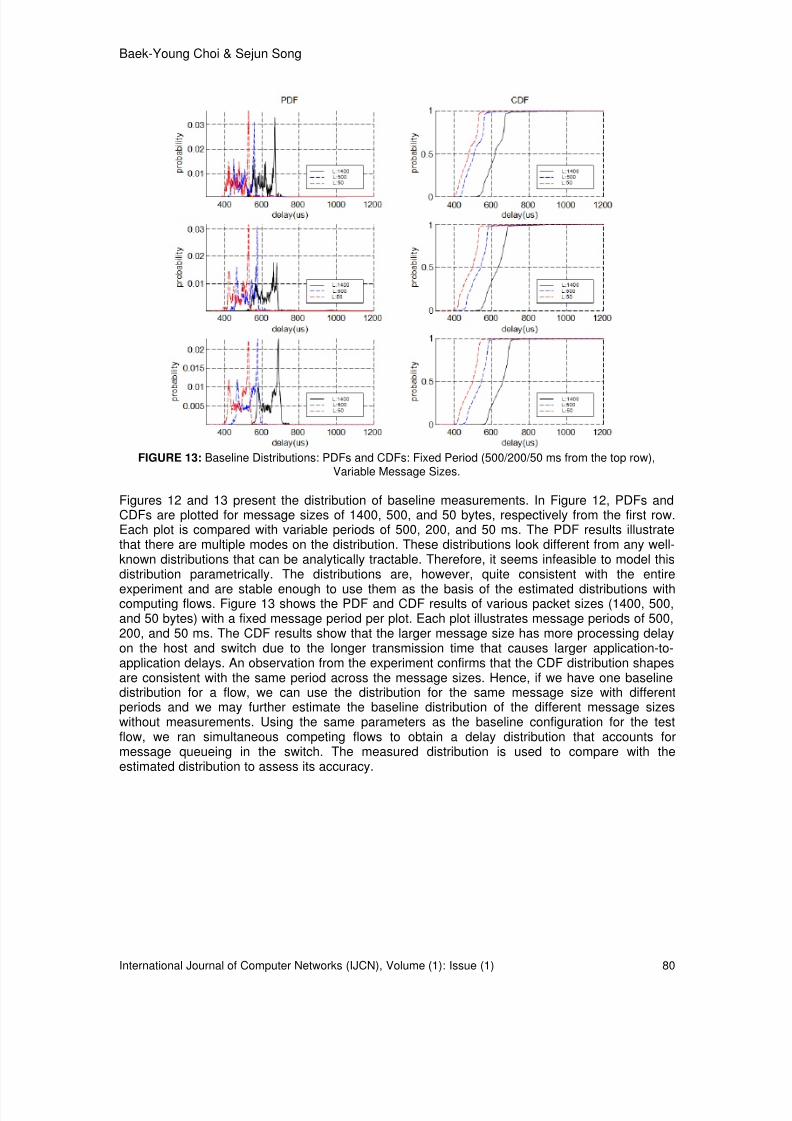
8/8/2019 IJCN v1 i1
http://slidepdf.com/reader/full/ijcn-v1-i1 39/89
Baek-Young Choi & Sejun Song
International Journal of Computer Networks (IJCN), Volume (1): Issue (1) 80
FIGURE 13: Baseline Distributions: PDFs and CDFs: Fixed Period (500/200/50 ms from the top row),Variable Message Sizes.
Figures 12 and 13 present the distribution of baseline measurements. In Figure 12, PDFs andCDFs are plotted for message sizes of 1400, 500, and 50 bytes, respectively from the first row.Each plot is compared with variable periods of 500, 200, and 50 ms. The PDF results illustratethat there are multiple modes on the distribution. These distributions look different from any well-known distributions that can be analytically tractable. Therefore, it seems infeasible to model thisdistribution parametrically. The distributions are, however, quite consistent with the entire
experiment and are stable enough to use them as the basis of the estimated distributions withcomputing flows. Figure 13 shows the PDF and CDF results of various packet sizes (1400, 500,and 50 bytes) with a fixed message period per plot. Each plot illustrates message periods of 500,200, and 50 ms. The CDF results show that the larger message size has more processing delayon the host and switch due to the longer transmission time that causes larger application-to-application delays. An observation from the experiment confirms that the CDF distribution shapesare consistent with the same period across the message sizes. Hence, if we have one baselinedistribution for a flow, we can use the distribution for the same message size with differentperiods and we may further estimate the baseline distribution of the different message sizeswithout measurements. Using the same parameters as the baseline configuration for the testflow, we ran simultaneous competing flows to obtain a delay distribution that accounts formessage queueing in the switch. The measured distribution is used to compare with theestimated distribution to assess its accuracy.
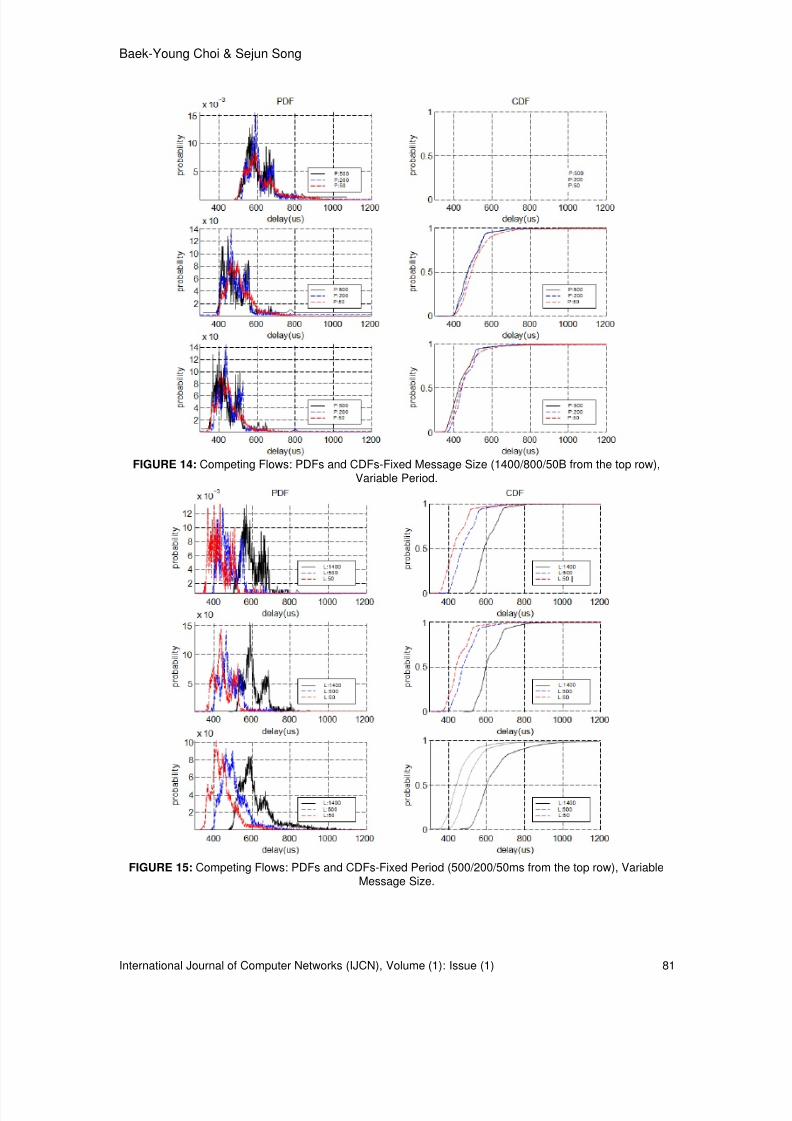
8/8/2019 IJCN v1 i1
http://slidepdf.com/reader/full/ijcn-v1-i1 40/89
Baek-Young Choi & Sejun Song
International Journal of Computer Networks (IJCN), Volume (1): Issue (1) 81
FIGURE 14: Competing Flows: PDFs and CDFs-Fixed Message Size (1400/800/50B from the top row),Variable Period.
FIGURE 15: Competing Flows: PDFs and CDFs-Fixed Period (500/200/50ms from the top row), VariableMessage Size.

8/8/2019 IJCN v1 i1
http://slidepdf.com/reader/full/ijcn-v1-i1 41/89
Baek-Young Choi & Sejun Song
International Journal of Computer Networks (IJCN), Volume (1): Issue (1) 82
The delay distributions with competing flows are shown in figures 14 and 15. In figure 14, PDFsand CDFs are plotted for message sizes of 1400, 500, and 50 bytes, respectively, from the firstrow. Each plot is compared for variable periods of 500, 200, and 50 ms. figure 15 presents theresults of various packet sizes (1400, 500, and 50 bytes) with a fixed message period per plot.Each plot illustrates with message periods of 500, 200, and 50 ms. The experiment uses 7competing flow generators and each host has 10 competing flows that makes 71 flows in totalincluding the test flow. To ensure the flow independence and to reduce the effect of phasesynchronization on the periodic flows, competing flows are generated with different start timesthat are made to be much bigger than the maximum period (if the start time difference is less thanthe maximum period, it may end up phase synchronization with the repeating experiments). Tohave solid statistical results, the experiments are performed repeatedly (more than 200 times).The experiments with competing flows clearly show that flows with longer messages and shorterperiods experience longer delays with higher probability due to queueing events in the switch. Infigure 14, shorter periods tend to result in a high probability of extreme delay for the fixedmessage sizes. i.e., PDFs are more widely distributed (compared to baselines) and in CDFs, itreaches to one slowly especially in high probability regions. In figure 15, the distributions of largermessages sit on the right-hand side of the smaller messages and the gaps are bigger than thecase for baselines since that includes not only transmission delay of its message but alsoqueueing delays.
5.2 Algorithm ValidationThe measurements of various baseline distributions are used to estimate delay distributions thataccount for queueing in the switch for the same number and parameters of flows as in an earliersection. The estimated distributions are compared with the actual competing flow experimentdistributions jointly with baselines in figure 16. The figures are shown for the high probabilityregion (> 0.9) that aligns with the actual real-time requirements. The results show that theestimated distributions with competing flows approach to the experimental distributions especiallyin the higher probability regions. It is also observed that the estimated distributions are moreconservative than the experiment distribution because it considers the worst case distribution.These experimental results in the real implementation validate the proposed approach.
FIGURE 16: Delay CDFs from the Proposed Algorithm with Variable Periods.
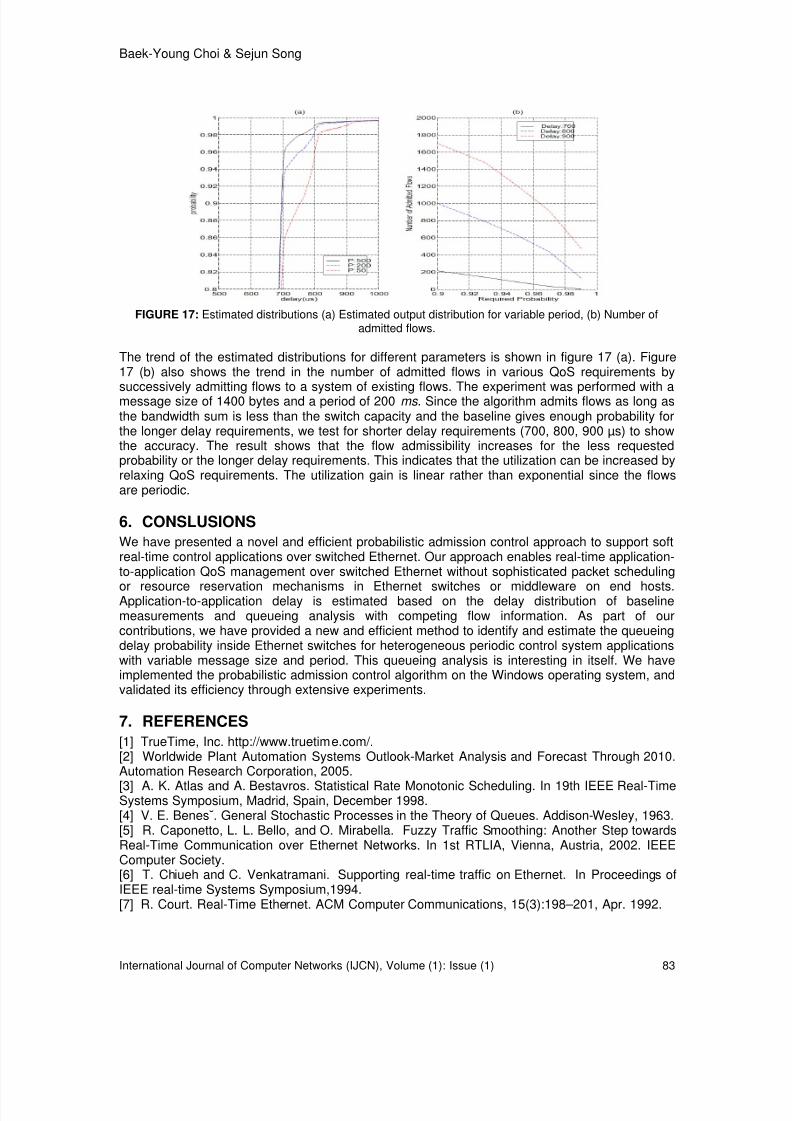
8/8/2019 IJCN v1 i1
http://slidepdf.com/reader/full/ijcn-v1-i1 42/89
Baek-Young Choi & Sejun Song
International Journal of Computer Networks (IJCN), Volume (1): Issue (1) 83
FIGURE 17: Estimated distributions (a) Estimated output distribution for variable period, (b) Number ofadmitted flows.
The trend of the estimated distributions for different parameters is shown in figure 17 (a). Figure17 (b) also shows the trend in the number of admitted flows in various QoS requirements by
successively admitting flows to a system of existing flows. The experiment was performed with amessage size of 1400 bytes and a period of 200 ms . Since the algorithm admits flows as long asthe bandwidth sum is less than the switch capacity and the baseline gives enough probability forthe longer delay requirements, we test for shorter delay requirements (700, 800, 900 µs) to showthe accuracy. The result shows that the flow admissibility increases for the less requestedprobability or the longer delay requirements. This indicates that the utilization can be increased byrelaxing QoS requirements. The utilization gain is linear rather than exponential since the flowsare periodic.
6. CONSLUSIONS
We have presented a novel and efficient probabilistic admission control approach to support softreal-time control applications over switched Ethernet. Our approach enables real-time application-to-application QoS management over switched Ethernet without sophisticated packet scheduling
or resource reservation mechanisms in Ethernet switches or middleware on end hosts.Application-to-application delay is estimated based on the delay distribution of baselinemeasurements and queueing analysis with competing flow information. As part of ourcontributions, we have provided a new and efficient method to identify and estimate the queueingdelay probability inside Ethernet switches for heterogeneous periodic control system applicationswith variable message size and period. This queueing analysis is interesting in itself. We haveimplemented the probabilistic admission control algorithm on the Windows operating system, andvalidated its efficiency through extensive experiments.
7. REFERENCES
[1] TrueTime, Inc. http://www.truetime.com/.[2] Worldwide Plant Automation Systems Outlook-Market Analysis and Forecast Through 2010.Automation Research Corporation, 2005.
[3] A. K. Atlas and A. Bestavros. Statistical Rate Monotonic Scheduling. In 19th IEEE Real-TimeSystems Symposium, Madrid, Spain, December 1998.[4] V. E. Benes˘. General Stochastic Processes in the Theory of Queues. Addison-Wesley, 1963.[5] R. Caponetto, L. L. Bello, and O. Mirabella. Fuzzy Traffic Smoothing: Another Step towardsReal-Time Communication over Ethernet Networks. In 1st RTLIA, Vienna, Austria, 2002. IEEEComputer Society.[6] T. Chiueh and C. Venkatramani. Supporting real-time traffic on Ethernet. In Proceedings ofIEEE real-time Systems Symposium,1994.[7] R. Court. Real-Time Ethernet. ACM Computer Communications, 15(3):198–201, Apr. 1992.
8/8/2019 IJCN v1 i1
http://slidepdf.com/reader/full/ijcn-v1-i1 43/89
Baek-Young Choi & Sejun Song
International Journal of Computer Networks (IJCN), Volume (1): Issue (1) 84
[8] Xing Fan and Magnus Jonsson. Guaranteed Real-Time Services over Standard SwitchedEthernet. In Proceedings of the IEEE Conference on Local Computer Networks 30th Anniversary(LCN,05), Sydney, Australia, 2005. IEEE Computer Society.[9] Robert Janowski, Piotr Krawiec, and Wojciech Burakowski. On assuring QoS in Ethernetaccess network. In Proceedings of the Third International Conference on Networking andServices ICNS’07, Athens, Greece, 2007. IEEE Computer Society.[10] S.-K. Kweon and K. Shin. Real-Time Communication over Ethernet with Adaptive TrafficSmoothing. In RTAS ’00: Proceedings of the Sixth IEEE Real-Time Technology and ApplicationsSymposium, Washington, DC, USA, 2000. IEEE Computer Society.[11] S. Lima, P. Carvalho, and V. Freitas. Distributed Admission Control in Multiservice IPNetworks: Concurrency issues. Journal of Communications, 1(3):1–9, June 2006.[12] J. Loeser and H. Haertig. Low-latency Hard Real-Time Communication over SwitchedEthernet. In Proceedings of the 16
thEuromicro Conference on Real-Time Systems (ECRTS 04),
Catania, Italy, 2004. IEEE Computer Society.[13] D. Loy and R. Schmalek. Thoughts About Redundancy in Fieldbus Systems Anchored inOSI Layer-4 and Applied to the Lontalk Protocol on Neuron-Based Network Nodes. In IEEEInternational Workshop on Factory Communication Systems, October 1995.[14] I. Norros, J. W. Roberts, A. Simonian, and J. T. Virtamo:. The superposition of variable bitrate sources in an ATM multipler. IEEE Journal of Selected Areas on Communication, 9(3):378– 387, 1991.
[15] P. Pedreiras, L. Almeida, and P. Gai. The ftt-ethernet protocol: Merging flexibility, timelinessand efficiency. In Euromicro ECRTS’02, Vienna, Austria, 2002. IEEE Computer Society.[16] P. Pedreiras, R. Leite, and L. Almeida. Characterizing the Real-Time Behavior of PrioritizedSwitched-Ethernet. In 2nd RTLIA, Porto, Portugal, 2003. IEEE Computer Society.[17] D. W. Pritty, J. R. Malone, S. K. Banerjee, and N. L. Lawrie. A real-time upgrade for Ethernetbased factory networking. In Annual Conference of the IEEE Industrial Electronics Society(IECON), 1995.[18] A. Raha, S. Kamat, and W. Zhao. Guaranteeing End-to-End Deadlines in ATM networks. In15th International Conference on Distributed Computing Systems, 1995.[19] A. Raha, S. Kamat, and W. Zhao. Admission Control for Hard Real-Time Connections inATM LANs. In IEEE INFOCOM, San Francisco, CA, March 1996.[20] Automation Strategies Report. Ethernet-Based Control Network Strategies. AutomationResearch Corporation, Oct. 1997.
[21] Y. Shimokawa and Y. Shiobara. Real-Time Ethernet for industrial applications. In AnnualConference of the IEEE Industrial Electronics Society (IECON), 1985.[22] V. Sivaraman and F. Chiussi. Providing End-to-End Statistical Delay Guarantees withEarliest Deadline First Scheduling and Per-Hop Traffic Shaping. In IEEE INFOCOM, 2000.[23] T. S. Tia, Z. Deng, M. Shankar, M. Storch, J. Sun, L. C. Wu, and J. W. S. Liu. Probabilisticperformance guarantee for real-time tasks with varying computation times. In IEEE Real-TimeTechnology and Applications Symposium, Chicago, IL, May 1995.[24] C. Venkatramani and T. Chiueh. Design, Implementation, and Evaluation of a Software-based Real-Time Ethernet Protocol. In ACM SIGCOMM, Cambridge, MA, August 1995.

8/8/2019 IJCN v1 i1
http://slidepdf.com/reader/full/ijcn-v1-i1 44/89
Xinying Zheng & Yu Cai
International Journal of Computer Networks (IJCN), Volume (1): Issue (1) 21
Achieving Energy Proportionality In Server Clusters
Xinying Zheng [email protected] Candidate /Electrical and Computer Engineering
Michigan Technological University Houghton, 49931, US
Yu Cai [email protected] Professor /School of Technology Michigan Technological University Houghton, 49931, US
Abstract
Green computing is a hot issue that has received a great amount of interests inthe past few years. Energy proportionality is a principal to ensure that energy
consumption is proportional to the system workload. Energy proportional designcan effectively improve energy efficiency of computing systems. In this paper, anenergy proportional model is proposed based on queuing theory and servicedifferentiation in server clusters, which can provide controllable and predictablequantitative control over power consumption with theoretically guaranteedservice performance. Further study for the transition overhead is carried outcorresponding strategy is proposed to compensate the performance degradationcaused by transition overhead. The model is evaluated via extensive simulationsand justified by the real workload data trace. The results show that our model canachieve satisfied service performance while still preserving energy efficiency inthe system.
Keywords: green computing, energy proportional, performance differentiation, transition overhead
1. INTRODUCTION
Green computing is to support personal and business computing needs in a green andsustainable manner, such as minimizing strain and impact on resources and environment.Computing systems, particularly enterprise data centers and high-performance cluster systemsconsume a significant amount of energy, thus placing an increasing burden on power supply andoperational cost. For example, the power consumption of enterprise data centers in the U.S.
doubled between 2000 and 2005, and will likely triple again in a few years [1]. In 2005, US datacenters consumed 45 billion kWH, which was roughly 1.2 percent of the total amount of USelectricity consumption, resulting in utility bills of $2.7 billion [2]. In 2006, the U.S. Congresspassed bills to raise the IT industry’s role in energy and environmental policy to the national level[3]. Furthermore, it is estimated that servers consume 0.5 percent of the world’s total electricity[4], which if current demand continues, is projected to quadruple by 2010. Some analystspredicted that IT infrastructure power usage will soon cost more than the hardware itself [5].
Many of the existing works on power management in server clusters rely heavily on heuristics orfeedback control [6][7][8][9]. An important principle in green computing is to ensure energy
8/8/2019 IJCN v1 i1
http://slidepdf.com/reader/full/ijcn-v1-i1 45/89
Xinying Zheng & Yu Cai
International Journal of Computer Networks (IJCN), Volume (1): Issue (1) 22
consumption proportionality, which states that the energy consumption should be proportional tothe system workload [10]. For example, when there is no or little workload, the system shouldconsume no or little energy; when workload increases, energy consumption should increaseproportionally, until the system reaches the full workload. This idea can effectively improve theenergy efficiency in real-life usage. Energy proportionality is relatively hard to be achieved on astandalone server because of hardware constraints. However, it is possible to achieve energyproportionality on a server cluster, since we can control the number of active and inactive nodesin a server cluster.
In this paper, we propose an energy proportional model in a server cluster and study itsperformance in both single and multiple classes’ scenarios. We further investigate the transitionoverhead based on this model. The simulation results show that the energy proportional modelcan provide controllable and predictable quantitative control over power consumption withtheoretically guaranteed service performance.
The rest of the paper is organized as follows. Section 2 reviews related work. Section 3introduces the energy proportional model. Performance metrics and servers allocation strategyare introduced in section 4. Section 5 evaluates the model and discusses the transition overheadinfluence, a strategy is also proposed to compensate the transition overhead in this section, themodel is further evaluated based on the real workload data trace, and the last section concludes
the paper.
2. RELATED WORK
In literatures, green computing is often related to terms like green IT, sustainable computing,energy efficiency, energy saving, power aware, power saving, and energy proportional. In thissection, we review relevant techniques commonly used on single server and server clusters.
A. Single ServerThe green computing techniques for a single server focus on microprocessors, memories anddisks. Current microprocessors allow power management by dynamic voltage and frequencyscaling (DV/FS). DV/FS works because reducing the voltage and frequency provides substantialsavings in power at the cost of slower program execution. Some researches tie the schedulerdirectly to DV/FS [11][12][13]. Most works deal exclusively with meeting real-time schedulingdeadlines while conserving energy.
Traditionally, many power management solutions rely heavily on heuristics. Recently, feedbackcontrol theoretical approaches for energy efficiency have been proposed by a number ofresearchers. On a single server, recent works [14][15] proposed power control schemes based onfeedback control theory. Femal et al. [16] developed an algorithm based on linear programming.In [8], a control theoretical power management scheme on standalone servers was proposed.The feedback control theory is better than the traditional techniques by providing high accuracyand stability.
Thermal management is another issue in power-aware computing, since temperature is a by-product of power dissipation [17]. Recent research demonstrated that dynamic thermal
management (DTM) can respond to thermal conditions by adaptively adjusting a chip powerconsumption profile on the according to feedback from temperature sensors [14] [18].
Research work on memory is often combined with processors and disks. In [19], the authors usedopen-loop control to shift power between processor and memory to maintain a server powerbudget. In [20], they proposed a solution to store pages and reliability data in idle RAM instead ofusing slow disk. A large portion of the power budget of servers goes into the I/O subsystem, thedisk array in particular. Many disk systems offer multiple power modes and can be switched to alow power mode when not in use to achieve energy saving. Such techniques had been proposed

8/8/2019 IJCN v1 i1
http://slidepdf.com/reader/full/ijcn-v1-i1 46/89
Xinying Zheng & Yu Cai
International Journal of Computer Networks (IJCN), Volume (1): Issue (1) 23
in [21][22]. Sudhanva et al. [23] presented a new approach called DRPM to modulate disk speeddynamically, and a practical implementation was provided for this mechanism.
B. Server ClustersIn recent years, power management has become one of the most important concerns on serverclusters. Some methods proposed on a single server can be extended to server clusters. In[24][25], the authors presented similar ways of applying DV/FS and cluster reconfiguration, usingthreshold values, based on the utilization of the system load to keep the processor frequencies aslow as possible, with less active nodes. In [9], the authors extended the feedback control schemeto clusters. Power has been used as a tool for application-level performance requirements.Sharma et al. [26] proposed feedback control schemes to control application-level quality ofservice requirements. Chen et al. [27] presented a feedback controller to manage the responsetime in server clusters. Some researchers applied DTM on an entire data center rather thanindividual servers or chips. In [28], the authors laid out policies for workload placement to promoteuniform temperature distribution using active thermal zones.
Vary-On Vary-off (VOVF) is a dynamic structure configuration mechanism to ensure energy-aware computing in server clusters, which turns nodes on and off to adjust the number of activeservers by the workload. Other work had been carried out based on VOVF [29][30][28]. In [31],The authors proposed a method to reduce network energy consumption via sleeping and rate
adaptation by combining VOVF and DV/FS. Another group developed power saving techniquesfor connection oriented servers [32]. The authors tested server provisioning and load dispatchingon the MSN instant messaging framework, and evaluated various load skewing techniques totrade off energy saving and quality of service.
Virtualization is another key strategy to reduce power consumption in enterprise networks. Withvirtualization, multiple virtual servers can be hosted on less but more powerful physical servers,using less electricity [33]. In [34], researchers developed methods to efficiently manage theaggregate platform resources according to the guest virtual machines (VM) of relative importance(Class-of-Service), using both the black-box and the VM-specific approach. Hu et al. [35] usedlive migration of virtual machines to transfer load among the nodes on a multilayer ring-basedoverlay. In [4], researchers scheduled virtual machines in a computer cluster to reduce powerconsumption via the technique of Dynamic Voltage Frequency Scaling (DVFS). An economy
driven energy and resource management framework was presented for clusters in [36]. Eachservice ”bids” for resources as a function of delivered performance. In [37], researchersformulated the problem as a cooperative game, and used game theory to find the bargainingpoint.
The energy-related budget has accounted for a large portion of total storage system cost ofownership. Some studies tried multispeed disks for servers [23][38]. Other techniques wereintroduced to regulate data movement. For example, the mostly used data can be transferred tospecific disks or memory, thus other disks can be set to a low power mode [39].
3. ENERGY PROPORTIONAL MODEL
A. Energy Proportional Model on a Single Server
The energy proportional model states that energy consumption P should be proportional to theworkload , while ensuring service performance.
P a b (1)

8/8/2019 IJCN v1 i1
http://slidepdf.com/reader/full/ijcn-v1-i1 47/89
Xinying Zheng & Yu Cai
International Journal of Computer Networks (IJCN), Volume (1): Issue (1) 24
Fig. 1. The energy consumption curves of non-energyproportional server and strict energy proportional server.
Figure.1 conceptually illustrates the energy consumption curve in non-energy proportional serversand energy proportional servers. The typical server operating range is between 10% - 60%. Wecan see that in a non-energy proportional server, it still consumes about half of its full power whendoing virtually no work [10]. Energy proportional server ideally consumes no power when idle (b =0), nearly no power when very little work is performed, and gradually more power as the activitylevel increases. Energy-proportional designs would enable large energy savings on servers.However, most servers nowadays are CPU, memory and hard disk intensive servers. The energyconsumption of CPU is almost linear to its utilization [32]. But memory and hard disks arenonlinear energy consumption components. As a result, energy proportionality is not easy to beachieved on a standalone sever because of the hardware constraints.
B. Energy Proportional Model on Server ClustersIt is more feasible to achieve energy proportionality in a server cluster. Most computing systemsnowadays have at least two modes of operation: an active mode when the system is working andan idle mode when the system is inactive and consumes little energy. Some researchersproposed to have finer-grained power modes, running at low speed and with lower power supplyvoltage. It is known that to quantitatively control energy consumption, one feasible way is toadaptively and dynamically control the number of servers running in active and inactive modesaccording to system workload.
For simplicity, we assume all the servers in the cluster are identical nodes. On typical web
servers and web clusters, system workload can be described by the request arrival rate . Let M
be the total number of servers in the cluster, and be the maximum arrival rate for the cluster.
m is the total number of active servers. The total energy consumption of a server cluster is:
ac inP m P M m P (2)
acP is the power consumption of fully active nodes; in
P is the power consumption of inactive
nodes. Based on the energy proportional model, we have:
maxPP
r
(3)
wheremax ac
P M P . r is a parameter, which adjusts the energy consumption curve in Figure
1. The rationale of using parameter r is as follows. Ideally the r is set to r =1 where energyconsumption is strictly proportional to workload. However, we can adjust it to satisfy different
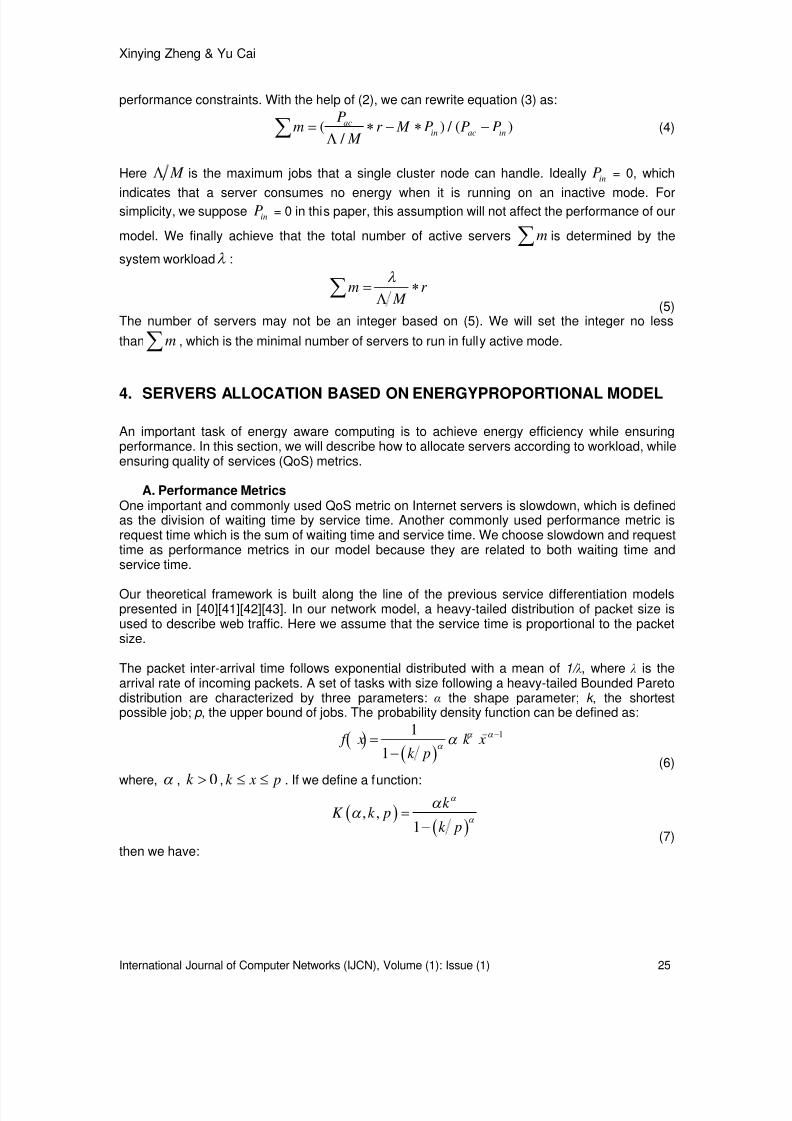
8/8/2019 IJCN v1 i1
http://slidepdf.com/reader/full/ijcn-v1-i1 48/89
Xinying Zheng & Yu Cai
International Journal of Computer Networks (IJCN), Volume (1): Issue (1) 25
performance constraints. With the help of (2), we can rewrite equation (3) as:
( ) / ( ) /
acin ac in
Pm r M P P P
M
(4)
Here M is the maximum jobs that a single cluster node can handle. Ideally inP = 0, which
indicates that a server consumes no energy when it is running on an inactive mode. Forsimplicity, we suppose in
P = 0 in this paper, this assumption will not affect the performance of our
model. We finally achieve that the total number of active servers m is determined by the
system workload :
m r M
(5)
The number of servers may not be an integer based on (5). We will set the integer no less
than m , which is the minimal number of servers to run in fully active mode.
4. SERVERS ALLOCATION BASED ON ENERGYPROPORTIONAL MODEL
An important task of energy aware computing is to achieve energy efficiency while ensuringperformance. In this section, we will describe how to allocate servers according to workload, whileensuring quality of services (QoS) metrics.
A. Performance MetricsOne important and commonly used QoS metric on Internet servers is slowdown, which is definedas the division of waiting time by service time. Another commonly used performance metric isrequest time which is the sum of waiting time and service time. We choose slowdown and requesttime as performance metrics in our model because they are related to both waiting time andservice time.
Our theoretical framework is built along the line of the previous service differentiation modelspresented in [40][41][42][43]. In our network model, a heavy-tailed distribution of packet size isused to describe web traffic. Here we assume that the service time is proportional to the packetsize.
The packet inter-arrival time follows exponential distributed with a mean of 1/ λ, where λ is thearrival rate of incoming packets. A set of tasks with size following a heavy-tailed Bounded Paretodistribution are characterized by three parameters: α the shape parameter; k , the shortestpossible job; p , the upper bound of jobs. The probability density function can be defined as:
11
1 f x k x
k p
(6)
where, , 0k , k x p . If we define a function:
, ,1
k K k p
k p
(7)
then we have:

8/8/2019 IJCN v1 i1
http://slidepdf.com/reader/full/ijcn-v1-i1 49/89
Xinying Zheng & Yu Cai
International Journal of Computer Networks (IJCN), Volume (1): Issue (1) 26
, ,1;
1, ,[ ]
ln ln , , 1.
p
k
K k pif
K k p E X f x dx
p k K k p if
(8)
Similarly, we can derive2
[ ] E X and [ ] E X
2 2
, ,[ ]
2, ,
p
k
K k p E X f x x dx
K k p
(9)
1 1
, ,[ ]
1, ,
p
k
K k p E X f x x dx
K k p
(10)
According to Pollaczek-Khinchin formula, the average waiting time for the incoming packets is:
2[ ][ ]
2 1 [ ]
E X E W
E X
(11)
We can derive a closed-form expression of the expected slowdown in an M/G/1 queue on asingle Internet server.
2 11 [ ] [ ]
[ ] [ ] [ ]2 1 [ ]
E X E X E S E W E X
E X
(12)
The expected request time with the incoming job rate is:
2[ ]
[ ] [ ] [ ] [ ]2 1 [ ]
E X E R E W E X E X
E X
(13)
B. Servers Allocation for a Single ClassIn this section, we assume all the incoming requests are classified into just one class. We want to
ensure the QoS metrics based on different workload . For example, the expected request time
of the incoming jobs should stay within a threshold,
E R . We assume m
is the number
of active server nodes handling the incoming requests. When using a round-robin dispatching
policy, the packet arrival rate of a node is m . The expected request time in a server cluster
can be calculated as:
2[ ]
[ ] [ ]2 [ ]
E X E R E X
m E X
(14)
Based on the above energy proportionality (5), equation (14) can be re-written as:
2[ ][ ] [ ]
2 [ ]
E X E R E X
r M E X
(15)
It is easy to observe that request time is not depending on workload, we can just adjust
parameter r to satisfy different performance thresholds.
C. Servers Allocation on Service DifferentiationNow we study server allocation schemes for service differentiation. In a cluster system, theincoming requests are often classified into N classes. Each class may have different QoS
requirements. We assume im is the number of active server nodes in class i , and i is the arrival
rate in class i . The expected slowdown of class i in a server cluster can be calculated as:

8/8/2019 IJCN v1 i1
http://slidepdf.com/reader/full/ijcn-v1-i1 50/89
Xinying Zheng & Yu Cai
International Journal of Computer Networks (IJCN), Volume (1): Issue (1) 27
2 1[ ] [ ]
[ ]2 [ ]
ii
i i
E X E X E S
m E X
(16)
Here we choose not to use request time as a performance metric for service differentiationbecause of its overly complicated mathematical expression. However, each class should satisfythe request time constraint. Obviously the results presented in this paper will not be affected by
the selection of performance metrics.
We adopt a relative service differentiation model where the QoS factor of slowdown betweendifferent classes are based on their predefined differentiation parameters.
[ ]
[ ]
i i
j j
E S
E S
(17)
Where 1 ,i j N :
We assume class 1 is the highest class and set1 2
0 N , then higher classes
receive better service, i.e., lower slowdown [39].
Based on the above energy proportionality and service differentiation model, according to formula(5)(17), we can derive the server allocation scheme in a cluster system as
1
1
* [ ]
[ ]
N
i ii
i i N
ii
M r E X
m E X
(18)
Here m i is the number of active servers in class i , and i i i is the normalized arrival rate.
The first term of formula (18) ensures that the sub-cluster in class i will not be overloaded. Thesecond term is related to arrival rates, differentiation parameters, and r.
We can also derive the expected slowdown of class i as:
2 1
1
1
[ ] [ ][ ]
2 * [ ]
N
i iii
N
ii
E X E X E S
M r E X
(19)
From (19) we can observe that the slowdown of class i is proportional to the pre-specified
parameter i , and is related to r . The slowdown ratio only depends on the pre-defined
differentiation parameters.
The expected request time for class i can be calculated as:
2
1
1
[ ][ ] [ ]
2 * [ ]
N
i iii i
N
ii
E X E R E X
M r E X
(20)
i is request time constraint for class i . We can learn from equation (20), request time in
class i is also independent of workload, but depends on both the pre-specified parameteri
and
r .
The performance is controllable based on our energy proportional model, with acceptableperformance degradation; large amounts of energy can be saved.
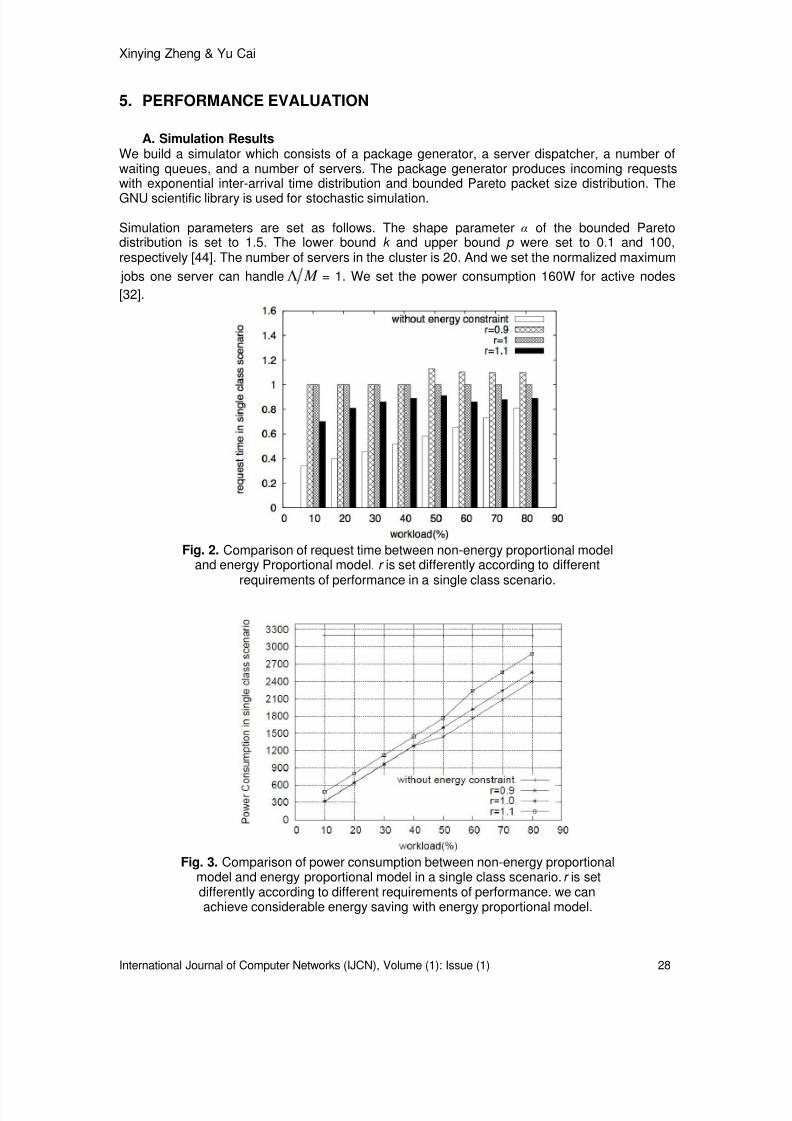
8/8/2019 IJCN v1 i1
http://slidepdf.com/reader/full/ijcn-v1-i1 51/89
Xinying Zheng & Yu Cai
International Journal of Computer Networks (IJCN), Volume (1): Issue (1) 28
5. PERFORMANCE EVALUATION
A. Simulation ResultsWe build a simulator which consists of a package generator, a server dispatcher, a number ofwaiting queues, and a number of servers. The package generator produces incoming requestswith exponential inter-arrival time distribution and bounded Pareto packet size distribution. The
GNU scientific library is used for stochastic simulation.
Simulation parameters are set as follows. The shape parameter α of the bounded Paretodistribution is set to 1.5. The lower bound k and upper bound p were set to 0.1 and 100,respectively [44]. The number of servers in the cluster is 20. And we set the normalized maximum
jobs one server can handle M = 1. We set the power consumption 160W for active nodes
[32].
Fig. 2. Comparison of request time between non-energy proportional modeland energy Proportional model. r is set differently according to different
requirements of performance in a single class scenario.
Fig. 3. Comparison of power consumption between non-energy proportionalmodel and energy proportional model in a single class scenario. r is setdifferently according to different requirements of performance. we canachieve considerable energy saving with energy proportional model.

8/8/2019 IJCN v1 i1
http://slidepdf.com/reader/full/ijcn-v1-i1 52/89
Xinying Zheng & Yu Cai
International Journal of Computer Networks (IJCN), Volume (1): Issue (1) 29
Fig. 4. Comparison of request time in higher priority class betweennon-energy proportional model and energy proportional models.
r is set differently according to different requirements of
performance in a multiple classes scenario.
Fig. 5. Comparison of request time in lower priority class betweenNon-energy proportional model and energy proportional models.
r is set differently according to different requirements of
performance in a multiple classes scenario.
We first evaluate the energy proportional model for the single class scenario. We set the requesttime β = 0.9, β = 1.1 and β = 1.3 which correspond to adjustment parameter r = 1.1, r = 1 and r = 0.9 respectively. We show the simulation results in the workload range of 10% - 80%. When theworkload is above 80%, the impact of energy proportionality constraint is very limited. Since the
typical server operating range is between 10% - 60%, the results presented here are sufficient totest the energy proportional model.
As Figure 2 indicates that the request time is always around the pre-defined performanceparameter under different workload. The request time increases as the value of r decreases. Theresults show that with adjustable parameter r desirable service performance can be achieved.Figure 3 compares the energy consumption of energy proportional model and non-energyproportion model for a single class scenario. We can achieve better energy efficiency under lowworkload, which leads to large amounts of energy saving in a server cluster.

8/8/2019 IJCN v1 i1
http://slidepdf.com/reader/full/ijcn-v1-i1 53/89
Xinying Zheng & Yu Cai
International Journal of Computer Networks (IJCN), Volume (1): Issue (1) 30
Next, we compare the performance metrics in a multiple classes’ scenario, as shown in Figure 4,5, 6. The number of classes is normally two or three [45][46]. In this paper we choose two classes
of incoming requests. We set the target slowdown ratio2 1: = 2 : 1. The energy curve
parameters are set differently according to different request time constraints. Note, in a multipleclasses scenario, parameter r is determined by performance requirements of all classes, whichmeans it should be set to be the largest value satisfying the requirements of all the classes. We
observe that the model can achieve desirable proportionality of slowdown differentiation withrequest time constraints. Figure 7 also compares the energy consumptions for proportional andnon-proportional models in multiple classes scenario.
Fig. 6. Comparison of slowdown ratio between non-energy proportionalmodel and energy proportional models. r is set by different
requirements of performance in a multiple classes scenario.
Fig. 7. Comparison of power consumption between non-energy proportionalmodel and energy proportional model in multiple classes scenario.
r is set by different requirements of performance. We can achieveconsiderable energy saving compare to the non-energy proportional model.
B. Transition Overhead AnalysisThe model proposed in this paper is a continual allocation process, where we dynamically changethe number of active servers. The transition time when a server transfers from an inactive modeto an active mode can not be ignored, this can influence the performance during the transitionperiod. Thus, it is necessary to estimate the cost of transition overhead.

8/8/2019 IJCN v1 i1
http://slidepdf.com/reader/full/ijcn-v1-i1 54/89
Xinying Zheng & Yu Cai
International Journal of Computer Networks (IJCN), Volume (1): Issue (1) 31
Generally speaking, the transition time for different servers is different which depends on theprocessor and other hardware constraints. Therefore, we study the influence on performancecaused by transition overhead under different time. Figure 8 shows how the request time changeswhen considering transition overhead as the workload gradually changed from 0%-80% based onthe energy proportional model. We only concern the situation when the workload increases, sinceas the workload decreases, the number of active servers will decline, which will not causeperformance degradation. The y-axis is the request time under different transition overhead. Asindicated in the figure, larger transition time has more impact on performance. The performancewill be affected greatly when large number of servers can not transfer to active mode on time.
Fig. 8. The effect to performance of transition overhead in energyproportional model, the transition time is set to be 15,20,25,30 respectively
Fig. 9. Request time after adding one spare server based on energyproportional model in a single class scenario, the transition time
is set to be 15,20,25,30 respectively.
It is important to make sure that the QoS is not sacrificed excessively in favor of power andenergy savings. Spare servers are added to solve the problem of transition overhead. Figure 9,10 illustrate the performance after one and two spare servers are added in a single classscenario. By adding one spare server, the performance can be improved dramatically comparedto the case of no spare server. Adding two spare servers, the response time can stay under thepre-defined threshold when the workload gradually changes from 0%-80%. However, in somespecial situations, the workload may vary significantly within two control periods. One or twospare servers are not adequate to compensate the performance degradation. More spare servers
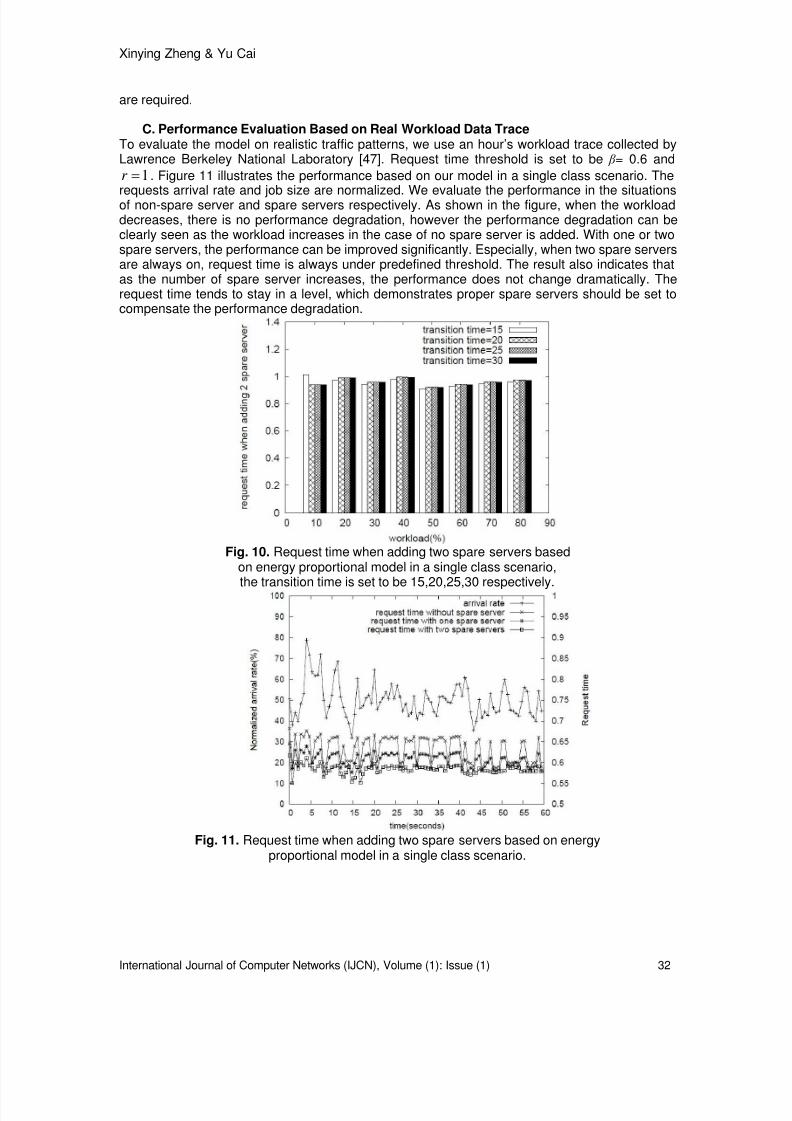
8/8/2019 IJCN v1 i1
http://slidepdf.com/reader/full/ijcn-v1-i1 55/89
Xinying Zheng & Yu Cai
International Journal of Computer Networks (IJCN), Volume (1): Issue (1) 32
are required.
C. Performance Evaluation Based on Real Workload Data TraceTo evaluate the model on realistic traffic patterns, we use an hour’s workload trace collected byLawrence Berkeley National Laboratory [47]. Request time threshold is set to be β = 0.6 and
1r . Figure 11 illustrates the performance based on our model in a single class scenario. The
requests arrival rate and job size are normalized. We evaluate the performance in the situationsof non-spare server and spare servers respectively. As shown in the figure, when the workloaddecreases, there is no performance degradation, however the performance degradation can beclearly seen as the workload increases in the case of no spare server is added. With one or twospare servers, the performance can be improved significantly. Especially, when two spare serversare always on, request time is always under predefined threshold. The result also indicates thatas the number of spare server increases, the performance does not change dramatically. Therequest time tends to stay in a level, which demonstrates proper spare servers should be set tocompensate the performance degradation.
Fig. 10. Request time when adding two spare servers basedon energy proportional model in a single class scenario,the transition time is set to be 15,20,25,30 respectively.
Fig. 11. Request time when adding two spare servers based on energyproportional model in a single class scenario.
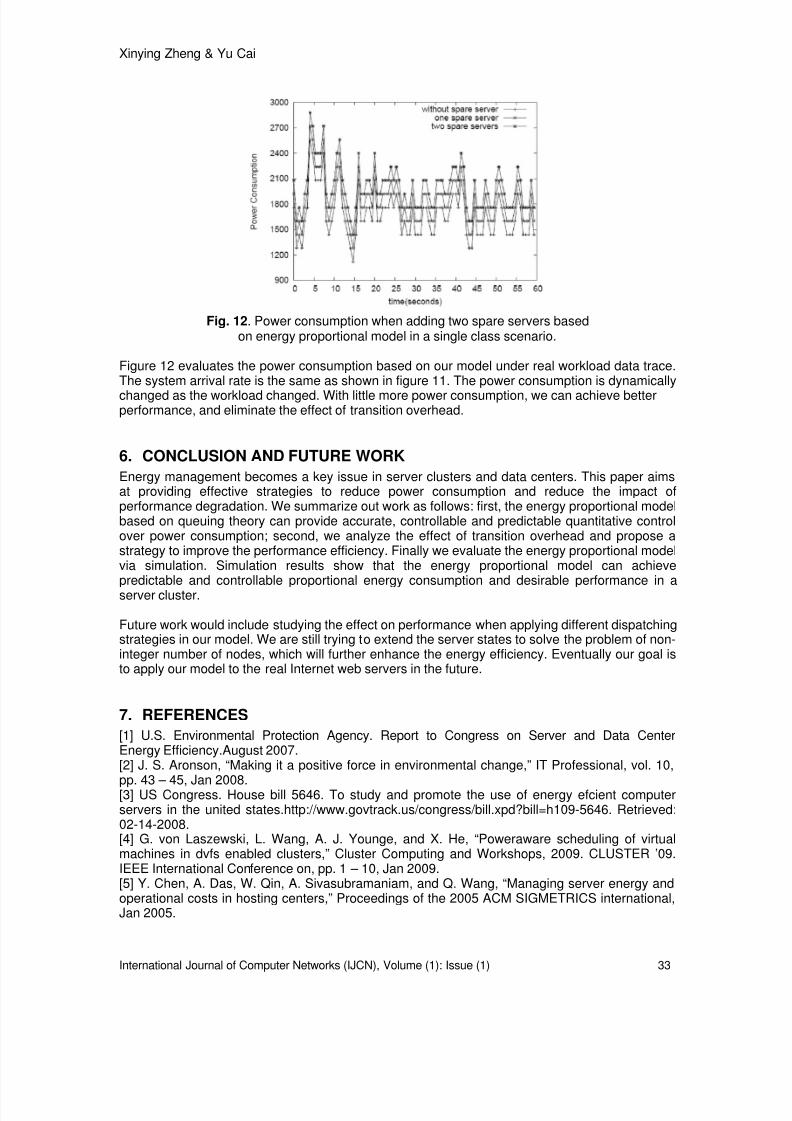
8/8/2019 IJCN v1 i1
http://slidepdf.com/reader/full/ijcn-v1-i1 56/89
Xinying Zheng & Yu Cai
International Journal of Computer Networks (IJCN), Volume (1): Issue (1) 33
Fig. 12. Power consumption when adding two spare servers basedon energy proportional model in a single class scenario.
Figure 12 evaluates the power consumption based on our model under real workload data trace.The system arrival rate is the same as shown in figure 11. The power consumption is dynamically
changed as the workload changed. With little more power consumption, we can achieve betterperformance, and eliminate the effect of transition overhead.
6. CONCLUSION AND FUTURE WORK
Energy management becomes a key issue in server clusters and data centers. This paper aimsat providing effective strategies to reduce power consumption and reduce the impact ofperformance degradation. We summarize out work as follows: first, the energy proportional modelbased on queuing theory can provide accurate, controllable and predictable quantitative controlover power consumption; second, we analyze the effect of transition overhead and propose astrategy to improve the performance efficiency. Finally we evaluate the energy proportional modelvia simulation. Simulation results show that the energy proportional model can achievepredictable and controllable proportional energy consumption and desirable performance in aserver cluster.
Future work would include studying the effect on performance when applying different dispatchingstrategies in our model. We are still trying to extend the server states to solve the problem of non-integer number of nodes, which will further enhance the energy efficiency. Eventually our goal isto apply our model to the real Internet web servers in the future.
7. REFERENCES
[1] U.S. Environmental Protection Agency. Report to Congress on Server and Data CenterEnergy Efficiency.August 2007.[2] J. S. Aronson, “Making it a positive force in environmental change,” IT Professional, vol. 10,
pp. 43 – 45, Jan 2008.[3] US Congress. House bill 5646. To study and promote the use of energy efcient computerservers in the united states.http://www.govtrack.us/congress/bill.xpd?bill=h109-5646. Retrieved:02-14-2008.[4] G. von Laszewski, L. Wang, A. J. Younge, and X. He, “Poweraware scheduling of virtualmachines in dvfs enabled clusters,” Cluster Computing and Workshops, 2009. CLUSTER ’09.IEEE International Conference on, pp. 1 – 10, Jan 2009.[5] Y. Chen, A. Das, W. Qin, A. Sivasubramaniam, and Q. Wang, “Managing server energy andoperational costs in hosting centers,” Proceedings of the 2005 ACM SIGMETRICS international,Jan 2005.

8/8/2019 IJCN v1 i1
http://slidepdf.com/reader/full/ijcn-v1-i1 57/89
Xinying Zheng & Yu Cai
International Journal of Computer Networks (IJCN), Volume (1): Issue (1) 34
[6] C. Lefurgy, K. Rajamani, F. Rawson, and W. Felter, “Energy management for commercialservers,” Computer, Jan 2003.[7] Y. Lu and G. D. Micheli, “Operating-system directed power reduction,” In proc. of internationalsymposium on Low power electronics and design, Jan 2000.[8] C. Lefurgy, X. Wang, and M. Ware, “Server-level power control,” Autonomic Computing, 2007.ICAC ’07. Fourth International Conference on, pp. 4 – 4, May 2007.[9] X. Wang and M. Chen, “Cluster-level feedback power control for performance optimization,” InProc. of Symposium on High-Performance Computer Architecture, Jan 2008.[10] L. Barroso and U. Holzle, “The case for energy-proportional computing,” Computer, vol. 40,pp. 33 – 37, Dec 2007.[11] G. Quan and X. Hu, “Energy efficient fixed-priority scheduling for real-time systems onvariable voltage processors,” Design Automation Conference, Jan 2001.[12] M. Elnozahy, M. Kistler, and R. Rajamony, “Energy conservation policies for web servers,”Proceedings of the 4th conference on USENIX Symposium on Internet Technologies andSystems, Jan 2003.[13] J. Pouwelse, K. Langendoen, and H. Sips, “Energy priority scheduling for variable voltageprocessors,” Proceedings of the 2001 international symposium on Low power, Jan 2001.[14] K. Skadron, T. Abdelzaher, and M. Stan, “Control-theoretic techniques and thermal-rcmodeling for accurate and localized dynamic thermal management,” pp. 17–28, Feb. 2002.[15] Q. Wu, P. Juang, M. Martonosi, L. Peh, and D. Clark, “Formal control techniques for power-
performance management,” IEEE Micro, Jan 2005.[16] M. Femal and V. Freeh, “Boosting data center performance through non-uniform powerallocation,” Autonomic Computing, Jan 2005.[17] R. Graybill and R. Melhem, “Power aware computing,” books.google.com, Jan 2002.[18] D. Brooks and M. Martonosi, “Dynamic thermal management for high-performancemicroprocessors,” High-Performance Computer Architecture, Jan 2001.[19] W. Felter, K. Rajamani, T. Keller, and C. Rusu, “A performanceconserving approach forreducing peak power consumption in server systems,” Proceedings of the 19th annualinternational conference on Supercomputing, Jan 2005.[20] T. Newhall, D. Amato, and A. Pshenichkin, “Reliable adaptable network ram,” 2008 IEEEInternational Conference on Cluster Computing, Jan 2008.[21] A. Weissel, B. Beutel, and F. Bellosa, “Cooperative I/O–a novel I/O semantics for energy-aware applications,” usenix.org.
[22] D. Helmbold, D. Long, T. Sconyers, and B. Sherrod, “Adaptive disk spindown for mobilecomputers,” Mobile Networks and Applications, Jan 2000.[23] S. Gurumurthi, A. Sivasubramaniam, and M. Kandemir, “DRPM: dynamic speed control forpower management in server class disks,” Computer Architecture, Jan 2003.[24] M. Vasic, O. Garcia, J. Oliver, P. Alou, and J. Cobos, “A dvs system based on the trade-offbetween energy savings and execution time,” Control and Modeling for Power Electronics, 2008.COMPEL 2008. 11th Workshop on, pp. 1 – 6, Jul 2008.[25] E. Pinheiro, R. Bianchini, E. Carrera, and T. Heath, “Dynamic cluster reconfiguration forpower and performance,” Compilers and operating systems for low power, Jan 2001.[26] V. Sharma, A. Thomas, T. Abdelzaher, K. Skadron, and Z. Lu, “Poweraware qosmanagement in web servers,” 24th IEEE Real-Time Systems Symposium, Jan 2003.[27] C. Dovrolis, D. Stiliadis, and P. Ramanathan, “Proportional differentiated services: Delaydifferentiation and packet scheduling,” Proceedings of the conference on Applications, Jan 1999.
[28] R. Sharma, C. Bash, C. Patel, and R. Friedrich, “Balance of power: Dynamic thermalmanagement for internet data centers,” IEEE Internet Computing, Jan 2005.[29] X. Fan, W. Weber, and L. Barroso, “Power provisioning for a warehouse-sized computer,”Proceedings of the 34th annual international conference on architecture, Jan 2007. B-2-2-2.[30] R. Guerra, J. Leite, and G. Fohler, “Attaining soft real-time constraint and energy-efficiency inweb servers,” Proceedings of the 2008 ACM symposium on Applied computing, Jan 2008.[31] S. Nedevschi, L. Popa, G. Iannaccone, and S. Ratnasamy, “Reducing network energyconsumption via sleeping and rate-adaptation,” NSDI, Jan 2008.[32] G. Chen, W. He, J. Liu, S. Nath, L. Rigas, and L. Xiao, “Energy-aware server provisioningand load dispatching for connection-intensive internet services,” Proceedings of the 5th USENIX
8/8/2019 IJCN v1 i1
http://slidepdf.com/reader/full/ijcn-v1-i1 58/89
Xinying Zheng & Yu Cai
International Journal of Computer Networks (IJCN), Volume (1): Issue (1) 35
Symposium on Networked Systems Design and Implementation, Jan 2008.[33] S. Murugesan, “Harnessing green it: Principles and practices,” IT Professional, Jan 2008.[34] M. Kesavan, A. Ranadive, A. Gavrilovska, and K. Schwan, “Active coordination (act)–towardeffectively managing virtualized multicore clouds,” 2008 IEEE International Conference on ClusterComputing, Jan 2008.[35] L. Hu, H. Jin, X. Liao, X. Xiong, and H. Liu, “Magnet: A novel scheduling policy for powerreduction in cluster with virtual machines,” 2008 IEEE International Conference on ClusterComputing, Jan 2008.[36] J. Chase, D. Anderson, P. Thakar, and A. Vahdat, “Managing energy and server resources inhosting centers,” Proceedings of the eighteenth ACM symposium on Operating Operating SystemPrinciples, Jan 2001.[37] I. Ahmad, S. Ranka, and S. Khan, “Using game theory for scheduling tasks on multi-coreprocessors for simultaneous optimization of performance and energy,” pp. 1–6, April 2008.[38] E. Carrera, E. Pinheiro, and R. Bianchini, “Conserving disk energy in network servers,”Proceedings of the 17th annual international conference on Supercomputing, Jan 2003.[39] M. Song, “Energy-aware data prefetching for multi-speed disks in video servers,”Proceedings of the 15th international conference on Supercomputing, Jan 2007.[40] X. Zhou, Y. Cai, C. Chow, and M. Augusteijn, “Two-tier resource allocation for slowdowndifferentiation on server clusters,” Parallel Processing, Jan 2005.[41] X. Zhou, Y. Cai, G. Godavari, and C. Chow, “An adaptive process allocation strategy for
proportional responsiveness differentiation on web servers,” Web Services, 2004. Proceedings.IEEE International Conference on, pp. 142 – 149, Jun 2004.[42] C. Dovrolis and P. Ramanathan, “A case for relative differentiated services and theproportionaldifferentiation model,” Network, Jan 1999.[43] X. Zhou and C. Xu, “Harmonic proportional bandwidth allocation and scheduling for servicedifferentiation on streaming servers,” Parallel and Distributed Systems, IEEE Transactions on,vol. 15, pp. 835 –848, Sep 2004.[44] M. Harchol-Balter and C. U. PITTSBURGH, “Task assignment with unknown duration,”doi.ieeecomputersociety.org, Jan 1999.[45] H. Zhu, H. Tang, and T. Yang;, “Demand-driven service differentiation in cluster-basednetwork servers,” INFOCOM 2001. Twentieth Annual Joint Conference of the IEEE Computerand Communications Societies. Proceedings. IEEE, vol. 2, pp. 679 – 688 vol.2, Mar 2001.[46] L. Zhang, “A two-bit differentiated services architecture for the internet,” Request for
Comments (Informational), Jan 1999.[47] NASA Kennedy Space Center Server Traces. http://ita.ee.lbl.gov/html/traces.html.
8/8/2019 IJCN v1 i1
http://slidepdf.com/reader/full/ijcn-v1-i1 59/89
Q. Duan & E. Lu
International Journal of Computer Networks (IJCN) Volume (1): Issue (1) 46
Network Service Description and Discovery for the NextGeneration Internet
Qiang Duan [email protected] Information Science and Technology Department The Pennsylvania State University Abington College Abington, PA 19001, USA
Enyue Lu [email protected] Mathematics and Computer Science Department Salisbury University Salisbury, MD, 21801, USA
Abstract
The next generation Internet will face new challenges due to the coexistingheterogeneous networks and highly diverse networking applications. Therefore how tocoordinate heterogeneous networking systems to support a wide spectrum of applicationrequirements becomes a significant research problem. A key to solving this problem liesin effective and flexible collaborations among heterogeneous networking systems andinteractions between applications and the underlying networks. Network virtualizationplays a crucial role in enabling such collaborations and interactions, and the Service-Oriented Architecture (SOA) provides a promising approach to supporting networkvirtualization. Network service description and discovery are key technologies forapplying SOA in networking, and the current service description and discoverytechnologies must be evolved to meet the special requirements of future Internet. In thispaper, we study the problem of network service description and discovery to supportnetwork virtualization in the next generation Internet. The main contributions of thispaper include a general approach to describing service capabilities of variousheterogeneous networking systems, a technology to discover and select the networkservices that guarantee the QoS requirements of different networking applications, ageneral profile for specifying networking demands of various applications, a scheme ofnetwork resource allocation for QoS provisioning, and a system structure for realizingthe network description, discovery, and resource allocation technologies. We alsopropose information update mechanisms for improving performance of the networkservice description and discovery system. The approach and technology developed inthis paper are general and independent of network architectures and implementations;thus are applicable to the heterogeneous networking systems in the next generationInternet.
Keywords: SOA, Internet, network virtualization, service description, service discovery, QoS.

8/8/2019 IJCN v1 i1
http://slidepdf.com/reader/full/ijcn-v1-i1 60/89
Q. Duan & E. Lu
International Journal of Computer Networks (IJCN) Volume (1): Issue (1) 47
1. INTRODUCTION
Although became a global communication platform in a short period of time, the Internet hasfallen victim to its own stunning success. The next generation Internet will face many challenges,which essentially come from the diversity in the networking architectures and technologiescoexisting in the Internet and the wide spectrum of networking applications supported by theInternet. The numerous distributed computing applications with diverse networking requirements
motive research on alternative networking technologies and architectures for the future Internet.The newly developed networking technologies vary in almost all aspects of networkfunctionalities, including data forwarding mechanisms, routing and signaling protocols, andcontrol and management schemes. So far no single network architecture has demonstrated thecapability of supporting all kinds of networking applications effectively and efficiently. Thecoexistence of various heterogeneous networking systems will be one of the essential features ofthe next generation Internet. Recently the networking research community started exploring“clean-slate” approaches to develop new Internet architectures, and an important aspect of theobjective is to enable alternative network architectures coexist and collaborate inside futureInternet. Therefore, how to coordinate heterogeneous networking systems to support the widevariety of application requirements becomes a significant research problem.
A key to solve this problem lies in flexible collaboration across heterogeneous networking
systems and effective interactions between networks and applications. Recent researchprogresses toward this direction include new network architecture for diversifying the Internet[23], a concurrent architecture (CABO) that separates the roles of service providers and networkinfrastructure providers [10], a new network control plane developed in the DRAGON project [17],and the network composition mechanism for Ambient Networks [6]. Examples of currentstandardization efforts for supporting various applications across heterogeneous networks includethe ITU-T Next Generation Network (NGN) structure [28] and the Open Service Environment(OSE) defined by the Open Mobile Alliance (OMA) [29]. Although the above researches addressthe heterogeneous networking problem from different aspects, they share a similarity in which thenotion of network virtualization plays a crucial role. Essentially network virtualization is to abstractnetworking resources into reusable components that can be discovered, selected, and composedto meet different networking requirements. Therefore an effective mechanism for networkvirtualization will greatly facilitate the next generation Internet.
The Service-Oriented Architecture (SOA) [25] is currently gaining high attention and acceptancein IT industry, especially in the fields of Web services and Grid/Cloud Computing. In SOA,heterogeneous computational resources are virtualized into services that are discoverable,selectable, and composable for supporting various computing application requirements. A keyfeature of SOA is the loose-coupling mechanism that enables flexible and effective interactionsamong services and applications. Therefore applying ideas of SOA in networking will greatlyfacilitate network virtualization in the next generation Internet. Following the SOA principles,heterogeneous networking systems can be virtualized into network services which are reusablenetwork components whose functions and access methods are described in standard-formatdocuments called network service descriptions. The network service descriptions can bepublished at a service registry. When an application needs to utilize networking resources, itsends a request to a network service broker, which will discover and select the appropriatenetwork service that meets the application requirements. Therefore network service description
and discovery form the foundation of this service-oriented networking paradigm.
Although SOA has been successfully applied in the field of distributed computing, currentlyavailable technologies for service description and discovery must to be enhanced to meet thespecial requirements of the next generation networking. One of the key requirements is to supportthe network Quality of Service (QoS) required by applications. The current service descriptionstandard in SOA mainly focuses on functional information instead of service provisioningcapabilities; thus limiting service discovery to be function-based instead of performance-based.Although progresses have been made toward enabling performance-based Web and Grid
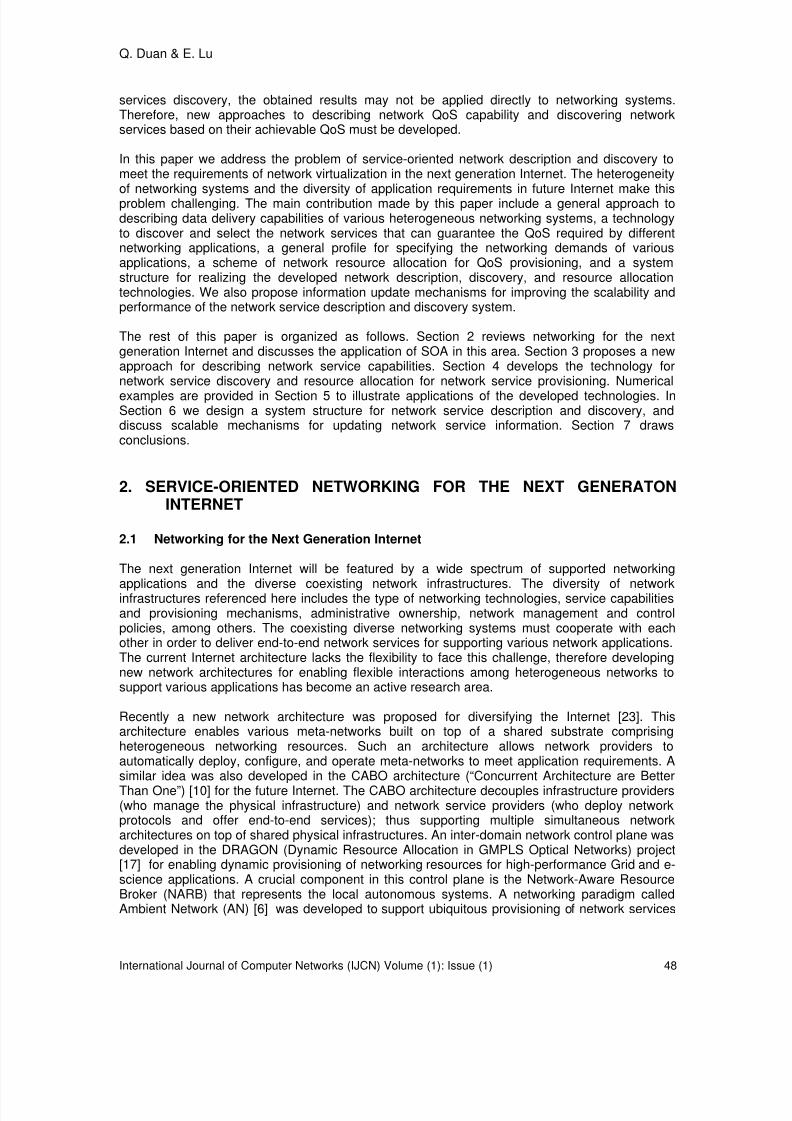
8/8/2019 IJCN v1 i1
http://slidepdf.com/reader/full/ijcn-v1-i1 61/89
Q. Duan & E. Lu
International Journal of Computer Networks (IJCN) Volume (1): Issue (1) 48
services discovery, the obtained results may not be applied directly to networking systems.Therefore, new approaches to describing network QoS capability and discovering networkservices based on their achievable QoS must be developed.
In this paper we address the problem of service-oriented network description and discovery tomeet the requirements of network virtualization in the next generation Internet. The heterogeneityof networking systems and the diversity of application requirements in future Internet make thisproblem challenging. The main contribution made by this paper include a general approach todescribing data delivery capabilities of various heterogeneous networking systems, a technologyto discover and select the network services that can guarantee the QoS required by differentnetworking applications, a general profile for specifying the networking demands of variousapplications, a scheme of network resource allocation for QoS provisioning, and a systemstructure for realizing the developed network description, discovery, and resource allocationtechnologies. We also propose information update mechanisms for improving the scalability andperformance of the network service description and discovery system.
The rest of this paper is organized as follows. Section 2 reviews networking for the nextgeneration Internet and discusses the application of SOA in this area. Section 3 proposes a newapproach for describing network service capabilities. Section 4 develops the technology fornetwork service discovery and resource allocation for network service provisioning. Numerical
examples are provided in Section 5 to illustrate applications of the developed technologies. InSection 6 we design a system structure for network service description and discovery, anddiscuss scalable mechanisms for updating network service information. Section 7 drawsconclusions.
2. SERVICE-ORIENTED NETWORKING FOR THE NEXT GENERATONINTERNET
2.1 Networking for the Next Generation Internet
The next generation Internet will be featured by a wide spectrum of supported networking
applications and the diverse coexisting network infrastructures. The diversity of networkinfrastructures referenced here includes the type of networking technologies, service capabilitiesand provisioning mechanisms, administrative ownership, network management and controlpolicies, among others. The coexisting diverse networking systems must cooperate with eachother in order to deliver end-to-end network services for supporting various network applications.The current Internet architecture lacks the flexibility to face this challenge, therefore developingnew network architectures for enabling flexible interactions among heterogeneous networks tosupport various applications has become an active research area.
Recently a new network architecture was proposed for diversifying the Internet [23]. Thisarchitecture enables various meta-networks built on top of a shared substrate comprisingheterogeneous networking resources. Such an architecture allows network providers toautomatically deploy, configure, and operate meta-networks to meet application requirements. Asimilar idea was also developed in the CABO architecture (“Concurrent Architecture are BetterThan One”) [10] for the future Internet. The CABO architecture decouples infrastructure providers(who manage the physical infrastructure) and network service providers (who deploy networkprotocols and offer end-to-end services); thus supporting multiple simultaneous networkarchitectures on top of shared physical infrastructures. An inter-domain network control plane wasdeveloped in the DRAGON (Dynamic Resource Allocation in GMPLS Optical Networks) project[17] for enabling dynamic provisioning of networking resources for high-performance Grid and e-science applications. A crucial component in this control plane is the Network-Aware ResourceBroker (NARB) that represents the local autonomous systems. A networking paradigm calledAmbient Network (AN) [6] was developed to support ubiquitous provisioning of network services

8/8/2019 IJCN v1 i1
http://slidepdf.com/reader/full/ijcn-v1-i1 62/89
Q. Duan & E. Lu
International Journal of Computer Networks (IJCN) Volume (1): Issue (1) 49
over any type of network. A core feature of Ambient Network is a uniform mechanism callednetwork composition for dynamic and scalable cooperation between heterogeneous networks. Aservice plane architecture for multi-domain network connections was also reported in [12], whichintroduced the notion of inter-domain network service as the result of composing a set of serviceelements. Some network standard organizations are also working on supporting applicationsacross heterogeneous networks. The Open Mobile Alliance (OMA) recently developed an OpenService Environment (OSE) that delivers network services by composing a set of standardservice components called service enablers [29]. The Next Generation Network (NGN) structuredefined by ITU-T promotes separation between service delivery from network transportinfrastructure [28].
Although the above mentioned research and standardization efforts tackle the problem ofcoordinating heterogeneous networking systems to support various applications from differentaspects, the notion of network virtualization plays a significant role in all these proposedsolutions. Through network virtualization, the underlying networking resources are de-coupledfrom network service provisioning. Networking resources are encapsulated into reusablecomponents, which can be discovered, selected, and composed to meet applicationrequirements. In the new Internet architecture proposed in [23], a meta-network is a virtualnetwork that serves as an abstraction of a collection of heterogeneous networking resources. TheCABO architecture employs network virtualization as a key mechanism to enable service
providers share the underlying network infrastructures for end-to-end service delivery. In theDRAGON network control plane, a key technology for realizing NARB is network domainvirtualization, which provides a mechanism to advertise a simplified view of a network domain.Network composition in Ambient Networks is based on a connectivity and resource virtualizationframework that hides the differences of heterogeneous networking systems and enablesapplications to operate across them. The service element proposed in [12] is also a type ofvirtualization of networking resources, which can be discovered and composed to form inter-domain network services. The service enablers in the OMA OSE are reusable virtualizations ofnetworking resources that provide access to network capabilities. The separation betweenservice provisioning and network transportation in the NGN structure is also realized throughnetwork virtualization. Therefore, an effective and flexible mechanism for network virtualizationwill greatly facilitate the development of new networking architectures and technologies for thenext generation Internet.
2.2 The Service-Oriented Architecture and Its Application in Networking
The Service-Oriented Architecture (SOA) is a system architecture initially developed by the ITcommunity, especially in the areas of Web services and Grid/Cloud computing, as an effectivesolution to coordinating computing resources crossing heterogeneous systems to support variousapplications. The SOA is described as “an architecture within which all functions are defined asindependent services with invokable interfaces that can be called in defined sequences to formbusiness processes” [9]. Services in SOA are self-contained and reusable computingcomponents that can cooperate with other services through pre-defined standard interfaces.Essentially the SOA enables virtualization of various computing resources in form of services andprovides a flexible interaction mechanism among services.
The interaction mechanism in the SOA is briefly illustrated in Figure 1. A service providerpublishes a machine-readable document called service description at a service registry. Theservice description gives descriptive information about the functions provided by the service andthe interfaces for utilizing such functions. When a service customer, either an application oranother service, needs to utilize computing resources to perform a certain function, it starts aservice discovery process to locate an available service that meets its requirement. Typically aservice broker handles service discovery for service customers by searching the servicedescriptions published at the registry and selecting a service that matches the criteria specified bythe customer. After discovering a service, the service customer contacts the service provider andinvokes the service by following the interface defined in the service description. Currently the
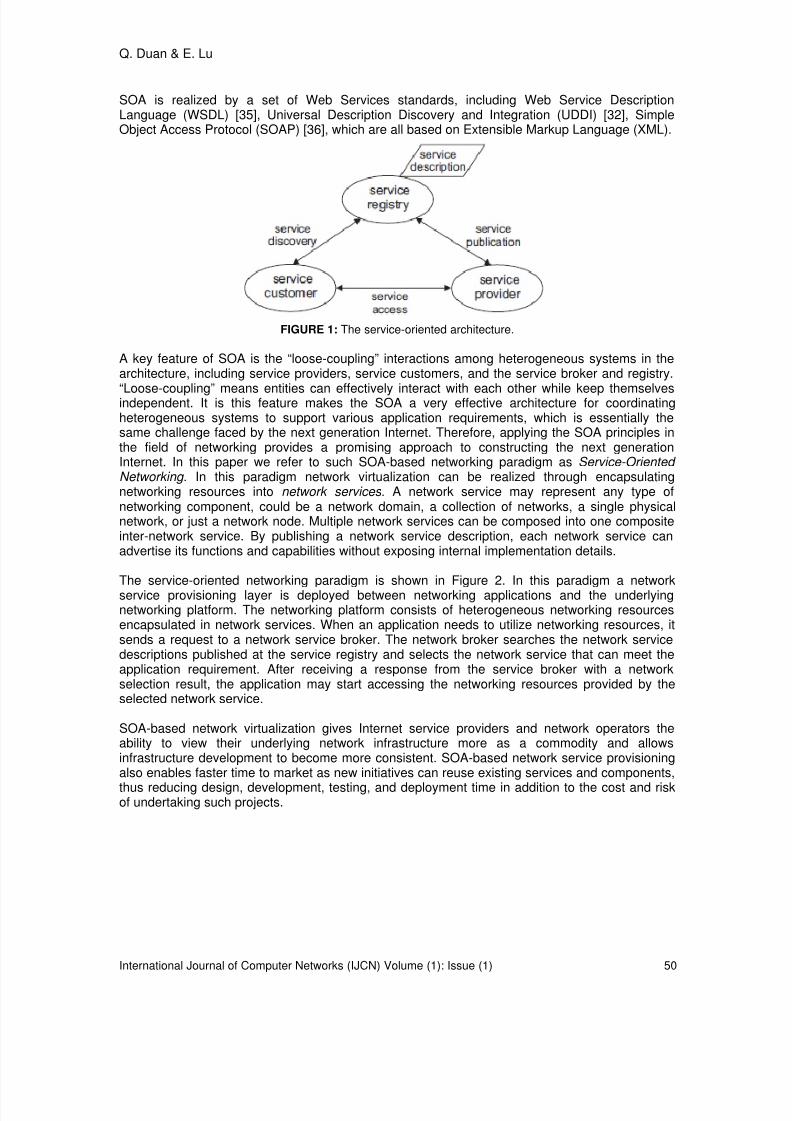
8/8/2019 IJCN v1 i1
http://slidepdf.com/reader/full/ijcn-v1-i1 63/89
Q. Duan & E. Lu
International Journal of Computer Networks (IJCN) Volume (1): Issue (1) 50
SOA is realized by a set of Web Services standards, including Web Service DescriptionLanguage (WSDL) [35], Universal Description Discovery and Integration (UDDI) [32], SimpleObject Access Protocol (SOAP) [36], which are all based on Extensible Markup Language (XML).
FIGURE 1: The service-oriented architecture.
A key feature of SOA is the “loose-coupling” interactions among heterogeneous systems in thearchitecture, including service providers, service customers, and the service broker and registry.
“Loose-coupling” means entities can effectively interact with each other while keep themselvesindependent. It is this feature makes the SOA a very effective architecture for coordinatingheterogeneous systems to support various application requirements, which is essentially thesame challenge faced by the next generation Internet. Therefore, applying the SOA principles inthe field of networking provides a promising approach to constructing the next generationInternet. In this paper we refer to such SOA-based networking paradigm as Service-Oriented Networking . In this paradigm network virtualization can be realized through encapsulatingnetworking resources into network services . A network service may represent any type ofnetworking component, could be a network domain, a collection of networks, a single physicalnetwork, or just a network node. Multiple network services can be composed into one compositeinter-network service. By publishing a network service description, each network service canadvertise its functions and capabilities without exposing internal implementation details.
The service-oriented networking paradigm is shown in Figure 2. In this paradigm a networkservice provisioning layer is deployed between networking applications and the underlyingnetworking platform. The networking platform consists of heterogeneous networking resourcesencapsulated in network services. When an application needs to utilize networking resources, itsends a request to a network service broker. The network broker searches the network servicedescriptions published at the service registry and selects the network service that can meet theapplication requirement. After receiving a response from the service broker with a networkselection result, the application may start accessing the networking resources provided by theselected network service.
SOA-based network virtualization gives Internet service providers and network operators theability to view their underlying network infrastructure more as a commodity and allowsinfrastructure development to become more consistent. SOA-based network service provisioningalso enables faster time to market as new initiatives can reuse existing services and components,
thus reducing design, development, testing, and deployment time in addition to the cost and riskof undertaking such projects.

8/8/2019 IJCN v1 i1
http://slidepdf.com/reader/full/ijcn-v1-i1 64/89
Q. Duan & E. Lu
International Journal of Computer Networks (IJCN) Volume (1): Issue (1) 51
FIGURE 2: Network service description and discovery in the service-oriented networking paradigm.
2.3 Network Service Description and Discovery
Network service description and discovery are key components for adopting SOA in networking.Service-oriented network virtualization introduces new challenges to description and discovery ofnetwork services. A distinguishing feature for network services is their service provisioningcapabilities, namely the capability of guaranteeing a certain level of QoS performance to anapplication. Therefore, service description for network virtualization should provide informationabout network service provisioning capability. Since most applications for the next generationInternet require high-performance networking, the key to network service discovery is selectingthe appropriate network services that meet application performance requirements; that is,performance-based network service selection. The currently available service description anddiscovery technologies in SOA must be enhanced to meet these new requirements.
The current standards for service description and discovery are Web Service Description
Language (WSDL) [35] and Universal Description, Discovery and Integration (UDDI) [32]. TheWSDL specification defines an abstract interface describing the functionality of a service and aconcrete interface that describes how to contact and invoke the service. The UDDI specificationdefines the interfaces for publishing and searching service descriptions and the data structuresfor organizing service description information. Currently the WSDL specification focuses onproviding functional information about services and UDDI lacks effective mechanism to publishand search non-functional features such as service provisioning capability. Therefore, the servicedescription and discovery technologies based on WSDL and UDDI are function-based instead ofperformance-based.
Research efforts have been made for enabling QoS-capable service description, discovery, andselection. For example, R.Al-Ali and his colleagues developed an extended UDDI registry(UDDIe) and the G-QoSM framework for supporting QoS-based Grid service discovery [1, 2].
However, the UDDIe was mainly tied with the G-QoSM framework for Grid computing and hadlimited support for QoS details. A QoS-capable service broker algorithm was developed todiscover, select, and compose Web services that meet end-to-end QoS constraints [26, 27]. Al-Masri and Mahmoud introduced a relevancy ranking function based on QoS parameters to findthe best Web service that meet client QoS preferences [3]. Technologies for QoS-aware run-timeservice discovery and selection were proposed in [4, 24] and a model to filter discovered serviceswith their QoS features to maximize user satisfaction was developed in [18]. These technologieswere mainly developed for Web or Grid services focusing on data processing and computinginstead of data communications and networking. Therefore, the obtained results may not beapplied directly to network service description and discovery.
8/8/2019 IJCN v1 i1
http://slidepdf.com/reader/full/ijcn-v1-i1 65/89
Q. Duan & E. Lu
International Journal of Computer Networks (IJCN) Volume (1): Issue (1) 52
World Wide Web Consortium (W3C) recently offered WS-Policy [37] and WS-PolicyAttachment[38] specifications for standardizing the description of non-functional characteristics of Webservices. WS-Policy aims to provide a general-purpose framework and model for expressing non-functional service characteristics such as requirements, preference, and capabilities as policies.WS-PolicyAttachment defines a mechanism to associate the policy expressions with the existingWSDL standard. The WS-Agreement specification [31] developed by the Open Grid Forum(OGF) defines a protocol between service providers and users for establishing and managingservice level agreements. These specifications have made significantly progresses toward QoS-enable Web/Grid service description and discovery. However, modeling and describing networkservice provisioning capability are left opened as domain-specific issues in these specifications.
Research results on network modeling and description have also been reported. A networkmodeling tool called Effective Network Views was developed in [21]. The application of this tool ismainly limited to local area networks and it is not scalable to the Internet. S. Lacour and hiscolleagues employed the directed acyclic graph (DAG) to describe network topology anddeveloped a scalable network description model [16]. This description model focuses on afunctional view of network topology instead of service provisioning capabilities; thus lacks theinformation needed for performance-based network service discovery. A Network DescriptionLanguage (NDL) was developed in [14] as a semantic schema for describing network topology.
The NDL language serves more as a vocabulary to present network topology than an approach tomodeling network service capabilities, and the reported application of NDL mainly focused onoptical networks. However the next generation Internet may consist of a wide variety of networkswith different implementations.
To the best of our knowledge little work has been reported with regard to network capabilitydescription and performance-based network discovery technologies that are applicable to theheterogeneous networks in the next generation Internet. The research presented in this articleaddresses this problem by developing a general approach for describing network servicecapabilities and a technology for discovering network services that meet the QoS performancerequired by different networking applications.
3. NETWORK SERVICE DESCRIPTION
In this section, we will develop a new approach to describing network service capabilities forsupporting the service-oriented network virtualization. The main challenge to network servicedescription lies in the heterogeneity of the networking systems that will be coexisting in theInternet. Therefore, the network service description approach must be (a) general so as to beapplicable to various network implementations and (b) flexible so as to support composingmultiple heterogeneous networks into one cross-domain network service. A key for networkservice description is to provide sufficient amount of information about the data delivery capabilityof a network without exposing its implementation details. In general, network data deliverycapability includes two aspects: the connectivity of the network service, which can be describedby enumerating the pairs of sources and destinations between which the network transports data;and the capability of data transportation between each pair of source-destination
In order to provide a formal description for network service capabilities, we define the CapabilityMatrix C. Given a network service S with m ingress ports and n egress ports, the capability matrixC is an m ×n matrix
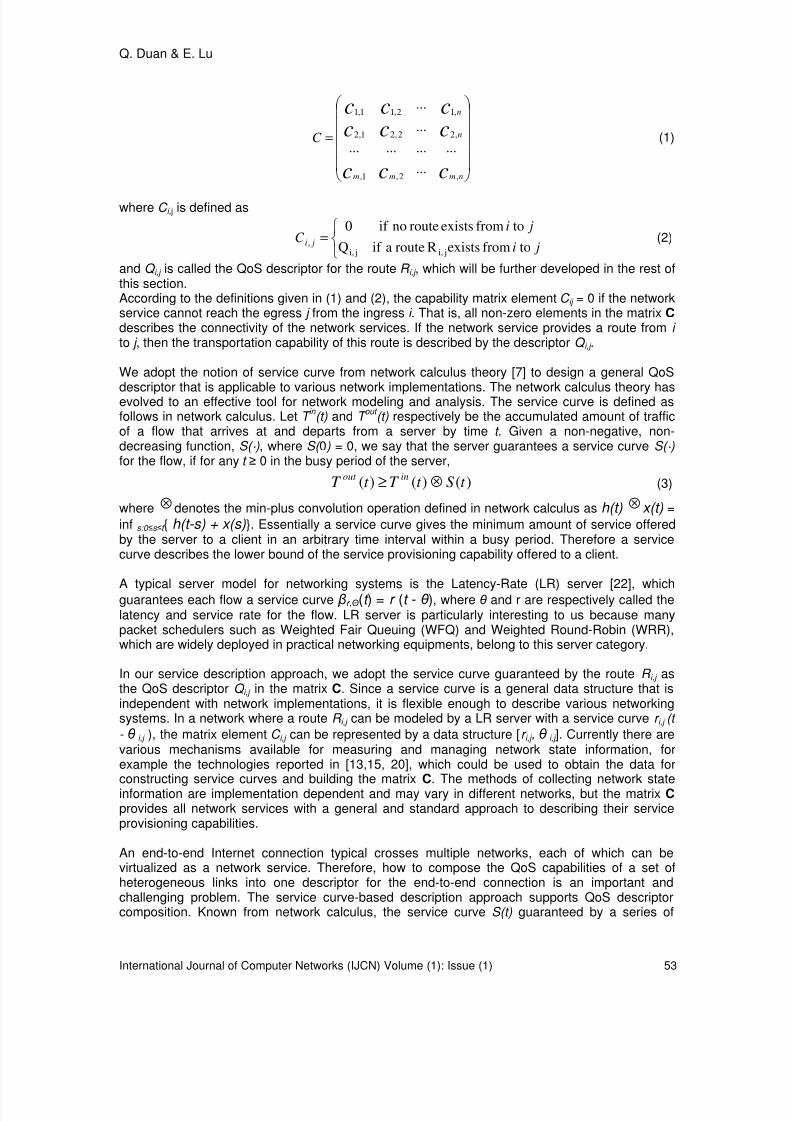
8/8/2019 IJCN v1 i1
http://slidepdf.com/reader/full/ijcn-v1-i1 66/89
Q. Duan & E. Lu
International Journal of Computer Networks (IJCN) Volume (1): Issue (1) 53
=
ccc
cccccc
nmmm
n
n
C
,2,1,
,22,21,2
,12,11,1
...
............
...
...
(1)
where C i, j is defined as
= ji
jiC ji tofromexistsRrouteaif Q
tofromexistsroutenoif 0
ji, ji,, (2)
and Q i,j is called the QoS descriptor for the route R i,j , which will be further developed in the rest ofthis section.According to the definitions given in (1) and (2), the capability matrix element C ij = 0 if the networkservice cannot reach the egress j from the ingress i . That is, all non-zero elements in the matrix C describes the connectivity of the network services. If the network service provides a route from i to j , then the transportation capability of this route is described by the descriptor Q i,j .
We adopt the notion of service curve from network calculus theory [7] to design a general QoS
descriptor that is applicable to various network implementations. The network calculus theory hasevolved to an effective tool for network modeling and analysis. The service curve is defined asfollows in network calculus. Let T
in (t) and T
out (t) respectively be the accumulated amount of traffic
of a flow that arrives at and departs from a server by time t . Given a non-negative, non-decreasing function, S(·), where S( 0 ) = 0, we say that the server guarantees a service curve S(·) for the flow, if for any t ≥ 0 in the busy period of the server,
)()()( t St T t T inout
⊗≥ (3)
where ⊗ denotes the min-plus convolution operation defined in network calculus as h(t) ⊗ x(t) =
inf s:0 ≤s ≤t { h(t-s) + x(s)}. Essentially a service curve gives the minimum amount of service offeredby the server to a client in an arbitrary time interval within a busy period. Therefore a servicecurve describes the lower bound of the service provisioning capability offered to a client.
A typical server model for networking systems is the Latency-Rate (LR) server [22], whichguarantees each flow a service curve βr,Θ(t ) = r (t - θ ), where θ and r are respectively called thelatency and service rate for the flow. LR server is particularly interesting to us because manypacket schedulers such as Weighted Fair Queuing (WFQ) and Weighted Round-Robin (WRR),which are widely deployed in practical networking equipments, belong to this server category.
In our service description approach, we adopt the service curve guaranteed by the route R i,j asthe QoS descriptor Q i,j in the matrix C. Since a service curve is a general data structure that isindependent with network implementations, it is flexible enough to describe various networkingsystems. In a network where a route R i,j can be modeled by a LR server with a service curve r i,j (t
- θ i,j ), the matrix element C i,j can be represented by a data structure [r i,j , θ i,j ]. Currently there arevarious mechanisms available for measuring and managing network state information, forexample the technologies reported in [13,15, 20], which could be used to obtain the data for
constructing service curves and building the matrix C. The methods of collecting network stateinformation are implementation dependent and may vary in different networks, but the matrix C provides all network services with a general and standard approach to describing their serviceprovisioning capabilities.
An end-to-end Internet connection typical crosses multiple networks, each of which can bevirtualized as a network service. Therefore, how to compose the QoS capabilities of a set ofheterogeneous links into one descriptor for the end-to-end connection is an important andchallenging problem. The service curve-based description approach supports QoS descriptorcomposition. Known from network calculus, the service curve S(t) guaranteed by a series of
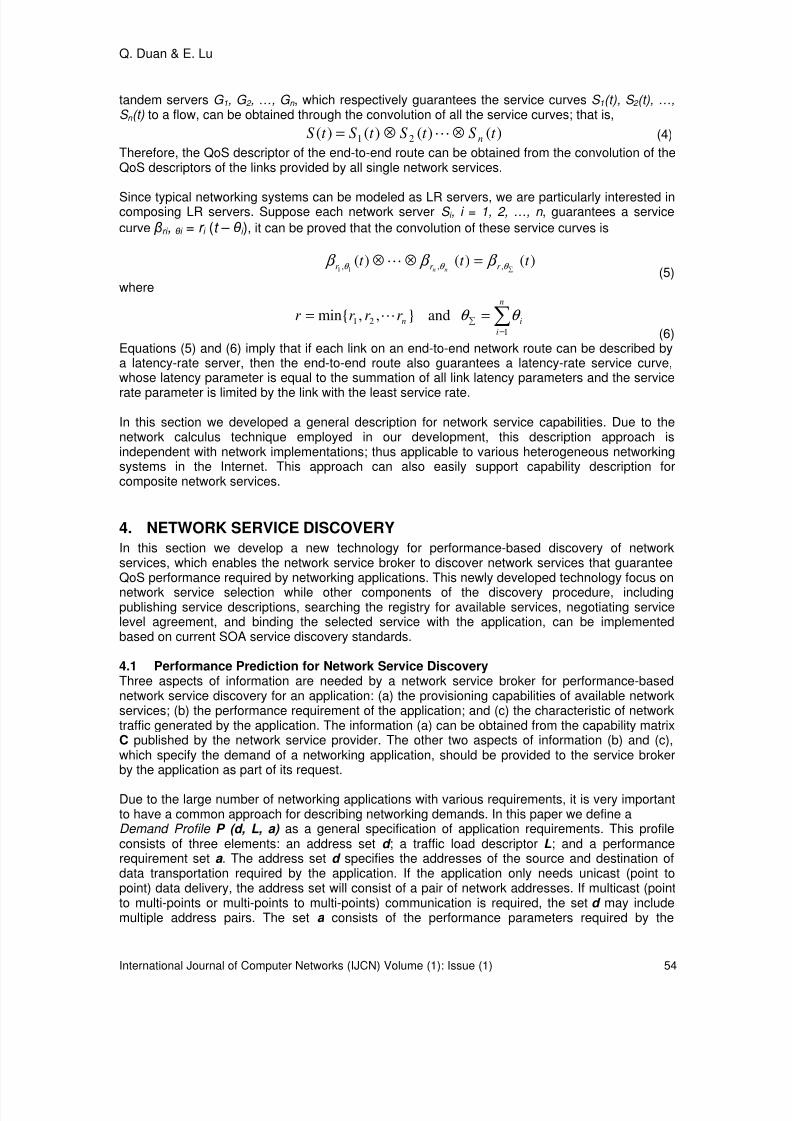
8/8/2019 IJCN v1 i1
http://slidepdf.com/reader/full/ijcn-v1-i1 67/89
Q. Duan & E. Lu
International Journal of Computer Networks (IJCN) Volume (1): Issue (1) 54
tandem servers G 1, G 2 , …, G n , which respectively guarantees the service curves S 1(t), S 2 (t), …,S n (t) to a flow, can be obtained through the convolution of all the service curves; that is,
)()()()( 21 t St St St S n⊗⊗= L (4)
Therefore, the QoS descriptor of the end-to-end route can be obtained from the convolution of theQoS descriptors of the links provided by all single network services.
Since typical networking systems can be modeled as LR servers, we are particularly interested incomposing LR servers. Suppose each network server S i , i = 1, 2, …, n , guarantees a service
curve βri , θ i = r i (t – θ i ), it can be proved that the convolution of these service curves is
)()()( ,,, 11t t t r r r nn ∑
=⊗⊗ θ θ θ β β β L
(5)where
∑=
∑ ==
n
i
inr r r r 1
21 and},,min{ θ θ L
(6)Equations (5) and (6) imply that if each link on an end-to-end network route can be described bya latency-rate server, then the end-to-end route also guarantees a latency-rate service curve,whose latency parameter is equal to the summation of all link latency parameters and the service
rate parameter is limited by the link with the least service rate.
In this section we developed a general description for network service capabilities. Due to thenetwork calculus technique employed in our development, this description approach isindependent with network implementations; thus applicable to various heterogeneous networkingsystems in the Internet. This approach can also easily support capability description forcomposite network services.
4. NETWORK SERVICE DISCOVERY
In this section we develop a new technology for performance-based discovery of networkservices, which enables the network service broker to discover network services that guaranteeQoS performance required by networking applications. This newly developed technology focus on
network service selection while other components of the discovery procedure, includingpublishing service descriptions, searching the registry for available services, negotiating servicelevel agreement, and binding the selected service with the application, can be implementedbased on current SOA service discovery standards.
4.1 Performance Prediction for Network Service DiscoveryThree aspects of information are needed by a network service broker for performance-basednetwork service discovery for an application: (a) the provisioning capabilities of available networkservices; (b) the performance requirement of the application; and (c) the characteristic of networktraffic generated by the application. The information (a) can be obtained from the capability matrixC published by the network service provider. The other two aspects of information (b) and (c),which specify the demand of a networking application, should be provided to the service brokerby the application as part of its request.
Due to the large number of networking applications with various requirements, it is very importantto have a common approach for describing networking demands. In this paper we define aDemand Profile P (d, L, a) as a general specification of application requirements. This profileconsists of three elements: an address set d ; a traffic load descriptor L; and a performancerequirement set a . The address set d specifies the addresses of the source and destination ofdata transportation required by the application. If the application only needs unicast (point topoint) data delivery, the address set will consist of a pair of network addresses. If multicast (pointto multi-points or multi-points to multi-points) communication is required, the set d may includemultiple address pairs. The set a consists of the performance parameters required by the
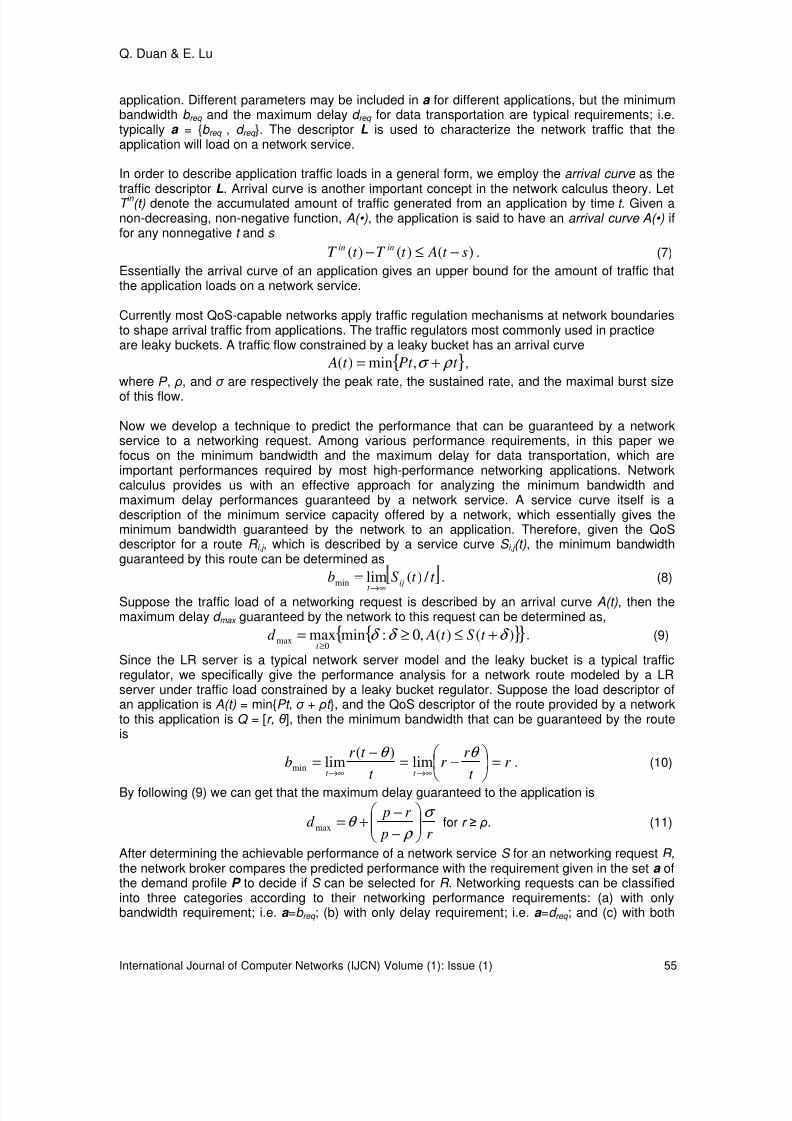
8/8/2019 IJCN v1 i1
http://slidepdf.com/reader/full/ijcn-v1-i1 68/89
Q. Duan & E. Lu
International Journal of Computer Networks (IJCN) Volume (1): Issue (1) 55
application. Different parameters may be included in a for different applications, but the minimumbandwidth b req and the maximum delay d req for data transportation are typical requirements; i.e.typically a = {b req , d req }. The descriptor L is used to characterize the network traffic that theapplication will load on a network service.
In order to describe application traffic loads in a general form, we employ the arrival curve as thetraffic descriptor L. Arrival curve is another important concept in the network calculus theory. LetT in (t) denote the accumulated amount of traffic generated from an application by time t . Given anon-decreasing, non-negative function, A(•), the application is said to have an arrival curve A(•) iffor any nonnegative t and s
)()()( st At T t T inin−≤− . (7)
Essentially the arrival curve of an application gives an upper bound for the amount of traffic thatthe application loads on a network service.
Currently most QoS-capable networks apply traffic regulation mechanisms at network boundariesto shape arrival traffic from applications. The traffic regulators most commonly used in practiceare leaky buckets. A traffic flow constrained by a leaky bucket has an arrival curve
}{ t Pt t A ρ σ += ,min)( ,
where Ρ , ρ, and σ are respectively the peak rate, the sustained rate, and the maximal burst size
of this flow.
Now we develop a technique to predict the performance that can be guaranteed by a networkservice to a networking request. Among various performance requirements, in this paper wefocus on the minimum bandwidth and the maximum delay for data transportation, which areimportant performances required by most high-performance networking applications. Networkcalculus provides us with an effective approach for analyzing the minimum bandwidth andmaximum delay performances guaranteed by a network service. A service curve itself is adescription of the minimum service capacity offered by a network, which essentially gives theminimum bandwidth guaranteed by the network to an application. Therefore, given the QoSdescriptor for a route R i,j , which is described by a service curve S i,j (t), the minimum bandwidthguaranteed by this route can be determined as
t t Sb ijt
/ )(limmin∞→
= . (8)
Suppose the traffic load of a networking request is described by an arrival curve A(t), then themaximum delay d max guaranteed by the network to this request can be determined as,
{ }{ })()(,0:minmax0
max δ δ δ +≤≥=≥
t St Ad t
. (9)
Since the LR server is a typical network server model and the leaky bucket is a typical trafficregulator, we specifically give the performance analysis for a network route modeled by a LRserver under traffic load constrained by a leaky bucket regulator. Suppose the load descriptor ofan application is A(t) = min{Pt , σ + ρt }, and the QoS descriptor of the route provided by a networkto this application is Q = [r, θ ], then the minimum bandwidth that can be guaranteed by the routeis
r t
r r
t
t r b
t t =
−=
−=
∞→∞→
θ θ lim
)(limmin . (10)
By following (9) we can get that the maximum delay guaranteed to the application is
r p
r pd
σ
ρ θ
−
−+=max for r ≥ ρ. (11)
After determining the achievable performance of a network service S for an networking request R ,the network broker compares the predicted performance with the requirement given in the set a ofthe demand profile P to decide if S can be selected for R . Networking requests can be classifiedinto three categories according to their networking performance requirements: (a) with onlybandwidth requirement; i.e. a =b req ; (b) with only delay requirement; i.e. a =d req ; and (c) with both
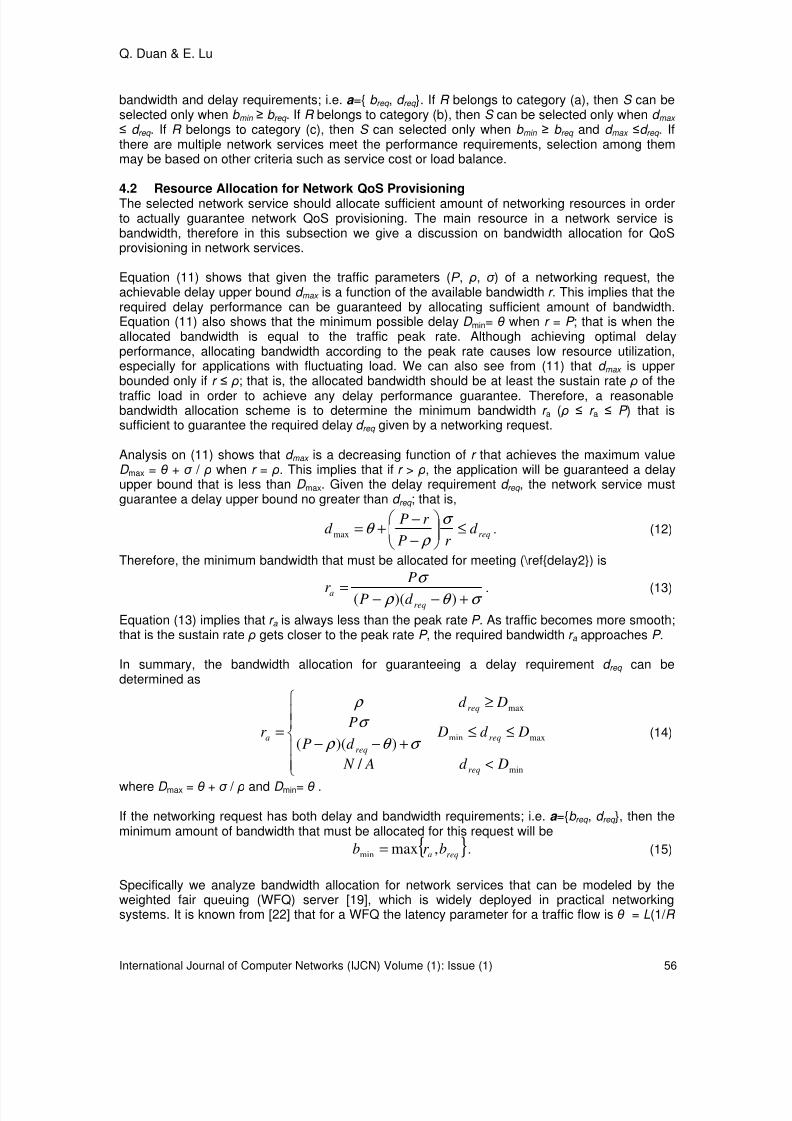
8/8/2019 IJCN v1 i1
http://slidepdf.com/reader/full/ijcn-v1-i1 69/89
Q. Duan & E. Lu
International Journal of Computer Networks (IJCN) Volume (1): Issue (1) 56
bandwidth and delay requirements; i.e. a ={ b req , d req }. If R belongs to category (a), then S can beselected only when b min ≥ b req . If R belongs to category (b), then S can be selected only when d max ≤ d req . If R belongs to category (c), then S can selected only when b min ≥ b req and d max ≤d req . Ifthere are multiple network services meet the performance requirements, selection among themmay be based on other criteria such as service cost or load balance.
4.2 Resource Allocation for Network QoS ProvisioningThe selected network service should allocate sufficient amount of networking resources in orderto actually guarantee network QoS provisioning. The main resource in a network service isbandwidth, therefore in this subsection we give a discussion on bandwidth allocation for QoSprovisioning in network services.
Equation (11) shows that given the traffic parameters (Ρ , ρ, σ ) of a networking request, theachievable delay upper bound d max is a function of the available bandwidth r . This implies that therequired delay performance can be guaranteed by allocating sufficient amount of bandwidth.Equation (11) also shows that the minimum possible delay D min= θ when r = P ; that is when theallocated bandwidth is equal to the traffic peak rate. Although achieving optimal delayperformance, allocating bandwidth according to the peak rate causes low resource utilization,especially for applications with fluctuating load. We can also see from (11) that d max is upperbounded only if r ≤ ρ; that is, the allocated bandwidth should be at least the sustain rate ρ of the
traffic load in order to achieve any delay performance guarantee. Therefore, a reasonablebandwidth allocation scheme is to determine the minimum bandwidth r a ( ρ ≤ r a ≤ P ) that issufficient to guarantee the required delay d req given by a networking request.
Analysis on (11) shows that d max is a decreasing function of r that achieves the maximum valueD max = θ + σ / ρ when r = ρ. This implies that if r > ρ, the application will be guaranteed a delayupper bound that is less than D max. Given the delay requirement d req , the network service mustguarantee a delay upper bound no greater than d req ; that is,
reqd r P
r Pd ≤
−
−+=
σ
ρ θ max . (12)
Therefore, the minimum bandwidth that must be allocated for meeting (\ref{delay2}) is
σ θ ρ
σ
+−−= ))(( req
ad P
P
r . (13)
Equation (13) implies that r a is always less than the peak rate P . As traffic becomes more smooth;that is the sustain rate ρ gets closer to the peak rate P , the required bandwidth r a approaches P .
In summary, the bandwidth allocation for guaranteeing a delay requirement d req can bedetermined as
<
≤≤+−−
≥
=
min
maxmin
max
/
))((
Dd A N
Dd Dd P
P
Dd
r
req
req
req
req
aσ θ ρ
σ
ρ
(14)
where D max = θ + σ / ρ and D min= θ .
If the networking request has both delay and bandwidth requirements; i.e. a ={b req , d req }, then theminimum amount of bandwidth that must be allocated for this request will be
{ }reqa br b ,maxmin = . (15)
Specifically we analyze bandwidth allocation for network services that can be modeled by theweighted fair queuing (WFQ) server [19], which is widely deployed in practical networkingsystems. It is known from [22] that for a WFQ the latency parameter for a traffic flow is θ = L(1/ R
8/8/2019 IJCN v1 i1
http://slidepdf.com/reader/full/ijcn-v1-i1 70/89
Q. Duan & E. Lu
International Journal of Computer Networks (IJCN) Volume (1): Issue (1) 57
+ 1/ r ), where L is the maximum packet length of this flow, R is the total transmission capacity ofthe network route, and r is the bandwidth available to the flow on this route. For a networkingapplication that generates a leaky bucket constrained flow with traffic parameters (Ρ , ρ, σ ), if theQoS descriptor of the route provided by a network service for the application is S =[r , θ ], then wecan predict that the maximum delay guaranteed to the application is
r P
r P
r R Ld
σ
ρ
−
−+
+=11
max. (16)
Given a delay requirement d req , D min ≤ d req ≤ D max , the bandwidth allocation requirement can bedetermined as
σ ρ
ρ σ
+−−
−+=
) / )((
)(
R Ld P
P LPr
req
a . (17)
5. NUMERICAL EXAMPLES
In this section, we use numerical examples to illustrate the applications of the performanceprediction and bandwidth allocation techniques developed for network service discovery. Weconsidered two networking applications utilizing a network service in our examples. The
application A1 uses the network to deliver a stream of video packets and loads the network with aflow f 1. The application A2 transmits a flow of audio packets f 2 through the network. Both A1 andA2 require a small maximum packet transmission delay. We adopt the traffic parameters given in[11] for f 1; that is, the peak rate P =5.3 Mb/s, the sustained rate ρ =1.5 Mb/s, and the maximumburst size σ =140 kbits. The traffic parameters for f 2 are given in [8]; that is, the peak rate P =3.2Mb/s, the sustained rate ρ =1.1 Mb/s, and the maximum burst size σ =300 kbits. We assume thatthe maximum transmission unit (MTU) of the network is L=1K bytes, and the total link capacity ofthe route is R =1Gb/s.
FIGURE 3: Delay performance prediction for a single network service
We first analyzed the maximum packet delay d max that can be guaranteed for the flows f 1 and f 2 by a single network service with various amounts of available bandwidth r on the assigned
network routes. The results are plotted in Figure 3, where d s 1 and d s
2 denote the maximum delayfor f 1 and f 2 respectively. From this figure we can see that both d s
1and d s
2 decrease when the
available bandwidth r increases. This means that the more bandwidth is available to anapplication, the tighter is the delay upper bound guaranteed to the application. Comparisonbetween the curves of d s
1and d s
2 shows that although both of them are decreasing functions of r
d s 2
drops faster than d s 1, which means that the same amount of bandwidth increment can make
more significant improvement in delay performance for f 2 than what it does for f 1. This observationimplies that the QoS performance guaranteed by a network service to an application isassociated with application traffic characteristics as well as the QoS capability of the network.

8/8/2019 IJCN v1 i1
http://slidepdf.com/reader/full/ijcn-v1-i1 71/89
Q. Duan & E. Lu
International Journal of Computer Networks (IJCN) Volume (1): Issue (1) 58
FIGURE 4: Delay performance prediction for a composite network service
We also predicted delay performance for A1 and A2 in a composite network service consisting ofthree network domains. To simplify the analysis, we assume that the three domains provide an
identical QoS descriptor for each application. We calculated the maximum end-to-end packetdelay for the traffic flows f 1 and f 2 that pass through the three domains, which are denoted by d c
1
and d c 2
respectively. We plotted the results of d s 1
and d s 2
with data for d c 1
and d c 2
in Figure 4.From this figure we can see that d c
1and d c
2 are also decreasing function of available bandwidth
$r$. This figure also shows that for any available bandwidth r , d s 1
< d c 1
and d s 2
< d c 2 . This implies
that the maximum packet delay guaranteed to each application by the composite network serviceis always greater than what is guaranteed by a single network service in the composite service.An interesting observation in Figure 4 is that for each application, the delay upper boundachieved by the composite network service is only slightly greater than the maximum delayguaranteed by a single service, which is much less than the summation of the maximum delays ofall domains passed by the traffic flow.
FIGURE 5: Bandwidth allocation for delay performance guarantee
We also analyzed the bandwidth allocation requirements in a network service to guarantee a setof delay upper-bounds for the two applications. The results are plotted in Figure 5, where r a
1and
r a 2
are respectively the required amounts of bandwidth for applications A1 and A2 to achieve therequired delay upper-bound d req . From this figure we can see that both r a
1and r a
2 are decreasing
functions of d req . This means that the tighter the required delay upper-bound is, the morebandwidth must be allocated in the network to guarantee it. Figure 5 also shows that r a
1
decreases with the increment of d req faster than r a 2
does. This implies that in the same networkservice, applications with different traffic load characteristics need different amounts bandwidth to
8/8/2019 IJCN v1 i1
http://slidepdf.com/reader/full/ijcn-v1-i1 72/89
Q. Duan & E. Lu
International Journal of Computer Networks (IJCN) Volume (1): Issue (1) 59
achieve the same level of delay performance. This also justifies the necessary of having a trafficload descriptor L as part of the networking demand profile P for performance-based networkservice discovery.
6. NETWORK SERVICE DESCRIPTION AND DISCOVERY SYSTEM
In this section, we discuss a system for realizing the network service description and discovery
technologies developed in previous sections. Figure 6 shows the structure of this system, whichconsists of a Network Service Broker (NSB), a Network Service Registry (NSR), multiple NetworkService Providers (NSPs), and a Network Service Consumer (NSC). A network service providercould be single networking system, a network domain with multiple networking systems, or acollection of network domains that belong to an Internet Service Provider (ISP). The networkservice consumer could be user equipment, or a networking application, or maybe a networkservice provider that needs to access networking resources managed by other network serviceproviders.
FIGURE 6: A system structure for network service description and discovery.
Each network service provider is required to support two functional modules for realizing theservice-oriented networking paradigm: a Network Service Management (NSM) module and aNetwork Resource Management (NRM) module. The NSM module registers the network serviceat the broker, collects network state information from the NRM module to compile a networkservice description (including the capability matrix C), and publishes the description at the serviceregistry. The NSM module is also responsible for updating the network service description at theservice registry when network information changes.
The network service broker consists of three modules: Consumer Interface (CI), Network ServiceDiscovery (NSD), and Network Service Selection (NSS). When a network service consumerneeds to discover a service provider for accessing networking resources, it submits a networkingrequest to the service broker through the CI interface. This request includes a networking
demand profile P [d , L, a ]. On receiving the networking request and the demand profile, thediscovery module (NSD) of the broker accesses the service registry to find all available networkservices that provide a network route between the source and destination specified in d of thedemand profile. These network services are selected as candidate services and their capabilitymatrixes will be further analyzed by the broker. For each candidate service, the selection module(NSS) uses the QoS descriptor from the matrix C and the load descriptor L in the demand profileP to evaluate the achievable QoS performance that the service can offer to the consumer. Thenthe NSS module compares the predicted performance with the requirements given in the set a ofthe profile P and selects the service that meets all performance requirements given by the
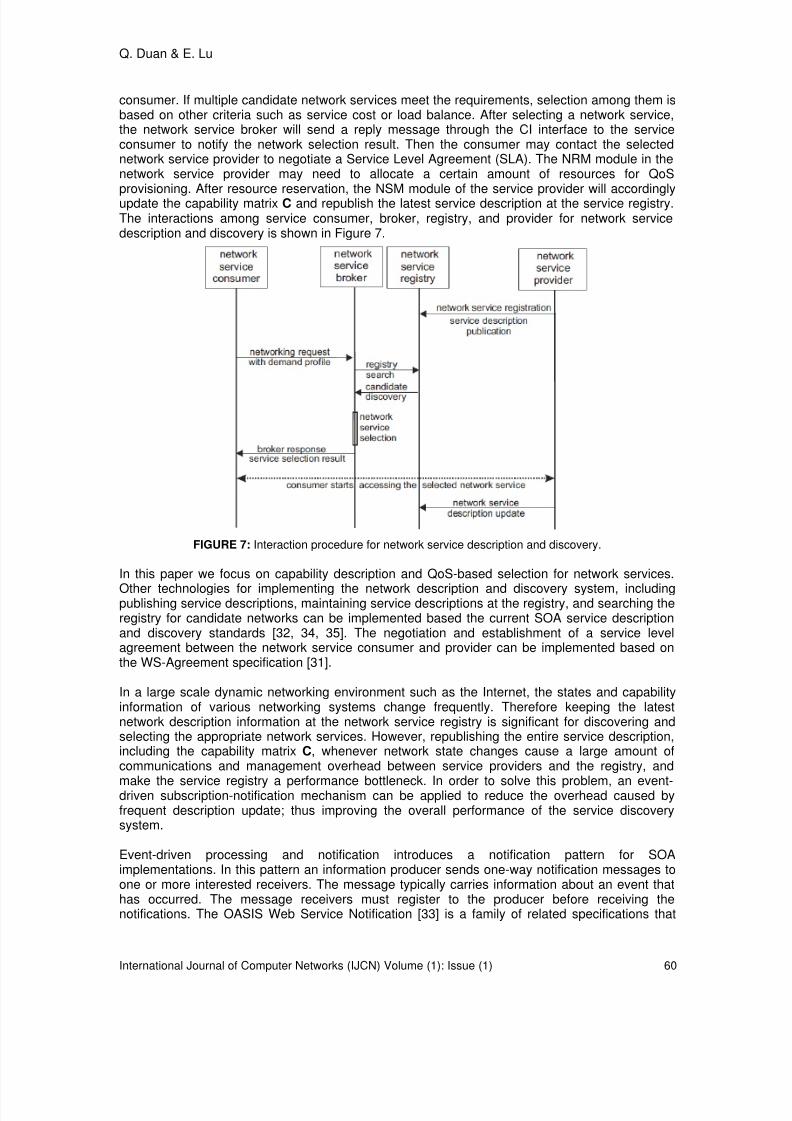
8/8/2019 IJCN v1 i1
http://slidepdf.com/reader/full/ijcn-v1-i1 73/89
Q. Duan & E. Lu
International Journal of Computer Networks (IJCN) Volume (1): Issue (1) 60
consumer. If multiple candidate network services meet the requirements, selection among them isbased on other criteria such as service cost or load balance. After selecting a network service,the network service broker will send a reply message through the CI interface to the serviceconsumer to notify the network selection result. Then the consumer may contact the selectednetwork service provider to negotiate a Service Level Agreement (SLA). The NRM module in thenetwork service provider may need to allocate a certain amount of resources for QoSprovisioning. After resource reservation, the NSM module of the service provider will accordinglyupdate the capability matrix C and republish the latest service description at the service registry.The interactions among service consumer, broker, registry, and provider for network servicedescription and discovery is shown in Figure 7.
FIGURE 7: Interaction procedure for network service description and discovery.
In this paper we focus on capability description and QoS-based selection for network services.
Other technologies for implementing the network description and discovery system, includingpublishing service descriptions, maintaining service descriptions at the registry, and searching theregistry for candidate networks can be implemented based the current SOA service descriptionand discovery standards [32, 34, 35]. The negotiation and establishment of a service levelagreement between the network service consumer and provider can be implemented based onthe WS-Agreement specification [31].
In a large scale dynamic networking environment such as the Internet, the states and capabilityinformation of various networking systems change frequently. Therefore keeping the latestnetwork description information at the network service registry is significant for discovering andselecting the appropriate network services. However, republishing the entire service description,including the capability matrix C, whenever network state changes cause a large amount ofcommunications and management overhead between service providers and the registry, and
make the service registry a performance bottleneck. In order to solve this problem, an event-driven subscription-notification mechanism can be applied to reduce the overhead caused byfrequent description update; thus improving the overall performance of the service discoverysystem.
Event-driven processing and notification introduces a notification pattern for SOAimplementations. In this pattern an information producer sends one-way notification messages toone or more interested receivers. The message typically carries information about an event thathas occurred. The message receivers must register to the producer before receiving thenotifications. The OASIS Web Service Notification [33] is a family of related specifications that

8/8/2019 IJCN v1 i1
http://slidepdf.com/reader/full/ijcn-v1-i1 74/89
Q. Duan & E. Lu
International Journal of Computer Networks (IJCN) Volume (1): Issue (1) 61
define a standard approach to notification using a topic-based subscription-publication pattern.Following this pattern, the network service registry can subscribe to a network service providerand specify a set of network states as subscription topics. Then, the service registry will receive anotification message from the service provider whenever a network state subscribed as a topicchanges. A threshold can also be set to each subscription topic so that update notification is onlytriggered when the amount of change in that topic is greater than the threshold. In this way, thenetwork service registry can obtain the latest network state and capability information forsupporting real-time network discovery and selection. Since an update only happens when anetwork state changes more than a pre-specified threshold and the notification message containsonly the changed states instead of the entire description document, this updating mechanism cangreatly reduce communications and management overhead.
FIGURE 8: Event driven network service description update.
The interaction procedure for network service description and discovery with event-driveninformation update is shown in Figure 8. When a network service provider first time publishes itsnetwork service description at the service registry, the registry will also subscribe itself to theservice provider to receive notification for network state change. The registry can specify whatnetwork states are subscription topics. After this registration-subscription procedure completed,the network service registry will be notified whenever the specified subscription topics change inthe network service. Then the description for this network service will be updated at the registryaccordingly.
The performance of the network service description and discovery system could be furtherimproved by reducing the information updating overhead through a partial publication technology.
This technology allows network service providers publish only part of their service descriptionsthat are relatively static at the service registry. This part of description could include informationsuch as the network types (e.g., connectionless IP network or circuit switching telecommunicationnetwork, cellular mobile network or WiFi WLAN), network service operators (e.g., AT&T orVerizon), and also the connectivity parameters of the capability matrix C, which are relativelystable for typical networks. If a network service is selected as a candidate, then the serviceselection module of the broker will contact the NSM module in the provider of this service toretrieve additional information needed for decision making on network service selection, forexample retrieving the QoS descriptor of the matrix C for performance evaluation. In this way the
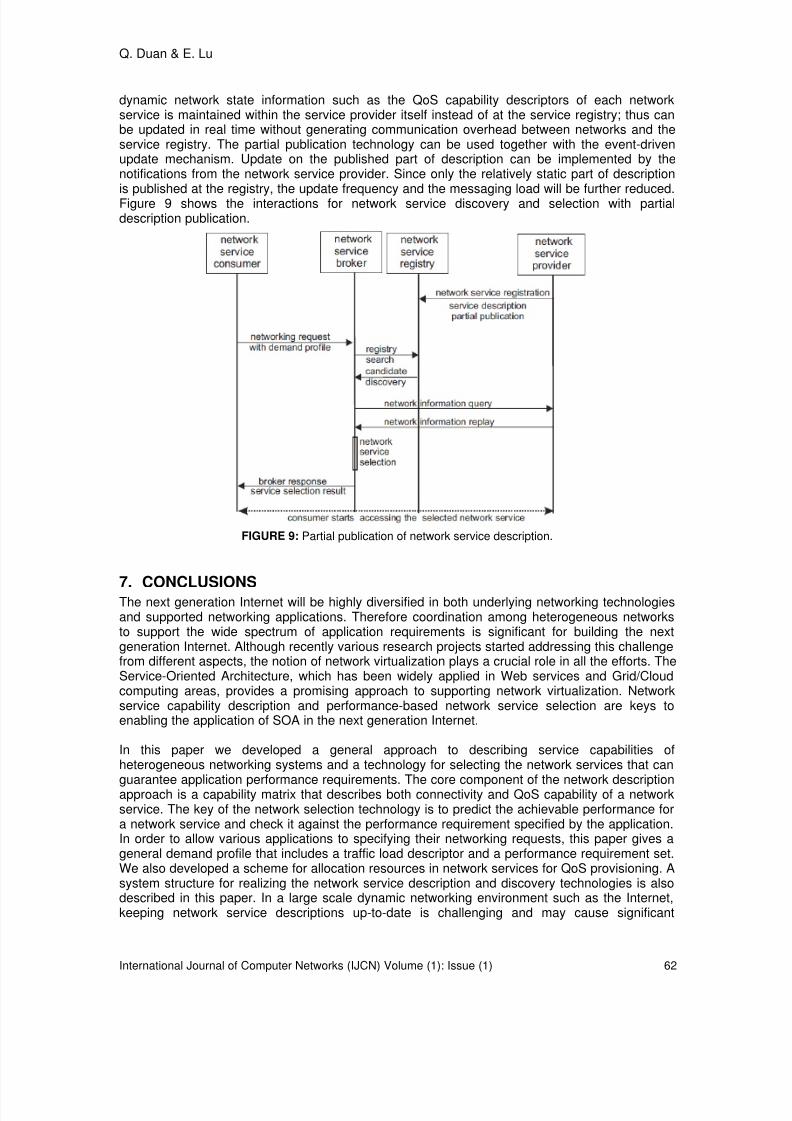
8/8/2019 IJCN v1 i1
http://slidepdf.com/reader/full/ijcn-v1-i1 75/89
Q. Duan & E. Lu
International Journal of Computer Networks (IJCN) Volume (1): Issue (1) 62
dynamic network state information such as the QoS capability descriptors of each networkservice is maintained within the service provider itself instead of at the service registry; thus canbe updated in real time without generating communication overhead between networks and theservice registry. The partial publication technology can be used together with the event-drivenupdate mechanism. Update on the published part of description can be implemented by thenotifications from the network service provider. Since only the relatively static part of descriptionis published at the registry, the update frequency and the messaging load will be further reduced.Figure 9 shows the interactions for network service discovery and selection with partialdescription publication.
FIGURE 9: Partial publication of network service description.
7. CONCLUSIONSThe next generation Internet will be highly diversified in both underlying networking technologiesand supported networking applications. Therefore coordination among heterogeneous networksto support the wide spectrum of application requirements is significant for building the nextgeneration Internet. Although recently various research projects started addressing this challengefrom different aspects, the notion of network virtualization plays a crucial role in all the efforts. TheService-Oriented Architecture, which has been widely applied in Web services and Grid/Cloudcomputing areas, provides a promising approach to supporting network virtualization. Networkservice capability description and performance-based network service selection are keys toenabling the application of SOA in the next generation Internet.
In this paper we developed a general approach to describing service capabilities ofheterogeneous networking systems and a technology for selecting the network services that can
guarantee application performance requirements. The core component of the network descriptionapproach is a capability matrix that describes both connectivity and QoS capability of a networkservice. The key of the network selection technology is to predict the achievable performance fora network service and check it against the performance requirement specified by the application.In order to allow various applications to specifying their networking requests, this paper gives ageneral demand profile that includes a traffic load descriptor and a performance requirement set.We also developed a scheme for allocation resources in network services for QoS provisioning. Asystem structure for realizing the network service description and discovery technologies is alsodescribed in this paper. In a large scale dynamic networking environment such as the Internet,keeping network service descriptions up-to-date is challenging and may cause significant
8/8/2019 IJCN v1 i1
http://slidepdf.com/reader/full/ijcn-v1-i1 76/89
Q. Duan & E. Lu
International Journal of Computer Networks (IJCN) Volume (1): Issue (1) 63
communication and management load. We proposed an event-driven information updatemechanism and a partial description publishing technology that may significantly improve theperformance of the network service description and discovery system. Our analysis methods andthe developed technologies for network service description, discovery, resource allocation, andinformation update are general and independent of network implementations; thus are applicableto heterogeneous networking systems in the next generation Internet. The service description andperformance analysis techniques are also flexible to support composite network services thatcomprise multiple networking systems.
8. REFERENCES
1. R. J. Al-Ali, O. M. Rana and D. W. Walker. “G-QoSM: Grid service discovery using QoSproperties''. J. of Computing and Informatics, 21(4):1--15, 2002
2. R. J. Al-Ali, A. ShaikhAli, O. M. Rana and D. W. Walker. “Supporting QoS-based discovery inservice-oriented grids''. In Proceedings of the 17th Intl. Parallel and Distributed Processingsymposium, 2003
3. E. Al-Marsri and Q. H. Mahmoud. “QoS-based discovery and ranking of Web services''. In
Proceedings of the 16th IEEE International Conference on Computer Communications andNetworks, August 2007
4. E. Ambrosi, M. Bianchi, C. Gaibisso, G. Gambosi and F. Lombardi. “A system for predictingthe run-time behavior of Web Services''. In Proceedings of the 2005 International Conferenceon Services Systems and Services Management, June 2005
5. T. Anderson, L. Peterson, S. Shenker and J. Turner. “Overcoming the Internet impassesthrough virtualization''. IEEE Computer Magazine, 38(4):34--41, 2005
6. F. Belqasmi, R. Glitho and R. Dssouli. “Ambient Network Composition''. IEEE NetworkMagazine, 22(4):6--12, 2008
7. J. L. Boudec and P. Thiran. “Network calculus: a theory of deterministic queueing systems forthe Internet'', Springer Verlag LNCS 2050, June 2001
8. M. Butto, E. Cavallero and A. Tonietti. “Effectiveness of the leaky bucket policingmechanisms in ATM networks''. IEEE J. Select. Areas Commun., 9(4):335--342, 1991
9. K. Channabasavaiah, K. Holley and E. Tuggle. “Migrating to a Service-Oriented Archiecture''.IBM DeveloperWorks, Dec. 2003
10. N. Feamster, L. Gao and J. Rexford. “How to lease the Internet in your spare time''. ACMSIGCOMM Computer Communications Review, 37(1):61--64, 2007
11. P. Fizek and M. Reisslein. “MPEG-4 and H.263 video traces for network performanceevaluation''. IEEE Network Magazine, 15(6):40--54, 2001
12. R. Douville, J.-L. Le Roux, J.-L. Rougier and S. Secci. “A service plane over the PCEarchitecture for automatic multidomain connection-oriented services''. IEEE CommunicationsMagazine, 46(6):90--102, 2008.
13. T. S. Eugene Ng and H. Zhang. “Predicting Internet network distance with coordinates-basedapproaches''. In Proceedings of IEEE INFOCOM'02, New York, June 2002
8/8/2019 IJCN v1 i1
http://slidepdf.com/reader/full/ijcn-v1-i1 77/89
Q. Duan & E. Lu
International Journal of Computer Networks (IJCN) Volume (1): Issue (1) 64
14. J. Ham, P. Grosso, R. Pol, A. Toonk and C. de Laat. “Using the network descriptionlanaguage in optical networks''. In Proceedings of the 10th IFIP/IEEE Intl. Symposium onIntegrated Network Management, May 2007
15. A. Kind, X. Dimitropoulos, S. Denazis and B. Claise. “Advanced network monitoring bringslife to the wareness plane''. IEEE Communicatins Magazine, 46(10):140--146, 2008
16. S. Lacour, C. Perez and T. PriolA. “Network topology description model for {G}rid applicationdeployment''. In Proceedings of the 5th IEEE/ACM Intl. Workshop on Grid Computing, Nov.2004
17. T. Lehman, J. Sobieski and B. Jabbari. “DRAGON: A Framework for Service Provisioning inHeterogeneous Grid Networks''. IEEE Communications Magazine, 44(3):84--90, 2006
18. M. Li, B. Yu, O. Rana and Z. Wang. “Grid service discovery with rough sets''. IEEETranscations on Knowledge and Data Engineering, 20(6):851--862, 2008
19. A. K. Parekh and R. G. Gallager. “A generalized processor sharing approach to flow controlin integrated services networks: the single-node case''. IEEE/ACM Trans. Networking,1(3):344--357, 1993
20. R. Prasad, M. Murray, C. Dovrolis and K. Claffy. “Bandwidth estimation: metrics,measurement techniques, and tools''. IEEE Network Magazine, 17(6):27--35, 2003
21. G. Shao and F. Berman. “Using effective network views to promote distributed applicationperformance''. In Proceedings of the 1999 Intl. Conf. on Parallel and Distributed ProcessingTechniques and Applications, June 1999
22. D. Stiliadis and A. Varma. “Latency-rate servers: a general model for analysis of trafficscheduling algorithms''. IEEE/ACM Trans. Networking, 6(5):611--624, 1998
23. J. Turner and D. E. Taylor. “Diversifying the Internet''. In Proceedings of IEEE Globecom2005, Nov. 2005
24. C. Wan, C. Ullrich, L. Chen, R. Huang, J. Luo and A. Shi. “On solving QoS-aware serviceselection problem with service composition''. In Proceedings of the 7th InternatinalConference on Grid and Cooperative Computing, Oct. 2008
25. S. Weerawarana, F. Curbera, F. Leymann, T. Storey and D. F. Ferguson. “Web ServicesPlatform Architecture''. Prentice Hall, 2005.
26. T. Yu and K-J. Lin. “The design of QoS broker algorithms for QoS-capable Web Services''.International Journal of Web Services Research, 1(4):10--16, 2004
27. T. Yu and K-J. Lin. “Service selection algorithm for Web services with end-to-end QoSconstraints''. Journal of Information Systems and E-Business Management, 3(2):20--30, 2005
28. ITU-T, “Functional Requirements and Architecture of the NGN Release 1,'' RecommendationY.2012, Sept. 2006
29. Open Mobile Alliance, “OMA Enabler Releases and Specifications - OMA ServiceEnvironment Architecture Document,'' Nov. 2007
30. Open Grid Forum (OGF) OGSA-WG, “The Open Grid Service Architecture, version 1.0,'' Jan.2005
8/8/2019 IJCN v1 i1
http://slidepdf.com/reader/full/ijcn-v1-i1 78/89
Q. Duan & E. Lu
International Journal of Computer Networks (IJCN) Volume (1): Issue (1) 65
31. Open Grid Forum (OGF) “Web Services Agreement Specification (WS-Agreement),'' March1007, available online: http://www.ogf.org/documents/GFD.107.pdf
32. Organization for the Advancement of Structured Information Standards (OASIS), “UniversalDescription, Discovery and Integration Version 3.0.2,'' Feb. 2005, available online:http://www.oasis-open.org/specs/
33. Organization for the Advancement of Structured Information Standards (OASIS), “WebServices Base Notification (WS-BaseNotification) v1.3,'' Oct. 2006
34. Organization for the Advancement of Structured Information Standards (OASIS), “WebServices Resource Framework (WSRF) v1.2,'' April 2006
35. World Wide Web Consortium (W3C), “Web Service Description Language Version 2,'' March2006
36. World Wide Web Consortium (W3C), “Simple Object Access Protocol (SOAP) Version 1.2,''April 2007
37. World Wide Web Consortium (W3C), “Web Services Policy Framwork (WS-Policy) Version
1.5,'' Sept. 2007, available online: http://www.w3.org/TR/ws-policy/
38. World Wide Web Consortium (W3C), “Web Services Policy Attachment (WS-PolicyAttachment) Version 1.5,'' Sept. 2007, available online: http://www.w3.org/TR/ws-policy-attach/
8/8/2019 IJCN v1 i1
http://slidepdf.com/reader/full/ijcn-v1-i1 79/89
Sachin Shetty, Ying Tang & William Collani
International Journal of Computer Networks (IJCN), Volume (1): Issue (1) 36
A Cross-Layer Packet Loss Identification Scheme to ImproveTCP Veno Performance
Sachin Shetty [email protected] of Electrical and Computer Engineering Tennessee State University 3500 John A. Merritt Blvd Nashville, TN 37209
Ying Tang [email protected] of Electrical and Computer Engineering Rowan University 201 Mullica Hill Rd Glassboro, NJ 08028
William Collani [email protected] of Electrical and Computer Engineering Rowan University 201 Mullica Hill Rd Glassboro, NJ 08028
Abstract
In wired-cum-wireless networks, one of the main design challenges for TCP is toaccurately distinguish congestion losses from random losses caused due tochannel noise and interference. TCP Veno has been widely deployed in wireless
networks to address this challenge. TCP Veno has been demonstrated to showbetter performance than TCP Reno in wired-cum-wireless environments.However, TCP Veno does not take into consideration the effects of channel noiseand interference on packet losses, which impacts the accuracy of TCP Veno’spacket loss identification and thereby causes underutilization of bandwidth inlightly-loaded networks. In this paper, we propose TCP Venoplus which containstwo refinements to improve the performance of TCP Veno in lightly-loadednetworks. The first refinement incorporates a new variable, congestion losswindow, into TCP Veno. This new variable will aid TCP Veno in proper utilizationof bandwidth in presence of lightly-loaded traffic. The second refinement involvesprocuring power level of received packet from the MAC layer to aid in better
detection of random losses. The simulation results demonstrate that, the tworefinements in TCP Venoplus can significantly improve Veno’s throughput withaccurate packet loss identification and without compromising fairness.Keywords – Transmission Control Protocol (TCP), System-on-Chip (SoC), congestion control, packet loss
differentiation
8/8/2019 IJCN v1 i1
http://slidepdf.com/reader/full/ijcn-v1-i1 80/89
Sachin Shetty, Ying Tang & William Collani
International Journal of Computer Networks (IJCN), Volume (1): Issue (1) 37
1. INTRODUCTION
In recent times, communication networks have evolved greatly. Packet switching technologieshave successfully merged the traditional voice networks and data networks into a converged andintegrated multimedia network. This converged integrated network has been extended toincorporate varied flavors of wireless technologies. Transmission control protocol (TCP) hasbecome the dominant communication protocol suite in almost all the Internet application for
reliable data transfer services [1]. The great success of TCP is due to its end-to-end congestioncontrol scheme, which is designed for fairness and friendliness with respect to coexistent TCPflows.
With the proliferation of mobile computing in recent years, more and more devices arecommunicating through wireless links. These links are often characterized by high random biterror rates (BER) due to channel fading or noise, and intermittent connectivity due to handoffs.Therefore, network protocols, originally designed for wired networks, have to be adapted for suchlossy environment. Nowadays, about 90% of the Internet traffics are carried by TCP. TCP needsto depart from its original wired network oriented design and evolve to meet the challengesintroduced by the wireless portion of the network. Transmission Control Protocol (TCP) hasbecome the dominant communication suite in today’s networking applications. TCP was designedideally for wired network with low BER, where congestion is the primary source of packet losses.
Although TCP was initially designed and optimized for wired networks, the growing popularity ofwireless data applications has lead wireless networks such as WLAN to extend TCP to wirelesscommunications as well. The initial objective of TCP was to efficiently use the availablebandwidth in the network and to avoid overloading the network (and the resulting packet losses)by appropriately throttling the senders’ transmission rates. Network congestion is deemed to bethe underlying reason for packet losses [3]. Consequently, TCP performance is oftenunsatisfactory when used in wireless networks and requires various improvement techniques [2],[8], [9], [10], [12]. When applied to the wireless environment in which packet losses are ofteninduced by noise, link errors, and reasons other than network congestion (random errors), TCPcongestion control and avoidance mechanism [6] becomes incapable of dealing with the mixedpacket losses. In fact, when a random loss occurs, TCP actually backs down the sending rate toreduce, what it perceives as, congestion in the network [4], resulting in significant performancedegradation. There are three key factors responsible for the unsatisfactory performance of TCPin wireless networks. The first factor is that the radio link quality in wireless networks can fluctuategreatly in time due to channel fading and user mobility, leading to a high packet loss which is non-congestion loss[4][5][6]. The second factor is variability of transmission time and delay [7]. Finally,the third factor is high delay variability caused by radio link quality in wireless networks. A form ofhigh delay variability, referred to as delay spike, is a sudden, drastic increase in delay for aparticular packet or a few consecutive packets, relative to the delay for the preceding andfollowing packets.
TCP’s congestion control scheme is based on the fundamental premise that packet loss is anindicator for network congestion. Therefore, TCP senders react to packet loss by reducing itssending throughput. However, this premise is inaccurate as increasing number of wireless linksare integrated into the Internet. Packet losses in wireless links are overwhelmingly caused due tobit errors, instead of buffer overflow at routers [2], [14], [15], [16]. This cause of packet loss due tobit errors has been largely ignored by TCP without any pertinent refinement. The result of such
failure is that TCP will ”blindly” scale back its sending rate upon packet losses with identicalpenalty, regardless of the reason of loss occurrence. So, TCP will suffer unnecessaryperformance degradation.
In recent years, different schemes have been proposed to aid TCP in distinguishing congestionlosses from bit errors. We present the details of these schemes in the next Section. To provide anend-to-end congestion control a sender-side variation of TCP Reno, TCP Veno [2] wasdeveloped. Veno purely uses the information available at the sender to make decisions regardingthe types of losses. The detection of packet losses is obtained from estimated congestion
8/8/2019 IJCN v1 i1
http://slidepdf.com/reader/full/ijcn-v1-i1 81/89
Sachin Shetty, Ying Tang & William Collani
International Journal of Computer Networks (IJCN), Volume (1): Issue (1) 38
information. A threshold value β is used to make the decision. If the estimated congestion level inthe network exceeds the value of β, the packet loss is detected as a congestion loss; else it isclassified as a loss due to random errors. In case of a random loss, the congestion window isreduced by a factor of 1/5, instead of halving the congestion window [2]. Therefore, if theestimated congestion information is accurate, the packet losses will be accurately detected at alltimes.
But TCP Veno has been demonstrated to not perform effectively in certain network scenarios. In[13], it has been shown that due to some uncertainties in network the actual network state couldbe associated with an irrelevant packet loss; or a packet loss is linked with the network state thatis mistakenly estimated. These factors imply that the loss due to transient congestion is also afactor which can influence the prediction of packet losses. In [14], the authors claimed that thetransient congestion period occurs so fast that a corresponding packet loss looks just like anepisode of wireless loss. In presence of bursty traffic, it has been shown that Veno’s packet lossidentification scheme is not very accurate [15]. More recently, it has been demonstrated thatVeno suffers from server bandwidth under utilization when operating under lightly loaded wirelessnetworks [16].
In recent times, with the rapid progress of deep submicron technology, System-on-Chip (SoC)has revolutionized the design of Integrated Circuits, allowing all components of a computer or
other electronic system into a single integrated circuit (i.e., chip). One of the applications innetworking is offloading TCP/IP processing into an embedded device called TCP Offload Engine(TOE). TOE provides an emerging solution to release communication systems from burdenedconventional TCP/IP stack, and significantly improves the network utilization [11]. Modern serverswith multi-processor and multi-core architectures are now equipped with TOE to boost throughputand reduce CPU overload. The advent of SoC technology further opens a new venue for cross-layer design in wireless networking since the traditional layered architecture served well for wirednetworks is not suitable for wireless networks. More specifically, the integration of all layers ofnetworking into a single chip presents the following two advantages: (1) the impact of breakingend-to-end network semantics is negligible; and (2) the implementation of cross-layercommunication becomes easier.
Motivated by these observations, this paper addresses the aforementioned two problems
together to improve TCP performance in both lightly and heavily loaded wireless networks. In thispaper, we propose TCP Venoplus which incorporates two refinements in the TCP Veno scheme.The two refinements improve the congestion state measurement in Veno. By taking advantagesof SoC technologies, Venoplus uses received signal strength information (RSSI) to compute BERand duplicate acknowledgements and timeouts to estimate congestion loss. The refinements inVenoplus are on the same line as the enhancedVeno scheme proposed in [16]. Enhanced Venodescribes a scheme to distinguish congestion losses from random losses for lightly-loadedwireless networks. But enhancedVeno assumes that the nature of random errors in the link isknown a priori . This is not practical in most wireless communication links due to the randomnessassociated with noise and interference sources. Venoplus differs from enhancedVeno byincorporating cross-layer functionality to compute random losses. The cross-layer property allowsthe TCP layer to learn RSSI for every received packet from the MAC layer.
Two new variables, congestion loss window and random loss rate are added to TCP Veno. Thecongestion loss window variable aids TCP Veno in improving bandwidth utilization withoutcompromising fairness. The random loss rate variable incorporates the information procured fromBER to signify the number of packet losses due to random errors. The computation of the randomloss rate involves the implementation of cross-layer functionality. As stated earlier, theimplementation complexity in terms of cross-layer communication becomes negligible with recentSoC advancements. Extensive simulations demonstrate that the throughput and accuratedetection of congestion and random losses are much improved than TCP Veno. We alsoobserved that Venoplus yields better fairness in presence of competing TCP connections.
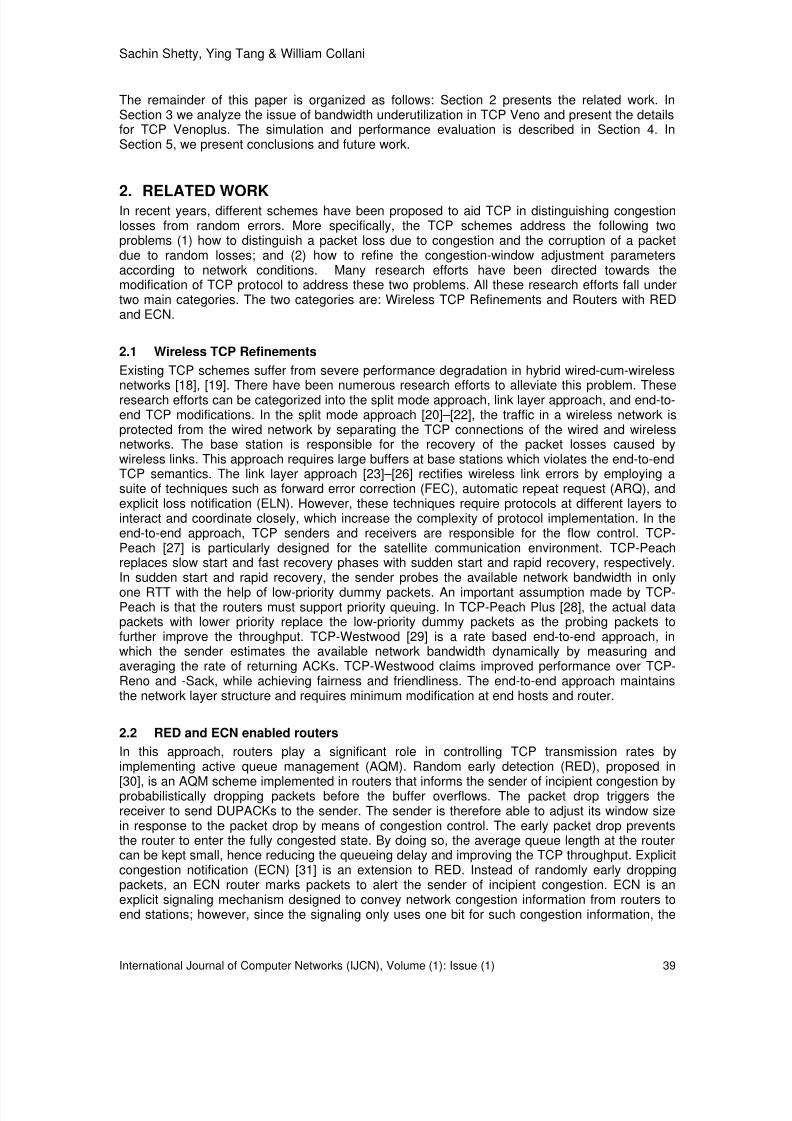
8/8/2019 IJCN v1 i1
http://slidepdf.com/reader/full/ijcn-v1-i1 82/89
Sachin Shetty, Ying Tang & William Collani
International Journal of Computer Networks (IJCN), Volume (1): Issue (1) 39
The remainder of this paper is organized as follows: Section 2 presents the related work. InSection 3 we analyze the issue of bandwidth underutilization in TCP Veno and present the detailsfor TCP Venoplus. The simulation and performance evaluation is described in Section 4. InSection 5, we present conclusions and future work.
2. RELATED WORK In recent years, different schemes have been proposed to aid TCP in distinguishing congestionlosses from random errors. More specifically, the TCP schemes address the following twoproblems (1) how to distinguish a packet loss due to congestion and the corruption of a packetdue to random losses; and (2) how to refine the congestion-window adjustment parametersaccording to network conditions. Many research efforts have been directed towards themodification of TCP protocol to address these two problems. All these research efforts fall undertwo main categories. The two categories are: Wireless TCP Refinements and Routers with REDand ECN.
2.1 Wireless TCP Refinements
Existing TCP schemes suffer from severe performance degradation in hybrid wired-cum-wirelessnetworks [18], [19]. There have been numerous research efforts to alleviate this problem. Theseresearch efforts can be categorized into the split mode approach, link layer approach, and end-to-end TCP modifications. In the split mode approach [20]–[22], the traffic in a wireless network isprotected from the wired network by separating the TCP connections of the wired and wirelessnetworks. The base station is responsible for the recovery of the packet losses caused bywireless links. This approach requires large buffers at base stations which violates the end-to-endTCP semantics. The link layer approach [23]–[26] rectifies wireless link errors by employing asuite of techniques such as forward error correction (FEC), automatic repeat request (ARQ), andexplicit loss notification (ELN). However, these techniques require protocols at different layers tointeract and coordinate closely, which increase the complexity of protocol implementation. In theend-to-end approach, TCP senders and receivers are responsible for the flow control. TCP-Peach [27] is particularly designed for the satellite communication environment. TCP-Peachreplaces slow start and fast recovery phases with sudden start and rapid recovery, respectively.In sudden start and rapid recovery, the sender probes the available network bandwidth in only
one RTT with the help of low-priority dummy packets. An important assumption made by TCP-Peach is that the routers must support priority queuing. In TCP-Peach Plus [28], the actual datapackets with lower priority replace the low-priority dummy packets as the probing packets tofurther improve the throughput. TCP-Westwood [29] is a rate based end-to-end approach, inwhich the sender estimates the available network bandwidth dynamically by measuring andaveraging the rate of returning ACKs. TCP-Westwood claims improved performance over TCP-Reno and -Sack, while achieving fairness and friendliness. The end-to-end approach maintainsthe network layer structure and requires minimum modification at end hosts and router.
2.2 RED and ECN enabled routers
In this approach, routers play a significant role in controlling TCP transmission rates byimplementing active queue management (AQM). Random early detection (RED), proposed in
[30], is an AQM scheme implemented in routers that informs the sender of incipient congestion byprobabilistically dropping packets before the buffer overflows. The packet drop triggers thereceiver to send DUPACKs to the sender. The sender is therefore able to adjust its window sizein response to the packet drop by means of congestion control. The early packet drop preventsthe router to enter the fully congested state. By doing so, the average queue length at the routercan be kept small, hence reducing the queueing delay and improving the TCP throughput. Explicitcongestion notification (ECN) [31] is an extension to RED. Instead of randomly early droppingpackets, an ECN router marks packets to alert the sender of incipient congestion. ECN is anexplicit signaling mechanism designed to convey network congestion information from routers toend stations; however, since the signaling only uses one bit for such congestion information, the
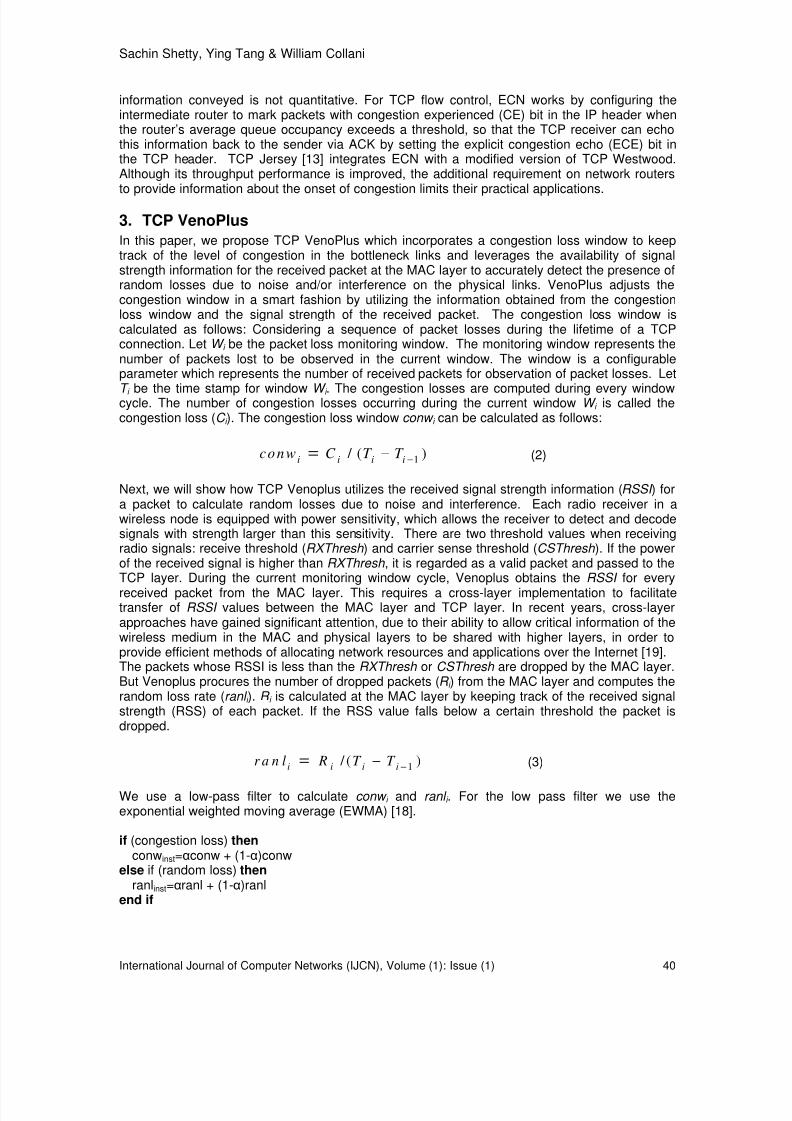
8/8/2019 IJCN v1 i1
http://slidepdf.com/reader/full/ijcn-v1-i1 83/89
Sachin Shetty, Ying Tang & William Collani
International Journal of Computer Networks (IJCN), Volume (1): Issue (1) 40
information conveyed is not quantitative. For TCP flow control, ECN works by configuring theintermediate router to mark packets with congestion experienced (CE) bit in the IP header whenthe router’s average queue occupancy exceeds a threshold, so that the TCP receiver can echothis information back to the sender via ACK by setting the explicit congestion echo (ECE) bit inthe TCP header. TCP Jersey [13] integrates ECN with a modified version of TCP Westwood.Although its throughput performance is improved, the additional requirement on network routersto provide information about the onset of congestion limits their practical applications.
3. TCP VenoPlus
In this paper, we propose TCP VenoPlus which incorporates a congestion loss window to keeptrack of the level of congestion in the bottleneck links and leverages the availability of signalstrength information for the received packet at the MAC layer to accurately detect the presence ofrandom losses due to noise and/or interference on the physical links. VenoPlus adjusts thecongestion window in a smart fashion by utilizing the information obtained from the congestionloss window and the signal strength of the received packet. The congestion loss window iscalculated as follows: Considering a sequence of packet losses during the lifetime of a TCPconnection. Let W i be the packet loss monitoring window. The monitoring window represents thenumber of packets lost to be observed in the current window. The window is a configurableparameter which represents the number of received packets for observation of packet losses. Let
T i be the time stamp for window W i . The congestion losses are computed during every windowcycle. The number of congestion losses occurring during the current window W i is called thecongestion loss (C i ). The congestion loss window conw i can be calculated as follows:
1 / ( )i i i ico n w C T T
−−= (2)
Next, we will show how TCP Venoplus utilizes the received signal strength information (RSSI ) fora packet to calculate random losses due to noise and interference. Each radio receiver in awireless node is equipped with power sensitivity, which allows the receiver to detect and decodesignals with strength larger than this sensitivity. There are two threshold values when receivingradio signals: receive threshold (RXThresh ) and carrier sense threshold (CSThresh ). If the powerof the received signal is higher than RXThresh , it is regarded as a valid packet and passed to theTCP layer. During the current monitoring window cycle, Venoplus obtains the RSSI for every
received packet from the MAC layer. This requires a cross-layer implementation to facilitatetransfer of RSSI values between the MAC layer and TCP layer. In recent years, cross-layerapproaches have gained significant attention, due to their ability to allow critical information of thewireless medium in the MAC and physical layers to be shared with higher layers, in order toprovide efficient methods of allocating network resources and applications over the Internet [19].The packets whose RSSI is less than the RXThresh or CSThresh are dropped by the MAC layer.But Venoplus procures the number of dropped packets (R i ) from the MAC layer and computes therandom loss rate (ranl i ). R i is calculated at the MAC layer by keeping track of the received signalstrength (RSS) of each packet. If the RSS value falls below a certain threshold the packet isdropped.
1 / ( )
i i i ir a n l R T T
−−= (3)
We use a low-pass filter to calculate conw i and ranl i . For the low pass filter we use theexponential weighted moving average (EWMA) [18].
if (congestion loss) then conwinst=αconw + (1-α)conw
else if (random loss) then ranlinst=αranl + (1-α)ranl
end if

8/8/2019 IJCN v1 i1
http://slidepdf.com/reader/full/ijcn-v1-i1 84/89
Sachin Shetty, Ying Tang & William Collani
International Journal of Computer Networks (IJCN), Volume (1): Issue (1) 41
Figure 1 illustrates the process of computation of congestion loss window and random loss rates.The packet train is categorized into different windows during a given period of time. The valuesfor conw and ranl are calculated during every window. Having calculated the values for conw and ranl , we now present the packet loss identification scheme:
if (conw i > conw i-1 and ranl i > ranl i-1 ) then cwnd=cwnd x 1/2; { Packet losses due to congestion and random errors}
if (conw i < conw i-1 and ranl i > ranl i-1) then cwnd=cwnd x 4/5; { Packet losses due to random errors}
if (conw i > conw i-1 and ranl i < ranl i-1) then cwnd=cwnd x 1/2; { Packet losses due to congestion}
if (conw i < conw i-1 and ranl i < ranl i-1) then cwnd=cwnd ; { No packet losses}
The packet identification scheme illustrates four different scenarios which are summarized asfollows: 1) If conw i > conw i-1 and ranl i > ranl i-1, the network suffers from losses due to congestionand random errors in the link simultaneously. This situation requires slowing down thetransmission of packets which is reflected by the reduction of the congestion window by half. 2) Ifconw i < conw i-1 and ranl i > ranl i-1, the packet losses can be attributed to random errors in the linkonly. The congestion window is cut down by 1/5. 3) If conw i > conw i-1 and ranl i < ranl i-1, the
packet losses can be attributed to congestion losses in the network. The congestion window isnow cut down by 1/2. 4) Finally, if conw i < conw i-1 and ranl i < ranl i-1, the congestion in the networkand the random errors in the link are not getting worse, which means that the congestion windowremains unchanged.
Figure 1: Computation of congestion loss window and random loss rate.
4. SIMULATION & EVALUATION
In this section, we will evaluate the following performance metrics of VenoPlus as compared to
Veno: throughput, and fairness. The comparison will be performed with varied number of nodesand random loss rates.
4.1 Simulation Model
We use network simulator ns-2 to conduct the simulations. Figure 2 illustrates the heterogeneouswired-cum-wireless topology. The wired nodes represent the source of traffic and the wirelessnodes represent the sinks. The wired links between R2 and the traffic sources are set with 10Mbps bandwidth, 0.1 ms roundtrip time and buffer size of 50 packets. The wireless links betweenR1 and the traffic sink are set with 10Mbps bandwidth, 0.1 ms round-trip time, and buffer size of
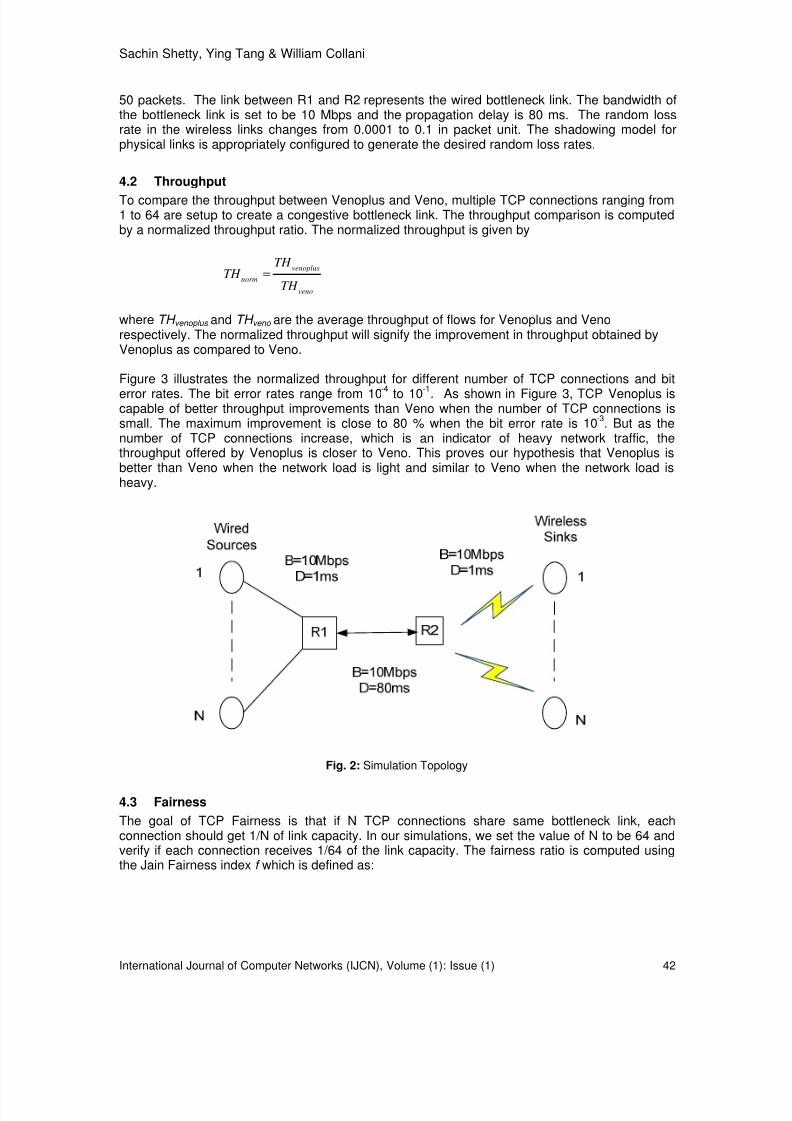
8/8/2019 IJCN v1 i1
http://slidepdf.com/reader/full/ijcn-v1-i1 85/89
Sachin Shetty, Ying Tang & William Collani
International Journal of Computer Networks (IJCN), Volume (1): Issue (1) 42
50 packets. The link between R1 and R2 represents the wired bottleneck link. The bandwidth ofthe bottleneck link is set to be 10 Mbps and the propagation delay is 80 ms. The random lossrate in the wireless links changes from 0.0001 to 0.1 in packet unit. The shadowing model forphysical links is appropriately configured to generate the desired random loss rates.
4.2 Throughput
To compare the throughput between Venoplus and Veno, multiple TCP connections ranging from1 to 64 are setup to create a congestive bottleneck link. The throughput comparison is computedby a normalized throughput ratio. The normalized throughput is given by
venoplus
norm
veno
TH TH
TH =
where TH venoplus and TH veno are the average throughput of flows for Venoplus and Venorespectively. The normalized throughput will signify the improvement in throughput obtained byVenoplus as compared to Veno.
Figure 3 illustrates the normalized throughput for different number of TCP connections and bit
error rates. The bit error rates range from 10-4 to 10-1. As shown in Figure 3, TCP Venoplus iscapable of better throughput improvements than Veno when the number of TCP connections issmall. The maximum improvement is close to 80 % when the bit error rate is 10
-3. But as the
number of TCP connections increase, which is an indicator of heavy network traffic, thethroughput offered by Venoplus is closer to Veno. This proves our hypothesis that Venoplus isbetter than Veno when the network load is light and similar to Veno when the network load isheavy.
Fig. 2: Simulation Topology
4.3 Fairness
The goal of TCP Fairness is that if N TCP connections share same bottleneck link, eachconnection should get 1/N of link capacity. In our simulations, we set the value of N to be 64 andverify if each connection receives 1/64 of the link capacity. The fairness ratio is computed usingthe Jain Fairness index f which is defined as:

8/8/2019 IJCN v1 i1
http://slidepdf.com/reader/full/ijcn-v1-i1 86/89
Sachin Shetty, Ying Tang & William Collani
International Journal of Computer Networks (IJCN), Volume (1): Issue (1) 43
( )2
1
2
1
n
ii
n
ii
th
f
n th
=
=
∑
=
∑
where, n is the number of TCP connections, th i is the throughput for the i th connection. The goalof TCP fairness is then to ensure that the value of f is closer to 1. Figure 4 illustrates the fairnessratio for Venoplus. The fairness ratio is close to 1 from light traffic to heavy traffic and for low biterror rate to high bit error rate. This proves that Venoplus is capable of providing betterthroughput without compromising fairness.
1
1.2
1.4
1.6
1.8
2
10 20 30 40 50 60
N o r m a l i z e d T h r o u g h p u t
Number of Connections
0.0001
0.001
0.01
0.1
Figure 3: Throughput improvement of Venoplus in presence of different bit error rates and TCPconnections.
0
0.2
0.4
0.6
0.8
1
1.2
1.4
10 20 30 40 50 60
F a i r n e s s R a t i o
Number of Connections
0.00010.0010.01
0.1
Figure 4: Fairness index of Venoplus
8/8/2019 IJCN v1 i1
http://slidepdf.com/reader/full/ijcn-v1-i1 87/89
Sachin Shetty, Ying Tang & William Collani
International Journal of Computer Networks (IJCN), Volume (1): Issue (1) 44
5. CONCLUSION & FUTURE WORK
TCP schemes have to adapt to the changing trends in modern networks. In this paper weaddress the problems with existing TCP schemes to accurately detect the reason for packetlosses. We highlight the performance issues for TCP Veno in presence of bursty congestion andlightly loaded wireless networks. We propose TCP Venoplus which incorporates two refinementsto TCP Veno to alleviate the performance degradation in lightly loaded wireless networks.
Simulations results demonstrate that Venoplus can improve the accuracy of congestion lossidentification in Veno in presence of light traffic. Venoplus provides significant improvement inthroughput over Veno without sacrificing fairness.
For future work, we plan to extend the simulations to include bursty traffic and evaluate theperformance of Venoplus in presence of transient congestion. We also plan to incorporateVenoplus in the TCP/IP suite of a Xilinx Virtex-II Pro FPGA and perform experimentalevaluations.
6. ACKNOWLEDGEMENT
This work was supported in part by the National Science Foundation under award number DUE-0633512. Any opinions, findings and conclusions or recommendations expressed in this material
are those of the authors and do not necessarily reflect those of the National Science Foundation.
7. REFERENCES
1. W. Richard Stevens, “TCP/IP Illustrated,” Addison-Wesley 1994.2. C. P. Fu and S. C. Liew. “TCP Veno: TCP Enhancement for Transmission Over wireless
Access Networks,” IEEE Journal on Selected Areas in Communication, February 2003.3. V. Jacobson, "Congestion avoidance and control," SIGCOMM 88, ACM, Aug. 19884. C. L. Zhang, C. P. Fu, M. T. Yap, C. H. Foh, K. K. Wong, C. T. Lau, and E. M. K. Lai,
“Dynamics comparison of TCP Reno and Veno,” in Proc. IEEE Globecom 2004.
5. C. P. Fu, W. Lu, and B. S. Lee, “TCP Veno revisited,” in Proc. IEEE Globecom 2003.6. Y. Tian, K. Xu, and N. Ansari. “TCP in Wireless Environments: Problems and Solutions,”IEEE Radio Communications Magazine, March 2005.
7. A. Gurtov, “Effect of Delays on TCP Performance,” Proc of IFIP Personal WirelessCommun., Aug. 2001.
8. Balakrishnan, H., Padmanabhan, V. N., Seshan, S., and Katz, R. H., “A Comparison ofMechanisms for Improving TCP Performance over Lossy Links,” IEEE/ACM Transactions on Networking , Dec 1997
9. Balan, R.K.; Lee, B.P.; Kumar, K.R.R.; Jacob, L.; Seah, W. K. G., Ananda, A.L., “TCPHACK: TCP header checksum option to improve performance over lossy links,”Proceedings of Twentieth Annual Joint Conference of the IEEE Computer and Communications Societies , pp. 309-318, 2001.
10. Comer, Douglas E. (2006). Internetworking with TCP/IP (5E ed.). Prentice Hall: UpperSaddle River, NJ.
11. Chung, S. M., Li, C. Y., Lee, H. H., Li, L. H., Tsai, Y. C. and Chen, C. C., “Design andimplementation of the high speed TCP/IP Offload Engine,” Proceedings of IEEE International Symposium on Communications and Information Technologies, Oct. 17-19,2007, pp. 574-579.
12. Krishnan, R., Allman, R. M., Partridge, C. and Sterbenz, J. P. G., “Explicit Transport ErrorNotification for Error-Prone Wireless and Satellite Networks,” BBN Technical Report No.8333, BBN Technologies, Feb. 2002.
13. Xu, K., Tian, Y. and Ansari, N., “TCP-Jersey for Wireless IP Communications,” IEEE Journal on Selected Areas in Communications , Vol. 22, No. 4, 2004, pp. 747-756.

8/8/2019 IJCN v1 i1
http://slidepdf.com/reader/full/ijcn-v1-i1 88/89
Sachin Shetty, Ying Tang & William Collani
International Journal of Computer Networks (IJCN), Volume (1): Issue (1) 45
14. L. Brakmo, S. O’Malley, and L. Peterson. “TCP Vegas: new techniques for congestiondetection and avoidance,” SIGCOMM, ACM, 1994.
15. Z. Zou, C. Fu, B. Lee, "A refinement to improve TCP Veno performance under burstycongestion," in Proc. IEEE Globecom 2005.
16. B. Zhou, C. Fu, K. Zhang, C. Lau, C. Foh, "An enhancement of TCP Veno over light-loadwireless networks," IEEE Communication Letters, 2006.
17. S. Shakkottai, T. S. Rappaport and P. C. Karlsson ,“Cross-layer Design for WirelessNetworks,”, IEEE Communications magazine, October, 2003.
18. T. V. Lakshman and U. Madhow, “The performance of TCP/IP for networks with highbandwidth-delay products and random loss,” IEEE/ACM Trans. Networking , vol. 5, pp.336–350, June 1997.
19. F. Lefevre and G. Vivier, “Understanding TCP’s behavior over wireless links,” in Proc.Communications Vehicular Technology , 2000, SCVT-2000, pp. 123–130.
20. V. Tsaoussidis and I. Matta, “Open issues on TCP for mobile computing,” J. Wireless Commun. Mobile Computi., vol. 2, no. 1, pp. 3–20, Feb. 2002.
21. A. Bakre and B. R. Badrinath, “I-TCP: Indirect TCP for mobile hosts,” in Proc. ICDCS 95 ,May 1995, pp. 136–143.
22. K. Wang and S. K. Tripathi, “Mobile-end transport protocol: An alternative to TCP/IP overwireless links,” in IEEE INFOCOM , vol. 3, Mar. 1998, pp. 1046–1053.
23. H. Balakrishnan, S. Seshan, and R. H. Katz, “Improving reliable transport and handoff
performance in cellular wireless networks,” ACM/Baltzer Wireless Networks J., vol. 1, no.4, pp. 469–481, Dec. 1995.
24. S. Keshav and S. Morgan, “SMART retransmission: Performance with overload andrandom losses,” in Proc. IEEE INFOCOM’97, vol. 3, 1997, pp. 1131–1138.
25. K. Ratnam and I. Matta, “WTCP: An efficient mechanism for improving TCP performanceover wireless links,” in Proc. Int Symp. Computers Communications, 1998, pp. 74–78.
26. H. Balakrishnan and R. H. Katz, “Explicit loss notification and wireless web performance,”in Proc. IEEE GLOBECOM Internet Mini-Conf., Sydney, Australia, Nov. 1998.
27. I. F. Akyildiz, G. Morabito, and S. Palazzo, “TCP-Peach: A new congestion controlscheme for satellite IP networks,” IEEE/ACM Trans. Networking, vol. 9, pp. 307–321,June 2001
28. I. F. Akyildiz, X. Zhang, and J. Fang, “TCP-Peach+: Enhancement of TCP-Peach forsatellite IP networks,” IEEE Commun. Lett., vol. 6, pp. 303–305, July 2002.
29. Casetti, M. Gerla, S. Mascolo, M. Y. Sanadidi, and R. Wang, “TCP Westwood: Bandwidthestimation for enhanced transport over wireless links,” ACM Mobicom , pp. 287–297, July2001.
30. S. Floyd and V. Jacobson, “Random early detection gateways for congestion avoidance,”IEEE/ACM Trans. Networking , vol. 1, pp. 397–413, Aug. 1993.
31. S. Floyd, “TCP and explicit congestion notification,” ACM Comput.Commun. Rev., vol.24, pp. 10–23, Oct. 1994.

8/8/2019 IJCN v1 i1
http://slidepdf.com/reader/full/ijcn-v1-i1 89/89