Embed Size (px)
Citation preview
COVID-19 and its Spatial Dimensions in India III
1. Introduction
3.1 State budgets were mostly presented
during February-March 2020, i.e., ahead of the
pandemic which has taken a more grievous toll in
some of the states relative to even some of the
most affected nations in the world1. A heartening
feature is that the case fatality rate2 in all the states,
except two, has been below the global average.
While a large part of the policy response has been
from the centre, mainly through its Aatma Nirbhar
Bharat Abhiyan package, states have also ramped
up health care, social services and containment
measures. The spatial and structural dimensions
of the pandemic are still unfolding.
3.2 No state or union territory in India has been
spared by the pandemic, with the sole exception
of Lakshadweep. The spread of infections has,
however, been disproportionate and varied; policy
responses and outcomes have also been diverse.
A meta-analysis of spatial studies shows that
the duration of the lockdown became a function
of the availability of healthcare resources and
accessibility to them across regions. Likewise,
regions with well-developed digitised infrastructure
and population could ensure faster and more
effective relief operations. Another dimension
of the health crisis is that lockdowns driven by
fast spreading contagion posed a formidable
challenge for spatial mobility of workers – inter-
and intra-state, and abroad – with implications for
regions dependent on migrant workers for labour
or remittances.
3.3 These spatial and structural dimensions
also have implications for the fisc on demographic
and epidemiological considerations. High
decentralisation in expenditure has been an
enabling factor in the policy response of states
– about 65 per cent of the total government
expenditure is at the state level, and more so in
the case of public health expenditure under which
states spend above 85 per cent of the general
government expenditure.
3.4 The rest of the Chapter is organised into
8 sections. Some stylised facts on the regional
dimensions of the COVID-19 outbreak in India are
documented in Section 2 against the backdrop
of a quick tour of the history of pandemics in
India. Structural health factors – demographics
and epidemiology; and healthcare systems – are
discussed in Section 3 and Section 4, respectively.
The regional dimensions of migration, employment
and micro, small and medium enterprises (MSMEs)
are examined in Section 5. Digitisation has
proved to be an important platform that provided
offsets to demand and intermediate business
transactions, as discussed in Section 6. The role
of third tier local governments in influencing the
effectiveness of the policy response is assessed
in Section 7. Section 8 deals with the implications
of the pandemic for states’ output during 2020-21.
Concluding observations are set out in Section 9.
2. COVID-19 in the States
3.5 History is replete with visitations of
pandemics in India. The ‘Black Death’ plague of
37
1 There are 12 nations with confirmed COVID-19 cases exceeding six lakh, while there are four Indian states with confirmed cases above that number as on October 12, 2020.
2 The number of confirmed deaths from disease as a ratio of diagnosed cases.
State Finances : A Study of Budgets of 2020-21
38
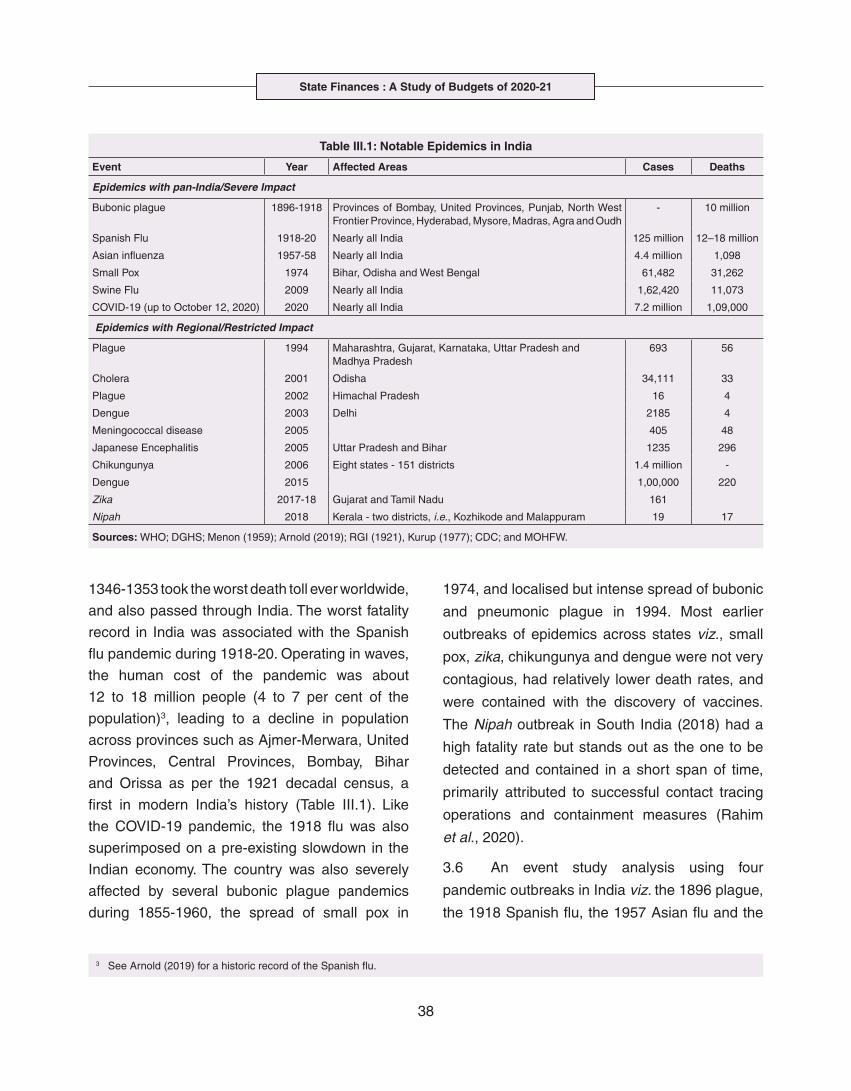
1346-1353 took the worst death toll ever worldwide,
and also passed through India. The worst fatality
record in India was associated with the Spanish
flu pandemic during 1918-20. Operating in waves,
the human cost of the pandemic was about
12 to 18 million people (4 to 7 per cent of the
population)3, leading to a decline in population
across provinces such as Ajmer-Merwara, United
Provinces, Central Provinces, Bombay, Bihar
and Orissa as per the 1921 decadal census, a
first in modern India’s history (Table III.1). Like
the COVID-19 pandemic, the 1918 flu was also
superimposed on a pre-existing slowdown in the
Indian economy. The country was also severely
affected by several bubonic plague pandemics
during 1855-1960, the spread of small pox in
1974, and localised but intense spread of bubonic
and pneumonic plague in 1994. Most earlier
outbreaks of epidemics across states viz., small
pox, zika, chikungunya and dengue were not very
contagious, had relatively lower death rates, and
were contained with the discovery of vaccines.
The Nipah outbreak in South India (2018) had a
high fatality rate but stands out as the one to be
detected and contained in a short span of time,
primarily attributed to successful contact tracing
operations and containment measures (Rahim
et al., 2020).
3.6 An event study analysis using four
pandemic outbreaks in India viz. the 1896 plague,
the 1918 Spanish flu, the 1957 Asian flu and the
Table III.1: Notable Epidemics in India
Event Year Affected Areas Cases Deaths
Epidemics with pan-India/Severe Impact
Bubonic plague 1896-1918 Provinces of Bombay, United Provinces, Punjab, North West Frontier Province, Hyderabad, Mysore, Madras, Agra and Oudh
- 10 million
Spanish Flu 1918-20 Nearly all India 125 million 12–18 million
Asian influenza 1957-58 Nearly all India 4.4 million 1,098
Small Pox 1974 Bihar, Odisha and West Bengal 61,482 31,262
Swine Flu 2009 Nearly all India 1,62,420 11,073
COVID-19 (up to October 12, 2020) 2020 Nearly all India 7.2 million 1,09,000
Epidemics with Regional/Restricted Impact
Plague 1994 Maharashtra, Gujarat, Karnataka, Uttar Pradesh and Madhya Pradesh
693 56
Cholera 2001 Odisha 34,111 33
Plague 2002 Himachal Pradesh 16 4
Dengue 2003 Delhi 2185 4
Meningococcal disease 2005 405 48
Japanese Encephalitis 2005 Uttar Pradesh and Bihar 1235 296
Chikungunya 2006 Eight states - 151 districts 1.4 million -
Dengue 2015 1,00,000 220
Zika 2017-18 Gujarat and Tamil Nadu 161
Nipah 2018 Kerala - two districts, i.e., Kozhikode and Malappuram 19 17
Sources: WHO; DGHS; Menon (1959); Arnold (2019); RGI (1921), Kurup (1977); CDC; and MOHFW.
3 See Arnold (2019) for a historic record of the Spanish flu.
COVID-19 and its Spatial Dimensions in India
39
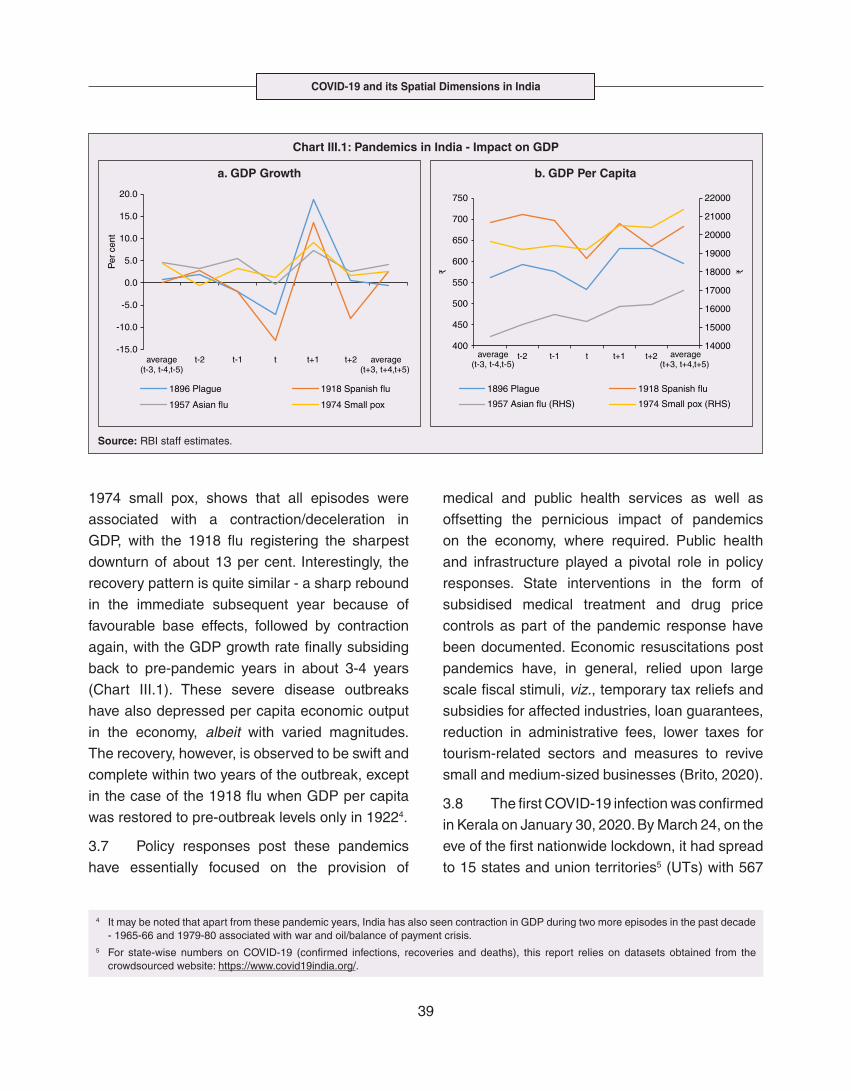
1974 small pox, shows that all episodes were
associated with a contraction/deceleration in
GDP, with the 1918 flu registering the sharpest
downturn of about 13 per cent. Interestingly, the
recovery pattern is quite similar - a sharp rebound
in the immediate subsequent year because of
favourable base effects, followed by contraction
again, with the GDP growth rate finally subsiding
back to pre-pandemic years in about 3-4 years
(Chart III.1). These severe disease outbreaks
have also depressed per capita economic output
in the economy, albeit with varied magnitudes.
The recovery, however, is observed to be swift and
complete within two years of the outbreak, except
in the case of the 1918 flu when GDP per capita
was restored to pre-outbreak levels only in 19224.
3.7 Policy responses post these pandemics
have essentially focused on the provision of
medical and public health services as well as
offsetting the pernicious impact of pandemics
on the economy, where required. Public health
and infrastructure played a pivotal role in policy
responses. State interventions in the form of
subsidised medical treatment and drug price
controls as part of the pandemic response have
been documented. Economic resuscitations post
pandemics have, in general, relied upon large
scale fiscal stimuli, viz., temporary tax reliefs and
subsidies for affected industries, loan guarantees,
reduction in administrative fees, lower taxes for
tourism-related sectors and measures to revive
small and medium-sized businesses (Brito, 2020).
3.8 The first COVID-19 infection was confirmed
in Kerala on January 30, 2020. By March 24, on the
eve of the first nationwide lockdown, it had spread
to 15 states and union territories5 (UTs) with 567
4 It may be noted that apart from these pandemic years, India has also seen contraction in GDP during two more episodes in the past decade - 1965-66 and 1979-80 associated with war and oil/balance of payment crisis.
5 For state-wise numbers on COVID-19 (confirmed infections, recoveries and deaths), this report relies on datasets obtained from the crowdsourced website: https://www.covid19india.org/.
Chart III.1: Pandemics in India - Impact on GDP
a. GDP Growth b. GDP Per Capita
Source: RBI staff estimates.
State Finances : A Study of Budgets of 2020-21
40
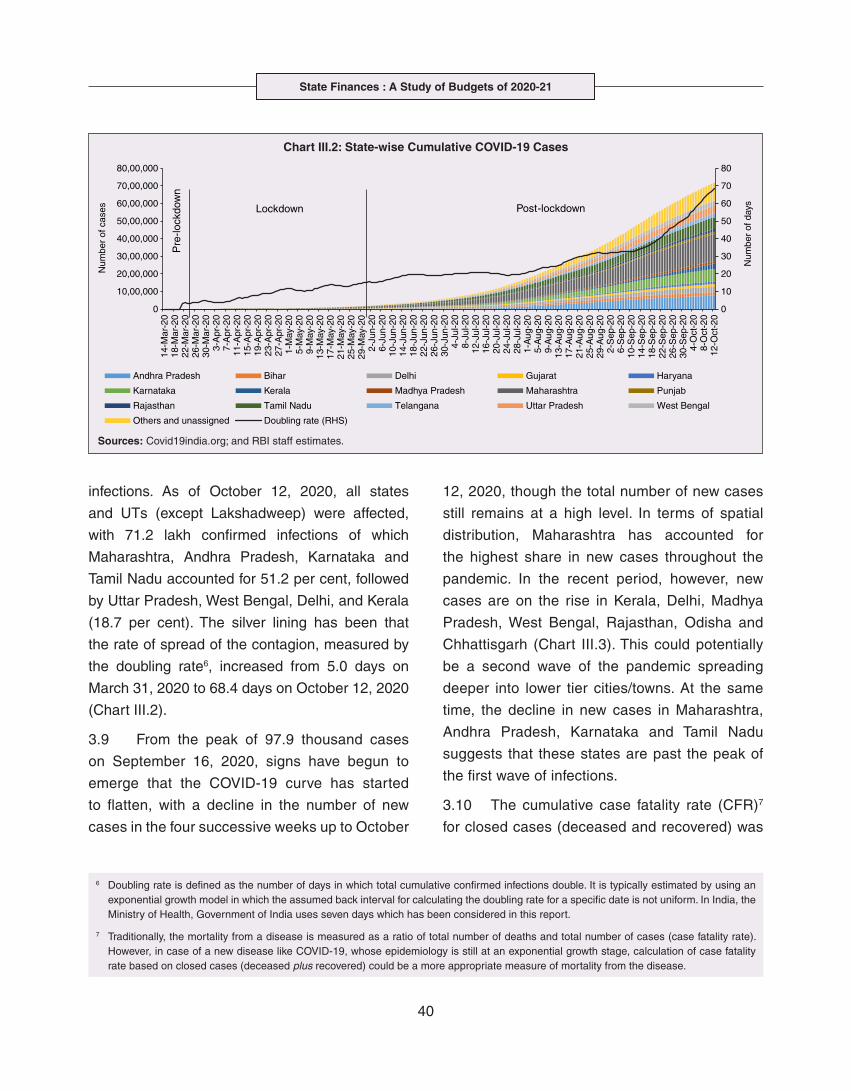
infections. As of October 12, 2020, all states
and UTs (except Lakshadweep) were affected,
with 71.2 lakh confirmed infections of which
Maharashtra, Andhra Pradesh, Karnataka and
Tamil Nadu accounted for 51.2 per cent, followed
by Uttar Pradesh, West Bengal, Delhi, and Kerala
(18.7 per cent). The silver lining has been that
the rate of spread of the contagion, measured by
the doubling rate6, increased from 5.0 days on
March 31, 2020 to 68.4 days on October 12, 2020
(Chart III.2).
3.9 From the peak of 97.9 thousand cases
on September 16, 2020, signs have begun to
emerge that the COVID-19 curve has started
to flatten, with a decline in the number of new
cases in the four successive weeks up to October
12, 2020, though the total number of new cases
still remains at a high level. In terms of spatial
distribution, Maharashtra has accounted for
the highest share in new cases throughout the
pandemic. In the recent period, however, new
cases are on the rise in Kerala, Delhi, Madhya
Pradesh, West Bengal, Rajasthan, Odisha and
Chhattisgarh (Chart III.3). This could potentially
be a second wave of the pandemic spreading
deeper into lower tier cities/towns. At the same
time, the decline in new cases in Maharashtra,
Andhra Pradesh, Karnataka and Tamil Nadu
suggests that these states are past the peak of
the first wave of infections.
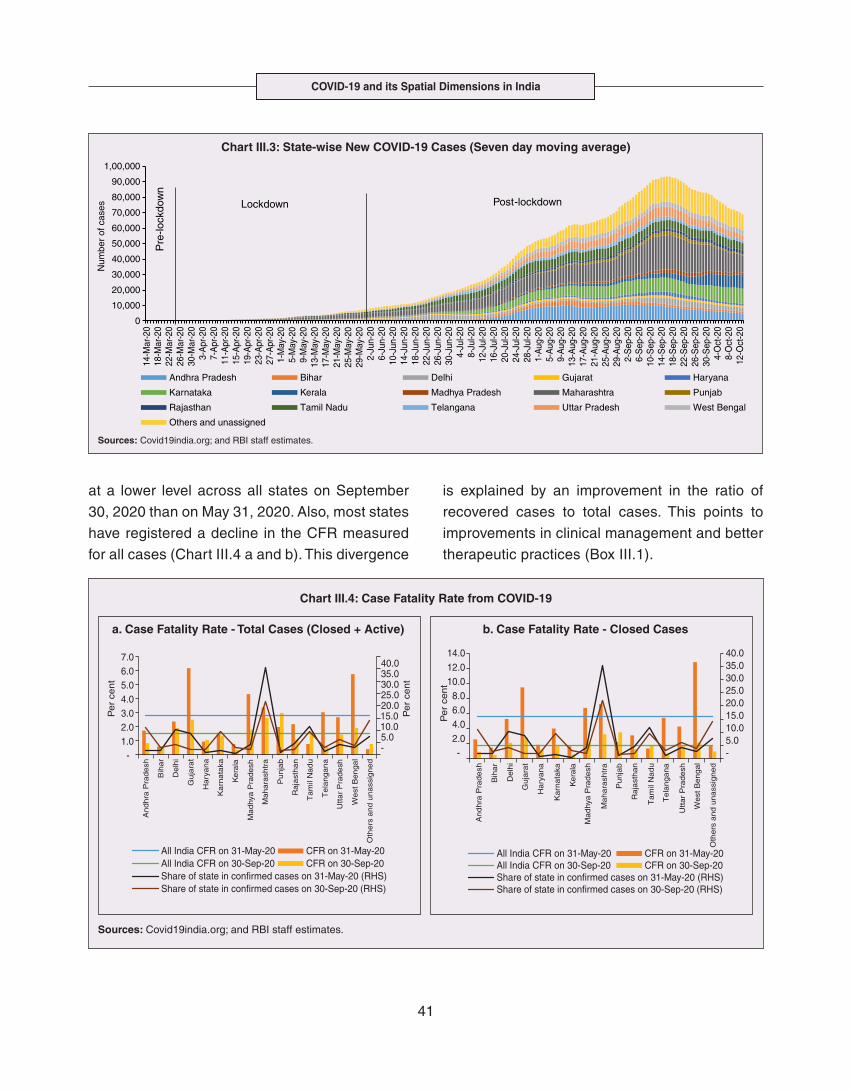
3.10 The cumulative case fatality rate (CFR)7
for closed cases (deceased and recovered) was
6 Doubling rate is defined as the number of days in which total cumulative confirmed infections double. It is typically estimated by using an exponential growth model in which the assumed back interval for calculating the doubling rate for a specific date is not uniform. In India, the Ministry of Health, Government of India uses seven days which has been considered in this report.
7 Traditionally, the mortality from a disease is measured as a ratio of total number of deaths and total number of cases (case fatality rate). However, in case of a new disease like COVID-19, whose epidemiology is still at an exponential growth stage, calculation of case fatality rate based on closed cases (deceased plus recovered) could be a more appropriate measure of mortality from the disease.
Chart III.2: State-wise Cumulative COVID-19 Cases
Sources: Covid19india.org; and RBI staff estimates.
COVID-19 and its Spatial Dimensions in India
41
at a lower level across all states on September
30, 2020 than on May 31, 2020. Also, most states
have registered a decline in the CFR measured
for all cases (Chart III.4 a and b). This divergence
is explained by an improvement in the ratio of
recovered cases to total cases. This points to
improvements in clinical management and better
therapeutic practices (Box III.1).
Chart III.3: State-wise New COVID-19 Cases (Seven day moving average)
Sources: Covid19india.org; and RBI staff estimates.
Chart III.4: Case Fatality Rate from COVID-19
a. Case Fatality Rate - Total Cases (Closed + Active) b. Case Fatality Rate - Closed Cases
Sources: Covid19india.org; and RBI staff estimates.
-5.010.015.020.025.030.035.040.0
-1.02.03.04.05.06.07.0
Andhra
Pra
desh
Bih
ar
Delh
i
Guja
rat
Hary
ana
Karn
ata
ka
Kera
la
Madhy
a P
radesh
Mahara
shtr
a
Punja
b
Raja
sthan
Tam
ilN
adu
Tela
ngana
Uttar
Pra
desh
West
Bengal
Oth
ers
and
unass
igned
Pe
r ce
nt
Pe
r ce
nt
CFR on 31-May-20CFR on 30-Sep-20
All India CFR on 31-May-20All India CFR on 30-Sep-20Share of state in confirmed cases on 31-May-20 (RHS)Share of state in confirmed cases on 30-Sep-20 (RHS)
-5.010.015.020.025.030.035.040.0
-2.04.06.08.0
10.012.014.0
Pe
r ce
nt
CFR on 31-May-20CFR on 30-Sep-20
All India CFR on 31-May-20All India CFR on 30-Sep-20Share of state in confirmed cases on 31-May-20 (RHS)Share of state in confirmed cases on 30-Sep-20 (RHS)
Andhra
Pra
desh
Bih
ar
Delh
i
Guja
rat
Hary
ana
Karn
ata
ka
Kera
la
Madhy
a P
radesh
Mahara
shtr
a
Punja
b
Raja
sthan
Tam
ilN
adu
Tela
ngana
Uttar
Pra
desh
West
Bengal
Oth
ers
and
unass
igned
State Finances : A Study of Budgets of 2020-21
42
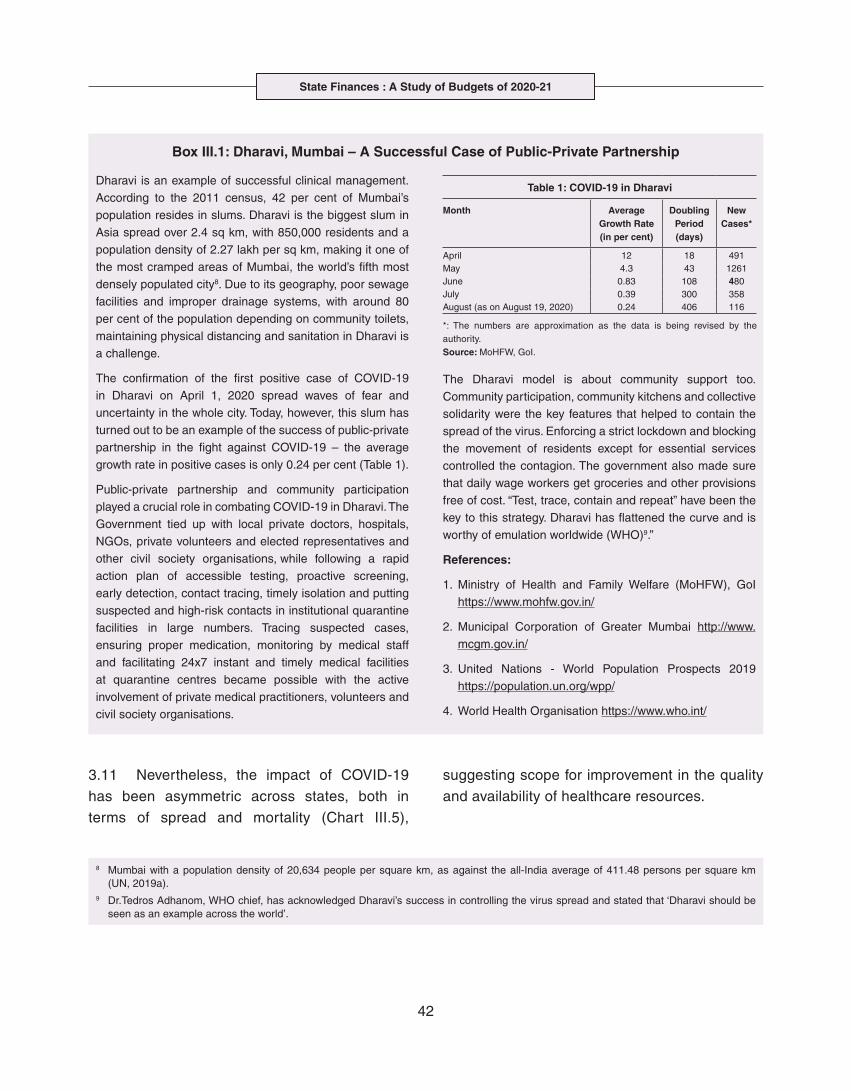
Box III.1: Dharavi, Mumbai – A Successful Case of Public-Private Partnership
Dharavi is an example of successful clinical management. According to the 2011 census, 42 per cent of Mumbai’s population resides in slums. Dharavi is the biggest slum in Asia spread over 2.4 sq km, with 850,000 residents and a population density of 2.27 lakh per sq km, making it one of the most cramped areas of Mumbai, the world’s fifth most densely populated city8. Due to its geography, poor sewage facilities and improper drainage systems, with around 80 per cent of the population depending on community toilets, maintaining physical distancing and sanitation in Dharavi is a challenge.
The confirmation of the first positive case of COVID-19 in Dharavi on April 1, 2020 spread waves of fear and uncertainty in the whole city. Today, however, this slum has turned out to be an example of the success of public-private partnership in the fight against COVID-19 – the average growth rate in positive cases is only 0.24 per cent (Table 1).
Public-private partnership and community participation played a crucial role in combating COVID-19 in Dharavi. The Government tied up with local private doctors, hospitals, NGOs, private volunteers and elected representatives and other civil society organisations, while following a rapid action plan of accessible testing, proactive screening, early detection, contact tracing, timely isolation and putting suspected and high-risk contacts in institutional quarantine facilities in large numbers. Tracing suspected cases, ensuring proper medication, monitoring by medical staff and facilitating 24x7 instant and timely medical facilities at quarantine centres became possible with the active involvement of private medical practitioners, volunteers and civil society organisations.
The Dharavi model is about community support too. Community participation, community kitchens and collective solidarity were the key features that helped to contain the spread of the virus. Enforcing a strict lockdown and blocking the movement of residents except for essential services controlled the contagion. The government also made sure that daily wage workers get groceries and other provisions free of cost. “Test, trace, contain and repeat” have been the key to this strategy. Dharavi has flattened the curve and is worthy of emulation worldwide (WHO)9.”
References:
1. Ministry of Health and Family Welfare (MoHFW), GoI https://www.mohfw.gov.in/
2. Municipal Corporation of Greater Mumbai http://www.mcgm.gov.in/
3. United Nations - World Population Prospects 2019 https://population.un.org/wpp/
4. World Health Organisation https://www.who.int/
Table 1: COVID-19 in Dharavi
Month Average Growth Rate (in per cent)
Doubling Period (days)
New Cases*
April 12 18 491May 4.3 43 1261June 0.83 108 480July 0.39 300 358August (as on August 19, 2020) 0.24 406 116
*: The numbers are approximation as the data is being revised by the authority.Source: MoHFW, GoI.
8 Mumbai with a population density of 20,634 people per square km, as against the all-India average of 411.48 persons per square km (UN, 2019a).
9 Dr.Tedros Adhanom, WHO chief, has acknowledged Dharavi’s success in controlling the virus spread and stated that ‘Dharavi should be seen as an example across the world’.
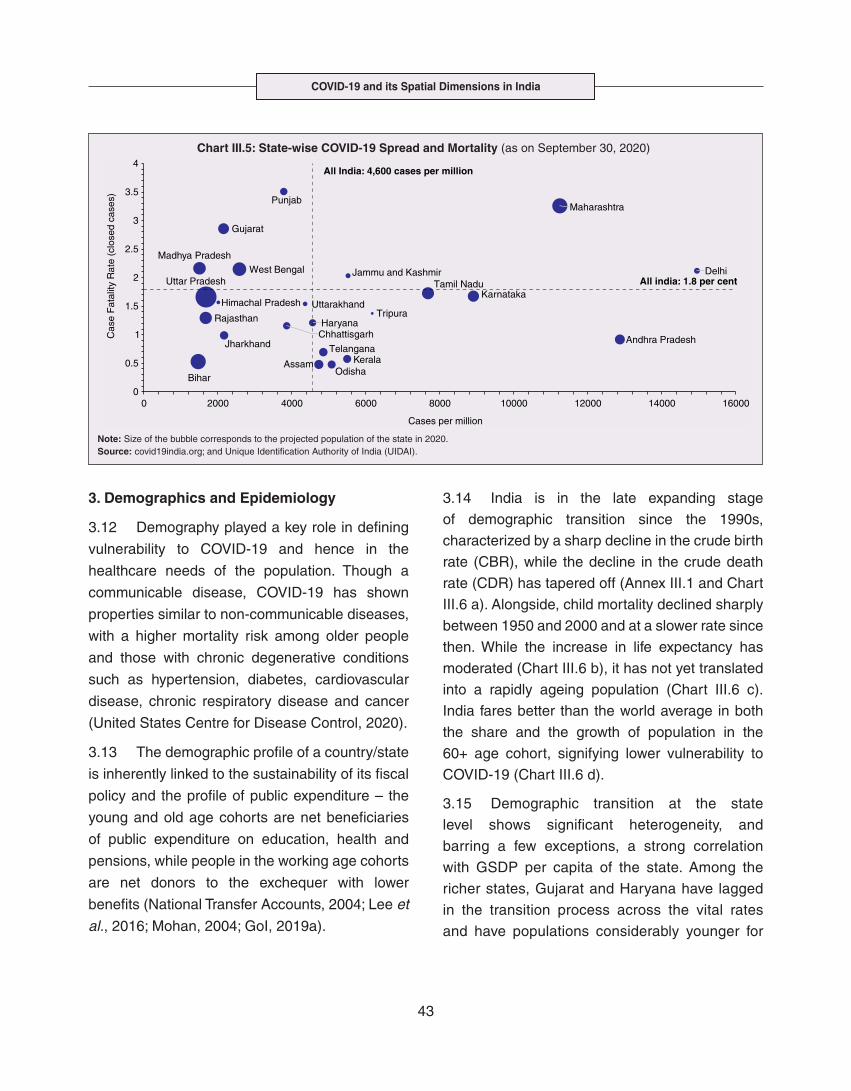
3.11 Nevertheless, the impact of COVID-19
has been asymmetric across states, both in
terms of spread and mortality (Chart III.5),
suggesting scope for improvement in the quality
and availability of healthcare resources.
COVID-19 and its Spatial Dimensions in India
43
3. Demographics and Epidemiology
3.12 Demography played a key role in defining
vulnerability to COVID-19 and hence in the
healthcare needs of the population. Though a
communicable disease, COVID-19 has shown
properties similar to non-communicable diseases,
with a higher mortality risk among older people
and those with chronic degenerative conditions
such as hypertension, diabetes, cardiovascular
disease, chronic respiratory disease and cancer
(United States Centre for Disease Control, 2020).
3.13 The demographic profile of a country/state
is inherently linked to the sustainability of its fiscal
policy and the profile of public expenditure – the
young and old age cohorts are net beneficiaries
of public expenditure on education, health and
pensions, while people in the working age cohorts
are net donors to the exchequer with lower
benefits (National Transfer Accounts, 2004; Lee et
al., 2016; Mohan, 2004; GoI, 2019a).
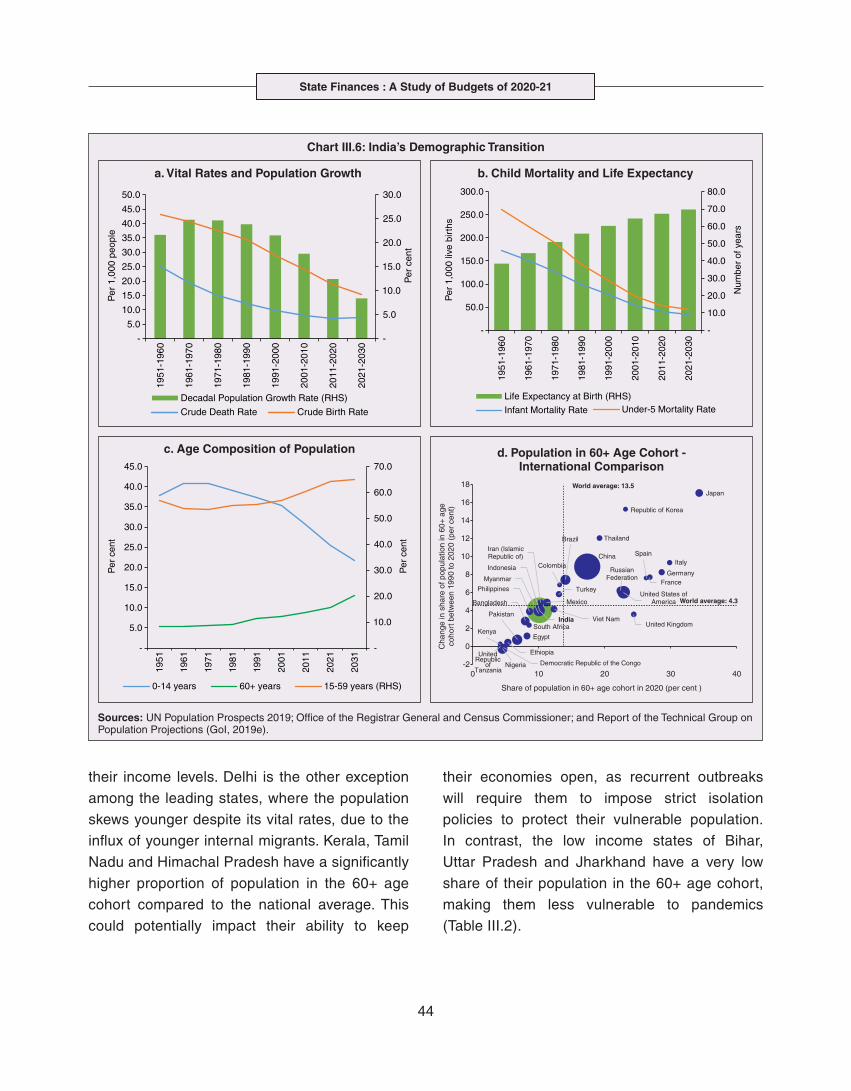
3.14 India is in the late expanding stage
of demographic transition since the 1990s,
characterized by a sharp decline in the crude birth
rate (CBR), while the decline in the crude death
rate (CDR) has tapered off (Annex III.1 and Chart
III.6 a). Alongside, child mortality declined sharply
between 1950 and 2000 and at a slower rate since
then. While the increase in life expectancy has
moderated (Chart III.6 b), it has not yet translated
into a rapidly ageing population (Chart III.6 c).
India fares better than the world average in both
the share and the growth of population in the
60+ age cohort, signifying lower vulnerability to
COVID-19 (Chart III.6 d).
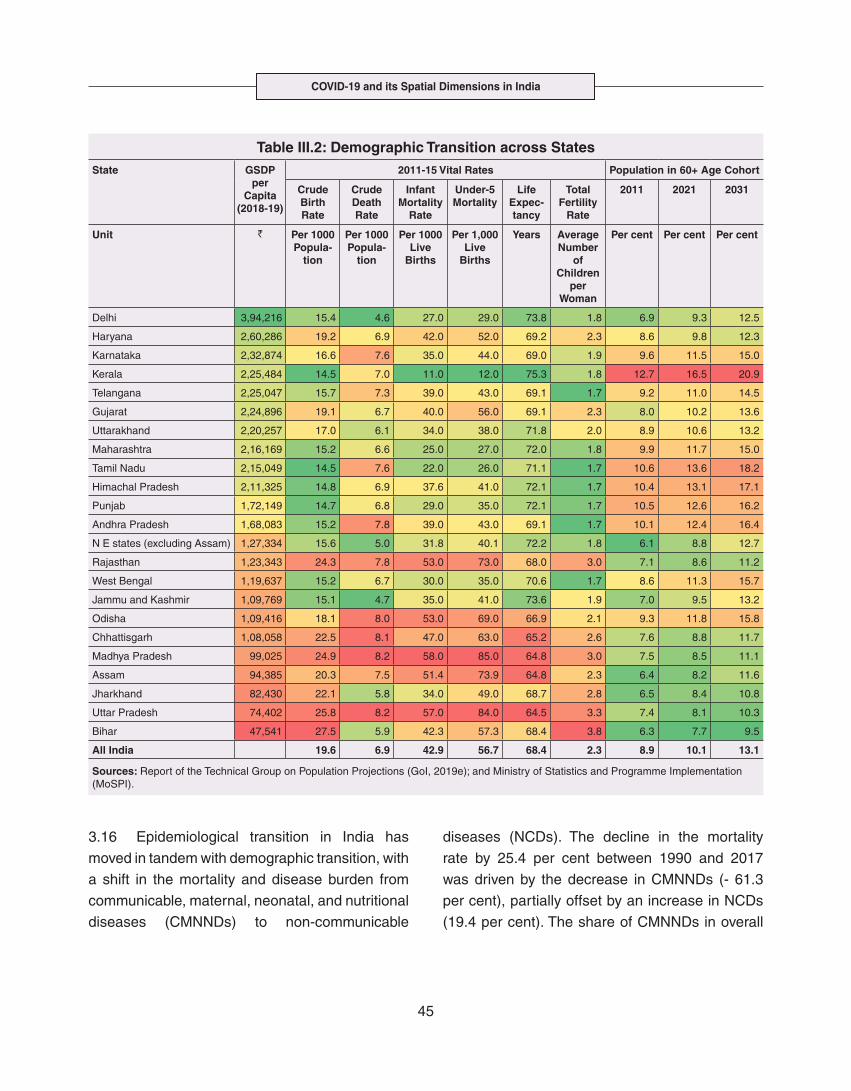
3.15 Demographic transition at the state
level shows significant heterogeneity, and
barring a few exceptions, a strong correlation
with GSDP per capita of the state. Among the
richer states, Gujarat and Haryana have lagged
in the transition process across the vital rates
and have populations considerably younger for
Chart III.5: State-wise COVID-19 Spread and Mortality (as on September 30, 2020)
Note: Size of the bubble corresponds to the projected population of the state in 2020.Source: covid19india.org; and Unique Identification Authority of India (UIDAI).
State Finances : A Study of Budgets of 2020-21
44
their income levels. Delhi is the other exception
among the leading states, where the population
skews younger despite its vital rates, due to the
influx of younger internal migrants. Kerala, Tamil
Nadu and Himachal Pradesh have a significantly
higher proportion of population in the 60+ age
cohort compared to the national average. This
could potentially impact their ability to keep
their economies open, as recurrent outbreaks
will require them to impose strict isolation
policies to protect their vulnerable population.
In contrast, the low income states of Bihar,
Uttar Pradesh and Jharkhand have a very low
share of their population in the 60+ age cohort,
making them less vulnerable to pandemics
(Table III.2).
Chart III.6: India’s Demographic Transition
a. Vital Rates and Population Growth b. Child Mortality and Life Expectancy
Sources: UN Population Prospects 2019; Office of the Registrar General and Census Commissioner; and Report of the Technical Group on Population Projections (GoI, 2019e).
c. Age Composition of Population d. Population in 60+ Age Cohort - International Comparison
COVID-19 and its Spatial Dimensions in India
45
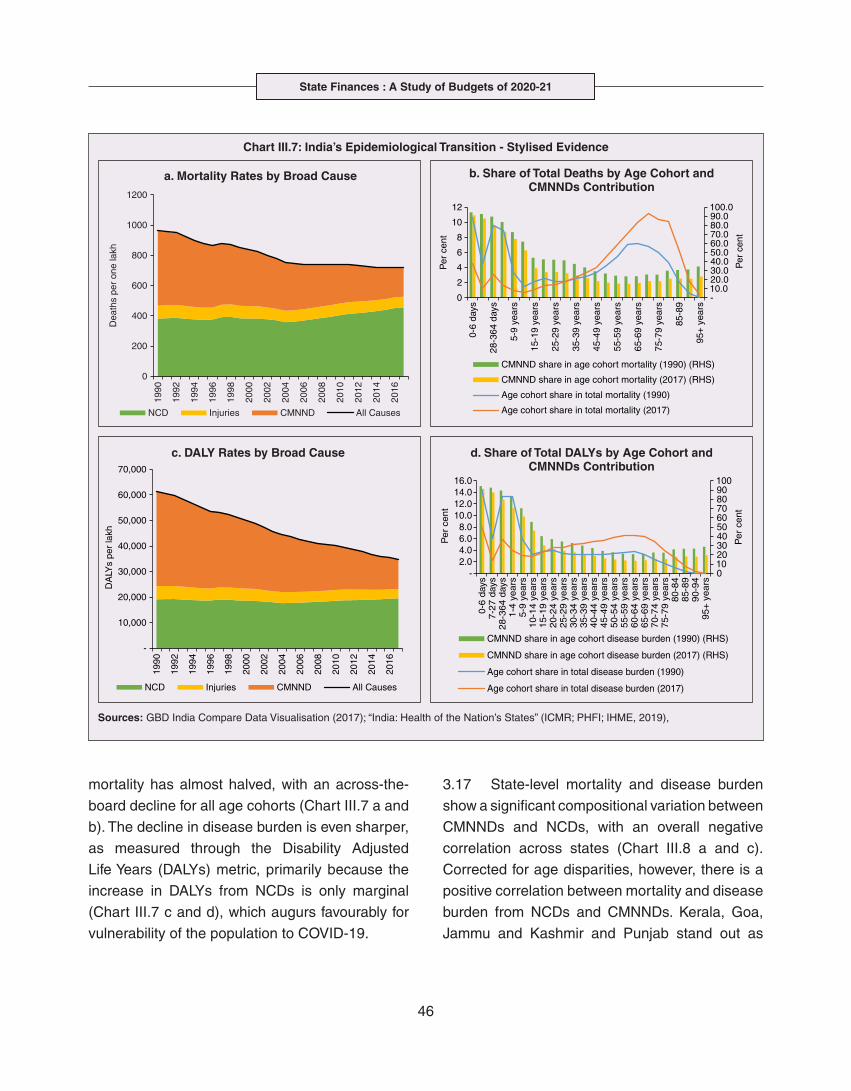
3.16 Epidemiological transition in India has
moved in tandem with demographic transition, with
a shift in the mortality and disease burden from
communicable, maternal, neonatal, and nutritional
diseases (CMNNDs) to non-communicable
diseases (NCDs). The decline in the mortality
rate by 25.4 per cent between 1990 and 2017
was driven by the decrease in CMNNDs (- 61.3
per cent), partially offset by an increase in NCDs
(19.4 per cent). The share of CMNNDs in overall
Table III.2: Demographic Transition across States State GSDP
per Capita
(2018-19)
2011-15 Vital Rates Population in 60+ Age Cohort
Crude Birth Rate
Crude Death Rate
Infant Mortality
Rate
Under-5 Mortality
Life Expec-tancy
Total Fertility
Rate
2011 2021 2031
Unit ` Per 1000 Popula-
tion
Per 1000 Popula-
tion
Per 1000 Live
Births
Per 1,000 Live
Births
Years Average Number
of Children
per Woman
Per cent Per cent Per cent
Delhi 3,94,216 15.4 4.6 27.0 29.0 73.8 1.8 6.9 9.3 12.5
Haryana 2,60,286 19.2 6.9 42.0 52.0 69.2 2.3 8.6 9.8 12.3
Karnataka 2,32,874 16.6 7.6 35.0 44.0 69.0 1.9 9.6 11.5 15.0
Kerala 2,25,484 14.5 7.0 11.0 12.0 75.3 1.8 12.7 16.5 20.9
Telangana 2,25,047 15.7 7.3 39.0 43.0 69.1 1.7 9.2 11.0 14.5
Gujarat 2,24,896 19.1 6.7 40.0 56.0 69.1 2.3 8.0 10.2 13.6
Uttarakhand 2,20,257 17.0 6.1 34.0 38.0 71.8 2.0 8.9 10.6 13.2
Maharashtra 2,16,169 15.2 6.6 25.0 27.0 72.0 1.8 9.9 11.7 15.0
Tamil Nadu 2,15,049 14.5 7.6 22.0 26.0 71.1 1.7 10.6 13.6 18.2
Himachal Pradesh 2,11,325 14.8 6.9 37.6 41.0 72.1 1.7 10.4 13.1 17.1
Punjab 1,72,149 14.7 6.8 29.0 35.0 72.1 1.7 10.5 12.6 16.2
Andhra Pradesh 1,68,083 15.2 7.8 39.0 43.0 69.1 1.7 10.1 12.4 16.4
N E states (excluding Assam) 1,27,334 15.6 5.0 31.8 40.1 72.2 1.8 6.1 8.8 12.7
Rajasthan 1,23,343 24.3 7.8 53.0 73.0 68.0 3.0 7.1 8.6 11.2
West Bengal 1,19,637 15.2 6.7 30.0 35.0 70.6 1.7 8.6 11.3 15.7
Jammu and Kashmir 1,09,769 15.1 4.7 35.0 41.0 73.6 1.9 7.0 9.5 13.2
Odisha 1,09,416 18.1 8.0 53.0 69.0 66.9 2.1 9.3 11.8 15.8
Chhattisgarh 1,08,058 22.5 8.1 47.0 63.0 65.2 2.6 7.6 8.8 11.7
Madhya Pradesh 99,025 24.9 8.2 58.0 85.0 64.8 3.0 7.5 8.5 11.1
Assam 94,385 20.3 7.5 51.4 73.9 64.8 2.3 6.4 8.2 11.6
Jharkhand 82,430 22.1 5.8 34.0 49.0 68.7 2.8 6.5 8.4 10.8
Uttar Pradesh 74,402 25.8 8.2 57.0 84.0 64.5 3.3 7.4 8.1 10.3
Bihar 47,541 27.5 5.9 42.3 57.3 68.4 3.8 6.3 7.7 9.5
All India 19.6 6.9 42.9 56.7 68.4 2.3 8.9 10.1 13.1
Sources: Report of the Technical Group on Population Projections (GoI, 2019e); and Ministry of Statistics and Programme Implementation (MoSPI).
State Finances : A Study of Budgets of 2020-21
46
mortality has almost halved, with an across-the-
board decline for all age cohorts (Chart III.7 a and
b). The decline in disease burden is even sharper,
as measured through the Disability Adjusted
Life Years (DALYs) metric, primarily because the
increase in DALYs from NCDs is only marginal
(Chart III.7 c and d), which augurs favourably for
vulnerability of the population to COVID-19.
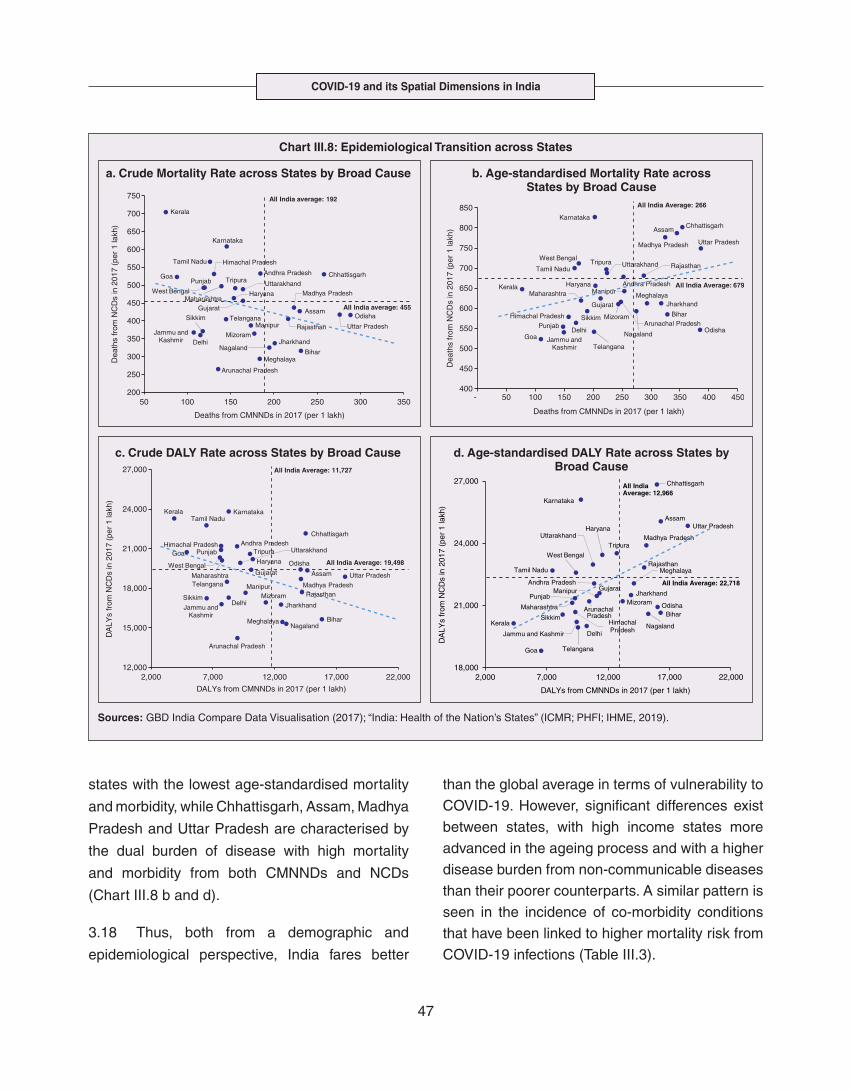
3.17 State-level mortality and disease burden
show a significant compositional variation between
CMNNDs and NCDs, with an overall negative
correlation across states (Chart III.8 a and c).
Corrected for age disparities, however, there is a
positive correlation between mortality and disease
burden from NCDs and CMNNDs. Kerala, Goa,
Jammu and Kashmir and Punjab stand out as
Chart III.7: India’s Epidemiological Transition - Stylised Evidence
a. Mortality Rates by Broad Cause b. Share of Total Deaths by Age Cohort and CMNNDs Contribution
Sources: GBD India Compare Data Visualisation (2017); “India: Health of the Nation’s States” (ICMR; PHFI; IHME, 2019),
c. DALY Rates by Broad Cause d. Share of Total DALYs by Age Cohort and CMNNDs Contribution
COVID-19 and its Spatial Dimensions in India
47
states with the lowest age-standardised mortality
and morbidity, while Chhattisgarh, Assam, Madhya
Pradesh and Uttar Pradesh are characterised by
the dual burden of disease with high mortality
and morbidity from both CMNNDs and NCDs
(Chart III.8 b and d).
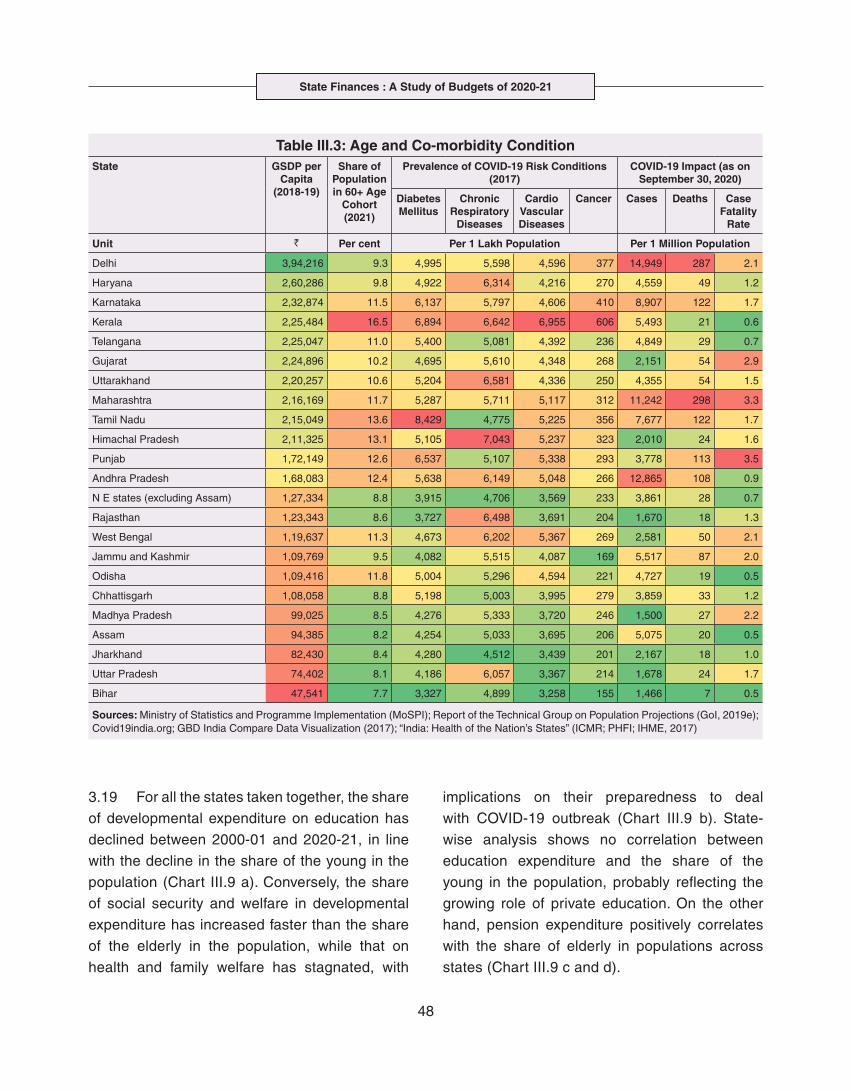
3.18 Thus, both from a demographic and
epidemiological perspective, India fares better
than the global average in terms of vulnerability to
COVID-19. However, significant differences exist
between states, with high income states more
advanced in the ageing process and with a higher
disease burden from non-communicable diseases
than their poorer counterparts. A similar pattern is
seen in the incidence of co-morbidity conditions
that have been linked to higher mortality risk from
COVID-19 infections (Table III.3).
Chart III.8: Epidemiological Transition across States
a. Crude Mortality Rate across States by Broad Cause b. Age-standardised Mortality Rate across States by Broad Cause
Sources: GBD India Compare Data Visualisation (2017); “India: Health of the Nation’s States” (ICMR; PHFI; IHME, 2019).
c. Crude DALY Rate across States by Broad Cause d. Age-standardised DALY Rate across States by Broad Cause
State Finances : A Study of Budgets of 2020-21
48
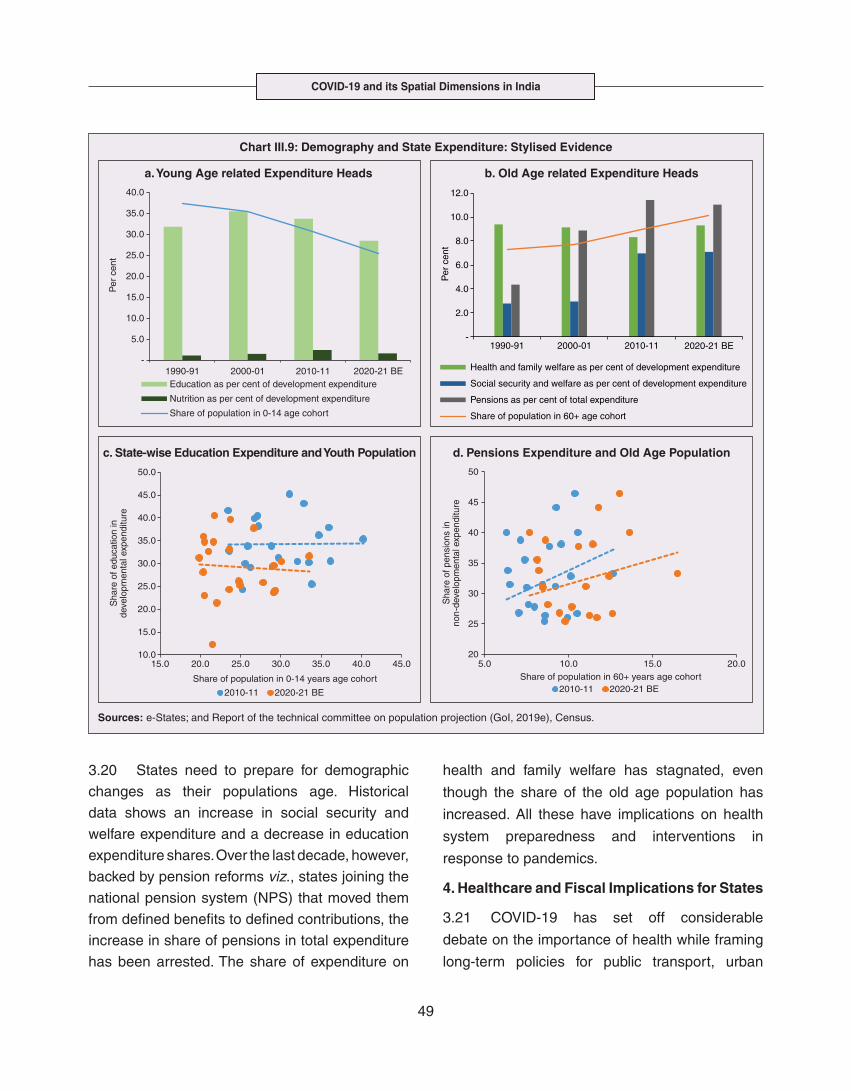
3.19 For all the states taken together, the share
of developmental expenditure on education has
declined between 2000-01 and 2020-21, in line
with the decline in the share of the young in the
population (Chart III.9 a). Conversely, the share
of social security and welfare in developmental
expenditure has increased faster than the share
of the elderly in the population, while that on
health and family welfare has stagnated, with
implications on their preparedness to deal
with COVID-19 outbreak (Chart III.9 b). State-
wise analysis shows no correlation between
education expenditure and the share of the
young in the population, probably reflecting the
growing role of private education. On the other
hand, pension expenditure positively correlates
with the share of elderly in populations across
states (Chart III.9 c and d).
Table III.3: Age and Co-morbidity ConditionState GSDP per
Capita (2018-19)
Share of Population in 60+ Age
Cohort (2021)
Prevalence of COVID-19 Risk Conditions (2017)
COVID-19 Impact (as on September 30, 2020)
Diabetes Mellitus
Chronic Respiratory
Diseases
Cardio Vascular Diseases
Cancer Cases Deaths Case Fatality
Rate
Unit ` Per cent Per 1 Lakh Population Per 1 Million Population
Delhi 3,94,216 9.3 4,995 5,598 4,596 377 14,949 287 2.1
Haryana 2,60,286 9.8 4,922 6,314 4,216 270 4,559 49 1.2
Karnataka 2,32,874 11.5 6,137 5,797 4,606 410 8,907 122 1.7
Kerala 2,25,484 16.5 6,894 6,642 6,955 606 5,493 21 0.6
Telangana 2,25,047 11.0 5,400 5,081 4,392 236 4,849 29 0.7
Gujarat 2,24,896 10.2 4,695 5,610 4,348 268 2,151 54 2.9
Uttarakhand 2,20,257 10.6 5,204 6,581 4,336 250 4,355 54 1.5
Maharashtra 2,16,169 11.7 5,287 5,711 5,117 312 11,242 298 3.3
Tamil Nadu 2,15,049 13.6 8,429 4,775 5,225 356 7,677 122 1.7
Himachal Pradesh 2,11,325 13.1 5,105 7,043 5,237 323 2,010 24 1.6
Punjab 1,72,149 12.6 6,537 5,107 5,338 293 3,778 113 3.5
Andhra Pradesh 1,68,083 12.4 5,638 6,149 5,048 266 12,865 108 0.9
N E states (excluding Assam) 1,27,334 8.8 3,915 4,706 3,569 233 3,861 28 0.7
Rajasthan 1,23,343 8.6 3,727 6,498 3,691 204 1,670 18 1.3
West Bengal 1,19,637 11.3 4,673 6,202 5,367 269 2,581 50 2.1
Jammu and Kashmir 1,09,769 9.5 4,082 5,515 4,087 169 5,517 87 2.0
Odisha 1,09,416 11.8 5,004 5,296 4,594 221 4,727 19 0.5
Chhattisgarh 1,08,058 8.8 5,198 5,003 3,995 279 3,859 33 1.2
Madhya Pradesh 99,025 8.5 4,276 5,333 3,720 246 1,500 27 2.2
Assam 94,385 8.2 4,254 5,033 3,695 206 5,075 20 0.5
Jharkhand 82,430 8.4 4,280 4,512 3,439 201 2,167 18 1.0
Uttar Pradesh 74,402 8.1 4,186 6,057 3,367 214 1,678 24 1.7
Bihar 47,541 7.7 3,327 4,899 3,258 155 1,466 7 0.5
Sources: Ministry of Statistics and Programme Implementation (MoSPI); Report of the Technical Group on Population Projections (GoI, 2019e); Covid19india.org; GBD India Compare Data Visualization (2017); “India: Health of the Nation’s States” (ICMR; PHFI; IHME, 2017)
COVID-19 and its Spatial Dimensions in India
49
3.20 States need to prepare for demographic
changes as their populations age. Historical
data shows an increase in social security and
welfare expenditure and a decrease in education
expenditure shares. Over the last decade, however,
backed by pension reforms viz., states joining the
national pension system (NPS) that moved them
from defined benefits to defined contributions, the
increase in share of pensions in total expenditure
has been arrested. The share of expenditure on
health and family welfare has stagnated, even
though the share of the old age population has
increased. All these have implications on health
system preparedness and interventions in
response to pandemics.
4. Healthcare and Fiscal Implications for States
3.21 COVID-19 has set off considerable
debate on the importance of health while framing
long-term policies for public transport, urban
Chart III.9: Demography and State Expenditure: Stylised Evidence
a. Young Age related Expenditure Heads b. Old Age related Expenditure Heads
Sources: e-States; and Report of the technical committee on population projection (GoI, 2019e), Census.
c. State-wise Education Expenditure and Youth Population d. Pensions Expenditure and Old Age Population
-
5.0
10.0
15.0
20.0
25.0
30.0
35.0
40.0
1990-91 2000-01 2010-11 2020-21 BE
Per
cen
t
Education as per cent of development expenditure
Nutrition as per cent of development expenditure
Share of population in 0-14 age cohort
Sha
reof
edu
catio
nin
deve
lopm
enta
lexp
endi
ture
10.0
15.0
20.0
25.0
30.0
35.0
40.0
45.0
50.0
15.0 20.0 25.0 30.0 35.0 40.0 45.0
Share of population in 0-14 years age cohort
2010-11 2020-21 BE
Sha
reof
pen
sion
sin
non-
deve
lopm
enta
lexp
endi
ture
20
25
30
35
40
45
50
5.0 10.0 15.0 20.0Share of population in 60+ years age cohort
2010-11 2020-21 BE
State Finances : A Study of Budgets of 2020-21
50
development, workforce mobility and migration
– areas in which it has traditionally been at the
periphery. Much will depend on the shape of the
post-COVID-19 “new normal”. Illustratively, the
usage of the blunt instrument of lockdown, which
has a significant impact on economic activity, is
essentially governed by considerations on the
adequacy/inadequacy of healthcare resources
to manage the peak case load. Going forward,
investing in healthcare is both prudent and urgent.
3.22 In the Indian federal structure, although
the centre and states’ share differentiated
responsibilities in management of the healthcare
system, the states’ role is larger. The seventh
schedule of the Indian constitution puts public
health and sanitation; hospitals and dispensaries
under entry 6 of the states list. Furthermore, law
and order (entry 1 and entry 2 of the states list)
and local government (entry 5 of the states list)
also puts the onus of containment on the states10.
The centre has specific responsibilities in the
management of disease outbreaks under the
Epidemic Diseases Act, 1897 and the Disaster
Management Act, 2005, which can and were
invoked in the current crisis. Also, successive
central governments have undertaken various
Centrally Sponsored Schemes (CSS) in public
health and sanitation (subjects in the states list),
which are routed through the treasuries of state
governments and are contributory in nature11.
From the perspective of management of the
COVID-19 health crisis, while significant aspects
of healthcare, particularly in health research
(including testing and development of therapeutics
and vaccines) and international collaboration, are
in the primary domain of the central government,
state governments will have to take on the mantle
of leadership in healthcare delivery. This pandemic
presents an opportunity for states to bring
about structural changes to improve the quality,
accessibility, and affordability of healthcare.
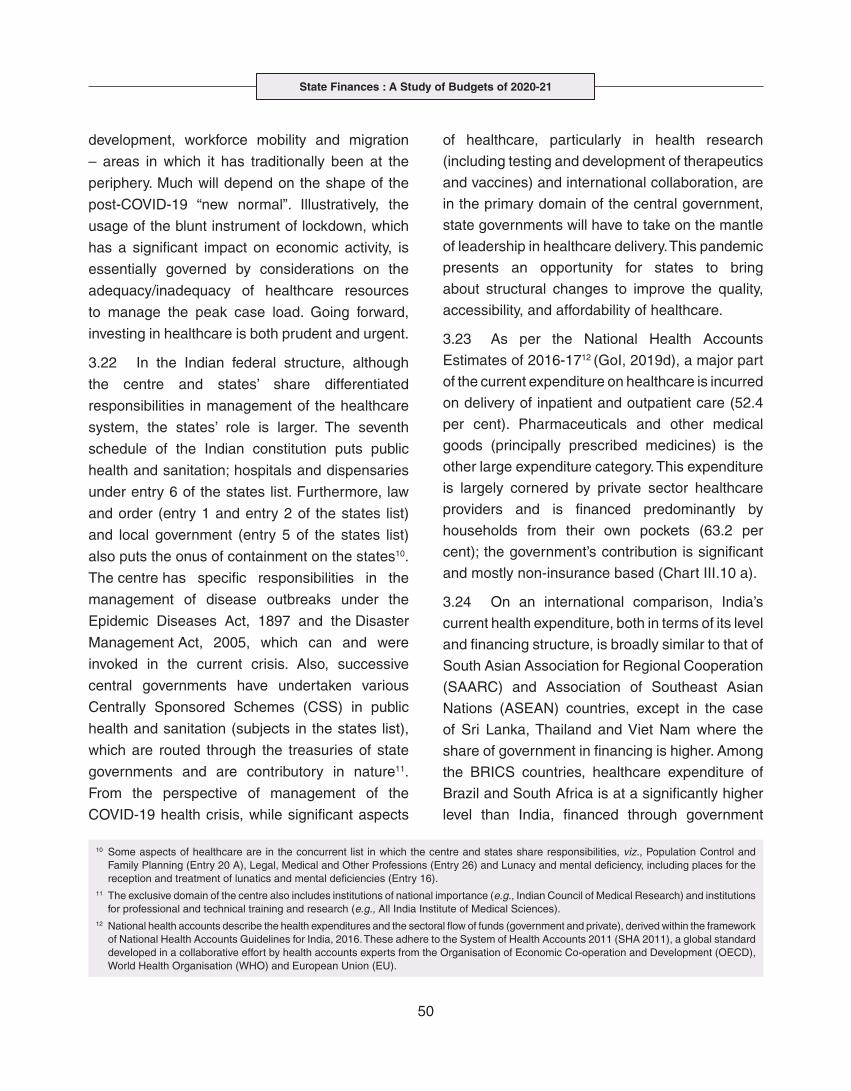
3.23 As per the National Health Accounts
Estimates of 2016-1712 (GoI, 2019d), a major part
of the current expenditure on healthcare is incurred
on delivery of inpatient and outpatient care (52.4
per cent). Pharmaceuticals and other medical
goods (principally prescribed medicines) is the
other large expenditure category. This expenditure
is largely cornered by private sector healthcare
providers and is financed predominantly by
households from their own pockets (63.2 per
cent); the government’s contribution is significant
and mostly non-insurance based (Chart III.10 a).
3.24 On an international comparison, India’s
current health expenditure, both in terms of its level
and financing structure, is broadly similar to that of
South Asian Association for Regional Cooperation
(SAARC) and Association of Southeast Asian
Nations (ASEAN) countries, except in the case
of Sri Lanka, Thailand and Viet Nam where the
share of government in financing is higher. Among
the BRICS countries, healthcare expenditure of
Brazil and South Africa is at a significantly higher
level than India, financed through government
10 Some aspects of healthcare are in the concurrent list in which the centre and states share responsibilities, viz., Population Control and Family Planning (Entry 20 A), Legal, Medical and Other Professions (Entry 26) and Lunacy and mental deficiency, including places for the reception and treatment of lunatics and mental deficiencies (Entry 16).
11 The exclusive domain of the centre also includes institutions of national importance (e.g., Indian Council of Medical Research) and institutions for professional and technical training and research (e.g., All India Institute of Medical Sciences).
12 National health accounts describe the health expenditures and the sectoral flow of funds (government and private), derived within the framework of National Health Accounts Guidelines for India, 2016. These adhere to the System of Health Accounts 2011 (SHA 2011), a global standard developed in a collaborative effort by health accounts experts from the Organisation of Economic Co-operation and Development (OECD), World Health Organisation (WHO) and European Union (EU).
COVID-19 and its Spatial Dimensions in India
51
expenditure and private insurance. Healthcare
expenditure in China and Russia is moderately
higher than in India; significantly, a higher share
of government expenditure in these countries
is through the insurance route (compulsory
contributory health insurance schemes). Among
the developed regions of the world – east Asia;
north America; and western Europe – current
healthcare expenditure is at a significantly higher
level, with a higher share of government financing
(except in Germany and the Republic of Korea). The
share of out-of-pocket expenditure by households
on healthcare is low in these countries, while the
financing is largely based on a mix of government
schemes and compulsory contributory health
insurance schemes, with no clear winner
between the two on a cross-country comparison
(Chart III.10 b).
Chart III.10: India’s Healthcare Expenditure
a. Components
Sources: National Health Accounts Estimates of India, 2016-17 (GoI, 2019d); and WHO Global Health Expenditure Database, 2019.
b. Current Health Expenditure by Financing Schemes- Cross-country Comparison
State Finances : A Study of Budgets of 2020-21
52
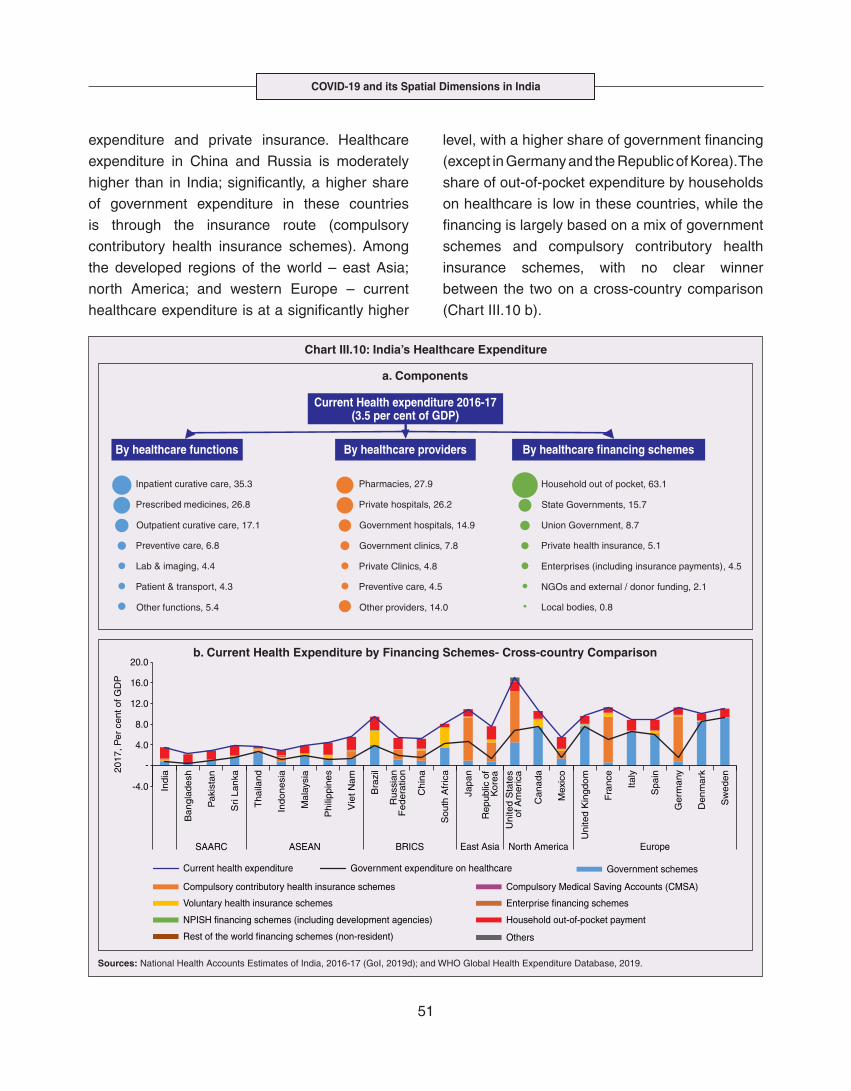
3.25 Turning to per capita healthcare
expenditure (Chart III.11a13), states in the top right
corner of the matrix (shaded red) perform poorly
on healthcare spending which is funded by a
high out of pocket component share, suggesting
that they have the lowest government spending
on healthcare on a per capita basis. Conversely,
states in the bottom left corner (shaded green)
are the best performing on both these metrics,
highlighting the key role played by government
finance in healthcare of these states. Kerala is
the exception, with significantly higher healthcare
spending per capita than all other states, driven
by higher than average government spending
as well as out of pocket spending, which has
borne dividend in the handling of the Nipah
outbreak as well as in keeping mortality from
COVID-19 relatively low despite unfavourable
demographics. In terms of the share of private
hospitals in hospitalised cases and its affordability
(Chart III.11b), states in the top right corner of
the matrix (shaded red) have a higher reliance
on private hospitals and at the same time, the
cost of hospitalisation in these facilities (relative
to their GSDP per capita) is higher than the all
India average. At the other end of the spectrum
are states in the bottom left corner (shaded green)
where the reliance on private hospitals is low and
they are relatively more affordable.
3.26 Thus, significant inter-state disparities
exist in access to and affordability of healthcare.
13 This analysis is based on NSS latest survey. Since the 1990s there have been four health surveys of NSO (erstwhile NSSO): those of the 52nd round (July 1995-June 1996), the 60th round (January 2004-June 2004), the 71st round (January 2014-June 2014), and the latest being the 75th round (July 2017-June 2018). The 71st and 75th round surveys were more comprehensive - done over a one year period and covering a larger sample size.
Chart III.11: Healthcare in States: Expenditure and Private Hospitals’ Share and Affordability
a. Healthcare Spending and Out of Pocket Financing Component (2016-17)
b. Private Hospitals Share and Affordability
Sources: National Health Accounts Estimates of India, 2016-17 (GoI, 2019d); and NSS 75th Round, (GoI, 2019b).
COVID-19 and its Spatial Dimensions in India
53
Himachal Pradesh acquits itself well in providing
government healthcare as well as in keeping
private healthcare affordable, while Uttar Pradesh,
Bihar and Jharkhand will need some catching up.
Individuals’ spending on healthcare is low in these
states, financed largely from out of pocket, with
high reliance on private facilities for hospitalisation
that is prohibitively expensive and crowds out
medical access to the poor. This requires urgent
attention from state governments to prepare their
states to meet the healthcare challenge from
COVID-19 and future pandemics.
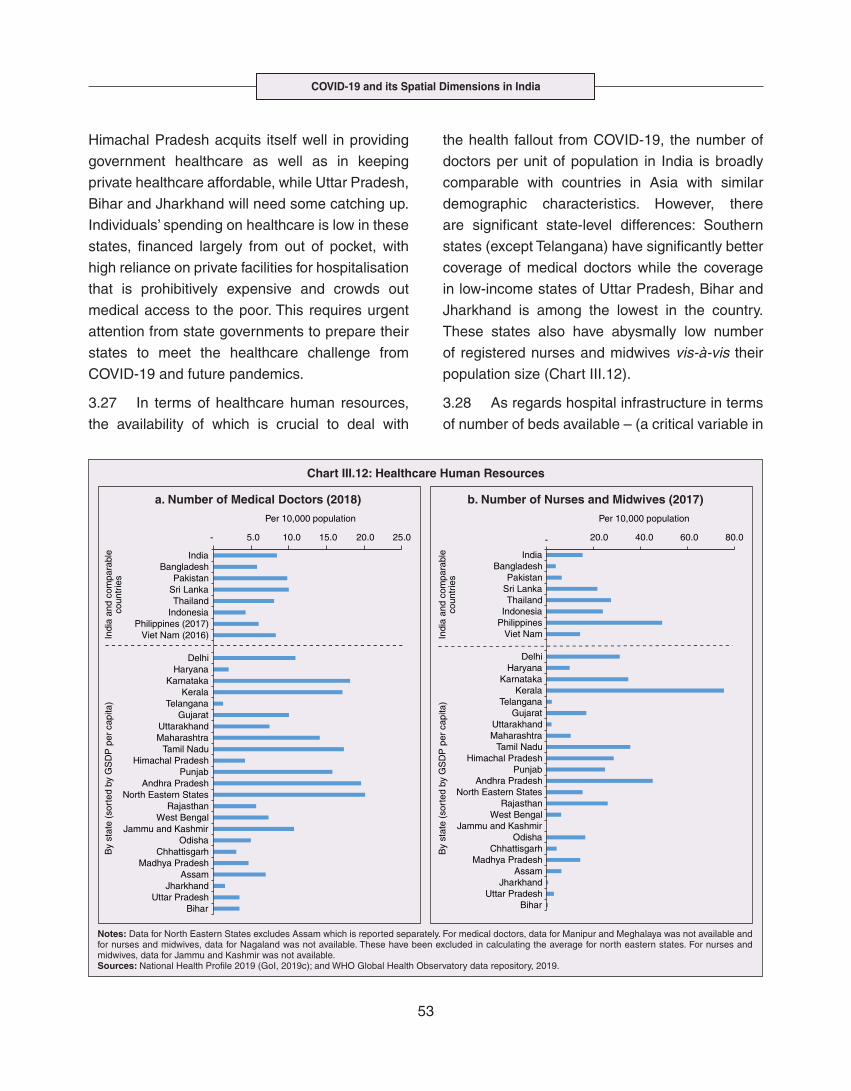
3.27 In terms of healthcare human resources,
the availability of which is crucial to deal with
the health fallout from COVID-19, the number of
doctors per unit of population in India is broadly
comparable with countries in Asia with similar
demographic characteristics. However, there
are significant state-level differences: Southern
states (except Telangana) have significantly better
coverage of medical doctors while the coverage
in low-income states of Uttar Pradesh, Bihar and
Jharkhand is among the lowest in the country.
These states also have abysmally low number
of registered nurses and midwives vis-à-vis their
population size (Chart III.12).
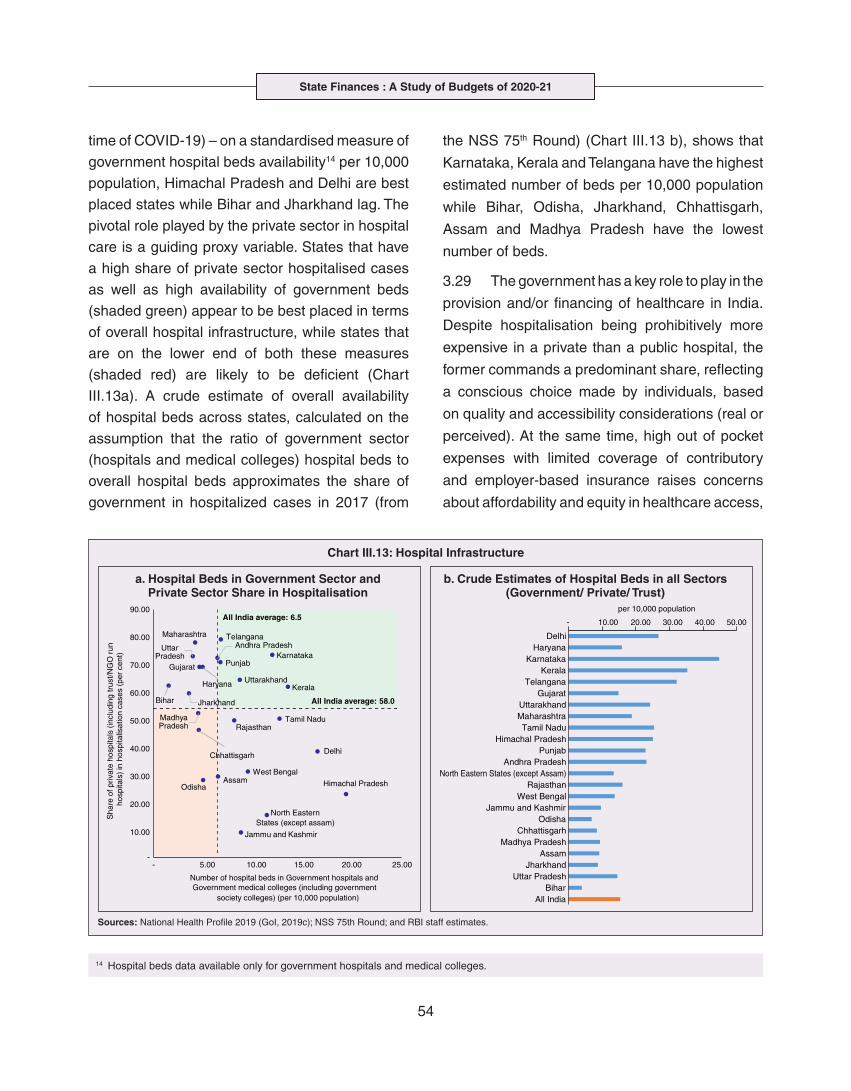
3.28 As regards hospital infrastructure in terms
of number of beds available – (a critical variable in
Chart III.12: Healthcare Human Resources
a. Number of Medical Doctors (2018) b. Number of Nurses and Midwives (2017)
Notes: Data for North Eastern States excludes Assam which is reported separately. For medical doctors, data for Manipur and Meghalaya was not available and for nurses and midwives, data for Nagaland was not available. These have been excluded in calculating the average for north eastern states. For nurses and midwives, data for Jammu and Kashmir was not available.Sources: National Health Profile 2019 (GoI, 2019c); and WHO Global Health Observatory data repository, 2019.
State Finances : A Study of Budgets of 2020-21
54
time of COVID-19) – on a standardised measure of
government hospital beds availability14 per 10,000
population, Himachal Pradesh and Delhi are best
placed states while Bihar and Jharkhand lag. The
pivotal role played by the private sector in hospital
care is a guiding proxy variable. States that have
a high share of private sector hospitalised cases
as well as high availability of government beds
(shaded green) appear to be best placed in terms
of overall hospital infrastructure, while states that
are on the lower end of both these measures
(shaded red) are likely to be deficient (Chart
III.13a). A crude estimate of overall availability
of hospital beds across states, calculated on the
assumption that the ratio of government sector
(hospitals and medical colleges) hospital beds to
overall hospital beds approximates the share of
government in hospitalized cases in 2017 (from
the NSS 75th Round) (Chart III.13 b), shows that
Karnataka, Kerala and Telangana have the highest
estimated number of beds per 10,000 population
while Bihar, Odisha, Jharkhand, Chhattisgarh,
Assam and Madhya Pradesh have the lowest
number of beds.
3.29 The government has a key role to play in the
provision and/or financing of healthcare in India.
Despite hospitalisation being prohibitively more
expensive in a private than a public hospital, the
former commands a predominant share, reflecting
a conscious choice made by individuals, based
on quality and accessibility considerations (real or
perceived). At the same time, high out of pocket
expenses with limited coverage of contributory
and employer-based insurance raises concerns
about affordability and equity in healthcare access,
Chart III.13: Hospital Infrastructure
a. Hospital Beds in Government Sector and Private Sector Share in Hospitalisation
b. Crude Estimates of Hospital Beds in all Sectors (Government/ Private/ Trust)
Sources: National Health Profile 2019 (GoI, 2019c); NSS 75th Round; and RBI staff estimates.
14 Hospital beds data available only for government hospitals and medical colleges.
COVID-19 and its Spatial Dimensions in India
55
especially in the context of COVID-19 and the
vulnerability of low-income segments of society.
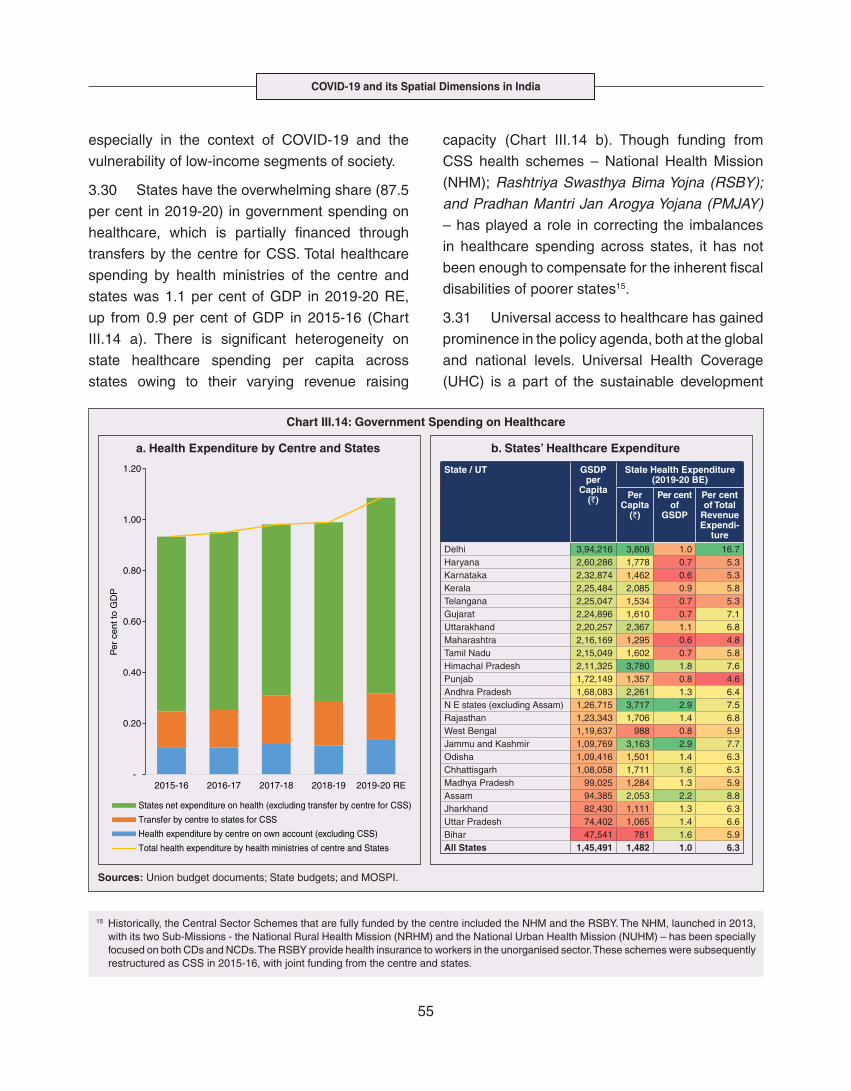
3.30 States have the overwhelming share (87.5
per cent in 2019-20) in government spending on
healthcare, which is partially financed through
transfers by the centre for CSS. Total healthcare
spending by health ministries of the centre and
states was 1.1 per cent of GDP in 2019-20 RE,
up from 0.9 per cent of GDP in 2015-16 (Chart
III.14 a). There is significant heterogeneity on
state healthcare spending per capita across
states owing to their varying revenue raising
capacity (Chart III.14 b). Though funding from
CSS health schemes – National Health Mission
(NHM); Rashtriya Swasthya Bima Yojna (RSBY);
and Pradhan Mantri Jan Arogya Yojana (PMJAY)
– has played a role in correcting the imbalances
in healthcare spending across states, it has not
been enough to compensate for the inherent fiscal
disabilities of poorer states15.
3.31 Universal access to healthcare has gained
prominence in the policy agenda, both at the global
and national levels. Universal Health Coverage
(UHC) is a part of the sustainable development
Chart III.14: Government Spending on Healthcare
a. Health Expenditure by Centre and States b. States’ Healthcare Expenditure
Sources: Union budget documents; State budgets; and MOSPI.
State / UT
GSDP per
Capita (`)
State Health Expenditure (2019-20 BE)
Per Capita
(`)
Per cent of
GSDP
Per cent of Total
Revenue Expendi-
ture
Delhi 3,94,216 3,808 1.0 16.7Haryana 2,60,286 1,778 0.7 5.3Karnataka 2,32,874 1,462 0.6 5.3Kerala 2,25,484 2,085 0.9 5.8Telangana 2,25,047 1,534 0.7 5.3Gujarat 2,24,896 1,610 0.7 7.1Uttarakhand 2,20,257 2,367 1.1 6.8Maharashtra 2,16,169 1,295 0.6 4.8Tamil Nadu 2,15,049 1,602 0.7 5.8Himachal Pradesh 2,11,325 3,780 1.8 7.6Punjab 1,72,149 1,357 0.8 4.6Andhra Pradesh 1,68,083 2,261 1.3 6.4N E states (excluding Assam) 1,26,715 3,717 2.9 7.5Rajasthan 1,23,343 1,706 1.4 6.8West Bengal 1,19,637 988 0.8 5.9Jammu and Kashmir 1,09,769 3,163 2.9 7.7Odisha 1,09,416 1,501 1.4 6.3Chhattisgarh 1,08,058 1,711 1.6 6.3Madhya Pradesh 99,025 1,284 1.3 5.9Assam 94,385 2,053 2.2 8.8Jharkhand 82,430 1,111 1.3 6.3Uttar Pradesh 74,402 1,065 1.4 6.6Bihar 47,541 781 1.6 5.9All States 1,45,491 1,482 1.0 6.3
15 Historically, the Central Sector Schemes that are fully funded by the centre included the NHM and the RSBY. The NHM, launched in 2013, with its two Sub-Missions - the National Rural Health Mission (NRHM) and the National Urban Health Mission (NUHM) – has been specially focused on both CDs and NCDs. The RSBY provide health insurance to workers in the unorganised sector. These schemes were subsequently restructured as CSS in 2015-16, with joint funding from the centre and states.
State Finances : A Study of Budgets of 2020-21
56
goals (SDGs) adopted by the United Nations (UN)
in 2015, and further reinforced in the political
declaration of the high level meeting on UHC at the
UN General Assembly meeting in October 2019.
Nationally, the progress towards UHC has gained
significant traction with the adoption of National
Health Policy in 2017 (GoI, 2017) and the launch
of PMJAY in 2018. The former has set ambitious
targets to increase government health expenditure
to 2.5 per cent of GDP by 2025 and states’ health
sector spending to 8 per cent of their budget by
2020. In the 2020-21 BE, however, only Assam
and Delhi meet this target. PMJAY, also known as
the Ayushman Bharat programme, was launched
as the largest health assurance scheme in the
world to cover 10.74 crores poor and vulnerable
families (approximately 50 crore beneficiaries)
that form the bottom 40 per cent of the Indian
population. Also, the scheme has an infrastructure
component – augmentation of which is necessary
for COVID-19 health requirements going forward
– and provides for viability gap funding under
the PPP route for empanelled private hospitals,
in addition to providing funding for establishing
health and welfare centres (HWCs).
3.32 Notwithstanding the considerable progress
made in recent years, the agenda for UHC
remains unfinished in India and requires a step
up in spending by the government, as COVID-19
demonstrated. Though a state subject, resources
to augment health spending by states need to come
from a mix of their own revenues and transfers from
the centre for a balanced fiscal outcome. Transfers
also have the additional advantage of mitigating
the fiscal disability of poorer states, thus ensuring
a minimum acceptable level of healthcare across
the country.
5. Reverse Migration, Employment and MSMEs
3.33 COVID-19 led to large migrations during
2020, establishing a link with epidemiology.
The nation-wide lockdown imposed job losses,
prompting migrant labourers to return from cities
to native places. The resulting transmission of
the virus to rural areas added to transitory rural
unemployment, besides causing labour shortages
in urban areas (Singh et al., 2020).
3.34 A sizeable fraction of India’s workforce
currently consists of inter-state migrants, mainly
labourers. Inter-state, intra-state, inter-district
and intra-district migrants (including migrant
labourers) increased from 309.3 million in 2001 to
449.9 million in 2011, of which inter-state migrants
(including migrant labourers) increased from 41.1
million in 2001 to 54.2 million in 2011 (Census,
2011). Since 2011, the inter-state migration has
been reported to have grown annually by around
9 million up to 2016 (GoI, 2018), though reliable
point estimates are unavailable in the absence
of a robust data collection system. Over the
decades, Uttar Pradesh (UP) and Bihar have been
the major out-migration states, followed closely by
Rajasthan and Odisha. The major in-migration
states are Maharashtra, Delhi, Gujarat and West
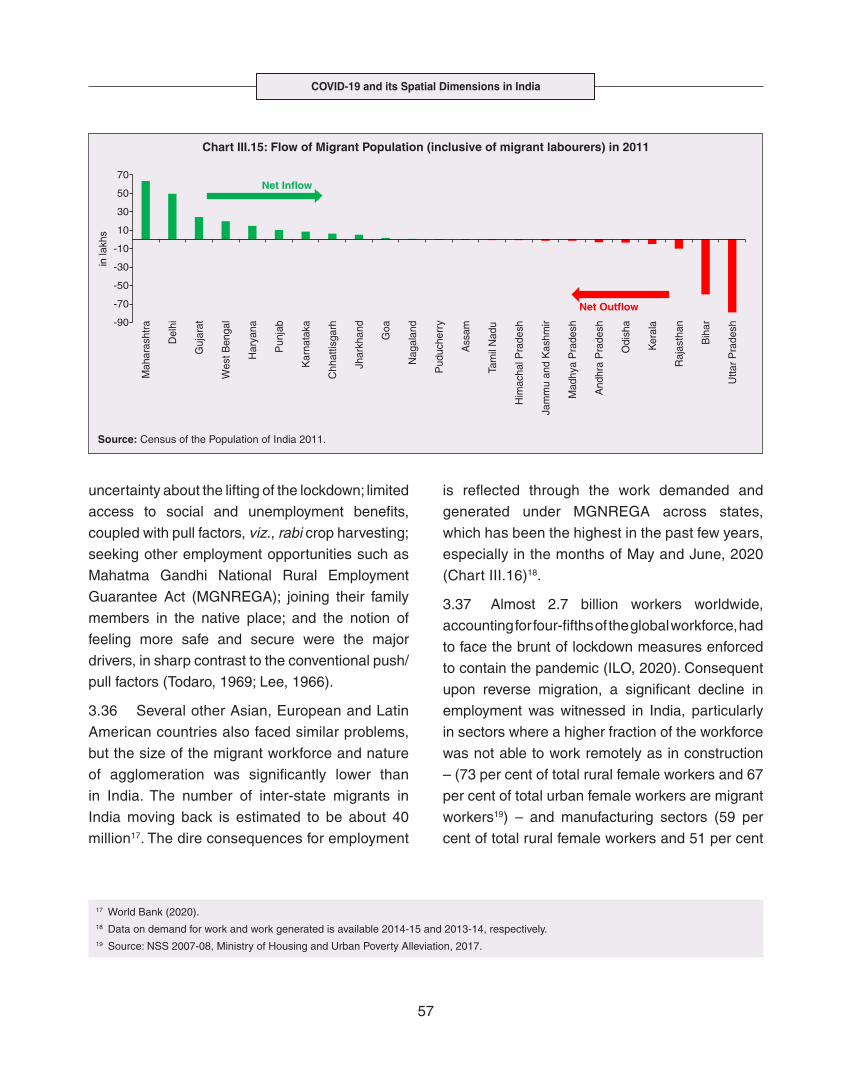
Bengal16 (Chart III.15). COVID-19 switched the
sources and destinations of migrant labourers
(Chart III.15).
3.35 In the reverse migration experienced during
the pandemic, push factors, viz., high costs of living
in urban areas; no earnings; loss of employment;
16 As per GoI (2018), the states that emerged as net inflow states by 2017-18 apart from those mentioned in this chart are Tamil Nadu, Andhra Pradesh and Assam, while those that emerged as net outflow states are Jharkhand, Haryana and Chandigarh. The trend for all other states is mostly in line with 2011 Census.
COVID-19 and its Spatial Dimensions in India
57
Chart III.15: Flow of Migrant Population (inclusive of migrant labourers) in 2011
Source: Census of the Population of India 2011.
uncertainty about the lifting of the lockdown; limited
access to social and unemployment benefits,
coupled with pull factors, viz., rabi crop harvesting;
seeking other employment opportunities such as
Mahatma Gandhi National Rural Employment
Guarantee Act (MGNREGA); joining their family
members in the native place; and the notion of
feeling more safe and secure were the major
drivers, in sharp contrast to the conventional push/
pull factors (Todaro, 1969; Lee, 1966).
3.36 Several other Asian, European and Latin
American countries also faced similar problems,
but the size of the migrant workforce and nature
of agglomeration was significantly lower than
in India. The number of inter-state migrants in
India moving back is estimated to be about 40
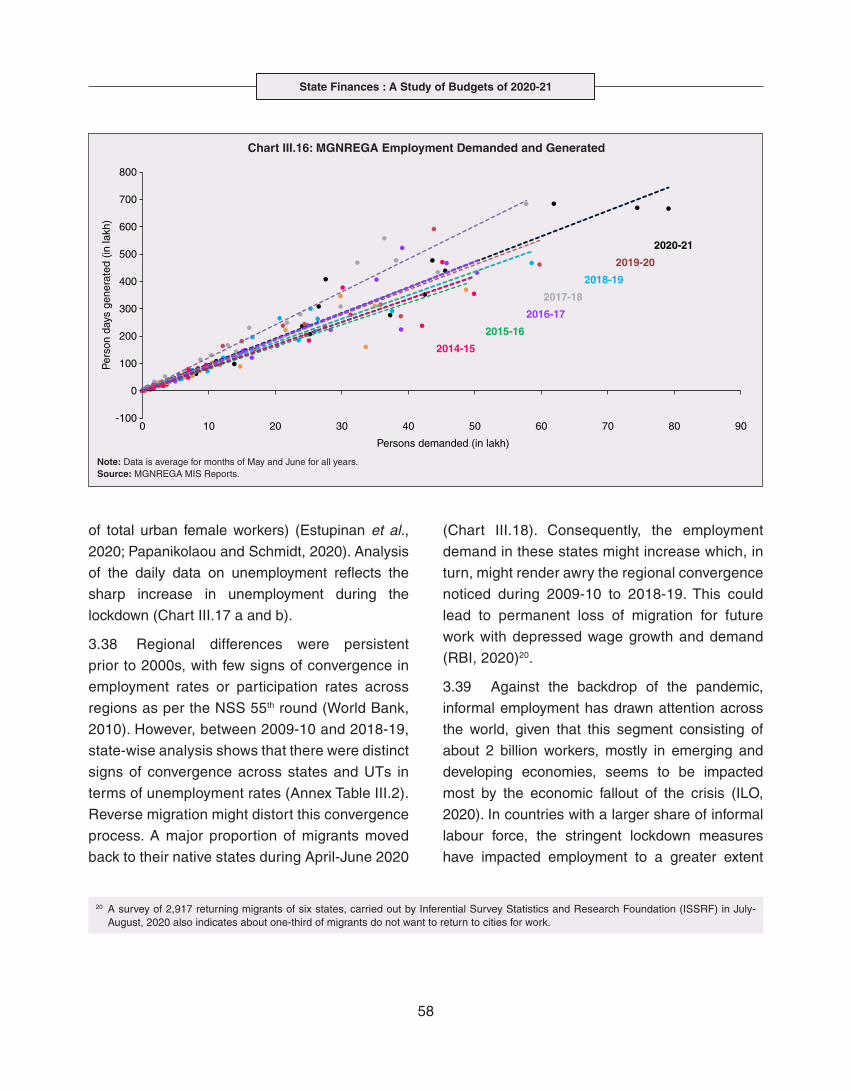
million17. The dire consequences for employment
is reflected through the work demanded and
generated under MGNREGA across states,
which has been the highest in the past few years,
especially in the months of May and June, 2020
(Chart III.16)18.
3.37 Almost 2.7 billion workers worldwide,
accounting for four-fifths of the global workforce, had
to face the brunt of lockdown measures enforced
to contain the pandemic (ILO, 2020). Consequent
upon reverse migration, a significant decline in
employment was witnessed in India, particularly
in sectors where a higher fraction of the workforce
was not able to work remotely as in construction
– (73 per cent of total rural female workers and 67
per cent of total urban female workers are migrant
workers19) – and manufacturing sectors (59 per
cent of total rural female workers and 51 per cent
17 World Bank (2020).18 Data on demand for work and work generated is available 2014-15 and 2013-14, respectively.19 Source: NSS 2007-08, Ministry of Housing and Urban Poverty Alleviation, 2017.
State Finances : A Study of Budgets of 2020-21
58
of total urban female workers) (Estupinan et al.,
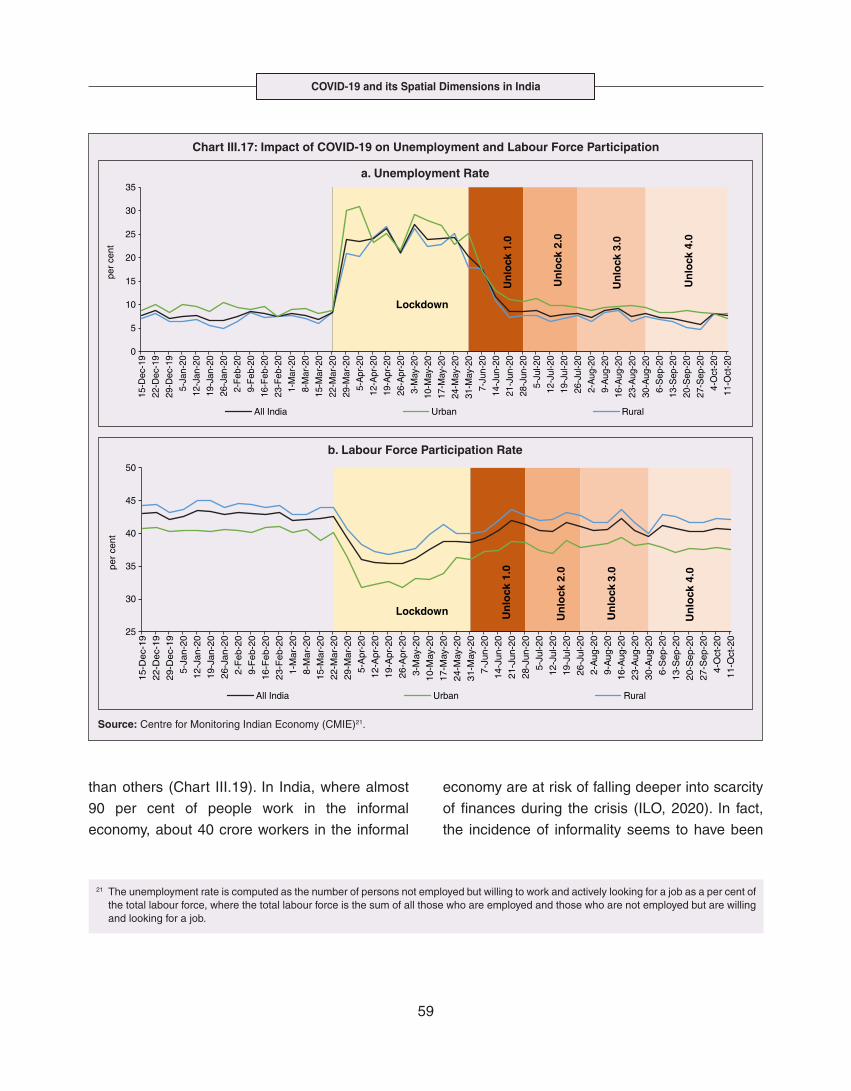
2020; Papanikolaou and Schmidt, 2020). Analysis
of the daily data on unemployment reflects the
sharp increase in unemployment during the
lockdown (Chart III.17 a and b).
3.38 Regional differences were persistent
prior to 2000s, with few signs of convergence in
employment rates or participation rates across
regions as per the NSS 55th round (World Bank,
2010). However, between 2009-10 and 2018-19,
state-wise analysis shows that there were distinct
signs of convergence across states and UTs in
terms of unemployment rates (Annex Table III.2).
Reverse migration might distort this convergence
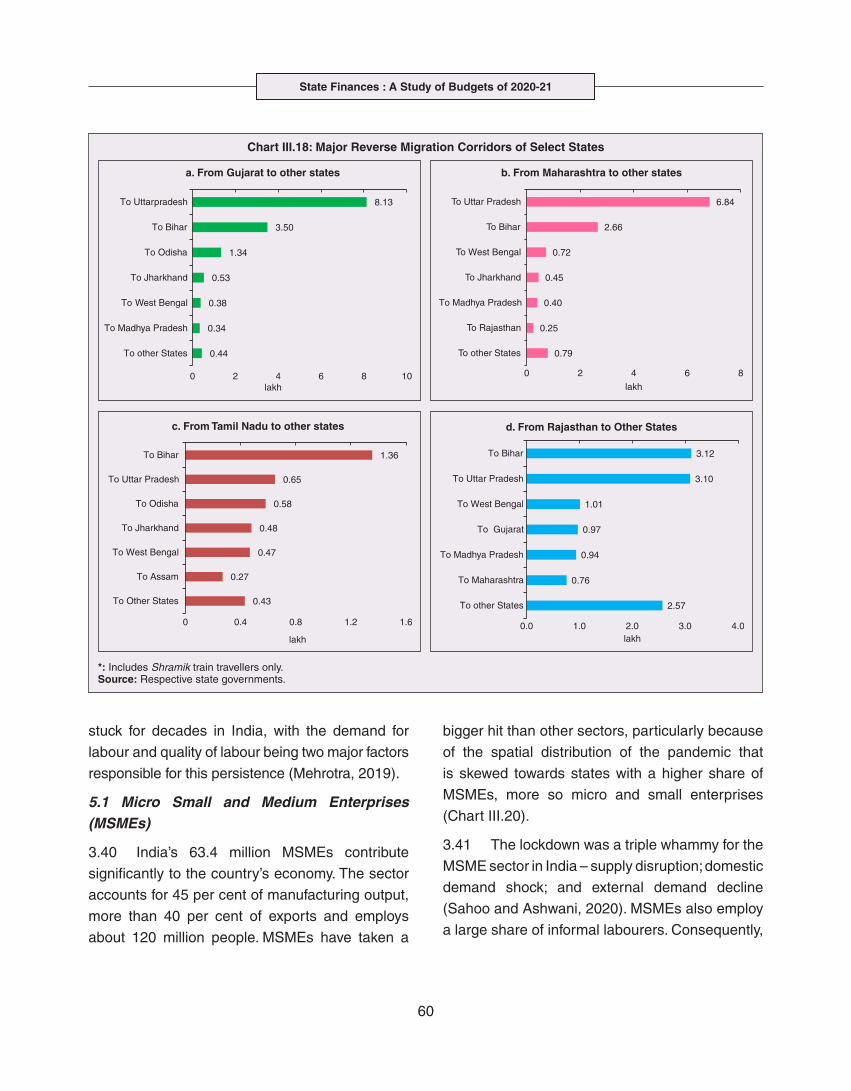
process. A major proportion of migrants moved
back to their native states during April-June 2020
(Chart III.18). Consequently, the employment
demand in these states might increase which, in
turn, might render awry the regional convergence
noticed during 2009-10 to 2018-19. This could
lead to permanent loss of migration for future
work with depressed wage growth and demand
(RBI, 2020)20.
3.39 Against the backdrop of the pandemic,
informal employment has drawn attention across
the world, given that this segment consisting of
about 2 billion workers, mostly in emerging and
developing economies, seems to be impacted
most by the economic fallout of the crisis (ILO,
2020). In countries with a larger share of informal
labour force, the stringent lockdown measures
have impacted employment to a greater extent
Chart III.16: MGNREGA Employment Demanded and Generated
Note: Data is average for months of May and June for all years.Source: MGNREGA MIS Reports.
20 A survey of 2,917 returning migrants of six states, carried out by Inferential Survey Statistics and Research Foundation (ISSRF) in July-August, 2020 also indicates about one-third of migrants do not want to return to cities for work.
COVID-19 and its Spatial Dimensions in India
59
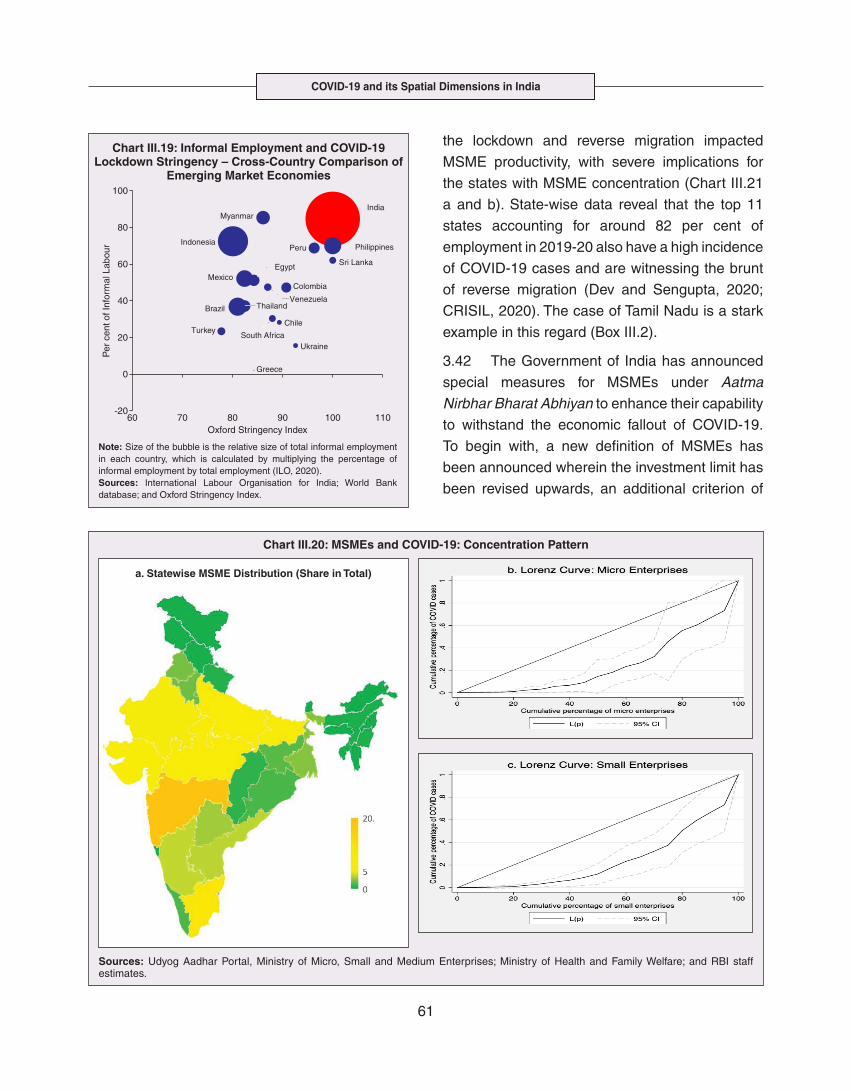
than others (Chart III.19). In India, where almost
90 per cent of people work in the informal
economy, about 40 crore workers in the informal
economy are at risk of falling deeper into scarcity
of finances during the crisis (ILO, 2020). In fact,
the incidence of informality seems to have been
Chart III.17: Impact of COVID-19 on Unemployment and Labour Force Participation
a. Unemployment Rate
Source: Centre for Monitoring Indian Economy (CMIE)21.
b. Labour Force Participation Rate
21 The unemployment rate is computed as the number of persons not employed but willing to work and actively looking for a job as a per cent of the total labour force, where the total labour force is the sum of all those who are employed and those who are not employed but are willing and looking for a job.
State Finances : A Study of Budgets of 2020-21
60
stuck for decades in India, with the demand for
labour and quality of labour being two major factors
responsible for this persistence (Mehrotra, 2019).
5.1 Micro Small and Medium Enterprises (MSMEs)
3.40 India’s 63.4 million MSMEs contribute
significantly to the country’s economy. The sector
accounts for 45 per cent of manufacturing output,
more than 40 per cent of exports and employs
about 120 million people. MSMEs have taken a
bigger hit than other sectors, particularly because
of the spatial distribution of the pandemic that
is skewed towards states with a higher share of
MSMEs, more so micro and small enterprises
(Chart III.20).
3.41 The lockdown was a triple whammy for the
MSME sector in India – supply disruption; domestic
demand shock; and external demand decline
(Sahoo and Ashwani, 2020). MSMEs also employ
a large share of informal labourers. Consequently,
Chart III.18: Major Reverse Migration Corridors of Select States
a. From Gujarat to other states b. From Maharashtra to other states
*: Includes Shramik train travellers only.Source: Respective state governments.
c. From Tamil Nadu to other states d. From Rajasthan to Other States
COVID-19 and its Spatial Dimensions in India
61
the lockdown and reverse migration impacted
MSME productivity, with severe implications for
the states with MSME concentration (Chart III.21
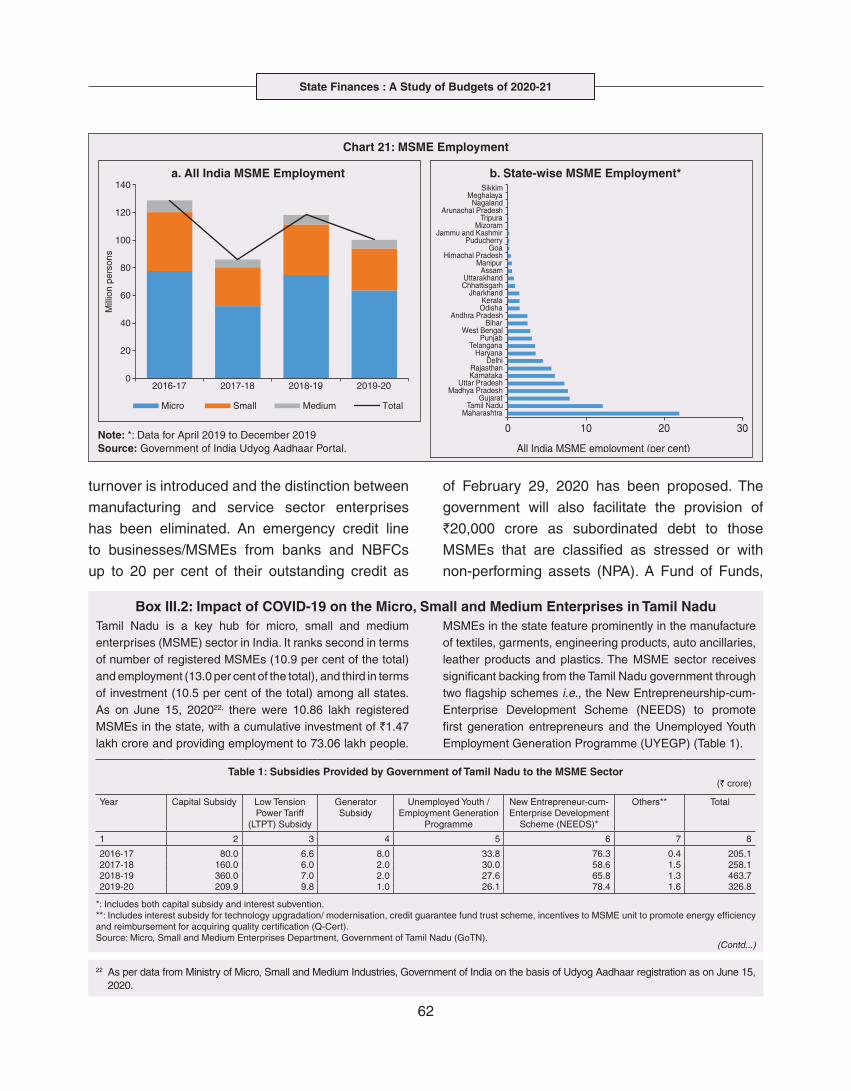
a and b). State-wise data reveal that the top 11
states accounting for around 82 per cent of
employment in 2019-20 also have a high incidence
of COVID-19 cases and are witnessing the brunt
of reverse migration (Dev and Sengupta, 2020;
CRISIL, 2020). The case of Tamil Nadu is a stark
example in this regard (Box III.2).
3.42 The Government of India has announced
special measures for MSMEs under Aatma
Nirbhar Bharat Abhiyan to enhance their capability
to withstand the economic fallout of COVID-19.
To begin with, a new definition of MSMEs has
been announced wherein the investment limit has
been revised upwards, an additional criterion of
Chart III.19: Informal Employment and COVID-19 Lockdown Stringency – Cross-Country Comparison of
Emerging Market Economies
Note: Size of the bubble is the relative size of total informal employment in each country, which is calculated by multiplying the percentage of informal employment by total employment (ILO, 2020).Sources: International Labour Organisation for India; World Bank database; and Oxford Stringency Index.
Chart III.20: MSMEs and COVID-19: Concentration Pattern
Sources: Udyog Aadhar Portal, Ministry of Micro, Small and Medium Enterprises; Ministry of Health and Family Welfare; and RBI staff estimates.
a. Statewise MSME Distribution (Share in Total)
State Finances : A Study of Budgets of 2020-21
62
turnover is introduced and the distinction between
manufacturing and service sector enterprises
has been eliminated. An emergency credit line
to businesses/MSMEs from banks and NBFCs
up to 20 per cent of their outstanding credit as
of February 29, 2020 has been proposed. The
government will also facilitate the provision of
`20,000 crore as subordinated debt to those
MSMEs that are classified as stressed or with
non-performing assets (NPA). A Fund of Funds,
Chart 21: MSME Employment
a. All India MSME Employment b. State-wise MSME Employment*
Note: *: Data for April 2019 to December 2019 Source: Government of India Udyog Aadhaar Portal.
0
20
40
60
80
100
120
140
2016-17 2017-18 2018-19 2019-20
Mill
ion
pers
ons
Micro Small Medium Total
0 10 20 30
All India MSME employment (per cent)
MaharashtraTamil Nadu
GujaratMadhya Pradesh
Uttar PradeshKarnatakaRajasthan
DelhiHaryana
TelanganaPunjab
West BengalBihar
Andhra PradeshOdishaKerala
JharkhandChhattisgarhUttarakhand
AssamManipur
Himachal PradeshGoa
PuducherryJammu and Kashmir
MizoramTripura
Arunachal PradeshNagaland
MeghalayaSikkim
Box III.2: Impact of COVID-19 on the Micro, Small and Medium Enterprises in Tamil Nadu
Tamil Nadu is a key hub for micro, small and medium enterprises (MSME) sector in India. It ranks second in terms of number of registered MSMEs (10.9 per cent of the total) and employment (13.0 per cent of the total), and third in terms of investment (10.5 per cent of the total) among all states. As on June 15, 202022, there were 10.86 lakh registered MSMEs in the state, with a cumulative investment of `1.47 lakh crore and providing employment to 73.06 lakh people.
MSMEs in the state feature prominently in the manufacture of textiles, garments, engineering products, auto ancillaries, leather products and plastics. The MSME sector receives significant backing from the Tamil Nadu government through two flagship schemes i.e., the New Entrepreneurship-cum-Enterprise Development Scheme (NEEDS) to promote first generation entrepreneurs and the Unemployed Youth Employment Generation Programme (UYEGP) (Table 1).
Table 1: Subsidies Provided by Government of Tamil Nadu to the MSME Sector(` crore)
Year Capital Subsidy Low Tension Power Tariff
(LTPT) Subsidy
Generator Subsidy
Unemployed Youth / Employment Generation
Programme
New Entrepreneur-cum-Enterprise Development
Scheme (NEEDS)*
Others** Total
1 2 3 4 5 6 7 8
2016-17 80.0 6.6 8.0 33.8 76.3 0.4 205.12017-18 160.0 6.0 2.0 30.0 58.6 1.5 258.12018-19 360.0 7.0 2.0 27.6 65.8 1.3 463.72019-20 209.9 9.8 1.0 26.1 78.4 1.6 326.8
*: Includes both capital subsidy and interest subvention.**: Includes interest subsidy for technology upgradation/ modernisation, credit guarantee fund trust scheme, incentives to MSME unit to promote energy efficiency and reimbursement for acquiring quality certification (Q-Cert).Source: Micro, Small and Medium Enterprises Department, Government of Tamil Nadu (GoTN).
(Contd...)
22 As per data from Ministry of Micro, Small and Medium Industries, Government of India on the basis of Udyog Aadhaar registration as on June 15, 2020.
COVID-19 and its Spatial Dimensions in India
63
The Tamil Nadu government announced a COVID Relief and Upliftment Scheme (CORUS) on March 31, 2020 to provide collateral-free immediate loans to MSMEs for meeting their capital expenditure and working capital needs. The state public sector enterprise, Tamil Nadu Industrial Investment Corporation (TIIC), which operates this scheme for existing customers, has sanctioned `125 crore up to June 2020 benefitting 1,064 MSMEs in the state (GoTN, 2020a). The government has also announced a special incentive package to promote manufacture of medical equipments/drugs required to tackle the COVID-19 pandemic in April 2020, provided that the manufacturers commence their production before July 31, 2020. Such MSMEs will also get priority under the NEEDS scheme.23 Five new MSMEs have applied for the incentives under this package till June 2020.
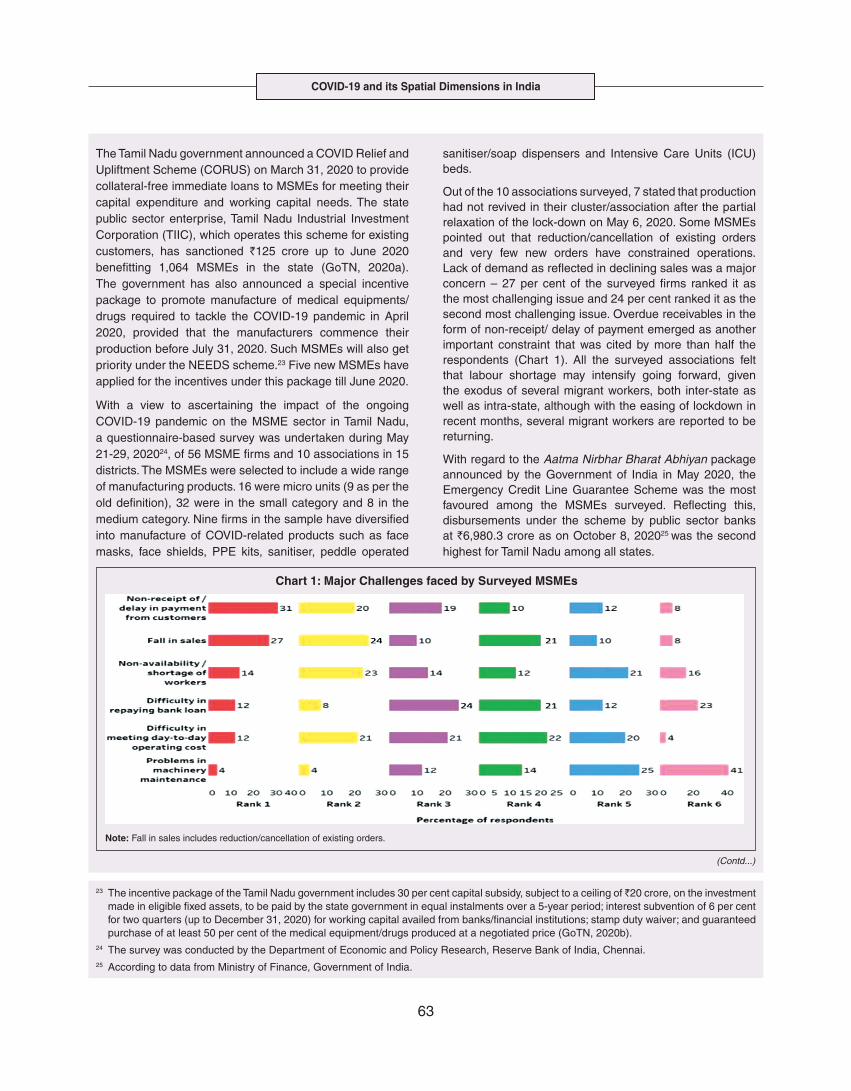
With a view to ascertaining the impact of the ongoing COVID-19 pandemic on the MSME sector in Tamil Nadu, a questionnaire-based survey was undertaken during May 21-29, 202024, of 56 MSME firms and 10 associations in 15 districts. The MSMEs were selected to include a wide range of manufacturing products. 16 were micro units (9 as per the old definition), 32 were in the small category and 8 in the medium category. Nine firms in the sample have diversified into manufacture of COVID-related products such as face masks, face shields, PPE kits, sanitiser, peddle operated
sanitiser/soap dispensers and Intensive Care Units (ICU) beds.
Out of the 10 associations surveyed, 7 stated that production had not revived in their cluster/association after the partial relaxation of the lock-down on May 6, 2020. Some MSMEs pointed out that reduction/cancellation of existing orders and very few new orders have constrained operations. Lack of demand as reflected in declining sales was a major concern – 27 per cent of the surveyed firms ranked it as the most challenging issue and 24 per cent ranked it as the second most challenging issue. Overdue receivables in the form of non-receipt/ delay of payment emerged as another important constraint that was cited by more than half the respondents (Chart 1). All the surveyed associations felt that labour shortage may intensify going forward, given the exodus of several migrant workers, both inter-state as well as intra-state, although with the easing of lockdown in recent months, several migrant workers are reported to be returning.
With regard to the Aatma Nirbhar Bharat Abhiyan package announced by the Government of India in May 2020, the Emergency Credit Line Guarantee Scheme was the most favoured among the MSMEs surveyed. Reflecting this, disbursements under the scheme by public sector banks at `6,980.3 crore as on October 8, 202025 was the second highest for Tamil Nadu among all states.
Chart 1: Major Challenges faced by Surveyed MSMEs
Note: Fall in sales includes reduction/cancellation of existing orders.
(Contd...)
23 The incentive package of the Tamil Nadu government includes 30 per cent capital subsidy, subject to a ceiling of ̀ 20 crore, on the investment made in eligible fixed assets, to be paid by the state government in equal instalments over a 5-year period; interest subvention of 6 per cent for two quarters (up to December 31, 2020) for working capital availed from banks/financial institutions; stamp duty waiver; and guaranteed purchase of at least 50 per cent of the medical equipment/drugs produced at a negotiated price (GoTN, 2020b).
24 The survey was conducted by the Department of Economic and Policy Research, Reserve Bank of India, Chennai.25 According to data from Ministry of Finance, Government of India.
State Finances : A Study of Budgets of 2020-21
64
with a corpus of `10,000 crore, will be created
for infusing `50,000 crore as equity into MSMEs
with growth potential and viability. Moreover,
global tenders will be disallowed in government
procurement tenders up to `200 crore. While all
these measures are likely to help MSMEs from
the supply side, particularly in increasing their
business, their effectiveness will depend upon
the revival of demand and improvement in orders
post-lock down (Ghosh, 2020; Purohit, 2020).
3.43 Consequent upon COVID-19 related
reverse migration, many states went ahead with
alteration in their labour laws (Annex III.3). Some
of them seek to address reverse migration and the
resultant labour shortage by enhancing work hours
and some have also experimented with relaxing/
suspending labour laws to enhance flexibility for
relocations of global value chains (GVCs). On May
14, 2020, the centre announced a few measures
as part of the Aatma Nirbhar Bharat Abhiyan
Programme to streamline the labour codes in the
country for the benefit of workers.
6. Digitalisation and Banking
3.44 Digital technologies offer immense scope
to mobilise resources and for provision of public
goods and services, especially during pandemics.
Digitalising government-to-person (G2P) transfers
carry positive externalities that include increased
transparency, better identification and targeting,
reduced leakages, more convenient and faster
transfer of funds, safer transactions with lower
transaction costs and privacy of payments besides
furthering financial inclusion (World Bank, 2014;
Klapper and Singer, 2017; Mishra and Dey, 2020).
To the degree G2P digital payments replace
cash, there is improvement in tax compliance
and shrinking of the shadow economy (Gupta
et al., 2017). India’s track record of adoption of
digital technology is reflected in IMD’s World
Digital Competitiveness Ranking, 2020 in which it
ranks 19th in a list of countries with population of
20 million or more, well ahead of most emerging
market peers (Chart III.22).
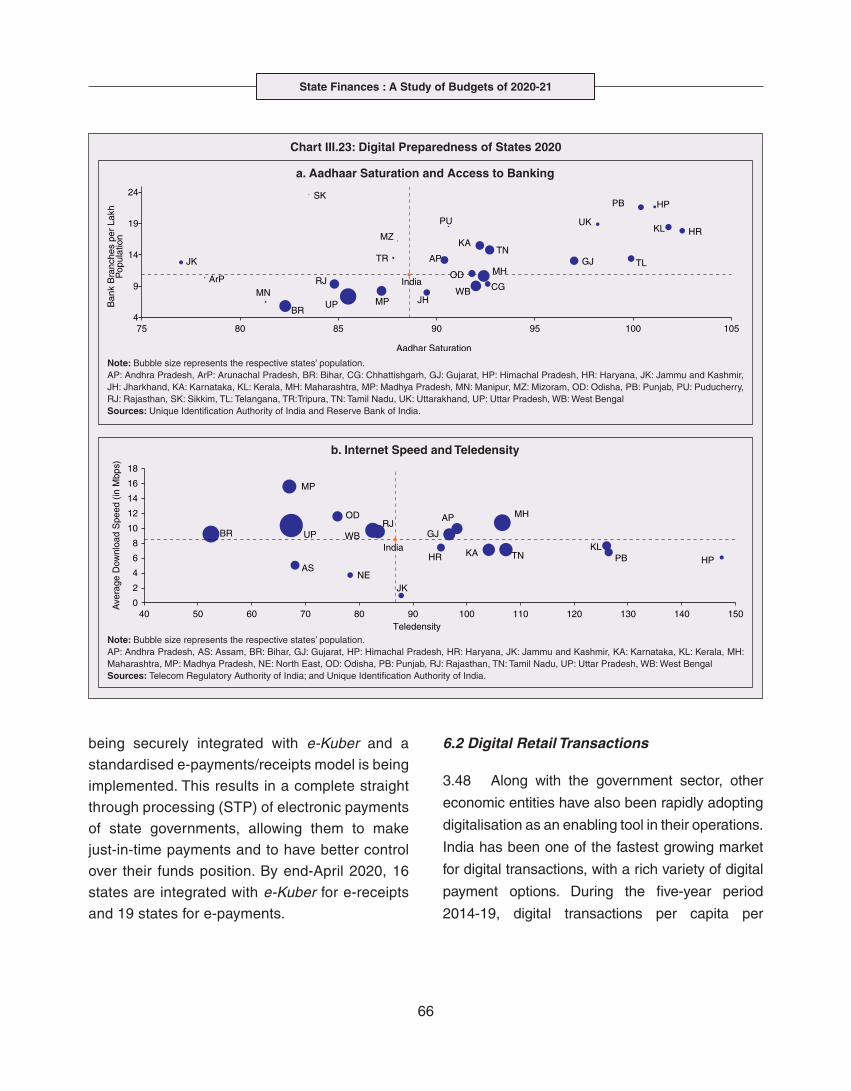
6.1 Digital Preparedness of States
3.45 The Direct Benefit Transfer (DBT) system,
launched by the union government in January
2013, was developed to transfer subsidies/
benefits directly to Aadhaar linked bank accounts
of the identified beneficiaries. Subsequently, state
governments were nudged by the centre to move
their welfare schemes to the Aadhaar-based
DBT platform, which ensures timely transfer of
benefits directly to the beneficiaries without any
Going forward, the signing of memorandum of understanding (MoU) by Tamil Nadu government with 17 foreign investors for `15,128 crores26 during the first quarter of 2020-21 to facilitate the relocation of their manufacturing activities has created an opportunity for MSMEs to meet their supply chain requirements from within the state. During 2020-21(up to October 12), Tamil Nadu has garnered an overall investment of over `41,000 crores through MoUs signed with domestic and foreign investors (GoTN, 2020d and GoTN, 2020e).
26 Refer GoTN(2020c).
References:
1. GoTN (2020a), Press Release No. 447, June 25.
2. GoTN (2020b), G.O. No. 113, April 2.
3. GoTN (2020c), Press Release No. 422, June 13.
4. GoTN (2020d), Press Release No. 686, September 19.
5. GoTN (2020e), Press Release No. 750, October 12.

COVID-19 and its Spatial Dimensions in India
65
need of paperwork and curbs leakages by linking
the Aadhaar numbers to the beneficiaries. The
success of DBT depends, inter alia, on Aadhaar
saturation27, availability of banking services and
high-speed internet as these are instrumental
in minimising inclusion and exclusion errors.
More populous states like Bihar, Uttar Pradesh,
Rajasthan and Madhya Pradesh lag behind
the national average in terms of both Aadhaar
saturation and availability of banking services
(Chart III.23a). While there are small variations
in average internet download speed, overall
teledensity28 still varies widely amongst states, with
Bihar, Uttar Pradesh, Madhya Pradesh, Assam
lagging significantly, reporting a teledensity below
70 (Chart III.23b).
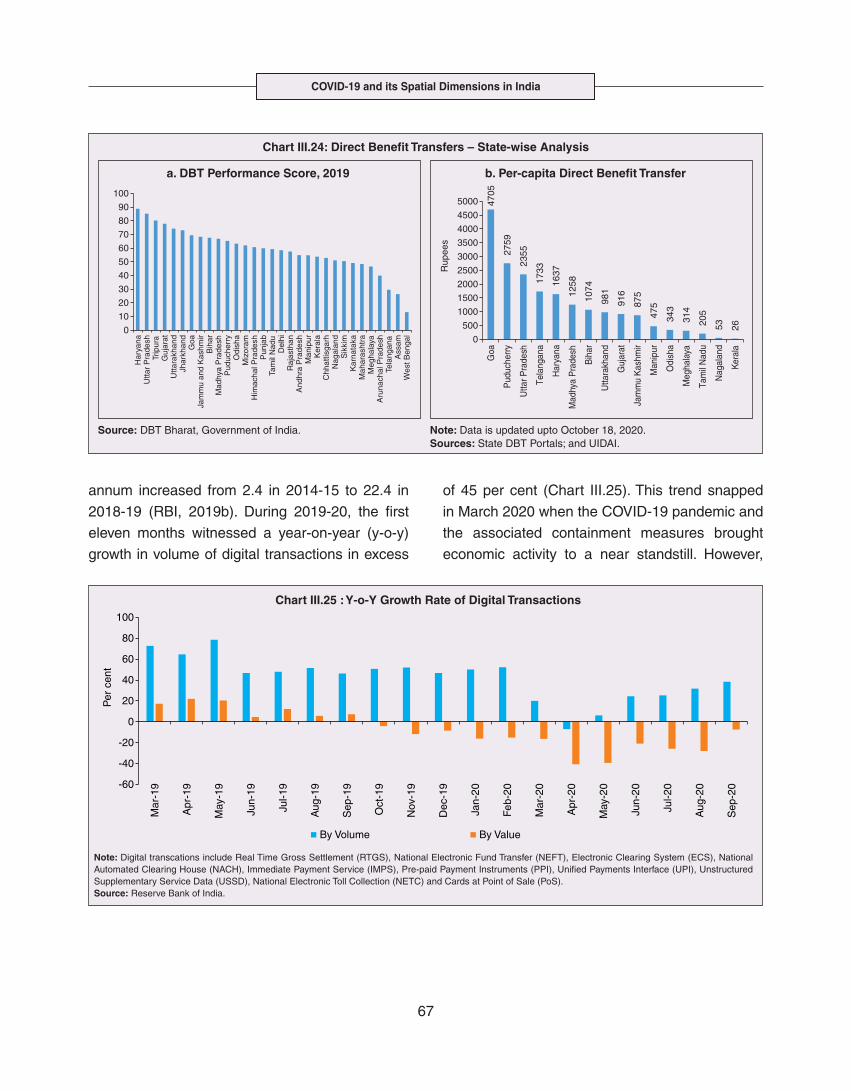
3.46 The ability of state governments to mitigate
the effects of the pandemic crucially depends on
their capacity to harness digital technologies.
States have been assigned DBT scores, in the
spirit of competitive federalism, based on their
performance in 2019 on parameters like Aadhaar
saturation, data reporting, savings-expenditure
ratio and DBT per capita. Haryana tops this
list, with an overall score of 88.8 as against
the national average of 56.1 (Chart III.24a). In
COVID-19 times, owing to social distancing norms,
scaling up public work programmes became
challenging, and consequently digital financial
transfers have emerged as the most viable public
intervention throughout the world. In India, several
state governments have adopted large-scale,
technology-enabled, real-time financial support
through the DBT platform in order to provide
immediate relief to vulnerable sections of the
population like small farmers, migrant labour,
women and senior citizens. Of the states and UTs
for which data are available for 2020-21, Goa leads
with a per capita DBT of `4,705 (Chart III.24b).
Several digital strategies have also been adopted
by states in the COVID-19 period for information
dissemination, effective surveillance and citizen
services, which aim to improve the quality of public
services as well as spur innovation by unlocking
the power of government data (Annex III.4).
3.47 Public financial management (PFM)
systems can also leverage digital solutions for
efficient and transparent implementation of
government programmes in the COVID-19 and
post COVID-19 period. In this regard, the Reserve
Bank as a banker to state governments is
leveraging its Core Banking System i.e., e-Kuber
to augment states’ capacity for digitalisation. To
achieve complete automation of process flow,
the centralised treasury systems of states are
Chart III.22: Digital Competitiveness Score, 2020
Source: IMD World Digital Competitiveness Ranking, 2020.
US
AS
outh
Ko
rea
Ta
iwa
nC
an
ad
aU
KA
ust
ralia
Ch
ina
Ge
rma
ny
Fra
nce
Mala
ysia
Jap
an
Po
lan
dS
pain
Sa
ud
i Ara
bia
Thaila
nd
Italy
Russ
iaT
urk
ey
Ind
iaB
razi
lM
exi
coP
eru
Ind
on
esi
aP
hili
pp
ine
s
Ukr
ain
eA
rge
ntin
a
So
uth
Afr
ica
Co
lom
bia
Ve
ne
zue
la0
10
20
30
40
50
60
70
80
90
100
27 Aadhaar saturation is defined as the ratio of number of live Aadhaars assigned to the total population.28 Teledensity is defined as total telephone subscribers per 100 population.
State Finances : A Study of Budgets of 2020-21
66
being securely integrated with e-Kuber and a
standardised e-payments/receipts model is being
implemented. This results in a complete straight
through processing (STP) of electronic payments
of state governments, allowing them to make
just-in-time payments and to have better control
over their funds position. By end-April 2020, 16
states are integrated with e-Kuber for e-receipts
and 19 states for e-payments.
6.2 Digital Retail Transactions
3.48 Along with the government sector, other
economic entities have also been rapidly adopting
digitalisation as an enabling tool in their operations.
India has been one of the fastest growing market
for digital transactions, with a rich variety of digital
payment options. During the five-year period
2014-19, digital transactions per capita per
Chart III.23: Digital Preparedness of States 2020
a. Aadhaar Saturation and Access to Banking
Note: Bubble size represents the respective states’ population.AP: Andhra Pradesh, ArP: Arunachal Pradesh, BR: Bihar, CG: Chhattishgarh, GJ: Gujarat, HP: Himachal Pradesh, HR: Haryana, JK: Jammu and Kashmir, JH: Jharkhand, KA: Karnataka, KL: Kerala, MH: Maharashtra, MP: Madhya Pradesh, MN: Manipur, MZ: Mizoram, OD: Odisha, PB: Punjab, PU: Puducherry, RJ: Rajasthan, SK: Sikkim, TL: Telangana, TR:Tripura, TN: Tamil Nadu, UK: Uttarakhand, UP: Uttar Pradesh, WB: West BengalSources: Unique Identification Authority of India and Reserve Bank of India.
b. Internet Speed and Teledensity
Note: Bubble size represents the respective states’ population.AP: Andhra Pradesh, AS: Assam, BR: Bihar, GJ: Gujarat, HP: Himachal Pradesh, HR: Haryana, JK: Jammu and Kashmir, KA: Karnataka, KL: Kerala, MH: Maharashtra, MP: Madhya Pradesh, NE: North East, OD: Odisha, PB: Punjab, RJ: Rajasthan, TN: Tamil Nadu, UP: Uttar Pradesh, WB: West BengalSources: Telecom Regulatory Authority of India; and Unique Identification Authority of India.
COVID-19 and its Spatial Dimensions in India
67
annum increased from 2.4 in 2014-15 to 22.4 in
2018-19 (RBI, 2019b). During 2019-20, the first
eleven months witnessed a year-on-year (y-o-y)
growth in volume of digital transactions in excess
of 45 per cent (Chart III.25). This trend snapped
in March 2020 when the COVID-19 pandemic and
the associated containment measures brought
economic activity to a near standstill. However,
Chart III.24: Direct Benefit Transfers – State-wise Analysis
a. DBT Performance Score, 2019 b. Per-capita Direct Benefit Transfer
Source: DBT Bharat, Government of India.
Note: Data is updated upto October 18, 2020.Sources: State DBT Portals; and UIDAI.
0
10
20
30
40
50
60
70
80
90
100
Har
yana
Utta
rP
rade
shTr
ipur
aG
ujar
atU
ttara
khan
dJh
arkh
and
Goa
Jam
mu
and
Kas
hmir
Bih
arM
adhy
aP
rade
shP
uduc
herr
yO
dish
aM
izor
amH
imac
hal P
rade
shP
unja
bTa
mil
Nad
uD
elhi
Raj
asth
anA
ndhr
aP
rade
shM
anip
urK
eral
aC
hhat
tisga
rhN
agal
and
Sik
kim
Kar
nata
kaM
ahar
asht
raM
egha
laya
Aru
nach
al P
rade
shTe
lang
ana
Ass
amW
est B
enga
l
4705
2759
2355
1733
1637
1258
1074
981
916
875
475
343
314
205
53 26
0
500
1000
1500
2000
2500
3000
3500
4000
4500
5000
Goa
Pud
uche
rry
Utta
r Pra
desh
Tela
ngan
a
Har
yana
Mad
hya
Pra
desh
Bih
ar
Utta
rakh
and
Guj
arat
Jam
mu
Kas
hmir
Man
ipur
Odi
sha
Meg
hala
ya
Tam
ilN
adu
Nag
alan
d
Kera
la
Rup
ees
Chart III.25 : Y-o-Y Growth Rate of Digital Transactions
Note: Digital transcations include Real Time Gross Settlement (RTGS), National Electronic Fund Transfer (NEFT), Electronic Clearing System (ECS), National Automated Clearing House (NACH), Immediate Payment Service (IMPS), Pre-paid Payment Instruments (PPI), Unified Payments Interface (UPI), Unstructured Supplementary Service Data (USSD), National Electronic Toll Collection (NETC) and Cards at Point of Sale (PoS).Source: Reserve Bank of India.
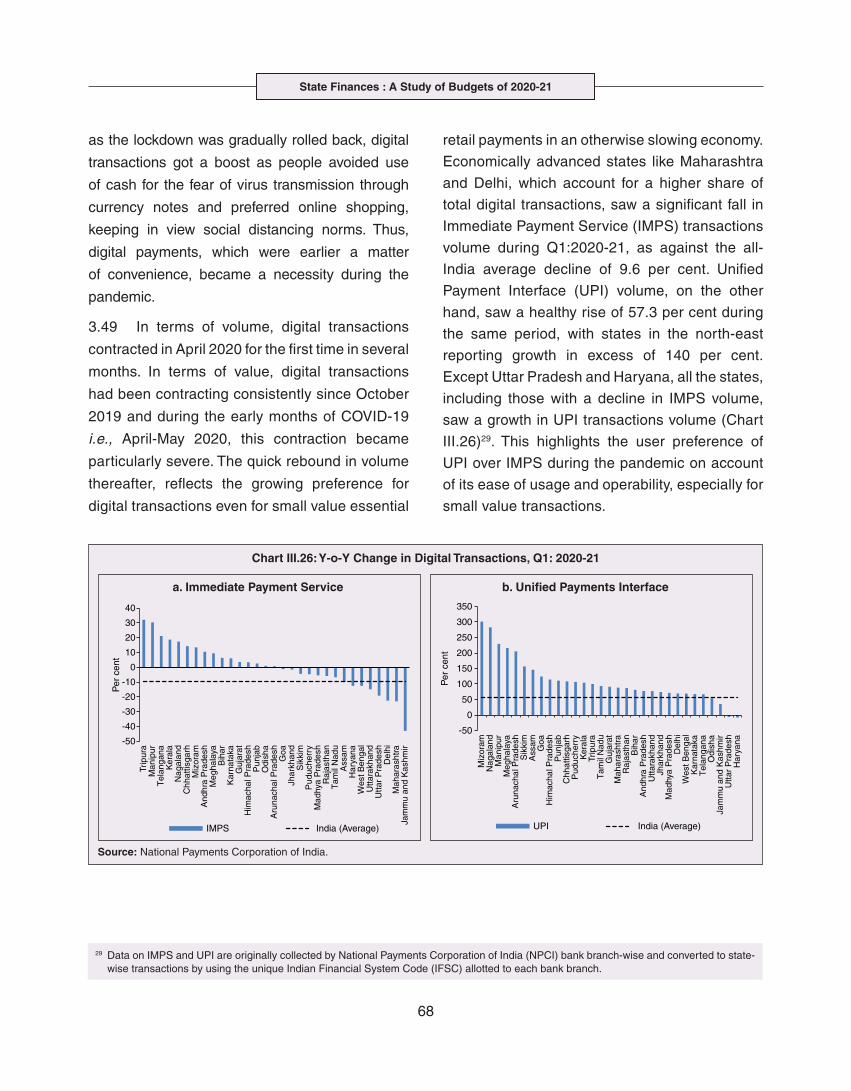
State Finances : A Study of Budgets of 2020-21
68
as the lockdown was gradually rolled back, digital
transactions got a boost as people avoided use
of cash for the fear of virus transmission through
currency notes and preferred online shopping,
keeping in view social distancing norms. Thus,
digital payments, which were earlier a matter
of convenience, became a necessity during the
pandemic.
3.49 In terms of volume, digital transactions
contracted in April 2020 for the first time in several
months. In terms of value, digital transactions
had been contracting consistently since October
2019 and during the early months of COVID-19
i.e., April-May 2020, this contraction became
particularly severe. The quick rebound in volume
thereafter, reflects the growing preference for
digital transactions even for small value essential
retail payments in an otherwise slowing economy.
Economically advanced states like Maharashtra
and Delhi, which account for a higher share of
total digital transactions, saw a significant fall in
Immediate Payment Service (IMPS) transactions
volume during Q1:2020-21, as against the all-
India average decline of 9.6 per cent. Unified
Payment Interface (UPI) volume, on the other
hand, saw a healthy rise of 57.3 per cent during
the same period, with states in the north-east
reporting growth in excess of 140 per cent.
Except Uttar Pradesh and Haryana, all the states,
including those with a decline in IMPS volume,
saw a growth in UPI transactions volume (Chart
III.26)29. This highlights the user preference of
UPI over IMPS during the pandemic on account
of its ease of usage and operability, especially for
small value transactions.
29 Data on IMPS and UPI are originally collected by National Payments Corporation of India (NPCI) bank branch-wise and converted to state-wise transactions by using the unique Indian Financial System Code (IFSC) allotted to each bank branch.
Chart III.26: Y-o-Y Change in Digital Transactions, Q1: 2020-21
Source: National Payments Corporation of India.
b. Unified Payments Interfacea. Immediate Payment Service
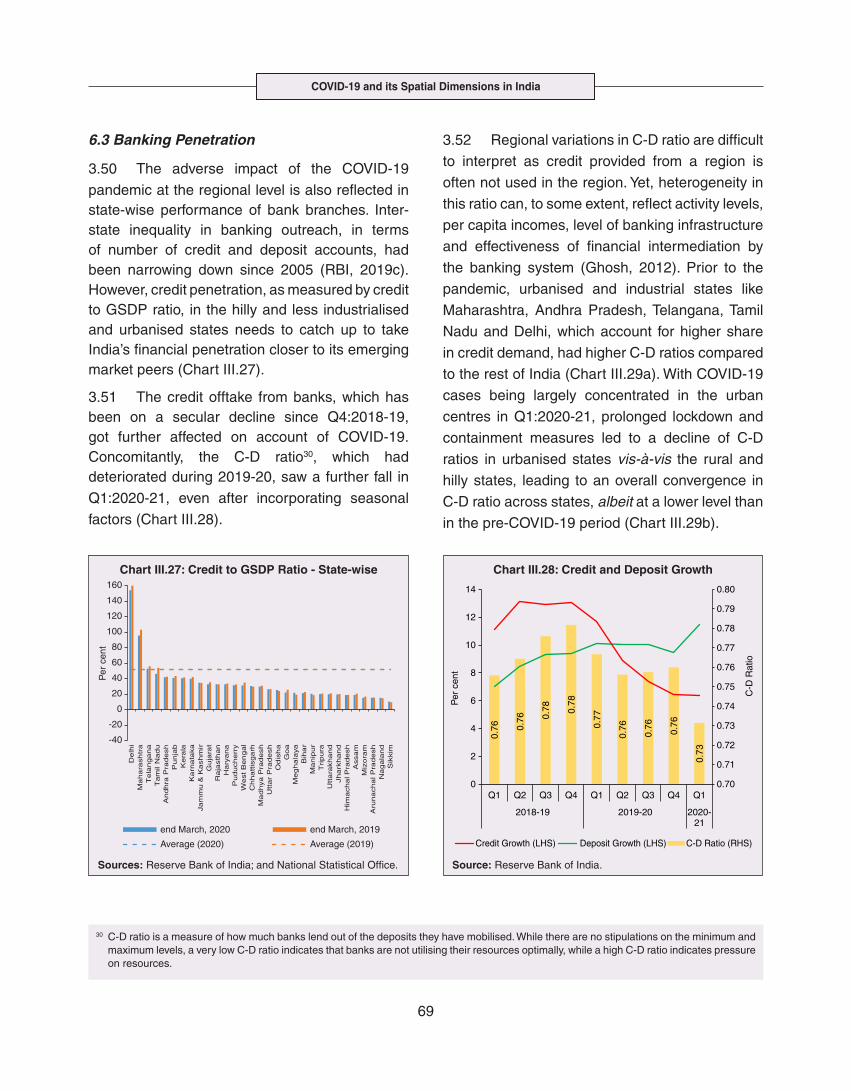
COVID-19 and its Spatial Dimensions in India
69
6.3 Banking Penetration
3.50 The adverse impact of the COVID-19
pandemic at the regional level is also reflected in state-wise performance of bank branches. Inter-state inequality in banking outreach, in terms of number of credit and deposit accounts, had been narrowing down since 2005 (RBI, 2019c). However, credit penetration, as measured by credit to GSDP ratio, in the hilly and less industrialised and urbanised states needs to catch up to take India’s financial penetration closer to its emerging market peers (Chart III.27).
3.51 The credit offtake from banks, which has been on a secular decline since Q4:2018-19, got further affected on account of COVID-19. Concomitantly, the C-D ratio30, which had deteriorated during 2019-20, saw a further fall in
Q1:2020-21, even after incorporating seasonal
factors (Chart III.28).
3.52 Regional variations in C-D ratio are difficult
to interpret as credit provided from a region is
often not used in the region. Yet, heterogeneity in
this ratio can, to some extent, reflect activity levels,
per capita incomes, level of banking infrastructure
and effectiveness of financial intermediation by
the banking system (Ghosh, 2012). Prior to the
pandemic, urbanised and industrial states like
Maharashtra, Andhra Pradesh, Telangana, Tamil
Nadu and Delhi, which account for higher share
in credit demand, had higher C-D ratios compared
to the rest of India (Chart III.29a). With COVID-19
cases being largely concentrated in the urban
centres in Q1:2020-21, prolonged lockdown and
containment measures led to a decline of C-D
ratios in urbanised states vis-à-vis the rural and
hilly states, leading to an overall convergence in
C-D ratio across states, albeit at a lower level than
in the pre-COVID-19 period (Chart III.29b).
30 C-D ratio is a measure of how much banks lend out of the deposits they have mobilised. While there are no stipulations on the minimum and maximum levels, a very low C-D ratio indicates that banks are not utilising their resources optimally, while a high C-D ratio indicates pressure on resources.
Chart III.27: Credit to GSDP Ratio - State-wise
Sources: Reserve Bank of India; and National Statistical Office.
-40
-20
0
20
40
60
80
100
120
140
160
Delh
iM
ahara
shtr
aT
ela
ngana
Tam
ilN
ad
uA
ndh
raP
radesh
Punja
bK
era
laK
arn
ata
ka
Jam
mu &
Kashm
irG
uja
rat
Ra
jasth
an
Hary
ana
Pudu
cherr
yW
est B
eng
al
Ch
ha
ttis
ga
rhM
ad
hya
Pra
desh
Utt
ar
Pra
de
sh
Odis
ha
Goa
Me
gh
ala
ya
Bih
ar
Manip
ur
Tripura
Uttara
khan
dJhark
han
dH
ima
ch
alP
radesh
Assam
Miz
ora
mA
runachal P
radesh
Nagala
nd
Sik
kim
Per
cen
t
end March, 2020 end March, 2019
Average (2020) Average (2019)
Chart III.28: Credit and Deposit Growth
Source: Reserve Bank of India.
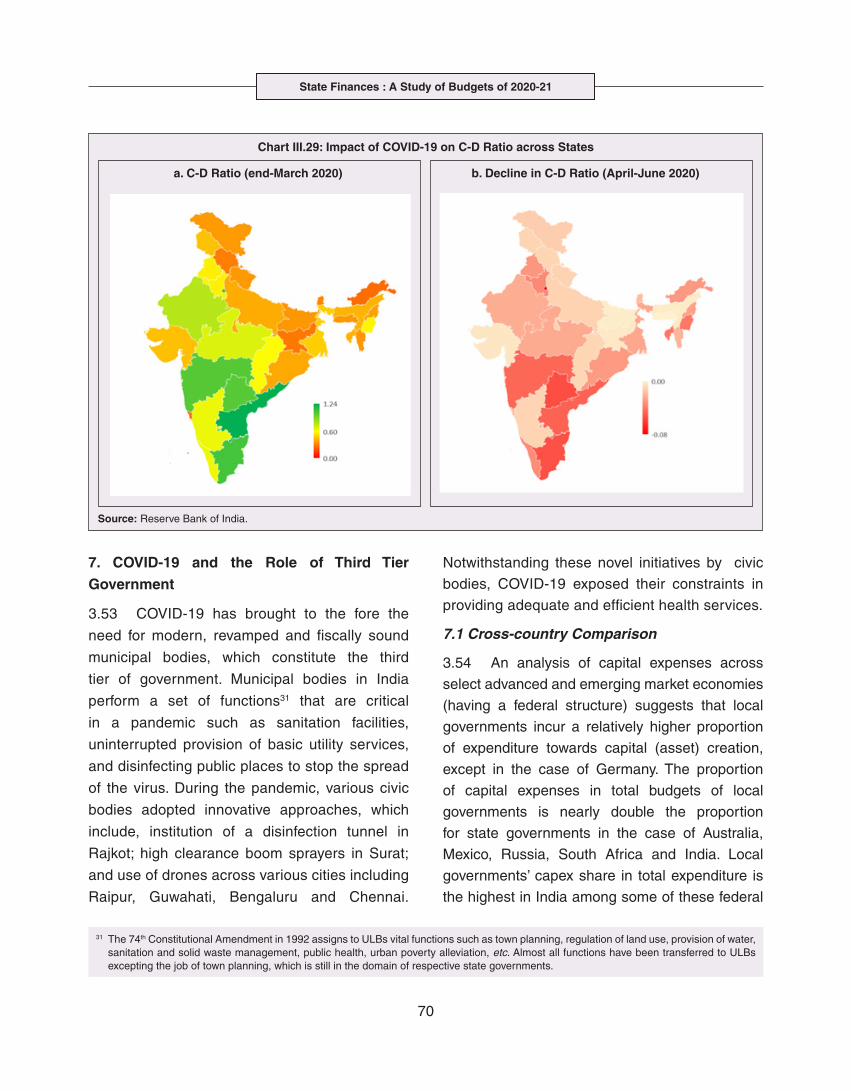
State Finances : A Study of Budgets of 2020-21
70
7. COVID-19 and the Role of Third Tier
Government
3.53 COVID-19 has brought to the fore the
need for modern, revamped and fiscally sound
municipal bodies, which constitute the third
tier of government. Municipal bodies in India
perform a set of functions31 that are critical
in a pandemic such as sanitation facilities,
uninterrupted provision of basic utility services,
and disinfecting public places to stop the spread
of the virus. During the pandemic, various civic
bodies adopted innovative approaches, which
include, institution of a disinfection tunnel in
Rajkot; high clearance boom sprayers in Surat;
and use of drones across various cities including
Raipur, Guwahati, Bengaluru and Chennai.
Notwithstanding these novel initiatives by civic
bodies, COVID-19 exposed their constraints in
providing adequate and efficient health services.
7.1 Cross-country Comparison
3.54 An analysis of capital expenses across
select advanced and emerging market economies
(having a federal structure) suggests that local
governments incur a relatively higher proportion
of expenditure towards capital (asset) creation,
except in the case of Germany. The proportion
of capital expenses in total budgets of local
governments is nearly double the proportion
for state governments in the case of Australia,
Mexico, Russia, South Africa and India. Local
governments’ capex share in total expenditure is
the highest in India among some of these federal
31 The 74th Constitutional Amendment in 1992 assigns to ULBs vital functions such as town planning, regulation of land use, provision of water, sanitation and solid waste management, public health, urban poverty alleviation, etc. Almost all functions have been transferred to ULBs excepting the job of town planning, which is still in the domain of respective state governments.
Chart III.29: Impact of COVID-19 on C-D Ratio across States
a. C-D Ratio (end-March 2020) b. Decline in C-D Ratio (April-June 2020)
Source: Reserve Bank of India.
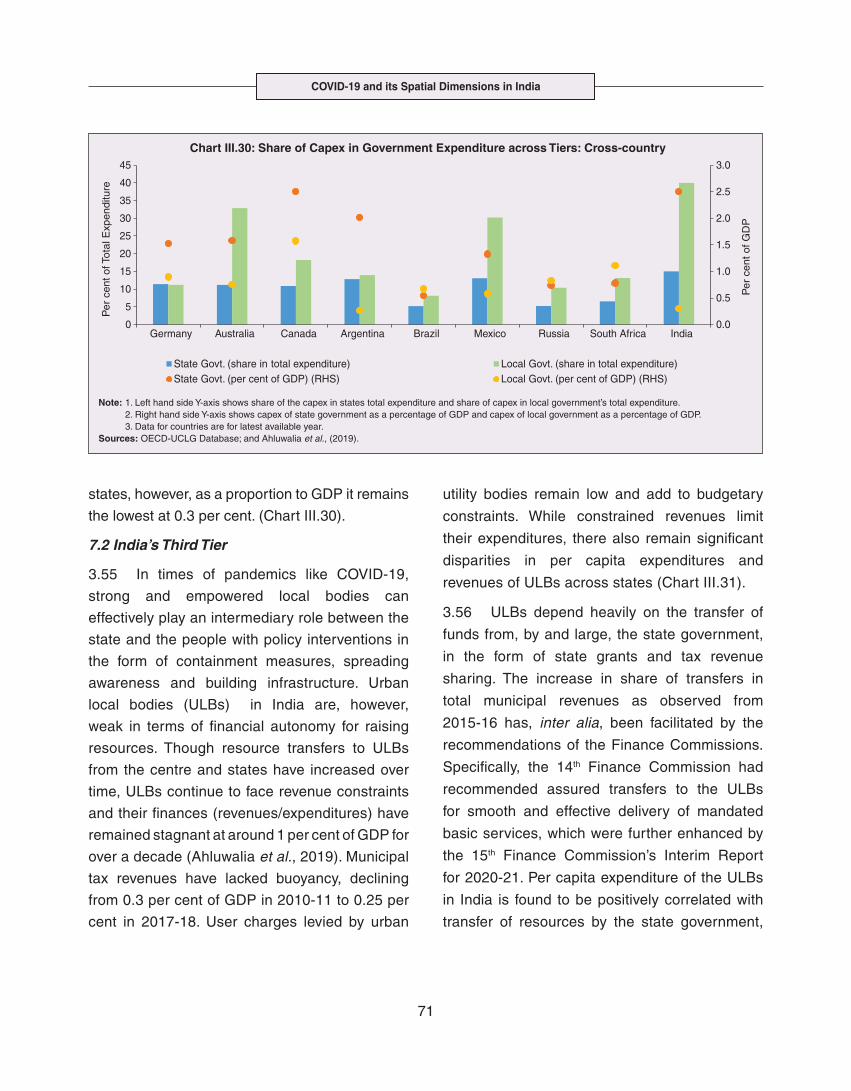
COVID-19 and its Spatial Dimensions in India
71
states, however, as a proportion to GDP it remains
the lowest at 0.3 per cent. (Chart III.30).
7.2 India’s Third Tier
3.55 In times of pandemics like COVID-19,
strong and empowered local bodies can
effectively play an intermediary role between the
state and the people with policy interventions in
the form of containment measures, spreading
awareness and building infrastructure. Urban
local bodies (ULBs) in India are, however,
weak in terms of financial autonomy for raising
resources. Though resource transfers to ULBs
from the centre and states have increased over
time, ULBs continue to face revenue constraints
and their finances (revenues/expenditures) have
remained stagnant at around 1 per cent of GDP for
over a decade (Ahluwalia et al., 2019). Municipal
tax revenues have lacked buoyancy, declining
from 0.3 per cent of GDP in 2010-11 to 0.25 per
cent in 2017-18. User charges levied by urban
utility bodies remain low and add to budgetary
constraints. While constrained revenues limit
their expenditures, there also remain significant
disparities in per capita expenditures and
revenues of ULBs across states (Chart III.31).
3.56 ULBs depend heavily on the transfer of
funds from, by and large, the state government,
in the form of state grants and tax revenue
sharing. The increase in share of transfers in
total municipal revenues as observed from
2015-16 has, inter alia, been facilitated by the
recommendations of the Finance Commissions.
Specifically, the 14th Finance Commission had
recommended assured transfers to the ULBs
for smooth and effective delivery of mandated
basic services, which were further enhanced by
the 15th Finance Commission’s Interim Report
for 2020-21. Per capita expenditure of the ULBs
in India is found to be positively correlated with
transfer of resources by the state government,
Chart III.30: Share of Capex in Government Expenditure across Tiers: Cross-country
Note: 1. Left hand side Y-axis shows share of the capex in states total expenditure and share of capex in local government’s total expenditure. 2. Right hand side Y-axis shows capex of state government as a percentage of GDP and capex of local government as a percentage of GDP. 3. Data for countries are for latest available year.Sources: OECD-UCLG Database; and Ahluwalia et al., (2019).
0.0
0.5
1.0
1.5
2.0
2.5
3.0
0
5
10
15
20
25
30
35
40
45
Germany Australia Canada Argentina Brazil Mexico Russia South Africa India
Per
cent
of G
DP
Per
cent
ofT
otal
Exp
endi
ture
State Govt. (share in total expenditure) Local Govt. (share in total expenditure)State Govt. (per cent of GDP) (RHS) Local Govt. (per cent of GDP) (RHS)
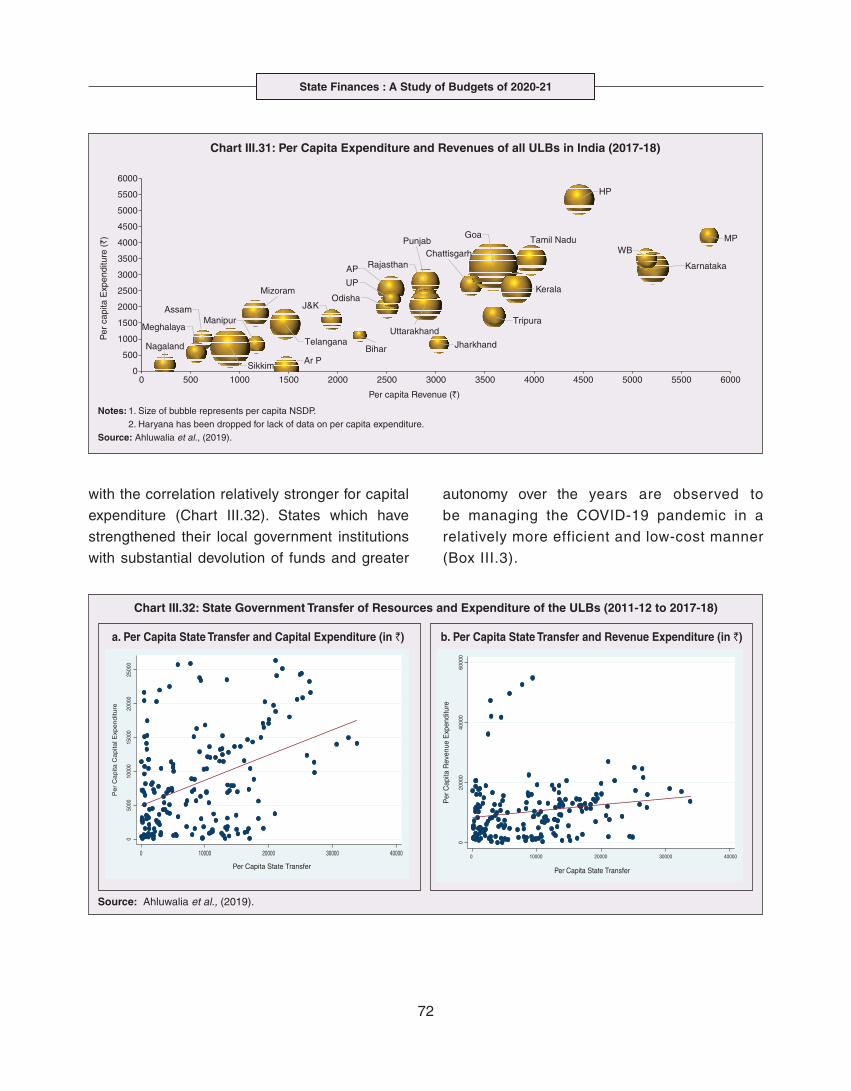
State Finances : A Study of Budgets of 2020-21
72
with the correlation relatively stronger for capital
expenditure (Chart III.32). States which have
strengthened their local government institutions
with substantial devolution of funds and greater
autonomy over the years are observed to
be managing the COVID-19 pandemic in a
relatively more efficient and low-cost manner
(Box III.3).
Chart III.31: Per Capita Expenditure and Revenues of all ULBs in India (2017-18)
Notes: 1. Size of bubble represents per capita NSDP. 2. Haryana has been dropped for lack of data on per capita expenditure.Source: Ahluwalia et al., (2019).
AP
Ar P
Assam
Bihar
Chattisgarh
Goa
HP
J&K
Jharkhand
Karnataka
Kerala
MP
ManipurMeghalaya
Mizoram
Nagaland
Odisha
Punjab
Rajasthan
Sikkim
Tamil Nadu
Telangana
Tripura
UP
Uttarakhand
WB
0
500
1000
1500
2000
2500
3000
3500
4000
4500
5000
5500
6000
0 500 1000 1500 2000 2500 3000 3500 4000 4500 5000 5500 6000
Per
cap
itaE
xpen
ditu
re (
)`
Per capita Revenue ( )`
Chart III.32: State Government Transfer of Resources and Expenditure of the ULBs (2011-12 to 2017-18)
Source: Ahluwalia et al., (2019).
b. Per Capita State Transfer and Revenue Expenditure (in `)a. Per Capita State Transfer and Capital Expenditure (in `)
050
0010
000
1500
020
000
2500
0
Pe
rC
ap
itaC
ap
ital E
xpe
nd
iture
0 10000 20000 30000 40000
Per Capita State Transfer
020
000
4000
060
000
Per
Cap
itaR
even
ueE
xpen
ditu
re
0 10000 20000 30000 40000
Per Capita State Transfer
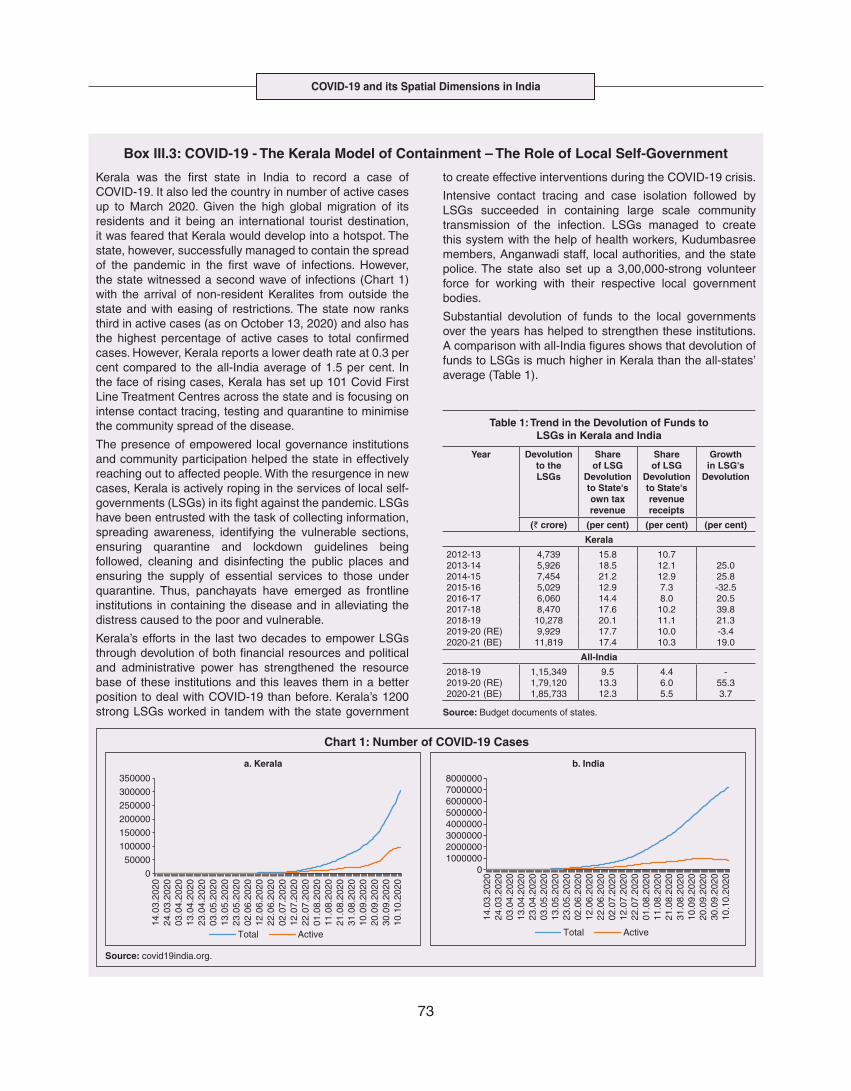
COVID-19 and its Spatial Dimensions in India
73
Box III.3: COVID-19 - The Kerala Model of Containment – The Role of Local Self-Government
Kerala was the first state in India to record a case of COVID-19. It also led the country in number of active cases up to March 2020. Given the high global migration of its residents and it being an international tourist destination, it was feared that Kerala would develop into a hotspot. The state, however, successfully managed to contain the spread of the pandemic in the first wave of infections. However, the state witnessed a second wave of infections (Chart 1) with the arrival of non-resident Keralites from outside the state and with easing of restrictions. The state now ranks third in active cases (as on October 13, 2020) and also has the highest percentage of active cases to total confirmed cases. However, Kerala reports a lower death rate at 0.3 per cent compared to the all-India average of 1.5 per cent. In the face of rising cases, Kerala has set up 101 Covid First Line Treatment Centres across the state and is focusing on intense contact tracing, testing and quarantine to minimise the community spread of the disease.
The presence of empowered local governance institutions and community participation helped the state in effectively reaching out to affected people. With the resurgence in new cases, Kerala is actively roping in the services of local self-governments (LSGs) in its fight against the pandemic. LSGs have been entrusted with the task of collecting information, spreading awareness, identifying the vulnerable sections, ensuring quarantine and lockdown guidelines being followed, cleaning and disinfecting the public places and ensuring the supply of essential services to those under quarantine. Thus, panchayats have emerged as frontline institutions in containing the disease and in alleviating the distress caused to the poor and vulnerable.
Kerala’s efforts in the last two decades to empower LSGs through devolution of both financial resources and political and administrative power has strengthened the resource base of these institutions and this leaves them in a better position to deal with COVID-19 than before. Kerala’s 1200 strong LSGs worked in tandem with the state government
to create effective interventions during the COVID-19 crisis.
Intensive contact tracing and case isolation followed by LSGs succeeded in containing large scale community transmission of the infection. LSGs managed to create this system with the help of health workers, Kudumbasree members, Anganwadi staff, local authorities, and the state police. The state also set up a 3,00,000-strong volunteer force for working with their respective local government bodies.
Substantial devolution of funds to the local governments over the years has helped to strengthen these institutions. A comparison with all-India figures shows that devolution of funds to LSGs is much higher in Kerala than the all-states’ average (Table 1).
Chart 1: Number of COVID-19 Cases
a. Kerala
Source: covid19india.org.
b. India
0
50000
100000
150000
200000
250000
300000
350000
14.0
3.20
2024
.03.
2020
03.0
4.20
2013
.04.
2020
23.0
4.20
2003
.05.
2020
13.0
5.20
2023
.05.
2020
02.0
6.20
2012
.06.
2020
22.0
6.20
2002
.07.
2020
12.0
7.20
2022
.07.
2020
01.0
8.20
2011
.08.
2020
21.0
8.20
2031
.08.
2020
10.0
9.20
2020
.09.
2020
30.0
9.20
2010
.10.
2020
Total Active
010000002000000300000040000005000000600000070000008000000
14.0
3.20
2024
.03.
2020
03.0
4.20
2013
.04.
2020
23.0
4.20
2003
.05.
2020
13.0
5.20
2023
.05.
2020
02.0
6.20
2012
.06.
2020
22.0
6.20
2002
.07.
2020
12.0
7.20
2022
.07.
2020
01.0
8.20
2011
.08.
2020
21.0
8.20
2031
.08.
2020
10.0
9.20
2020
.09.
2020
30.0
9.20
2010
.10.
2020
Total Active
Table 1: Trend in the Devolution of Funds to LSGs in Kerala and India
Year Devolution to the LSGs
Share of LSG
Devolution to State's own tax revenue
Share of LSG
Devolution to State's revenue receipts
Growth in LSG's
Devolution
(` crore) (per cent) (per cent) (per cent)
Kerala
2012-13 4,739 15.8 10.72013-14 5,926 18.5 12.1 25.02014-15 7,454 21.2 12.9 25.82015-16 5,029 12.9 7.3 -32.52016-17 6,060 14.4 8.0 20.52017-18 8,470 17.6 10.2 39.82018-19 10,278 20.1 11.1 21.32019-20 (RE) 9,929 17.7 10.0 -3.42020-21 (BE) 11,819 17.4 10.3 19.0
All-India
2018-19 1,15,349 9.5 4.4 -2019-20 (RE) 1,79,120 13.3 6.0 55.32020-21 (BE) 1,85,733 12.3 5.5 3.7
Source: Budget documents of states.
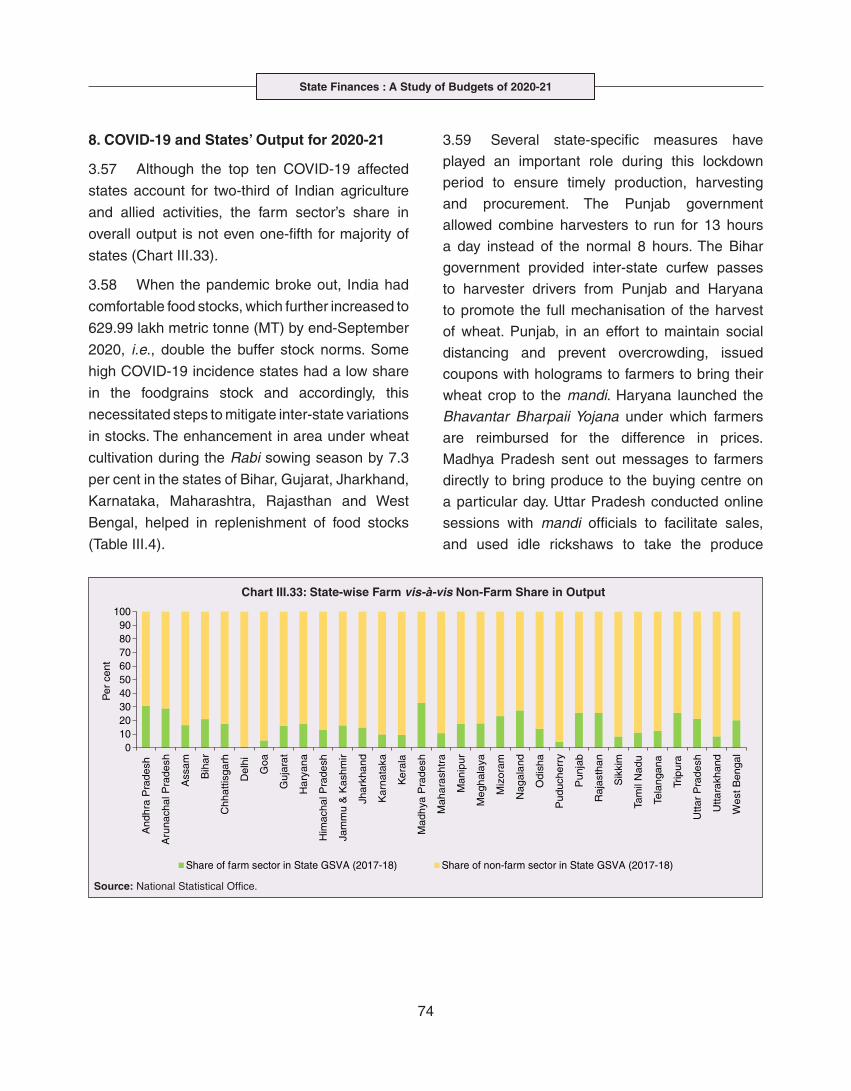
State Finances : A Study of Budgets of 2020-21
74
8. COVID-19 and States’ Output for 2020-21
3.57 Although the top ten COVID-19 affected
states account for two-third of Indian agriculture
and allied activities, the farm sector’s share in
overall output is not even one-fifth for majority of
states (Chart III.33).
3.58 When the pandemic broke out, India had
comfortable food stocks, which further increased to
629.99 lakh metric tonne (MT) by end-September
2020, i.e., double the buffer stock norms. Some
high COVID-19 incidence states had a low share
in the foodgrains stock and accordingly, this
necessitated steps to mitigate inter-state variations
in stocks. The enhancement in area under wheat
cultivation during the Rabi sowing season by 7.3
per cent in the states of Bihar, Gujarat, Jharkhand,
Karnataka, Maharashtra, Rajasthan and West
Bengal, helped in replenishment of food stocks
(Table III.4).
3.59 Several state-specific measures have
played an important role during this lockdown
period to ensure timely production, harvesting
and procurement. The Punjab government
allowed combine harvesters to run for 13 hours
a day instead of the normal 8 hours. The Bihar
government provided inter-state curfew passes
to harvester drivers from Punjab and Haryana
to promote the full mechanisation of the harvest
of wheat. Punjab, in an effort to maintain social
distancing and prevent overcrowding, issued
coupons with holograms to farmers to bring their
wheat crop to the mandi. Haryana launched the
Bhavantar Bharpaii Yojana under which farmers
are reimbursed for the difference in prices.
Madhya Pradesh sent out messages to farmers
directly to bring produce to the buying centre on
a particular day. Uttar Pradesh conducted online
sessions with mandi officials to facilitate sales,
and used idle rickshaws to take the produce
Chart III.33: State-wise Farm vis-à-vis Non-Farm Share in Output
Source: National Statistical Office.
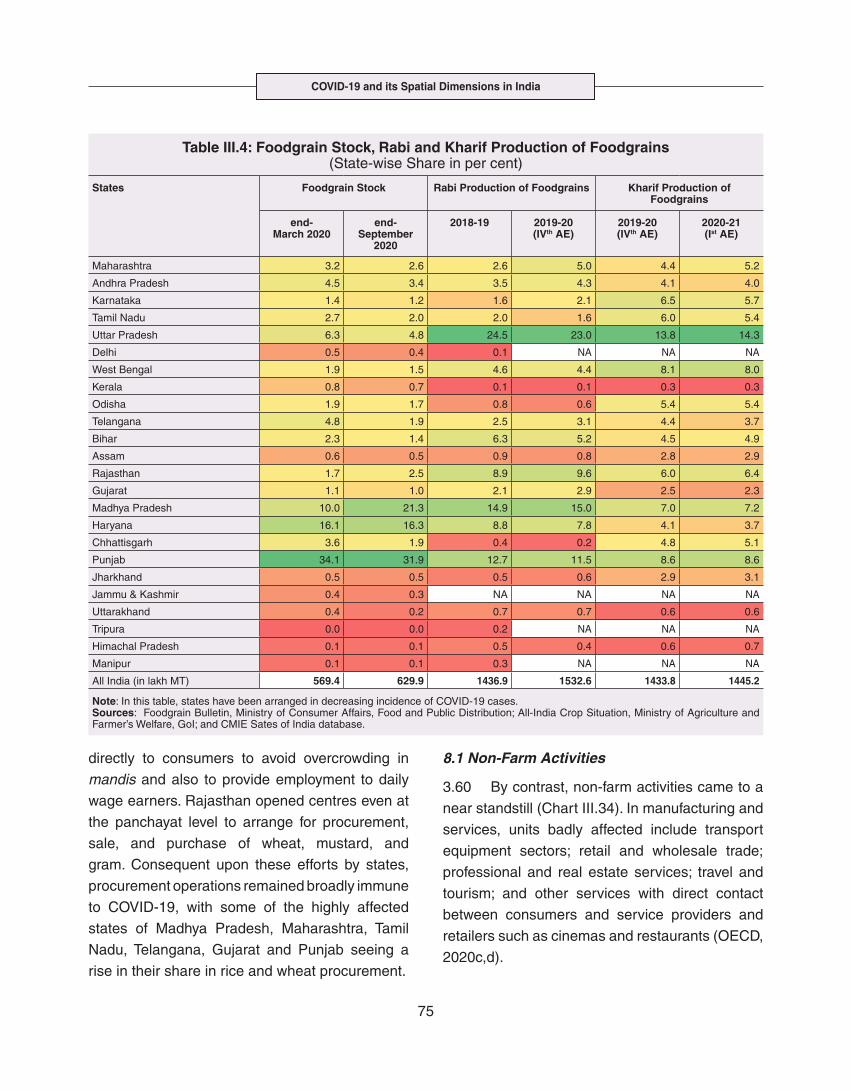
COVID-19 and its Spatial Dimensions in India
75
directly to consumers to avoid overcrowding in
mandis and also to provide employment to daily
wage earners. Rajasthan opened centres even at
the panchayat level to arrange for procurement,
sale, and purchase of wheat, mustard, and
gram. Consequent upon these efforts by states,
procurement operations remained broadly immune
to COVID-19, with some of the highly affected
states of Madhya Pradesh, Maharashtra, Tamil
Nadu, Telangana, Gujarat and Punjab seeing a
rise in their share in rice and wheat procurement.
8.1 Non-Farm Activities
3.60 By contrast, non-farm activities came to a
near standstill (Chart III.34). In manufacturing and
services, units badly affected include transport
equipment sectors; retail and wholesale trade;
professional and real estate services; travel and
tourism; and other services with direct contact
between consumers and service providers and
retailers such as cinemas and restaurants (OECD,
2020c,d).
Table III.4: Foodgrain Stock, Rabi and Kharif Production of Foodgrains (State-wise Share in per cent)
States Foodgrain Stock Rabi Production of Foodgrains Kharif Production of Foodgrains
end- March 2020
end- September
2020
2018-19 2019-20 (IVth AE)
2019-20 (IVth AE)
2020-21 (Ist AE)
Maharashtra 3.2 2.6 2.6 5.0 4.4 5.2
Andhra Pradesh 4.5 3.4 3.5 4.3 4.1 4.0
Karnataka 1.4 1.2 1.6 2.1 6.5 5.7
Tamil Nadu 2.7 2.0 2.0 1.6 6.0 5.4
Uttar Pradesh 6.3 4.8 24.5 23.0 13.8 14.3
Delhi 0.5 0.4 0.1 NA NA NA
West Bengal 1.9 1.5 4.6 4.4 8.1 8.0
Kerala 0.8 0.7 0.1 0.1 0.3 0.3
Odisha 1.9 1.7 0.8 0.6 5.4 5.4
Telangana 4.8 1.9 2.5 3.1 4.4 3.7
Bihar 2.3 1.4 6.3 5.2 4.5 4.9
Assam 0.6 0.5 0.9 0.8 2.8 2.9
Rajasthan 1.7 2.5 8.9 9.6 6.0 6.4
Gujarat 1.1 1.0 2.1 2.9 2.5 2.3
Madhya Pradesh 10.0 21.3 14.9 15.0 7.0 7.2
Haryana 16.1 16.3 8.8 7.8 4.1 3.7
Chhattisgarh 3.6 1.9 0.4 0.2 4.8 5.1
Punjab 34.1 31.9 12.7 11.5 8.6 8.6
Jharkhand 0.5 0.5 0.5 0.6 2.9 3.1
Jammu & Kashmir 0.4 0.3 NA NA NA NA
Uttarakhand 0.4 0.2 0.7 0.7 0.6 0.6
Tripura 0.0 0.0 0.2 NA NA NA
Himachal Pradesh 0.1 0.1 0.5 0.4 0.6 0.7
Manipur 0.1 0.1 0.3 NA NA NA
All India (in lakh MT) 569.4 629.9 1436.9 1532.6 1433.8 1445.2
Note: In this table, states have been arranged in decreasing incidence of COVID-19 cases.Sources: Foodgrain Bulletin, Ministry of Consumer Affairs, Food and Public Distribution; All-India Crop Situation, Ministry of Agriculture and Farmer’s Welfare, GoI; and CMIE Sates of India database.
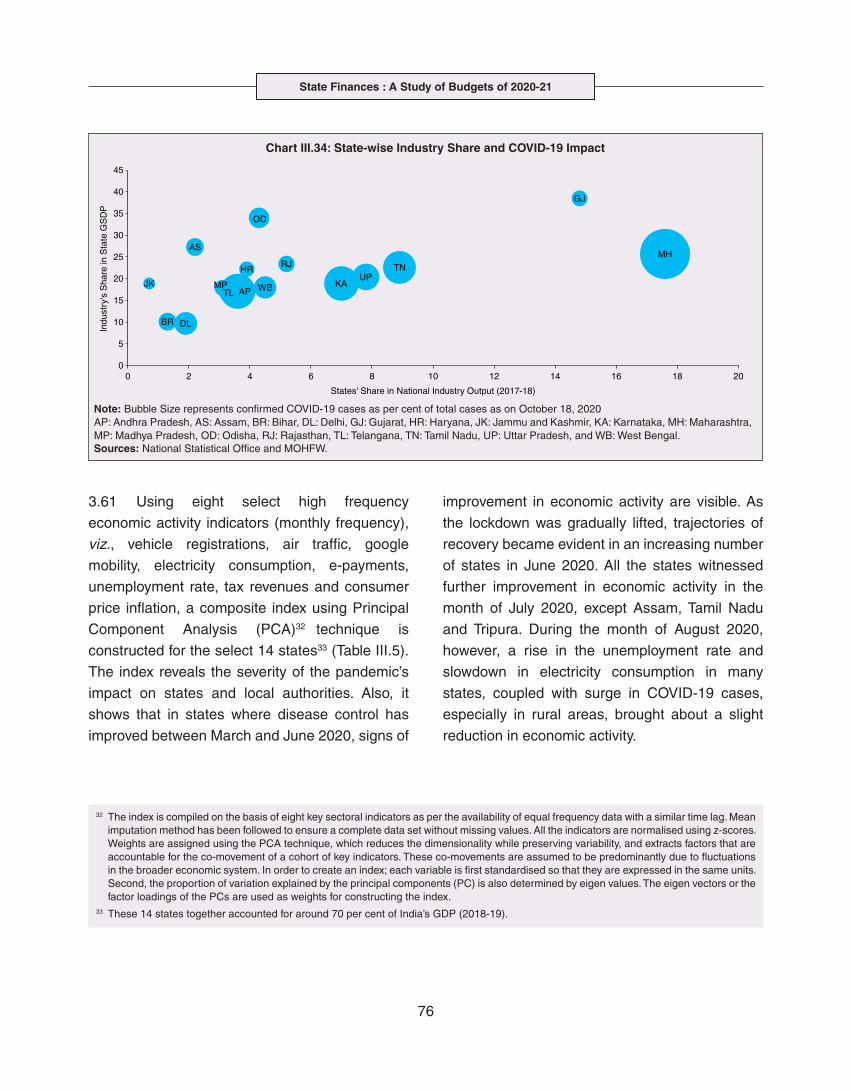
State Finances : A Study of Budgets of 2020-21
76
3.61 Using eight select high frequency
economic activity indicators (monthly frequency),
viz., vehicle registrations, air traffic, google
mobility, electricity consumption, e-payments,
unemployment rate, tax revenues and consumer
price inflation, a composite index using Principal
Component Analysis (PCA)32 technique is
constructed for the select 14 states33 (Table III.5).
The index reveals the severity of the pandemic’s
impact on states and local authorities. Also, it
shows that in states where disease control has
improved between March and June 2020, signs of
improvement in economic activity are visible. As
the lockdown was gradually lifted, trajectories of
recovery became evident in an increasing number
of states in June 2020. All the states witnessed
further improvement in economic activity in the
month of July 2020, except Assam, Tamil Nadu
and Tripura. During the month of August 2020,
however, a rise in the unemployment rate and
slowdown in electricity consumption in many
states, coupled with surge in COVID-19 cases,
especially in rural areas, brought about a slight
reduction in economic activity.
Chart III.34: State-wise Industry Share and COVID-19 Impact
Note: Bubble Size represents confirmed COVID-19 cases as per cent of total cases as on October 18, 2020AP: Andhra Pradesh, AS: Assam, BR: Bihar, DL: Delhi, GJ: Gujarat, HR: Haryana, JK: Jammu and Kashmir, KA: Karnataka, MH: Maharashtra, MP: Madhya Pradesh, OD: Odisha, RJ: Rajasthan, TL: Telangana, TN: Tamil Nadu, UP: Uttar Pradesh, and WB: West Bengal.Sources: National Statistical Office and MOHFW.
32 The index is compiled on the basis of eight key sectoral indicators as per the availability of equal frequency data with a similar time lag. Mean imputation method has been followed to ensure a complete data set without missing values. All the indicators are normalised using z-scores. Weights are assigned using the PCA technique, which reduces the dimensionality while preserving variability, and extracts factors that are accountable for the co-movement of a cohort of key indicators. These co-movements are assumed to be predominantly due to fluctuations in the broader economic system. In order to create an index; each variable is first standardised so that they are expressed in the same units. Second, the proportion of variation explained by the principal components (PC) is also determined by eigen values. The eigen vectors or the factor loadings of the PCs are used as weights for constructing the index.
33 These 14 states together accounted for around 70 per cent of India’s GDP (2018-19).
COVID-19 and its Spatial Dimensions in India
77
8.2 Exports and Remittances
3.62 As a consequence of the pandemic,
private transfer receipts, embodying remittances
from Indians working overseas, dropped by 8.7
per cent y-o-y in Q1:2020-21. India’s exports were
weakened by demand and supply-side shocks
and, together with the fall in remittances, per
capita income levels in some states (Chart III.35).
The top six states, viz., Maharashtra, Gujarat,
Tamil Nadu, Uttar Pradesh, Karnataka and Andhra
Pradesh, which reported around 60 per cent of
total confirmed COVID-19 cases, account for
nearly two-third of India’s merchandise exports.
With slowdown in economic activity amid lockdown
measures, exports from these states may have
also become vulnerable34. Apart from the direct
economic impact in the top six states, the loss of
employment could be significant going forward
for some of the other low-investment states like
Uttar Pradesh, Bihar, West Bengal and Rajasthan,
which had seen a large chunk of migration for
overseas employment in recent years.
Chart III.35: India’s Exports and Inward Remittances: State-wise Share
Sources: DGCI&S; RBI Inward Remittances Survey, August 2018
0.0
5.0
10.0
15.0
20.0
25.0M
ahar
astr
aG
ujar
atT
amil
Nad
uU
ttar
Pra
desh
Kar
nata
kaA
ndhr
a P
rade
shH
arya
naD
elhi
Ker
ala
Wes
t Ben
gal
Odi
sha
Raj
asth
anP
unja
bM
adhy
a P
rade
shU
ttara
khan
dG
oaB
ihar
Him
acha
l Pra
desh
Cha
ttisg
arh
Jhar
khan
dO
ther
s +
uns
peci
fied
Per
cent
Share in Exports in 2019-20
Share in Inward Remittances in 2016-17
34 Given the fact that Maharashtra, Karnataka, Delhi and Gujarat have been the major recipients of FDI in India, COVID-19 may have impacted finances of companies registered in these states. These states are reported to have hosted 75 per cent of FDI in India by end-March 2020 (GoI, 2020b).
3.63 This is reflected in the drastic fall in
emigration clearances (EC) obtained by recruiting
agents, project exporters and under direct
recruitment by foreign employers in January-
September 2020 on a y-o-y basis (Table III.6).
While reverse migration started in March, the
Table III.5: Trends in Economic Activity Index – Select States
States Feb 2020 Mar 2020 Apr 2020 May 2020 Jun 2020 Jul 2020 Aug 2020
Assam 0.3 -0.2 -0.3 -0.1 0.4 0.0 -0.1
Chhattisgarh -0.2 0.0 0.0 0.1 -0.2 0.2 0.1
Gujarat 0.0 -0.3 0.0 -0.7 0.3 0.4 0.3
Karnataka 0.3 0.2 -1.0 -0.3 0.1 0.4 0.3
Kerala 0.5 0.0 -1.0 0.0 0.3 0.4 -0.2
Maharashtra 0.3 0.3 0.3 0.0 -0.6 -0.3 0.0
Odisha -0.5 -0.4 0.2 0.1 0.0 0.5 0.1
Punjab 0.6 0.0 -0.4 -0.1 -0.2 0.1 0.0
Rajasthan 0.1 -0.1 -0.9 0.1 0.1 0.6 0.0
Tamil Nadu 0.2 0.0 -0.4 -0.3 0.2 0.1 0.2
Tripura -0.4 -0.3 0.6 -0.2 0.5 0.1 -0.3
Uttar Pradesh 0.0 -0.2 -0.1 -0.2 0.0 0.6 0.0
Uttarakhand 0.1 -0.1 -0.2 -0.4 0.3 0.3 0.1
West Bengal 0.0 0.0 0.0 -0.8 0.4 0.5 -0.1
Source: RBI staff estimates.
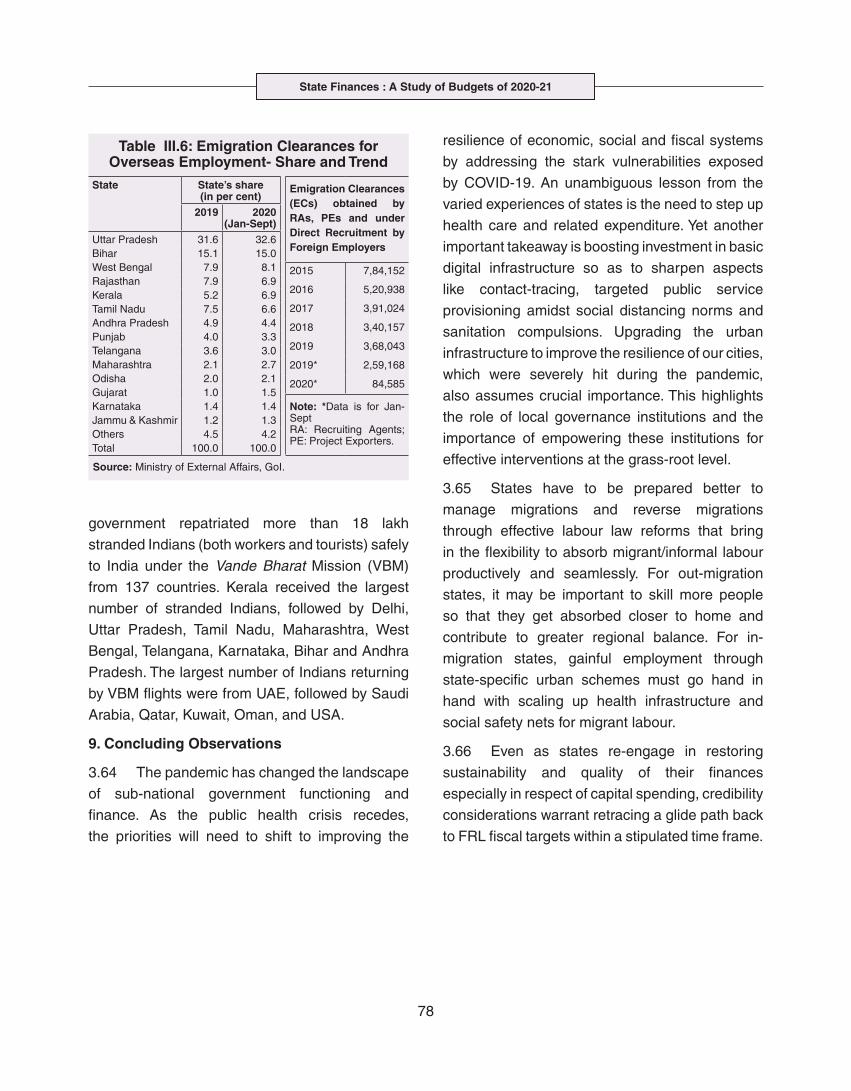
State Finances : A Study of Budgets of 2020-21
78
government repatriated more than 18 lakh
stranded Indians (both workers and tourists) safely
to India under the Vande Bharat Mission (VBM)
from 137 countries. Kerala received the largest
number of stranded Indians, followed by Delhi,
Uttar Pradesh, Tamil Nadu, Maharashtra, West
Bengal, Telangana, Karnataka, Bihar and Andhra
Pradesh. The largest number of Indians returning
by VBM flights were from UAE, followed by Saudi
Arabia, Qatar, Kuwait, Oman, and USA.
9. Concluding Observations
3.64 The pandemic has changed the landscape
of sub-national government functioning and
finance. As the public health crisis recedes,
the priorities will need to shift to improving the
State State’s share (in per cent)
2019 2020 (Jan-Sept)
Uttar Pradesh 31.6 32.6 Bihar 15.1 15.0West Bengal 7.9 8.1Rajasthan 7.9 6.9Kerala 5.2 6.9Tamil Nadu 7.5 6.6Andhra Pradesh 4.9 4.4Punjab 4.0 3.3Telangana 3.6 3.0Maharashtra 2.1 2.7Odisha 2.0 2.1Gujarat 1.0 1.5Karnataka 1.4 1.4Jammu & Kashmir 1.2 1.3Others 4.5 4.2Total 100.0 100.0
Emigration Clearances (ECs) obtained by RAs, PEs and under Direct Recruitment by Foreign Employers
2015 7,84,152
2016 5,20,938
2017 3,91,024
2018 3,40,157
2019 3,68,043
2019* 2,59,168
2020* 84,585
Note: *Data is for Jan-Sept RA: Recruiting Agents; PE: Project Exporters.
Source: Ministry of External Affairs, GoI.
Table III.6: Emigration Clearances for Overseas Employment- Share and Trend
resilience of economic, social and fiscal systems
by addressing the stark vulnerabilities exposed
by COVID-19. An unambiguous lesson from the
varied experiences of states is the need to step up
health care and related expenditure. Yet another
important takeaway is boosting investment in basic
digital infrastructure so as to sharpen aspects
like contact-tracing, targeted public service
provisioning amidst social distancing norms and
sanitation compulsions. Upgrading the urban
infrastructure to improve the resilience of our cities,
which were severely hit during the pandemic,
also assumes crucial importance. This highlights
the role of local governance institutions and the
importance of empowering these institutions for
effective interventions at the grass-root level.
3.65 States have to be prepared better to
manage migrations and reverse migrations
through effective labour law reforms that bring
in the flexibility to absorb migrant/informal labour
productively and seamlessly. For out-migration
states, it may be important to skill more people
so that they get absorbed closer to home and
contribute to greater regional balance. For in-
migration states, gainful employment through
state-specific urban schemes must go hand in
hand with scaling up health infrastructure and
social safety nets for migrant labour.
3.66 Even as states re-engage in restoring
sustainability and quality of their finances
especially in respect of capital spending, credibility
considerations warrant retracing a glide path back
to FRL fiscal targets within a stipulated time frame.
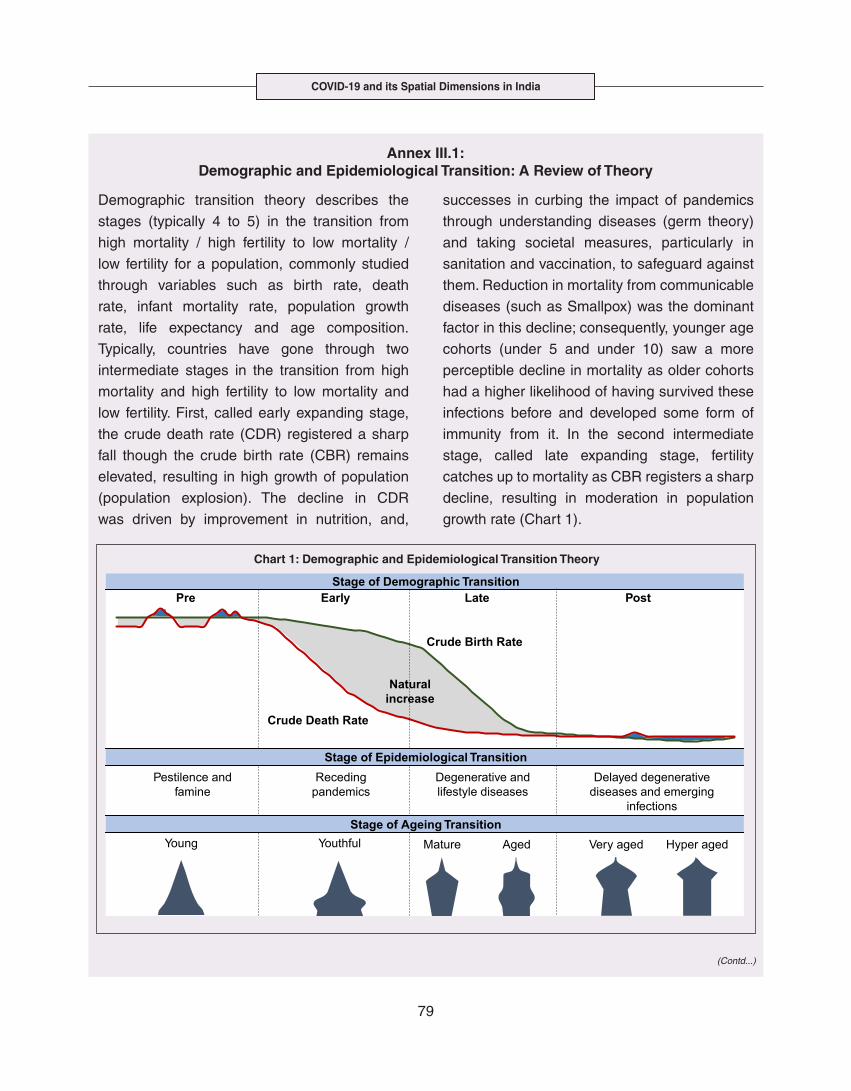
COVID-19 and its Spatial Dimensions in India
79
Demographic transition theory describes the
stages (typically 4 to 5) in the transition from
high mortality / high fertility to low mortality /
low fertility for a population, commonly studied
through variables such as birth rate, death
rate, infant mortality rate, population growth
rate, life expectancy and age composition.
Typically, countries have gone through two
intermediate stages in the transition from high
mortality and high fertility to low mortality and
low fertility. First, called early expanding stage,
the crude death rate (CDR) registered a sharp
fall though the crude birth rate (CBR) remains
elevated, resulting in high growth of population
(population explosion). The decline in CDR
was driven by improvement in nutrition, and,
successes in curbing the impact of pandemics
through understanding diseases (germ theory)
and taking societal measures, particularly in
sanitation and vaccination, to safeguard against
them. Reduction in mortality from communicable
diseases (such as Smallpox) was the dominant
factor in this decline; consequently, younger age
cohorts (under 5 and under 10) saw a more
perceptible decline in mortality as older cohorts
had a higher likelihood of having survived these
infections before and developed some form of
immunity from it. In the second intermediate
stage, called late expanding stage, fertility
catches up to mortality as CBR registers a sharp
decline, resulting in moderation in population
growth rate (Chart 1).
Annex III.1: Demographic and Epidemiological Transition: A Review of Theory
Chart 1: Demographic and Epidemiological Transition Theory
(Contd...)
Stage of Demographic TransitionPre Early Late Post
Crude Birth Rate
Crude Death Rate
Stage of Epidemiological Transition
Natural increase
Pestilence and famine
Receding pandemics
Degenerative and lifestyle diseases
Delayed degenerative diseases and emerging
infectionsStage of Ageing Transition
Young Youthful Mature Aged Very aged Hyper aged
S
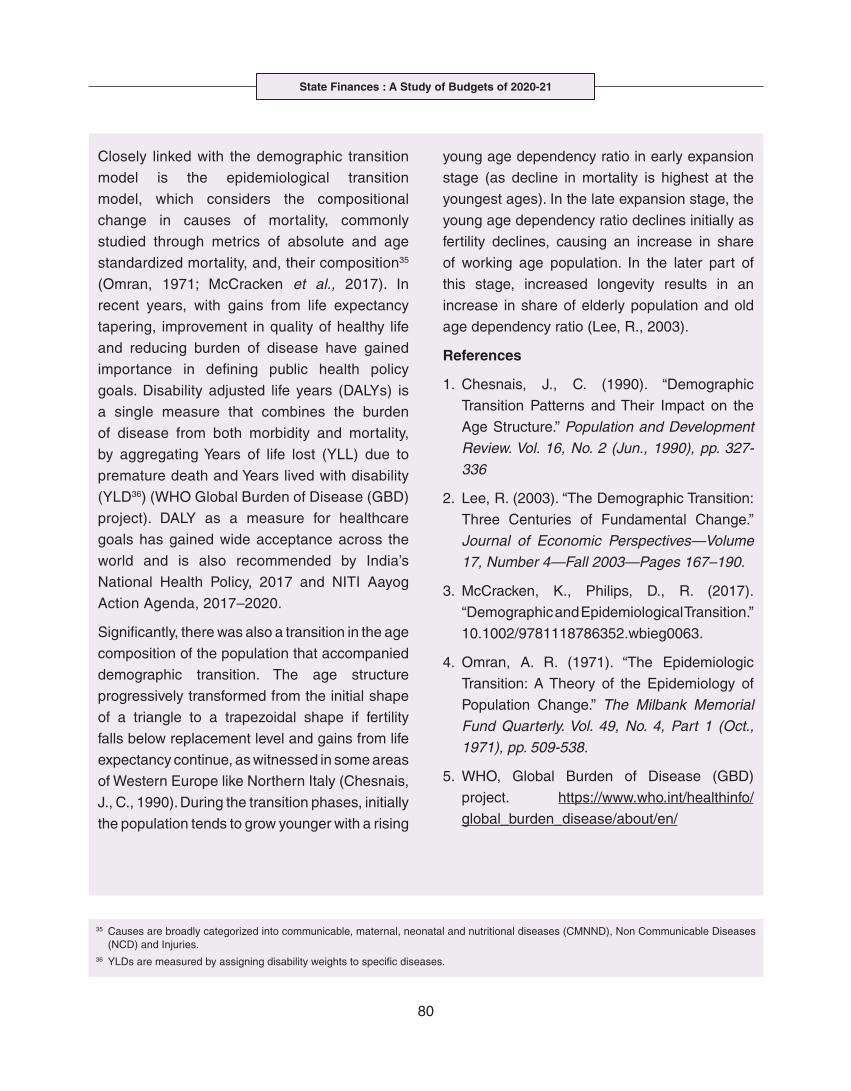
State Finances : A Study of Budgets of 2020-21
80
Closely linked with the demographic transition
model is the epidemiological transition
model, which considers the compositional
change in causes of mortality, commonly
studied through metrics of absolute and age
standardized mortality, and, their composition35
(Omran, 1971; McCracken et al., 2017). In
recent years, with gains from life expectancy
tapering, improvement in quality of healthy life
and reducing burden of disease have gained
importance in defining public health policy
goals. Disability adjusted life years (DALYs) is
a single measure that combines the burden
of disease from both morbidity and mortality,
by aggregating Years of life lost (YLL) due to
premature death and Years lived with disability
(YLD36) (WHO Global Burden of Disease (GBD)
project). DALY as a measure for healthcare
goals has gained wide acceptance across the
world and is also recommended by India’s
National Health Policy, 2017 and NITI Aayog
Action Agenda, 2017–2020.
Significantly, there was also a transition in the age
composition of the population that accompanied
demographic transition. The age structure
progressively transformed from the initial shape
of a triangle to a trapezoidal shape if fertility
falls below replacement level and gains from life
expectancy continue, as witnessed in some areas
of Western Europe like Northern Italy (Chesnais,
J., C., 1990). During the transition phases, initially
the population tends to grow younger with a rising
young age dependency ratio in early expansion
stage (as decline in mortality is highest at the
youngest ages). In the late expansion stage, the
young age dependency ratio declines initially as
fertility declines, causing an increase in share
of working age population. In the later part of
this stage, increased longevity results in an
increase in share of elderly population and old
age dependency ratio (Lee, R., 2003).
References
1. Chesnais, J., C. (1990). “Demographic
Transition Patterns and Their Impact on the
Age Structure.” Population and Development
Review. Vol. 16, No. 2 (Jun., 1990), pp. 327-
336
2. Lee, R. (2003). “The Demographic Transition:
Three Centuries of Fundamental Change.”
Journal of Economic Perspectives—Volume
17, Number 4—Fall 2003—Pages 167–190.
3. McCracken, K., Philips, D., R. (2017).
“Demographic and Epidemiological Transition.”
10.1002/9781118786352.wbieg0063.
4. Omran, A. R. (1971). “The Epidemiologic
Transition: A Theory of the Epidemiology of
Population Change.” The Milbank Memorial
Fund Quarterly. Vol. 49, No. 4, Part 1 (Oct.,
1971), pp. 509-538.
5. WHO, Global Burden of Disease (GBD)
project. https://www.who.int/healthinfo/
global_burden_disease/about/en/
35 Causes are broadly categorized into communicable, maternal, neonatal and nutritional diseases (CMNND), Non Communicable Diseases (NCD) and Injuries.
36 YLDs are measured by assigning disability weights to specific diseases.
COVID-19 and its Spatial Dimensions in India
81
37 Due to data limitations, UTs of Daman and Diu and Dadra and Nagar Haveli have been eliminated from the analysis, and mean imputation has been performed for newly formed state of Telangana using value of Andhra Pradesh for the data prior to bifurcation of Andhra Pradesh into Telangana and Andhra Pradesh.
Chart 1: Beta Convergence: OLS Estimates
Dependent Variable D-W
UR 0.34*** (11.9)
-0.12*** (-5.0)
0.45 2.71
Notes: 1. Numbers in parentheses are t-statistics. 2. *, **, ***, represent statistical significance at 1, 5 and 10
percent respectively. 3. D-W denotes Durbin-Watson test statistic.
Note: Convergence is further reinforced when checked through sigma convergence using an analysis of variance (ANOVA) and trend regression model, which shows a statistically significant ebbing of dispersion of unemployment rate between 2009 and 2018 from 73 to 53 percent.Source: RBI staff estimates.
An analysis of the evolution of convergence in
unemployment rates between Indian states/
UTs over recent years is attempted with
the available data to understand the spatial
distribution of employment conditions. Absolute
or unconditional convergence is measured in
levels in order to assess the catching up process
across states/UTs between 2009-10 and
2018-1937. Unemployment rate data are sourced
from NSS 66th and 68th rounds and Periodic
Labour Force Survey (PLFS) Annual Reports.
In a cross-sectional ordinary least square (OLS)
framework (Baumol ,1986) i.e.,
………….. (1)
is the time interval from to , is the
unemployment rate of state in the final year
and is the unemployment rate of state at
the beginning of time, is the constant term,
is the slope coefficient that must be negative
and statistically significant to confirm absolute
convergence, is the error term, and is natural
logarithm.
The results bring out evidence of beta-
convergence across states (Chart 1). The
negative sign of shows that, on average,
the higher the unemployment rate, the lower
is the growth in unemployment. The speed of
convergence, measured by half-life, indicates that
the gap in unemployment rates will be reduced
by 50 per cent in approximately 32 years. The
regression satisfies all the residual diagnostic
tests such as homoscedasticity and normality
of the residuals. The model is parsimonious and
the results are robust.
Annex III.2: Unemployment Convergence across States
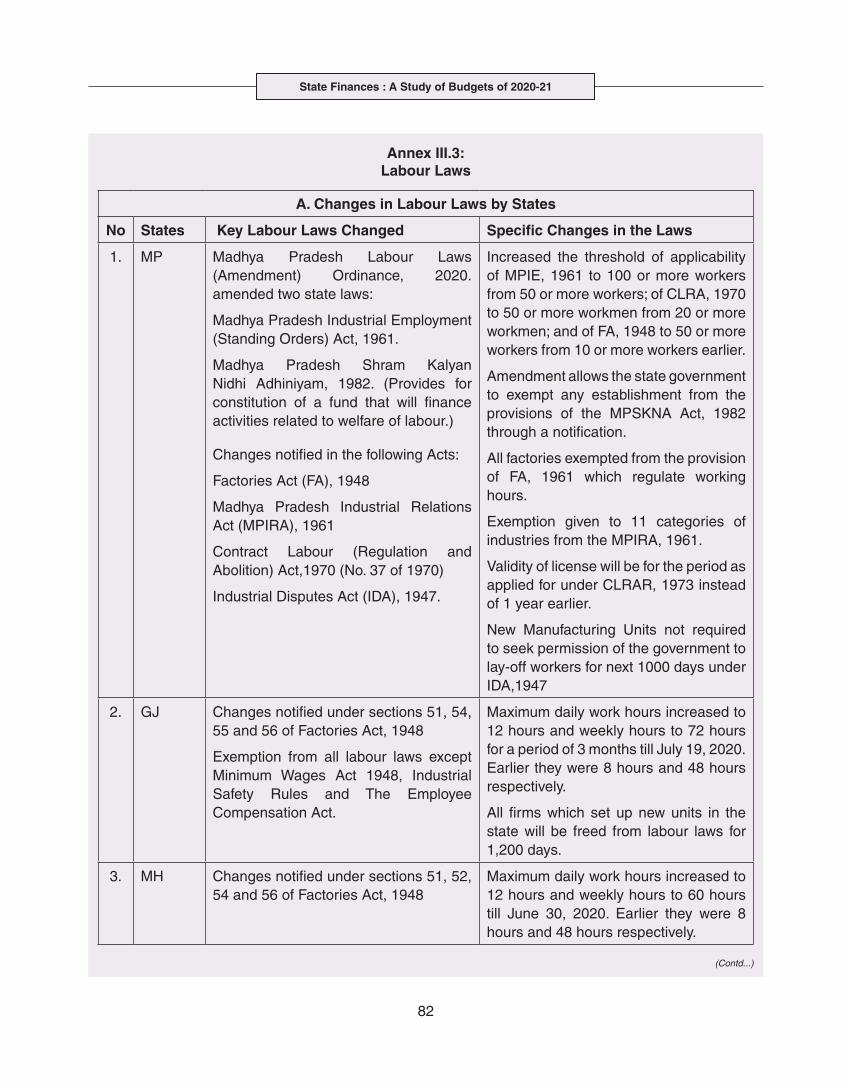
State Finances : A Study of Budgets of 2020-21
82
A. Changes in Labour Laws by States
No States Key Labour Laws Changed Specific Changes in the Laws
1. MP Madhya Pradesh Labour Laws (Amendment) Ordinance, 2020. amended two state laws:
Madhya Pradesh Industrial Employment (Standing Orders) Act, 1961.
Madhya Pradesh Shram Kalyan Nidhi Adhiniyam, 1982. (Provides for constitution of a fund that will finance activities related to welfare of labour.)
Changes notified in the following Acts:
Factories Act (FA), 1948
Madhya Pradesh Industrial Relations Act (MPIRA), 1961
Contract Labour (Regulation and Abolition) Act,1970 (No. 37 of 1970)
Industrial Disputes Act (IDA), 1947.
Increased the threshold of applicability of MPIE, 1961 to 100 or more workers from 50 or more workers; of CLRA, 1970 to 50 or more workmen from 20 or more workmen; and of FA, 1948 to 50 or more workers from 10 or more workers earlier.
Amendment allows the state government to exempt any establishment from the provisions of the MPSKNA Act, 1982 through a notification.
All factories exempted from the provision of FA, 1961 which regulate working hours.
Exemption given to 11 categories of industries from the MPIRA, 1961.
Validity of license will be for the period as applied for under CLRAR, 1973 instead of 1 year earlier.
New Manufacturing Units not required to seek permission of the government to lay-off workers for next 1000 days under IDA,1947
2. GJ Changes notified under sections 51, 54, 55 and 56 of Factories Act, 1948
Exemption from all labour laws except Minimum Wages Act 1948, Industrial Safety Rules and The Employee Compensation Act.
Maximum daily work hours increased to 12 hours and weekly hours to 72 hours for a period of 3 months till July 19, 2020. Earlier they were 8 hours and 48 hours respectively.
All firms which set up new units in the state will be freed from labour laws for 1,200 days.
3. MH Changes notified under sections 51, 52, 54 and 56 of Factories Act, 1948
Maximum daily work hours increased to 12 hours and weekly hours to 60 hours till June 30, 2020. Earlier they were 8 hours and 48 hours respectively.
Annex III.3: Labour Laws
(Contd...)
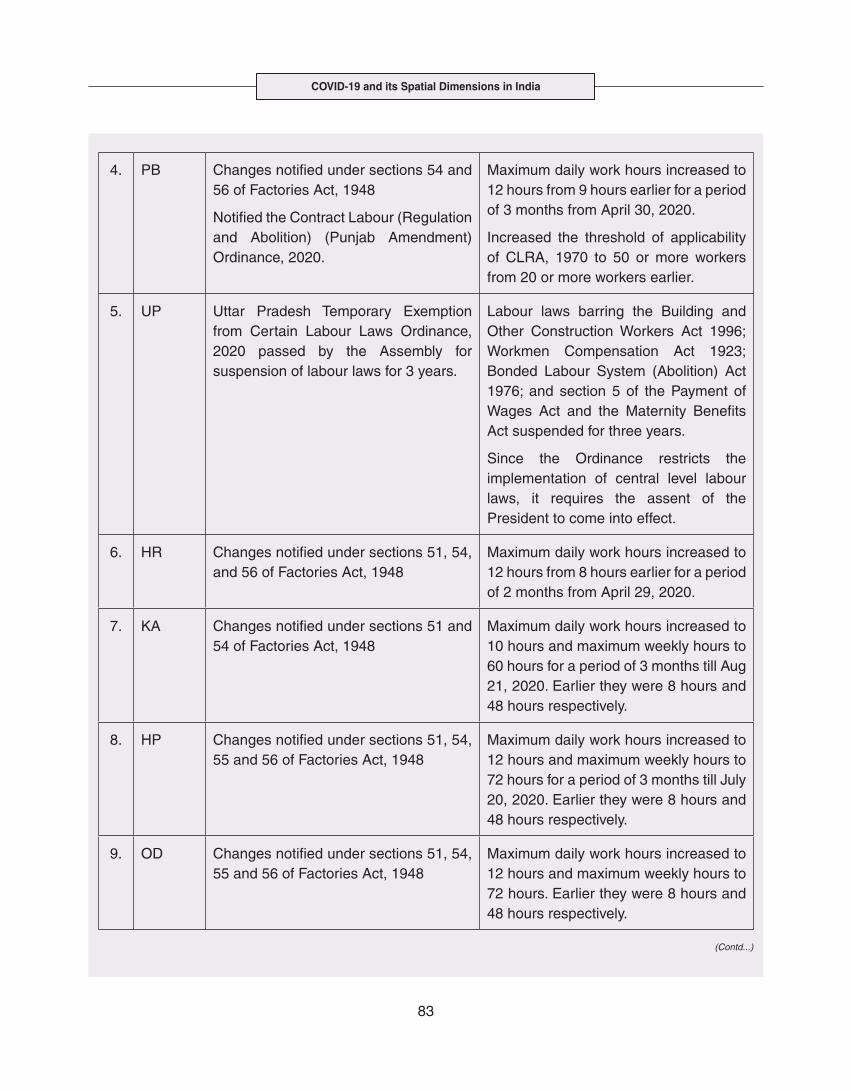
COVID-19 and its Spatial Dimensions in India
83
4. PB Changes notified under sections 54 and 56 of Factories Act, 1948
Notified the Contract Labour (Regulation and Abolition) (Punjab Amendment) Ordinance, 2020.
Maximum daily work hours increased to 12 hours from 9 hours earlier for a period of 3 months from April 30, 2020.
Increased the threshold of applicability of CLRA, 1970 to 50 or more workers from 20 or more workers earlier.
5. UP Uttar Pradesh Temporary Exemption from Certain Labour Laws Ordinance, 2020 passed by the Assembly for suspension of labour laws for 3 years.
Labour laws barring the Building and Other Construction Workers Act 1996; Workmen Compensation Act 1923; Bonded Labour System (Abolition) Act 1976; and section 5 of the Payment of Wages Act and the Maternity Benefits Act suspended for three years.
Since the Ordinance restricts the implementation of central level labour laws, it requires the assent of the President to come into effect.
6. HR Changes notified under sections 51, 54, and 56 of Factories Act, 1948
Maximum daily work hours increased to 12 hours from 8 hours earlier for a period of 2 months from April 29, 2020.
7. KA Changes notified under sections 51 and 54 of Factories Act, 1948
Maximum daily work hours increased to 10 hours and maximum weekly hours to 60 hours for a period of 3 months till Aug 21, 2020. Earlier they were 8 hours and 48 hours respectively.
8. HP Changes notified under sections 51, 54, 55 and 56 of Factories Act, 1948
Maximum daily work hours increased to 12 hours and maximum weekly hours to 72 hours for a period of 3 months till July 20, 2020. Earlier they were 8 hours and 48 hours respectively.
9. OD Changes notified under sections 51, 54, 55 and 56 of Factories Act, 1948
Maximum daily work hours increased to 12 hours and maximum weekly hours to 72 hours. Earlier they were 8 hours and 48 hours respectively.
(Contd...)
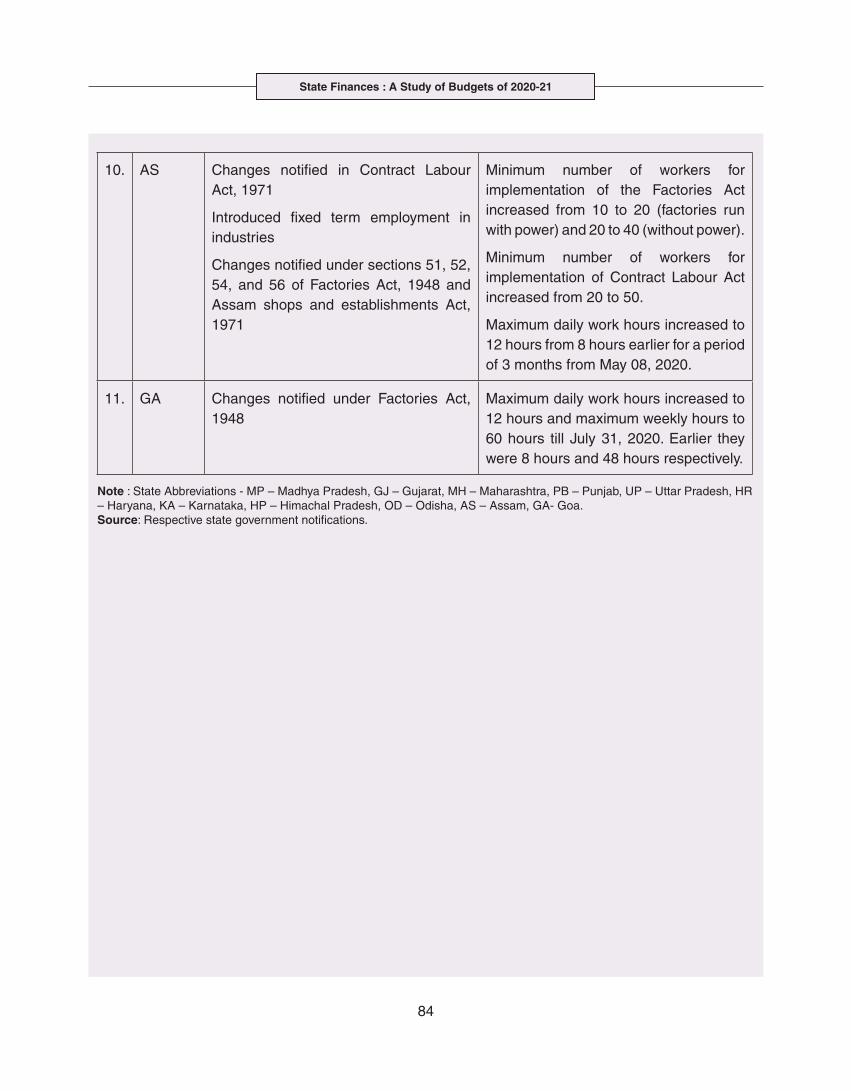
State Finances : A Study of Budgets of 2020-21
84
10. AS Changes notified in Contract Labour Act, 1971
Introduced fixed term employment in industries
Changes notified under sections 51, 52, 54, and 56 of Factories Act, 1948 and Assam shops and establishments Act, 1971
Minimum number of workers for implementation of the Factories Act increased from 10 to 20 (factories run with power) and 20 to 40 (without power).
Minimum number of workers for implementation of Contract Labour Act increased from 20 to 50.
Maximum daily work hours increased to 12 hours from 8 hours earlier for a period of 3 months from May 08, 2020.
11. GA Changes notified under Factories Act, 1948
Maximum daily work hours increased to 12 hours and maximum weekly hours to 60 hours till July 31, 2020. Earlier they were 8 hours and 48 hours respectively.
Note : State Abbreviations - MP – Madhya Pradesh, GJ – Gujarat, MH – Maharashtra, PB – Punjab, UP – Uttar Pradesh, HR – Haryana, KA – Karnataka, HP – Himachal Pradesh, OD – Odisha, AS – Assam, GA- Goa.Source: Respective state government notifications.
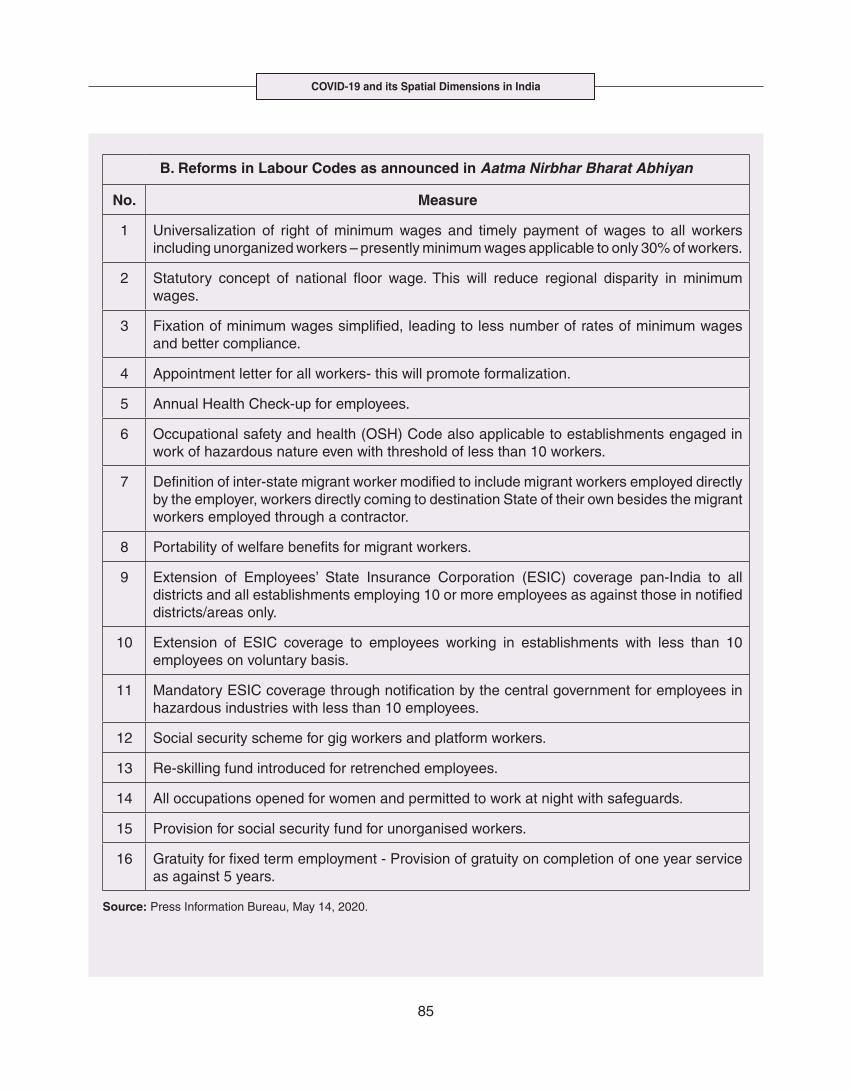
COVID-19 and its Spatial Dimensions in India
85
B. Reforms in Labour Codes as announced in Aatma Nirbhar Bharat Abhiyan
No. Measure
1 Universalization of right of minimum wages and timely payment of wages to all workers including unorganized workers – presently minimum wages applicable to only 30% of workers.
2 Statutory concept of national floor wage. This will reduce regional disparity in minimum wages.
3 Fixation of minimum wages simplified, leading to less number of rates of minimum wages and better compliance.
4 Appointment letter for all workers- this will promote formalization.
5 Annual Health Check-up for employees.
6 Occupational safety and health (OSH) Code also applicable to establishments engaged in work of hazardous nature even with threshold of less than 10 workers.
7 Definition of inter-state migrant worker modified to include migrant workers employed directly by the employer, workers directly coming to destination State of their own besides the migrant workers employed through a contractor.
8 Portability of welfare benefits for migrant workers.
9 Extension of Employees’ State Insurance Corporation (ESIC) coverage pan-India to all districts and all establishments employing 10 or more employees as against those in notified districts/areas only.
10 Extension of ESIC coverage to employees working in establishments with less than 10 employees on voluntary basis.
11 Mandatory ESIC coverage through notification by the central government for employees in hazardous industries with less than 10 employees.
12 Social security scheme for gig workers and platform workers.
13 Re-skilling fund introduced for retrenched employees.
14 All occupations opened for women and permitted to work at night with safeguards.
15 Provision for social security fund for unorganised workers.
16 Gratuity for fixed term employment - Provision of gratuity on completion of one year service as against 5 years.
Source: Press Information Bureau, May 14, 2020.
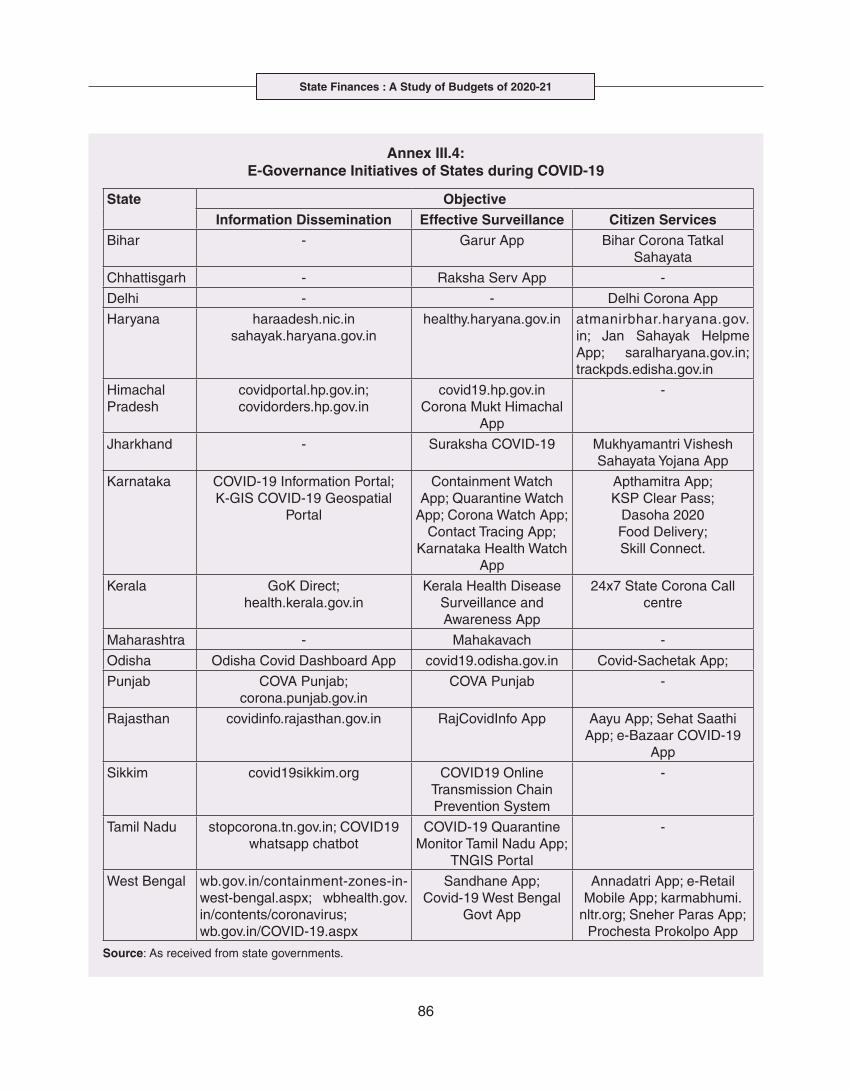
State Finances : A Study of Budgets of 2020-21
86
Annex III.4: E-Governance Initiatives of States during COVID-19
State ObjectiveInformation Dissemination Effective Surveillance Citizen Services
Bihar - Garur App Bihar Corona Tatkal Sahayata
Chhattisgarh - Raksha Serv App -
Delhi - - Delhi Corona App
Haryana haraadesh.nic.insahayak.haryana.gov.in
healthy.haryana.gov.in atmanirbhar.haryana.gov.in; Jan Sahayak Helpme App; saralharyana.gov.in; trackpds.edisha.gov.in
Himachal Pradesh
covidportal.hp.gov.in; covidorders.hp.gov.in
covid19.hp.gov.inCorona Mukt Himachal
App
-
Jharkhand - Suraksha COVID-19 Mukhyamantri Vishesh Sahayata Yojana App
Karnataka COVID-19 Information Portal; K-GIS COVID-19 Geospatial
Portal
Containment Watch App; Quarantine Watch
App; Corona Watch App; Contact Tracing App;
Karnataka Health Watch App
Apthamitra App; KSP Clear Pass;
Dasoha 2020 Food Delivery; Skill Connect.
Kerala GoK Direct; health.kerala.gov.in
Kerala Health Disease Surveillance and Awareness App
24x7 State Corona Call centre
Maharashtra - Mahakavach -
Odisha Odisha Covid Dashboard App covid19.odisha.gov.in Covid-Sachetak App;
Punjab COVA Punjab; corona.punjab.gov.in
COVA Punjab -
Rajasthan covidinfo.rajasthan.gov.in RajCovidInfo App Aayu App; Sehat Saathi App; e-Bazaar COVID-19
App
Sikkim covid19sikkim.org COVID19 Online Transmission Chain Prevention System
-
Tamil Nadu stopcorona.tn.gov.in; COVID19 whatsapp chatbot
COVID-19 Quarantine Monitor Tamil Nadu App;
TNGIS Portal
-
West Bengal wb.gov.in/containment-zones-in-west-bengal.aspx; wbhealth.gov.in/contents/coronavirus;wb.gov.in/COVID-19.aspx
Sandhane App; Covid-19 West Bengal
Govt App
Annadatri App; e-Retail Mobile App; karmabhumi.
nltr.org; Sneher Paras App; Prochesta Prokolpo App
Source: As received from state governments.