Embed Size (px)
Citation preview

74
III. Analysis and Discussion
Sample
A convenience sample of sixty people consisting of faculty and staff from a large
university in southwest Virginia volunteered to participate in this study. The age range of
participants were as follows: 17% of the subjects were between the ages of 20 and 29;
20% were between the ages of 30 and 39; 20% were between the ages of 40 and 49; 33%
were between the ages of 50 and 59; and 10% were age 60 and older. The sample was
almost evenly split in terms of gender; 47% of the subjects were female and 53% were
male. Races were represented as 95% Caucasian, 3% African-American, and 2% Hispanic.
100% of the subjects had lived in the United States for at least seven years.
Analysis
Three types of analysis were performed on the data collected in this study. First,
quantitative data was analyzed using data obtained from the semantic differential
questionnaire (see Appendix D) and from the proxemic distances recorded from each
subject's placement of figures within the scale-models of the three waiting/reception area
scenarios. Secondly, composite drawings were prepared showing the placement of figures
within in the scale-models. Thirdly, qualitative analysis was performed on the open-ended
questionnaire (see Appendix E) and on the video and audio recordings. Quantitative
results and analysis are reported regarding each waiting/reception area scenario and then
followed up with the results of the qualitative analysis.
Three hypotheses were formulated for the purposes of this study. Hypothesis H10
stated: "In a simulated hotel lobby waiting/reception area, there is no difference in
proxemic distances between bright and dim lighting conditions." Hypothesis H20 stated:
"In a simulated physician's office waiting/reception area, there is no difference in proxemic
distances between bright and dim lighting conditions." Hypothesis H30 stated: "In a
simulated service-oriented waiting/reception area, there is no difference in proxemic
distances between bright and dim lighting conditions." Using the data obtained from the
semantic differential questionnaire, contrast tests were performed on the bright and dim

75
conditions for each scenario, with alpha set at .05.
H10 - In a simulated hotel lobby waiting/reception area, there is no difference in
proxemic distances between bright and dim lighting conditions.
Semantic Differential Questionnaire
Several questions were asked on the questionnaire to determine subjects'
impressions of the scale-model environments. One question asking how bright or dim the
environment felt, revealed that there was a significant difference (p < .0001) in the
perception of bright versus dim lighting condition for the hotel waiting/reception area (see
Table 2). This significance validates that there was a perceived difference in the two
lighting conditions.
The null hypothesis was not rejected with the results from the semantic differential
questionnaire. Questions regarding friendly/hostile, pleasant/unpleasant, harmonious/
frustrating, sociable/unsociable, relaxing/agitating, interesting/monotonous, comfortable/
uncomfortable, simple/complex, cluttered/uncluttered, large/small, long/short, spacious/
cramped, rounded/angular, informal/formal, and contemporary/traditional showed no
significant difference (p > .05) between bright and dim conditions. Also, no significant
difference (p > .05) was found between bright and dim lighting conditions for the amount
of time a person was willing to wait in the scenario. However, on the questions of how
clear/hazy, focused/unfocused, and radiant/dull the hotel waiting/reception area felt,
significance was shown (p < .0001). Thus the null hypothesis was rejected in this instance
(see Table 2).
Although there was a perceived difference in the bright and dim lighting conditions
of the hotel waiting/reception area, significant differences in how this environment felt or
appeared under the two lighting conditions were not found (p > .05). These results
indicate that the brightness or dimness of the ambient lighting did not affect how
friendly/hostile, pleasant/unpleasant, harmonious/frustrating, sociable/unsociable,
relaxing/agitating, interesting/monotonous, comfortable/uncomfortable, simple/complex,
cluttered/uncluttered, large/small, long/short, spacious/cramped, rounded/angular,
informal/formal, and contemporary/traditional the hotel space was perceived. These results
76
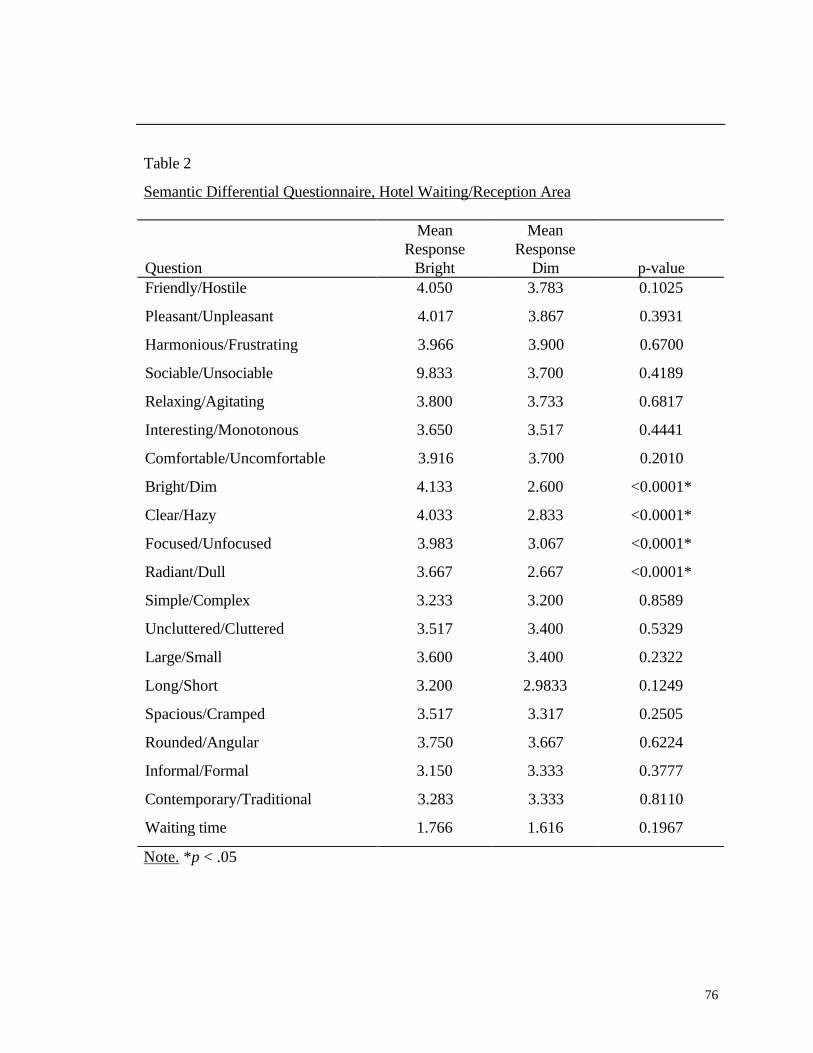
Table 2
Semantic Differential Questionnaire, Hotel Waiting/Reception Area
Question
MeanResponse
Bright
MeanResponse
Dim p-valueFriendly/Hostile 4.050 3.783 0.1025
Pleasant/Unpleasant 4.017 3.867 0.3931
Harmonious/Frustrating 3.966 3.900 0.6700
Sociable/Unsociable 9.833 3.700 0.4189
Relaxing/Agitating 3.800 3.733 0.6817
Interesting/Monotonous 3.650 3.517 0.4441
Comfortable/Uncomfortable 3.916 3.700 0.2010
Bright/Dim 4.133 2.600 <0.0001*
Clear/Hazy 4.033 2.833 <0.0001*
Focused/Unfocused 3.983 3.067 <0.0001*
Radiant/Dull 3.667 2.667 <0.0001*
Simple/Complex 3.233 3.200 0.8589
Uncluttered/Cluttered 3.517 3.400 0.5329
Large/Small 3.600 3.400 0.2322
Long/Short 3.200 2.9833 0.1249
Spacious/Cramped 3.517 3.317 0.2505
Rounded/Angular 3.750 3.667 0.6224
Informal/Formal 3.150 3.333 0.3777
Contemporary/Traditional 3.283 3.333 0.8110
Waiting time 1.766 1.616 0.1967
Note. *p < .05
77
contradict present research which indicates that lighting does have an impact on how
environments are perceived (Lam, 1977, IESNA, 1995).
Lighting also did not have an effect on how long subjects were willing to wait in
either the bright or dim hotel scenario. Under either the bright or dim light, subjects were
willing to wait an average of a half hour to an hour. Therefore, in this case, lighting was
not a very important factor in determining how long one would be willing to wait in this
type of space.
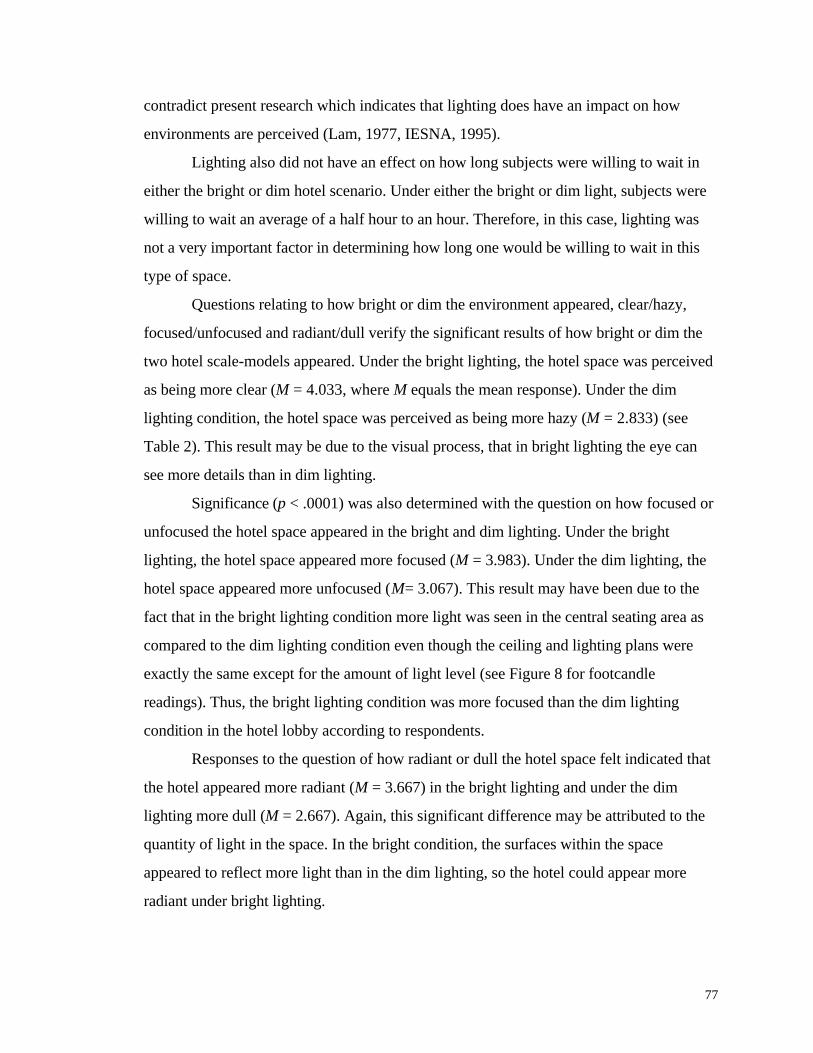
Questions relating to how bright or dim the environment appeared, clear/hazy,
focused/unfocused and radiant/dull verify the significant results of how bright or dim the
two hotel scale-models appeared. Under the bright lighting, the hotel space was perceived
as being more clear (M = 4.033, where M equals the mean response). Under the dim
lighting condition, the hotel space was perceived as being more hazy (M = 2.833) (see
Table 2). This result may be due to the visual process, that in bright lighting the eye can
see more details than in dim lighting.
Significance (p < .0001) was also determined with the question on how focused or
unfocused the hotel space appeared in the bright and dim lighting. Under the bright
lighting, the hotel space appeared more focused (M = 3.983). Under the dim lighting, the
hotel space appeared more unfocused (M= 3.067). This result may have been due to the
fact that in the bright lighting condition more light was seen in the central seating area as
compared to the dim lighting condition even though the ceiling and lighting plans were
exactly the same except for the amount of light level (see Figure 8 for footcandle
readings). Thus, the bright lighting condition was more focused than the dim lighting
condition in the hotel lobby according to respondents.
Responses to the question of how radiant or dull the hotel space felt indicated that
the hotel appeared more radiant (M = 3.667) in the bright lighting and under the dim
lighting more dull (M = 2.667). Again, this significant difference may be attributed to the
quantity of light in the space. In the bright condition, the surfaces within the space
appeared to reflect more light than in the dim lighting, so the hotel could appear more
radiant under bright lighting.

78
Proxemic Measurements
In addition to the questionnaire data, proxemic distances between the seating
selections chosen in the hotel bright and dim lighting conditions were recorded. A
contingency table, following the format of a two factor mixed model experiment in a
randomized complete block design, discussed in the methodology was prepared, with one
exception. The contingency table in the methodology required that only three proxemic
zones (intimate, personal and social) were analyzed. To give a clearer picture of the data,
six proxemic zones are included in the contingency table, including the intimate (close and
far combined), personal-close, personal-far, social-close, social-far, and public-close
zones. The percentages of seating selections placed within these six proxemic are
displayed within Table 3. There were no statistical differences (p > .05) in the seating
selections between bright and dim conditions, so the null hypothesis was not rejected (see
Appendix H). It is interesting to note that in the dim lighting condition, slightly higher
frequencies in the public-close and social-far zones were recorded. Overall, it is important
to recognize there were noticeable differences in the zones where seating choices were
made. A total of 46.94% of the seating selections were made in the social-far zone,
30.28% in the public-close zone, and 19.17% in the social-close zone. Only 1.67% of
seating choices were in the personal-far zone and 1.94% were in the personal-close zone.
No choices were made in the intimate zone (see Table 3).
Despite the result the null hypothesis could not be rejected, the results hold
interesting information about proxemic preferences. Most seating selections placed figures
in the social-far and public-close zones, demonstrating that people prefer to sit at a
minimum of 7'-0" from others in the hotel lobby waiting/reception area. This minimizes
the social contact with others, and may be an effort to maintain anonymity and personal
privacy with other strangers in the hotel space (Hall, 1966). However, there were a few
seating selections that placed figures in the personal-far and personal-close zones. Perhaps
these were individuals who would not mind interacting with other hotel patrons, or did not
feel that maintaining distance was their only way at protecting privacy.
Because the ratio of males (53%) to females (47%) that participated in this study
was nearly even, chi-square tests were run to compare the frequency of seating selections

79
Table 3
Contingency Table with Seating Choices within Six Proxemic Zones; Hotel
Waiting/Reception Scenario
FrequencyPercentRow PctColumnPct
PublicClose
SocialFar
SocialClose
PersonalFar
PersonalClose Intimate Total
Bright 106
14.72
29.44
48.62
167
23.19
46.39
49.41
70
9.72
19.44
50.72
8
1.11
2.22
66.67
9
1.25
2.5
64.29
0
0.00
0.00
.
360
50.00
Dim 112
15.16
31.11
51.38
171
23.75
47.50
50.59
68
9.44
18.89
49.28
4
0.56
1.11
33.33
5
.69
1.39
35.71
0
0.00
0.00
.
360
50.00
Total 218
30.28
338
46.94
138
19.17
12
1.67
14
1.94
0
0.00
720
100.00
Note. Distances for zones are as follows: intimate zone (0"-18"), personal-close
zone (18" - 30"), personal-far zone (30" - 4'0"), social-close zone (4'-0" - 7'-0"),
social-far zone (7'-0" - 12'-0"), public-close zone (12'-0" - 25'-0").

80
by males to the frequency of seating selections by females in the six proxemic zones.
Statistical significance was not found to indicate a difference in seat selections by males
and females in the bright lighting condition (χ2(4, N = 360) = 5.158, p > .05) or in the dim
lighting condition (χ2(4, N = 360) = 3.349, p > .05) (see Table 4 and Table 5). These
results indicate that males and females do not have significantly different proxemic
requirements. However, Altman (1970) suggested that males do tend to have larger
proxemic zones than females. Altman's (1970) research also indicated that same-sex pairs
tend to have larger proxemic zones that mixed-sex pairs. This study did not attempt to
assign gender to the scale-figures to be placed in the experiment, so such results could not
be analyzed accordingly. More analysis on male/female proxemic requirements in various
behavioral settings would need to be performed before conclusions could be made.
In order to better understand the distribution of seating preferences and proxemic
zones, a composite map of the hotel bright and dim lighting conditions was created
showing the seating selections chosen for the successive scale-figures in relationship to the
antecedent figure (see Figure 27). Although no significant differences in proxemic zones
resulted from the statistical analysis of the bright versus dim conditions, slight variations
are apparent when examining the composite map. On the sofa where the antecedent figure
was placed, six (1.67%) subjects chose to place themselves (as a scale-figure) on the same
sofa, within the personal proxemic zone in the bright lighting condition. However, in the
dim lighting condition, only three (0.83%) subjects placed themselves on the sofa with the
antecedent figure. This phenomenon is contradicted in analyzing the seat choices on the
loveseat within the personal proxemic zone. Only three (0.83%) subjects chose to sit at a
right angle on the loveseat beside the antecedent figure in the bright lighting condition,
whereas, seven (1.94%) chose that seat in the dim lighting condition. Perhaps sitting at the
right angle in the dim condition, a person would feel more protected by the arm of the
loveseat, than sitting side-by-side with an unknown person with no physical barrier.
As the statistical tests showed, there was not a significant difference (p > .05) in
the average proxemic distances under the bright and dim lighting conditions. For the
majority, seating choices were made within the social-far proxemic zone and the public-
close proxemic zone (see Figure 27). The choices for the successive scale-figures

81
Table 4
Gender Comparison of Frequencies of Seating Choices within Proxemic Zones; Hotel
Lobby Waiting/Reception Scenario - Bright Lighting Condition
Frequency (N)Expected Counts
PublicClose
SocialFar
SocialClose
PersonalFar
PersonalClose Total
Male 51
56.00
87
89.60
43
37.33
4
4.27
7
4.80
192
Female 54
49.00
81
78.40
27
32.67
4
3.73
2
4.20
168
Total 105 168 70 8 9 360
Note. N = number of observations. χ2 (4, N = 360) = 5.158, p = 0.271. There were four
cells with expected counts less than 5.0. No observations were made in the intimate zone.
Distances for zones are as follows: intimate zone (0"-18"), personal-close zone (18" -
30"), personal-far zone (30" - 4'0"), social-close zone (4'-0" - 7'-0"), social-far zone (7'-0"
- 12'-0"), public-close zone (12'-0" - 25'-0").

82
Table 5
Gender Comparison of Frequencies of Seating Choices within Proxemic Zones; Hotel
Lobby Waiting/Reception Scenario - Dim Lighting Condition
Frequency (N)Expected Counts
PublicClose
SocialFar
SocialClose
PersonalFar
PersonalClose Total
Male 65
59.73
85
91.20
36
36.27
2
2.13
4
2.67
192
Female 47
52.27
86
79.80
32
31.73
2
1.87
1
2.33
168
Total 112 171 68 4 5 360
Note. N = number of observations. χ2 (4, N = 360) = 3.349, p = 0.501. There were four
cells with expected counts less than 5.0. No observations were made in the intimate zone.
Distances for zones are as follows: intimate zone (0"-18"), personal-close zone (18" -
30"), personal-far zone (30" - 4'0"), social-close zone (4'-0" - 7'-0"), social-far zone
(7'-0" - 12'-0"), public-close zone (12'-0" - 25'-0").

83
�����
�����
�����
���
�����
�����
�����
�����
���
��������
���
�����
Figure 27. Composite map depicting seating selection under bright and dim lighting
conditions for hotel lobby waiting/reception scenario. Drawing not to scale.
Note:
• Antecedent Figure
nb/nd, where nb = frequency of choice in bright light nd = frequency of choice in dim light

84
maximized distances as much as possible, and minimized opportunities for eye-contact or
interaction. Choices for seats were typically on the outer positions of the furniture
arrangement. Figure 28 depicts a typical recording of a typical subject's successive seat
selections in the hotel lobby waiting/reception area scenario.
There were individual subjects who did show different seating choices under the
two lighting conditions. One example is depicted in Figure 29. In the bright lighting
condition, all the seating choices were within the social-far zone or smaller proxemic
zones, placing all the figures within conversational and eye-contact proximity. In contrast,
under the dim lighting condition, one figure is placed behind the antecedent figure and out
of range for easy eye-contact and conversation. Another figure is placed in the public-
close zone, again out of range for easy eye-contact and conversation. Only one figure was
placed within the personal zone to allow for interaction with the antecedent figure. It is
likely that the reason the seating choices varied so much was due to the difference in light
level. Perhaps under the bright lighting, the subject thought it was more comfortable or
socially acceptable to sit closer to others, than it was under the dim lighting. There are
other cultural, social, and personality variables that may have affected this subject's seating
choices and proxemic requirements, but it is significant that there is something that caused
such different spatial requirements under the two lighting conditions.
H20 - In a simulated physician's office waiting/reception area, there is no difference in
proxemic distances between bright and dim lighting conditions.
Semantic Differential Questionnaire
To gain a further understanding of lighting level and a potential effect on waiting
room spatial behavior, a second space, a physician's office waiting/reception area, was
analyzed. One question asking how bright or dim the environment felt, revealed that there
was a significant difference (p < .0001) in the perception of bright versus dim lighting
condition for the physician's office waiting/reception area (see Table 6). This significance
validates there was a perceived difference in the two lighting conditions. The null
hypothesis was not rejected on most of the questions from the semantic differential
questionnaire. Questions regarding friendly/hostile, pleasant/unpleasant,

85
�
�
�
�
�
�
Figure 28. Recording of successive scale-figure placement for a typical subject in the hotel
waiting/reception area scenario. Drawing not to scale.
Bright Lighting Condition
Dim Lighting Condition
Note:
• Antecedent Figure
1 = First figure2 = Second figure3 = Third figure
Personal-Far = 2.5' - 4'
Social-close = 4'-7'
Social-far = 7'-12'
Public-close = 12'-25'

86
�
�
�
� �
�
Figure 29. Recording of successive scale-figure placement for a non-typical subject in the
hotel waiting/reception area scenario. Drawing not to scale.
Bright Lighting Condition
Dim Lighting Condition
Note:
• Antecedent Figure
1 = First figure2 = Second figure3 = Third figure
Personal-Far = 2.5' - 4'
Social-close = 4'-7'
Social-far = 7'-12'
Public-close = 12'-25'

87
Table 6
Semantic Differential Questionnaire; Physician's Office Waiting/Reception Area
QuestionMean Response
BrightMean Response
Dim p-valueFriendly/Hostile 3.250 3.067 0.2611
Pleasant/Unpleasant 3.267 3.017 0.1150
Harmonious/Frustrating 3.367 3.100 0.0889
Sociable/Unsociable 3.117 2.700 0.0119*
Relaxing/Agitating 3.113 3.000 0.4122
Interesting/Monotonous 2.550 2.433 0.5030
Comfortable/Uncomfortable 3.183 2.933 0.1403
Bright/Dim 4.250 2.550 <0.0001*
Clear/Hazy 4.083 2.883 <0.0001*
Focused/Unfocused 3.550 2.917 0.0009*
Radiant/Dull 3.333 2.417 <0.0001*
Simple/Complex 3.650 3.433 0.2482
Uncluttered/Cluttered 3.483 3.433 0.7892
Large/Small 3.917 3.733 0.2734
Long/Short 3.417 3.400 0.9059
Spacious/Cramped 3.733 3.483 0.1511
Rounded/Angular 1.850 1.867 0.9215
Informal/Formal 2.550 2.617 0.7483
Contemporary/Traditional 2.683 2.917 0.2648
Waiting time 1.366 1.350 0.8858
Note. *p < .05

88
harmonious/ frustrating, relaxing/agitating, interesting/monotonous, comfortable/
uncomfortable, simple/complex, cluttered/uncluttered, large/small, long/short, spacious/
cramped, rounded/angular, informal/formal, and contemporary/traditional showed no
significant difference (p > .05) between bright and dim conditions. Also, no significant
difference (p > .05) was found between bright and dim lighting conditions for the amount
of time a person was willing to wait in the scenario. However, on the questions of how
social/unsocial (p = 0.0119), clear/hazy (p < 0.0001), focused/unfocused (p = 0.0009),
and radiant/dull (p < 0.0001) the physician's office waiting/reception area felt, significance
was shown, thus this null hypothesis was rejected in this instance (see Table 6).
Although there was a perceived difference in lighting level between the two
physician's office waiting/reception lighting conditions, significant differences in how this
environment felt or appeared under the two lighting conditions was not found (p > .05).
This would indicate that lighting level did not affect how friendly/hostile, pleasant/
unpleasant, harmonious/frustrating, relaxing/agitating, interesting/monotonous,
comfortable/uncomfortable, simple/complex, cluttered/uncluttered, large/small, long/short,
spacious/cramped, rounded/angular, informal/formal, and contemporary/ traditional the
physician's office space was perceived. As with the hotel space, these results contradict
present research which indicates that lighting does have an impact on how environments
are perceived (Lam, 1977, IESNA, 1995).
Like the hotel lobby scenario, no difference was found in the bright and dim
conditions of the physician's office waiting/reception area for the amount of time a subject
would be willing to wait in the space (p > .05). Under both conditions, subjects were
willing to wait less than a half hour. In this scenario, lighting did not have an impact on the
decision for how long someone would be willing to wait.
However, unlike the hotel lobby scenario, the results for how social or unsocial the
physician's office waiting area appeared did show significant difference between the two
lighting conditions (p < .0001). Under the bright lighting, subjects felt the physician's
office waiting space was more sociable (M = 3.117). Under the dim lighting, the waiting
space was more unsocial (M = 2.700) (see Table 6). Perhaps there was a subjective
opinion of the perceived quality of light under the two conditions that contributed to this

89
result. It could also be interpreted that under the bright lighting, subjects felt more
comfortable interacting with others than in the dim lighting. However, this is contradicted
by the results obtained in the proxemic data. Under both lighting conditions, average
maintained proxemic distances were in the social-far and public-close zones.
Questions related to how bright or dim the physician's office waiting/reception area
appeared, clear/hazy, focused/unfocused and radiant/dull verify the significant results of
how bright or dim the two hotel scale-models appeared. Under the bright lighting
condition, the physician's waiting space was perceived as being more clear (M = 4.083).
Under the dim lighting condition the physician's waiting space was perceived as being
more hazy (M= 2.883) (see Table 6). As with the hotel space, this result may be due to the
visual process that in bright lighting the eye can see more details than in dim lighting.
Significance was also determined with the question on how focused or unfocused
the physician's waiting space appeared in the bright and dim lighting (p <.0001). Under the
bright lighting the physician's waiting space appeared more focused (M = 3.550). Under
the dim lighting the space appeared more unfocused (M= 2.917) (see Table 6). This result
may appear deceptive considering the light level in each lighting condition is consistent
across the space, and the lighting design was not intentionally trying to focus attention
anywhere in this environment. However, under the bright lighting, subjects may have felt
that the receptionist window was more approachable and inviting, and thus focusing their
attention on it. As compared to the dim lighting, the subjects may not have felt the light
level encouraged the interaction, considering that the environment was considered more
unsociable in dimmer lighting.
Responses to the question of how radiant or dull the physician's waiting space felt
indicated that the space appeared more radiant (M = 3.333) in the bright lighting and
under the dim lighting more dull (M= 2.417) (see Table 6). Again, this significant
difference can be attributed to the quantity of light in the space. In the bright condition,
the surfaces within the space appeared to reflect more light, compared to the dim lighting,
so the physician's waiting/reception area could appear more radiant under bright lighting.

90
Proxemic Measurements
A contingency table, following the format of a two factor mixed model experiment
in a randomized complete block design, was prepared to analyze the proxemic distances
between the seating selections chosen in the physician's office bright and dim lighting
conditions. To give a clear picture of the data, six proxemic zones are included in the
contingency table, including the intimate (close and far combined), personal-close,
personal-far, social-close, social-far, and public-close zones. The percentages of seating
selections placed within these six proxemic zones are displayed within Table 7. There were
no statistical differences in the seating selections between bright and dim conditions (p >
.05), so the null hypothesis could not be rejected (see Appendix H). However, noticeable
differences in the preferences of proxemic zones can be noted. More observations (1.39%)
were recorded in the public-close zone under the bright lighting, compared to only
(0.56%) under the dim lighting. Overall, a high percentage (50%) of the seating choices
were made in the public-close zone, 32.50% of choices were in the social-far zone. Fewer
percentages were noted in the other proxemic zones, 8.33% in the social-close zone,
7.50% in the personal-far zone, 0.97% in the personal-close zone, and 0.69% in the
intimate zone.
Although there were no significant differences in the proxemics zones under the
two lighting conditions, there were some notable differences. Under the bright lighting,
9.44% of the observations were in the social-close zone compared to 7.22% under the dim
lighting. In the public-close zone, under the dim lighting condition there were 51.11%
observations compared to 48.89% under the bright lighting. This outcome may indicate
lighting had a slight impact on the spatial behavior in this waiting area scenario. Overall,
the proxemic distances under both lighting conditions maximized personal space
boundaries. Maintaining far distances may have been an effort to stay away from others in
the physician's waiting area because the subjects were not sure why other patrons in the
space waiting area were waiting. Subjects made statements to this effect in the qualitative
analysis. It also could have been that subjects did not want to sit close to others due to the
perception that most people in a physician's office are ill. In order to gain an understanding

91
Table 7
Contingency Table with Seating Choices within Six Proxemic Zones; Physician's Office
Waiting/Reception Area Scenario
FrequencyPercentRow PctColumnPct
PublicClose
SocialFar
SocialClose
PersonalFar
PersonalClose Intimate Total
Bright 176
24.44
48.89
48.89
117
16.25
32.50
50.00
34
4.72
9.44
56.67
25
3.47
6.94
46.30
5
0.69
1.39
71.43
3
0.42
0.83
60.00
360
50.00
Dim 184
25.56
51.11
51.11
117
16.25
32.50
50.00
26
3.61
7.22
43.33
29
4.03
8.06
53.07
2
0.28
0.56
28.57
2
0.28
0.56
40.00
360
50.00
Total 360
50.00
234
32.50
60
8.33
54
7.50
7
0.97
5
0.69
720
100.00
Note. Distances for zones are as follows: intimate zone (0"-18"), personal-close
zone (18" - 30"), personal-far zone (30" - 4'0"), social-close zone (4'-0" - 7'-0"),
social-far zone (7'-0" - 12'-0"), public-close zone (12'-0" - 25'-0").

92
of the proxemic distances between men and women, chi-square tests were run to compare
the frequency of seating selections by males to the frequency of seating selections by
females in the six proxemic zones under investigation for the two lighting conditions in the
physician's office waiting/reception area scenario. Statistical significance was not found to
indicate a difference in seat selections by males and females in the bright lighting condition
(χ2(5, N = 360) = 6.760, p > .05) or in the dim lighting condition (χ2(4, N = 360) = 2.069,
p > .05) (see Table 8 and Table 9). These results are comparable to the results from the
hotel lobby waiting/ reception area scenario for male and female proxemic behaviors.
To provide a visual picture for the proxemic data, a composite map of the
physician's office bright and dim lighting conditions was created showing the seating
selections chosen for the successive scale-figures in relationship to the antecedent figure
(see Figure 30). Although no significant differences in proxemic zones resulted from the
statistical analysis of the bright versus dim conditions, slight variations are apparent when
examining the composite map. Under the dim lighting condition, more seats were chosen
near the entry; six and five respectively. In contrast, under the bright lighting condition,
fewer choices were made to sit near the entry. Perhaps in the dim lighting, choosing a seat
near the entry allowed maximum distances from others.
Most of the seating choices were near tables, and maximized the distance between
figures. This spacing minimizes interaction and protects personal space boundaries A
majority of the seating selections were in the social-far or public-close zone. Figures
seated within the intimate zone, had their backs to one another, eliminating any eye-
contact or welcoming social interaction. In cases where the figures were within the social
or personal zones, a table or another chair(s) separated the figures. Choices to sit near the
tables may have been to acquire access to magazines or other reading material assumed to
be on the tables. Also, subjects tended to choose seats that would place their back to a
wall, as mentioned in the qualitative analysis. However, in the bright lighting condition
6.67% (N = 24) observations and in the dim lighting condition 6.11% (N = 22)
observations indicated a desire to sit facing the receptionist window near the round table
(see Figure 30). This seating choice would leave the person's back vulnerable to the space.
It is possible that DeLong's (1992) theory of ovoid-shaped personal space boundaries

93
Table 8
Gender Comparison of Frequencies of Seating Choices within Proxemic Zones; Physician's
Office Waiting/Reception Area Scenario - Bright Lighting Condition
Frequency (N)Expected Counts
PublicClose
SocialFar
SocialClose
PersonalFar
PersonalClose Intimate Total
Male 86
92.27
62
63.47
22
18.67
15
13.33
4
2.67
3
1.60
192
Female 87
80.73
57
55.53
13
16.33
10
11.67
1
2.33
0
1.40
168
Total 173 119 35 25 5 3 360
Note. N = number of observations. χ2 (5, N = 360) = 6.760, p = 0.239. There were four
cells with expected counts less than 5.0. Distances for zones are as follows: intimate zone
(0"-18"), personal-close zone (18" - 30"), personal-far zone (30" - 4'0"), social-close zone
(4'-0" - 7'-0"), social-far zone (7'-0" - 12'-0"), public-close zone (12'-0" - 25'-0").

94
Table 9
Gender Comparison of Frequencies of Seating Choices within Proxemic Zones; Physician's
Office Waiting/Reception Area Scenario - Dim Lighting Condition
Frequency (N)Expected Counts
PublicClose
SocialFar
SocialClose
PersonalFar
PersonalClose/
Intimate TotalMale 94
98.13
66
62.40
15
13.87
14
15.47
3
2.13
192
Female 90
85.87
51
54.60
11
12.13
15
13.53
1
1.87
168
Total 184 117 26 29 4 360
Note. N = number of observations. χ2 (4, N = 360) = 2.069, p = 0.723. There were two
cells with expected counts less than 5.0. Observations in the intimate zone were combined
with observations in the personal-close zone. Distances for zones are as follows: intimate
zone (0"-18"), personal-close zone (18" - 30"), personal-far zone (30" - 4'0"), social-close
zone (4'-0" - 7'-0"), social-far zone (7'-0" - 12'-0"), public-close zone (12'-0" - 25'-0").

95
�����
���
�����
�����
���
���
���
�����
���
��� ���
��������
��� ���
���
���
Figure 30. Composite map depicting seating selection under lighting conditions for
physician's office waiting/reception scenario. Drawing not to scale.
Entry
Note:
• Antecedent Figure
nb/nd, where nb = frequency of choice in bright light nd = frequency of choice in dim light

96
comes into effect here, as he argues one's personal space requirements are not as large
behind the back as they are to the front and sides.
Figure 31 depicts a typical subject's placement of successive scale-figures in the
physician's office waiting area scenario. In the bright lighting condition, most proxemic
distances are in the public-close zone, twelve to twenty-five feet. Placements of figures
two and three were in the personal-far one, but a table acts to preserve personal space.
Under the dim lighting, most figures were near a table, but figure three was placed farther
way. Perhaps the dim lighting attributed to the decision for this placement, requiring more
distance for providing a sense of greater security in the social situation. Dim lighting may
trigger the feeling that the social atmosphere is more intimate (IESNA, 1995).
A few individuals did display note-worthy differences in their proxemic choices
under the bright or dim lighting conditions. One subject placed their successive 'selves'
within the social-far zone for one person, and within the social-close and personal zones
for the others under the bright lighting condition (see Figure 32). The first person was
placed in the social-far zone, with their back to the antecedent. The second person was
placed with their back to the first, and offset from the antecedent. Both of these
placements may discourage interaction and eye-contact. However, the third person was
placed within the personal-close zone to allow for possible interaction with the first. All
the figures were placed next to a table. The placements for successive 'selves' under the
dim lighting condition are very different for this particular subject. Under the dim lighting
condition, the subject placed his or her successive selves further apart, most within the
social-far zone, discouraging interaction. The first and second figure were placed within
the personal-far zone, but a chair was empty between them, making any possible
interaction less intimate. It is apparent that the lighting did have an effect on the proximity
the subject was willing to place his or her successive selves in this particular behavioral
setting.

97
�
�
�
�
�
�
Figure 31. Recording of successive scale-figure placement for a typical subject in the
physician's office waiting/reception area scenario. Drawing not to scale.
Bright Lighting Condition
Dim Lighting Condition
Note:
• Antecedent Figure
1 = First figure2 = Second figure3 = Third figure
Personal-Far = 2.5' - 4'
Social-close = 4'-7'
Social-far = 7'-12'
Public-close = 12'-25'

98
�
�
�
�
�
�
Figure 32. Recording of successive scale-figure placement for a non-typical subject in the
physician's office waiting/reception area scenario. Drawing not to scale.
Bright Lighting Condition
Dim Lighting Condition
Note:
• Antecedent Figure
1 = First figure2 = Second figure3 = Third figure
Personal-Far = 2.5' - 4'
Social-close = 4'-7'
Social-far = 7'-12'
Public-close = 12'-25'

99
H30 - "In a simulated service-oriented waiting/reception area, there is no difference in
proxemic distances between bright and dim lighting conditions."
Semantic Differential Questionnaire
In addition to examining the hotel lobby and physician's office waiting area spaces,
a service-oriented waiting/reception area was also studied. One question asking how
bright or dim the environment felt, revealed that there was a significant difference in the
perception of bright versus dim lighting condition for the service-oriented waiting/
reception (p < .0001) (see Table 10). This significance validates that there was a
perceived difference in the two lighting conditions.
The null hypothesis was not rejected with the results from the semantic differential
questionnaire. Questions regarding friendly/hostile, pleasant/unpleasant, harmonious/
frustrating, sociable/unsociable, relaxing/agitating, interesting/monotonous, comfortable/
uncomfortable, simple/complex, cluttered/uncluttered, large/small, long/ short, spacious/
cramped, rounded/angular, informal/formal, and contemporary/ traditional showed no
significant difference (p > .05) between bright and dim conditions. Also, no significant
difference (p > .05) was found between bright and dim lighting conditions for the amount
of time a person was willing to wait in the scenario. However, on the questions of how
clear/hazy, focused/unfocused, and radiant/dull the service-oriented waiting/reception felt,
significance (p < .0001) was shown, and the null hypothesis was rejected in this instance
(see Table 10).
Although there was a perceived difference in lighting levels between the two
service-oriented waiting/reception lighting conditions, significant differences in how this
environment felt or appeared under the two lighting conditions was not found (p > .05).
These results indicate that the brightness or dimness of the ambient lighting did not affect
how friendly/hostile, pleasant/unpleasant, harmonious/frustrating, sociable/unsociable,
relaxing/agitating, interesting/monotonous, comfortable/uncomfortable, simple/complex,
cluttered/uncluttered, large/small, long/short, spacious/cramped, rounded/angular,
informal/formal, and contemporary/traditional the service-oriented waiting space was
perceived. As with the results of the previous two scenarios, these results are ambiguous,

100
Table 10
Semantic Differential Questionnaire; Service-Oriented Waiting/Reception Area
QuestionMean Response
BrightMean Response
Dim p-valueFriendly/Hostile 3.433 3.317 0.4743
Pleasant/Unpleasant 4.200 3.250 0.1072
Harmonious/Frustrating 3.416 3.383 0.8312
Sociable/Unsociable 3.150 3.050 0.5442
Relaxing/Agitating 3.383 3.350 0.8375
Interesting/Monotonous 2.500 2.400 0.5659
Comfortable/Uncomfortable 3.333 3.083 0.1403
Bright/Dim 4.067 2.550 <0.0001*
Clear/Hazy 4.033 2.917 <0.0001*
Focused/Unfocused 3.767 3.167 0.0017*
Radiant/Dull 3.333 2.533 <0.0001*
Simple/Complex 4.066 4.117 0.7897
Uncluttered/Cluttered 3.967 4.033 0.7215
Large/Small 3.867 3.583 0.0909
Long/Short 3.133 3.283 0.2876
Spacious/Cramped 3.933 3.717 0.2132
Rounded/Angular 2.233 2.267 0.8438
Informal/Formal 2.783 2.667 0.5744
Contemporary/Traditional 2.867 2.900 0.8733
Waiting time 1.500 1.333 0.1516
Note. *p < .05
101
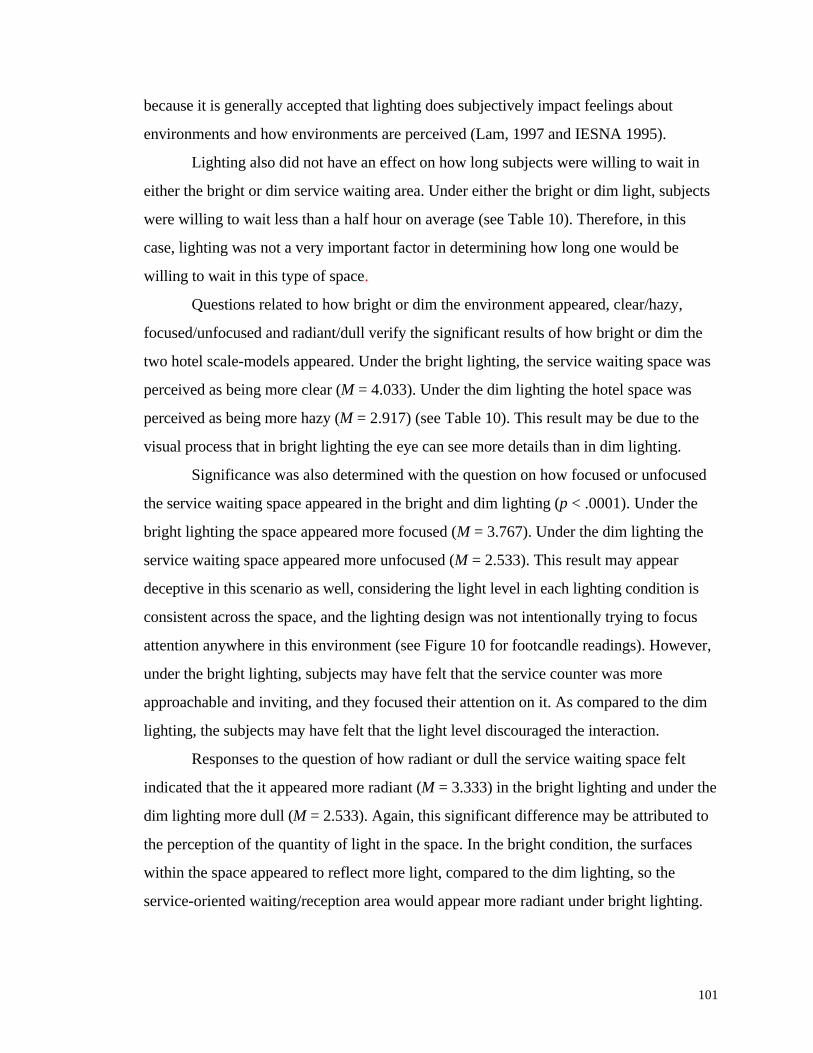
because it is generally accepted that lighting does subjectively impact feelings about
environments and how environments are perceived (Lam, 1997 and IESNA 1995).
Lighting also did not have an effect on how long subjects were willing to wait in
either the bright or dim service waiting area. Under either the bright or dim light, subjects
were willing to wait less than a half hour on average (see Table 10). Therefore, in this
case, lighting was not a very important factor in determining how long one would be
willing to wait in this type of space.
Questions related to how bright or dim the environment appeared, clear/hazy,
focused/unfocused and radiant/dull verify the significant results of how bright or dim the
two hotel scale-models appeared. Under the bright lighting, the service waiting space was
perceived as being more clear (M = 4.033). Under the dim lighting the hotel space was
perceived as being more hazy (M = 2.917) (see Table 10). This result may be due to the
visual process that in bright lighting the eye can see more details than in dim lighting.
Significance was also determined with the question on how focused or unfocused
the service waiting space appeared in the bright and dim lighting (p < .0001). Under the
bright lighting the space appeared more focused (M = 3.767). Under the dim lighting the
service waiting space appeared more unfocused (M = 2.533). This result may appear
deceptive in this scenario as well, considering the light level in each lighting condition is
consistent across the space, and the lighting design was not intentionally trying to focus
attention anywhere in this environment (see Figure 10 for footcandle readings). However,
under the bright lighting, subjects may have felt that the service counter was more
approachable and inviting, and they focused their attention on it. As compared to the dim
lighting, the subjects may have felt that the light level discouraged the interaction.
Responses to the question of how radiant or dull the service waiting space felt
indicated that the it appeared more radiant (M = 3.333) in the bright lighting and under the
dim lighting more dull (M = 2.533). Again, this significant difference may be attributed to
the perception of the quantity of light in the space. In the bright condition, the surfaces
within the space appeared to reflect more light, compared to the dim lighting, so the
service-oriented waiting/reception area would appear more radiant under bright lighting.

102
Proxemic Measurements
Proxemic distances between the seating selections chosen in the service scenario
bright and dim lighting conditions were recorded. A contingency table, following the
format of a two factor mixed model experiment in a randomized complete block design,
discussed in the methodology was prepared showing the frequency of seating selections
within six proxemic zones are including the intimate (close and far combined), personal-
close, personal-far, social-close, social-far, and public-close zones. The percentages of
seating selections placed within these six proxemic are displayed within Table 11. No
significant difference between bright and dim conditions were found, so the null hypothesis
could not be rejected (p > .05) (see Appendix H). However, there are noticeable
differences in the seating selections made within the six proxemic zones. A majority
(60.97%) of the seating choices were made in the public-close zone. Fewer choices were
made in the social-far and social-close zones, 18.33% and 15%, respectively. Only 3.19%
of the seating choices were in the personal-far zone, 1.53% in the personal-close zone, and
0.97% in the intimate zone. Distances were overwhelmingly in the public-close zone. The
total percentages for the public-close zone in this scenario (60.97%) are considerably
higher that that of the hotel (30.28%) and physician's (50.00%) scenario. Perhaps this
result is due to the seating arrangement in this particular setting. All the seats are along the
perimeter of the space, unlike the other two environments for this study. In this waiting
area, it may have been easier to maximize distances between individuals.
Chi-square tests were run to compare the frequency of seating selections by males
to the frequency of seating selections by females in the six proxemic zones under
investigation for the two lighting conditions in the service-oriented waiting/reception area
scenario. Statistical significance was not found to indicate a difference in seat selections by
males and females in the bright lighting condition (χ2(4, N = 360) = 4.212, p > .05) or in
the dim lighting condition (χ2(5, N = 360) = 3.262, p > .05) (see Table 12 and Table 13).
These results are consistent with that of the results from the hotel and physicians office
waiting/reception area scenarios.
A composite map of the service bright and dim lighting conditions was created
showing the seating selections chosen for the successive scale-figures in relationship to

103
Table 11
Contingency Table with Seating Choices within Six Proxemic Zones; Service-Oriented
Waiting/Reception Area Scenario
FrequencyPercentRow PctColumnPct
PublicClose
SocialFar
SocialClose
PersonalFar
PersonalClose Intimate Total
Bright 215
29.86
59.72
48.97
69
9.58
19.17
52.27
55
7.64
15.28
50.93
14
1.94
3.89
60.87
5
0.69
1.39
45.45
2
0.28
0.56
28.57
360
50.00
Dim 224
31.11
62.22
51.03
63
8.75
17.50
47.73
53
7.36
14.72
49.07
9
1.25
2.50
39.13
6
0.83
1.67
54.55
5
0.69
1.39
71.43
360
50.00
Total 439
60.97
132
18.33
108
15.00
23
3.19
11
1.53
7
0.97
720
100.00
Note. Distances for zones are as follows: intimate zone (0"-18"), personal-close
zone (18" - 30"), personal-far zone (30" - 4'0"), social-close zone (4'-0" - 7'-0"),
social-far zone (7'-0" - 12'-0"), public-close zone (12'-0" - 25'-0").

104
Table 12
Gender Comparison of Frequencies of Seating Choices within Proxemic Zones; Service-
Oriented Waiting/Reception Area Scenario - Bright Lighting Condition
Frequency (N)Expected Counts
PublicClose
SocialFar
SocialClose
PersonalFar
PersonalClose Total
Male 115
114.67
36
37.87
27
28.27
11
7.47
3
3.73
192
Female 100
100.33
35
33.13
26
24.73
3
36.53
4
3.27
168
Total 215 71 53 14 7 360
Note. N = number of observations. χ2 (5, N = 360) = 4.212, p = 0.378. There were two
cells with expected counts less than 5.0. Observations in the intimate zone were combined
with observations in the personal-close zone. Distances for zones are as follows: intimate
zone (0"-18"), personal-close zone (18" - 30"), personal-far zone (30" - 4'0"), social-close
zone (4'-0" - 7'-0"), social-far zone (7'-0" - 12'-0"), public-close zone (12'-0" - 25'-0").

105
Table 13
Gender Comparison of Frequencies of Seating Choices within Proxemic Zones; Service-
Oriented Waiting/Reception Area Scenario - Dim Lighting Condition
Frequency (N)Expected Counts
PublicClose
SocialFar
SocialClose
PersonalFar
PersonalClose
IntimateTotal
Male 86
92.27
62
63.47
22
18.67
15
13.33
4
2.67
3
1.60
192
Female 87
80.73
57
55.53
13
16.33
10
11.67
1
2.33
0
1.40
168
Total 173 119 35 25 5 3 360
Note. N = number of observations. χ2 (5, N = 360) = 3.262, p = 0.659. There were six
cells with expected counts less than 5.0. Observations in the intimate zone were combined
with observations in the personal-close zone. Distances for zones are as follows: intimate
zone (0"-18"), personal-close zone (18" - 30"), personal-far zone (30" - 4'0"), social-close
zone (4'-0" - 7'-0"), social-far zone (7'-0" - 12'-0"), public-close zone (12'-0" - 25'-0").

106
the antecedent figure (see Figure 33). Although no significant differences in proxemic
zones resulted from the statistical analysis of the bright versus dim conditions, slight
variations are apparent when examining the composite map. Seating selections show a
preference to sit near tables and/or as much space as possible between other people. Most
of the seating choices were made within the public-close proxemic zone and fewer choices
in the other zones. A few choices were in the personal-close or intimate zone near the
antecedent figure. Six observations (1.67%) were noted in the bright condition and seven
(1.94%) were noted in the dim condition at a right angle to the antecedent (see Figure 33).
This close proximity may have been due to the presence of a decorative lighting fixture.
Light was not being emitted from this fixture, but perhaps subjects assumed there would
have been light had the scale-model been a real environment.
The choices made to sit in the public-close zone were consistent under the two
lighting conditions. The choices for the successive scale-figures maximized distances as
much as possible, and minimized opportunities for interaction. Choices for seats were
typically in opposite corners of the space near a table. Figure 34 depicts a recording of a
typical subject's successive seat selections in the service-oriented waiting/reception area
scenario. Lighting did not appear to be an important factor for most individuals in
determining seat selection and proximity to others. Other factors, such as proximity to
tables, maximizing distances from others as much as possible, and maintaining a view of
the space outweighed decisions lighting could have influenced.
However, there were a few subjects who did show different seating choices under
the two lighting conditions. One example is depicted in Figure 35. In the bright lighting
condition for the service-oriented scenario, one subject placed the three successive figures
within the social close and far zones. However, these three figures were placed in the
public-close zone from the antecedent figure. In contrast, under the dim lighting condition,
the first two figures were placed in the same seat selections as the bright condition, but the
third figure was placed in the public-far zone from the first two figures. The third figure
was placed within the personal-far zone in relation to the antecedent figure to allow for
possible interaction. One possible explanation for this result is that lighting did have an
impact on the proxemic choices that this subject made. Perhaps in the dimmer light, the

107
���
���
�����
�����
���
�����
���
�����
�����
��������
����
��� ���
Figure 33. Composite map depicting seating selection under bright and dim lighting
conditions for service-oriented waiting/reception scenario. Drawing not to scale.
Note:
• Antecedent Figure
nb/nd, where nb = frequency of choice in bright light nd = frequency of choice in dim light

108
�
�
�
�
�
�
Figure 34. Recording of successive scale-figure placement for a typical subject in the
service-oriented waiting/reception area scenario. Drawing not to scale.
Bright Lighting Condition
Dim Lighting Condition
Note:
• Antecedent Figure
1 = First figure2 = Second figure3 = Third figure
Personal-Far = 2.5' - 4'
Social-close = 4'-7'
Social-far = 7'-12'
Public-close = 12'-25'

109
�
�
�
�
�
�
Figure 35. Recording of successive scale-figure placement for a non-typical subject in the
service-oriented waiting/reception area scenario. Drawing not to scale.
Bright Lighting Condition
Dim Lighting Condition
Note:
• Antecedent Figure
1 = First figure2 = Second figure3 = Third figure
Personal-Far = 2.5' - 4'
Social-close = 4'-7'
Social-far = 7'-12'
Public-close = 12'-25'
110
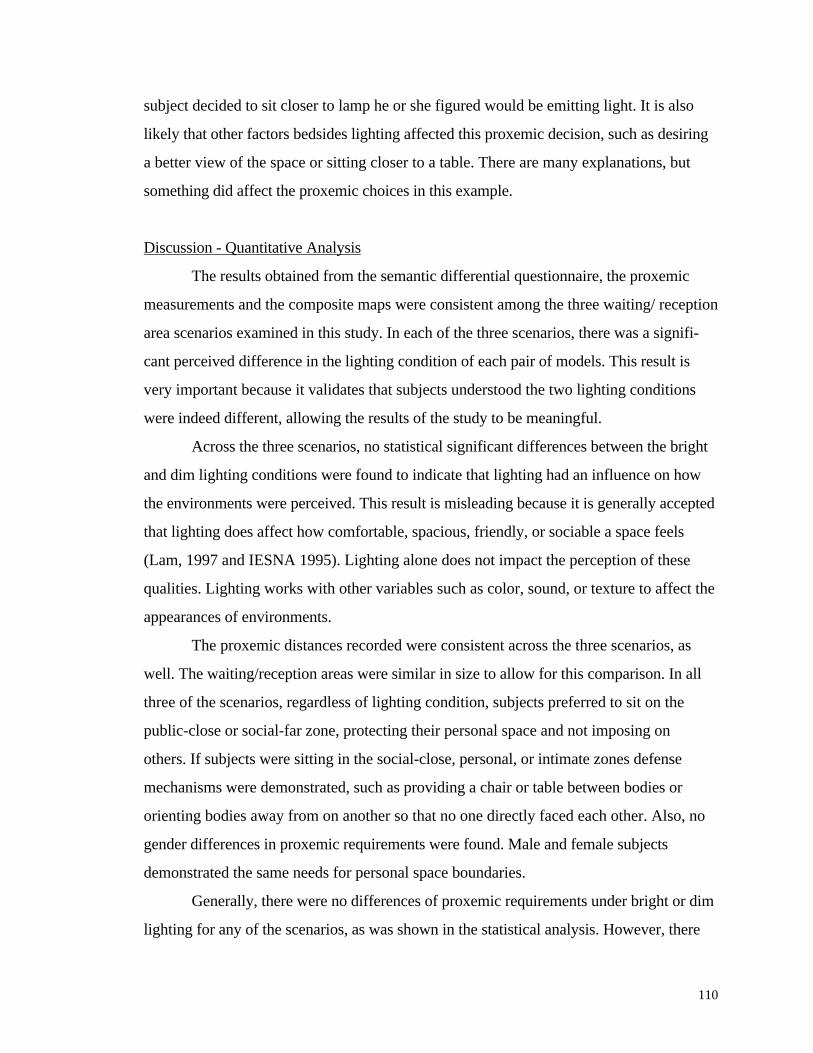
subject decided to sit closer to lamp he or she figured would be emitting light. It is also
likely that other factors bedsides lighting affected this proxemic decision, such as desiring
a better view of the space or sitting closer to a table. There are many explanations, but
something did affect the proxemic choices in this example.
Discussion - Quantitative Analysis
The results obtained from the semantic differential questionnaire, the proxemic
measurements and the composite maps were consistent among the three waiting/ reception
area scenarios examined in this study. In each of the three scenarios, there was a signifi-
cant perceived difference in the lighting condition of each pair of models. This result is
very important because it validates that subjects understood the two lighting conditions
were indeed different, allowing the results of the study to be meaningful.
Across the three scenarios, no statistical significant differences between the bright
and dim lighting conditions were found to indicate that lighting had an influence on how
the environments were perceived. This result is misleading because it is generally accepted
that lighting does affect how comfortable, spacious, friendly, or sociable a space feels
(Lam, 1997 and IESNA 1995). Lighting alone does not impact the perception of these
qualities. Lighting works with other variables such as color, sound, or texture to affect the
appearances of environments.
The proxemic distances recorded were consistent across the three scenarios, as
well. The waiting/reception areas were similar in size to allow for this comparison. In all
three of the scenarios, regardless of lighting condition, subjects preferred to sit on the
public-close or social-far zone, protecting their personal space and not imposing on
others. If subjects were sitting in the social-close, personal, or intimate zones defense
mechanisms were demonstrated, such as providing a chair or table between bodies or
orienting bodies away from on another so that no one directly faced each other. Also, no
gender differences in proxemic requirements were found. Male and female subjects
demonstrated the same needs for personal space boundaries.
Generally, there were no differences of proxemic requirements under bright or dim
lighting for any of the scenarios, as was shown in the statistical analysis. However, there

111
were a few subjects who demonstrated lighting did influence their proxemic choices under
the two lighting conditions. These subjects indicated a willingness to sit closer to strangers
in bright lighting as compared to sitting further away in dim lighting. This phenomenon is
consistent with Adam's and Zuckerman's (1991) results that in dim lighting personal space
increases compared to bright lighting. However, Adam and Zuckerman (1991) worked in
the context of standing individuals, where as this study worked in a seated context. For
these individuals the dim lighting may have caused inappropriate feelings of intimacy,
therefore increasing spatial distance.
Qualitative Analysis
An open ended questionnaire was given to the subjects near the completion of the
experiment (see Appendix E). The questionnaire contained the following three questions:
1) Describe how you felt interacting with the models.
2) What did you feel motivated your seating selection within the models?
3) Did you think about the lighting within the models? If so, how did the lighting
influence your seating selection?
These questions were asked to further clarify what the respondents were thinking while
making decisions affecting the placement of 'his or herself' within the models.
An open coding analysis was used to define the qualitative data (Strauss & Corbin,
1990). "Open coding is the part of the analysis that pertains specifically to the naming and
categorizing of phenomena through close examination of data…During open coding data
are broken down into discrete parts, closely examined, compared for similarities and
differences, and questions are asked about the phenomena as reflected in the data" (p. 62).
The video and audio recordings of the experiment were used to help develop the content
analysis and corroborate the categories developed from the open-ended questionnaire.
Questionnaire
Question 1: Describe how you felt interacting with the models.
Several categories emerged from this data set, including that the simulation was
realistic, unrealistic, user friendly, awkward, interactive, stimulating, and thought

112
provoking. Respondents (27% ) indicated they felt the models were realistic or they could
easily relate themselves to the environments the models represented. "It was reasonably
easy to 'place myself' in the models. They had a realistic feel." "Models were representative
enough to put you in the right mind set." "Felt like I was there." A small portion of the
respondents (10%) felt otherwise, that the models were unrealistic."[Felt] OK." "They
[models] were on the bland side. Not too realistic in terms of what the situations might
really look like - color, fabric, sound." "It was a bit difficult to imagine the people without
any distinguishing characteristics, though my answers probably would not have changed."
Respondents (25% ) indicated they felt fine or comfortable, that the models were user
friendly. "Comfortable. The models were easy to handle and 'human' enough to relate to."
Respondents (17% ) stated interacting with the models was stimulating or interesting.
"Interesting. Really tried to place myself in the varying situations." Respondents (8%)
indicated they felt awkward or frustrated. "Funny, yet awkward. Moving doll-like objects
didn't seem real at first. The sensation changed by the third model. I began to focus in on
the subtle changes per lighting and layout." Sometimes I felt frustrated because someone
was in the seat I would have selected (even though I put the person there!)" Respondents
(25%) noted they felt interacting with the models was thought provoking. "It seemed like
I knew where I would sit immediately." "These models made me think about where I
would sit when entering a room. Interacting with these models also made me have an
awareness of the people around me before I sat down." These quotes represent some of
the language used to support the development of the categories (see Appendix I). See
Table 14 for summary of open-ended questionnaire responses.
Question 2: "What did you feel motivated your seating selections within the models?"
Several categories of responses emerged from this data set. Respondents reported
the presence of a table, proximity to others in the space, achieving privacy, a view of the
space, service response, lighting, and seat orientation had influenced some of their seating
choices. Respondents (47% ) stated that the presence of a table prompted their choice to
sit near the table. "Reading materials on end tables would prompt me to sit near the
tables." "To be near a table w/ magazines, to put a purse, coffee cup, etc." Respondents

113
Table 14
Summary of Responses from Open-Ended Questionnaire
Questions Categories
Realistic UnrealisticUser
Friendly StimulatingAwkward/Frustrating
ThoughtProvoking
1 27% 10% 25% 8% 17% 25%
Presenceof table
Proximityto others Privacy View
Planes
ServiceResponse Lighting
SeatOrientatio
n
Proximity toEntrance/Exit
2 47% 20% 63% 38% 10% 5% 3% 8%
NoImpact Proximity
SpatialComfort
PreferBrightLight
AversionDim Light
3 30% 8% 60% 42% 8%

114
(20% ) indicated that the proximity to others influenced seating choices. "Seating selection
was based mostly on the location of other people in the models." "Not too close, not too
isolated. Give the opportunity to talk with other persons who are interesting and be far
enough to avoid if they are dull." Respondents (63%) expressed a desire to achieve
privacy. "Wanted to have private space around me." "I generally tried to maximize the
space from the next nearest person. Although in the central circular models [hotel
models], I chose to be closer because the chairs at the edges had a 'left out' feeling."
Respondents (38%) indicated they would prefer to sit where their viewing plane included
a view of the receptionist counter or the whole space. "Good view of room." "View of
total space." Respondents (10%) stated they would sit where they were close to a service
counter or receptionist. "Wanted to be close to service person or reception window, or
counter." Respondents (15%) expressed a desire to sit where they considered there to be
good lighting. "I always have reading material, so I look for a light spot." Respondents
(3% ) indicated that the orientation of the seating in the space influences their seat
selections. "I like to sit with my back to the wall." "I like corner seats." Respondents (8%)
also stated they would choose to sit near entrances/exits. "I like to be close to the exit."
These quotes represent some of the language used to support the development of the
categories (see Appendix I). See Table 14 for summary of open-ended questionnaire
responses.
Questions 3: "Did you think about the lighting within the models? If so, how did the
lighting influence your seating selection?"
Respondents (8%) stated they only thought about the lighting in the spaces "a
little." Respondents (13%) stated "no", they did not think about the lighting and 78%
stated "yes" they did consider the lighting within the models. Forty-seven respondents
stated that "yes" they did think about the lighting within the models. However, 30% of the
respondents who stated "yes" said the lighting would not have impacted their decision
where to sit. Lighting appeared to have more of an effect on how the subject felt in that
space. Respondents (60%) stated that the lighting affected their comfort level in the space.
"It didn't affect the seating selection, but it motivated my comfort within in the room. I

115
was more comfortable in brighter rooms." "Quality of light is important to a sense of
comfort in a space." "It influenced my comfort level more than my seating selection. I'd be
willing to wait longer in a well lit place because of being able to see well and because it
would allow me to more easily/better … to read or do work…" Respondents (8%)
indicated lighting did affect their seating choices and proximity to others. "If it was dark I
did not want to go too close." "Brighter lighting seemed to be more 'friendly' - a more
willingness to sit nearer someone." Preferences were expressed for bright lighting.
Respondents (42%) stated a preference for brighter lighting. "Bright lights are more
inviting to me and presents a more positive atmosphere to me." In contrast, 15% of the
respondents expressed negative feelings towards dim lighting. "I hate dim lighting." "Dull
or low light you tend to see as a controlled location with less interaction with other
patrons." A few respondents also noted how the light level affected how close or far they
would choose to sit near other people in the spaces. These quotes represent some of the
language used to support the development of the categories (see Appendix I). See Table
14 for summary of open-ended questionnaire responses.
Video and Audio Recordings
In addition to the qualitative data obtained from the questionnaire, each subject's
hands interacting with the models were video taped. Audio taping for verbal comments
made through the course of the experiment was also recorded. These recordings were
used to verify what the subjects were doing through the course of the experiment, not to
generate data. The information obtained from the video and audio recordings were also
used to assist the establishment of categories from the open-ended questionnaire.
Upon reviewing the video/audio tapes, the following reactions were noted.
Subjects were inquisitive about the three reception/waiting environments represented.
Subjects asked questions about the specific entrances, where adjacent entries were
located, and where visible doorways would lead to. They also asked if tables would have
magazines or reading materials on them. The same answers were given to all subjects
regarding these types of questions. Specific entrances into each model were described and
what was behind adjacent doorways or openings was also explained for each scenario.

116
These answers were given before and after these types of questions were asked, depending
on the inquiries by the subject. It was also stated that tables could be assumed to have
reading material on them. These questions and answers were important in helping the
subject familiarize himself or herself with the environment. Subjects made comments about
the tables, and placed figures near tables they assumed would have reading material on
them. Most subjects felt it was important to space himself/herself in the environment as a
far away from others as possible, paying little attention to entrances/exits in the physician's
office and service-oriented waiting/reception scenarios. However, in the hotel lobby
scenarios, most subjects assumed they were waiting for someone to join them, and they
desired a place to sit that would afford the best view of the space while at the same time
maintaining what they felt were private distances from others.
Throughout the course of the experiment, most subjects were silent and did not
indicate reasons why they chose seats where they did. Yet, subjects seemed to relate well
to the environments that the models represented. Most subjects placed their successive
selves in the models rather quickly, indicating they needed little time to decide where to
sit. A few subjects did spend quite a bit of time studying the models, and were slow to
place their successive selves in the first few models. After about three models, the
placement of their successive selves was more quick, indicating they took less time to
decide where to sit. Rarely did subjects move a scale-figure from one seat to another, or
show an interest in one seat then finally place the figure in another. Thus, nearly all
placements of scale figures were made in just seconds and never changed.
A few questions that were not common throughout the sample group included
questions about the gender of the strangers, the physical attractiveness of the strangers or
asked about what type of clothing the strangers were wearing. The researcher asked if the
answer would make a difference in the seat selection. Most times, the answer was yes, the
gender/beauty/dress of a stranger would most likely make a difference. Other questions
regarded why people were waiting in the physician's office waiting room. "Were they
sick?" The researcher explained that the subject did not know why the people where
waiting to see the physician, that they could be sick, or possibly be there for a check-up.
Subjects did express a desire to not sit too close to those in the physician's office waiting
117
area. Other comments on seat selection included expressing a need to sit with a back to
the wall, the desire to see the whole space, a desire to choose comfortable seating, or sit
where they thought more light was available to read while they waited.
Several subjects verbally expressed they noticed a difference in the models as they
encountered them through out the course of the experiment. Some of subjects wanted to
go back and look at the difference. The researcher did not allow this direct comparison
until after the experiment was completed. Of the subjects who noticed a difference in the
similar models, they did not immediately recognize that the lighting level was the only
difference between conditions.
Discussion - Qualitative Analysis
The qualitative analysis revealed most subjects did think about the lighting in the
models throughout the course of the experiment, although lighting was not a major
influence in determining seat selections in the three scenarios under investigation.
Proximity to others, achieving privacy, having a view of the space, and sitting near tables
were more important factors in determining seating choice than the factor of lighting.
Subjects also indicated the lighting level had an impact on their comfort level in the
space. Responses showed a tendency to feel more comfortable in brighter lighting than in
dim lighting. These qualitative results are contradictory to the statistical results obtained
from the semantic differential questionnaire, which showed there were no differences in
the perception of comfort under the two lighting conditions in each scenario. A possible
explanation for this results may be that in answering the questions on the open-ended
questionnaire, subjects related their answer to experiences they have had in other
behavioral settings. In answering this question on the semantic differential questionnaire,
subjects directed their answer to the model in front of them, as instructed.

118
IV. Conclusion
Hall (1966) pioneered the ground work for the study of human personal space by
defining four basic invisible bubbles serving to maintain proper spacing between
individuals, which he named proxemic zones. Much research on proxemics has been
prepared by researchers such as Sommer (1969), Altman (1975), and DeLong (1976) as
well as many others. Their research has explored cultural influences, social influences,
seating arrangements, and crowding perception. However, few studies to date have
attempted to examine the potential influence of illumination level on personal space
behavior within a particular environmental/behavioral setting. This study attempted to
explore this potential influence by investigating the effect of bright or dim lighting
conditions on the personal space requirements within the behavioral setting of
waiting/reception areas.
This study worked within the theoretical framework of Michelson's (1976)
Intersystems Congruence Model [ICM], which stated that cultural, social, and personality
systems interact and limit possible behaviors or variables present in each system. At the
same time, the built environment sets broad limits on what behaviors (influenced by
cultural, social, personality factors) can occur in a particular environmental setting. Space
is always the variable under scrutiny in this framework. The study at hand looked for
changes in the amount of space due to environmental changes (illumination level) and
attempted to control for variables in the cultural, social, and personality systems.
In setting up the experiment, several variables in each of the four systems of
Michelson's (1976) ICM were controlled. In the built-environment system, three different
types of waiting/reception areas were used for analysis: a hotel lobby, physician's office,
and service-oriented waiting spaces. Cultural influences were controlled by using a
homogenous sample of people who had lived in the United States for at least seven years.
Nearly all participants (95%) were Caucasian. Social influences were controlled by
examining one type of behavioral setting, where social expectations for behaviors in the
space were similar, and it could be assumed that people in the spaces would be strangers.
Social expectations were also controlled by using similarly sized spaces, and typical

119
furniture arrangements. Personality influences may not be highly controlled, but the scale-
models used in the experiment eliminated color, texture and noise factors that could affect
individual differences.
The results of the subjects' interactions with the models indicated with statistical
significance that subjects did perceive the difference between the brightly and dimly
illuminated conditions of each of the three scenarios presented in the study. This result
confirms that the participants understood the lighting qualities of the scale-models. in
addition, the qualitative results showed that participants also easily related to the spaces
the models represented.
The quantitative results showed that under general ambient bright and dim lighting
conditions, there were no significant differences in personal space requirements in the
waiting/receptions area behavioral setting. Thus, lighting does not appear to be a
determining factor in achieving adequate personal space. The qualitative analysis agreed
with these results, noting other factors as being more important, such as presence of tables
(assuming they hold reading materials) and a view of the entire space. The proximity to
others was important, but thinking about the lighting did not affect choices in attaining
adequate personal space for most of the subjects in this experiment. This phenomenon
suggests ambient illumination level does not play a large role in determining proxemic
distances between individuals in waiting area settings.
There were differences between the two types of analyses. The quantitative results
did not show significant differences between bright and dim lighting for how
comfortable/uncomfortable or social/unsociable the waiting/reception areas felt or
appeared. In contrast, the qualitative results reported the light level did influence these
feelings. In brighter lighting, the spaces were reported to feel more comfortable and more
sociable than under the dim lighting.
As Michelson's (1976) ICM suggests, four systems (cultural, social, personality,
and built-environment) interact to influence the variable of space. The results, shaped by
the use of a homogenous sample, representing people who have lived in the United States
for at least seven years, showed that social and personality variables influenced proxemic
distances more so than built-environment variables. In general, people desired to sit as far

120
from others to preserve a sense of privacy as possible, a function of the social system.
Others felt that having a view of the entire space was important, a function of the
personality system. To a lesser influence, furniture arrangement and availability of tables to
sit close to affected proxemic distances, a function of the built-environment system.
This study has several implications for design related fields. First, it is now
understood that tolerable, not extreme differences, in ambient illumination do not have an
influence on personal space requirements in waiting/reception areas, but other factors
relating to proximity do have influences. Designers can use this information to effectively
plan waiting areas for end users. Secondly, the use of 1" = 1'-0" scale-models of interior
environments within this study demonstrated subjects easily relate to the environments
they represent and that models can be effectively used for further research in proxemic
studies. Thirdly, the use of illuminated scale-models in combination with open-ended
questionnaires is an effective way of testing behavioral hypotheses when field studies are
not possible or are not feasible due to many confounding variables.
Several limitations were imposed on this research. First, only three scale-figures
were placed inside the models during the experiment, for a total of four including the
antecedent. All these figures were seated. Only the hotel lobby and service-oriented spaces
had standing antecedent figures at the service counters. Using only a few figures left the
spaces under investigation rather sparsely populated. Results may have been different if
more figures were in the environments, forcing the issues of crowding and territoriality as
related to personal space. Secondly, this study did not attempt to simulate and analyze
Sommer's (1969) theories of arrival, settled, and departure distances. If figures had been
moved and changed through-out the course of the experiment, simulating more real-life
movements, results may have been different. Thirdly, this study only attempted to analyze
the influence of ambient bright and dim illumination levels on personal space behavior. It
did not attempt to simulate the use of other types of decorative light sources commonly
found in waiting spaces such as table lamps, floor lamps, or accent lights. Simulated
placements of these types of lights may have affected results.
Many possibilities for future research could be developed from this study. Other
types of environmental/behavior settings could be analyzed in a similar way to see if

121
illumination level has an influence on personal space requirements. This study could be
repeated changing the light distribution patterns and adding scale-model light emitting
sources such as table lamps and floor lamps to examine potential effect on proxemic
behaviors. Other types of spaces could be analyzed by manipulating light distribution
patterns, different types of light sources or colors of light for potential influences on
proxemic behaviors. All of these possibilities could also be analyzed in terms of how
gender, cultural and social factors have an influence. It is important to continue research in
the realm of proxemics with the consideration of various cultural and social factors in
order for designers to create better designed, efficient and user friendly environments.