Embed Size (px)
Citation preview
Micropost Arrays to Advance Cell Handling
By
Ryan Daniel Sochol
A thesis submitted in partial satisfaction of the
requirements for the degree of
Doctor of Philosophy
in
Mechanical Engineering
in the
Graduate Division
of the
University of California, Berkeley
Committee in charge:
Professor Liwei Lin, Chair
Professor Dorian Liepmann
Professor Song Li
Professor Luke P. Lee
Fall 2011

ii
1
Abstract
Micropost Arrays to Advance Cell Handling
by
Ryan Daniel Sochol
Doctor of Philosophy in Mechanical Engineering
University of California, Berkeley
Professor Liwei Lin, Chair
Mechanical engineering methods and microfabrication techniques offer powerful means for
meeting biological challenges. In particular, microfabrication processes enable researchers to
develop technologies at scales that are biologically relevant and advantageous. In this work,
microfabricated posts were employed to advance cell handling capabilities in both static and
dynamic (i.e., microfluidic) systems.
Static, substrate-based biophysical properties influence diverse cellular processes. Methods for
engineering micropost arrays enable microscale control over the biophysical characteristics of
discrete topographic features. Here, unidirectional micropost array gradients of variable
micropost stiffness and variable interpost spacing were constructed to regulate cell motility using
two distinct biophysical cues: (i) gradients in substrate rigidity (i.e., via durotaxis – a subset of
mechanotaxis), and (ii) variable spacing of substrate binding sites – via a phenomenon herein
referred to as spatiotaxis. Micropost array stiffness gradients were designed with post-to-post
differences in stiffness of 0.5 nN/μm, 2 nN/μm, 3 nN/μm, and 7.5 nN/μm. Bovine aortic
endothelial cells (BAECs) seeded on micropost array gradients with variable micropost stiffness
exhibited preferential cell migration in the direction of increasing micropost stiffness.
Gradients of elliptical microposts further enhanced unidirectional guidance by limiting cellular
movement perpendicular to the direction of increasing micropost stiffness. Micropost array
spacing gradients were designed with average post-to-post differences in spacing of 10 nm,
20 nm, and 40 nm. Micropost array gradients with variable interpost spacing were found to
promote BAEC migration in the direction of decreasing interpost spacing, which represents the
first demonstration of unidirectional spatiotaxis. Higher gradient strengths were observed to
enhance the aforementioned migratory behaviors for both biophysical cues. For substrates with
simultaneous, anti-parallel stiffness and spatial stimuli, the spatial cues were found to dominate
the migratory response. The micropost array gradient methodology offers a powerful technique
for investigating the biophysical cellular response, while also providing the basis for new classes
2
of passive substrates capable of directing cell motility in biological fields, such as biomaterials,
tissue engineering, and regenerative medicine.
In order to create high-speed lab-on-a-chip devices for quantitative cell biology, drug discovery,
and molecular diagnostics, precision hydrodynamic controls of microparticles (e.g., cells and
microbeads) are in critical demand. The ability to achieve multi-stage fluidic reaction processes
for microparticles is integral to diverse chemical and biological applications;
however, microfluidic particulate-based systems remain limited due to particle handling issues.
In contrast to suspended cells, which are experimentally complex, microbeads offer a simplified
example for initial demonstrations of microfluidic particulate handling. Thus, the ability to
manipulate microbeads in microfluidic systems represents a fundamental first step toward
advancing microfluidic cell handling. In this dissertation, microposts (15×15 µm2) were arrayed
within microfluidic architectures (18 µm in height) to enhance microparticle handling and enable
multi-stage fluidic reactions and analyses for suspended particles. The presented microfluidic
systems were first characterized using suspended microbeads (15 µm in diameter); thereafter, the
potential of employing the platforms for cell handling applications was also investigated using
suspended BAECs. A resettable, hydrodynamic microparticle trapping system – termed
micropost array trapping (µPAT) – was designed and demonstrated to accomplish controlled
particulate arraying and microarray resettability by trapping-and-releasing both microbeads and
cells. The µPAT technique was integrated into: (i) a dynamic microarray to detect multiple
bio-molecules in parallel via molecular beacon probes conjugated to microbead substrates, and
(ii) a “Microfluidic Ping Pong” (MPP) system to achieve multi-stage fluidic reactions under
discontinuous flow conditions. As a demonstrative example, the MPP technique was employed
to detect an inflammatory cytokine at 100 pM concentrations via an 11-stage aptamer beacon-
based sandwich assay performed using microbeads. Additionally, a microfluidic micropost array
railing (µPAR) system was developed to rapidly transport both microbeads and cells into
adjacent flow streams under continuous flow conditions. To demonstrate the µPAR technique,
a multiplexed layer-by-layer (LbL) molecular synthesis process (i.e., consisting of up to 18
fluidic stages) was accomplished on microbead substrates. This work represents the first
demonstration of a microfluidic platform capable of railing either microbeads or cells into
adjacent flow streams. Through improved microparticle handling in microfluidic systems,
the presented methodologies could further extend the efficacy of dynamic cell-based and
bead-based microarrays for applications in diverse chemical and biological fields.

i
Dedication
This work is dedicated to my parents,
Lori and David Sochol,
whose uncompromising belief in me is the reason for my accomplishments.
Unconditional love is a powerful thing.
It instills a sense of self-worth, security, and optimism
that reframes life‟s challenges to appear far less daunting.

ii
Acknowledgements
To say my experience at UC Berkeley has surpassed my expectations would be a considerable
understatement. Coming to Berkeley without any prior research experience, in addition to not
having taken courses in MEMS or Biology, was certainly a cause for anxiety when I began my
graduate career. It did not help that I spent much of my first year of graduate school in a lab that
was not a great fit, which only served to further exacerbate my concerns. Luckily, this trend
reversed completely after I joined the Liwei Lin Lab. From that point on, my time at Berkeley
has been characterized by tremendous growth not only intellectually, but in essentially every
aspect of my life. It is without question that growth is primarily due to my interactions with the
people who have been there for me during my graduate experience, all of whom I will try to
acknowledge here.
First, I am truly grateful to my advisor, Prof. Liwei Lin, as well as my „co-advisors,‟
Prof. Song Li and Prof. Luke Lee, for their incredible guidance and support during my graduate
career. For those in the field, it is widely known how tremendous an opportunity it is to get to
work with any one of these professors, but the fact that I‟ve had access to such a brain trust of
intellectual powerhouses throughout my time at Berkeley has been simply outstanding.
It should be noted that nothing here will really do justice to how extraordinary an advisor Prof.
Liwei Lin has been; nonetheless, I will list some of my favorite aspects of working for him.
On a purely academic level, I find it difficult to imagine that there are other professors in the
world who work as hard as Prof. Lin does to cultivate creativity, independence, and intellectual
growth in their students. This has been particularly true for me given that my biological research
interests have never exactly been perfectly in line with the laboratory‟s research directions.
Despite this fact, Prof. Lin has never wavered in his support of me. He has been a constant
source of sound insight and feedback regarding every component of the academic process, with
intellectual input that is consistently humbling. Additionally, I have genuinely never met anyone
with more integrity than Prof. Lin. His commitment to honesty, fairness, and pragmatism is
unsurpassed. I sincerely appreciate how fortunate I am to have had this experience.
As a mechanical engineer, the biological aspects of my projects have been particularly
challenging. I cannot thank Prof. Song Li, Prof. Luke Lee, and Megan Dueck enough, not only
for allowing me to work in their laboratories, but also for consistently providing me with
invaluable help and advice throughout my graduate career. I recognize that Prof. Li, Prof. Lee,
and Megan are quite busy with their own labs and research, so for them to have taken so much
time over the years to meet with me, flesh out ideas, and edit manuscripts has meant a great deal.
I especially want to express my gratitude for their encouragement of me as well as their
continued support of my research projects.
I also want to thank Prof. Albert Pisano and Prof. Dorian Liepmann, whose counsel has been
particularly helpful, especially during my time preparing for my qualifying examination.
I am truly thankful to Adrienne Higa, without whom it is doubtful that the micropost array
gradient projects would have ever taken off. Her brilliance, insight, and work-ethic make her an

iii
ideal research partner, but her understanding, thoughtfulness, and selflessness elevate her from
just a partner to one of my very best friends.
I cannot imagine that graduate school would have been so enjoyable without such a wonderful
environment for research. My mentor, Brian Sosnowchik, was critical in helping me develop my
skills as a researcher. He certainly led by example, and was always willing to provide much-
needed advice. I would like to thank Kosuke Iwai, Kedar Shah, Armon Mahajerin, Richard
Winslow, and all of the members of the Liwei Lin Lab for their help and assistance. Working in
outside laboratories can be difficult, but the laboratories of Prof. Song Li and Prof. Luke Lee as
well as the Berkeley Nanotechnology Center (BNC) and the Berkeley Stem Cell Center have
been incredibly welcoming and supportive. In particular, I greatly appreciate the help of Paul
Lum, Mary West, Randall Janairo, Julia Chu, John Waldeisen, Hansang Cho, Terry Johnson,
Jeffrey Henry, Timothy Downing, An-Chi Tsou, Kyle Kurpinski, Aijun Wang, and Erick Ulin-
Avila. I also want to thank Joanne Lo for being there for me during my latter years, especially in
terms of her help and input in the crucial hours right before abstract and manuscript deadlines.
Much of my work would not exist without the support and contributions of researchers who I
have advised during my graduate career. I especially want to thank Barthélémy Lüthi, Benjamin
Casavant, Eric Zhou, Liana Lo, Ryan Ruelos, Albert Lu, Valerie Chang, Dara Bahri, Jonathan
Lei, Marc Russel, Chris Luong, Deepak Lingam, Anushweta Asthana, Sheng-Chih (Ken) Chang,
Parminder Singh, Annie Chou, and Nina Khoshnevisrad.
Being a part of the Berkeley Sensor and Actuator Center (BSAC) has been fantastic, and a large
part of that is due to my interactions with Helen Kim, John Huggins, Richard Lossing, Kim Ly,
Yulia Golubovskaya, and Alain Kesseru. I also want to thank the mechanical engineering
department‟s staff, including Donna Craig, Patricia Giddings, and Yawo Akpawu.
Outside of school, having family and friends that I can rely on has meant a lot to me. Having
intellectual discussions and debates with my brother and sister, Jason and Jessica, has supported
my ability to construct cogent arguments and think more critically. My uncle, Jeremy Sochol,
always keeps me on my toes, especially with his „sat question of the day‟ emails. It‟s always
enjoyable receiving funny cards from my grandma, Sonia Feinberg, as well as discussing life
during phone calls and visits. Spending downtime with my family has made work far less
stressful, especially when Stacey, Mike, Blake, Lucie, and Payton join. It has really been
amazing getting to be so close to my „California cousins,‟ Sharon, Laura, Robert, Yo, Samantha,
Zoe, Alex, and Cole, who have made living in the bay area such a great experience. I realize that
graduate school is not supposed to be so much fun, but spending time with my friends has made
these past few years some of the best of my life. Kevin Salimian, Daniel Peters, Chris Zeuger,
Doron Klepach, George Mseis, Andrew Stevens, Deborah Sunter, Diana Lin, Maral Gharib,
Kimberly Ann Krauze, Clare Gollnick, Grace Yoon, Ali Streimer, Jonathan Roth, Joshua
Schmerling, Joanna Millman, Joshua Gerstenblith, Casey Spigel, Ann Evans, Anders Solem,
Rocky Jones, Anthony Giangiorgi, and Daniel Alarcon – it‟s been a pleasure.
Lastly, I want to thank Eddie Murphy, Rick James, and Sharam for their renditions of P.A.T.T.,
which have provided me with much needed inspiration during multiple all-nighters in lab.

iv
Table of Contents
Chapter 1: Introduction
1.1 Dissertation Introduction ......................................................................................................... 1
1.2 Dissertation Outline ................................................................................................................. 3
Chapter 2: Micropost Array Gradients for Cell Handling
2.1 Introduction .............................................................................................................................. 4
2.1.1 Microenvironmental Cellular Stimuli ........................................................................... 4
2.1.2 Biophysical Cellular Stimuli ......................................................................................... 4
2.1.3 Substrate-Based Mechanical Stimuli ............................................................................ 5
2.1.4 Substrate-Based Microtopographic Stimuli .................................................................. 5
2.1.5 Micropost Arrays for Cellular Applications ................................................................. 5
2.2 Design of Micropost Array Gradients for Cell Handling ........................................................ 7
2.2.1 Microtopographic Durotaxis Gradients (µDGs) ........................................................... 7
2.2.2 Microtopographic Dual-Axis Durotaxis Gradients (µDDGs) ...................................... 8
2.2.3 Microtopographic Spatiotaxis Gradients (µSGs) ........................................................ 10
2.2.4 Microtopographic Durotaxis versus Spatiotaxis Gradients (µDSGs) ......................... 12
2.3 Materials and Methods ........................................................................................................... 13
2.3.1 Micropost Array Gradient Fabrication and Preparation ............................................. 13
2.3.2 Bovine Aortic Endothelial Cell (BAEC) Passaging for Migration Studies ................ 14
2.3.3 Methods for Observing Cell Migration on µDG and µDSG Substrates ..................... 15
2.3.4 Methods for Observing Cell Migration on µDDG and µSG Substrates ..................... 16
2.3.5 Data Acquisition and Analysis for Cell Migration Studies ........................................ 17
2.4 Results and Discussion .......................................................................................................... 18
2.4.1 Cell Motility on µDGs ................................................................................................ 18
2.4.2 Cell Motility on µDDGs ............................................................................................. 20
2.4.3 Cell Motility on µSGs ................................................................................................. 27
2.4.4 Cell Motility on the µDSGs ........................................................................................ 32
v
Chapter 3: Arrayed Microposts for Microparticle Handling in Microfluidic Systems
3.1 Introduction ............................................................................................................................ 35
3.1.1 Particulate-Handling in Microfluidic Systems............................................................ 35
3.1.2 Arraying Microparticles via Hydrodynamic Techniques ........................................... 35
3.1.3 Multi-Stage Fluidic Reactions and Analyses in Particulate-Based Microarrays ........ 36
3.1.4 Releasing Arrayed Microparticles in Microfluidic Systems ....................................... 36
3.1.5 Cell Handling versus Microbead Handling in Dynamic Microarrays ........................ 37
3.2 Design of Microfluidic Systems for Microparticle Handling ................................................ 38
3.2.1 Resettable Micropost Array Trapping (µPAT) ........................................................... 38
3.2.2 A Dynamic Microarray with µPAT for Parallel DNA Detection ............................... 39
3.2.3 „Microfluidic Ping Pong‟ (MPP) for Multi-Stage Fluidic Reactions Under
Discontinuous Flow Conditions ............................................................................................ 41
3.2.4 Micropost Array Railing (µPAR) for Multi-Stage Fluidic Reactions Under
Continuous Flow Conditions ................................................................................................ 43
3.3 Materials and Methods ........................................................................................................... 47
3.3.1 Microfabrication ......................................................................................................... 47
3.3.2 Fluid Velocity Field and Pressure Field Simulations for Resettable µPAT ............... 49
3.3.3 Experimental Reagents ............................................................................................... 49
3.3.4 Microbead Functionalization for the Parallel DNA Detection Assay ........................ 50
3.3.5 Cell Suspension Preparation ....................................................................................... 50
3.3.6 Experimental Setup ..................................................................................................... 50
3.3.7 Data Acquisition ......................................................................................................... 51
3.3.8 Quantification of Experimental Results ...................................................................... 52
3.3.9 Statistical Analysis ...................................................................................................... 55
3.4 Results and Discussion .......................................................................................................... 56
3.4.1 Resettable µPAT for Particulate Handling ................................................................. 56
3.4.2 Parallel DNA Detection via a Dynamic Bead-Based Microarray with µPAT ........... 61
3.4.3 MPP for Bead-Based Cytokine Detection .................................................................. 63
3.4.4 µPAR for Continuous Flow Particulate Handling ...................................................... 64
vi
Chapter 4: Conclusions
4.1 Micropost Array Gradients for Cell Handling ....................................................................... 69
4.1.1 Micropost Array Gradients for Inducing Cellular Durotaxis ...................................... 69
4.1.2 Micropost Array Gradients for Inducing Cellular Spatiotaxis .................................... 69
4.1.3 Micropost Array Gradients to Examine Cellular Durotaxis versus Spatiotaxis ......... 70
4.1.4 Future Directions for Micropost Array Gradients ...................................................... 70
4.2 Micropost Array-Based Microfluidic Platforms for Microparticle Handling........................ 71
4.2.1 Trapping-and-Releasing Microbeads and Cells via Resettable µPAT ....................... 71
4.2.2 Continuous Flow Railing of Microbeads and Cells via µPAR ................................... 71
4.2.3 Microbead-Based Applications for the Microfluidic Platforms ................................. 72
4.2.4 Future Directions for the Microfluidic Platforms for Microparticle Handling ........... 73
References .................................................................................................................................... 75
vii
List of Figures
Chapter 1
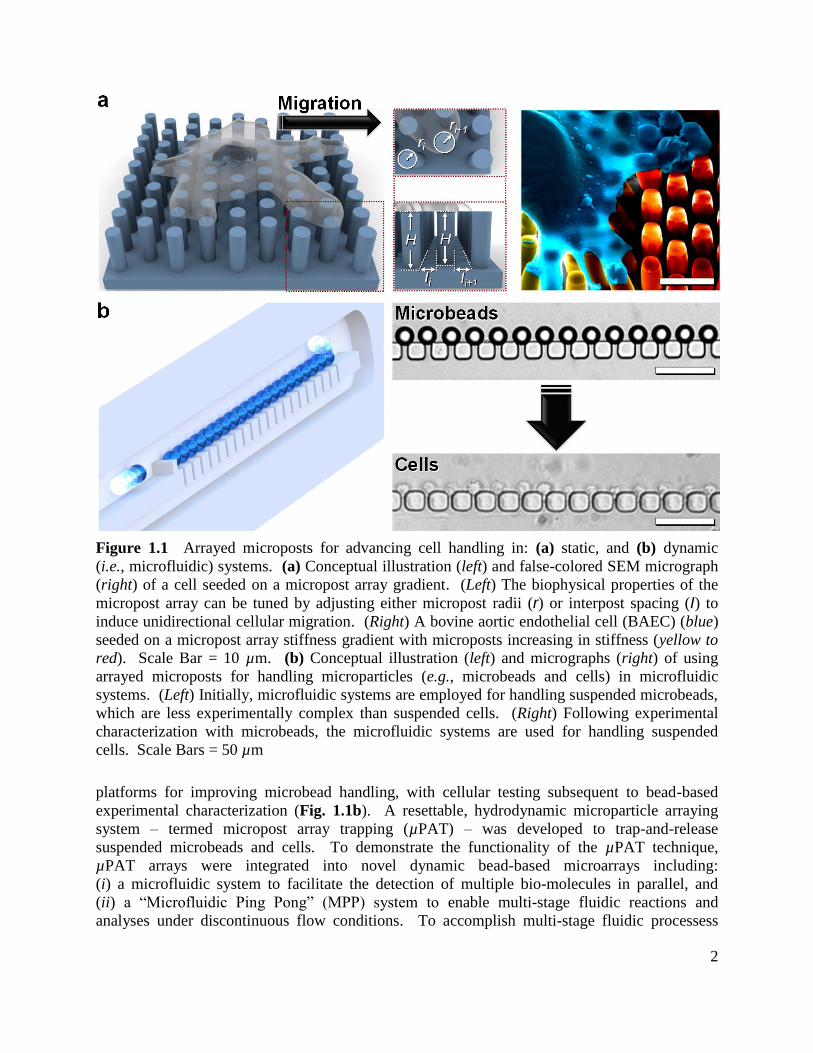
Figure 1.1 Arrayed microposts for advancing cell handling in: (a) static, and (b) dynamic
(i.e., microfluidic) systems.............................................................................................................. 1
Chapter 2
Figure 2.1 Conceptual illustrations of micropost arrays employed for the application of
quantifying cellular traction forces on the substrate ....................................................................... 6
Figure 2.2 Microtopographic Durotaxis Gradient (µDG) design ................................................. 7
Figure 2.3 Microtopographic Dual-Axis Durotaxis Gradient (µDDG) design ............................. 9
Figure 2.4 Microtopographic Spatiotaxis Gradient (µSG) design .............................................. 11
Figure 2.5 Microtopographic Durotaxis versus Spatiotaxis Gradient (µDSG) design. .............. 12
Figure 2.6 Conceptual illustrations of the micropost array gradient fabrication process ........... 14
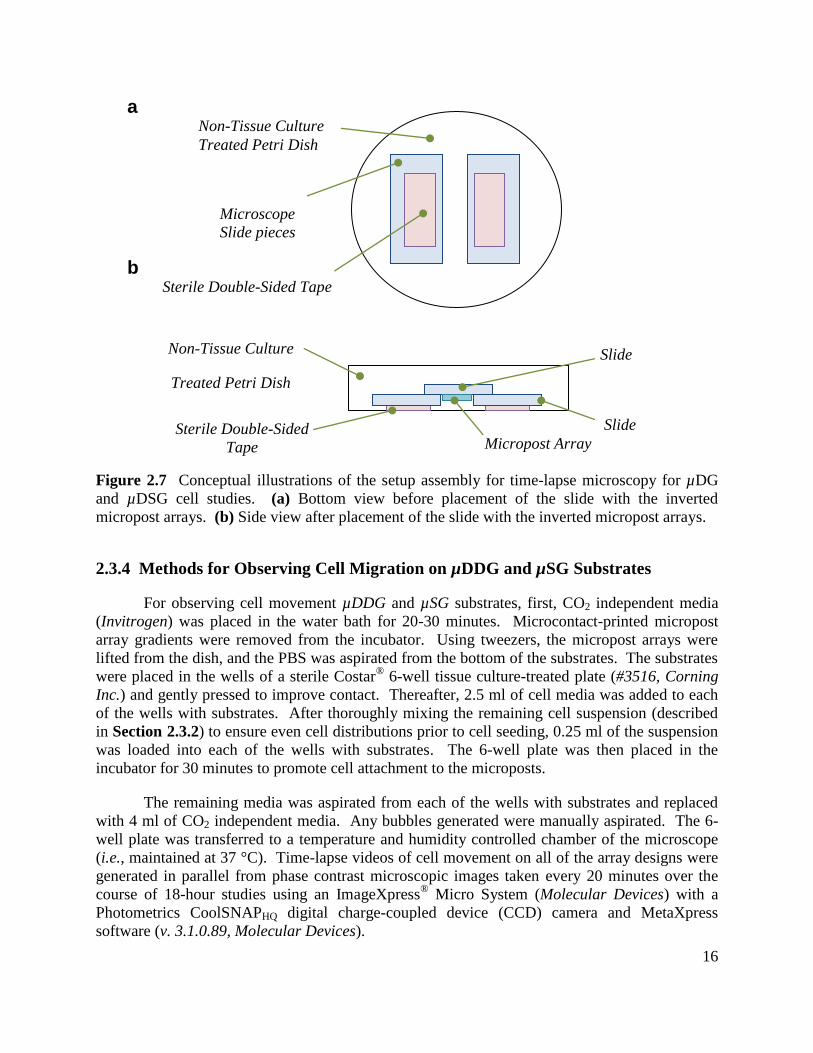
Figure 2.7 Conceptual illustrations of the setup assembly for time-lapse microscopy for µDG
and µDSG cell studies ................................................................................................................... 16
Figure 2.8 Experimental results for BAEC migration on the µDGs over the course of 18-hour
studies ........................................................................................................................................... 19
Figure 2.9 Experimental results for average BAEC velocities versus the direction BAEC
movement on the µDGL (white) and µDGH (dark grey) for 18-hour studies................................ 20
Figure 2.10 Sequential time-lapse images of BAECs (arrow heads) migrating on: (a) a negative
control substrate with identical circular posts (CC), (b) a bidirectional control substrate with
identical elliptical microposts (CE), and microtopographic dual-axis durotaxis gradients with
(c) low gradient strength (µDDGL), and (d) high gradient strength (µDDGH) ............................. 22
Figure 2.11 Migration paths over the course of 18-hour studies for BAECs seeded on the:
(a) CC, (b) CE, (c) µDDGL, and (d) µDDGH ................................................................................. 23
Figure 2.12 Experimental results of directional BAEC migration on the µDDGs and control
substrates for 18-hour studies ....................................................................................................... 24
Figure 2.13 Experimental results for BAEC motility on the µDDGs and control substrates for
18-hour studies .............................................................................................................................. 25
Figure 2.14 Sequential time-lapse images of BAECs (arrow heads) migrating on: (a) a control
substrate with identical interpost spacing (C), and microtopographic spatiotaxis gradients with
(b) low gradient strength (µSGL), and (c) high gradient strength (µSGH) .................................... 28
viii
Figure 2.15 Experimental results for BAEC migration on the µSGs and control substrate for
18-hour studies .............................................................................................................................. 29
Figure 2.16 Experimental results for BAEC motility on the µDDGs and control substrates for
18-hour studies .............................................................................................................................. 30
Figure 2.17 Experimental results of BAEC migration on the µDSG for 18-hour studies .......... 33
Chapter 3
Figure 3.1 Conceptual illustrations of the resettable micropost array trapping (µPAT) process.
....................................................................................................................................................... 38
Figure 3.2 Conceptual illustrations of the dynamic particulate-based microarray for parallel
DNA detection .............................................................................................................................. 40
Figure 3.3 Conceptual illustrations of the Microfluidic Ping Pong (MPP) process ................... 41
Figure 3.4 Conceptual illustrations of the aptamer beacon-based sandwich assay process for
cytokine detection via MPP .......................................................................................................... 42
Figure 3.5 Conceptual illustrations of the Micropost Array Railing (µPAR) process ................ 44
Figure 3.6 Conceptual illustrations of the µPAR system for continuous flow layer-by-layer
(LbL) microbead functionalization of extended biotin-avidin-based biological linkers .............. 45
Figure 3.7 Conceptual illustrations of the microdevice fabrication process ............................... 47
Figure 3.8 SEM micrographs of a resettable µPAT system with WT = 35 μm and WR = 20 μm 48
Figure 3.9 Fabrication results for the MPP devices. ................................................................... 48
Figure 3.10 Fabrication results for the multiplexed µPAR device ............................................. 49
Figure 3.11 Examples for trapping efficiency (TE), loading efficiency (LE), and resetting
efficiency (RE) quantification ....................................................................................................... 53
Figure 3.12 Three-dimensional COMSOL simulations of the resettable µPAT system for the
trapping mode (a-f) and resetting mode (g-l) ............................................................................... 57
Figure 3.13 Trapping mode experimental results for microbeads in the resettable µPAT system
....................................................................................................................................................... 58
Figure 3.14 Resetting mode experimental results for microbeads in the resettable µPAT system
....................................................................................................................................................... 59
Figure 3.15 Experimental results for (a-c) trapping and (d, e) releasing BAECs in the resettable
µPAT system ................................................................................................................................. 61
Figure 3.16 Experimental results for microbead fluorescence ................................................... 62
Figure 3.17 Biological linker optimization experimental results for the relative IFN-γ
fluorescence intensity.................................................................................................................... 63

ix
Figure 3.18 Experimental results for IFN-γ detection via an aptamer-based sandwich assay in
the MPP System ............................................................................................................................ 64
Figure 3.19 Experimental results for µPAR systems with varying α ......................................... 65
Figure 3.20 Experimental results for µPAR ............................................................................... 66
Figure 3.21 Experimental results for microbead fluorescence corresponding to microbeads with
varying extended biological linker lengths ................................................................................... 67
Figure 3.22 Experimental results for railing cells via µPAR ...................................................... 68

x
List of Tables
Chapter 3
Table 3.1 Names and sequences of the molecular beacon probe (MB) and DNA oligonucleotide
sequences based on the Hepatitis C viral (HCV) genome.110
....................................................... 40
Table 3.2 Names and Sequences (5‟-3‟ orientation) for the Aptamer Beacon.104
...................... 43

xi
List of Acronyms
BAEC Bovine Aortic Endothelial Cell
BHQ Black Hole Quencher
BSA Bovine Serum Albumin
C Negative Control Substrate with Identical Interpost Spacing and Identical Circular
Microposts for Spatiotaxis Experiments
CC Negative Control Substrate with Identical Circular Microposts for Dual-Axis
Durotaxis Experiments
CCD Charge-Coupled Device
CE Bidirectional Control Substrate with Identical Elliptical Microposts for Dual-Axis
Durotaxis Experiments
DI Deionized
DMEM Dulbecco's Modified Eagle Medium
DNA Deoxyribonucleic Acid
ECM Extracellular Matrix
FA Fluorescent Aptamer
FAM Fluorescein
FBS Fetal Bovine Serum
FRET Förster Resonance Energy Transfer
HCV Hepatitis C Virus
IFN-γ Interferon-Gamma
kmajor Major Axes Linear Stiffness of Elliptical Microposts
kminor Minor Axes Linear Stiffness of Elliptical Microposts
LbL Layer-by-Layer
LE Loading Efficiency
MB Molecular Beacon Probe
MM Mismatch
MPP Microfluidic Ping Pong
PBS Phosphate-Buffered Saline
PDMS Poly(dimethylsiloxane)
PM Perfect Match
xii
Q Quencher
RE Resetting Efficiency
RFI Relative Fluorescent Intensity
RFR Railing Failure Rate
S.E.M. Standard Error of the Mean
SEM Scanning Electron Microscope
SNP Single Nucleotide Polymorphism (One Mismatch)
ssDNA Single-Stranded Deoxyribonucleic Acid
TE Trapping Efficiency
WR Resetting Width for Micropost Array Trapping
WT Trapping Width for Micropost Array Trapping
µDDGH Microtopographic Dual-Axis Durotaxis Gradient with High Gradient Strength
µDDGL Microtopographic Dual-Axis Durotaxis Gradient with Low Gradient Strength
µDGH Microtopographic Durotaxis Gradient with High Gradient Strength
µDGL Microtopographic Durotaxis Gradient with Low Gradient Strength
µDSG Microtopographic Durotaxis versus Spatiotaxis Gradient
µPAR Micropost Array Railing
µPAT Micropost Array Trapping
µSGH Microtopographic Spatiotaxis Gradient with High Gradient Strength
µSGL Microtopographic Spatiotaxis Gradient with Low Gradient Strength
%ECM Percentage of Extracellular Matrix Coverage
1
Chapter 1: Introduction
1.1 Dissertation Introduction
The advancement of cell handling capabilities in static and dynamic (i.e., microfluidic)
environments directly impacts fields including tissue engineering, biomaterials, regenerative
medicine, quantitative cell biology, and medical diagnostics.1-3
Ideally, techniques for cell
handling under static conditions (i.e., in the absence of external regulation or power) would
enable high control of cell motility via simple, accurate, and repeatable fabrication processes.
Unfortunately, simultaneously achieving these goals has remained a significant challenge.4-11
Previously, a broad range of microenvironmental stimuli have been employed to regulate cellular
behavior, including motility.12-24
Passive, substrate-based biophysical stimuli could offer
powerful means for cell handling in vitro; however, current methods suffer from drawbacks
ranging from poor control of cell motility to limited fabrication processes.4-11, 25-29
For cell
handling in microfluidic systems (e.g., dynamic microarrays), researchers have developed a
variety of methods for: (i) immobilizing cells in designated array positions, (ii) mixing cells with
multiple fluidic reagents, and (iii) releasing cells from microfluidic arrays.30-43
The efficacy of
techniques for trapping-and-releasing cells could be further extended by increasing trapping
efficiencies and densities, simplifying processes associated with device fabrication and
operation, and improving resetting efficiencies. Additionally, limitations associated with
accomplishing multi-stage fluidic reactions in such systems have hindered the applicability of
dynamic cell-based microarrays.
This dissertation reports efforts to develop new methodologies for advancing cell
handling in both static and dynamic environments via the use of arrayed microposts. The
technique of using micropost array gradients to apply biophysical stimuli to seeded cells is
presented for enabling cell handling under static conditions (Fig. 1.1a). By altering the
geometric characteristics of micropost arrays, such as micropost radii (Fig. 1.1a – left, „r‟) and
interpost spacing (Fig. 1.1a – left, „I‟), the biophysical properties of discrete, microscale substrate
features can be tuned via simple, accurate, and repeatable fabrication processes. Micropost array
gradients were designed, fabricated, and experimentally demonstrated to accomplish
unidirectional cellular guidance using microtopographic mechanical (i.e., durotaxis) and spatial
(i.e., spatiotaxis) stimuli. Experiments were performed with living cells seeded on several
classes of micropost array gradients (Fig. 1.1a – right). The motility of bovine aortic endothelial
cells (BAECs) was quantified by tracking the movement of single cells over the course of
18-hour time-lapse studies. The experimental results represent the first demonstration of
unidirectional cellular durotaxis induced via microtopographic stiffness cues. Additionally, the
ability to achieve unidirectional cellular guidance by varying the spacing of substrate binding
sites (i.e., spatiotaxis) has been demonstrated for the first time.
To advance cell handling in microfluidic systems, several microfluidic platforms
integrating arrayed microposts are presented. Compared to microbeads, living cells are
characterized by a significantly higher degree of complexity. Thus, successfully manipulating
microbeads in microfluidic systems is a critical first step toward robust microfluidic cell
handling. Consequently, this dissertation focuses primarily on the development of microfluidic
2
Figure 1.1 Arrayed microposts for advancing cell handling in: (a) static, and (b) dynamic
(i.e., microfluidic) systems. (a) Conceptual illustration (left) and false-colored SEM micrograph
(right) of a cell seeded on a micropost array gradient. (Left) The biophysical properties of the
micropost array can be tuned by adjusting either micropost radii (r) or interpost spacing (I) to
induce unidirectional cellular migration. (Right) A bovine aortic endothelial cell (BAEC) (blue)
seeded on a micropost array stiffness gradient with microposts increasing in stiffness (yellow to
red). Scale Bar = 10 µm. (b) Conceptual illustration (left) and micrographs (right) of using
arrayed microposts for handling microparticles (e.g., microbeads and cells) in microfluidic
systems. (Left) Initially, microfluidic systems are employed for handling suspended microbeads,
which are less experimentally complex than suspended cells. (Right) Following experimental
characterization with microbeads, the microfluidic systems are used for handling suspended
cells. Scale Bars = 50 µm
platforms for improving microbead handling, with cellular testing subsequent to bead-based
experimental characterization (Fig. 1.1b). A resettable, hydrodynamic microparticle arraying
system – termed micropost array trapping (µPAT) – was developed to trap-and-release
suspended microbeads and cells. To demonstrate the functionality of the µPAT technique,
µPAT arrays were integrated into novel dynamic bead-based microarrays including:
(i) a microfluidic system to facilitate the detection of multiple bio-molecules in parallel, and
(ii) a “Microfluidic Ping Pong” (MPP) system to enable multi-stage fluidic reactions and
analyses under discontinuous flow conditions. To accomplish multi-stage fluidic processess
3
under continuous flow conditions, a micropost array railing (µPAR) system was developed for
rapidly transporting both microbeads and cells into adjacent flow streams. A multiplexed
layer-by-layer (LbL) molecular synthesis process was demonstrated on microbead substrates to
illustrate the robustness of the µPAR technique.
1.2 Dissertation Outline
In Chapter 2, the methodology of engineering micropost array gradients to induce
unidirectional cellular migration via substrate-based biophysical stimuli is presented.
An overview of prior efforts for investigating and regulating cellular processes using
microenvironmental stimuli is offered, as well as prior uses of micropost arrays for cellular
applications. The design and fabrication of four different classes of micropost array gradients
are discussed, corresponding to: (i) Microtopographic Durotaxis Gradients (µDGs),
(ii) Microtopographic Dual-Axis Durotaxis Gradients (µDDGs), (iii) Microtopographic
Spatiotaxis Gradients (µSGs), and (iv) a Microtopographic Durotaxis versus Spatiotaxis Gradient
(µDSG). The experimental methods for observing and quantifying cell movement on each of the
substrates are detailed. Results for cell motility are presented and discussed. In particular, the
experimental results revealed that: (i) µDGs promoted cell migration in the direction of
increasing micropost stiffness, (ii) µDDGs promoted migration in the direction of increasing
micropost stiffness, while also limiting movement perpendicular to that direction, (iii) µSGs
promoted migration in the direction of decreasing interpost spacing, and (iv) the spatial cues of
the µDSG dominated the mechanical stimuli.
In Chapter 3, several techniques that incorporate arrayed microposts into microfluidic
systems to improve microparticle handling are presented. An overview of prior efforts for
handling cells and microbeads in microfluidic systems is offered. The design and fabrication of
two novel microfluidic particulate-based platforms – the resettable micropost array trapping
(µPAT) system and the micropost array railing (µPAR) system – are discussed. Examples of
two additional bead-based systems incorporating the µPAT technique are presented.
The methods associated with the experimental procedures, data acquisition, and quantitative
analyses are detailed. Results for microparticle handling are presented and discussed for each
platform, with a primary focus on bead-based experiments preceding cell-based experiments.
Conclusions for the dissertation are discussed in Chapter 4. The efficacy of the
presented micropost array-based methodologies for advancing cell handling in static and
dynamic environments is summarized. Future directions and applications for the presented
technologies are discussed.
4
Chapter 2: Micropost Array Gradients for Cell Handling
2.1 Introduction
2.1.1 Microenvironmental Cellular Stimuli
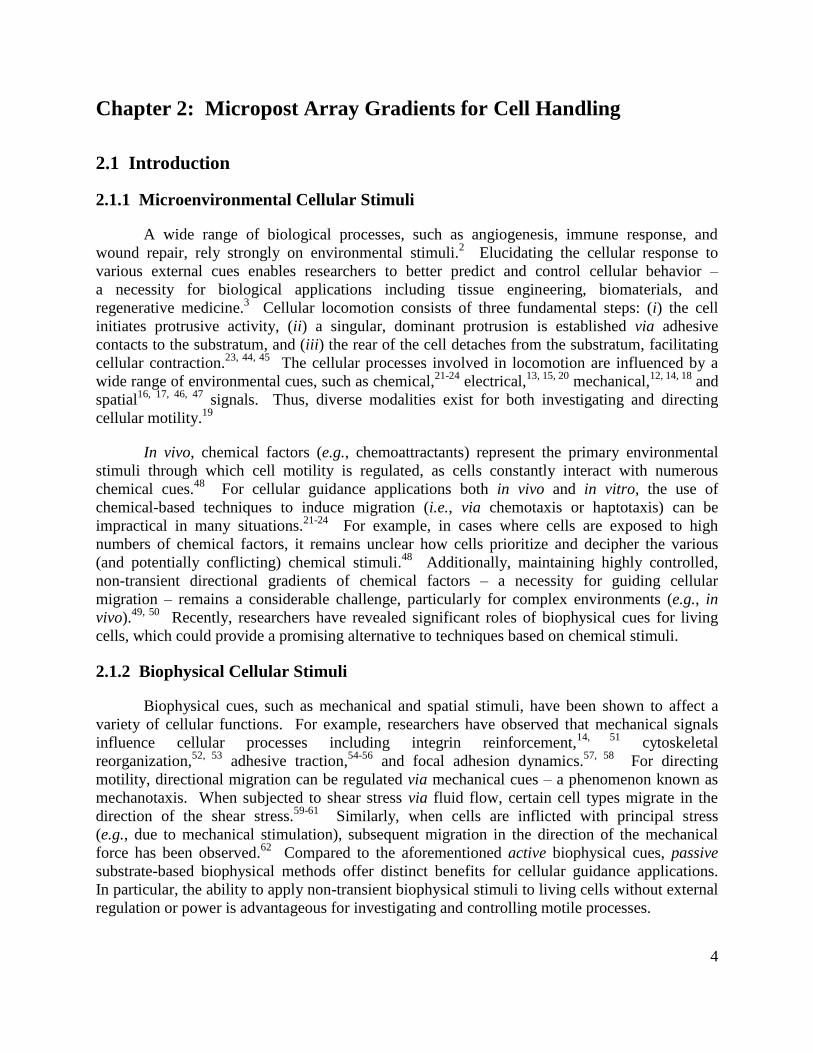
A wide range of biological processes, such as angiogenesis, immune response, and
wound repair, rely strongly on environmental stimuli.2 Elucidating the cellular response to
various external cues enables researchers to better predict and control cellular behavior –
a necessity for biological applications including tissue engineering, biomaterials, and
regenerative medicine.3 Cellular locomotion consists of three fundamental steps: (i) the cell
initiates protrusive activity, (ii) a singular, dominant protrusion is established via adhesive
contacts to the substratum, and (iii) the rear of the cell detaches from the substratum, facilitating
cellular contraction.23, 44, 45
The cellular processes involved in locomotion are influenced by a
wide range of environmental cues, such as chemical,21-24
electrical,13, 15, 20
mechanical,12, 14, 18
and
spatial16, 17, 46, 47
signals. Thus, diverse modalities exist for both investigating and directing
cellular motility.19
In vivo, chemical factors (e.g., chemoattractants) represent the primary environmental
stimuli through which cell motility is regulated, as cells constantly interact with numerous
chemical cues.48
For cellular guidance applications both in vivo and in vitro, the use of
chemical-based techniques to induce migration (i.e., via chemotaxis or haptotaxis) can be
impractical in many situations.21-24
For example, in cases where cells are exposed to high
numbers of chemical factors, it remains unclear how cells prioritize and decipher the various
(and potentially conflicting) chemical stimuli.48
Additionally, maintaining highly controlled,
non-transient directional gradients of chemical factors – a necessity for guiding cellular
migration – remains a considerable challenge, particularly for complex environments (e.g., in
vivo).49, 50
Recently, researchers have revealed significant roles of biophysical cues for living
cells, which could provide a promising alternative to techniques based on chemical stimuli.
2.1.2 Biophysical Cellular Stimuli
Biophysical cues, such as mechanical and spatial stimuli, have been shown to affect a
variety of cellular functions. For example, researchers have observed that mechanical signals
influence cellular processes including integrin reinforcement,14, 51
cytoskeletal
reorganization,52, 53
adhesive traction,54-56
and focal adhesion dynamics.57, 58
For directing
motility, directional migration can be regulated via mechanical cues – a phenomenon known as
mechanotaxis. When subjected to shear stress via fluid flow, certain cell types migrate in the
direction of the shear stress.59-61
Similarly, when cells are inflicted with principal stress
(e.g., due to mechanical stimulation), subsequent migration in the direction of the mechanical
force has been observed.62
Compared to the aforementioned active biophysical cues, passive
substrate-based biophysical methods offer distinct benefits for cellular guidance applications.
In particular, the ability to apply non-transient biophysical stimuli to living cells without external
regulation or power is advantageous for investigating and controlling motile processes.
5
2.1.3 Substrate-Based Mechanical Stimuli
In prior reports, researchers have shown that substrate-based mechanical stimuli
influence diverse cellular processes, such as focal adhesion development63
and stem cell lineage
specification.64, 65
Cellular migration guided by the rigidity of the substrate – a phenomenon
known as durotaxis49
– has been observed on a variety of substrates with stiffness gradients.4, 6, 11
In order to study the cellular response to substrates of varying rigidity, researchers have
employed hydrogel photopolymerization-based methods to fabricate substrates with either a low
number4-6
or high number7-11
of substrate stiffnesses. Substrates with a low number of substrate
stiffnesses are intrinsically limited because the stiffness steps are much larger than the size of a
single cell and often include only two prominent stiffnesses.4-6
In contrast, continuous rigidity
gradients with high numbers of substrate stiffnesses offer superior control for directing cellular
movement; however, the current methods used to fabricate continuous rigidity gradients suffer
from a wide range of disadvantages, including complicated microfabrication processes, poor
control over the placement and magnitude of substrate stiffness, and low repeatability.7-11
2.1.4 Substrate-Based Microtopographic Stimuli
Methods for engineering substrates with microtopography (e.g., microgrooves or
microposts) facilitate simple microfabrication, accurate feature definition, and high
repeatability.66-69
Previously, researchers have investigated the effects of microtopography on
cellular migration.25-29
On substrates with microgrooves (alternatively referred to as
microridges), cells have been observed to migrate bidirectionally, parallel to the
microgrooves.27, 69
Unfortunately, the ability to induce unidirectional migration on
microtopographic substrates has previously required varying the surface density of topographic
features coated with extracellular matrix (ECM) proteins.70, 71
Thus, achieving unidirectional
cellular guidance using microtopographic substrates (i.e., independent of collaborative chemical
stimuli) has remained a significant challenge.
2.1.5 Micropost Arrays for Cellular Applications
Micropost arrays present a powerful topographic technology for cellular applications by
enabling researchers to achieve high control over micropost positioning and geometry via
simple, accurate, and repeatable microfabrication processes. Historically, researchers have
exploited these advantages primarily for the application of quantifying cellular traction forces on
the substrate.68, 72-74
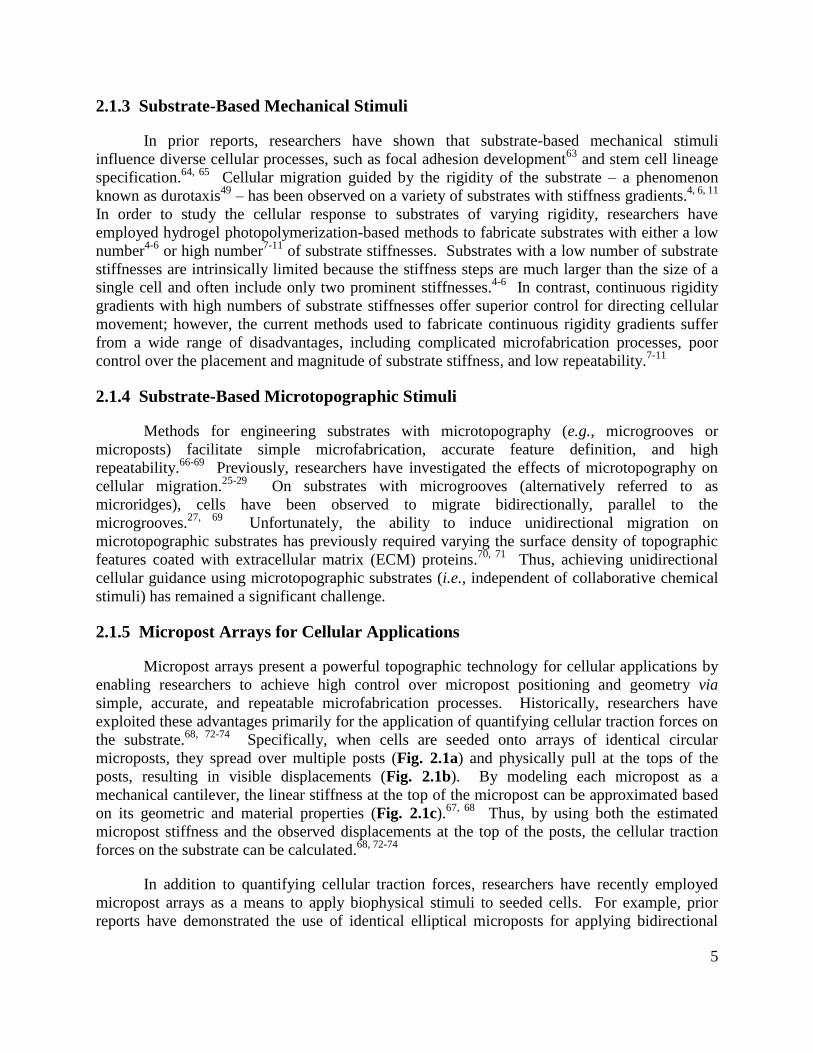
Specifically, when cells are seeded onto arrays of identical circular
microposts, they spread over multiple posts (Fig. 2.1a) and physically pull at the tops of the
posts, resulting in visible displacements (Fig. 2.1b). By modeling each micropost as a
mechanical cantilever, the linear stiffness at the top of the micropost can be approximated based
on its geometric and material properties (Fig. 2.1c).67, 68
Thus, by using both the estimated
micropost stiffness and the observed displacements at the top of the posts, the cellular traction
forces on the substrate can be calculated.68, 72-74
In addition to quantifying cellular traction forces, researchers have recently employed
micropost arrays as a means to apply biophysical stimuli to seeded cells. For example, prior
reports have demonstrated the use of identical elliptical microposts for applying bidirectional
6
substrate stiffness cues to cells, because the micropost stiffness parallel to the major axes is
inherently larger than the stiffness parallel to the minor axes.66, 75
Experimental results revealed
bidirectional migration along the stiffer axis, consistent with a priori durotaxis predictions.
However, it should be noted that the arrays were designed with closer spacing between
microposts along the major axes (relative to the perpendicular spacing between posts along the
minor axes), and thus, it is possible that this variable spacing may have contributed to the
observed migratory behavior.66, 75
Using micropost arrays with different heights (and therefore,
different micropost stiffnesses), researchers have also shown that micropost stiffness can be a
determinant factor for stem cell fate decisions.65
Figure 2.1 Conceptual illustrations of micropost arrays employed for the application of
quantifying cellular traction forces on the substrate. (a) A cell spreads over multiple, identical
circular microposts, attaching to the top surface of the posts. (b) The cell then physically pulls at
the tops of the microposts, resulting in visible displacements (as shown in the expanded view).
(c) By modeling the micropost as a mechanical cantilever, the linear stiffness at the top of the
micropost is derived from its geometric and material properties, including the Young‟s
Modulus (E), shear modulus (G), shear coefficient (κ), micropost height (H), and micropost
radius (r). A force applied at the top of the micropost (F), parallel to the substrate, results in a
displacement at the top of the micropost (δ).
7
2.2 Design of Micropost Array Gradients for Cell Handling
Micropost arrays present a unique and powerful tool for independently engineering the
stiffness of the substrate and the spacing of substrate binding sites – two physical cues that
influence cellular attachment and membrane extension, respectively. Here, the technique of
using micromachining processes to fabricate micropost array gradients is proposed to apply these
substrate-based biophysical stimuli to seeded cells. Micropost array gradients with varying
stiffness and interpost spacing were designed to achieve unidirectional cellular guidance via
micropost stiffness cues (i.e., durotaxis) and microtopographic spatial cues (a phenomenon
herein referred to as spatiotaxis), respectively. Four classes of micropost array gradients were
designed: (i) Microtopographic Durotaxis Gradients (µDGs), (ii) Microtopographic Dual-Axis
Durotaxis Gradients (µDDGs), (iii) Microtopographic Spatiotaxis Gradients (µSGs), and (iv) a
Microtopographic Durotaxis versus Spatiotaxis Gradient (µDSG).
2.2.1 Microtopographic Durotaxis Gradients (µDGs)
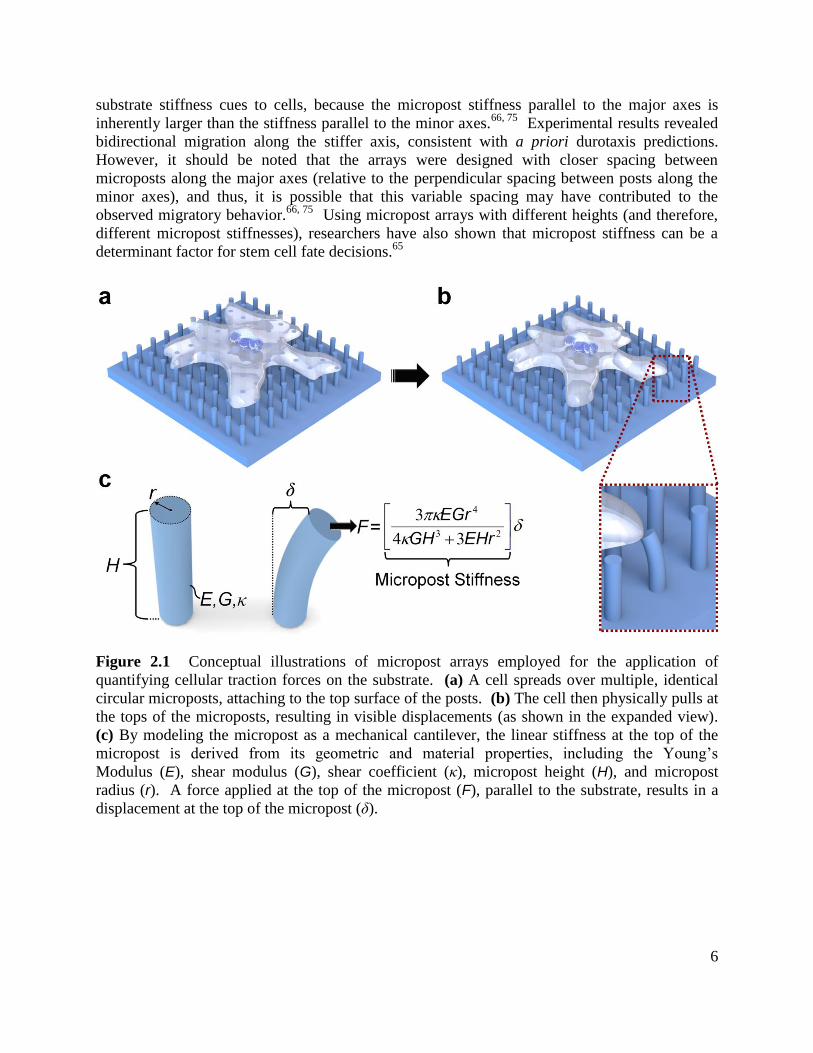
Figure 2.2a illustrates the µDG concept. In contrast to prior reports of microposts with
uniform radii67, 68
or identical shapes,66, 75
here, the radii of arrayed microposts (Fig. 2.2a – „r‟)
were increased in a single, designed direction. A constant interpost spacing (Fig. 2.2a – „I‟) of
2 µm was designed along the axis of increasing micropost radii. The stiffness of a micropost can
be geometrically tuned by adjusting either the height or radius of the micropost.68, 72-74
For fabricating gradients of micropost stiffness, modulating micropost radii while maintaining a
uniform structural height over the length of the substrate facilitates simple fabrication via one- a
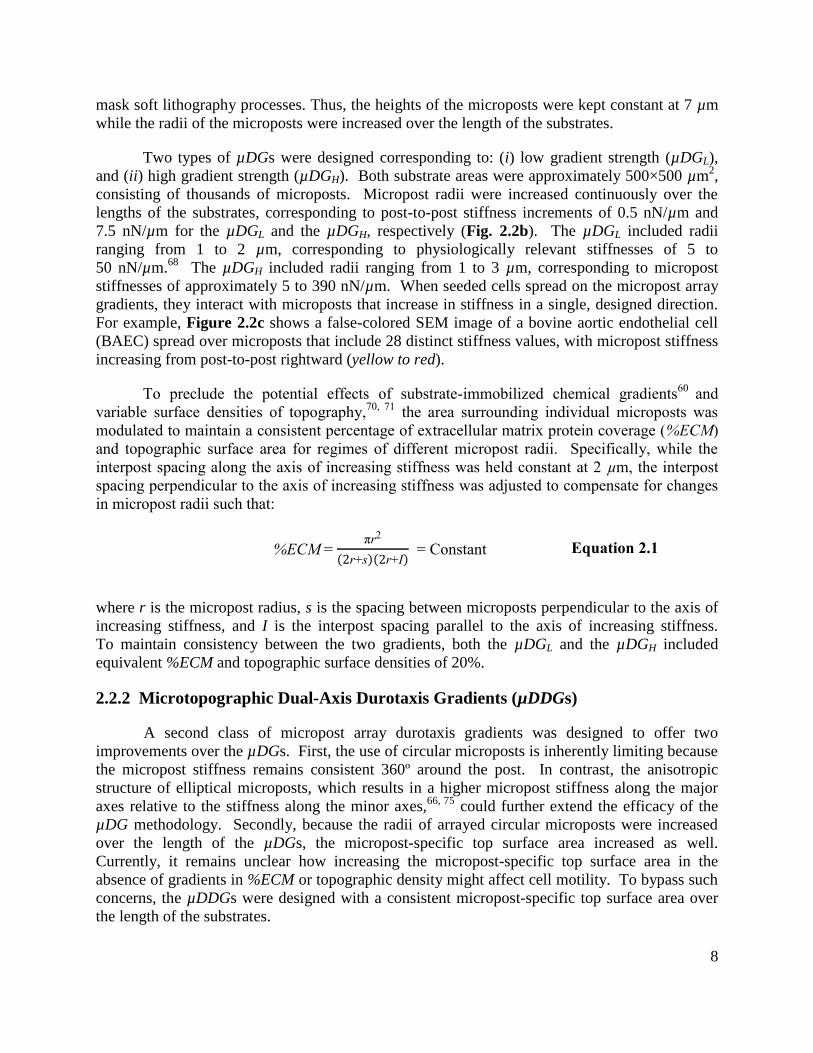
Figure 2.2 Microtopographic Durotaxis Gradient (µDG) design. (a) Conceptual illustration of a
cell seeded on a microtopographic stiffness gradient with an enlarged view of individual
microposts with increasing radii (r) and equivalent interpost spacing (I). (b) Micropost stiffness
over the length of the micropost array durotaxis gradient with low gradient strength (µDGL;
white diamonds) and high gradient strength (µDGH; dark grey squares). (c) False-colored SEM
micrograph of a bovine aortic endothelial cell (BAEC) (blue) seeded on a micropost array
stiffness gradient with microposts increasing in stiffness (yellow to red). Scale Bar = 10 µm
8
mask soft lithography processes. Thus, the heights of the microposts were kept constant at 7 µm
while the radii of the microposts were increased over the length of the substrates.
Two types of µDGs were designed corresponding to: (i) low gradient strength (µDGL),
and (ii) high gradient strength (µDGH). Both substrate areas were approximately 500×500 µm2,
consisting of thousands of microposts. Micropost radii were increased continuously over the
lengths of the substrates, corresponding to post-to-post stiffness increments of 0.5 nN/µm and
7.5 nN/µm for the µDGL and the µDGH, respectively (Fig. 2.2b). The µDGL included radii
ranging from 1 to 2 µm, corresponding to physiologically relevant stiffnesses of 5 to
50 nN/µm.68
The µDGH included radii ranging from 1 to 3 µm, corresponding to micropost
stiffnesses of approximately 5 to 390 nN/µm. When seeded cells spread on the micropost array
gradients, they interact with microposts that increase in stiffness in a single, designed direction.
For example, Figure 2.2c shows a false-colored SEM image of a bovine aortic endothelial cell
(BAEC) spread over microposts that include 28 distinct stiffness values, with micropost stiffness
increasing from post-to-post rightward (yellow to red).
To preclude the potential effects of substrate-immobilized chemical gradients60
and
variable surface densities of topography,70, 71
the area surrounding individual microposts was
modulated to maintain a consistent percentage of extracellular matrix protein coverage (%ECM)
and topographic surface area for regimes of different micropost radii. Specifically, while the
interpost spacing along the axis of increasing stiffness was held constant at 2 µm, the interpost
spacing perpendicular to the axis of increasing stiffness was adjusted to compensate for changes
in micropost radii such that:
Equation 2.1
where r is the micropost radius, s is the spacing between microposts perpendicular to the axis of
increasing stiffness, and I is the interpost spacing parallel to the axis of increasing stiffness.
To maintain consistency between the two gradients, both the µDGL and the µDGH included
equivalent %ECM and topographic surface densities of 20%.
2.2.2 Microtopographic Dual-Axis Durotaxis Gradients (µDDGs)
A second class of micropost array durotaxis gradients was designed to offer two
improvements over the µDGs. First, the use of circular microposts is inherently limiting because
the micropost stiffness remains consistent 360º around the post. In contrast, the anisotropic
structure of elliptical microposts, which results in a higher micropost stiffness along the major
axes relative to the stiffness along the minor axes,66, 75
could further extend the efficacy of the
µDG methodology. Secondly, because the radii of arrayed circular microposts were increased
over the length of the µDGs, the micropost-specific top surface area increased as well.
Currently, it remains unclear how increasing the micropost-specific top surface area in the
absence of gradients in %ECM or topographic density might affect cell motility. To bypass such
concerns, the µDDGs were designed with a consistent micropost-specific top surface area over
the length of the substrates.
9
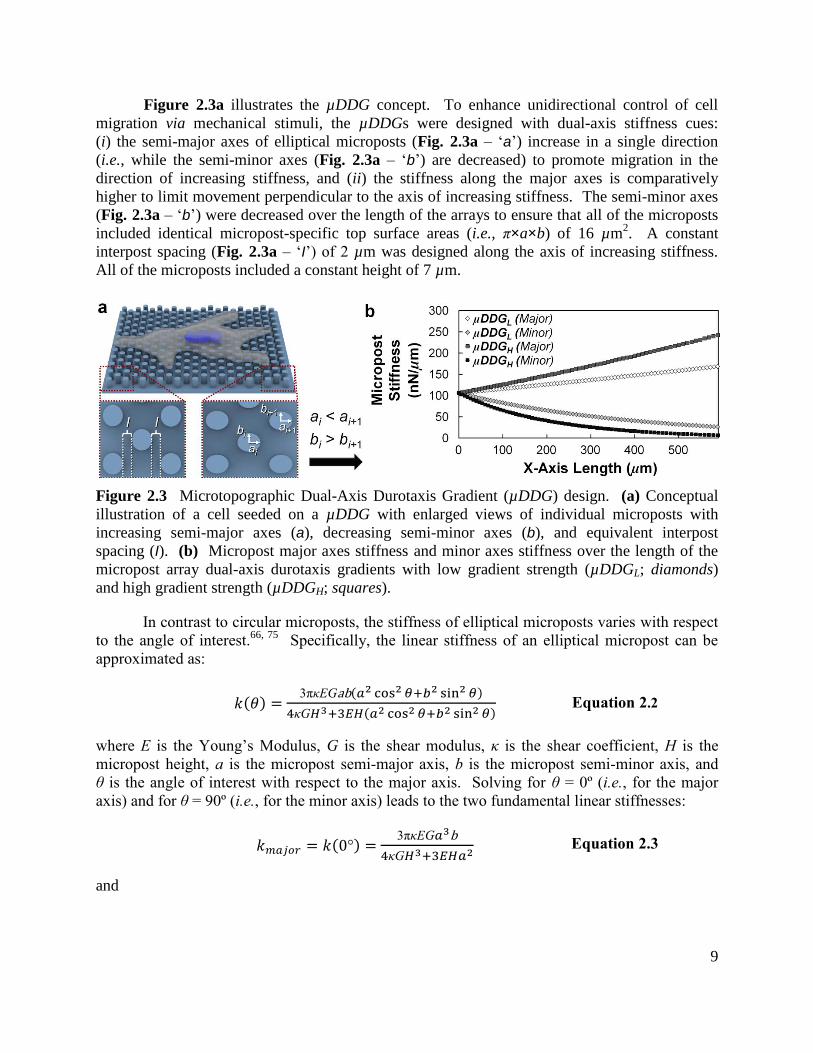
Figure 2.3a illustrates the µDDG concept. To enhance unidirectional control of cell
migration via mechanical stimuli, the µDDGs were designed with dual-axis stiffness cues:
(i) the semi-major axes of elliptical microposts (Fig. 2.3a – „a‟) increase in a single direction
(i.e., while the semi-minor axes (Fig. 2.3a – „b‟) are decreased) to promote migration in the
direction of increasing stiffness, and (ii) the stiffness along the major axes is comparatively
higher to limit movement perpendicular to the axis of increasing stiffness. The semi-minor axes
(Fig. 2.3a – „b‟) were decreased over the length of the arrays to ensure that all of the microposts
included identical micropost-specific top surface areas (i.e., π×a×b) of 16 µm2. A constant
interpost spacing (Fig. 2.3a – „I‟) of 2 µm was designed along the axis of increasing stiffness.
All of the microposts included a constant height of 7 µm.
Figure 2.3 Microtopographic Dual-Axis Durotaxis Gradient (µDDG) design. (a) Conceptual
illustration of a cell seeded on a µDDG with enlarged views of individual microposts with
increasing semi-major axes (a), decreasing semi-minor axes (b), and equivalent interpost
spacing (I). (b) Micropost major axes stiffness and minor axes stiffness over the length of the
micropost array dual-axis durotaxis gradients with low gradient strength (µDDGL; diamonds)
and high gradient strength (µDDGH; squares).
In contrast to circular microposts, the stiffness of elliptical microposts varies with respect
to the angle of interest.66, 75
Specifically, the linear stiffness of an elliptical micropost can be
approximated as:
3 κ
κ Equation 2.2
where E is the Y u g’ M dulu , G is the shear modulus, κ is the shear coefficient, H is the
micropost height, a is the micropost semi-major axis, b is the micropost semi-minor axis, and
θ is the angle of interest with respect to the major axis. Solving for θ = 0º (i.e., for the major
axis) and for θ = 90º (i.e., for the minor axis) leads to the two fundamental linear stiffnesses:
3 κ
κ Equation 2.3
and
10
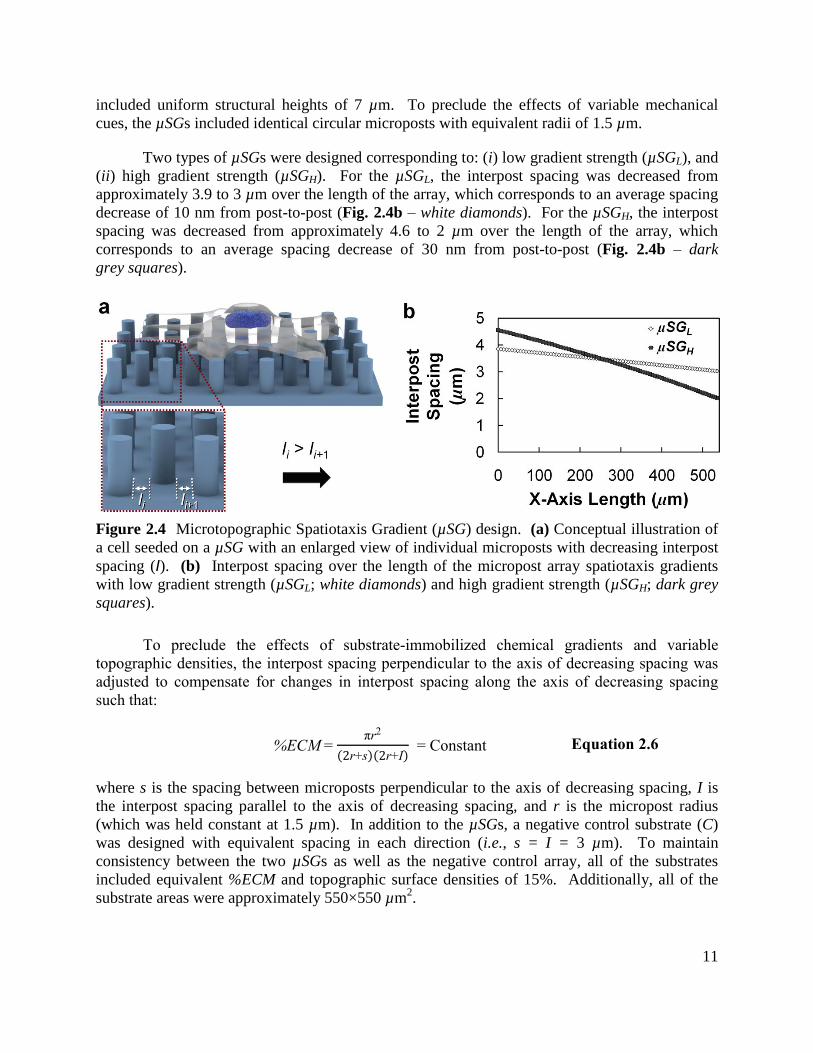
3 κ
κ Equation 2.4
where kmajor is the major axis stiffness, and kminor is the minor axis stiffness.
Two types of µDDGs were designed corresponding to: (i) low gradient
strength (µDDGL), and (ii) high gradient strength (µDDGH). The µDDGL included semi-major
axes increasing from 2.25 to 3 µm while the semi-minor axes were simultaneously decreased
from 2.25 to 1.7 µm, corresponding to changes in kmajor and kminor from approximately 100 to 170
nN/µm and 100 to 25 nN/µm, respectively (Fig. 2.3b – diamonds). For the µDDGL, kmajor was
increased by increments of approximately 1 nN/µm from post-to-post. The µDDGH included
semi-major axes increasing from 2.25 to 4.1 µm while the semi-minor axes were simultaneously
decreased from 2.25 to 1.25 µm, corresponding to changes in kmajor and kminor from approximately
100 to 240 nN/µm and 100 to 10 nN/µm, respectively (Fig. 2.3b – squares). For the µDDGH,
kmajor was increased by increments of approximately 2 nN/µm from post-to-post.
In addition to the microtopographic gradients, two control substrates were also designed:
(i) a negative control with identical circular posts of 2.25 µm in radius (CC), and
(ii) a bidirectional control of identical elliptical microposts of 3 µm in semi-major axes, and
1.7 µm in semi-minor axes (CE). For the CC, all of the microposts included stiffnesses of
approximately 100 nN/µm 360º around the post. For the CE, all of the microposts included a
kmajor of 170 nN/µm and a kminor of 25 nN/µm. Both control substrates included micropost-
specific top surface areas equivalent to that of the µDDGs.
To preclude the potential of substrate-immobilized chemical gradients and variable
surface densities of topography from affecting the migratory results, the interpost spacing
perpendicular to the axis of increasing stiffness was adjusted to compensate for changes in
micropost geometry such that:
Equation 2.5
where s is the spacing between microposts perpendicular to the axis of increasing stiffness and
I is the interpost spacing parallel to the axis of increasing stiffness (which was held constant at
2 µm over the length of the arrays). To maintain consistency between the two gradients as well
as the control arrays, all of the substrates included equivalent %ECM and topographic surface
densities of 25%. Additionally, all of the substrate areas were approximately 600×600 µm2.
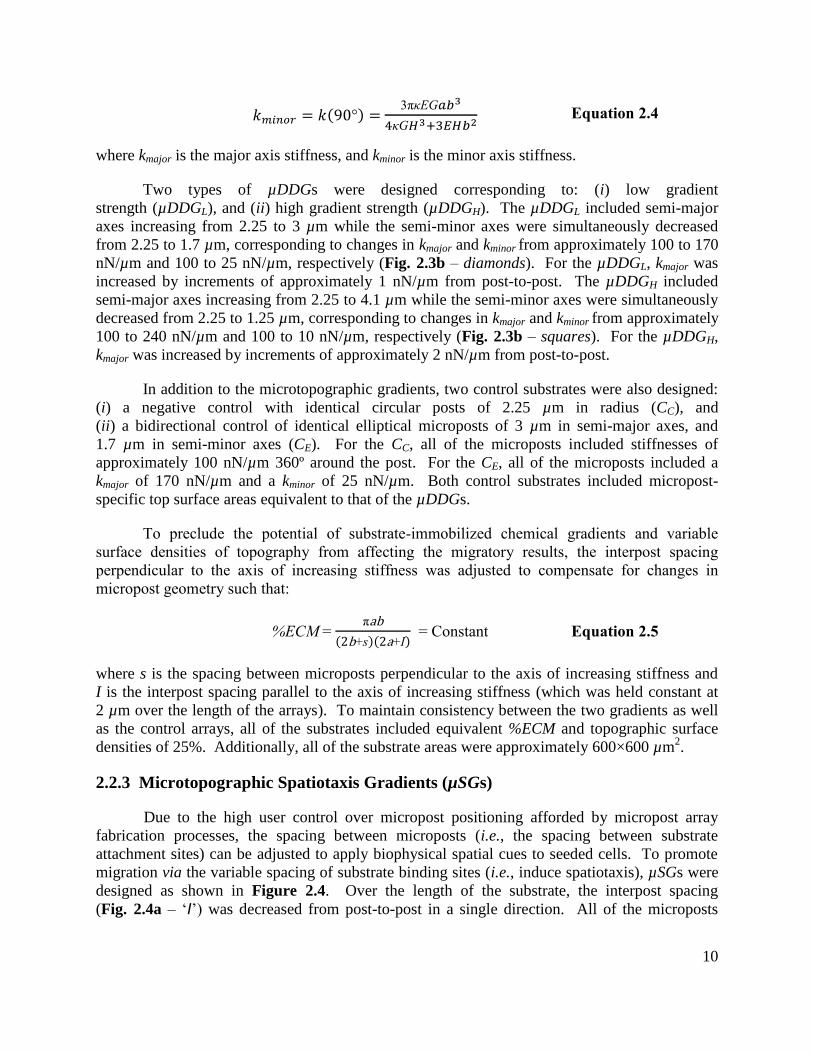
2.2.3 Microtopographic Spatiotaxis Gradients (µSGs)
Due to the high user control over micropost positioning afforded by micropost array
fabrication processes, the spacing between microposts (i.e., the spacing between substrate
attachment sites) can be adjusted to apply biophysical spatial cues to seeded cells. To promote
migration via the variable spacing of substrate binding sites (i.e., induce spatiotaxis), µSGs were
designed as shown in Figure 2.4. Over the length of the substrate, the interpost spacing
(Fig. 2.4a – „I‟) was decreased from post-to-post in a single direction. All of the microposts
11
included uniform structural heights of 7 µm. To preclude the effects of variable mechanical
cues, the µSGs included identical circular microposts with equivalent radii of 1.5 µm.
Two types of µSGs were designed corresponding to: (i) low gradient strength (µSGL), and
(ii) high gradient strength (µSGH). For the µSGL, the interpost spacing was decreased from
approximately 3.9 to 3 µm over the length of the array, which corresponds to an average spacing
decrease of 10 nm from post-to-post (Fig. 2.4b – white diamonds). For the µSGH, the interpost
spacing was decreased from approximately 4.6 to 2 µm over the length of the array, which
corresponds to an average spacing decrease of 30 nm from post-to-post (Fig. 2.4b – dark
grey squares).
Figure 2.4 Microtopographic Spatiotaxis Gradient (µSG) design. (a) Conceptual illustration of
a cell seeded on a µSG with an enlarged view of individual microposts with decreasing interpost
spacing (I). (b) Interpost spacing over the length of the micropost array spatiotaxis gradients
with low gradient strength (µSGL; white diamonds) and high gradient strength (µSGH; dark grey
squares).
To preclude the effects of substrate-immobilized chemical gradients and variable
topographic densities, the interpost spacing perpendicular to the axis of decreasing spacing was
adjusted to compensate for changes in interpost spacing along the axis of decreasing spacing
such that:
Equation 2.6
where s is the spacing between microposts perpendicular to the axis of decreasing spacing, I is
the interpost spacing parallel to the axis of decreasing spacing, and r is the micropost radius
(which was held constant at 1.5 µm). In addition to the µSGs, a negative control substrate (C)
was designed with equivalent spacing in each direction (i.e., s = I = 3 µm). To maintain
consistency between the two µSGs as well as the negative control array, all of the substrates
included equivalent %ECM and topographic surface densities of 15%. Additionally, all of the
substrate areas were approximately 550×550 µm2.
12
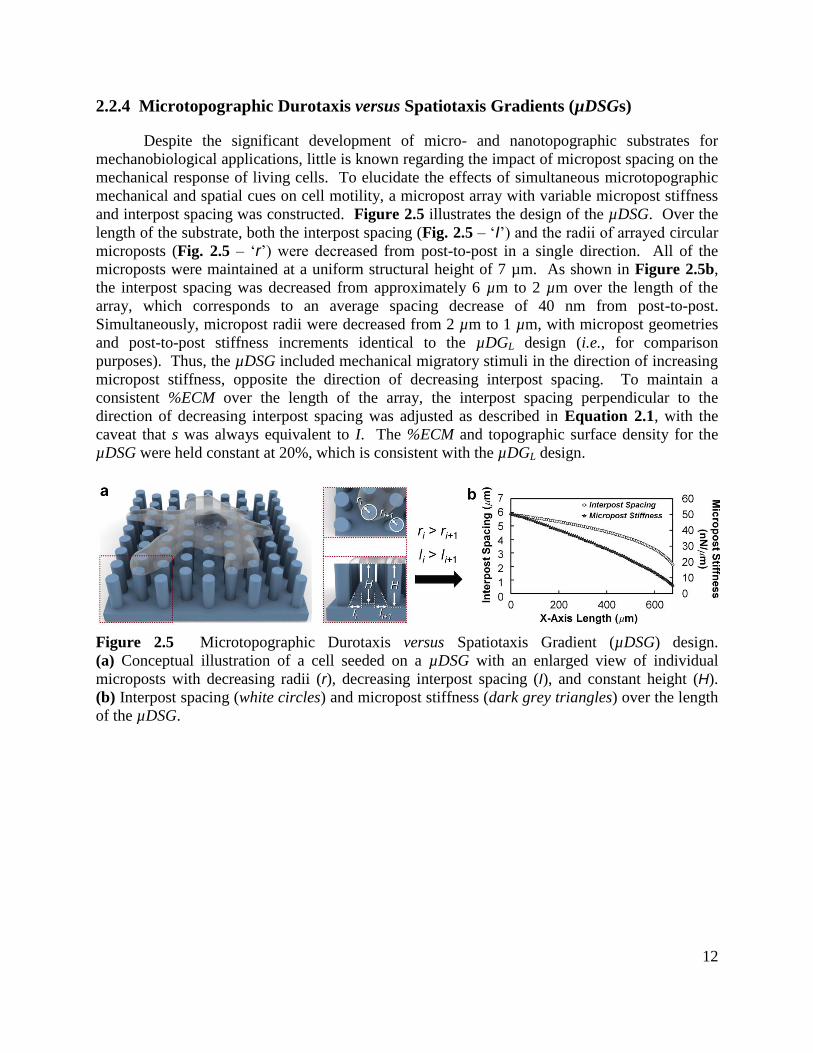
2.2.4 Microtopographic Durotaxis versus Spatiotaxis Gradients (µDSGs)
Despite the significant development of micro- and nanotopographic substrates for
mechanobiological applications, little is known regarding the impact of micropost spacing on the
mechanical response of living cells. To elucidate the effects of simultaneous microtopographic
mechanical and spatial cues on cell motility, a micropost array with variable micropost stiffness
and interpost spacing was constructed. Figure 2.5 illustrates the design of the µDSG. Over the
length of the substrate, both the interpost spacing (Fig. 2.5 – „I‟) and the radii of arrayed circular
microposts (Fig. 2.5 – „r‟) were decreased from post-to-post in a single direction. All of the
microposts were maintained at a uniform structural height of 7 µm. As shown in Figure 2.5b,
the interpost spacing was decreased from approximately 6 µm to 2 µm over the length of the
array, which corresponds to an average spacing decrease of 40 nm from post-to-post.
Simultaneously, micropost radii were decreased from 2 µm to 1 µm, with micropost geometries
and post-to-post stiffness increments identical to the µDGL design (i.e., for comparison
purposes). Thus, the µDSG included mechanical migratory stimuli in the direction of increasing
micropost stiffness, opposite the direction of decreasing interpost spacing. To maintain a
consistent %ECM over the length of the array, the interpost spacing perpendicular to the
direction of decreasing interpost spacing was adjusted as described in Equation 2.1, with the
caveat that s was always equivalent to I. The %ECM and topographic surface density for the
µDSG were held constant at 20%, which is consistent with the µDGL design.
Figure 2.5 Microtopographic Durotaxis versus Spatiotaxis Gradient (µDSG) design.
(a) Conceptual illustration of a cell seeded on a µDSG with an enlarged view of individual
microposts with decreasing radii (r), decreasing interpost spacing (I), and constant height (H).
(b) Interpost spacing (white circles) and micropost stiffness (dark grey triangles) over the length
of the µDSG.
13
2.3 Materials and Methods
2.3.1 Micropost Array Gradient Fabrication and Preparation
The micropost arrays were fabricated via standard soft lithography processes. Chrome
photomasks (Fineline Imaging) were designed with micropost geometry and placement
customized as described in Section 2.2. To fabricate the negative master, Si wafers were piranha
cleaned (Fig. 2.6a). The positive photoresist, SPR-220 (Rohm and Haas Electronic Materials),
was spin-coated onto the clean Silicon wafers at 50 rpm for 30 seconds, and then 3500 rpm for
45 seconds, resulting in a thickness of approximately 7 μm. Thereafter, a softbake was
performed on a hotplate at 115 °C for 5 minutes, and the wafers were cooled at room temperature
(20-25 °C) to avoid thermal shock. The microfeatures were defined using projection
photolithography with a 10× reduction step and repeat camera (GCA-6200 Wafer Stepper,
General Signal Corporation). After a wait time of at least 30 minutes, a post exposure bake was
performed at 115 °C for 6.5 minutes. The wafer was developed in a beaker of MF-26A
developer for 15 minutes, and then rinsed thoroughly with deionized (DI) water and dried with
N2. A hardbake was performed on a hotplate at 80 °C for 5 minutes to finish the negative master
fabrication process (Fig. 2.6b).
Using the developed photoresist as a negative master, the silicone elastomer,
poly(dimethylsiloxane) (PDMS) (Sylgard 184, Dow Corning), was poured onto the wafer at a
10:1 (base : curing agent) ratio and cured at room temperature (20-25 °C) in a vacuum chamber
for approximately two days (Fig. 2.6c). The fabricated microtopographic substrates were
removed from the negative master (Fig. 2.6d). Solvents were not used during the removal
process. To remove residual photoresist, the substrates were submerged in 100% ethanol and
sonicated for 10 minutes. In a clean hood, the 100% ethanol was aspirated from the substrates
until the substrates were dry. To improve cellular attachment to the top surfaces of the
microposts, the substrate was selectively microcontact-printed with the ECM protein,
fibronectin, via previously described processes.67
Briefly, the microtopographic substrates were
treated with O2 plasma (RTE73 AMNS-500- E, Plasma Therm) for 5 minutes to render the
surfaces hydrophilic. The surface of PDMS stamps were incubated with fibronectin (25 µg/ml in
DI water; Sigma-Aldrich) for one hour to allow for protein adsorption (Fig. 2.6e - inset).
Fibronectin-coated stamps were brought into contact with the microtopographic substrates for
15 minutes to facilitate the adsorption of fibronectin at the tops of the microposts (Fig. 2.6e).
After the stamps were removed, the microtopographic substrates were sterilized in successive
dishes of 100% ethanol and 70% ethanol for one minute each. The micropost array substrates
were then submerged in two successive dishes of DI water for one minute each to remove excess
70% ethanol. The micropost array gradients were submerged in 0.2% Pluronics F127
(Sigma Aldrich) for 30 minutes to limit cell attachment and protein adsorption at locations other
than the top surfaces of the microposts (Fig. 2.6f). Lastly, the substrates were submerged in two
successive dishes of phosphate buffered saline (PBS) (Sigma Aldrich) for one minute each
(i.e., to remove excess Pluronics F127), and then stored in sterile PBS in an incubator at 37 °C
until use.
14
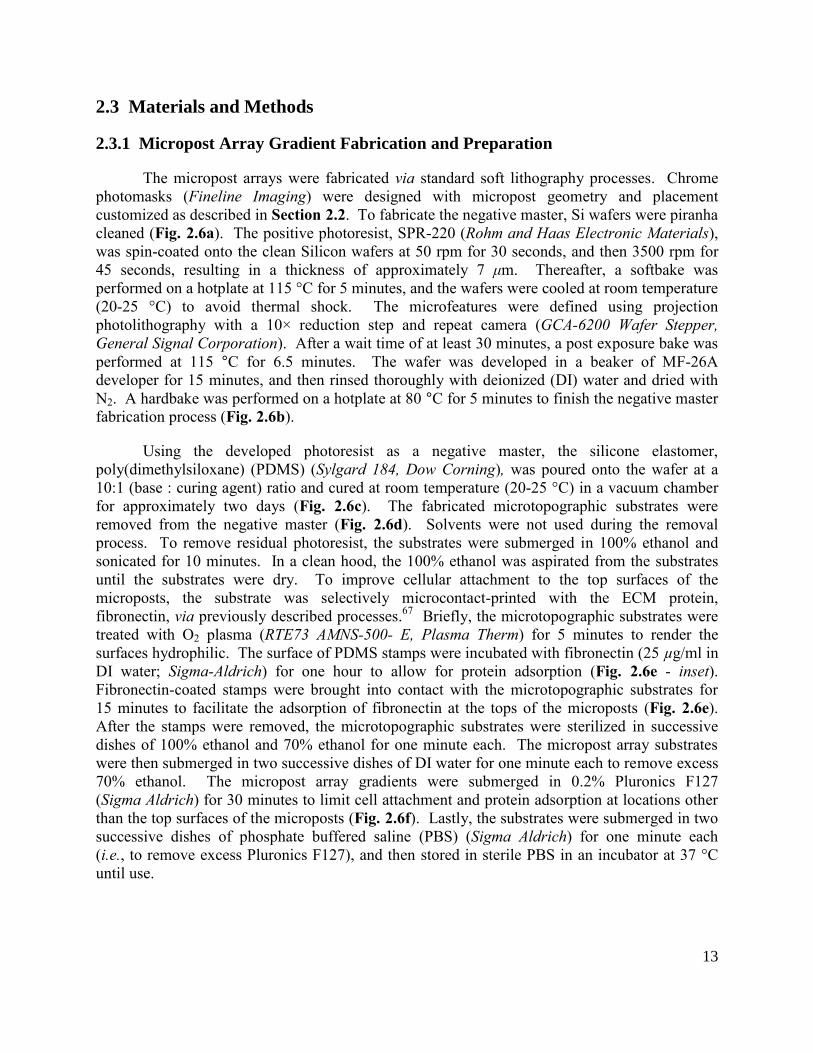
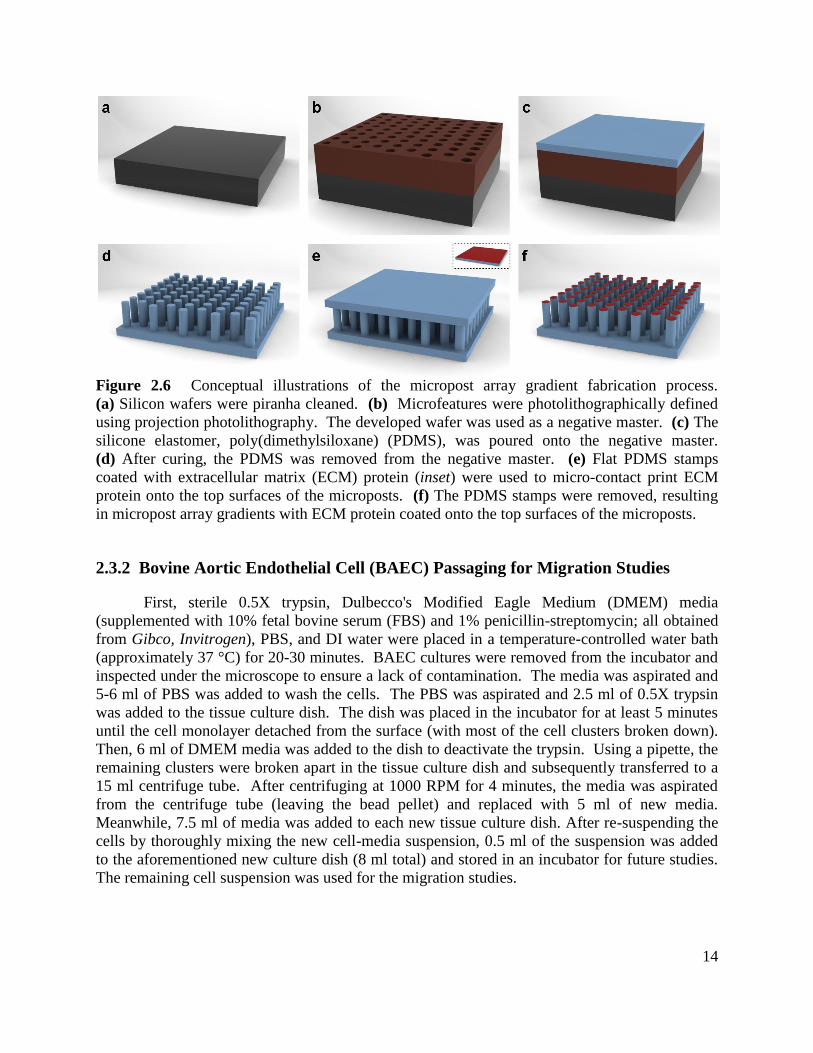
Figure 2.6 Conceptual illustrations of the micropost array gradient fabrication process.
(a) Silicon wafers were piranha cleaned. (b) Microfeatures were photolithographically defined
using projection photolithography. The developed wafer was used as a negative master. (c) The
silicone elastomer, poly(dimethylsiloxane) (PDMS), was poured onto the negative master.
(d) After curing, the PDMS was removed from the negative master. (e) Flat PDMS stamps
coated with extracellular matrix (ECM) protein (inset) were used to micro-contact print ECM
protein onto the top surfaces of the microposts. (f) The PDMS stamps were removed, resulting
in micropost array gradients with ECM protein coated onto the top surfaces of the microposts.
2.3.2 Bovine Aortic Endothelial Cell (BAEC) Passaging for Migration Studies
First, sterile 0.5X trypsin, Dulbecco's Modified Eagle Medium (DMEM) media
(supplemented with 10% fetal bovine serum (FBS) and 1% penicillin-streptomycin; all obtained
from Gibco, Invitrogen), PBS, and DI water were placed in a temperature-controlled water bath
(approximately 37 °C) for 20-30 minutes. BAEC cultures were removed from the incubator and
inspected under the microscope to ensure a lack of contamination. The media was aspirated and
5-6 ml of PBS was added to wash the cells. The PBS was aspirated and 2.5 ml of 0.5X trypsin
was added to the tissue culture dish. The dish was placed in the incubator for at least 5 minutes
until the cell monolayer detached from the surface (with most of the cell clusters broken down).
Then, 6 ml of DMEM media was added to the dish to deactivate the trypsin. Using a pipette, the
remaining clusters were broken apart in the tissue culture dish and subsequently transferred to a
15 ml centrifuge tube. After centrifuging at 1000 RPM for 4 minutes, the media was aspirated
from the centrifuge tube (leaving the bead pellet) and replaced with 5 ml of new media.
Meanwhile, 7.5 ml of media was added to each new tissue culture dish. After re-suspending the
cells by thoroughly mixing the new cell-media suspension, 0.5 ml of the suspension was added
to the aforementioned new culture dish (8 ml total) and stored in an incubator for future studies.
The remaining cell suspension was used for the migration studies.
15
2.3.3 Methods for Observing Cell Migration on µDG and µDSG Substrates
Initially, CO2 independent media (Invitrogen) was placed in the temperature-controlled
water bath (approximately 37 °C) for 20-30 minutes. The microcontact-printed micropost arrays
from Section 2.3.1 were removed from the incubator. The PBS was aspirated from the dish
(without touching the micropost arrays). Using tweezers, the microtopographic substrates were
lifted from the dish, and the PBS was aspirated from the bottom of the substrates. The substrates
were placed onto an autoclaved microscope slide and gently pressed to improve contact.
After thoroughly mixing the remaining cell suspension from Section 2.3.2 to ensure even cell
distributions prior to cell seeding, 10 µl of the suspension was used to seed each micropost array
pattern. Next, the micropost array substrates were placed in a non-tissue culture petri dish, with
one ml of DMEM media added to the dish. The dish was placed in the incubator for up to one
hour to promote cell attachment to the microposts.
A Griffin beaker with 700 ml of DI water was placed inside the microscope incubator and
the temperature was set to 37 °C. Double sided tape was soaked in 70% ethanol for 30 minutes
and placed in the tissue culture hood. Both sides were sterilized via UV treatment for
30 minutes. The 70% ethanol was aspirated and the tape was rinsed with DI water for 2 minutes.
The water was aspirated until the tape dried completely. A kimwipe was soaked in 70% ethanol,
placed flat inside the hood and UV treated for 20 minutes. An autoclaved microscope slide was
placed onto the dry kimwipe. Using the glass cutter, the slide was scored at its midpoint.
The kimwipe is folded over the slide, which was then manually broken into two equal pieces.
The slide pieces were placed into a non-tissue culture treated petri dish and rinsed with 13 ml of
DI water. The DI water and any rogue glass particulates were aspirated. Using tweezers and the
aspirator, the slide pieces were dried completely. Using a razor or scalpel, the sterile double
sided tape was cut to the length of the slide pieces. The tape was placed on the base of the petri
dish, parallel to each other and less than 2 cm apart. The slide pieces were placed on top of the
tape, parallel to each other and approximately 1 cm apart (Fig. 2.7a).
The slide with the seeded micropost array substrates was removed from the incubator.
The remaining media was aspirated until the slide dried. Meanwhile, 9-10 ml of CO2
independent media was added to the dish with the tape and slide pieces, covering the base.
Any bubbles generated were manually aspirated. The slide with the micropost arrays was
inverted (i.e., the patterns faced downward) and carefully placed in between the slide pieces to
avoid bubbles (Fig. 2.7b). Any bubbles generated were aspirated. To submerge all of the slides,
10-15 ml of CO2 independent media was added to the dish. Lastly, the dish was covered and
transferred to the temperature and humidity controlled chamber of the microscope
(i.e., maintained at 37 °C). Time-lapse videos of cell movement on the micropost array gradients
were generated in parallel from phase contrast microscopic images taken every 20 minutes over
the course of 18-hour studies using an Eclipse TE300 inverted microscope (Nikon) with Simple
PCI software (Compix, Inc.).
16
Figure 2.7 Conceptual illustrations of the setup assembly for time-lapse microscopy for µDG
and µDSG cell studies. (a) Bottom view before placement of the slide with the inverted
micropost arrays. (b) Side view after placement of the slide with the inverted micropost arrays.
2.3.4 Methods for Observing Cell Migration on µDDG and µSG Substrates
For observing cell movement µDDG and µSG substrates, first, CO2 independent media
(Invitrogen) was placed in the water bath for 20-30 minutes. Microcontact-printed micropost
array gradients were removed from the incubator. Using tweezers, the micropost arrays were
lifted from the dish, and the PBS was aspirated from the bottom of the substrates. The substrates
were placed in the wells of a sterile Costar® 6-well tissue culture-treated plate (#3516, Corning
Inc.) and gently pressed to improve contact. Thereafter, 2.5 ml of cell media was added to each
of the wells with substrates. After thoroughly mixing the remaining cell suspension (described
in Section 2.3.2) to ensure even cell distributions prior to cell seeding, 0.25 ml of the suspension
was loaded into each of the wells with substrates. The 6-well plate was then placed in the
incubator for 30 minutes to promote cell attachment to the microposts.
The remaining media was aspirated from each of the wells with substrates and replaced
with 4 ml of CO2 independent media. Any bubbles generated were manually aspirated. The 6-
well plate was transferred to a temperature and humidity controlled chamber of the microscope
(i.e., maintained at 37 °C). Time-lapse videos of cell movement on all of the array designs were
generated in parallel from phase contrast microscopic images taken every 20 minutes over the
course of 18-hour studies using an ImageXpress® Micro System (Molecular Devices) with a
Photometrics CoolSNAPHQ digital charge-coupled device (CCD) camera and MetaXpress
software (v. 3.1.0.89, Molecular Devices).
Sterile Double-Sided
Tape
tape
Slide
e
Non-Tissue Culture
Treated Petri Dish
Micropost Array
Slide
pieces
a
b
Sterile Double-Sided Tape
Microscope
Slide pieces
Non-Tissue Culture
Treated Petri Dish

17
2.3.5 Data Acquisition and Analysis for Cell Migration Studies
Because cell-cell interactions can affect directional migration,76
data was collected from
single cells with only substrate contact (i.e., no cell-cell interactions). The time-lapse videos
were analyzed using an independently designed cell tracking program in conjunction with the
software ImageJ (National Institute of Health (NIH), USA) to manually track cell area centroids
with time to determine net cell displacements and velocities. Experimental results are presented
as mean ± standard error of the mean (s.e.m.). The p values for this study were calculated via
unpaired Student’ t tests. Briefly, the sample means and standard deviations were calculated
directly from the migratory data. The s.e.m. was calculated by dividing the standard deviation
by the square root of the sample size (n). The t value was calculated by dividing the difference
between two means by the corresponding standard error of the difference between two means.
With the number of degrees of freedom (the total n minus 2) and the t value, the corresponding
two-tailed p values were determined to assess statistical significance. Differences with a p value
less than 0.05 were considered statistically significant.
18
2.4 Results and Discussion
2.4.1 Cell Motility on µDGs
Experimental observations revealed that both µDGs influenced directional motility, as
seeded BAECs migrated preferentially in the direction of increasing micropost stiffness.
Figure 2.8a shows sequential time-lapse images of a BAEC (white arrows) migrating in the
direction of increasing micropost stiffness (black arrow) on the µDGL. The two-dimensional
averaged 18-hour cell paths for migration on the µDGL and µDGH are shown in Figure 2.8b and
Figure 2.8c, respectively. On the µDGL, seeded BAECs were found to displace an average of
26.5±8.7 µm (n = 23 cells) in the direction of increasing micropost stiffness by the end of the
18-hour studies (Fig. 2.8d). The maximum observed displacements during the studies were
141 µm for cell movement in the direction of increasing micropost stiffness and 45 µm for
displacement opposite that direction. At the end of the studies, 70% (16 from a total of 23) of
BAECs exhibited displacement in the direction of increasing stiffness relative to their initial
positions at the start of the studies.
Higher gradient strength was found to enhance the directional response. By the end of
the studies, cells on the µDGH displaced an average of 41.9±14.7 µm in the direction of
increasing micropost stiffness (Fig. 2.8e), with maximum observed displacements of 145 µm for
movement in the direction of increasing stiffness and 24 µm for displacement opposite that
direction. By the end of the 18-hour studies, the percentage of cells that exhibited displacement
in the direction of increasing micropost stiffness increased to 77% (10 from a total of 13 cells).
These results are consistent with past studies of the cellular response to substrate stiffness
cues.9, 10, 49
Similar to prior work, increased gradient strength was found to enhance cell
migration in the direction of increasing substrate stiffness.9
The speed of cell movement was also found to be affected by the micropost array
gradients during the 18-hour studies. Specifically, cell speeds were observed to vary with
respect to the direction of the mechanical stimuli. For migration in the direction of increasing
micropost stiffness, BAECs on the µDGL and µDGH exhibited average speeds of 7.5±0.5 µm/hr
and 7.0±0.7 µm/hr, respectively (Fig. 2.9). For movement opposite the direction of increasing
stiffness, the average speed of BAEC migration on the µDGL decreased to 6.6±0.5 µm/hr;
however, this difference was not statistically significant (p = 0.24). In contrast, the average
speed of BAEC migration on the µDGH decreased significantly to 4.8±0.6 µm/hr for movement
opposite the direction of increasing stiffness (p < 0.05). Additionally, although the average cell
speed did not differ significantly between substrates for movement in the direction of increasing
micropost stiffness (p = 0.61), higher gradient strength was found to significantly reduce the
average cell speed for migration opposite that direction (p < 0.05) (Fig. 2.9).
Although the cellular response to the microtopographic mechanical stimuli was found to
be consistent with durotaxis predictions and prior work, the experimental results for the µDGs
cannot be attributed exclusively to cellular durotaxis. For the µDGs, the spacing surrounding
individual microposts was modulated to ensure that the overall %ECM and topographic surface
area remained constant over both microtopographic substrates (Eq. 2.1); however, it remains
unclear how increasing the micropost-specific top surface area in the absence of gradients in
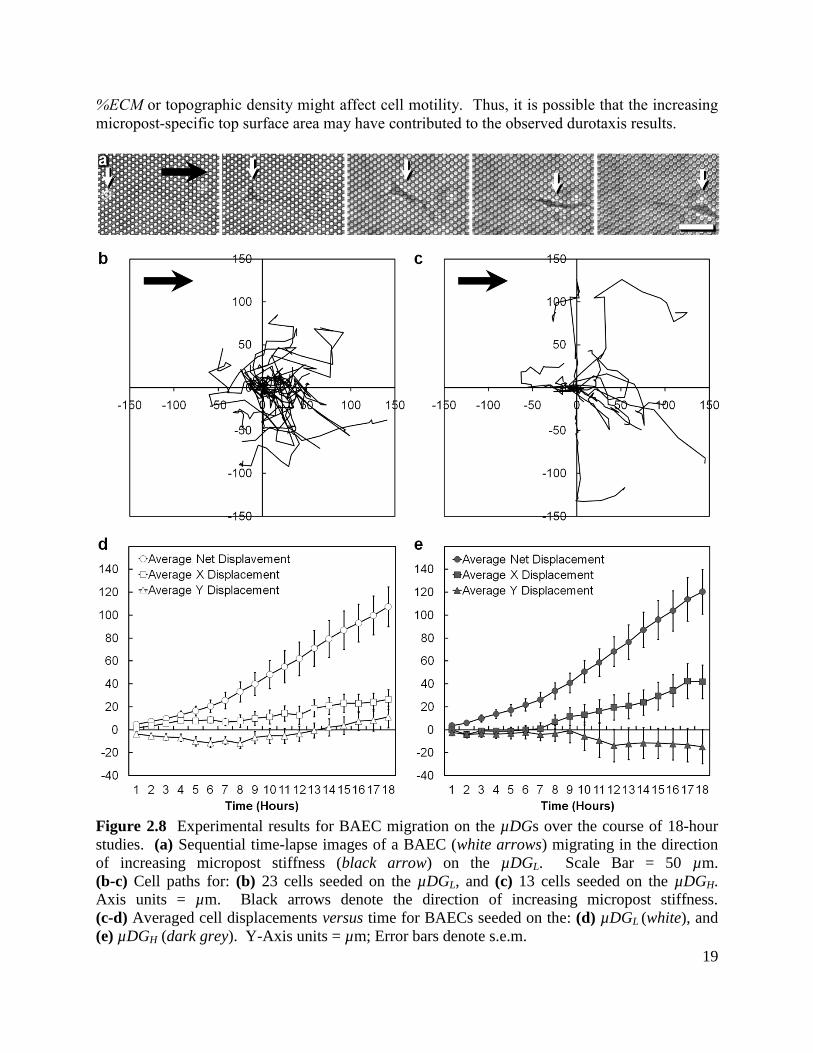
19
%ECM or topographic density might affect cell motility. Thus, it is possible that the increasing
micropost-specific top surface area may have contributed to the observed durotaxis results.
Figure 2.8 Experimental results for BAEC migration on the µDGs over the course of 18-hour
studies. (a) Sequential time-lapse images of a BAEC (white arrows) migrating in the direction
of increasing micropost stiffness (black arrow) on the µDGL. Scale Bar = 50 µm.
(b-c) Cell paths for: (b) 23 cells seeded on the µDGL, and (c) 13 cells seeded on the µDGH.
Axis units = µm. Black arrows denote the direction of increasing micropost stiffness.
(c-d) Averaged cell displacements versus time for BAECs seeded on the: (d) µDGL (white), and
(e) µDGH (dark grey). Y-Axis units = µm; Error bars denote s.e.m.
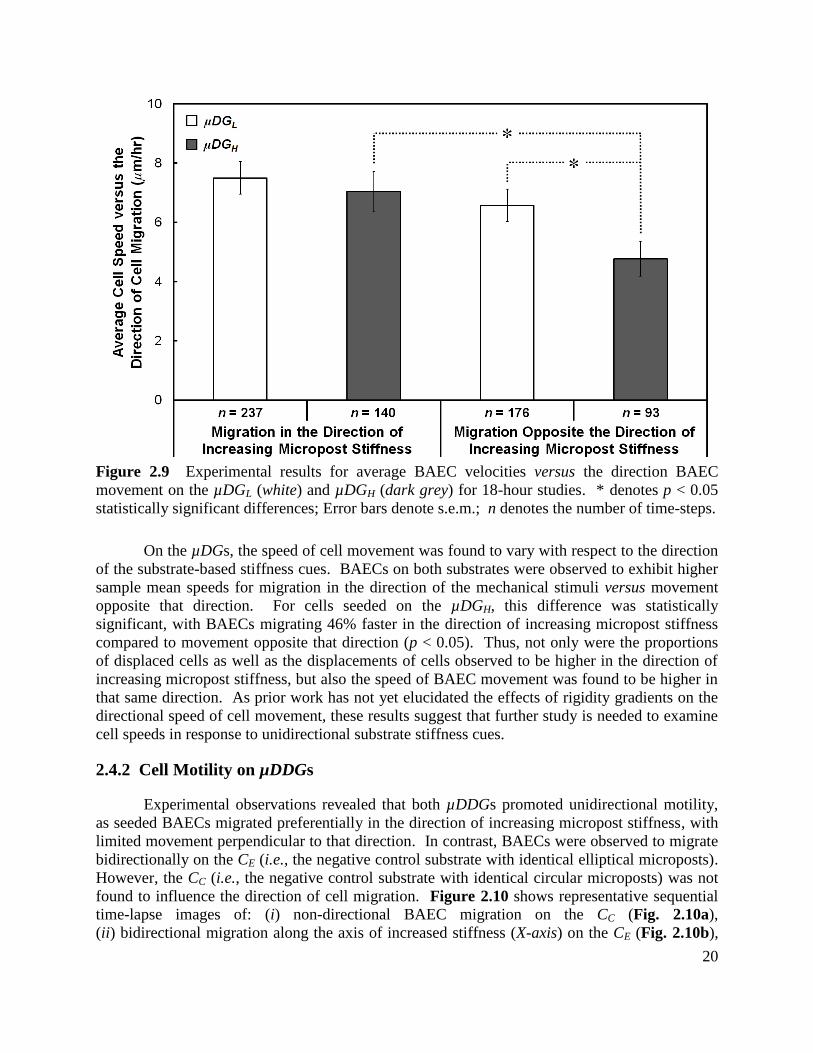
20
Figure 2.9 Experimental results for average BAEC velocities versus the direction BAEC
movement on the µDGL (white) and µDGH (dark grey) for 18-hour studies. * denotes p < 0.05
statistically significant differences; Error bars denote s.e.m.; n denotes the number of time-steps.
On the µDGs, the speed of cell movement was found to vary with respect to the direction
of the substrate-based stiffness cues. BAECs on both substrates were observed to exhibit higher
sample mean speeds for migration in the direction of the mechanical stimuli versus movement
opposite that direction. For cells seeded on the µDGH, this difference was statistically
significant, with BAECs migrating 46% faster in the direction of increasing micropost stiffness
compared to movement opposite that direction (p < 0.05). Thus, not only were the proportions
of displaced cells as well as the displacements of cells observed to be higher in the direction of
increasing micropost stiffness, but also the speed of BAEC movement was found to be higher in
that same direction. As prior work has not yet elucidated the effects of rigidity gradients on the
directional speed of cell movement, these results suggest that further study is needed to examine
cell speeds in response to unidirectional substrate stiffness cues.
2.4.2 Cell Motility on µDDGs
Experimental observations revealed that both µDDGs promoted unidirectional motility,
as seeded BAECs migrated preferentially in the direction of increasing micropost stiffness, with
limited movement perpendicular to that direction. In contrast, BAECs were observed to migrate
bidirectionally on the CE (i.e., the negative control substrate with identical elliptical microposts).
However, the CC (i.e., the negative control substrate with identical circular microposts) was not
found to influence the direction of cell migration. Figure 2.10 shows representative sequential
time-lapse images of: (i) non-directional BAEC migration on the CC (Fig. 2.10a),
(ii) bidirectional migration along the axis of increased stiffness (X-axis) on the CE (Fig. 2.10b),
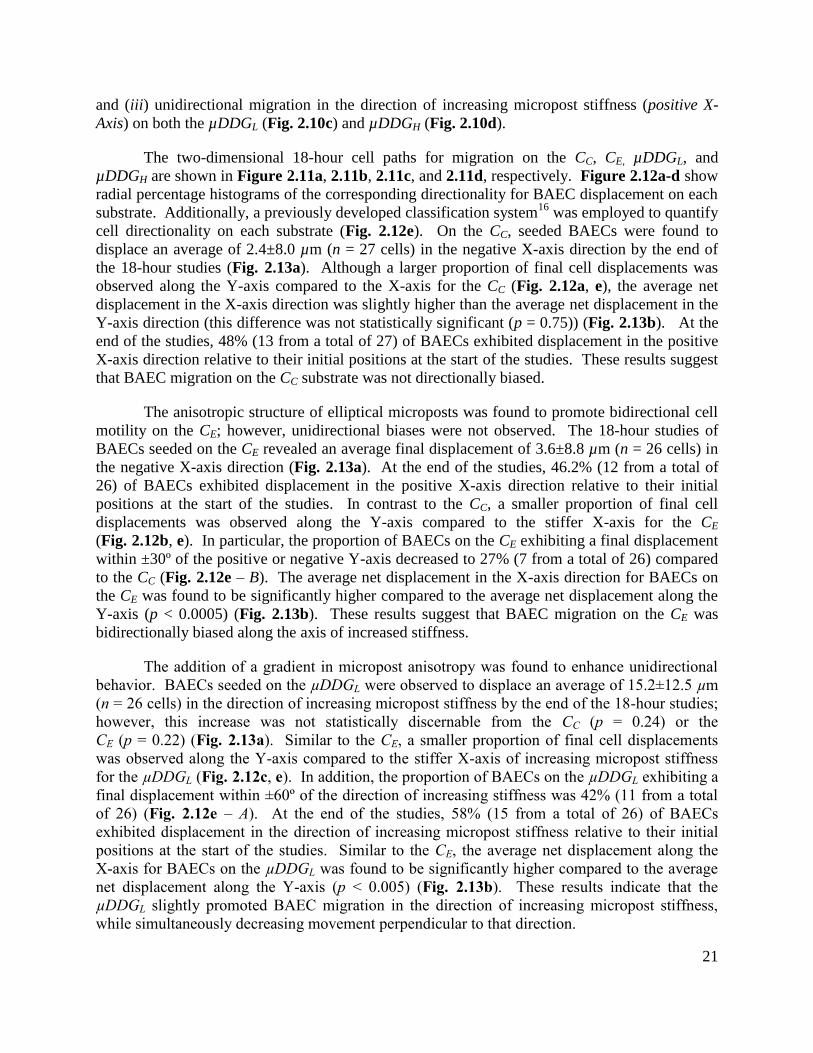
21
and (iii) unidirectional migration in the direction of increasing micropost stiffness (positive X-
Axis) on both the µDDGL (Fig. 2.10c) and µDDGH (Fig. 2.10d).
The two-dimensional 18-hour cell paths for migration on the CC, CE, µDDGL, and
µDDGH are shown in Figure 2.11a, 2.11b, 2.11c, and 2.11d, respectively. Figure 2.12a-d show
radial percentage histograms of the corresponding directionality for BAEC displacement on each
substrate. Additionally, a previously developed classification system16
was employed to quantify
cell directionality on each substrate (Fig. 2.12e). On the CC, seeded BAECs were found to
displace an average of 2.4±8.0 µm (n = 27 cells) in the negative X-axis direction by the end of
the 18-hour studies (Fig. 2.13a). Although a larger proportion of final cell displacements was
observed along the Y-axis compared to the X-axis for the CC (Fig. 2.12a, e), the average net
displacement in the X-axis direction was slightly higher than the average net displacement in the
Y-axis direction (this difference was not statistically significant (p = 0.75)) (Fig. 2.13b). At the
end of the studies, 48% (13 from a total of 27) of BAECs exhibited displacement in the positive
X-axis direction relative to their initial positions at the start of the studies. These results suggest
that BAEC migration on the CC substrate was not directionally biased.
The anisotropic structure of elliptical microposts was found to promote bidirectional cell
motility on the CE; however, unidirectional biases were not observed. The 18-hour studies of
BAECs seeded on the CE revealed an average final displacement of 3.6±8.8 µm (n = 26 cells) in
the negative X-axis direction (Fig. 2.13a). At the end of the studies, 46.2% (12 from a total of
26) of BAECs exhibited displacement in the positive X-axis direction relative to their initial
positions at the start of the studies. In contrast to the CC, a smaller proportion of final cell
displacements was observed along the Y-axis compared to the stiffer X-axis for the CE
(Fig. 2.12b, e). In particular, the proportion of BAECs on the CE exhibiting a final displacement
within ±30º of the positive or negative Y-axis decreased to 27% (7 from a total of 26) compared
to the CC (Fig. 2.12e – B). The average net displacement in the X-axis direction for BAECs on
the CE was found to be significantly higher compared to the average net displacement along the
Y-axis (p < 0.0005) (Fig. 2.13b). These results suggest that BAEC migration on the CE was
bidirectionally biased along the axis of increased stiffness.
The addition of a gradient in micropost anisotropy was found to enhance unidirectional
behavior. BAECs seeded on the µDDGL were observed to displace an average of 15.2±12.5 µm
(n = 26 cells) in the direction of increasing micropost stiffness by the end of the 18-hour studies;
however, this increase was not statistically discernable from the CC (p = 0.24) or the
CE (p = 0.22) (Fig. 2.13a). Similar to the CE, a smaller proportion of final cell displacements
was observed along the Y-axis compared to the stiffer X-axis of increasing micropost stiffness
for the µDDGL (Fig. 2.12c, e). In addition, the proportion of BAECs on the µDDGL exhibiting a
final displacement within ±60º of the direction of increasing stiffness was 42% (11 from a total
of 26) (Fig. 2.12e – A). At the end of the studies, 58% (15 from a total of 26) of BAECs
exhibited displacement in the direction of increasing micropost stiffness relative to their initial
positions at the start of the studies. Similar to the CE, the average net displacement along the
X-axis for BAECs on the µDDGL was found to be significantly higher compared to the average
net displacement along the Y-axis (p < 0.005) (Fig. 2.13b). These results indicate that the
µDDGL slightly promoted BAEC migration in the direction of increasing micropost stiffness,
while simultaneously decreasing movement perpendicular to that direction.
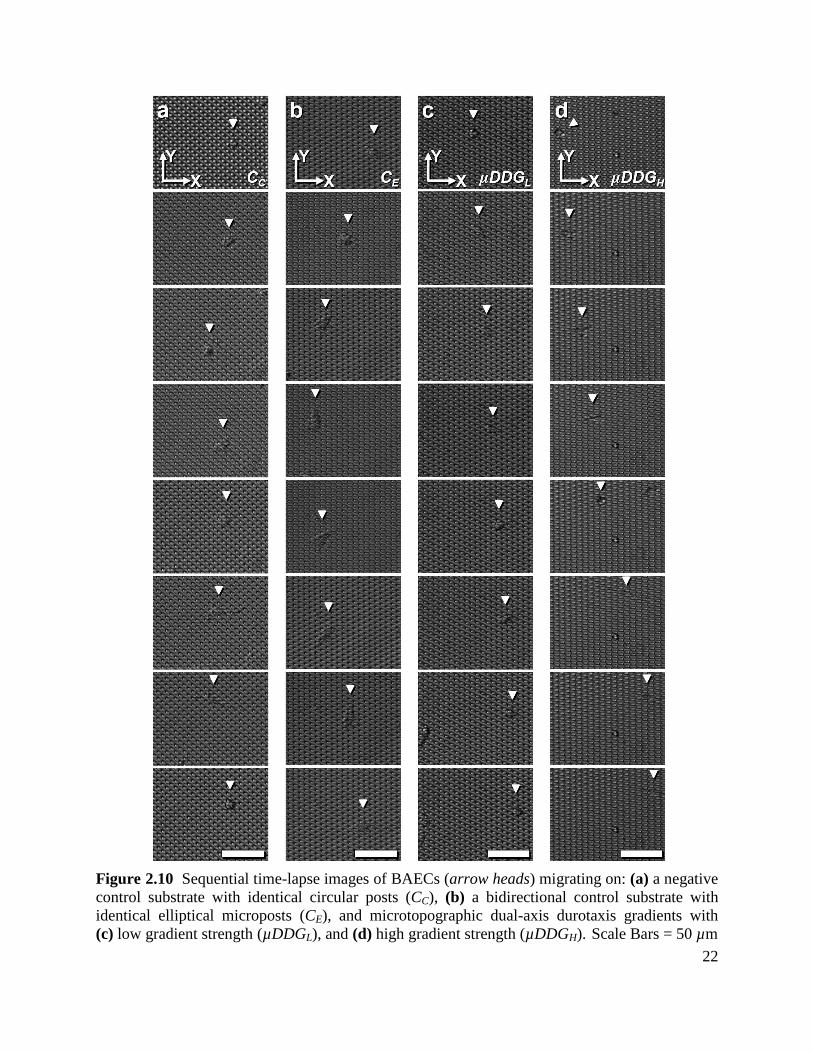
22
Figure 2.10 Sequential time-lapse images of BAECs (arrow heads) migrating on: (a) a negative
control substrate with identical circular posts (CC), (b) a bidirectional control substrate with
identical elliptical microposts (CE), and microtopographic dual-axis durotaxis gradients with
(c) low gradient strength (µDDGL), and (d) high gradient strength (µDDGH). Scale Bars = 50 µm
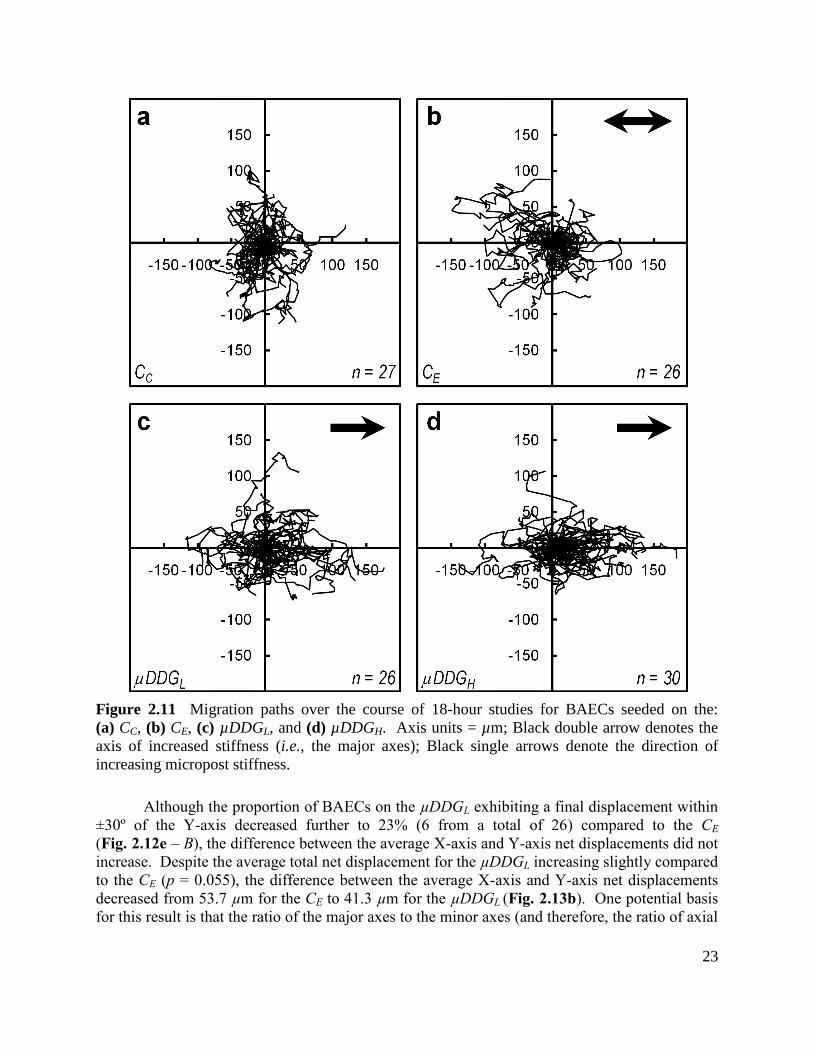
23
Figure 2.11 Migration paths over the course of 18-hour studies for BAECs seeded on the:
(a) CC, (b) CE, (c) µDDGL, and (d) µDDGH. Axis units = µm; Black double arrow denotes the
axis of increased stiffness (i.e., the major axes); Black single arrows denote the direction of
increasing micropost stiffness.
Although the proportion of BAECs on the µDDGL exhibiting a final displacement within
±30º of the Y-axis decreased further to 23% (6 from a total of 26) compared to the CE
(Fig. 2.12e – B), the difference between the average X-axis and Y-axis net displacements did not
increase. Despite the average total net displacement for the µDDGL increasing slightly compared
to the CE (p = 0.055), the difference between the average X-axis and Y-axis net displacements
decreased from 53.7 µm for the CE to 41.3 µm for the µDDGL (Fig. 2.13b). One potential basis
for this result is that the ratio of the major axes to the minor axes (and therefore, the ratio of axial
a
24
Figure 2.12 Experimental results of directional BAEC migration on the µDDGs and control
substrates for 18-hour studies. (a-d) Radial percentage histograms of final displacements for
cells on the: (a) CC, (b) CE, (c) µDDGL, and (d) µDDGH. Circular Axis units = Degrees; 0º
denotes the positive X-axis direction (i.e., the direction of increasing micropost stiffness for the
µDDGs). (e) Corresponding percentage histogram of the final directional cell displacements on
each microtopographic substrate into three 120º regions.
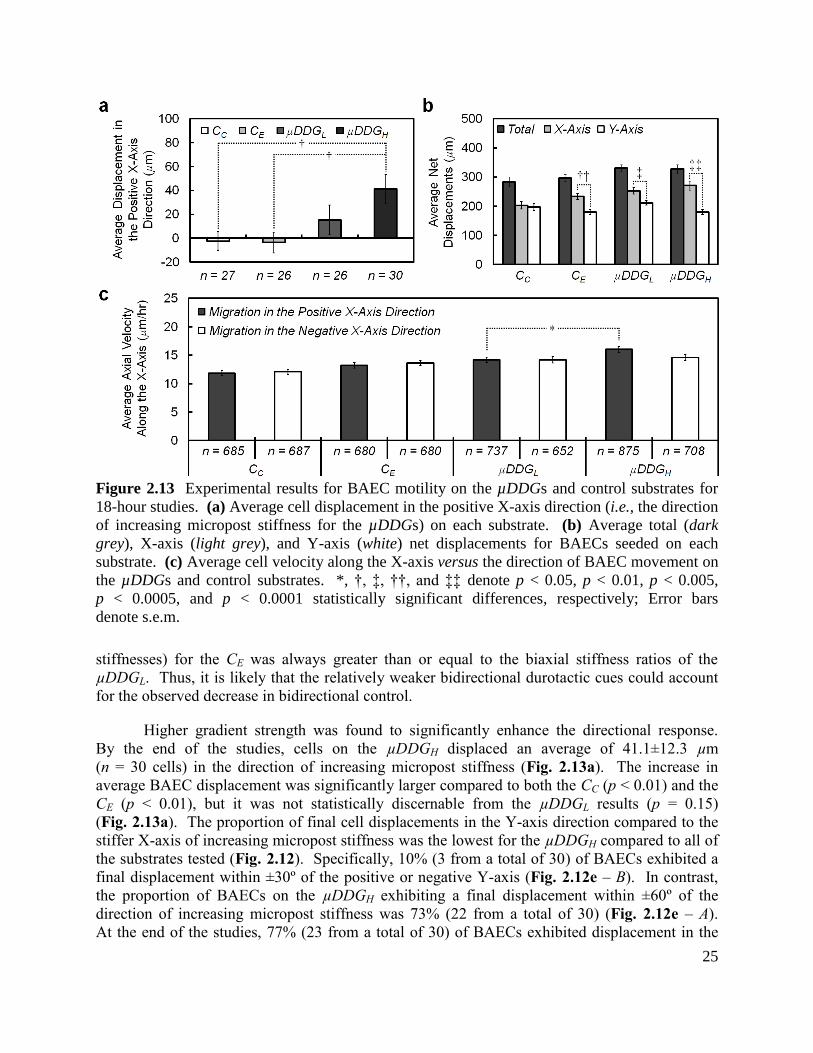
25
Figure 2.13 Experimental results for BAEC motility on the µDDGs and control substrates for
18-hour studies. (a) Average cell displacement in the positive X-axis direction (i.e., the direction
of increasing micropost stiffness for the µDDGs) on each substrate. (b) Average total (dark
grey), X-axis (light grey), and Y-axis (white) net displacements for BAECs seeded on each
substrate. (c) Average cell velocity along the X-axis versus the direction of BAEC movement on
the µDDGs and control substrates. *, †, ‡, ††, and ‡‡ denote p < 0.05, p < 0.01, p < 0.005,
p < 0.0005, and p < 0.0001 statistically significant differences, respectively; Error bars
denote s.e.m.
stiffnesses) for the CE was always greater than or equal to the biaxial stiffness ratios of the
µDDGL. Thus, it is likely that the relatively weaker bidirectional durotactic cues could account
for the observed decrease in bidirectional control.
Higher gradient strength was found to significantly enhance the directional response.
By the end of the studies, cells on the µDDGH displaced an average of 41.1±12.3 µm
(n = 30 cells) in the direction of increasing micropost stiffness (Fig. 2.13a). The increase in
average BAEC displacement was significantly larger compared to both the CC (p < 0.01) and the
CE (p < 0.01), but it was not statistically discernable from the µDDGL results (p = 0.15)
(Fig. 2.13a). The proportion of final cell displacements in the Y-axis direction compared to the
stiffer X-axis of increasing micropost stiffness was the lowest for the µDDGH compared to all of
the substrates tested (Fig. 2.12). Specifically, 10% (3 from a total of 30) of BAECs exhibited a
final displacement within ±30º of the positive or negative Y-axis (Fig. 2.12e – B). In contrast,
the proportion of BAECs on the µDDGH exhibiting a final displacement within ±60º of the
direction of increasing micropost stiffness was 73% (22 from a total of 30) (Fig. 2.12e – A).
At the end of the studies, 77% (23 from a total of 30) of BAECs exhibited displacement in the
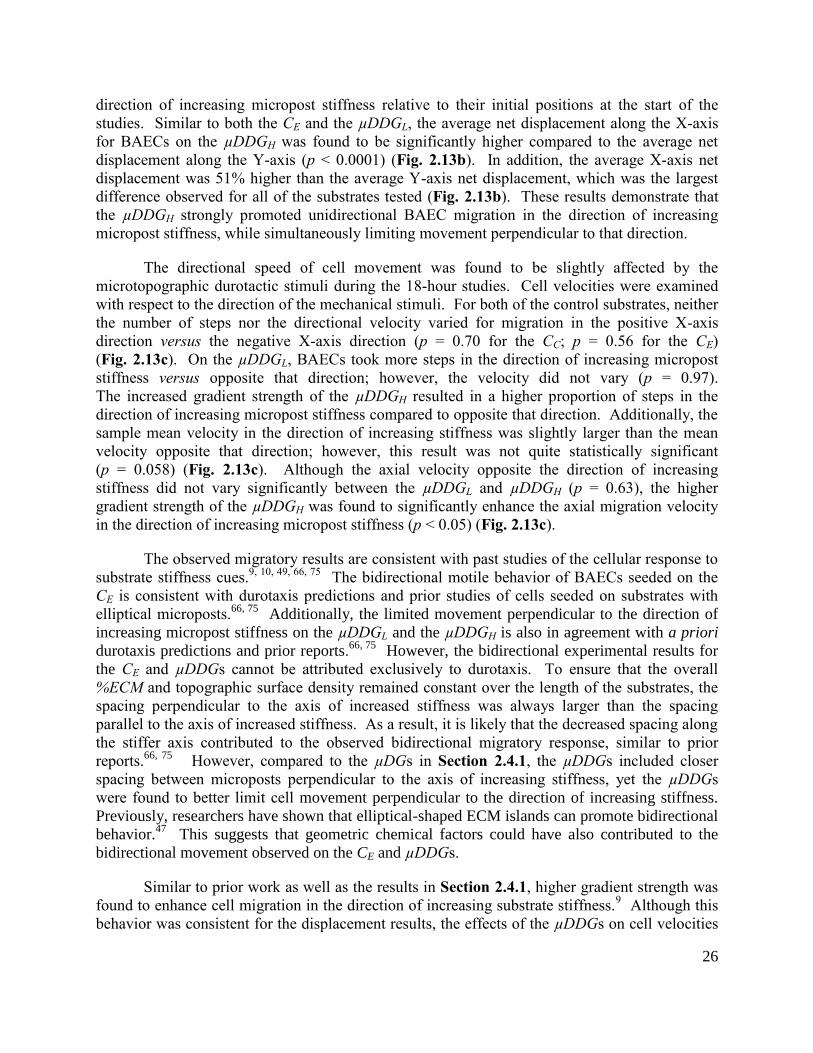
26
direction of increasing micropost stiffness relative to their initial positions at the start of the
studies. Similar to both the CE and the µDDGL, the average net displacement along the X-axis
for BAECs on the µDDGH was found to be significantly higher compared to the average net
displacement along the Y-axis (p < 0.0001) (Fig. 2.13b). In addition, the average X-axis net
displacement was 51% higher than the average Y-axis net displacement, which was the largest
difference observed for all of the substrates tested (Fig. 2.13b). These results demonstrate that
the µDDGH strongly promoted unidirectional BAEC migration in the direction of increasing
micropost stiffness, while simultaneously limiting movement perpendicular to that direction.
The directional speed of cell movement was found to be slightly affected by the
microtopographic durotactic stimuli during the 18-hour studies. Cell velocities were examined
with respect to the direction of the mechanical stimuli. For both of the control substrates, neither
the number of steps nor the directional velocity varied for migration in the positive X-axis
direction versus the negative X-axis direction (p = 0.70 for the CC; p = 0.56 for the CE)
(Fig. 2.13c). On the µDDGL, BAECs took more steps in the direction of increasing micropost
stiffness versus opposite that direction; however, the velocity did not vary (p = 0.97).
The increased gradient strength of the µDDGH resulted in a higher proportion of steps in the
direction of increasing micropost stiffness compared to opposite that direction. Additionally, the
sample mean velocity in the direction of increasing stiffness was slightly larger than the mean
velocity opposite that direction; however, this result was not quite statistically significant
(p = 0.058) (Fig. 2.13c). Although the axial velocity opposite the direction of increasing
stiffness did not vary significantly between the µDDGL and µDDGH (p = 0.63), the higher
gradient strength of the µDDGH was found to significantly enhance the axial migration velocity
in the direction of increasing micropost stiffness (p < 0.05) (Fig. 2.13c).
The observed migratory results are consistent with past studies of the cellular response to
substrate stiffness cues.9, 10, 49, 66, 75
The bidirectional motile behavior of BAECs seeded on the
CE is consistent with durotaxis predictions and prior studies of cells seeded on substrates with
elliptical microposts.66, 75
Additionally, the limited movement perpendicular to the direction of
increasing micropost stiffness on the µDDGL and the µDDGH is also in agreement with a priori
durotaxis predictions and prior reports.66, 75
However, the bidirectional experimental results for
the CE and µDDGs cannot be attributed exclusively to durotaxis. To ensure that the overall
%ECM and topographic surface density remained constant over the length of the substrates, the
spacing perpendicular to the axis of increased stiffness was always larger than the spacing
parallel to the axis of increased stiffness. As a result, it is likely that the decreased spacing along
the stiffer axis contributed to the observed bidirectional migratory response, similar to prior
reports.66, 75
However, compared to the µDGs in Section 2.4.1, the µDDGs included closer
spacing between microposts perpendicular to the axis of increasing stiffness, yet the µDDGs
were found to better limit cell movement perpendicular to the direction of increasing stiffness.
Previously, researchers have shown that elliptical-shaped ECM islands can promote bidirectional
behavior.47
This suggests that geometric chemical factors could have also contributed to the
bidirectional movement observed on the CE and µDDGs.
Similar to prior work as well as the results in Section 2.4.1, higher gradient strength was
found to enhance cell migration in the direction of increasing substrate stiffness.9 Although this
behavior was consistent for the displacement results, the effects of the µDDGs on cell velocities
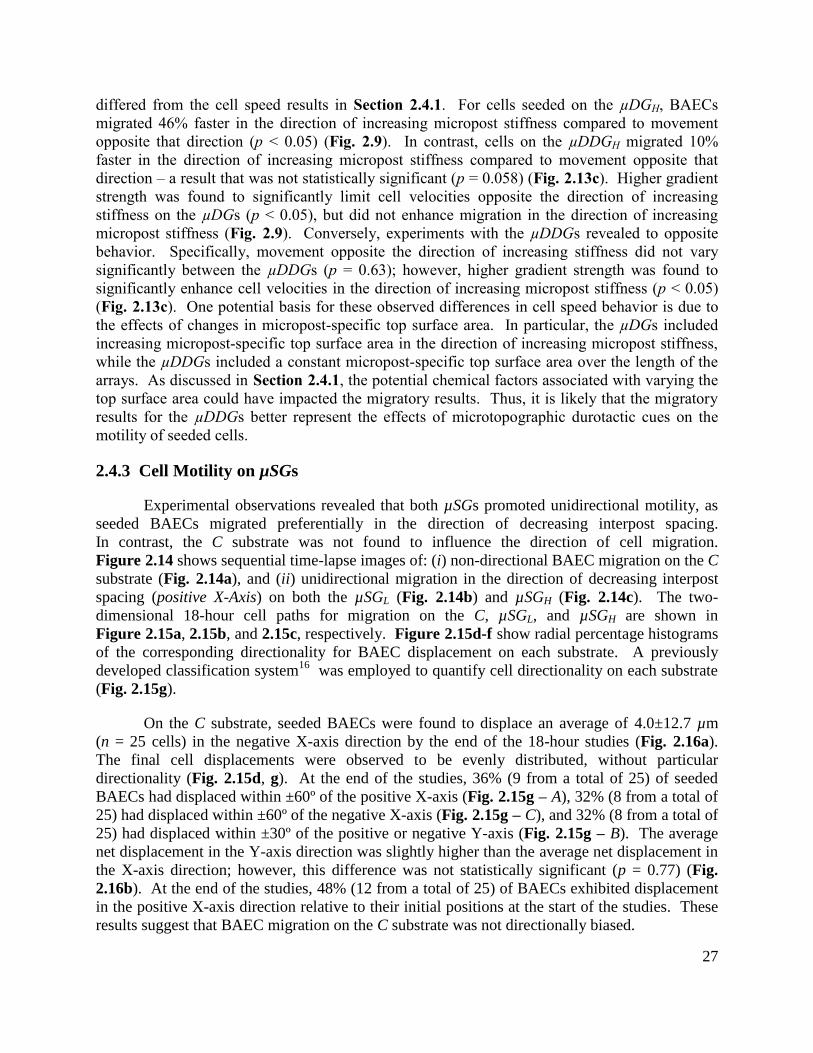
27
differed from the cell speed results in Section 2.4.1. For cells seeded on the µDGH, BAECs
migrated 46% faster in the direction of increasing micropost stiffness compared to movement
opposite that direction (p < 0.05) (Fig. 2.9). In contrast, cells on the µDDGH migrated 10%
faster in the direction of increasing micropost stiffness compared to movement opposite that
direction – a result that was not statistically significant (p = 0.058) (Fig. 2.13c). Higher gradient
strength was found to significantly limit cell velocities opposite the direction of increasing
stiffness on the µDGs (p < 0.05), but did not enhance migration in the direction of increasing
micropost stiffness (Fig. 2.9). Conversely, experiments with the µDDGs revealed to opposite
behavior. Specifically, movement opposite the direction of increasing stiffness did not vary
significantly between the µDDGs (p = 0.63); however, higher gradient strength was found to
significantly enhance cell velocities in the direction of increasing micropost stiffness (p < 0.05)
(Fig. 2.13c). One potential basis for these observed differences in cell speed behavior is due to
the effects of changes in micropost-specific top surface area. In particular, the µDGs included
increasing micropost-specific top surface area in the direction of increasing micropost stiffness,
while the µDDGs included a constant micropost-specific top surface area over the length of the
arrays. As discussed in Section 2.4.1, the potential chemical factors associated with varying the
top surface area could have impacted the migratory results. Thus, it is likely that the migratory
results for the µDDGs better represent the effects of microtopographic durotactic cues on the
motility of seeded cells.
2.4.3 Cell Motility on µSGs
Experimental observations revealed that both µSGs promoted unidirectional motility, as
seeded BAECs migrated preferentially in the direction of decreasing interpost spacing.
In contrast, the C substrate was not found to influence the direction of cell migration.
Figure 2.14 shows sequential time-lapse images of: (i) non-directional BAEC migration on the C
substrate (Fig. 2.14a), and (ii) unidirectional migration in the direction of decreasing interpost
spacing (positive X-Axis) on both the µSGL (Fig. 2.14b) and µSGH (Fig. 2.14c). The two-
dimensional 18-hour cell paths for migration on the C, µSGL, and µSGH are shown in
Figure 2.15a, 2.15b, and 2.15c, respectively. Figure 2.15d-f show radial percentage histograms
of the corresponding directionality for BAEC displacement on each substrate. A previously
developed classification system16
was employed to quantify cell directionality on each substrate
(Fig. 2.15g).
On the C substrate, seeded BAECs were found to displace an average of 4.0±12.7 µm
(n = 25 cells) in the negative X-axis direction by the end of the 18-hour studies (Fig. 2.16a).
The final cell displacements were observed to be evenly distributed, without particular
directionality (Fig. 2.15d, g). At the end of the studies, 36% (9 from a total of 25) of seeded
BAECs had displaced within ±60º of the positive X-axis (Fig. 2.15g – A), 32% (8 from a total of
25) had displaced within ±60º of the negative X-axis (Fig. 2.15g – C), and 32% (8 from a total of
25) had displaced within ±30º of the positive or negative Y-axis (Fig. 2.15g – B). The average
net displacement in the Y-axis direction was slightly higher than the average net displacement in
the X-axis direction; however, this difference was not statistically significant (p = 0.77) (Fig.
2.16b). At the end of the studies, 48% (12 from a total of 25) of BAECs exhibited displacement
in the positive X-axis direction relative to their initial positions at the start of the studies. These
results suggest that BAEC migration on the C substrate was not directionally biased.
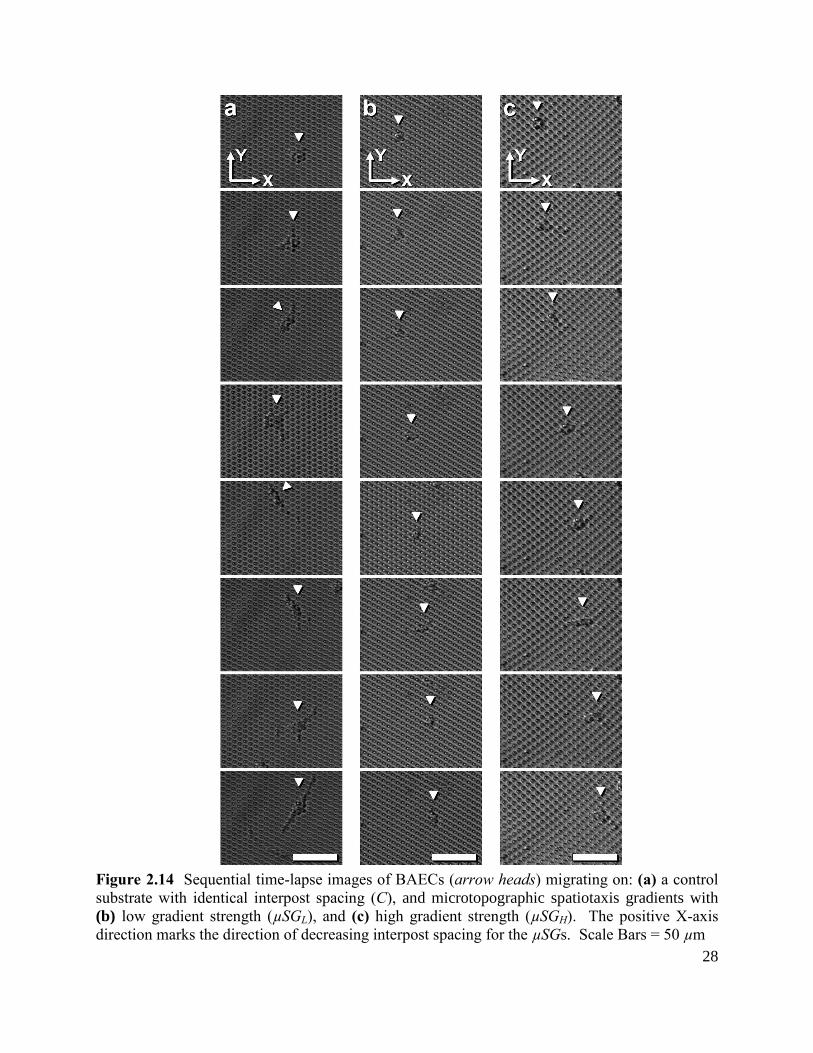
28
Figure 2.14 Sequential time-lapse images of BAECs (arrow heads) migrating on: (a) a control
substrate with identical interpost spacing (C), and microtopographic spatiotaxis gradients with
(b) low gradient strength (µSGL), and (c) high gradient strength (µSGH). The positive X-axis
direction marks the direction of decreasing interpost spacing for the µSGs. Scale Bars = 50 µm
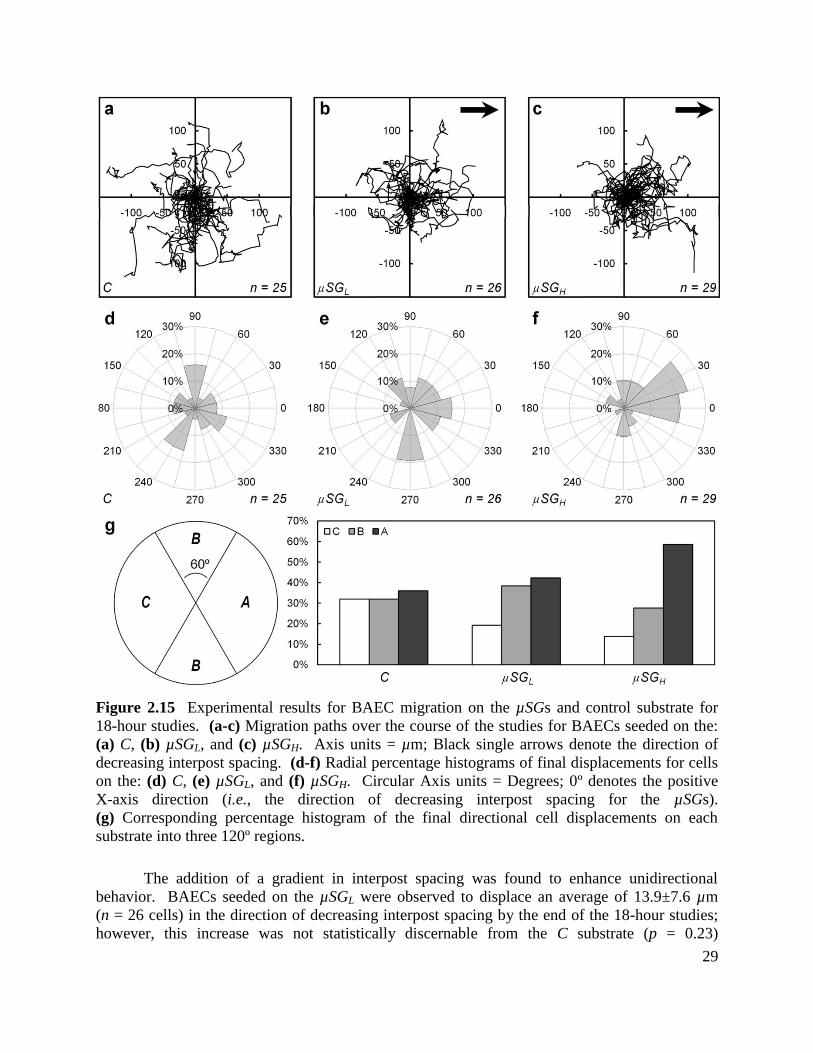
29
Figure 2.15 Experimental results for BAEC migration on the µSGs and control substrate for
18-hour studies. (a-c) Migration paths over the course of the studies for BAECs seeded on the:
(a) C, (b) µSGL, and (c) µSGH. Axis units = µm; Black single arrows denote the direction of
decreasing interpost spacing. (d-f) Radial percentage histograms of final displacements for cells
on the: (d) C, (e) µSGL, and (f) µSGH. Circular Axis units = Degrees; 0º denotes the positive
X-axis direction (i.e., the direction of decreasing interpost spacing for the µSGs).
(g) Corresponding percentage histogram of the final directional cell displacements on each
substrate into three 120º regions.
The addition of a gradient in interpost spacing was found to enhance unidirectional
behavior. BAECs seeded on the µSGL were observed to displace an average of 13.9±7.6 µm
(n = 26 cells) in the direction of decreasing interpost spacing by the end of the 18-hour studies;
however, this increase was not statistically discernable from the C substrate (p = 0.23) a
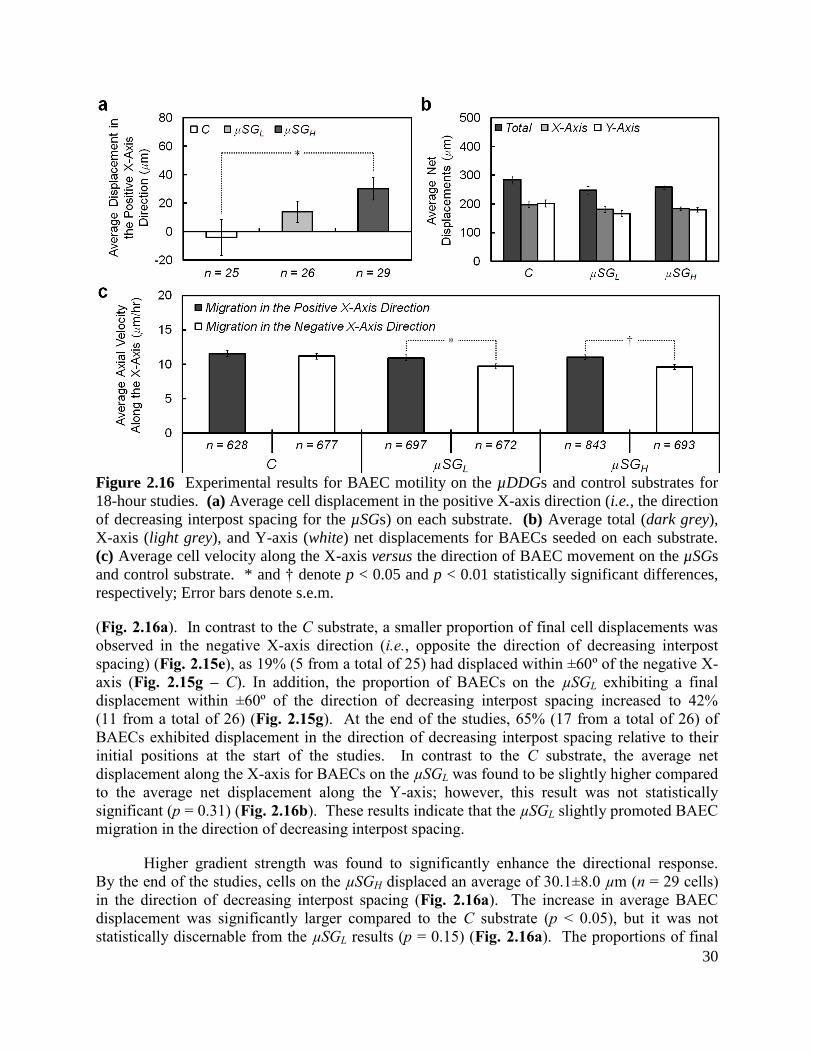
30
Figure 2.16 Experimental results for BAEC motility on the µDDGs and control substrates for
18-hour studies. (a) Average cell displacement in the positive X-axis direction (i.e., the direction
of decreasing interpost spacing for the µSGs) on each substrate. (b) Average total (dark grey),
X-axis (light grey), and Y-axis (white) net displacements for BAECs seeded on each substrate.
(c) Average cell velocity along the X-axis versus the direction of BAEC movement on the µSGs
and control substrate. * and † denote p < 0.05 and p < 0.01 statistically significant differences,
respectively; Error bars denote s.e.m.
(Fig. 2.16a). In contrast to the C substrate, a smaller proportion of final cell displacements was
observed in the negative X-axis direction (i.e., opposite the direction of decreasing interpost
spacing) (Fig. 2.15e), as 19% (5 from a total of 25) had displaced within ±60º of the negative X-
axis (Fig. 2.15g – C). In addition, the proportion of BAECs on the µSGL exhibiting a final
displacement within ±60º of the direction of decreasing interpost spacing increased to 42%
(11 from a total of 26) (Fig. 2.15g). At the end of the studies, 65% (17 from a total of 26) of
BAECs exhibited displacement in the direction of decreasing interpost spacing relative to their
initial positions at the start of the studies. In contrast to the C substrate, the average net
displacement along the X-axis for BAECs on the µSGL was found to be slightly higher compared
to the average net displacement along the Y-axis; however, this result was not statistically
significant (p = 0.31) (Fig. 2.16b). These results indicate that the µSGL slightly promoted BAEC
migration in the direction of decreasing interpost spacing.
Higher gradient strength was found to significantly enhance the directional response.
By the end of the studies, cells on the µSGH displaced an average of 30.1±8.0 µm (n = 29 cells)
in the direction of decreasing interpost spacing (Fig. 2.16a). The increase in average BAEC
displacement was significantly larger compared to the C substrate (p < 0.05), but it was not
statistically discernable from the µSGL results (p = 0.15) (Fig. 2.16a). The proportions of final
31
cell displacements in the Y-axis direction and negative X-axis direction (i.e., opposite the
direction of decreasing interpost spacing) were the lowest for the µSGH compared to all of the
substrates tested (Fig. 2.15d-g). Specifically, 28% (8 from a total of 29) of seeded BAECs had
displaced within ±30º of the Y-axis (Fig. 2.15g – B), and 14% (4 from a total of 29) had
displaced within ±60º of the negative X-axis (Fig. 2.15g – C). At the end of the studies, 76%
(22 from a total of 29) of BAECs exhibited displacement in the direction of decreasing interpost
spacing relative to their initial positions at the start of the studies. Similar to the µSGL,
the average net displacement along the X-axis for BAECs on the µSGH was found to be slightly
higher compared to the average net displacement along the Y-axis, but not statistically
significant (p = 0.71) (Fig. 2.16b). These results demonstrate that the µSGH strongly promoted
unidirectional BAEC migration in the direction of decreasing interpost spacing.
The microtopographic spatial stimuli were found to significantly affect the directional
speed of cell movement during the 18-hour studies. Cell velocities were examined with respect
to the direction of the spatial cues. For the C substrate, although the number of steps in the
positive X-axis direction was lower compared to the number of steps opposite that direction,
the mean axial velocity in the positive X-axis direction was slightly higher, but not significantly
(p = 0.53) (Fig. 2.16c). On the µSGL, BAECs took a higher number of steps in the direction of
decreasing interpost spacing versus opposite that direction, and migrated faster in the direction of
decreasing interpost spacing (p < 0.05) (Fig. 2.16c). Higher gradient strength further enhanced
this response as BAECs on the µSGH migrated 15% faster during movement in the direction of
decreasing interpost spacing, while also taking 22% more steps in the direction of decreasing
interpost spacing versus opposite that direction (Fig. 2.16c). Thus, not only did BAECs on the
µSGs migrate more often in the direction of decreasing interpost spacing, they also exhibited
higher cell velocities in that same direction.
At present, the specific mechanisms underlying the spatiotaxis migratory response remain
unclear. One potential basis for this behavior is that variable interpost spacing may impact the
location where the leading cellular protrusion stabilizes. During cell movement, the migration
direction is dictated by the establishment of a single, dominant protrusion anchored to the
substratum; however, protrusive activity is a stochastic and dynamic process.77
Thus, differences
in interpost spacing could result in a higher probability of motile cells first contacting and
forming adhesions onto comparatively closer microposts. As a result, cellular protrusions could
more readily stabilize in the direction of decreasing interpost spacing, thereby influencing the
direction of migration. Spatiotactic behavior could also be attributed to intracellular energy
optimization. Protrusive activity is an energy intensive process, and the length of cellular
protrusions is related to the polymerization of actin monomers, which are transported to the
leading edge of protrusive sites.44, 78
Thus, generating shorter leading protrusions would reduce
the energy needed for actin transport and polymerization, thereby rendering anchorage and
migration to closer microfeatures energetically favorable. These potential mechanisms
underlying the spatiotaxis phenomenon could also contribute to the bidirectional movement cells
exhibit on microgrooved substrates.27, 69
32
2.4.4 Cell Motility on the µDSGs
Experimental observations revealed that changes in micropost spacing significantly
affected the mechanical response of seeded BAECs. In contrast to the experimental results for
BAECs seeded on the µDGL in Section 2.4.1, the addition of variable interpost spacing was
found to significantly offset the durotactic response (p < 0.05). For example, Fig. 2.17a shows
sequential time-lapse images of a BAEC (white arrows) migrating in the direction of decreasing
interpost spacing (black arrow), opposite the direction of increasing micropost stiffness.
The two-dimensional 18-hour cell paths for 38 BAECs seeded on the µDSG are shown in
Fig. 2.17b. Although cells were observed to migrate throughout the course of the experiments
(Fig. 2.17c), directional biases were not observed initially (Fig. 2.17d). However, by the end of
the studies, seeded BAECs were found to displace an average of 9.6±7.3 µm in the direction of
decreasing interpost spacing (Fig. 2.17d). The maximum observed displacements during the
studies were 149 µm for cell movement in the direction of decreasing interpost spacing, and
115 µm for displacement opposite that direction. In contrast, lateral migration did not appear to
be biased, as BAECs exhibited a final average displacement of 4.2±11.5 µm perpendicular to the
axis of decreasing interpost spacing (Fig. 2.17e). At the end of the studies, 61% (23 from a total
of 38) of BAECs exhibited displacement in the direction of decreasing interpost spacing relative
to their initial positions at the start of the study.
The speed of cell movement was also found to be influenced by variable micropost
spacing. In Section 2.4.1, cells seeded on the µDGL (with only mechanical cues) exhibited
average speeds of 7.5±0.5 µm/hr for movement in the direction of increasing stiffness, and
6.6±0.5 µm/hr during migration opposite that direction. The addition of variable interpost
spacing appeared to reverse this trend. During the 18-hour cell studies, the average speed of
BAEC migration was 5.42±0.36 µm/hr for movement in the direction of decreasing interpost
spacing. In contrast, for migration opposite that direction, BAECs exhibited an average speed of
4.67±0.31 µm/hr; however, this difference was not statistically significant (p = 0.12).
The experimental results suggest that changes in micropost spacing can limit and even
counteract the effects of microtopographic mechanical stimuli. Although the spatial stimuli
appeared to be the dominant migratory cue overall, there remained periods where migration was
observed opposite the direction of decreasing spacing (Fig. 2.17d). It is possible that this
behavior was due to the opposing mechanical stimuli. Increasingly the post-to-post spacing
increment could further enhance the effects of the spatial cues; however, further study is needed
to elucidate the effects of spacing gradient strength on the mechanical migratory response.
On the µDSG, BAECs were observed to migrate in the direction of decreasing interpost
spacing, rather than in the direction of the mechanical cues (i.e., in the direction of increasing
micropost stiffness). At present, the specific mechanisms underlying this migratory response
remain unclear; however, the effects of the different migratory cues on cell motility could be
related to the order of locomotive processes. The basis for controlling cellular movement on
each microtopographic gradient can be attributed to the capability of manipulating distinct steps
of the locomotive process, with the µSGs and µDGs influencing membrane extension and
substrate adhesion, respectively. As discussed in Section 2.4.3, one potential basis for
spatiotactic behavior is the effect of variable spacing on the location where the leading protrusion a
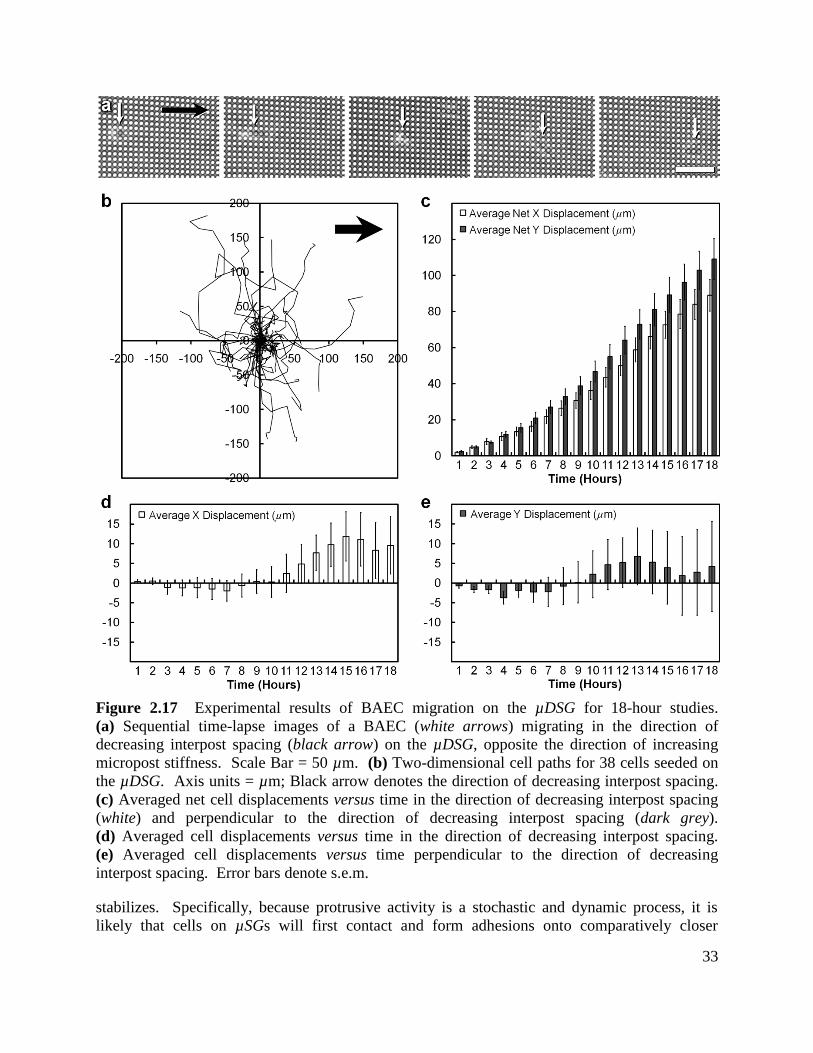
33
Figure 2.17 Experimental results of BAEC migration on the µDSG for 18-hour studies.
(a) Sequential time-lapse images of a BAEC (white arrows) migrating in the direction of
decreasing interpost spacing (black arrow) on the µDSG, opposite the direction of increasing
micropost stiffness. Scale Bar = 50 µm. (b) Two-dimensional cell paths for 38 cells seeded on
the µDSG. Axis units = µm; Black arrow denotes the direction of decreasing interpost spacing.
(c) Averaged net cell displacements versus time in the direction of decreasing interpost spacing
(white) and perpendicular to the direction of decreasing interpost spacing (dark grey).
(d) Averaged cell displacements versus time in the direction of decreasing interpost spacing.
(e) Averaged cell displacements versus time perpendicular to the direction of decreasing
interpost spacing. Error bars denote s.e.m.
stabilizes. Specifically, because protrusive activity is a stochastic and dynamic process, it is
likely that cells on µSGs will first contact and form adhesions onto comparatively closer
34
microposts. On the µDGs, relatively stronger adhesive contacts can be formed on stiffer
microposts compared to softer microposts.14
This behavior would enhance cellular attachment to
stiffer microposts while simultaneously facilitating detachment from softer microposts, and
could account for the observed migration in the direction of increasing micropost stiffness in
Section 2.4.1 and Section 2.4.2. On the µDSG, because relatively longer protrusions are
required for cells to reach microposts in the direction of increasing micropost stiffness, the
formation of new adhesive contacts on stiffer microposts is limited initially (i.e., until after
membrane extension has occurred). Such factors could provide an explanation as to why the
spatial cues dominated the durotactic response on the µDSG. Although the overall %ECM was
held constant throughout the µDSG, one caveat to the experimental results is that the micropost-
specific top surface area increased from post-to-post as the radii were increased. As discussed in
Section 2.4.1, this would increase the potential for chemical (i.e., haptotactic) cues to promote
migration in the direction of increasing micropost stiffness. Thus, if such cues did affect BAEC
migration, the spatiotactic response would in fact be more robust than observed.
35
Chapter 3: Arrayed Microposts for Microparticle Handling in
Microfluidic Systems
3.1 Introduction
3.1.1 Particulate-Handling in Microfluidic Systems
Microfluidic particulate-based microarrays offer an ideal platform for chemical and
biological applications, including quantitative cell biology, cellular investigations, medical
diagnostics, drug screening, and molecular detection; thus, precision hydrodynamic controls of
microparticles (e.g., cells and microbeads) are in critical demand.1, 79
System miniaturization
results in a variety of benefits, including high surface-to-volume ratios, low reagent volumes, and
rapid diffusion times. As a result, there has been significant development of dynamic
microarrays, which are characterized by the loading of microparticle suspensions into
microfluidic systems.80-83
To benefit from the advantages of dynamic microarray platforms,
researchers have utilized diverse techniques to: (i) transport, immobilize, and array both living
cells and microbeads in microfluidic systems, (ii) mix microparticles with multiple fluidic
reagents and washes, and (iii) release cells and microbeads from microarrays.30-37, 40-43, 80-85
Through improved microparticle handling, multiplexed reactions could be implemented in
microfluidic platforms to increase throughput for particulate-based microarrays.86-88
Hydrodynamic methods, which enable the transportation and immobilization of high numbers of
suspended microparticles via passive fluidic forces, are ideally suited for handling cells and
microbeads in microfluidic systems.38, 81
3.1.2 Arraying Microparticles via Hydrodynamic Techniques
Previously, researchers have developed a variety of hydrodynamic methods for arraying
microparticles in designated trapping locations. In particular, microwell arrays, which involve
loading microparticle suspensions and allowing the particles to settle into microfabricated wells,
have been widely used to array cells30-33
and microbeads.89, 90
Di Carlo et al. designed pachinko-
style elevated U-shaped weir structures to array living cells34, 35
– a technique that has been
adapted to corral cells40, 41
and for cellular pairing applications.36
In contrast to the aforementioned two-layer techniques, researchers have also developed
single-layer hydrodynamic arraying methods that bypass the limitations (e.g., time and labor)
associated with multi-layer microfabrication processes. For example, Tan and Takeuchi
presented a microfluidic system consisting of trapping channels that cross a meander-shaped
main channel to array microbeads81
and hydrogel-encapsulated cells.37
In this system, a lower
fluidic resistance through a vacant trap results in particle trapping. After a microparticle is
trapped, the resistance across the trap increases, which causes subsequent particles to bypass
occupied trapping sites.81
This technique has also been adapted to achieve long-term trapping of
single cells,91
and for pairing of both microbeads92
and cells.39, 93
36
3.1.3 Multi-Stage Fluidic Reactions and Analyses in Particulate-Based Microarrays
Previously, particulate-based assays have been developed to achieve microfluidic mixing
and visualization with either mobile or non-mobile microparticles. For mobile (i.e., dynamic)
particulate-based microarrays, microparticles suspended in solution undergo microfluidic mixing
with reagents and are then visualized dynamically (e.g., via flow cytometry) for detection.87, 94
In such systems, the microparticles are never immobilized during the fluidic reaction process.
In contrast, non-mobile (i.e., fixed) particulate-based arrays consist of cells or microbeads that
are first immobilized in microfluidic systems (e.g., using microwells or weir structures), and then
fluidic reagents are delivered to the non-mobile particles.1, 33-35, 95-99
The efficacy of dynamic
particulate-based microarrays could be further extended by incorporating these two techniques
into a single system capable of achieving: (i) dynamic mixing of mobile microparticles with
distinct reagents, and then (ii) microparticle immobilization for visualization and signal
detection. By integrating controlled microfluidic mixing of suspended microparticles with
hydrodynamic particulate arraying techniques, such microfluidic platforms could offer a low-
cost alternative to more complex flow cytometry-based methods, for applications including
point-of-care (POC) diagnostics and on-site bio-chemical analysis.100, 101
3.1.4 Releasing Arrayed Microparticles in Microfluidic Systems
Historically, researchers have focused primarily on arraying microparticles
(e.g., cells and microbeads) in microfluidic systems.30-35
Recently however, research has shifted
toward enabling full microarray resettability after particle trapping.42, 43, 102
Resettable
microfluidic systems can significantly reduce limitations associated with one-time-use devices,
particularly in terms of the cost, time, and labor required to fabricate a new device for each
particulate-based experiment.43
Additionally, fully resettable microarrays enable the rapid
retrieval of high numbers of microparticles, which can then be used for analysis or in subsequent
experiments.42
An ideal resettable dynamic microarray architecture would facilitate: (i) the release of all
arrayed microparticles, (ii) high trapping efficiencies and yields, (iii) high trapping densities of
individual particles (i.e., without particle-particle contact), and (iv) simplified processes
associated with device fabrication and operation. Despite considerable progress, simultaneously
achieving these goals has remained a significant challenge. Previously, researchers have
implemented a variety of techniques to achieve microarray resettability. To release
microparticles from the Tan and Takeuchi trapping system during forward flow rates,
microbubbles generated via laser-induced heating of aluminum plates have been used to displace
cells37
and microbeads81
from trapping positions. This technique is advantageous for releasing
individual microparticles of interest; however, thermal bubble generation is inefficient for
resetting an entire microarray (i.e., with hundreds of arrayed microparticles). Thus, researchers
in the Takeuchi group have further adapted the Tan and Takeuchi trapping system (see
Section 3.1.2) to enable full microarray resettability during reverse (alternatively, backward)
flow.42, 102
By using microfeature-based obstacles, Iwai et al. varied experimental parameters to
demonstrate bead-based systems with: (i) a 93% trapping rate and an 85% releasing rate, and
(ii) a 100% trapping rate and a 77% releasing rate. Additionally, the system facilitated an
approximate trapping density of 100 microbeads (15 µm in diameter) in a 0.75 mm2 area.
42
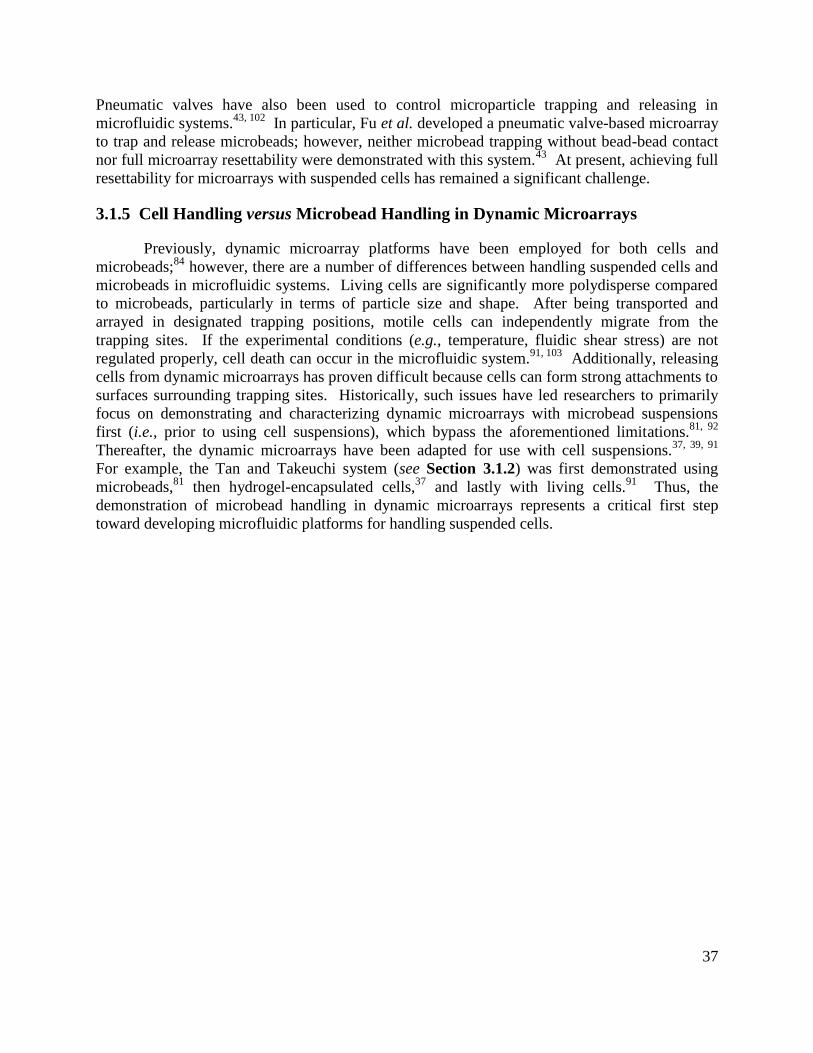
37
Pneumatic valves have also been used to control microparticle trapping and releasing in
microfluidic systems.43, 102
In particular, Fu et al. developed a pneumatic valve-based microarray
to trap and release microbeads; however, neither microbead trapping without bead-bead contact
nor full microarray resettability were demonstrated with this system.43
At present, achieving full
resettability for microarrays with suspended cells has remained a significant challenge.
3.1.5 Cell Handling versus Microbead Handling in Dynamic Microarrays
Previously, dynamic microarray platforms have been employed for both cells and
microbeads;84
however, there are a number of differences between handling suspended cells and
microbeads in microfluidic systems. Living cells are significantly more polydisperse compared
to microbeads, particularly in terms of particle size and shape. After being transported and
arrayed in designated trapping positions, motile cells can independently migrate from the
trapping sites. If the experimental conditions (e.g., temperature, fluidic shear stress) are not
regulated properly, cell death can occur in the microfluidic system.91, 103
Additionally, releasing
cells from dynamic microarrays has proven difficult because cells can form strong attachments to
surfaces surrounding trapping sites. Historically, such issues have led researchers to primarily
focus on demonstrating and characterizing dynamic microarrays with microbead suspensions
first (i.e., prior to using cell suspensions), which bypass the aforementioned limitations.81, 92
Thereafter, the dynamic microarrays have been adapted for use with cell suspensions.37, 39, 91
For example, the Tan and Takeuchi system (see Section 3.1.2) was first demonstrated using
microbeads,81
then hydrogel-encapsulated cells,37
and lastly with living cells.91
Thus, the
demonstration of microbead handling in dynamic microarrays represents a critical first step
toward developing microfluidic platforms for handling suspended cells.
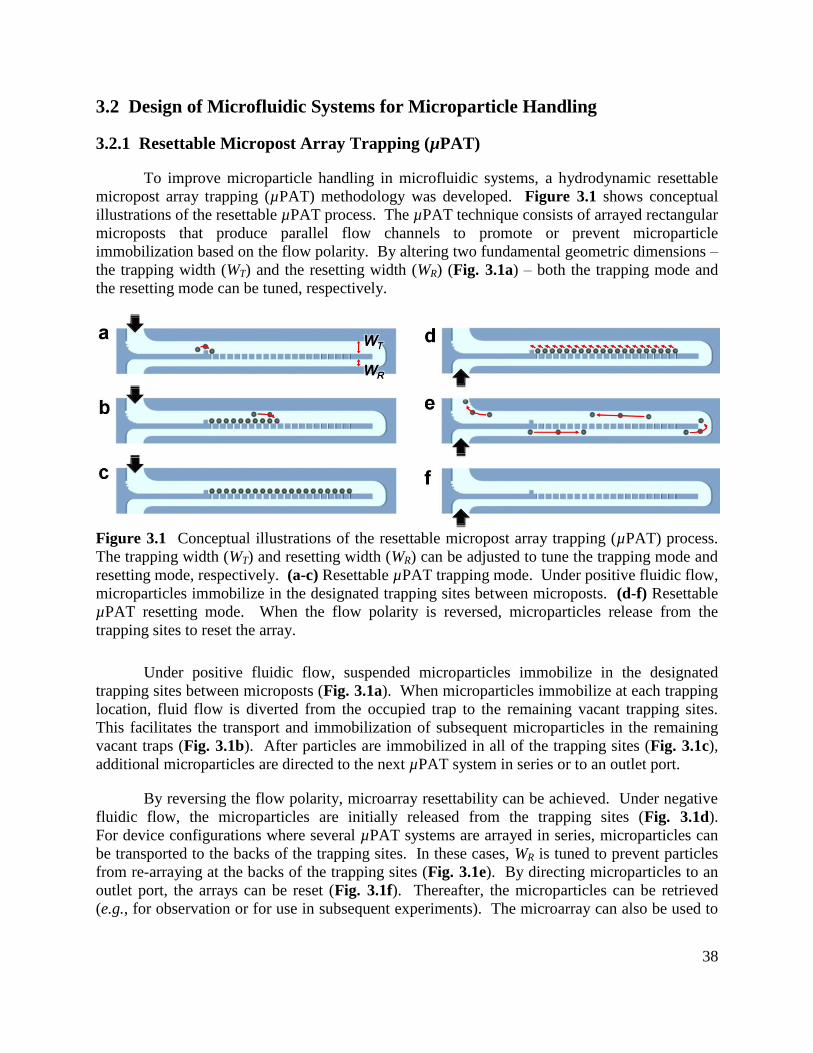
38
3.2 Design of Microfluidic Systems for Microparticle Handling
3.2.1 Resettable Micropost Array Trapping (µPAT)
To improve microparticle handling in microfluidic systems, a hydrodynamic resettable
micropost array trapping (µPAT) methodology was developed. Figure 3.1 shows conceptual
illustrations of the resettable µPAT process. The µPAT technique consists of arrayed rectangular
microposts that produce parallel flow channels to promote or prevent microparticle
immobilization based on the flow polarity. By altering two fundamental geometric dimensions –
the trapping width (WT) and the resetting width (WR) (Fig. 3.1a) – both the trapping mode and
the resetting mode can be tuned, respectively.
Figure 3.1 Conceptual illustrations of the resettable micropost array trapping (µPAT) process.
The trapping width (WT) and resetting width (WR) can be adjusted to tune the trapping mode and
resetting mode, respectively. (a-c) Resettable µPAT trapping mode. Under positive fluidic flow,
microparticles immobilize in the designated trapping sites between microposts. (d-f) Resettable
µPAT resetting mode. When the flow polarity is reversed, microparticles release from the
trapping sites to reset the array.
Under positive fluidic flow, suspended microparticles immobilize in the designated
trapping sites between microposts (Fig. 3.1a). When microparticles immobilize at each trapping
location, fluid flow is diverted from the occupied trap to the remaining vacant trapping sites.
This facilitates the transport and immobilization of subsequent microparticles in the remaining
vacant traps (Fig. 3.1b). After particles are immobilized in all of the trapping sites (Fig. 3.1c),
additional microparticles are directed to the next µPAT system in series or to an outlet port.
By reversing the flow polarity, microarray resettability can be achieved. Under negative
fluidic flow, the microparticles are initially released from the trapping sites (Fig. 3.1d).
For device configurations where several µPAT systems are arrayed in series, microparticles can
be transported to the backs of the trapping sites. In these cases, WR is tuned to prevent particles
from re-arraying at the backs of the trapping sites (Fig. 3.1e). By directing microparticles to an
outlet port, the arrays can be reset (Fig. 3.1f). Thereafter, the microparticles can be retrieved
(e.g., for observation or for use in subsequent experiments). The microarray can also be used to
39
perform additional experiments with new sets of microbeads or cells, thereby enabling the use of
a single microdevice for multiple particulate-based experiments.
3.2.2 A Dynamic Microarray with µPAT for Parallel DNA Detection
To demonstrate a dynamic particulate-based microarray that integrates both microfluidic
mixing of mobile (i.e., suspended) particles and hydrodynamic microparticle arraying
capabilities on a single chip, a microfluidic system was designed for simultaneously detecting
multiple bio-molecules in parallel using microbeads. Specifically, the system was developed to
detect single nucleotide polymorphisms (SNPs) for single-stranded DNA (ssDNA)
oligonucleotide sequences via molecular beacon probes (MBs) conjugated to polystyrene
microbead substrates.
The advancement of microfluidic platforms for surface-based biochemical assays impacts
a broad range of biomedical fields, including genomics, proteomics, drug discovery, and
molecular diagnostics.82, 104
Bead-based microfluidic platforms have attracted significant
attention in recent years due to their enhanced reaction kinetics, reduced background noise, and
decreased system costs.80-84, 87, 88
Additionally, microbeads can be functionalized with a variety
of chemicals and bio-molecules to achieve diverse chemical and biological assays
(e.g., immunoassays105
). Previously, MBs have been employed as a detection mechanism for
target bio-molecules, such as cytokines106
and SNPs.107
The MBs used for this study are ssDNA
sequences containing a stem-and-loop structure, with a fluorophore and a quencher molecule on
opposing ends. In the absence of a loop-complementary target DNA oligonucleotide sequence,
the MBs maintain their stem-and-loop structure, which restricts fluorescence via a
Förster Resonance Energy Transfer (FRET) interaction between the fluorophore and quencher
molecules.108-111
In the presence of a loop-complementary target sequence, the loop region of the
MB hybridizes with the DNA oligonucleotide, which dissociates the stem structure.
This conformational change positions the fluorophore and quencher molecules at a distance
where FRET is no longer possible, enabling the fluorophore to fluoresce when excited.108-111
The fluorescence response is reduced as the number of base-pair mismatches increases, thereby
enabling the detection of SNPs for unlabeled DNA analytes.107
Conceptual illustrations of the dynamic microarray architecture and reaction processes
are shown in Figure 3.2. MB-based genotyping is combined with hydrodynamic microbead
arraying to simultaneously detect multiple ssDNA oligonucleotide sequences in parallel.
A suspension of polystyrene microbeads conjugated to an extended streptavidin-based linker and
a solution of biotinylated MBs are loaded separately (Fig. 3.2). Laminar diffusion-based mixing
in the microfluidic channel enables MBs to bind to the surface of the microbead substrates and
maintain a conformation with quenched fluorescence. Via separate inlets, four distinct
homogenous solutions are loaded: (i) Perfect Match (PM) – the target DNA oligonucleotide
sequence, which is perfectly complementary to the MB, (ii) One Mismatch (SNP) – a DNA
oligonucleotide sequence with a single base-pair mismatch to the MB, (iii) Mismatch (MM) –
a DNA oligonucleotide sequence with multiple base-pair mismatches, and (iv) Blank – a negative
control solution of PBS (Table 3.1).87, 112
The MB-microbead solution is distributed to four
microchannels, each mixing independently with a singular DNA or PBS solution (Fig. 3.2).
When the MB-microbead solution is mixed with the PM solution, the complementary target
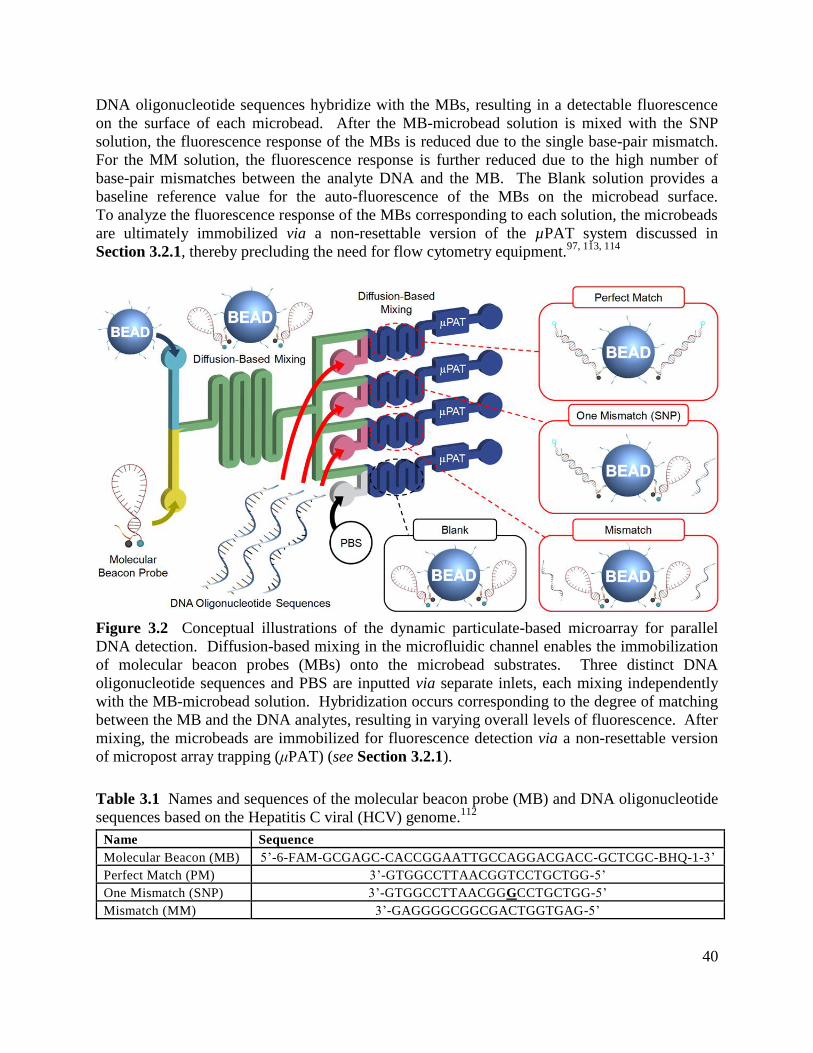
40
DNA oligonucleotide sequences hybridize with the MBs, resulting in a detectable fluorescence
on the surface of each microbead. After the MB-microbead solution is mixed with the SNP
solution, the fluorescence response of the MBs is reduced due to the single base-pair mismatch.
For the MM solution, the fluorescence response is further reduced due to the high number of
base-pair mismatches between the analyte DNA and the MB. The Blank solution provides a
baseline reference value for the auto-fluorescence of the MBs on the microbead surface.
To analyze the fluorescence response of the MBs corresponding to each solution, the microbeads
are ultimately immobilized via a non-resettable version of the µPAT system discussed in
Section 3.2.1, thereby precluding the need for flow cytometry equipment.97, 113, 114
Figure 3.2 Conceptual illustrations of the dynamic particulate-based microarray for parallel
DNA detection. Diffusion-based mixing in the microfluidic channel enables the immobilization
of molecular beacon probes (MBs) onto the microbead substrates. Three distinct DNA
oligonucleotide sequences and PBS are inputted via separate inlets, each mixing independently
with the MB-microbead solution. Hybridization occurs corresponding to the degree of matching
between the MB and the DNA analytes, resulting in varying overall levels of fluorescence. After
mixing, the microbeads are immobilized for fluorescence detection via a non-resettable version
of micropost array trapping (μPAT) (see Section 3.2.1).
Table 3.1 Names and sequences of the molecular beacon probe (MB) and DNA oligonucleotide
sequences based on the Hepatitis C viral (HCV) genome.112
Name Sequence
Molecular Beacon (MB) 5‟-6-FAM-GCGAGC-CACCGGAATTGCCAGGACGACC-GCTCGC-BHQ-1-3‟
Perfect Match (PM) 3‟-GTGGCCTTAACGGTCCTGCTGG-5‟
One Mismatch (SNP) 3‟-GTGGCCTTAACGGGCCTGCTGG-5‟
Mismatch (MM) 3‟-GAGGGGCGGCGACTGGTGAG-5‟

41
3.2.3 ‘Microfluidic Ping Pong’ (MPP) for Multi-Stage Fluidic Reactions Under
Discontinuous Flow Conditions
Although the dynamic microarray presented in Section 3.2.2 was designed to provide
advantages compared to static microarrays (e.g., enhanced diffusion times, the ability to „mix-
and-match‟ microparticles corresponding to different screenings, etc.), the microfluidic platform
included several limitations inherent to the system‟s design. For example, ensuring complete
diffusion-based mixing of reagents corresponding to each reaction-step necessitates significant
device area. By mixing all of the experimental reagents with the suspended microbeads prior to
bead-immobilization, there is a high likelihood that undesired solution-phase binding will occur,
which can decrease assay sensitivity and increase background noise. Additionally, the design
precluded the ability to implement fluidic washes between reaction-steps. Because bead-
immobilization occurs after reaction completion, optical visualization and fluorescence detection
is restricted to only the final step of multi-stage reaction processes. Such issues are prevalent
among current dynamic bead-based microarrays that preclude the need for flow cytometry or
magnetic microbeads. As a result, the use of microfluidic bead-based platforms for achieving
multi-stage reaction processes (e.g., sandwich assays) remains limited. To overcome the
aforementioned limitations, a novel dynamic bead-based microarray platform was designed.
Figure 3.3 Conceptual illustrations of the Microfluidic Ping Pong (MPP) process. The MPP
technique consists of two sets of resettable µPAT components that are mirrored with respect to
each other and connected by a serpentine mixing channel. (Top) For rightward flow
(blue arrows), microparticles: (i) bypass the left-side µPAT arrays, (ii) undergo dynamic mixing
with the inputted solution in the mixing channel, and (iii) immobilize in the right-side µPAT
arrays. (Bottom) By switching the flow polarity to achieve leftward flow (red arrows), this
process is reversed with particles immobilizing in the left-side µPAT arrays. This process can be
repeated continuously by switching the flow polarity as desired to mix the microparticles with
additional reagents and washes.
The Microfluidic Ping Pong (MPP) concept is illustrated in Figure 3.3. In the MPP
system, two sets of resettable µPAT components are mirrored with respect to each other and are
connected via a serpentine microfluidic mixing channel (Fig. 3.3). For rightward flow,
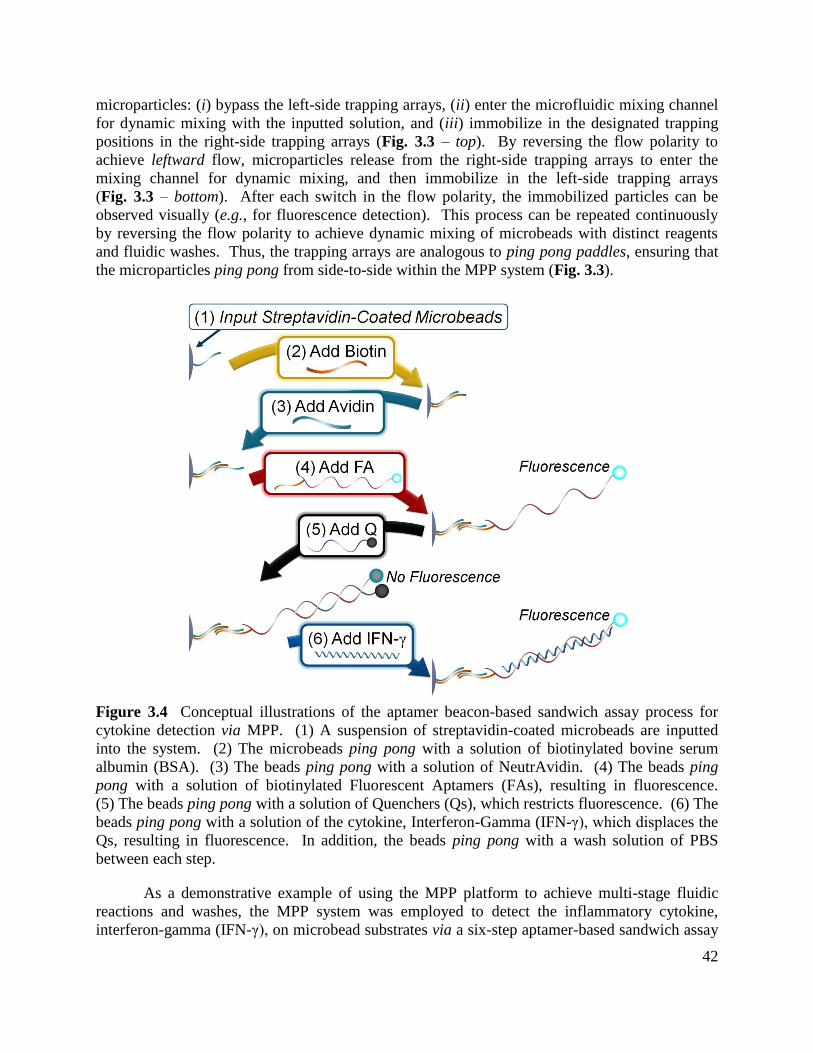
42
microparticles: (i) bypass the left-side trapping arrays, (ii) enter the microfluidic mixing channel
for dynamic mixing with the inputted solution, and (iii) immobilize in the designated trapping
positions in the right-side trapping arrays (Fig. 3.3 – top). By reversing the flow polarity to
achieve leftward flow, microparticles release from the right-side trapping arrays to enter the
mixing channel for dynamic mixing, and then immobilize in the left-side trapping arrays
(Fig. 3.3 – bottom). After each switch in the flow polarity, the immobilized particles can be
observed visually (e.g., for fluorescence detection). This process can be repeated continuously
by reversing the flow polarity to achieve dynamic mixing of microbeads with distinct reagents
and fluidic washes. Thus, the trapping arrays are analogous to ping pong paddles, ensuring that
the microparticles ping pong from side-to-side within the MPP system (Fig. 3.3).
Figure 3.4 Conceptual illustrations of the aptamer beacon-based sandwich assay process for
cytokine detection via MPP. (1) A suspension of streptavidin-coated microbeads are inputted
into the system. (2) The microbeads ping pong with a solution of biotinylated bovine serum
albumin (BSA). (3) The beads ping pong with a solution of NeutrAvidin. (4) The beads ping
pong with a solution of biotinylated Fluorescent Aptamers (FAs), resulting in fluorescence.
(5) The beads ping pong with a solution of Quenchers (Qs), which restricts fluorescence. (6) The
beads ping pong with a solution of the cytokine, Interferon-Gamma (IFN-γ), which displaces the
Qs, resulting in fluorescence. In addition, the beads ping pong with a wash solution of PBS
between each step.
As a demonstrative example of using the MPP platform to achieve multi-stage fluidic
reactions and washes, the MPP system was employed to detect the inflammatory cytokine,
interferon-gamma (IFN-γ), on microbead substrates via a six-step aptamer-based sandwich assay
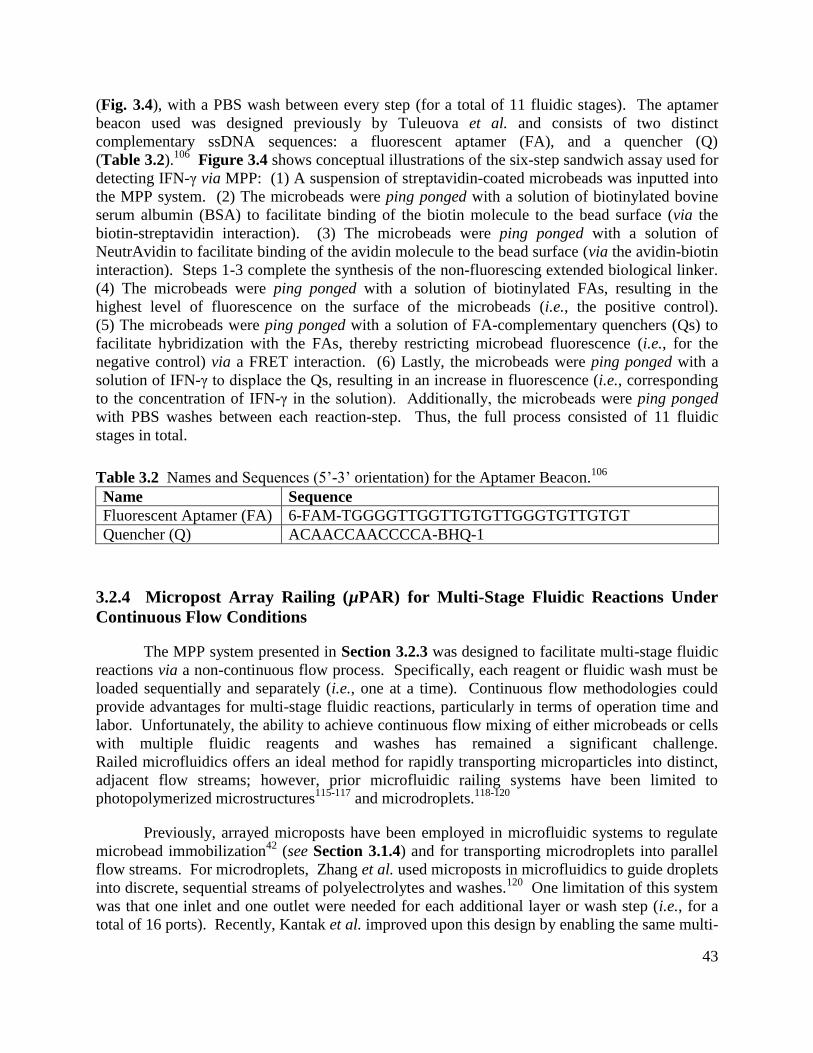
43
(Fig. 3.4), with a PBS wash between every step (for a total of 11 fluidic stages). The aptamer
beacon used was designed previously by Tuleuova et al. and consists of two distinct
complementary ssDNA sequences: a fluorescent aptamer (FA), and a quencher (Q)
(Table 3.2).106
Figure 3.4 shows conceptual illustrations of the six-step sandwich assay used for
detecting IFN-γ via MPP: (1) A suspension of streptavidin-coated microbeads was inputted into
the MPP system. (2) The microbeads were ping ponged with a solution of biotinylated bovine
serum albumin (BSA) to facilitate binding of the biotin molecule to the bead surface (via the
biotin-streptavidin interaction). (3) The microbeads were ping ponged with a solution of
NeutrAvidin to facilitate binding of the avidin molecule to the bead surface (via the avidin-biotin
interaction). Steps 1-3 complete the synthesis of the non-fluorescing extended biological linker.
(4) The microbeads were ping ponged with a solution of biotinylated FAs, resulting in the
highest level of fluorescence on the surface of the microbeads (i.e., the positive control).
(5) The microbeads were ping ponged with a solution of FA-complementary quenchers (Qs) to
facilitate hybridization with the FAs, thereby restricting microbead fluorescence (i.e., for the
negative control) via a FRET interaction. (6) Lastly, the microbeads were ping ponged with a
solution of IFN-γ to displace the Qs, resulting in an increase in fluorescence (i.e., corresponding
to the concentration of IFN-γ in the solution). Additionally, the microbeads were ping ponged
with PBS washes between each reaction-step. Thus, the full process consisted of 11 fluidic
stages in total.
Table 3.2 Names and Sequences (5‟-3‟ orientation) for the Aptamer Beacon.106
Name Sequence
Fluorescent Aptamer (FA) 6-FAM-TGGGGTTGGTTGTGTTGGGTGTTGTGT
Quencher (Q) ACAACCAACCCCA-BHQ-1
3.2.4 Micropost Array Railing (µPAR) for Multi-Stage Fluidic Reactions Under
Continuous Flow Conditions
The MPP system presented in Section 3.2.3 was designed to facilitate multi-stage fluidic
reactions via a non-continuous flow process. Specifically, each reagent or fluidic wash must be
loaded sequentially and separately (i.e., one at a time). Continuous flow methodologies could
provide advantages for multi-stage fluidic reactions, particularly in terms of operation time and
labor. Unfortunately, the ability to achieve continuous flow mixing of either microbeads or cells
with multiple fluidic reagents and washes has remained a significant challenge.
Railed microfluidics offers an ideal method for rapidly transporting microparticles into distinct,
adjacent flow streams; however, prior microfluidic railing systems have been limited to
photopolymerized microstructures115-117
and microdroplets.118-120
Previously, arrayed microposts have been employed in microfluidic systems to regulate
microbead immobilization42
(see Section 3.1.4) and for transporting microdroplets into parallel
flow streams. For microdroplets, Zhang et al. used microposts in microfluidics to guide droplets
into discrete, sequential streams of polyelectrolytes and washes.120
One limitation of this system
was that one inlet and one outlet were needed for each additional layer or wash step (i.e., for a
total of 16 ports). Recently, Kantak et al. improved upon this design by enabling the same multi-
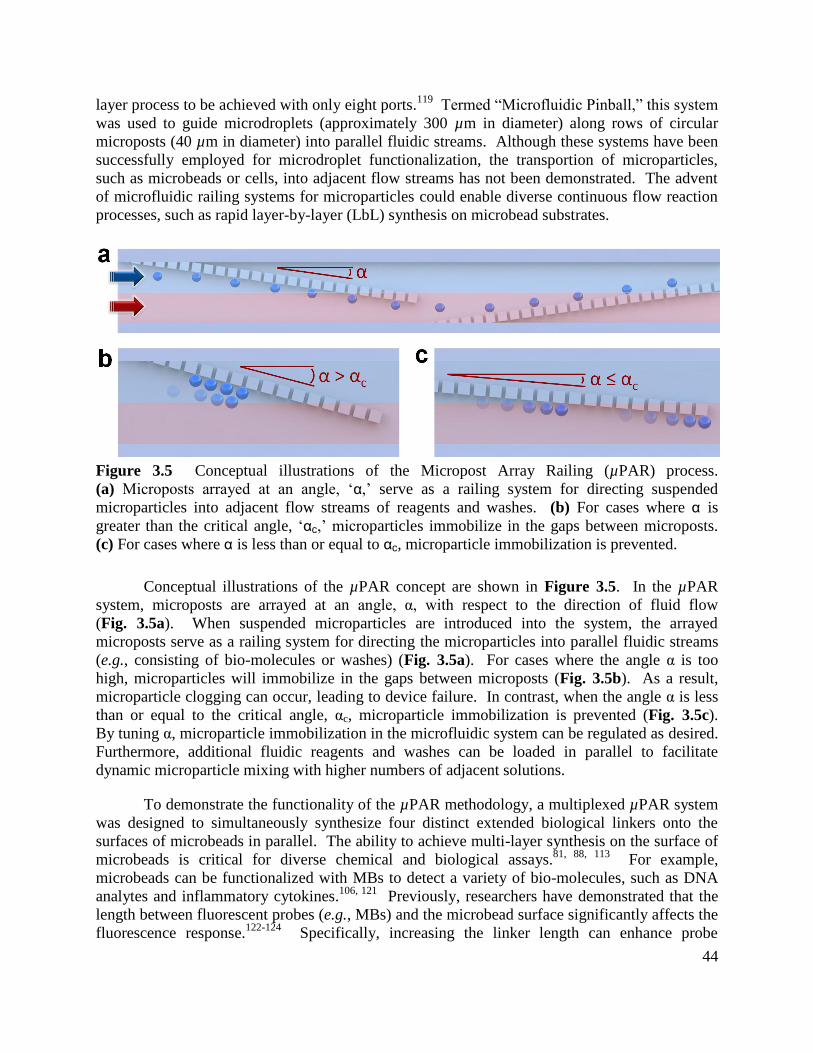
44
layer process to be achieved with only eight ports.119
Termed “Microfluidic Pinball,” this system
was used to guide microdroplets (approximately 300 µm in diameter) along rows of circular
microposts (40 µm in diameter) into parallel fluidic streams. Although these systems have been
successfully employed for microdroplet functionalization, the transportion of microparticles,
such as microbeads or cells, into adjacent flow streams has not been demonstrated. The advent
of microfluidic railing systems for microparticles could enable diverse continuous flow reaction
processes, such as rapid layer-by-layer (LbL) synthesis on microbead substrates.
Figure 3.5 Conceptual illustrations of the Micropost Array Railing (µPAR) process.
(a) Microposts arrayed at an angle, „α,‟ serve as a railing system for directing suspended
microparticles into adjacent flow streams of reagents and washes. (b) For cases where α is
greater than the critical angle, „αc,‟ microparticles immobilize in the gaps between microposts.
(c) For cases where α is less than or equal to αc, microparticle immobilization is prevented.
Conceptual illustrations of the µPAR concept are shown in Figure 3.5. In the µPAR
system, microposts are arrayed at an angle, α, with respect to the direction of fluid flow
(Fig. 3.5a). When suspended microparticles are introduced into the system, the arrayed
microposts serve as a railing system for directing the microparticles into parallel fluidic streams
(e.g., consisting of bio-molecules or washes) (Fig. 3.5a). For cases where the angle α is too
high, microparticles will immobilize in the gaps between microposts (Fig. 3.5b). As a result,
microparticle clogging can occur, leading to device failure. In contrast, when the angle α is less
than or equal to the critical angle, αc, microparticle immobilization is prevented (Fig. 3.5c).
By tuning α, microparticle immobilization in the microfluidic system can be regulated as desired.
Furthermore, additional fluidic reagents and washes can be loaded in parallel to facilitate
dynamic microparticle mixing with higher numbers of adjacent solutions.
To demonstrate the functionality of the µPAR methodology, a multiplexed µPAR system
was designed to simultaneously synthesize four distinct extended biological linkers onto the
surfaces of microbeads in parallel. The ability to achieve multi-layer synthesis on the surface of
microbeads is critical for diverse chemical and biological assays.81, 88, 113
For example,
microbeads can be functionalized with MBs to detect a variety of bio-molecules, such as DNA
analytes and inflammatory cytokines.106, 121
Previously, researchers have demonstrated that the
length between fluorescent probes (e.g., MBs) and the microbead surface significantly affects the
fluorescence response.122-124
Specifically, increasing the linker length can enhance probe
45
performance;87, 125
however, prior reports have also shown that increasing this distance beyond
an optimal linker length can result in a decrease in the fluorescence response.123
To control the
distance between immobilized fluorescent probes and the bead surface, extended biological
linkers (e.g., consisting of biotin-avidin pairs) can be synthesized onto the surface of
microbeads.87
Unfortunately, functionalizing microbeads with chemicals and bio-molecules off-
chip requires considerable time and labor, which has previously hindered the use of bead-based
microarrays for applications that require a high number of fluidic stages. This issue presents a
particular challenge for situations where extended biological linkers consisting of several biotin-
avidin pairs are desired. To overcome such limitations, the µPAR methodology is ideally suited
for simultaneously functionalizing microbeads with several distinct linker lengths in parallel
under continuous flow conditions.
Figure 3.6 Conceptual illustrations of the µPAR system for continuous flow layer-by-layer
(LbL) microbead functionalization of extended biotin-avidin-based biological linkers.
(a) Simplified architecture of the µPAR system (not to scale) for the example of synthesizing
two biotin-avidin pairs onto streptavidin-coated microbeads. A suspension of streptavidin-
coated microbeads (blue) is loaded into the device. The microbeads are railed sequentially into
adjacent solutions of: (1) biotinylated BSA (yellow), (2) PBS wash (white), (3) NeutrAvidin
(green), (4) PBS wash, (5) biotinylated BSA, (6) PBS wash, (7) NeutrAvidin, (8) PBS wash, and
(9) biotinylated fluorescent aptamers (FAs) (red). This process can be repeated or reduced to
synthesize a higher or lower number of biotin-avidin pairs onto the streptavidin-coated
microbeads, respectively. (b) Conceptual illustrations of the reaction process for synthesizing an
extended biological linker consisting of four biotin-avidin pairs onto a streptavidin-coated
microbead. Ultimately, a FA molecule is immobilized onto the extended biological linker, which
results in a detectable fluorescence on the surface of the microbead. This process involves 10
steps with additional fluidic washes between reagents for a total of 18 fluidic stages.
Figure 3.6a shows conceptual illustrations of the µPAR system for the demonstrative
example of conjugating an extended biological linker of two biotin-avidin pairs onto
streptavidin-coated microbeads. Six input solutions/suspensions were used, including a
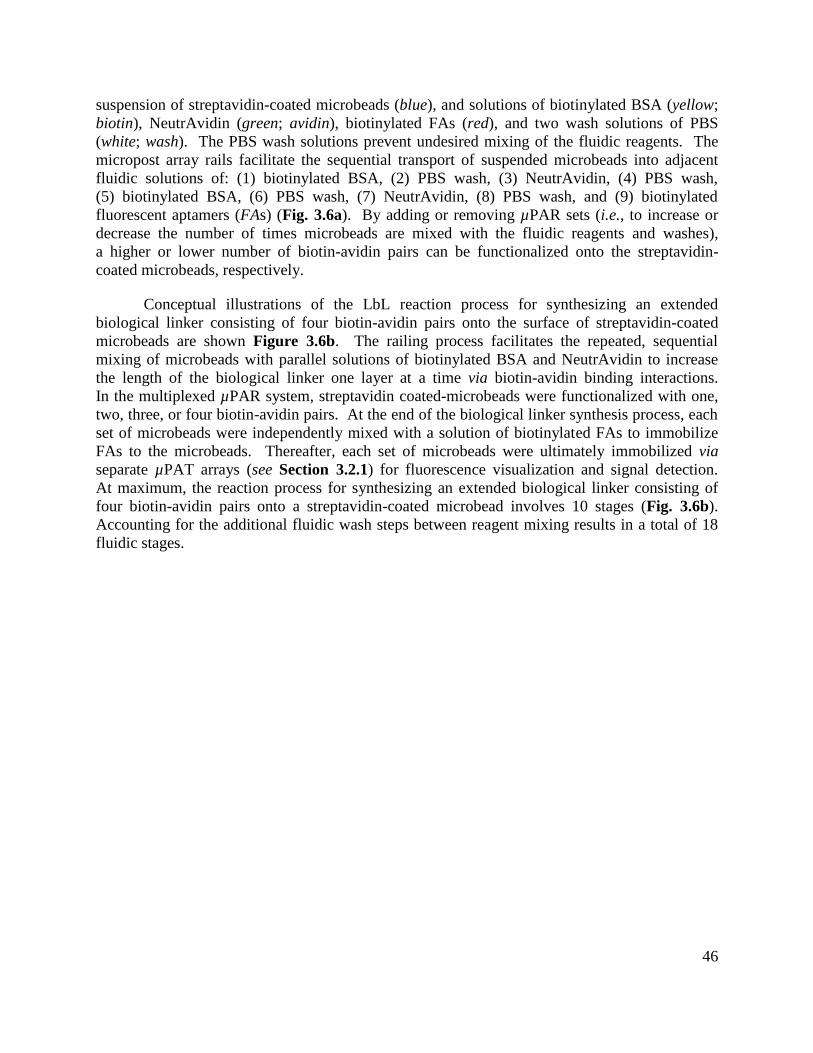
46
suspension of streptavidin-coated microbeads (blue), and solutions of biotinylated BSA (yellow;
biotin), NeutrAvidin (green; avidin), biotinylated FAs (red), and two wash solutions of PBS
(white; wash). The PBS wash solutions prevent undesired mixing of the fluidic reagents. The
micropost array rails facilitate the sequential transport of suspended microbeads into adjacent
fluidic solutions of: (1) biotinylated BSA, (2) PBS wash, (3) NeutrAvidin, (4) PBS wash,
(5) biotinylated BSA, (6) PBS wash, (7) NeutrAvidin, (8) PBS wash, and (9) biotinylated
fluorescent aptamers (FAs) (Fig. 3.6a). By adding or removing µPAR sets (i.e., to increase or
decrease the number of times microbeads are mixed with the fluidic reagents and washes),
a higher or lower number of biotin-avidin pairs can be functionalized onto the streptavidin-
coated microbeads, respectively.
Conceptual illustrations of the LbL reaction process for synthesizing an extended
biological linker consisting of four biotin-avidin pairs onto the surface of streptavidin-coated
microbeads are shown Figure 3.6b. The railing process facilitates the repeated, sequential
mixing of microbeads with parallel solutions of biotinylated BSA and NeutrAvidin to increase
the length of the biological linker one layer at a time via biotin-avidin binding interactions.
In the multiplexed µPAR system, streptavidin coated-microbeads were functionalized with one,
two, three, or four biotin-avidin pairs. At the end of the biological linker synthesis process, each
set of microbeads were independently mixed with a solution of biotinylated FAs to immobilize
FAs to the microbeads. Thereafter, each set of microbeads were ultimately immobilized via
separate µPAT arrays (see Section 3.2.1) for fluorescence visualization and signal detection.
At maximum, the reaction process for synthesizing an extended biological linker consisting of
four biotin-avidin pairs onto a streptavidin-coated microbead involves 10 stages (Fig. 3.6b).
Accounting for the additional fluidic wash steps between reagent mixing results in a total of 18
fluidic stages.
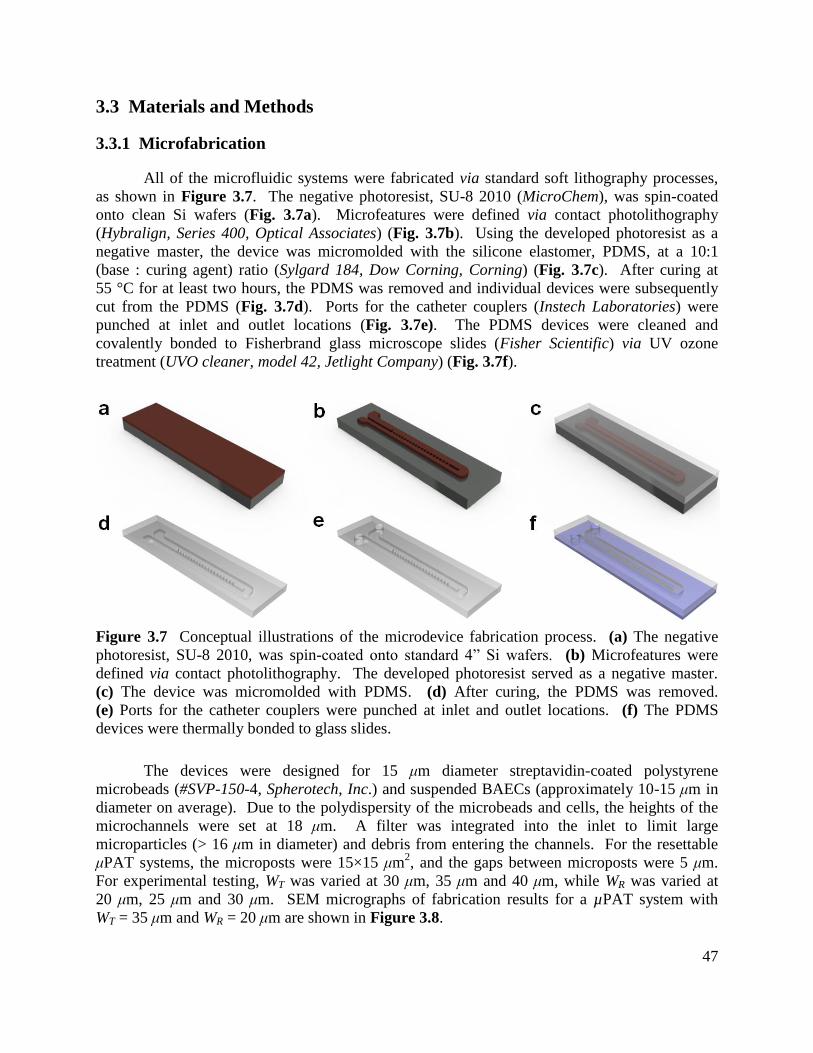
47
3.3 Materials and Methods
3.3.1 Microfabrication
All of the microfluidic systems were fabricated via standard soft lithography processes,
as shown in Figure 3.7. The negative photoresist, SU-8 2010 (MicroChem), was spin-coated
onto clean Si wafers (Fig. 3.7a). Microfeatures were defined via contact photolithography
(Hybralign, Series 400, Optical Associates) (Fig. 3.7b). Using the developed photoresist as a
negative master, the device was micromolded with the silicone elastomer, PDMS, at a 10:1
(base : curing agent) ratio (Sylgard 184, Dow Corning, Corning) (Fig. 3.7c). After curing at
55 °C for at least two hours, the PDMS was removed and individual devices were subsequently
cut from the PDMS (Fig. 3.7d). Ports for the catheter couplers (Instech Laboratories) were
punched at inlet and outlet locations (Fig. 3.7e). The PDMS devices were cleaned and
covalently bonded to Fisherbrand glass microscope slides (Fisher Scientific) via UV ozone
treatment (UVO cleaner, model 42, Jetlight Company) (Fig. 3.7f).
Figure 3.7 Conceptual illustrations of the microdevice fabrication process. (a) The negative
photoresist, SU-8 2010, was spin-coated onto standard 4” Si wafers. (b) Microfeatures were
defined via contact photolithography. The developed photoresist served as a negative master.
(c) The device was micromolded with PDMS. (d) After curing, the PDMS was removed.
(e) Ports for the catheter couplers were punched at inlet and outlet locations. (f) The PDMS
devices were thermally bonded to glass slides.
The devices were designed for 15 μm diameter streptavidin-coated polystyrene
microbeads (#SVP-150-4, Spherotech, Inc.) and suspended BAECs (approximately 10-15 μm in
diameter on average). Due to the polydispersity of the microbeads and cells, the heights of the
microchannels were set at 18 μm. A filter was integrated into the inlet to limit large
microparticles (> 16 μm in diameter) and debris from entering the channels. For the resettable
μPAT systems, the microposts were 15×15 μm2, and the gaps between microposts were 5 μm.
For experimental testing, WT was varied at 30 μm, 35 μm and 40 μm, while WR was varied at
20 μm, 25 μm and 30 μm. SEM micrographs of fabrication results for a µPAT system with
WT = 35 μm and WR = 20 μm are shown in Figure 3.8.
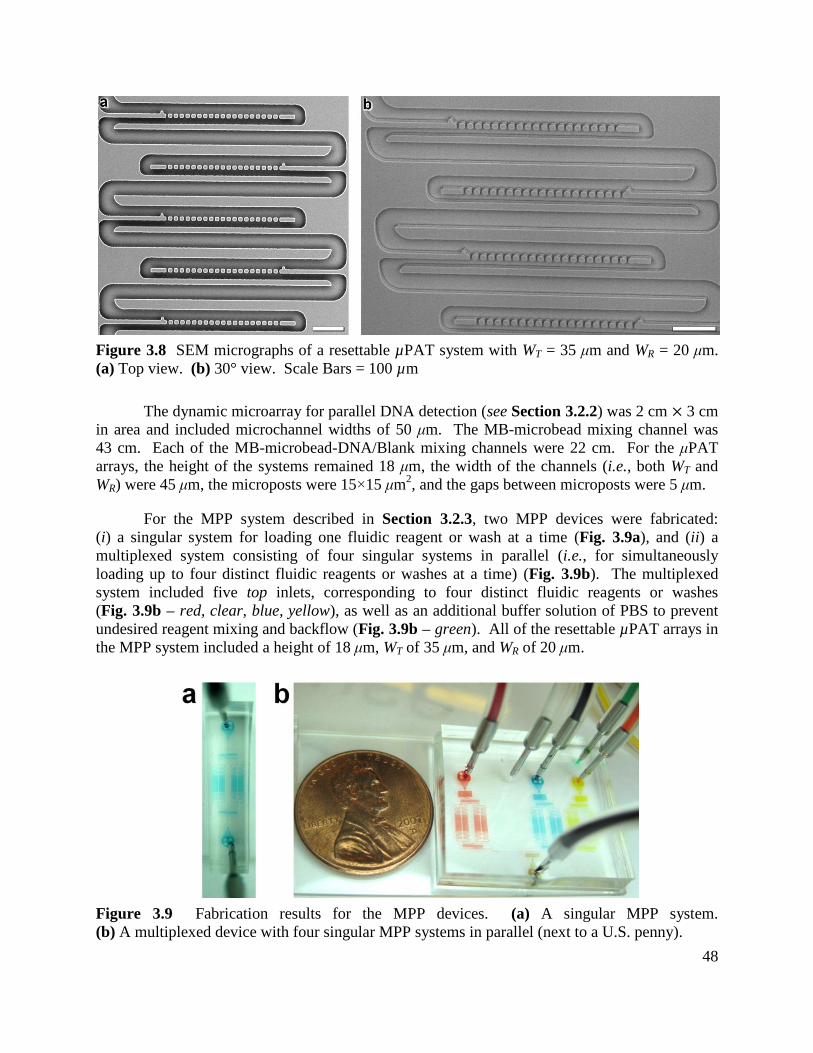
48
Figure 3.8 SEM micrographs of a resettable µPAT system with WT = 35 μm and WR = 20 μm.
(a) Top view. (b) 30° view. Scale Bars = 100 µm
The dynamic microarray for parallel DNA detection (see Section 3.2.2) was 2 cm 3 cm
in area and included microchannel widths of 50 μm. The MB-microbead mixing channel was
43 cm. Each of the MB-microbead-DNA/Blank mixing channels were 22 cm. For the μPAT
arrays, the height of the systems remained 18 μm, the width of the channels (i.e., both WT and
WR) were 45 μm, the microposts were 15×15 μm2, and the gaps between microposts were 5 μm.
For the MPP system described in Section 3.2.3, two MPP devices were fabricated:
(i) a singular system for loading one fluidic reagent or wash at a time (Fig. 3.9a), and (ii) a
multiplexed system consisting of four singular systems in parallel (i.e., for simultaneously
loading up to four distinct fluidic reagents or washes at a time) (Fig. 3.9b). The multiplexed
system included five top inlets, corresponding to four distinct fluidic reagents or washes
(Fig. 3.9b – red, clear, blue, yellow), as well as an additional buffer solution of PBS to prevent
undesired reagent mixing and backflow (Fig. 3.9b – green). All of the resettable µPAT arrays in
the MPP system included a height of 18 μm, WT of 35 μm, and WR of 20 μm.
Figure 3.9 Fabrication results for the MPP devices. (a) A singular MPP system.
(b) A multiplexed device with four singular MPP systems in parallel (next to a U.S. penny).
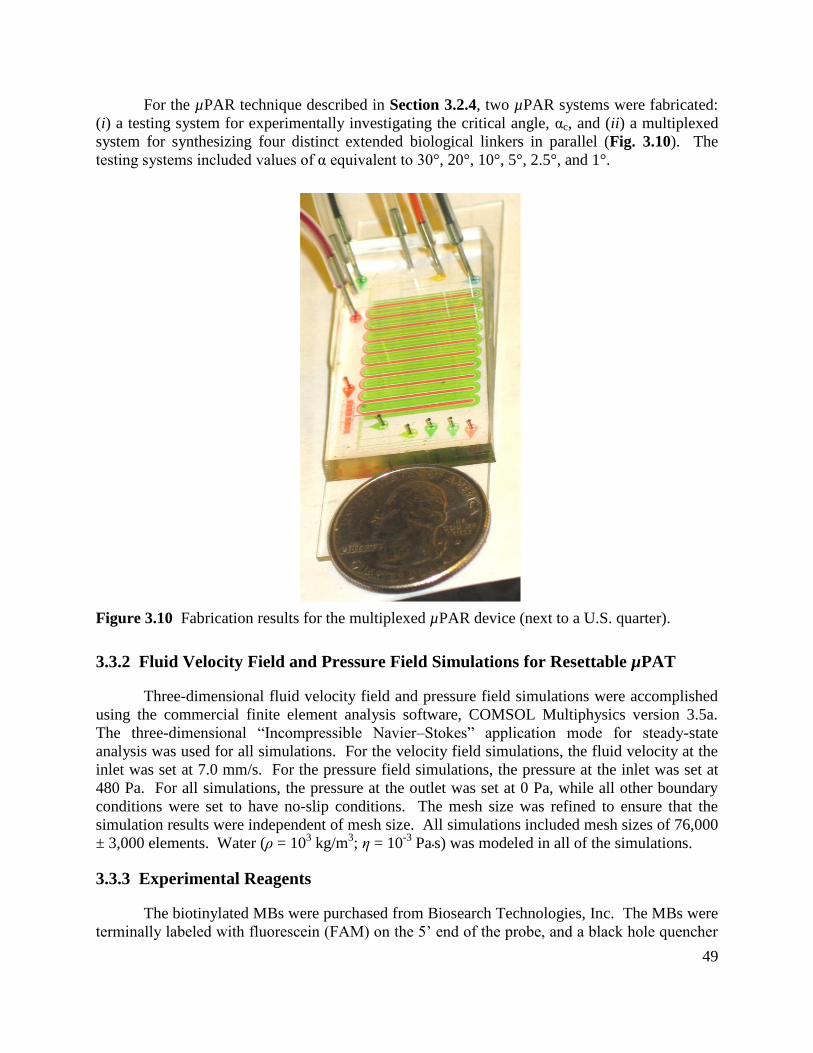
49
For the µPAR technique described in Section 3.2.4, two µPAR systems were fabricated:
(i) a testing system for experimentally investigating the critical angle, αc, and (ii) a multiplexed
system for synthesizing four distinct extended biological linkers in parallel (Fig. 3.10). The
testing systems included values of α equivalent to 30°, 20°, 10°, 5°, 2.5°, and 1°.
Figure 3.10 Fabrication results for the multiplexed µPAR device (next to a U.S. quarter).
3.3.2 Fluid Velocity Field and Pressure Field Simulations for Resettable µPAT
Three-dimensional fluid velocity field and pressure field simulations were accomplished
using the commercial finite element analysis software, COMSOL Multiphysics version 3.5a.
The three-dimensional “Incompressible Navier–Stokes” application mode for steady-state
analysis was used for all simulations. For the velocity field simulations, the fluid velocity at the
inlet was set at 7.0 mm/s. For the pressure field simulations, the pressure at the inlet was set at
480 Pa. For all simulations, the pressure at the outlet was set at 0 Pa, while all other boundary
conditions were set to have no-slip conditions. The mesh size was refined to ensure that the
simulation results were independent of mesh size. All simulations included mesh sizes of 76,000
± 3,000 elements. Water (ρ = 103 kg/m
3; η = 10
-3 Pa•s) was modeled in all of the simulations.
3.3.3 Experimental Reagents
The biotinylated MBs were purchased from Biosearch Technologies, Inc. The MBs were
terminally labeled with fluorescein (FAM) on the 5‟ end of the probe, and a black hole quencher
50
(BHQ-1) on the 3‟ end (Table 3.1). The biotinylated FAs and Qs were also purchased from
Biosearch Technologies, Inc. The FAs were terminally labeled with fluorescein (FAM) on the 5‟
end of the probe, while the Qs included a black hole quencher (BHQ-1) on the 3‟ end
(Table 3.2). The PM, SNP, and MM DNA oligonucleotide sequences (see Section 3.2.1) were
all purchased from Invitrogen Corp. The recombinant human INF-γ was purchased from R&D
Systems (#285-IF-100). Both the biotinylated BSA and NeutrAvidin were purchased from
Sigma-Aldrich Corp. All of the reagents were used without further purification or amplification.
For the Blank solutions and all PBS washes, GIBCOTM
Dulbecco's 1X PBS (#14287072;
Invitrogen) was used.
3.3.4 Microbead Functionalization for the Parallel DNA Detection Assay
For the parallel DNA detection experiment described in Section 3.2.2, an extended
biological linker was synthesized to the streptavidin-coated 15 μm diameter polystyrene
microbeads (#SVP-150-4, Spherotech, Inc.) prior to loading. Specifically, an extended biological
linker composed of biotinylated BSA (biotin) and NeutrAvidin (avidin), which were both
purchased from Sigma-Aldrich Corp., was conjugated onto the surface of the microbeads
because the fluorescence response of bead-immobilized MBs can be enhanced by increasing the
distance from the microbead surface.87
Laminar diffusion-based mixing facilitated the binding
of biotinylated MBs to the microbead surface (i.e., microbead – streptavidin – biotinylated BSA
– avidin – biotinylated MB).
3.3.5 Cell Suspension Preparation
BAECs were used to investigate the potential of using the: (i) resettable μPAT system to
trap-and-release cells, and (ii) μPAR system to transport cells into adjacent flow streams. After
the cells were passaged and cultured as described in Section 2.3.2, the remaining cell
suspensions were used for testing cell handling in the microfluidic devices.
3.3.6 Experimental Setup
All experiments were conducted under room temperature environment (20-25 °C) and
without thermal cycling during device operation. To limit the immobilization of microparticles
at locations other than the designated trapping sites, the polysorbate surfactant, Tween 20 (20%
in PBS, Fisher), was vacuum loaded into all devices prior to operation for a 15 minute
incubation period.
3.3.6.1 Resettable µPAT Experiments
For testing the resettable μPAT system (see Section 3.2.1), a syringe pump (NE-300, New
Era Pump Systems, Inc.) was used to control the input flow rates. For the trapping efficiency and
loading efficiency testing, the flow rate for the microbead suspension (inputted via the inlet;
15 μL; 30 beads/μL) was set at 0.25 μL/min. For the resetting efficiency testing, the flow rate for
the microbead suspension (inputted via the outlet; 60 μL; 5 beads/μL) was set at 1.5 μL/min.
For resetting µPAT systems filled with arrayed microbeads, the flow rate for the DI water
(inputted via the outlet) was set at 1.5 μL/min. For cell handling testing, the trapping mode was
51
first tested by loading the BAEC suspension (180 cells/µL) via the inlet using a syringe pump set
at a flow rate of 0.1 µL/min. For testing the resetting mode, two experiments were conducted to
examine the efficacy of using DI water and 0.5X trypsin to achieve device resettability.
After cells had immobilized in µPAT systems, solutions of either DI water or 0.5X trypsin were
loaded via the outlet using a syringe pump set at a flow rate of 1.5 µL/min.
3.3.6.2 Parallel DNA Detection Experiments
The dynamic microarray for parallel DNA detection (see Section 3.2.2), four syringe
pumps were used to load PBS into the device at a flow rate of 1 μL/min each via the PM, SNP,
MM, and Blank inlets, until the Tween solution was removed from the device. Thereafter, six
syringe pumps were used to independently control the input flow rates of each homogenous
solution or suspension (i.e., microbeads, MBs, PM, SNP, MM, and Blank). The flow rates for
the microbead suspension (20 μL; 250 beads/μL) and the MB solution (20 μL; 10 μM) were each
set at 0.60 μL/min, while the flow rates for the DNA oligonucleotide solutions (10 μL; 30 μM)
and Blank solution (10 μL) were all set at 0.17 μL/min. Laminar diffusion-based mixing of the
MB-microbead solution and the MB-microbead-DNA/Blank solutions each occurred in separate
serpentine microchannels.
3.3.6.3 MPP Experiments
For the experiments with the singular MPP system (see Section 3.3.1), a syringe pump
was used to control the input flow rates (2 μL/min) for each homogenous solution, suspension,
and wash. For the multiplexed system (see Section 3.3.1), five syringe pumps were used to
control the input flow rates (0.5 μL/min) during parallel loading of the homogenous solutions
and PBS washes, while a single syringe pump was used to control the input flow rates (2 μL/min)
during singular loading of homogenous solutions, suspensions, and PBS washes.
3.3.6.4 µPAR Experiments
For the μPAR α testing experiments (see Section 3.3.1), three syringe pumps were used
to control the input flow rates (0.5 μL/min) for each homogenous solution or suspension. For the
multiplexed μPAR system (see Section 3.3.1), six syringe pumps were used to control the input
flow rates (0.5 μL/min) during parallel loading of the homogenous suspensions, solutions, and
washes. To determine the fluorescence response of streptavidin-coated microbeads after mixing
with the FA solution (i.e., for the negative control), the biotin and avidin solutions were replaced
with PBS washes. The control experiments were also run using the multiplexed μPAR device.
For cell handling experiments with the μPAR system, the BAEC suspension (180 cells/µL) was
loaded into the α = 1° testing system in parallel with a blue-dyed solution and a yellow-dyed
solution via separate inlet ports. Three syringe pumps were used to control the input flow rates
(0.5 μL/min) for each dyed-solution and the cell suspension.
3.3.7 Data Acquisition
All images were taken using a fluorescent inverted microscope (Motic AE31, Motic
Instruments, Inc.) connected to a Micropublisher 5.0 RTV charge-coupled device (CCD) camera
(QImaging) and calibrated with QCapturePro (QImaging). For the bead-based experimental
52
runs, all fluorescent images were captured at 100X magnification. For both the dynamic
microarray for parallel DNA detection (see Section 3.2.2) and the μPAR systems (see
Section 3.2.4), fluorescent images were acquired after microbeads were arrayed in the final
μPAT arrays. For experiments with the MPP systems (see Section 3.2.3), images were acquired
after the μPAT arrays were filled with trapped microbeads following each reaction-step.
The freely available software, ImageJ (NIH), was used to quantify the fluorescence response of
each arrayed microbead directly from the captured images. Since contact between microbeads
can distort the fluorescence response, data was excluded for microbeads that were in contact with
other microbeads, or not immobilized in the designated trapping sites.
3.3.8 Quantification of Experimental Results
3.3.8.1 Quantification of µPAT Efficiencies
In prior reports, terms for quantifying particulate-based arrays, such as the “trapping
efficiency” (or “yield”) and “loading efficiency,” have been assigned a variety of definitions.
Here, standardized equations are presented for quantifying the efficiencies associated with
particulate-based arraying systems. The trapping efficiency (TE) was calculated as:
Equation 3.1
where Na is the number of discrete arrayed particles (i.e., without particle-particle contact) in the
designated trapping sites, and NT is the total number of potential trapping sites that could have
been occupied. For testing systems where microparticle clogging was observed, the TE was
quantified as 0%. Figure 3.11a shows TEs of 100% (top) and 65% (bottom).
Defining the loading efficiency (LE) as the proportion of loaded particles that are
immobilized can be misleading because loading a low number of particles in a system with high
numbers of potential trapping sites would produce a high efficiency. To preclude this issue, the
LE was calculated as:
for Equation 3.2
where Ni is the number of particles immobilized, and NL is the number of particles loaded – with
the condition that the number of particles loaded (NL) is equivalent to the number of potential
trapping sites that could have been occupied (NT). For testing systems where microparticle
clogging was observed, the LE was quantified as 0%. Figure 3.11b and Figure 3.11c show LEs
of 95% and 100%, respectively.
To quantify microarray resettability, the resetting efficiency (RE) for this study was
calculated as:
Equation 3.3
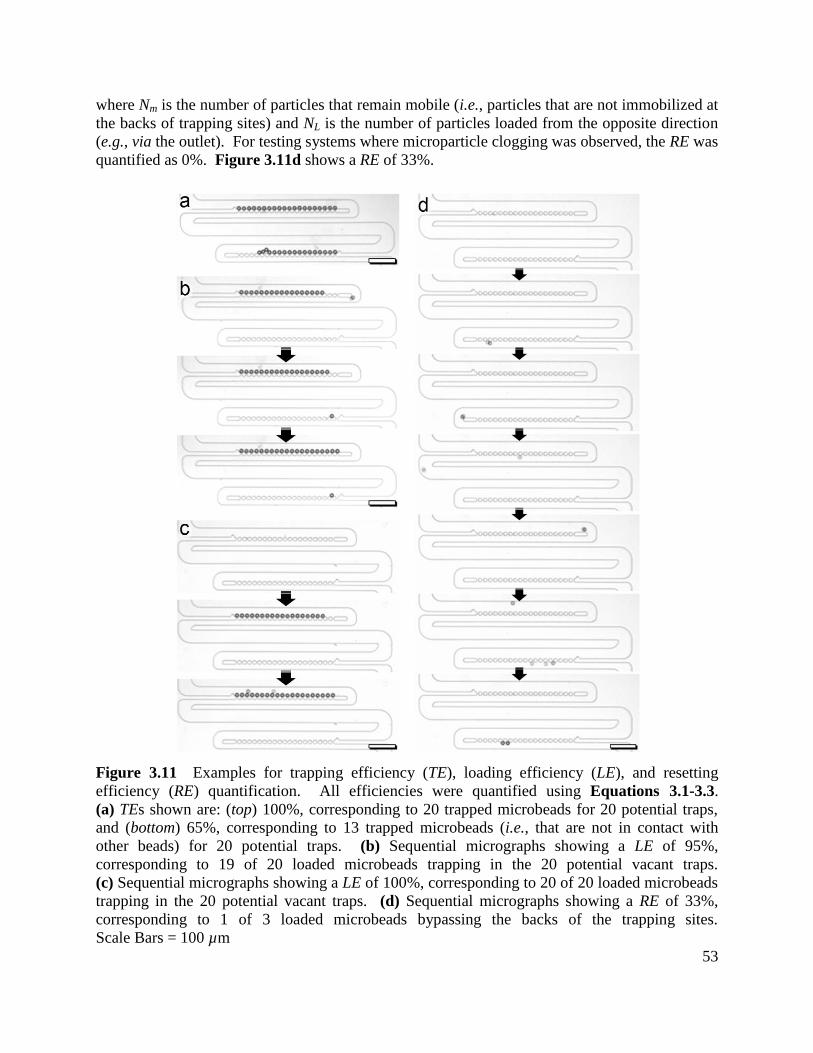
53
where Nm is the number of particles that remain mobile (i.e., particles that are not immobilized at
the backs of trapping sites) and NL is the number of particles loaded from the opposite direction
(e.g., via the outlet). For testing systems where microparticle clogging was observed, the RE was
quantified as 0%. Figure 3.11d shows a RE of 33%.
Figure 3.11 Examples for trapping efficiency (TE), loading efficiency (LE), and resetting
efficiency (RE) quantification. All efficiencies were quantified using Equations 3.1-3.3.
(a) TEs shown are: (top) 100%, corresponding to 20 trapped microbeads for 20 potential traps,
and (bottom) 65%, corresponding to 13 trapped microbeads (i.e., that are not in contact with
other beads) for 20 potential traps. (b) Sequential micrographs showing a LE of 95%,
corresponding to 19 of 20 loaded microbeads trapping in the 20 potential vacant traps.
(c) Sequential micrographs showing a LE of 100%, corresponding to 20 of 20 loaded microbeads
trapping in the 20 potential vacant traps. (d) Sequential micrographs showing a RE of 33%,
corresponding to 1 of 3 loaded microbeads bypassing the backs of the trapping sites.
Scale Bars = 100 µm

54
3.3.8.2 Quantification of Relative Fluorescence Intensities (RFIs) for the Parallel DNA
Detection Experiments
Relative fluorescence intensities (RFIs) associated with bead-based experiments were
quantified from fluorescence images of μPAT-immobilized 15 μm diameter microbeads. For
experiments with the dynamic microarray for parallel DNA detection (see Section 3.2.2), RFI
values for individual microbeads were calculated as:
RFIi =
- n
- n Equation 3.4
where xi is the fluorescent intensity of a single microbead, is the mean fluorescent intensity
of the microbeads that mixed with the Blank solution for the corresponding experiment, and
is the mean fluorescent intensity of microbeads that mixed with the PM solution for the
corresponding experiment. The calculation of RFI values normalized the fluorescence results
such that the mean RFI for the PM case was set at 1, while the mean RFI for the Blank case was
set at 0.
3.3.8.3 Quantification of RFIs for the MPP Experiments
For the MPP experiments (see Section 3.2.3), RFI values for individual microbeads were
calculated as:
RFIi =
-
- Equation 3.5
where xi is the fluorescent intensity of a single microbead, is the mean fluorescent intensity of
the microbeads after mixing with the Q solution for the corresponding experiment, and is the
mean fluorescent intensity of the microbeads after mixing with the FA solution for the
corresponding experiment. The calculation of RFI values normalized the fluorescence results
such that the mean RFIs for the FA case and Q case were set at 1 and 0, respectively.
3.3.8.4 Quantification of RFIs for the Multiplexed µPAR Experiments
For the multiplexed μPAR experiments (see Section 3.2.4), RFI values for individual
microbeads were calculated as:
RFIi = - S Equation 3.6
where xi is the fluorescent intensity of a single microbead, and is the mean fluorescent
intensity of the microbeads without any biotin-avidin pairs (i.e., with only streptavidin) for the
corresponding experiment. The calculation of RFI values normalized the fluorescence results
such that the mean RFI for the streptavidin (negative control) case was set at 0.
55
3.3.8.5 Quantification of Railing Failure Rates (RFRs) for the µPAR α Testing
Experiments
Railing Failure Rates (RFRs) associated with the µPAR α testing experiments (see
Section 3.3.1) were quantified as:
RFR =
Equation 3.7
where NB is the number of microparticles that immobilized in the gaps between
microposts, and NG is the total number of potential gaps between microposts where
microparticles could have been immobilized. Thus, an ideal microfluidic railing system
would yield a RFR of 0%, a system where microbeads immobilized in each gap would
yield a RFR of 100%, and a system with microbeads that immobilized on top of other
immobilized microbeads would yield a RFR greater than 100%.
3.3.9 Statistical Analysis
Experimental results are presented as mean ± s.e.m. For experiments with the dynamic
microarray for parallel DNA detection (see Section 3.2.2), the p values corresponding to
differences in RFI between distinct DNA oligonucleotide sequences were calculated via one-way
analysis of variance (ANOVA) and confirmed via unpaired tude t’s t tests. The p value
corresponding to differences in RFI between the MM and Blank cases was calculated via
unpaired tude t’s t tests because the mean RFIs for these cases were not assumed to be
different. For all other experiments, p values corresponding to differences in RFI were
calculated via unpaired tude t’s t tests. Differences with p values less than 0.05 were
considered statistically significant.
56
3.4 Results and Discussion
3.4.1 Resettable µPAT for Particulate Handling
3.4.1.1 Microfluidic Simulations
Three-dimensional COMSOL simulations were performed for the resettable µPAT
system using ideal microspheres of 15 µm in diameter. The simulation results are presented in
Figure 3.12. For the trapping mode (i.e., the positive fluidic flow case), Figure 3.12a-c show
both the reduction in fluid velocities through the traps after microbead immobilization, and the
resulting increase in fluid velocities through the remaining vacant trapping sites. For example,
the immobilization of ten microbeads resulted in a 20% decrease in the maximum fluid velocity
through the first trapping site, and a 100% increase in the maximum fluid velocity through the
eleventh trapping site (Fig. 3.12a, b). The vacant µPAT arrays in Figure 3.12a and
Figure 3.12d show that the flow through the trapping sites is highest for the first vacant trap and
decreases successively. This suggests that sequential microbead trapping would be promoted
during the arraying process. As shown in Figure 3.12e and Figure 3.12f, the pressure drop
across the trapping sites suggests that previously trapped microbeads would remain immobilized
in the array positions. However, because the pressure drop is highest across the first trapping site
and decreases sequentially (Fig. 3.12f), the microbeads immobilized in the latter array positions
would have a comparatively higher risk of being displaced from the traps (e.g., due to contact
from subsequent microbeads entering a 100% filled array).
Figure 3.12g-l show the effects of decreasing the channel size (i.e., reducing WR) on the
flow patterns surrounding microbeads located at trapping channels. In particular, the expanded
views of the velocity fields show that that component of the velocity vectors (red arrows)
perpendicular to the trapping channel are all oriented in the same direction (rightward)
(Fig. 3.12g-i). This is in stark contrast to the expanded views from Figure 3.12b and
Figure 3.12c, where the majority of velocity vectors (red arrows) outlining the contour of the
trapped microbead are directed into the trapping channel. The flow profile in the velocity and
pressure fields for negative fluidic flow suggest that microbead immobilization at the backs of
trapping sites would be deterred during experimental runs (Fig. 3.12g-l).
3.4.1.2 Trapping Mode for Microbead Suspensions
Experimental results for the trapping mode are shown in Figure 3.13. Both WT and WR
were varied for a total of nine distinct µPAT testing systems. As shown in Figure 3.13a and
Figure 3.13b, systems where WT = 35 µm were found to have the highest TEs and LEs, while
microbead clogging in the device was not observed for any of these systems. The low TEs for
the testing systems with WT = 30 µm were primarily due to a higher proportion of vacant
trapping sites (Fig. 3.13a). The majority of trap vacancies were caused by subsequent
microbeads impacting previously immobilized microbeads that were located in the latter array
positions. This issue not only limited the LEs (Fig. 3.13b), but also resulted in microbead
clogging for cases where too many microbeads were simultaneously displaced from the trapping
sites. In contrast, the low TEs for the testing systems with WT = 40 µm (Fig. 3.13a) were
primarily due to a higher proportion of bead-bead contact from subsequent microbeads arraying
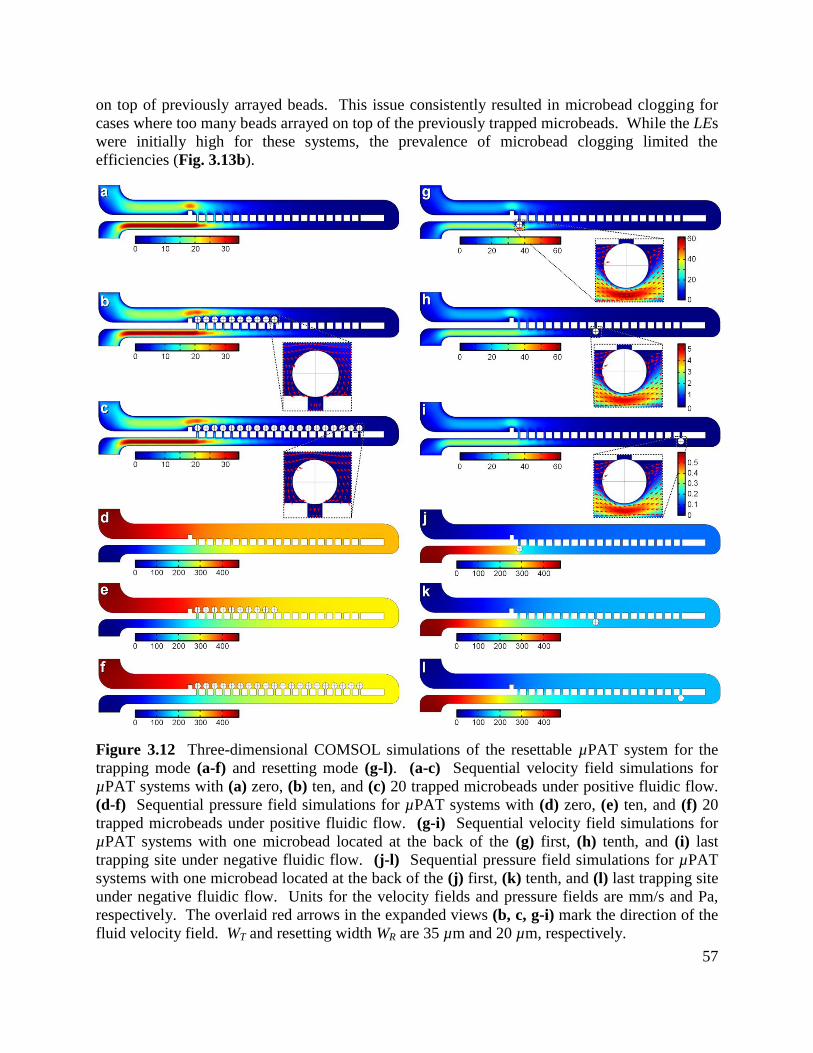
57
on top of previously arrayed beads. This issue consistently resulted in microbead clogging for
cases where too many beads arrayed on top of the previously trapped microbeads. While the LEs
were initially high for these systems, the prevalence of microbead clogging limited the
efficiencies (Fig. 3.13b).
Figure 3.12 Three-dimensional COMSOL simulations of the resettable µPAT system for the
trapping mode (a-f) and resetting mode (g-l). (a-c) Sequential velocity field simulations for
µPAT systems with (a) zero, (b) ten, and (c) 20 trapped microbeads under positive fluidic flow.
(d-f) Sequential pressure field simulations for µPAT systems with (d) zero, (e) ten, and (f) 20
trapped microbeads under positive fluidic flow. (g-i) Sequential velocity field simulations for
µPAT systems with one microbead located at the back of the (g) first, (h) tenth, and (i) last
trapping site under negative fluidic flow. (j-l) Sequential pressure field simulations for µPAT
systems with one microbead located at the back of the (j) first, (k) tenth, and (l) last trapping site
under negative fluidic flow. Units for the velocity fields and pressure fields are mm/s and Pa,
respectively. The overlaid red arrows in the expanded views (b, c, g-i) mark the direction of the
fluid velocity field. WT and resetting width WR are 35 µm and 20 µm, respectively.
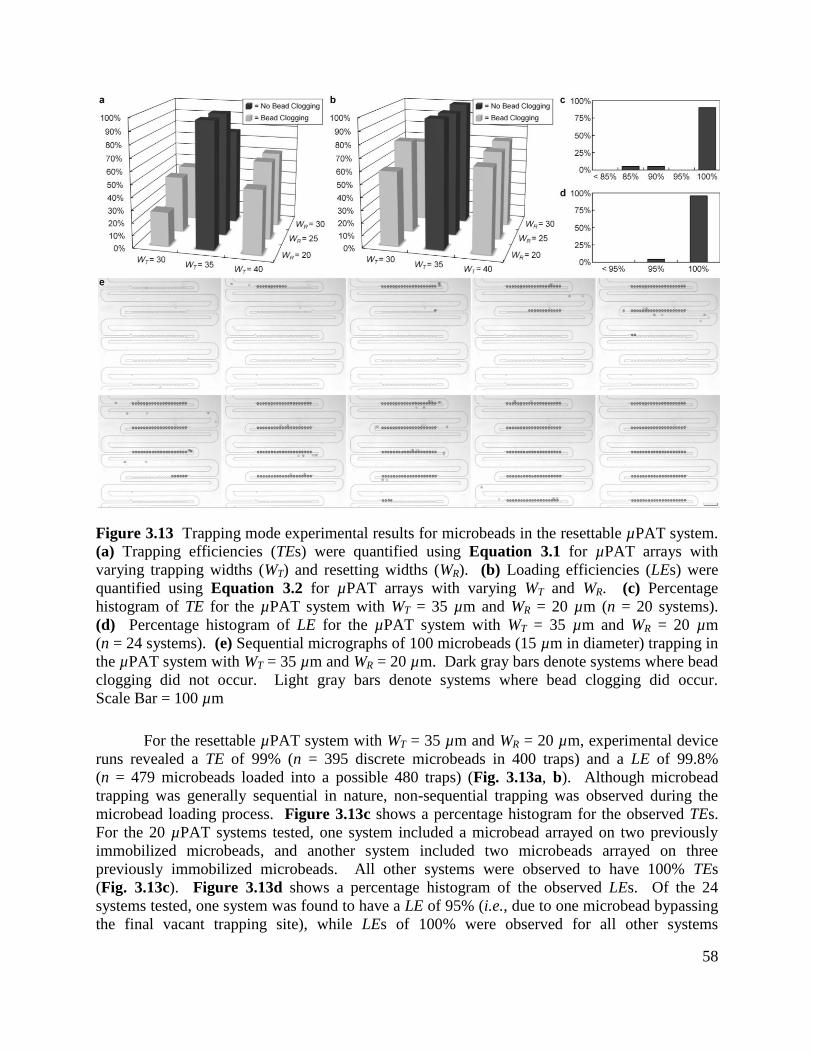
58
Figure 3.13 Trapping mode experimental results for microbeads in the resettable µPAT system.
(a) Trapping efficiencies (TEs) were quantified using Equation 3.1 for µPAT arrays with
varying trapping widths (WT) and resetting widths (WR). (b) Loading efficiencies (LEs) were
quantified using Equation 3.2 for µPAT arrays with varying WT and WR. (c) Percentage
histogram of TE for the µPAT system with WT = 35 µm and WR = 20 µm (n = 20 systems).
(d) Percentage histogram of LE for the µPAT system with WT = 35 µm and WR = 20 µm
(n = 24 systems). (e) Sequential micrographs of 100 microbeads (15 µm in diameter) trapping in
the µPAT system with WT = 35 µm and WR = 20 µm. Dark gray bars denote systems where bead
clogging did not occur. Light gray bars denote systems where bead clogging did occur.
Scale Bar = 100 µm
For the resettable µPAT system with WT = 35 µm and WR = 20 µm, experimental device
runs revealed a TE of 99% (n = 395 discrete microbeads in 400 traps) and a LE of 99.8%
(n = 479 microbeads loaded into a possible 480 traps) (Fig. 3.13a, b). Although microbead
trapping was generally sequential in nature, non-sequential trapping was observed during the
microbead loading process. Figure 3.13c shows a percentage histogram for the observed TEs.
For the 20 µPAT systems tested, one system included a microbead arrayed on two previously
immobilized microbeads, and another system included two microbeads arrayed on three
previously immobilized microbeads. All other systems were observed to have 100% TEs
(Fig. 3.13c). Figure 3.13d shows a percentage histogram of the observed LEs. Of the 24
systems tested, one system was found to have a LE of 95% (i.e., due to one microbead bypassing
the final vacant trapping site), while LEs of 100% were observed for all other systems
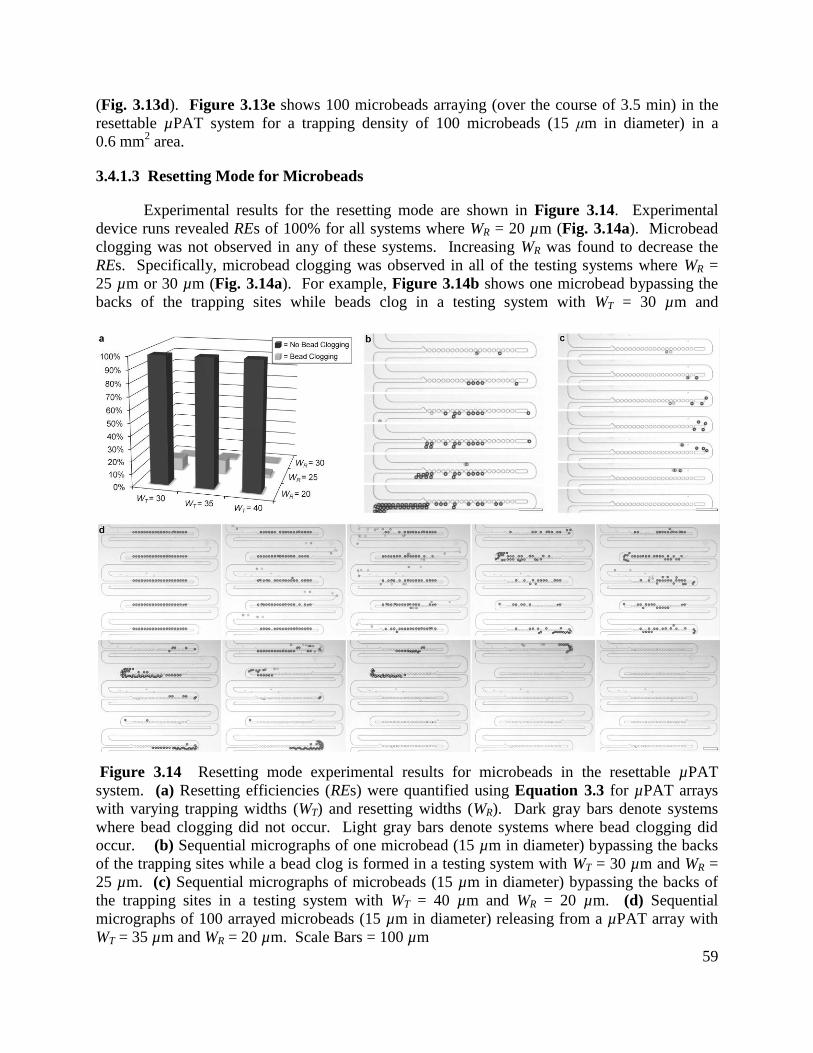
59
(Fig. 3.13d). Figure 3.13e shows 100 microbeads arraying (over the course of 3.5 min) in the
resettable µPAT system for a trapping density of 100 microbeads (15 μm in diameter) in a
0.6 mm2 area.
3.4.1.3 Resetting Mode for Microbeads
Experimental results for the resetting mode are shown in Figure 3.14. Experimental
device runs revealed REs of 100% for all systems where WR = 20 µm (Fig. 3.14a). Microbead
clogging was not observed in any of these systems. Increasing WR was found to decrease the
REs. Specifically, microbead clogging was observed in all of the testing systems where WR =
25 µm or 30 µm (Fig. 3.14a). For example, Figure 3.14b shows one microbead bypassing the
backs of the trapping sites while beads clog in a testing system with WT = 30 µm and
Figure 3.14 Resetting mode experimental results for microbeads in the resettable µPAT
system. (a) Resetting efficiencies (REs) were quantified using Equation 3.3 for µPAT arrays
with varying trapping widths (WT) and resetting widths (WR). Dark gray bars denote systems
where bead clogging did not occur. Light gray bars denote systems where bead clogging did
occur. (b) Sequential micrographs of one microbead (15 µm in diameter) bypassing the backs
of the trapping sites while a bead clog is formed in a testing system with WT = 30 µm and WR =
25 µm. (c) Sequential micrographs of microbeads (15 µm in diameter) bypassing the backs of
the trapping sites in a testing system with WT = 40 µm and WR = 20 µm. (d) Sequential
micrographs of 100 arrayed microbeads (15 µm in diameter) releasing from a µPAT array with
WT = 35 µm and WR = 20 µm. Scale Bars = 100 µm
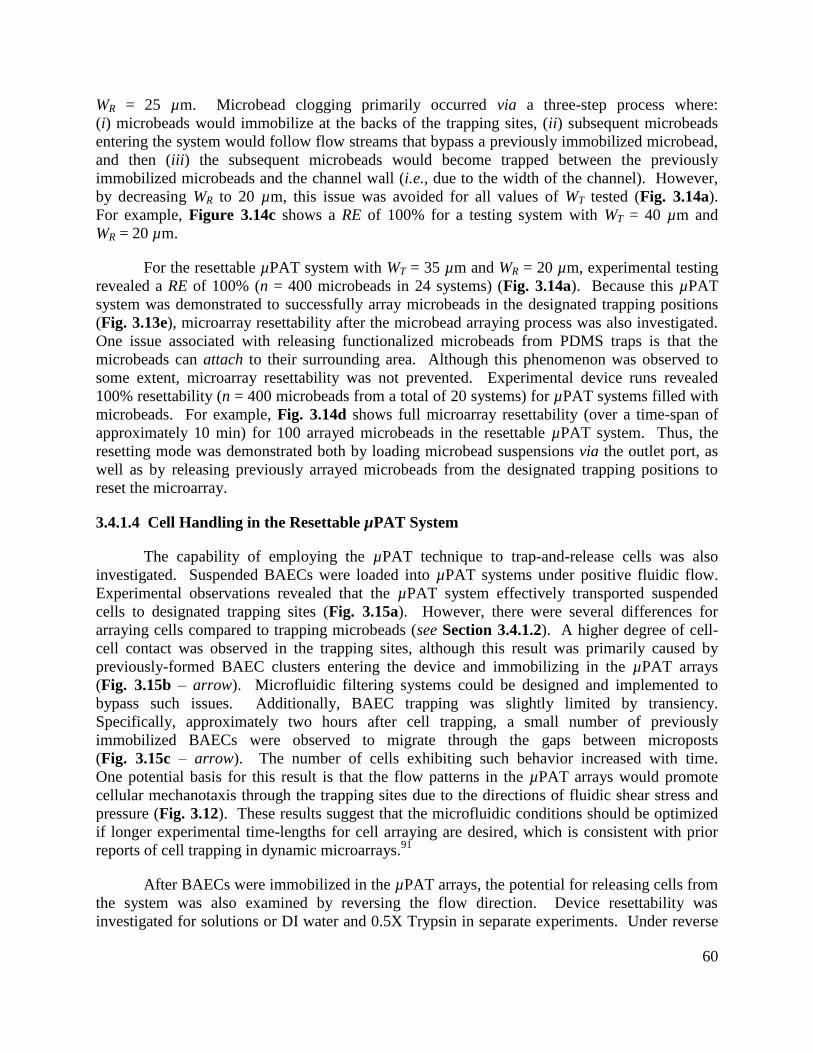
60
WR = 25 µm. Microbead clogging primarily occurred via a three-step process where:
(i) microbeads would immobilize at the backs of the trapping sites, (ii) subsequent microbeads
entering the system would follow flow streams that bypass a previously immobilized microbead,
and then (iii) the subsequent microbeads would become trapped between the previously
immobilized microbeads and the channel wall (i.e., due to the width of the channel). However,
by decreasing WR to 20 µm, this issue was avoided for all values of WT tested (Fig. 3.14a).
For example, Figure 3.14c shows a RE of 100% for a testing system with WT = 40 µm and
WR = 20 µm.
For the resettable µPAT system with WT = 35 µm and WR = 20 µm, experimental testing
revealed a RE of 100% (n = 400 microbeads in 24 systems) (Fig. 3.14a). Because this µPAT
system was demonstrated to successfully array microbeads in the designated trapping positions
(Fig. 3.13e), microarray resettability after the microbead arraying process was also investigated.
One issue associated with releasing functionalized microbeads from PDMS traps is that the
microbeads can attach to their surrounding area. Although this phenomenon was observed to
some extent, microarray resettability was not prevented. Experimental device runs revealed
100% resettability (n = 400 microbeads from a total of 20 systems) for µPAT systems filled with
microbeads. For example, Fig. 3.14d shows full microarray resettability (over a time-span of
approximately 10 min) for 100 arrayed microbeads in the resettable µPAT system. Thus, the
resetting mode was demonstrated both by loading microbead suspensions via the outlet port, as
well as by releasing previously arrayed microbeads from the designated trapping positions to
reset the microarray.
3.4.1.4 Cell Handling in the Resettable µPAT System
The capability of employing the µPAT technique to trap-and-release cells was also
investigated. Suspended BAECs were loaded into µPAT systems under positive fluidic flow.
Experimental observations revealed that the µPAT system effectively transported suspended
cells to designated trapping sites (Fig. 3.15a). However, there were several differences for
arraying cells compared to trapping microbeads (see Section 3.4.1.2). A higher degree of cell-
cell contact was observed in the trapping sites, although this result was primarily caused by
previously-formed BAEC clusters entering the device and immobilizing in the µPAT arrays
(Fig. 3.15b – arrow). Microfluidic filtering systems could be designed and implemented to
bypass such issues. Additionally, BAEC trapping was slightly limited by transiency.
Specifically, approximately two hours after cell trapping, a small number of previously
immobilized BAECs were observed to migrate through the gaps between microposts
(Fig. 3.15c – arrow). The number of cells exhibiting such behavior increased with time.
One potential basis for this result is that the flow patterns in the µPAT arrays would promote
cellular mechanotaxis through the trapping sites due to the directions of fluidic shear stress and
pressure (Fig. 3.12). These results suggest that the microfluidic conditions should be optimized
if longer experimental time-lengths for cell arraying are desired, which is consistent with prior
reports of cell trapping in dynamic microarrays.91
After BAECs were immobilized in the µPAT arrays, the potential for releasing cells from
the system was also examined by reversing the flow direction. Device resettability was
investigated for solutions or DI water and 0.5X Trypsin in separate experiments. Under reverse
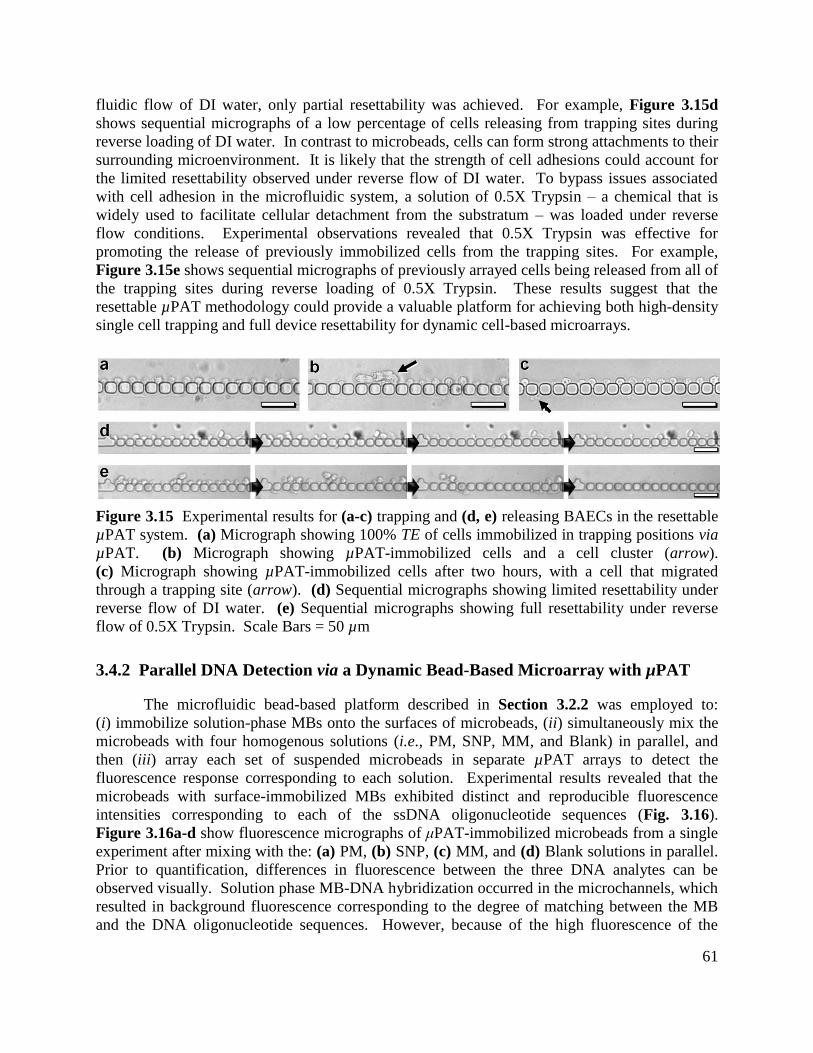
61
fluidic flow of DI water, only partial resettability was achieved. For example, Figure 3.15d
shows sequential micrographs of a low percentage of cells releasing from trapping sites during
reverse loading of DI water. In contrast to microbeads, cells can form strong attachments to their
surrounding microenvironment. It is likely that the strength of cell adhesions could account for
the limited resettability observed under reverse flow of DI water. To bypass issues associated
with cell adhesion in the microfluidic system, a solution of 0.5X Trypsin – a chemical that is
widely used to facilitate cellular detachment from the substratum – was loaded under reverse
flow conditions. Experimental observations revealed that 0.5X Trypsin was effective for
promoting the release of previously immobilized cells from the trapping sites. For example,
Figure 3.15e shows sequential micrographs of previously arrayed cells being released from all of
the trapping sites during reverse loading of 0.5X Trypsin. These results suggest that the
resettable µPAT methodology could provide a valuable platform for achieving both high-density
single cell trapping and full device resettability for dynamic cell-based microarrays.
Figure 3.15 Experimental results for (a-c) trapping and (d, e) releasing BAECs in the resettable
µPAT system. (a) Micrograph showing 100% TE of cells immobilized in trapping positions via
µPAT. (b) Micrograph showing µPAT-immobilized cells and a cell cluster (arrow).
(c) Micrograph showing µPAT-immobilized cells after two hours, with a cell that migrated
through a trapping site (arrow). (d) Sequential micrographs showing limited resettability under
reverse flow of DI water. (e) Sequential micrographs showing full resettability under reverse
flow of 0.5X Trypsin. Scale Bars = 50 µm
3.4.2 Parallel DNA Detection via a Dynamic Bead-Based Microarray with µPAT
The microfluidic bead-based platform described in Section 3.2.2 was employed to:
(i) immobilize solution-phase MBs onto the surfaces of microbeads, (ii) simultaneously mix the
microbeads with four homogenous solutions (i.e., PM, SNP, MM, and Blank) in parallel, and
then (iii) array each set of suspended microbeads in separate µPAT arrays to detect the
fluorescence response corresponding to each solution. Experimental results revealed that the
microbeads with surface-immobilized MBs exhibited distinct and reproducible fluorescence
intensities corresponding to each of the ssDNA oligonucleotide sequences (Fig. 3.16).
Figure 3.16a-d show fluorescence micrographs of μPAT-immobilized microbeads from a single
experiment after mixing with the: (a) PM, (b) SNP, (c) MM, and (d) Blank solutions in parallel.
Prior to quantification, differences in fluorescence between the three DNA analytes can be
observed visually. Solution phase MB-DNA hybridization occurred in the microchannels, which
resulted in background fluorescence corresponding to the degree of matching between the MB
and the DNA oligonucleotide sequences. However, because of the high fluorescence of the
62
microbead-immobilized MBs, Figure 3.16 shows that accurate and quantitative results were
achieved without the need for additional time-consuming fluidic wash steps to eliminate the
background noise.
Figure 3.16 Experimental results for microbead fluorescence. (a-d) Fluorescence micrographs
from a single experiment showing arrayed 15 µm in diameter microbeads with surface-
immobilized MBs after mixing with: (a) Perfect Match (PM), (b) One Mismatch (SNP),
(c) Mismatch (MM), and (d) Blank (PBS) solutions. Scale Bars = 100 µm. (e) Relative
fluorescence intensities (RFIs) corresponding to PM (n = 148), SNP (n = 194), MM (n = 124),
and Blank (n = 158) solutions. RFIs were quantified using Equation 3.4. * denotes p < 10-5
statistically significant differences. Error bars represent s.e.m.
Microbead RFIs were quantified using Equation 3.4. The quantified fluorescence results
are shown in Figure 3.16e. Each DNA oligonucleotide sequence was found to produce a
statistically discernable RFI. Microbeads with surface-immobilized MBs that mixed with the
PM solution produced the highest fluorescence response, with an average RFI of 1.00±0.06.
A single base-pair mismatch was found to significantly reduce the microbead fluorescence
(p < 10-5
). The average RFI corresponding to the SNP solution was 0.60±0.06. After mixing
with the MM solution, microbeads exhibited an average RFI of 0.07±0.05. The MM average
RFI was distinguished from both the PM and SNP cases (p < 10-5
). In contrast, the MM average
RFI was not discernable from the Blank case (p = 0.31), which demonstrates the specific binding
of the MB. Microbeads that mixed with the PBS solution produced an average RFI of
0.00±0.05. Thus, although the three DNA oligonucleotide sequences were observed to exhibit
distinct fluorescence intensities, the fluorescence response corresponding to the MM and Blank
solutions was not statistically distinguishable (Fig. 3.16e).
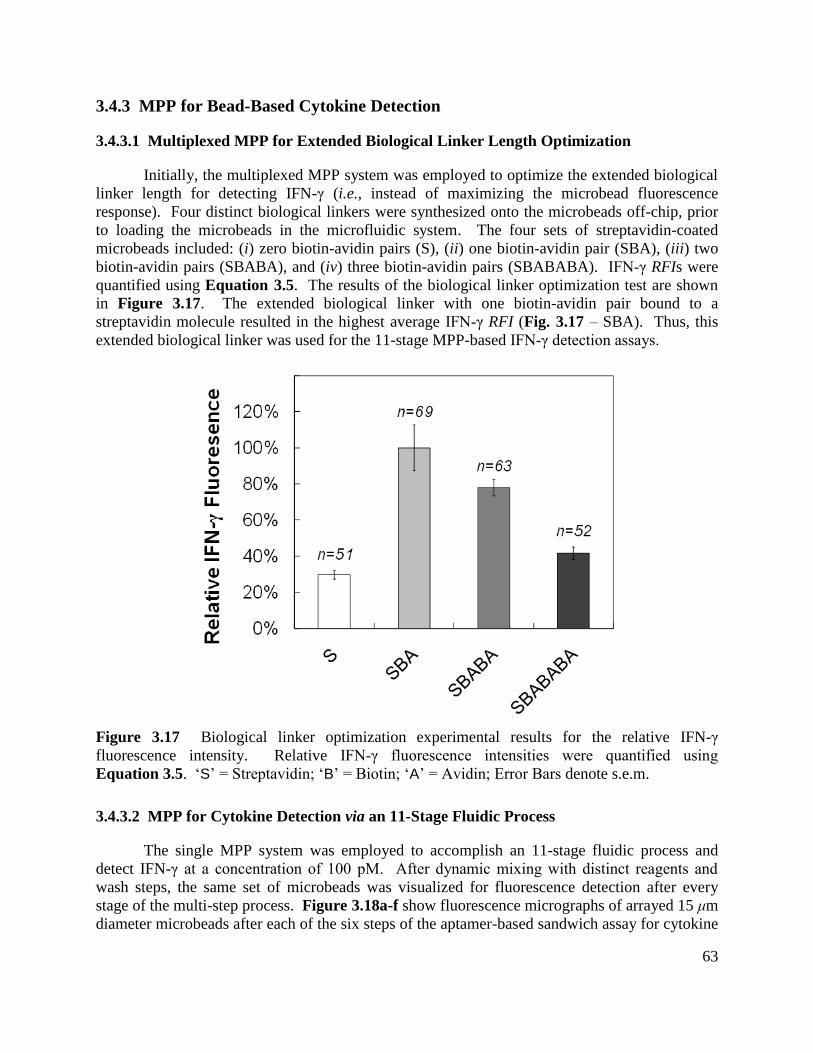
63
3.4.3 MPP for Bead-Based Cytokine Detection
3.4.3.1 Multiplexed MPP for Extended Biological Linker Length Optimization
Initially, the multiplexed MPP system was employed to optimize the extended biological
linker length for detecting IFN-γ (i.e., instead of maximizing the microbead fluorescence
response). Four distinct biological linkers were synthesized onto the microbeads off-chip, prior
to loading the microbeads in the microfluidic system. The four sets of streptavidin-coated
microbeads included: (i) zero biotin-avidin pairs (S), (ii) one biotin-avidin pair (SBA), (iii) two
biotin-avidin pairs (SBABA), and (iv) three biotin-avidin pairs (SBABABA). IFN-γ RFIs were
quantified using Equation 3.5. The results of the biological linker optimization test are shown
in Figure 3.17. The extended biological linker with one biotin-avidin pair bound to a
streptavidin molecule resulted in the highest average IFN-γ RFI (Fig. 3.17 – SBA). Thus, this
extended biological linker was used for the 11-stage MPP-based IFN-γ detection assays.
Figure 3.17 Biological linker optimization experimental results for the relative IFN-γ
fluorescence intensity. Relative IFN-γ fluorescence intensities were quantified using
Equation 3.5. „S‟ = Streptavidin; „B‟ = Biotin; „A‟ = Avidin; Error Bars denote s.e.m.
3.4.3.2 MPP for Cytokine Detection via an 11-Stage Fluidic Process
The single MPP system was employed to accomplish an 11-stage fluidic process and
detect IFN-γ at a concentration of 100 pM. After dynamic mixing with distinct reagents and
wash steps, the same set of microbeads was visualized for fluorescence detection after every
stage of the multi-step process. Figure 3.18a-f show fluorescence micrographs of arrayed 15 μm
diameter microbeads after each of the six steps of the aptamer-based sandwich assay for cytokine
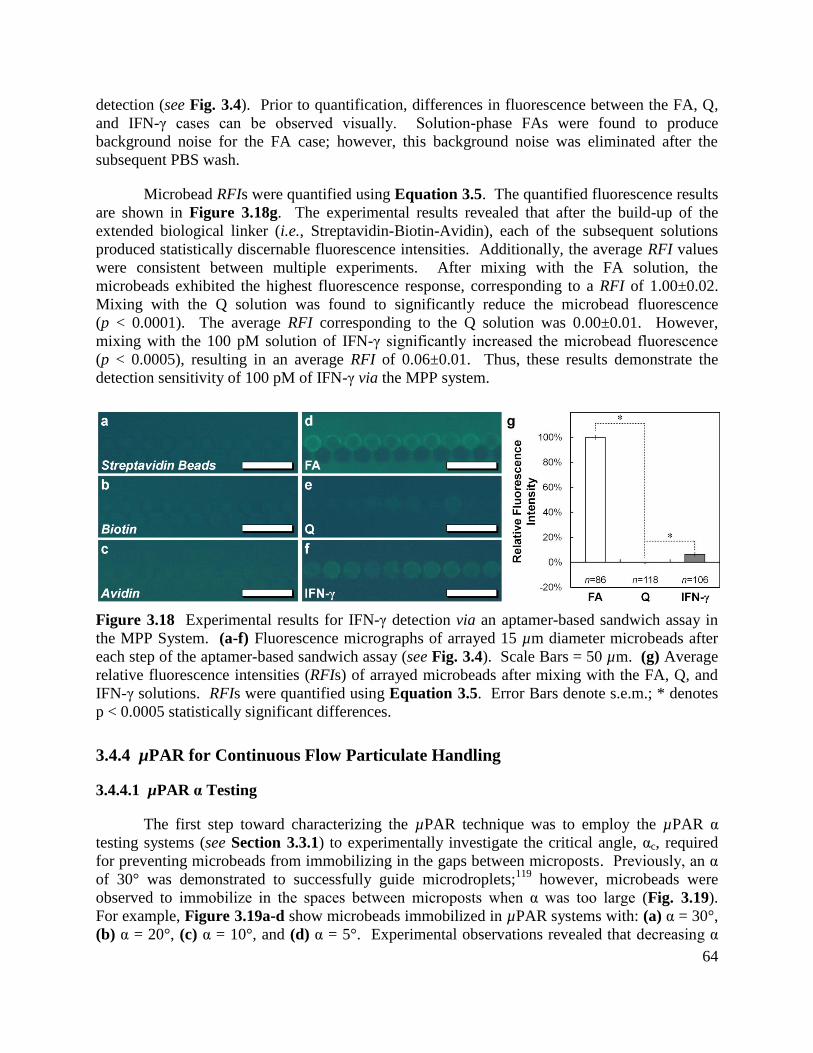
64
detection (see Fig. 3.4). Prior to quantification, differences in fluorescence between the FA, Q,
and IFN-γ cases can be observed visually. Solution-phase FAs were found to produce
background noise for the FA case; however, this background noise was eliminated after the
subsequent PBS wash.
Microbead RFIs were quantified using Equation 3.5. The quantified fluorescence results
are shown in Figure 3.18g. The experimental results revealed that after the build-up of the
extended biological linker (i.e., Streptavidin-Biotin-Avidin), each of the subsequent solutions
produced statistically discernable fluorescence intensities. Additionally, the average RFI values
were consistent between multiple experiments. After mixing with the FA solution, the
microbeads exhibited the highest fluorescence response, corresponding to a RFI of 1.00±0.02.
Mixing with the Q solution was found to significantly reduce the microbead fluorescence
(p < 0.0001). The average RFI corresponding to the Q solution was 0.00±0.01. However,
mixing with the 100 pM solution of IFN-γ significantly increased the microbead fluorescence
(p < 0.0005), resulting in an average RFI of 0.06±0.01. Thus, these results demonstrate the
detection sensitivity of 100 pM of IFN-γ via the MPP system.
Figure 3.18 Experimental results for IFN-γ detection via an aptamer-based sandwich assay in
the MPP System. (a-f) Fluorescence micrographs of arrayed 15 µm diameter microbeads after
each step of the aptamer-based sandwich assay (see Fig. 3.4). Scale Bars = 50 µm. (g) Average
relative fluorescence intensities (RFIs) of arrayed microbeads after mixing with the FA, Q, and
IFN-γ solutions. RFIs were quantified using Equation 3.5. Error Bars denote s.e.m.; * denotes
p < 0.0005 statistically significant differences.
3.4.4 µPAR for Continuous Flow Particulate Handling
3.4.4.1 µPAR α Testing
The first step toward characterizing the µPAR technique was to employ the µPAR α
testing systems (see Section 3.3.1) to experimentally investigate the critical angle, αc, required
for preventing microbeads from immobilizing in the gaps between microposts. Previously, an α
of 30° was demonstrated to successfully guide microdroplets;119
however, microbeads were
observed to immobilize in the spaces between microposts when α was too large (Fig. 3.19).
For example, Figure 3.19a-d show microbeads immobilized in µPAR systems with: (a) α = 30°,
(b) α = 20°, (c) α = 10°, and (d) α = 5°. Experimental observations revealed that decreasing α
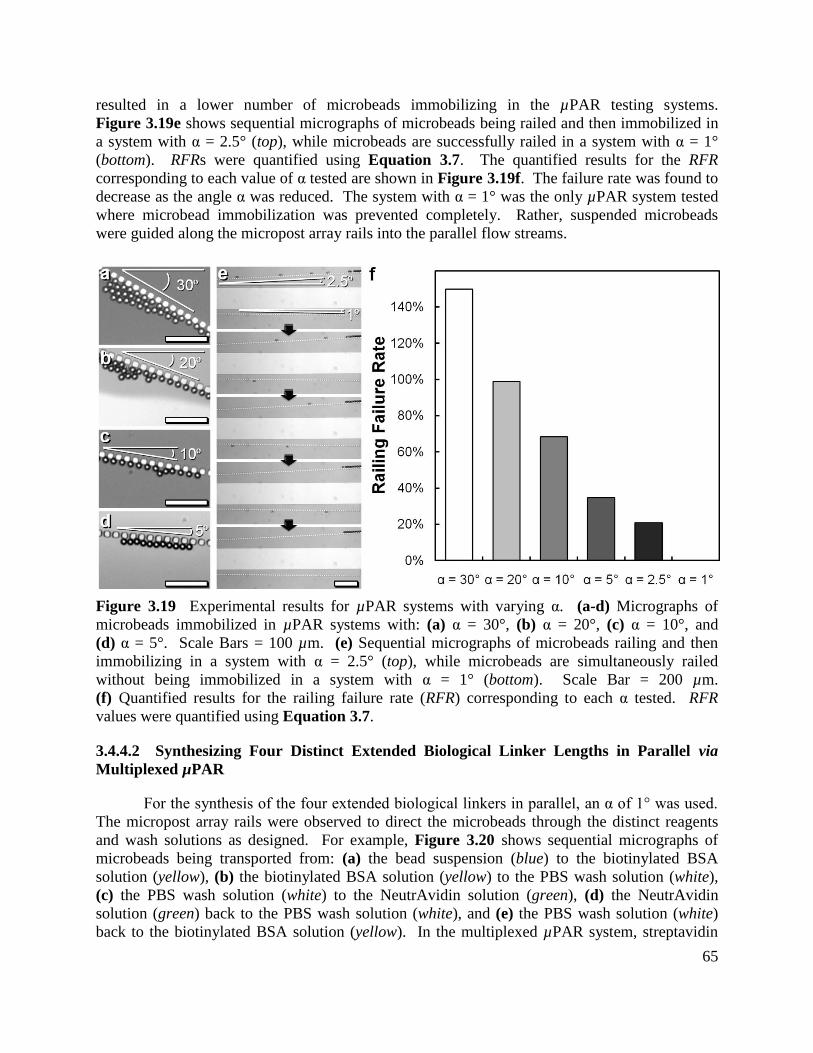
65
resulted in a lower number of microbeads immobilizing in the µPAR testing systems.
Figure 3.19e shows sequential micrographs of microbeads being railed and then immobilized in
a system with α = 2.5° (top), while microbeads are successfully railed in a system with α = 1°
(bottom). RFRs were quantified using Equation 3.7. The quantified results for the RFR
corresponding to each value of α tested are shown in Figure 3.19f. The failure rate was found to
decrease as the angle α was reduced. The system with α = 1° was the only µPAR system tested
where microbead immobilization was prevented completely. Rather, suspended microbeads
were guided along the micropost array rails into the parallel flow streams.
Figure 3.19 Experimental results for µPAR systems with varying α. (a-d) Micrographs of
microbeads immobilized in µPAR systems with: (a) α = 30°, (b) α = 20°, (c) α = 10°, and
(d) α = 5°. Scale Bars = 100 µm. (e) Sequential micrographs of microbeads railing and then
immobilizing in a system with α = 2.5° (top), while microbeads are simultaneously railed
without being immobilized in a system with α = 1° (bottom). Scale Bar = 200 µm.
(f) Quantified results for the railing failure rate (RFR) corresponding to each α tested. RFR
values were quantified using Equation 3.7.
3.4.4.2 Synthesizing Four Distinct Extended Biological Linker Lengths in Parallel via
Multiplexed µPAR
For the synthesis of the four extended biological linkers in parallel, an α of 1° was used.
The micropost array rails were observed to direct the microbeads through the distinct reagents
and wash solutions as designed. For example, Figure 3.20 shows sequential micrographs of
microbeads being transported from: (a) the bead suspension (blue) to the biotinylated BSA
solution (yellow), (b) the biotinylated BSA solution (yellow) to the PBS wash solution (white),
(c) the PBS wash solution (white) to the NeutrAvidin solution (green), (d) the NeutrAvidin
solution (green) back to the PBS wash solution (white), and (e) the PBS wash solution (white)
back to the biotinylated BSA solution (yellow). In the multiplexed µPAR system, streptavidin a
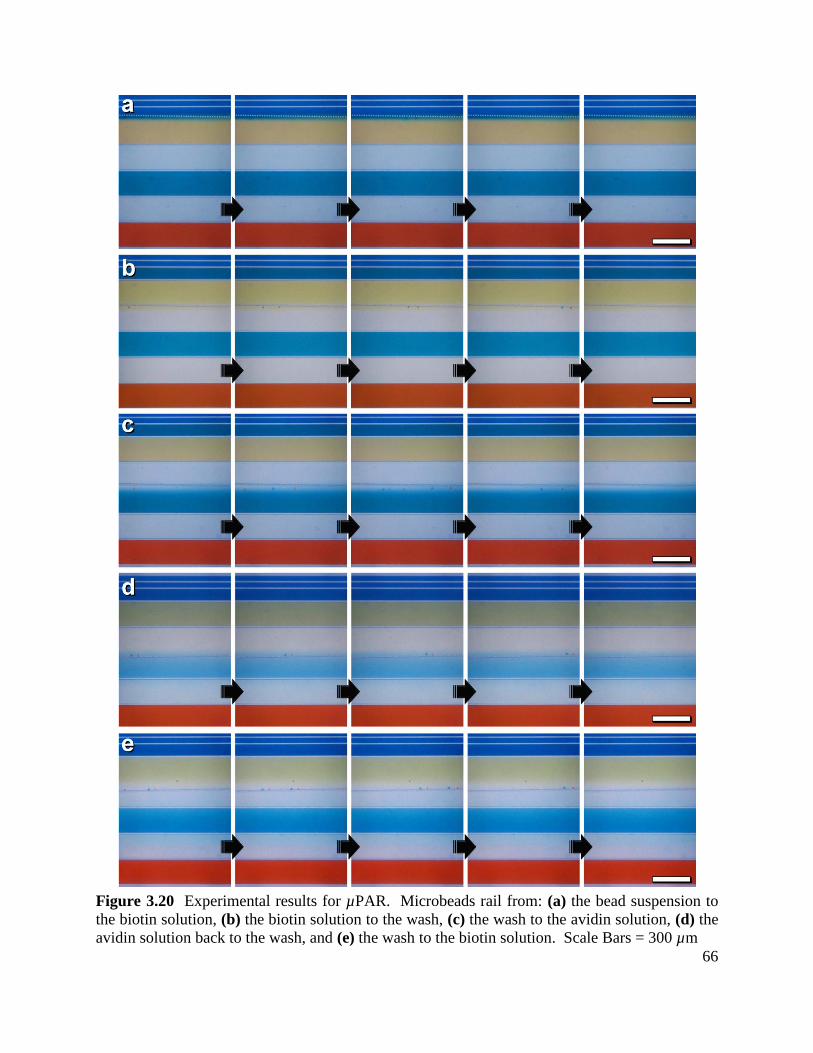
66
Figure 3.20 Experimental results for µPAR. Microbeads rail from: (a) the bead suspension to
the biotin solution, (b) the biotin solution to the wash, (c) the wash to the avidin solution, (d) the
avidin solution back to the wash, and (e) the wash to the biotin solution. Scale Bars = 300 µm
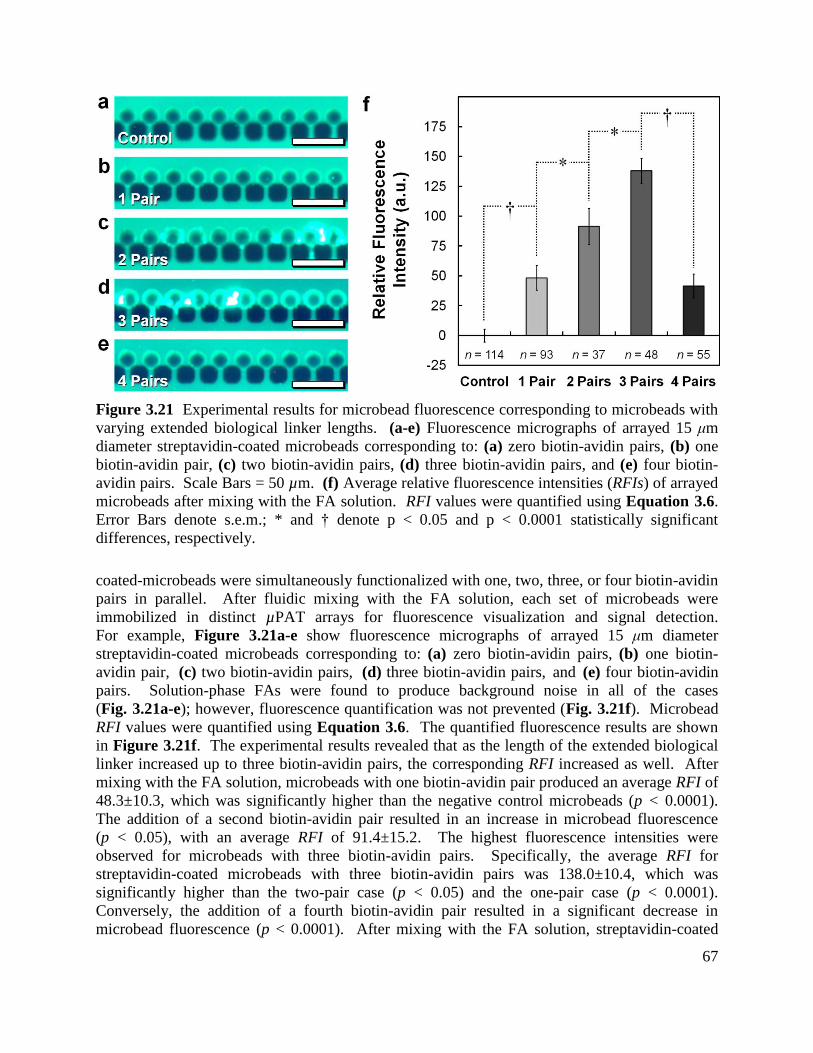
67
Figure 3.21 Experimental results for microbead fluorescence corresponding to microbeads with
varying extended biological linker lengths. (a-e) Fluorescence micrographs of arrayed 15 μm
diameter streptavidin-coated microbeads corresponding to: (a) zero biotin-avidin pairs, (b) one
biotin-avidin pair, (c) two biotin-avidin pairs, (d) three biotin-avidin pairs, and (e) four biotin-
avidin pairs. Scale Bars = 50 µm. (f) Average relative fluorescence intensities (RFIs) of arrayed
microbeads after mixing with the FA solution. RFI values were quantified using Equation 3.6.
Error Bars denote s.e.m.; * and † denote p < 0.05 and p < 0.0001 statistically significant
differences, respectively.
coated-microbeads were simultaneously functionalized with one, two, three, or four biotin-avidin
pairs in parallel. After fluidic mixing with the FA solution, each set of microbeads were
immobilized in distinct µPAT arrays for fluorescence visualization and signal detection.
For example, Figure 3.21a-e show fluorescence micrographs of arrayed 15 μm diameter
streptavidin-coated microbeads corresponding to: (a) zero biotin-avidin pairs, (b) one biotin-
avidin pair, (c) two biotin-avidin pairs, (d) three biotin-avidin pairs, and (e) four biotin-avidin
pairs. Solution-phase FAs were found to produce background noise in all of the cases
(Fig. 3.21a-e); however, fluorescence quantification was not prevented (Fig. 3.21f). Microbead
RFI values were quantified using Equation 3.6. The quantified fluorescence results are shown
in Figure 3.21f. The experimental results revealed that as the length of the extended biological
linker increased up to three biotin-avidin pairs, the corresponding RFI increased as well. After
mixing with the FA solution, microbeads with one biotin-avidin pair produced an average RFI of
48.3±10.3, which was significantly higher than the negative control microbeads (p < 0.0001).
The addition of a second biotin-avidin pair resulted in an increase in microbead fluorescence
(p < 0.05), with an average RFI of 91.4±15.2. The highest fluorescence intensities were
observed for microbeads with three biotin-avidin pairs. Specifically, the average RFI for
streptavidin-coated microbeads with three biotin-avidin pairs was 138.0±10.4, which was
significantly higher than the two-pair case (p < 0.05) and the one-pair case (p < 0.0001).
Conversely, the addition of a fourth biotin-avidin pair resulted in a significant decrease in
microbead fluorescence (p < 0.0001). After mixing with the FA solution, streptavidin-coated
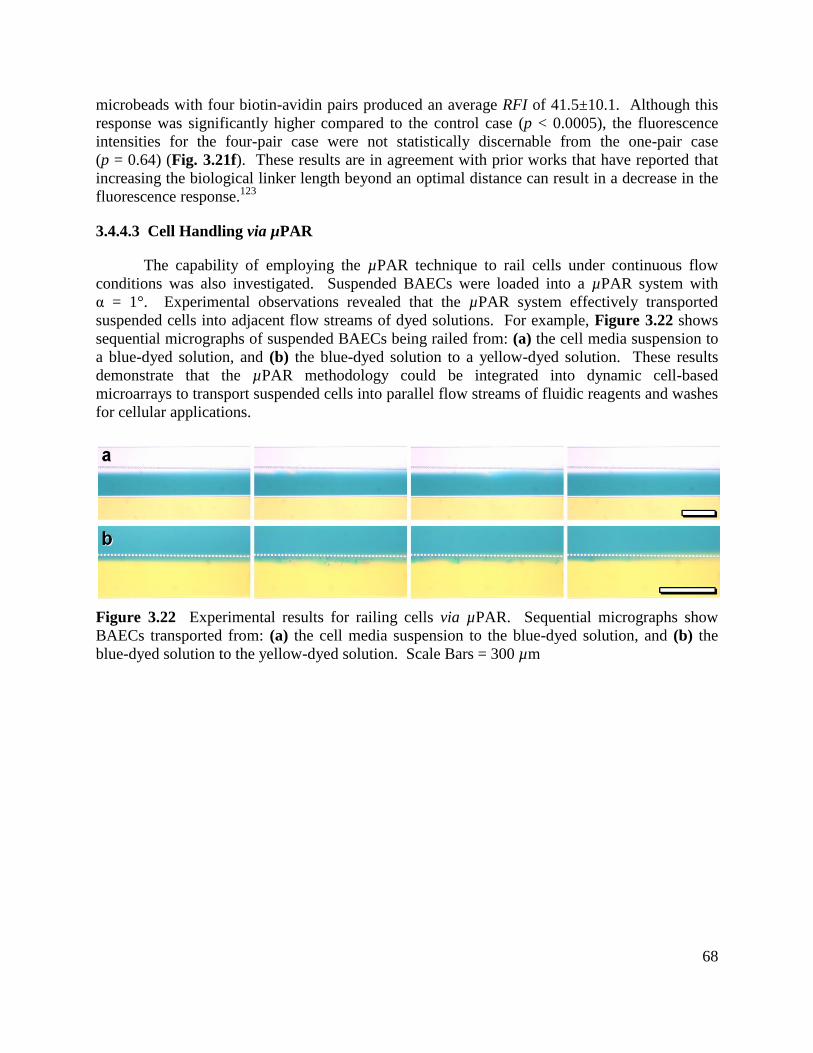
68
microbeads with four biotin-avidin pairs produced an average RFI of 41.5±10.1. Although this
response was significantly higher compared to the control case (p < 0.0005), the fluorescence
intensities for the four-pair case were not statistically discernable from the one-pair case
(p = 0.64) (Fig. 3.21f). These results are in agreement with prior works that have reported that
increasing the biological linker length beyond an optimal distance can result in a decrease in the
fluorescence response.123
3.4.4.3 Cell Handling via µPAR
The capability of employing the µPAR technique to rail cells under continuous flow
conditions was also investigated. Suspended BAECs were loaded into a µPAR system with
α = 1°. Experimental observations revealed that the µPAR system effectively transported
suspended cells into adjacent flow streams of dyed solutions. For example, Figure 3.22 shows
sequential micrographs of suspended BAECs being railed from: (a) the cell media suspension to
a blue-dyed solution, and (b) the blue-dyed solution to a yellow-dyed solution. These results
demonstrate that the µPAR methodology could be integrated into dynamic cell-based
microarrays to transport suspended cells into parallel flow streams of fluidic reagents and washes
for cellular applications.
Figure 3.22 Experimental results for railing cells via µPAR. Sequential micrographs show
BAECs transported from: (a) the cell media suspension to the blue-dyed solution, and (b) the
blue-dyed solution to the yellow-dyed solution. Scale Bars = 300 µm
69
Chapter 4: Conclusions and Future Directions
4.1 Micropost Array Gradients for Cell Handling
Micropost array gradients provide an effective technique for engineering the biophysical
properties of discrete, microscale substrate features via simple, accurate, and repeatable
fabrication processes. Here, unidirectional micropost array gradients of variable micropost
stiffness and variable interpost spacing were constructed to regulate cell motility via durotaxis
and spatiotaxis stimuli, respectively.
4.1.1 Micropost Array Gradients for Inducing Cellular Durotaxis
Unidirectional micropost array stiffness gradients were employed to investigate cell
motility in response to microtopographic mechanical cues. Two classes of micropost array
durotaxis gradients were developed, corresponding to the use of circular or elliptical microposts.
For the circular micropost array stiffness gradients, the radii (and therefore, stiffness) of arrayed
microposts were increased in a single, designed direction. For the elliptical micropost array
stiffness gradients, the major axes of arrayed microposts were increased in a single direction,
while the minor axes were simultaneously decreased. BAECs seeded on both types of micropost
array stiffness gradients exhibited higher displacements and speeds in the direction of increasing
micropost stiffness versus opposite that direction. Additionally, higher gradient strength was
found to enhance this directional response. Between the two types of micropost array stiffness
gradients, the use of elliptical microposts offers a superior technique for applying durotactic
stimuli to living cells. In particular, the anisotropy of elliptical microposts enables the
application of dual-axis durotaxis cues to seeded cells. Experimental results for the elliptical
micropost array stiffness gradients revealed that cell migration was not only promoted in the
direction of increasing micropost stiffness, but also that cell movement perpendicular to that
direction was reduced. These results suggest that the micropost array stiffness gradient
methodology offers a unique and passive technique for regulating the motile processes of seeded
cells via substrate-based mechanical cues.
4.1.2 Micropost Array Gradients for Inducing Cellular Spatiotaxis
Microtopographic techniques have previously been utilized to tune the mechanical
properties of discrete substrate features for studying and directing cellular functions; however,
the effects of changes in micropost spacing on cellular behavior have remained elusive.
The spacing between circular microposts was gradually decreased from post-to-post over the
lengths of micropost arrays. BAECs seeded on the micropost array spacing gradients exhibited
higher displacements and speeds in the direction of decreasing interpost spacing versus opposite
that direction. Higher gradient strength was found to enhance this directional response.
This work represents the first explicit demonstration of unidirectional spatiotaxis, i.e., the ability
to regulate cell motility by varying the spacing of substrate binding sites in a single direction.
Although further study is needed to elucidate the specific mechanisms underlying the spatiotaxis
migratory response, the experimental results demonstrate that the spacing between
microtopographic features represents a determinant factor in cell motility.
70
4.1.3 Micropost Array Gradients to Examine Cellular Durotaxis versus Spatiotaxis
A microfabricated post array with variable interpost spacing and micropost stiffness was
employed to investigate the effects of microtopographic spatial stimuli on the mechanical
response of living cells. Experimental results revealed that changes in micropost spacing can
significantly limit the effects of mechanical substrate cues on cell motility. In response to post-
to-post differences in interpost spacing of 40 nm (on average), seeded cells exhibited preferential
migration opposite the direction of the mechanical stimuli. Thus, these results suggest that
microtopographic spatial stimuli can be a determinant factor in directional migration.
Additionally, the design of micropost spacing can be critical to the efficacy of cellular platforms
for mechanobiological applications.
4.1.4 Future Directions for Micropost Array Gradients
The use of micro- and nanotopographic methods for investigating and controlling diverse
cellular processes is expanding. Here, substrates were designed with post-to-post differences in
stiffness of 0.5 nN/μm, 2 nN/μm, 3 nN/μm, and 7.5 nN/μm, and post-post differences in spacing
of 10 nm, 20 nm, and 40 nm (on average). However, both the stiffness and spacing gradient
strength of micropost arrays can be tailored corresponding to specific applications. Although the
current studies employed unidirectional micropost array gradients in linear arrangements,
individual microposts can be independently placed and geometrically tuned to achieve diverse
configurations of substrate stiffness and interpost spacing (e.g., radial gradients). Micropost
array gradients could also be scaled up or down as desired. In particular, scaling the micropost
array stiffness gradient methodology down to the nanoscale (i.e., using nanoposts) would better
mimic continuous rigidity gradients that include infinitesimally small stiffness steps.
Because substrate rigidity and microtopography have been demonstrated to affect a variety of
cells, the presented techniques could be adapted to examine how additional cell types respond to
microtopographic stiffness and spacing gradients. Prior works have used micropost arrays to
measure cellular forces on the substrate, which suggests that the presented substrates could be
employed to elucidate the effects of biophysical gradients on the traction forces of motile cells.
Additionally, micropost array gradients could be used to reveal how intracellular processes
(e.g., actin and focal adhesion dynamics) are affected by biophysical microtopographic stimuli.
As a method for investigating the cellular response to substrate-based biophysical cues,
micropost array gradients offer a simple, yet powerful technique for applying unidirectional
biophysical stimuli to living cells. Thus, the presented methodologies could provide the
foundation for new classes of passive, microtopographic substrates capable of controlling
cellular motility via biophysical cues, particularly for cell handling applications in fields
including biomaterials, tissue engineering, and regenerative medicine.
71
4.2 Micropost Array-Based Microfluidic Platforms for Microparticle
Handling
Precision hydrodynamic controls of suspended cells are critical to the advancement of
dynamic cell-based microarrays for lab-on-a-chip applications including quantitative cell
biology, drug screening, and medical diagnostics. Here, novel micropost array-based
methodologies (i.e., µPAT and µPAR) were presented for handling both microbeads and cells in
microfluidic systems. Due to the challenges associated with handling cells versus microbeads in
microfluidic environments (e.g., high polydispersity, independent mobility, increased substrate
adhesivity, and experimental fragility), this work focused primarily on demonstrating and
characterizing the presented techniques using microbeads. The potential of employing the µPAT
and µPAR systems for cell handling applications was also investigated.
4.2.1 Trapping-and-Releasing Microbeads and Cells via Resettable µPAT
Hydrodynamic methods are ideally suited for transporting and arraying microparticles
(e.g., microbeads and cells) in microfluidic systems. The resettable µPAT technique was
demonstrated as an effective single-layer resettable hydrodynamic arraying system by:
(i) achieving high-density trapping of microparticles under positive fluidic flow, and
(ii) releasing the microparticles after switching the flow polarity to reset the microarray.
Experimental device runs with the resettable µPAT system for microbead handling revealed a
TE of 99%, a LE of 99.8%, and a RE of 100%. Due to the increased trapping density of
100 microbeads (15 μm in diameter) in a 0.6 mm2 area, higher numbers of data points
(i.e., immobilized microbeads) can be arrayed without sacrificing device area.
Experimental device runs with suspended BAECs revealed that the resettable µPAT system can
be employed for cell handling applications; however, there were several caveats. After trapping
suspended cells in the designated array positions, a small proportion of cells were observed to
migrate through the trapping sites. For releasing arrayed cells, solutions capable of enhancing
cellular detachment from the substrate (i.e., 0.5X Trypsin) were needed to achieve resettability.
4.2.2 Continuous Flow Railing of Microbeads and Cells via µPAR
The ability to rapidly mix suspended microparticles with discrete solutions of chemicals
and bio-molecules is integral to diverse biological applications. Here, a µPAR system was
developed for transporting suspended microparticles into sequential, parallel flow streams of
reagents and fluidic washes. Experimental observations revealed that increasing the angle α
above 1° decreased the railing efficiency, as microbead immobilization in the gaps between
microposts was promoted. However, microposts arrayed at an angle of 1° from the flow
direction served as a railing system by successfully preventing microbeads from immobilizing in
the gaps between microposts. In addition to railing microbeads, the µPAR system was also
successfully employed for transporting suspended BAECs into adjacent flow streams, which
demonstrates the potential of using the µPAR technique for cellular applications. This work
represents the first demonstration of microfluidic railing of either microbeads or cells into
adjacent flow streams.
72
4.2.3 Microbead-Based Applications for the Microfluidic Platforms
Although one of the goals of this dissertation was to advance cell handling in
microfluidic systems, the presented microfluidic platforms are not limited exclusively to cellular
applications. Dynamic bead-based microarrays offer an ideal platform for chemical and
biological assays; however, limitations associated with microparticle handling have hindered the
efficacy of current bead-based systems. By enhancing microbead handling and enabling multi-
stage fluidic reactions and analyses on the surface of microbeads, the microfluidic platforms
presented in this work could provide powerful techniques for microbead handling in dynamic
bead-based microarrays.
4.2.3.1 Dynamic Bead-Based Microarray with µPAT for Parallel DNA Detection
The integration of hydrodynamic microbead arraying techniques into dynamic
microarrays offers a powerful and scalable technique for achieving low-cost detection of
multiple bio-molecules in parallel. Here, a microfluidic bead-based platform was employed to
simultaneously detect multiple ssDNA oligonucleotide sequences via MBs conjugated to
polystyrene microbead substrates. Label-free solutions of PM, SNP, and MM DNA analytes
were successfully differentiated in parallel with single base-pair mismatch specificity.
Automated systems could be implemented to rapidly obtain fluorescence data from a single
fluorescence image of μPAT-immobilized microbeads, serving as an effective alternative to more
complex flow cytometry-based methods. Although the current system was employed to detect
four homogenous solutions, the present methodology could be modified to dramatically increase
parallelization by distributing the microbeads to thousands of channels – each tailored for
distinct reactions. The MB used in this study was designed to detect single nucleotide
differences in ssDNA oligonucleotide sequences; however, MBs can be used as a detection
mechanism for diverse chemicals and bio-molecules. Thus, the dynamic bead-based microarray
presented here could be adapted to achieve multiplexed detection for a wide range of biological
applications, such as POC diagnostics, drug screening, and pathogen detection.
4.2.3.2 Multi-Stage Fluidic Reactions and Analyses Under Discontinuous Flow Conditions
via MPP
Despite the capability of simultaneously detecting multiple ssDNA oligonucleotide
sequences in parallel, the dynamic microarray with μPAT presented included several limitations,
such as significant device area requirements and an inability to implement fluidic washes.
In addition, all of the experimental reagents were mixed prior to bead-immobilization, resulting
in undesired solution-phase binding, which increased background noise (and can potentially
decrease assay sensitivity). To overcome these issues, the µPAT technique was utilized in a
MPP system to achieve multi-stage fluidic reactions on microbeads under discontinuous flow
conditions, thereby precluding chip-area requirements associated with laminar diffusion-based
mixing. Fluidic washes of suspended microbeads were effectively implemented between
reaction steps to limit undesired solution-phase binding of reagents. Additionally, the
microbeads were immobilized after each reaction step to detect the fluorescence response for the
same set of microbeads after every phase of the multi-stage process. Here, MPP was used to
detect 100 pM concentrations of IFN-γ via a six-step aptamer-based sandwich assay; however,
73
the MPP technique can be adapted for diverse biological assays. These results suggest that the
MPP methodology could provide a simple and effective platform to achieve multi-stage fluidic
processes for a variety of chemical and biological applications.
4.2.3.3 Multi-Stage Fluidic Reactions Under Continuous Flow Conditions via µPAR
One disadvantage of the MPP system is that the methodology is inherently based on a
non-continuous flow process, where each reagent or fluidic wash must be loaded sequentially
and separately. Such discontinuous flow processes suffer from limitations associated with
operational time and labor. The continuous flow process of the µPAR methodology bypasses
these issues. As a demonstrative example, the µPAR technique was employed to achieve
continuous flow LbL synthesis on streptavidin-coated polystyrene microbead substrates.
Extended biological linkers consisting of one, two, three, and four biotin-avidin pairs were
conjugated to streptavidin-coated microbeads in parallel via a LbL µPAR process. Thereafter,
the microbeads were mixed with a fluorescently labeled analyte, resulting in detectable
fluorescence intensities on the surfaces of the microbeads. At maximum, the reaction process for
synthesizing an extended biological linker consisting of four biotin-avidin pairs onto a
streptavidin-coated microbead included a total of 18 fluidic stages (including 8 wash steps).
Experimental results revealed that microbead fluorescence was enhanced as the length of the
extended biological linker increased up to three biotin-avidin pairs; however, the addition of a
fourth biotin-avidin pair decreased the fluorescence response. These results suggest that the
length of biological linkers can be optimized to maximize fluorescence intensities, which is
consistent with prior studies.123
Although the continuous flow µPAR methodology provides advantages versus
discontinuous flow processes, there remained several disadvantages for achieving multi-stage
reactions and analyses compared to the MPP system. Specifically, the microbeads in the µPAR
system were immobilized exclusively after reaction completion, thereby preventing microbead
visualization and fluorescence detection over the course of the LbL process. This issue could be
circumvented by varying the angle at which the microposts are arrayed with respect to the
direction of the fluid flow (e.g., from 1° to 2.5°) to immobilize a distinct number of microbeads
within the µPAR system. Another issue is that the 1° angle between the arrayed microposts and
the flow direction (i.e., for ensuring successful railing) greatly increases the device area
requirements of µPAR systems. Consequently, for cases where minimal device area is desired,
the MPP methodology would present a superior technique compared to the µPAR system.
4.2.4 Future Directions for the Microfluidic Platforms for Microparticle Handling
In this dissertation, microposts were arrayed in microfluidic systems to achieve three
fundamental accomplishments. First, a µPAT system was presented to facilitate the transport
and immobilization of suspended cells and microbeads in designated array positions via a single-
layer hydrodynamic technique. Secondly, microfluidic platforms were developed to mix
suspended particles with multiple, discrete fluidic reagents and washes to perform multi-stage
fluidic processes under discontinuous and continuous flow conditions via the MPP and µPAR
methodologies, respectively. These systems could be particularly beneficial for surface-based
biochemical assays, where the ability to rapidly synthesize multiple bio-molecules and chemicals
74
onto microbead substrates is desired. Lastly, the µPAT system was also demonstrated for
releasing previously immobilized cells and microbeads from trapping positions to enable
microarray resettability. The resettable µPAT technique could be used to rapidly retrieve high
numbers of microparticles for analysis following microfluidic particulate-based assays.
Additionally, the ability to reset microarrays could greatly reduce the costs, time, and labor
associated with fabricating one-time-use devices.
The presented µPAT and µPAR systems were designed with microparticles and
microposts that were approximately the same size. Thus, these techniques could be scaled up or
down as desired (i.e., to handle particles of various sizes). For example, the µPAT and µPAR
systems could be tailored to handle a variety of cells types. Future work should investigate the
potential to handling bacteria using the presented methodologies. To benefit from the
advantages of nanoparticles, the presented platforms could also be scaled down to use arrayed
nanoposts for handling nanoparticles in fluidic systems.
In this work, the microfluidic systems were primarily characterized using suspended
microbeads first instead of cells (which represent a significantly higher degree of experimental
complexity). Experimental testing with microbeads before cells is highly consistent with prior
efforts of developing dynamic microarrays for cellular applications.37, 39, 81, 91-93
The bead-based
experimental results provide a fundamental basis for subsequent studies with living cells.
Similar to prior dynamic particulate-based systems, future work should concentrate on adapting
the presented platforms to achieve high control of suspended cells in microfluidic systems.
At present, both the bead-based and cell-based experimental results represent significant progress
toward robust microfluidic handling of suspended microparticles. Thus, the novel microfluidic
particulate-based platforms in this dissertation could impact a broad range of chemical and
biological fields, including quantitative cell biology, genomics, proteomics, drug discovery, and
molecular diagnostics.
75
References
1. Di Carlo, D. & Lee, L. P. Dynamic single-cell analysis for quantitative biology.
Analytical Chemistry 78, 7918-7925 (2006).
2. Gurtner, G. C., Werner, S., Barrandon, Y. & Longaker, M. T. Wound repair and
regeneration. Nature 453, 314-321 (2008).
3. Petrie, R. J., Doyle, A. D. & Yamada, K. M. Random versus directionally persistent cell
migration. Nature Reviews Molecular Cell Biology 10, 538-549 (2009).
4. Gray, D. S., Tien, J. & Chen, C. S. Repositioning of cells by mechanotaxis on surfaces
with micropatterned Young's modulus. Journal of Biomedical Materials Research Part A
66A, 605-614 (2003).
5. Hong, J. et al. in Nano/Micro Engineered and Molecular Systems 797-800 (2007).
6. Kidoaki, A. & Matsuda, T. Microelastic gradient gelatinous gels to induce cellular
mechanotaxis. Journal of Biotechnology 133, 225-230 (2008).
7. Burdick, J. A., Khademhosseini, A. & Langer, R. Fabrication of gradient hydrogels using
a microfluidics/photopolymerization process. Langmuir 20, 5153-5156 (2004).
8. Hadjipanayi, E., Mudera, V. & Brown, R. A. Guiding Cell Migration in 3D: A Collagen
Matrix with Graded Directional Stiffness. Cell Motility and the Cytoskeleton 66, 121-128
(2009).
9. Isenberg, B. C., DiMilla, P. A., Walker, M., Kim, S. & Wong, J. Y. Vascular Smooth
Muscle Cell Durotaxis Depends on Substrate Stiffness Gradient Strength. Biophysical
Journal 97, 1313-1322 (2009).
10. Wong, J. Y., Velasco, A., Rajagopalan, P. & Pham, Q. Directed movement of vascular
smooth muscle cells on gradient-compliant hydrogels. Langmuir 19, 1908-1913 (2003).
11. Zaari, N., Rajagopalan, P., Kim, S. K., Engler, A. J. & Wong, J. Y. Photopolymerization
in microfluidic gradient generators: Microscale control of substrate compliance to
manipulate cell response. Advanced Materials 16, 2133-2137 (2004).
12. Chicurel, M. E., Chen, C. S. & Ingber, D. E. Cellular control lies in the balance of forces.
Current Opinion In Cell Biology 10, 232-239 (1998).
13. Cho, M. R., Thatte, H. S., Lee, R. C. & Golan, D. E. Integrin-dependent human
macrophage migration induced by oscillatory electrical stimulation. Annals Of
Biomedical Engineering 28, 234-243 (2000).
14. Choquet, D., Felsenfeld, D. P. & Sheetz, M. P. Extracellular matrix rigidity causes
strengthening of integrin-cytoskeleton linkages. Cell 88, 39-48 (1997).
15. Farboud, B., Nuccitelli, R., Schwab, I. R. & Isseroff, R. R. DC electric fields induce rapid
directional migration in cultured human corneal epithelial cells. Experimental Eye
Research 70, 667-673 (2000).
16. Jiang, X. Y., Bruzewicz, D. A., Wong, A. P., Piel, M. & Whitesides, G. M. Directing cell
migration with asymmetric micropatterns. Proceedings Of The National Academy Of
Sciences Of The United States Of America 102, 975-978 (2005).
17. Parker, K. K. et al. Directional control of lamellipodia extension by constraining cell
shape and orienting cell tractional forces. Faseb Journal 16 (2002).
18. Pelham, R. J. & Wang, Y. L. Cell locomotion and focal adhesions are regulated by the
mechanical properties of the substrate. Biological Bulletin 194, 348-349 (1998).
76
19. Singh, M., Berkland, C. & Detamore, M. S. Strategies and Applications for Incorporating
Physical and Chemical Signal Gradients in Tissue Engineering. Tissue Engineering Part
B-Reviews 14, 341-366 (2008).
20. Wang, E., Zhao, M., Forrester, J. V. & McCaig, C. D. Re-orientation and faster, directed
migration of lens epithelial cells in a physiological electric field. Experimental Eye
Research 71, 91-98 (2000).
21. Brahmbhatt, A. A. & Klemke, R. L. ERK and RhoA differentially regulate pseudopodia
growth and retraction during chemotaxis. Journal of Biological Chemistry 278, 13016-
13025 (2003).
22. Harms, B. D., Bassi, G. M., Horwitz, A. R. & Lauffenburger, D. A. Directional
persistence of EGF-Induced cell migration is associated with stabilization of
lamellipodial protrusions. Biophysical Journal 88, 1479-1488 (2005).
23. Zhelev, D. V., Alteraifi, A. M. & Chodniewicz, D. Controlled pseudopod extension of
human neutrophils stimulated with different chemoattractants. Biophysical Journal 87,
688-695 (2004).
24. Kloxin, A. M., Kasko, A. M., Salinas, C. N. & Anseth, K. S. Photodegradable Hydrogels
for Dynamic Tuning of Physical and Chemical Properties. Science 324, 59-63 (2009).
25. Brunette, D. M., Kenner, G. S. & Gould, T. R. L. Grooved Titanium Surfaces Orient
Growth and Migration of Cells from Human Gingival Explants. Journal of Dental
Research 62, 1045-1048 (1983).
26. Curtis, A. & Wilkinson, C. Topographical control of cells. Biomaterials 18, 1573-1583
(1997).
27. Dalton, B. A. et al. Modulation of epithelial tissue and cell migration by microgrooves.
Journal of Biomedical Materials Research 56, 195-207 (2001).
28. Kaiser, J. P., Reinmann, A. & Bruinink, A. The effect of topographic characteristics on
cell migration velocity. Biomaterials 27, 5230-5241 (2006).
29. Walboomers, X. F., Croes, H. J. E., Ginsel, L. A. & Jansen, J. A. Contact guidance of rat
fibroblasts on various implant materials. Journal of Biomedical Materials Research 47,
204-212 (1999).
30. Park, J. Y. et al. Single cell trapping in larger microwells capable of supporting cell
spreading and proliferation. Microfluidics and Nanofluidics 8, 263-268 (2010).
31. Park, M. C., Hur, J. Y., Cho, H. S., Park, S. H. & Suh, K. Y. High-throughput single-cell
quantification using simple microwell-based cell docking and programmable time-course
live-cell imaging. Lab on a Chip 11, 79-86 (2011).
32. Rettig, J. R. & Folch, A. Large-scale single-cell trapping and imaging using microwell
arrays. Analytical Chemistry 77, 5628-5634 (2005).
33. Yamamura, S. et al. Single-cell microarray for analyzing cellular response. Analytical
Chemistry 77, 8050-8056 (2005).
34. Di Carlo, D., Aghdam, N. & Lee, L. P. Single-cell enzyme concentrations, kinetics, and
inhibition analysis using high-density hydrodynamic cell isolation arrays. Analytical
Chemistry 78, 4925-4930 (2006).
35. Di Carlo, D., Wu, L. Y. & Lee, L. P. Dynamic single cell culture array. Lab on a Chip 6,
1445-1449 (2006).
36. Skelley, A. M., Kirak, O., Suh, H., Jaenisch, R. & Voldman, J. Microfluidic control of
cell pairing and fusion. Nature Methods 6, 147-152 (2009).
77
37. Tan, W. H. & Takeuchi, S. Dynamic microarray system with gentle retrieval mechanism
for cell-encapsulating hydrogel beads. Lab on a Chip 8, 259-266 (2008).
38. Tanyeri, M., Johnson-Chavarria, E. M. & Schroeder, C. M. Hydrodynamic trap for single
particles and cells. Applied Physics Letters 96 (2010).
39. Teshima, T., Onoe, H., Kuribayashi-Shigetomi, K. & Takeuchi, S. in The 24nd IEEE
International Conference on Micro Electro Mechanical Systems (MEMS 2011) 71-74
(Cancun, Mexico, 2011).
40. Faley, S. et al. Microfluidic platform for real-time signaling analysis of multiple single T
cells in parallel. Lab on a Chip 8, 1700-1712 (2008).
41. Faley, S. L. et al. Microfluidic single cell arrays to interrogate signalling dynamics of
individual, patient-derived hematopoietic stem cells. Lab on a Chip 9, 2659-2664 (2009).
42. Iwai, K., Tan, W.-H., Ishihara, H. & Takeuchi, S. A resettable dynamic microarray
device. Biomedical Microdevices (2011).
43. Fu, Z. et al. Microfabricated Renewable Beads-Trapping/Releasing Flow Cell for Rapid
Antigenâˆ‟Antibody Reaction in Chemiluminescent Immunoassay. Analytical Chemistry
83, 2685-2690 (2011).
44. Chan, C. E. & Odde, D. J. Traction Dynamics of Filopodia on Compliant Substrates.
Science 322, 1687-1691 (2008).
45. Trepat, X. et al. Physical forces during collective cell migration. Nature Physics 5, 426-
430 (2009).
46. Mahmud, G. et al. Directing cell motions on micropatterned ratchets. Nature Physics 5,
606-612 (2009).
47. Xia, N. et al. Directional control of cell motility through focal adhesion positioning and
spatial control of Rac activation. Faseb Journal 22, 1649-1659 (2008).
48. Heit, B., Tavener, S., Raharjo, E. & Kubes, P. An intracellular signaling hierarchy
determines direction of migration in opposing chemotactic gradients. Journal Of Cell
Biology 159, 91-102 (2002).
49. Lo, C.-M., Wang, H.-B., Dembo, M. & Wang, Y.-L. Cell Movement Is Guided by the
Rigidity of the Substrate. Biophysical Journal 79, 144-152 (2000).
50. Thakar, R. G. et al. Contractility-dependent modulation of cell proliferation and adhesion
by microscale topographical cues. Small 4, 1416-1424 (2008).
51. Akhouayri, O. et al. Mechanical strain early increases integrin-mediated focal adhesion
and tyrosine phosphorylation in osteoblast-like cells. Journal Of Bone And Mineral
Research 14, S471-S471 (1999).
52. Bischofs, I. B. & Schwarz, U. S. Cell organization in soft media due to active
mechanosensing. Proceedings Of The National Academy Of Sciences Of The United
States Of America 100, 9274-9279 (2003).
53. Schwartz, Wang & Bruinsma. Cell locomotion and focal adhesions are regulated by the
mechanical properties of the substrate - Discussion. Biological Bulletin 194, 349-350
(1998).
54. Butler, J. P., Tolic-Norrelykke, I. M., Fabry, B. & Fredberg, J. J. Traction fields,
moments, and strain energy that cells exert on their surroundings. American Journal Of
Physiology-Cell Physiology 282, C595-C605 (2002).
55. Kong, H. J., Polte, T. R., Alsberg, E. & Mooney, D. J. FRET measurements of cell-
traction forces and nano-scale clustering of adhesion ligands varied by substrate stiffness.
78
Proceedings Of The National Academy Of Sciences Of The United States Of America
102, 4300-4305 (2005).
56. Schwarz, U. S. et al. Calculation of forces at focal adhesions from elastic substrate data:
The effect of localized force and the need for regularization. Biophysical Journal 83,
1380-1394 (2002).
57. Gallant, N. D. & Garcia, A. J. Cell adhesion strengthening and focal adhesion assembly
on micropatterned substrates. Molecular Biology Of The Cell 15, 173A-173A (2004).
58. Mack, P. J., Kaazempur-Mofrad, M. R., Karcher, H., Lee, R. T. & Kamm, R. D. Force-
induced focal adhesion translocation: effects of force amplitude and frequency. American
Journal Of Physiology-Cell Physiology 287, C954-C962 (2004).
59. Ando, J., Nomura, H. & Kamiya, A. The Effect of Fluid Shear-Stress on the Migration
and Proliferation of Cultured Endothelial-Cells. Microvascular Research 33, 62-70
(1987).
60. Hsu, S., Thakar, R., Liepmann, D. & Li, S. Effects of shear stress on endothelial cell
haptotaxis on micropatterned surfaces. Biochemical and Biophysical Research
Communications 337, 401-409 (2005).
61. Soghomonians, A., Barakat, A. I., Thirkill, T. L., Blankenship, T. N. & Douglas, G. C.
Effect of shear stress on migration and integrin expression in macaque trophoblast cells.
Biochimica Et Biophysica Acta-Molecular Cell Research 1589, 233-246 (2002).
62. Verkhovsky, A. B., Svitkina, T. M. & Borisy, G. G. Self-polarization and directional
motility of cytoplasm. Current Biology 9, 11-20 (1999).
63. Galbraith, C. G., Yamada, K. M. & Sheetz, M. P. The relationship between force and
focal complex development. Journal Of Cell Biology 159, 695-705 (2002).
64. Engler, A. J., Sen, S., Sweeney, H. L. & Discher, D. E. Matrix elasticity directs stem cell
lineage specification. Cell 126, 677-689 (2006).
65. Fu, J. P. et al. Mechanical regulation of cell function with geometrically modulated
elastomeric substrates. Nature Methods 7, 733-795 (2010).
66. Saez, A., Ghibaudo, M., Buguin, A., Silberzan, P. & Ladoux, B. Rigidity-driven growth
and migration of epithelial cells on microstructured anisotropic substrates. Proceedings of
the National Academy of Sciences of the United States of America 104, 8281-8286
(2007).
67. Sniadecki, N. J. & Chen, C. S. in Methods in Cell Biology - Cell Mechanics 313-328
(2007).
68. Tan, J. L. et al. Cells lying on a bed of microneedles: An approach to isolate mechanical
force. Proceedings of the National Academy of Sciences of the United States of America
100, 1484-1489 (2003).
69. Uttayarat, P. et al. Microtopography and flow modulate the direction of endothelial cell
migration. American Journal of Physiology-Heart and Circulatory Physiology 294,
H1027-H1035 (2008).
70. Kim, D. H. et al. Guided Cell Migration on Microtextured Substrates with Variable Local
Density and Anisotropy. Advanced Functional Materials 19, 1579-1586 (2009).
71. Kim, D.-H. et al. Mechanosensitivity of fibroblast cell shape and movement to
anisotropic substratum topography gradients. Biomaterials 30, 5433-5444 (2009).
72. Sniadecki, N. J. & Chen, C. S. in Cell Mechanics 313-+ (2007).
79
73. Li, B. et al. Development of micropost force sensor array with culture experiments for
determination of cell traction forces. Cell Motility and the Cytoskeleton 64, 509-518
(2007).
74. Lin, I. K. et al. Viscoelastic mechanical behavior of soft microcantilever-based force
sensors. Applied Physics Letters 93, 251907-251907-3 (2008).
75. Ghibaudo, M. et al. Traction forces and rigidity sensing regulate cell functions. Soft
Matter 4, 1836-1843 (2008).
76. Carmona-Fontaine, C. et al. Contact inhibition of locomotion in vivo controls neural crest
directional migration. Nature 456, 957-961 (2008).
77. Chodniewicz, D. & Klemke, R. L. Guiding cell migration through directed extension and
stabilization of pseudopodia. Experimental Cell Research 301, 31-37 (2004).
78. Heath, J. & Holifield, B. Cell Locomotion - Actin Alone In Lamellipodia. Nature 352,
107-108 (1991).
79. Khoury, M. et al. A microfluidic traps system supporting prolonged culture of human
embryonic stem cells aggregates. Biomedical Microdevices 12, 1001-1008 (2010).
80. Dittrich, P. S. & Manz, A. Lab-on-a-chip: microfluidics in drug discovery. Nature
Reviews Drug Discovery 5, 210-218 (2006).
81. Tan, W. H. & Takeuchi, S. A trap-and-release integrated microfluidic system for
dynamic microarray applications. Proceedings of the National Academy of Sciences of
the United States of America 104, 1146-1151 (2007).
82. Verpoorte, E. Beads and chips: new recipes for analysis. Lab on a Chip 3, 60N-68N
(2003).
83. Lim, C. T. & Zhang, Y. Bead-based microfluidic immunoassays: The next generation.
Biosensors & Bioelectronics 22, 1197-1204 (2007).
84. Nilsson, J., Evander, M., Hammarstrom, B. & Laurell, T. Review of cell and particle
trapping in microfluidic systems. Analytica Chimica Acta 649, 141-157 (2009).
85. Wheeler, A. R. et al. Microfluidic device for single-cell analysis. Analytical Chemistry
75, 3581-3586 (2003).
86. Du, J. Y. et al. Bead-based profiling of tyrosine kinase phosphorylation identifies SRC as
a potential target for glioblastoma therapy. Nature Biotechnology 27, 77-83 (2009).
87. Horejsh, D. et al. A molecular beacon, bead-based assay for the detection of nucleic acids
by flow cytometry. Nucleic Acids Research 33 (2005).
88. Ng, J. K. K. & Liu, W. T. Miniaturized platforms for the detection of single-nucleotide
polymorphisms. Analytical and Bioanalytical Chemistry 386, 427-434 (2006).
89. Qiu, X. B. et al. Finger-actuated, self-contained immunoassay cassettes. Biomedical
Microdevices 11, 1175-1186 (2009).
90. Thompson, J. A., Du, X. G., Grogan, J. M., Schrlau, M. G. & Bau, H. H. Polymeric
microbead arrays for microfluidic applications. Journal of Micromechanics and
Microengineering 20 (2010).
91. Kobel, S., Valero, A., Latt, J., Renaud, P. & Lutolf, M. Optimization of microfluidic
single cell trapping for long-term on-chip culture. Lab on a Chip 10, 857-863 (2010).
92. Teshima, T., Ishihara, H., Iwai, K., Adachi, A. & Takeuchi, S. A dynamic microarray
device for paired bead-based analysis. Lab on a Chip 10, 2443-2448 (2010).
93. Frimat, J. P. et al. A microfluidic array with cellular valving for single cell co-culture.
Lab on a Chip 11, 231-237 (2011).
80
94. Dunbar, S. A. Applications of Luminex (R) xMAP (TM) technology for rapid, high-
throughput multiplexed nucleic acid detection. Clinica Chimica Acta 363, 71-82 (2006).
95. Ali, M. F. et al. DNA hybridization and discrimination of single-nucleotide mismatches
using chip-based microbead arrays. Analytical Chemistry 75, 4732-4739 (2003).
96. Hashmi, G. et al. A flexible array format for large-scale, rapid blood group DNA typing.
Transfusion 45, 680-688 (2005).
97. Ng, J. K., Feng, H. H. & Liu, W. T. Rapid discrimination of single-nucleotide
mismatches using a microfluidic device with monolayered beads. Analytica Chimica
Acta 582, 295-303 (2007).
98. Steemers, F. J. & Gunderson, K. L. Whole genome genotyping technologies on the
BeadArray (TM) platform. Biotechnology Journal 2, 41-49 (2007).
99. Thompson, J. A. & Bau, H. H. Microfluidic, bead-based assay: Theory and experiments.
Journal of Chromatography B-Analytical Technologies in the Biomedical and Life
Sciences 878, 228-236 (2010).
100. Hur, S. C., Tse, H. T. K. & Di Carlo, D. Sheathless inertial cell ordering for extreme
throughput flow cytometry. Lab on a Chip 10, 274-280 (2010).
101. Kim, D. N., Lee, Y. & Koh, W. G. Fabrication of microfluidic devices incorporating
bead-based reaction and microarray-based detection system for enzymatic assay. Sensors
and Actuators B-Chemical 137, 305-312 (2009).
102. Iwai, K. & Takeuchi, S. in The 22nd IEEE International Conference on Micro Electro
Mechanical Systems (MEMS 2009) 371-374 (Sorrento, Italy, 2009).
103. Lindstrom, S. & Andersson-Svahn, H. Overview of single-cell analyses: microdevices
and applications. Lab on a Chip 10, 3363-3372 (2010).
104. Syvanen, A. C. Accessing genetic variation: Genotyping single nucleotide
polymorphisms. Nature Reviews Genetics 2, 930-942 (2001).
105. Nagai, H., Narita, Y., Ohtaki, M., Saito, K. & Wakida, S. I. Single-bead analysis on a
disk-shaped microfluidic device using an antigen-immobilized bead. Analytical Sciences
23, 975-979 (2007).
106. Tuleuova, N. et al. Development of an Aptamer Beacon for Detection of Interferon-
Gamma. Analytical Chemistry 82, 1851-1857 (2010).
107. Hsieh, A. T. H., Pan, P. J. H. & Lee, A. P. Rapid label-free DNA analysis in picoliter
microfluidic droplets using FRET probes. Microfluidics and Nanofluidics 6, 391-401
(2009).
108. Strohsahl, C. M., Miller, B. L. & Krauss, T. D. Preparation and use of metal surface-
immobilized DNA hairpins for the detection of oligonucleotides. Nature Protocols 2,
2105-2110 (2007).
109. Kim, S. et al. Rapid DNA hybridization analysis using a PDMS microfluidic sensor and a
molecular beacon. Analytical Sciences 23, 401-405 (2007).
110. Jung, J. et al. Fast and sensitive DNA analysis using changes in the FRET signals of
molecular beacons in a PDMS microfluidic channel. Analytical and Bioanalytical
Chemistry 387, 2609-2615 (2007).
111. Tan, L. et al. Molecular beacons for bioanalytical applications. Analyst 130, 1002-1005
(2005).
112. Yang, J. H. et al. Real-time RT-PCR for quantitation of hepatitis C virus RNA. Journal of
Virological Methods 102, 119-128 (2002).
81
113. Zuo, X. B., Yang, X. H., Wang, K. M., Tan, W. H. & Wen, J. H. A novel sandwich assay
with molecular beacon as report probe for nucleic acids detection on one-dimensional
microfluidic beads array. Analytica Chimica Acta 587, 9-13 (2007).
114. Ng, J. K., Selamat, E. S. & Lin, W. T. A spatially addressable bead-based biosensor for
simple and rapid DNA detection. Biosensors & Bioelectronics 23, 803-810 (2008).
115. Chung, S. E., Lee, S. A., Kim, J. & Kwon, S. Optofluidic encapsulation and manipulation
of silicon microchips using image processing based optofluidic maskless lithography and
railed microfluidics. Lab on a Chip 9, 2845-2850 (2009).
116. Park, W., Lee, H., Park, H. & Kwon, S. Sorting directionally oriented microstructures
using railed microfluidics. Lab on a Chip 9, 2169-2175 (2009).
117. Lee, S. H. et al. Active Guidance of 3D Microstructures. Small 6, 2668-2672 (2010).
118. Abbyad, P., Dangla, R., Alexandrou, A. & Baroud, C. N. Rails and anchors: guiding and
trapping droplet microreactors in two dimensions. Lab on a Chip 11, 813-821 (2011).
119. Kantak, C., Beyer, S., Yobas, L., Bansal, T. & Trau, D. A 'microfluidic pinball' for on-
chip generation of Layer-by-Layer polyelectrolyte microcapsules. Lab on a Chip 11,
1030-1035 (2011).
120. Zhang, S., Yobas, L. & Trau, D. in The 12th International Conference on Miniaturized
Systems for Chemistry and Life Sciences (MicroTAS 2008) 1402-1404 (San Diego, CA,
USA, 2008).
121. Sochol, R. D. et al. in The IEEE 22nd International Conference on Micro Electro
Mechanical Systems (MEMS 2009) 304-307 (Sorrento, Italy, 2009).
122. Shimozono, S. & Miyawaki, A. Engineering FRET constructs using CFP and YFP.
Fluorescent Proteins, Second Edition 85, 381-+ (2008).
123. Yao, G. & Tan, W. H. Molecular-beacon-based array for sensitive DNA analysis.
Analytical Biochemistry 331, 216-223 (2004).
124. Zhu, Z. R., Chao, J., Yu, H. & Waggoner, A. S. Directly labeled DNA probes using
fluorescent nucleotides with different length linkers. Nucleic Acids Research 22, 3418-
3422 (1994).
125. Kwon, B. H. et al. Binding Modes of New Bis-Ru(II) Complexes to DNA: Effect of the
Length of the Linker. Bulletin of the Korean Chemical Society 31, 1615-1620 (2010).