Embed Size (px)
Citation preview
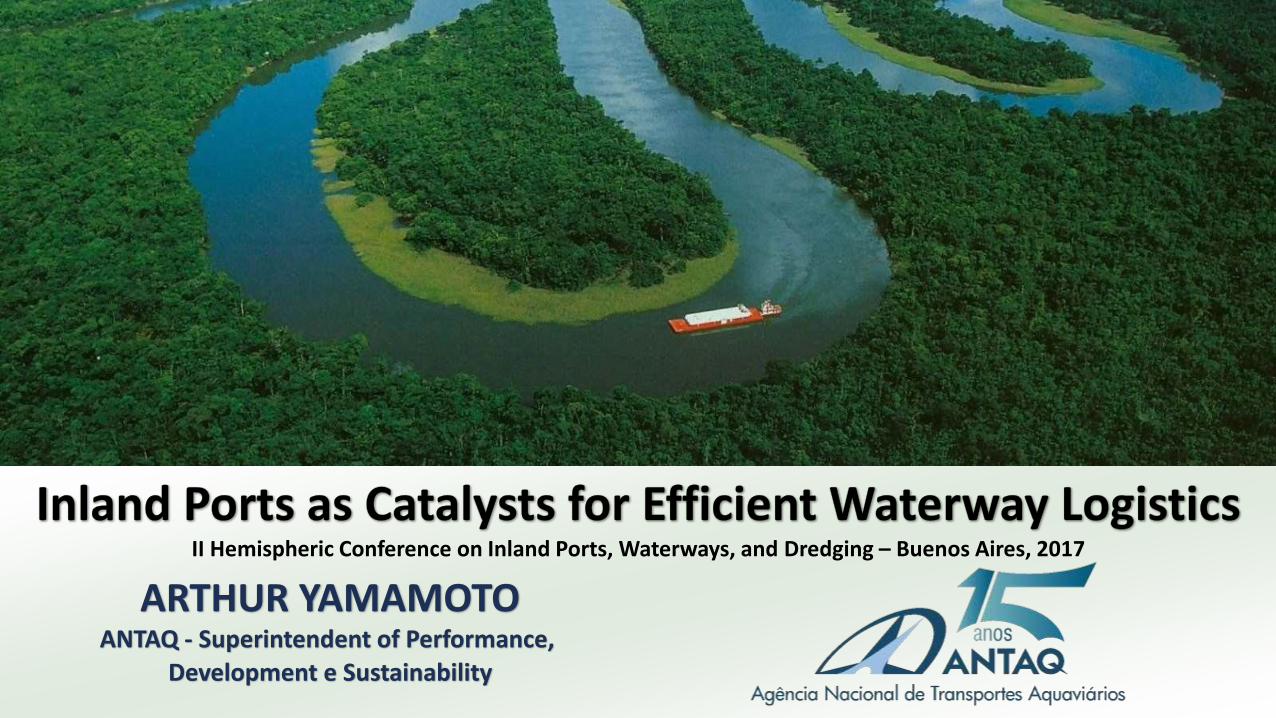
II Hemispheric Conference on Inland Ports, Waterways, and Dredging – Buenos Aires, 2017
ARTHUR YAMAMOTO ANTAQ - Superintendent of Performance,
Development e Sustainability
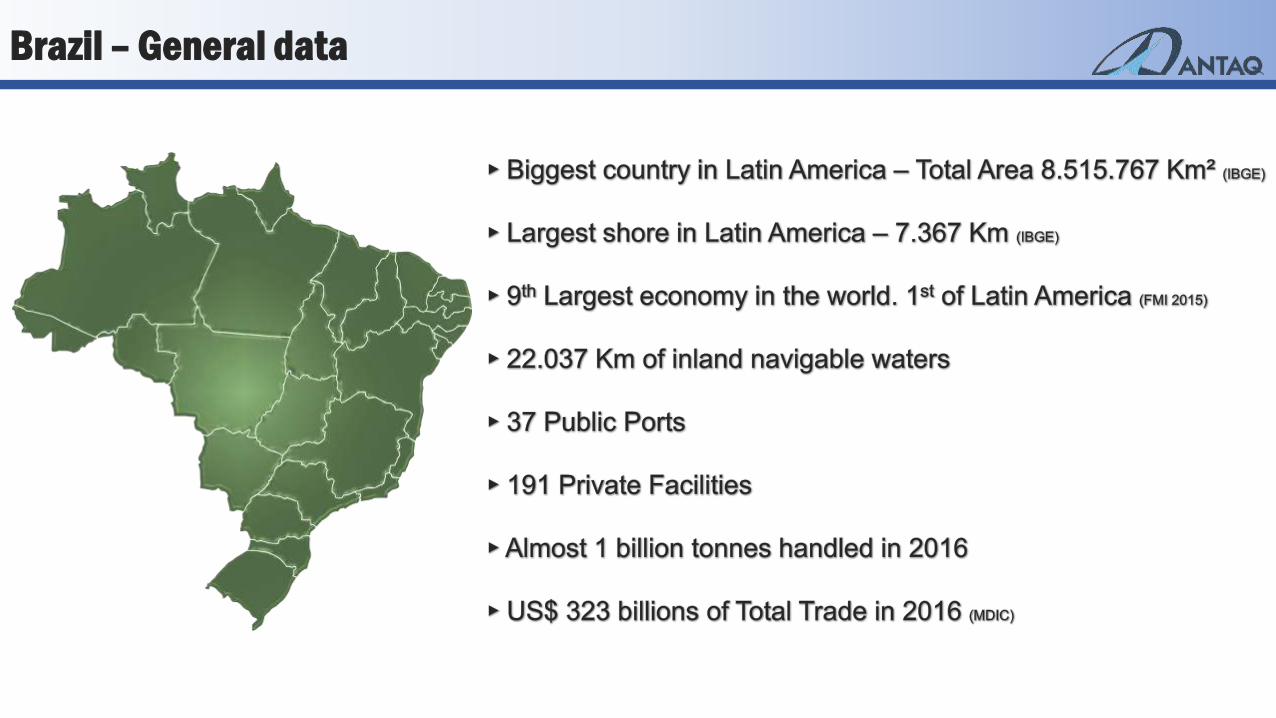
Brazil – General data
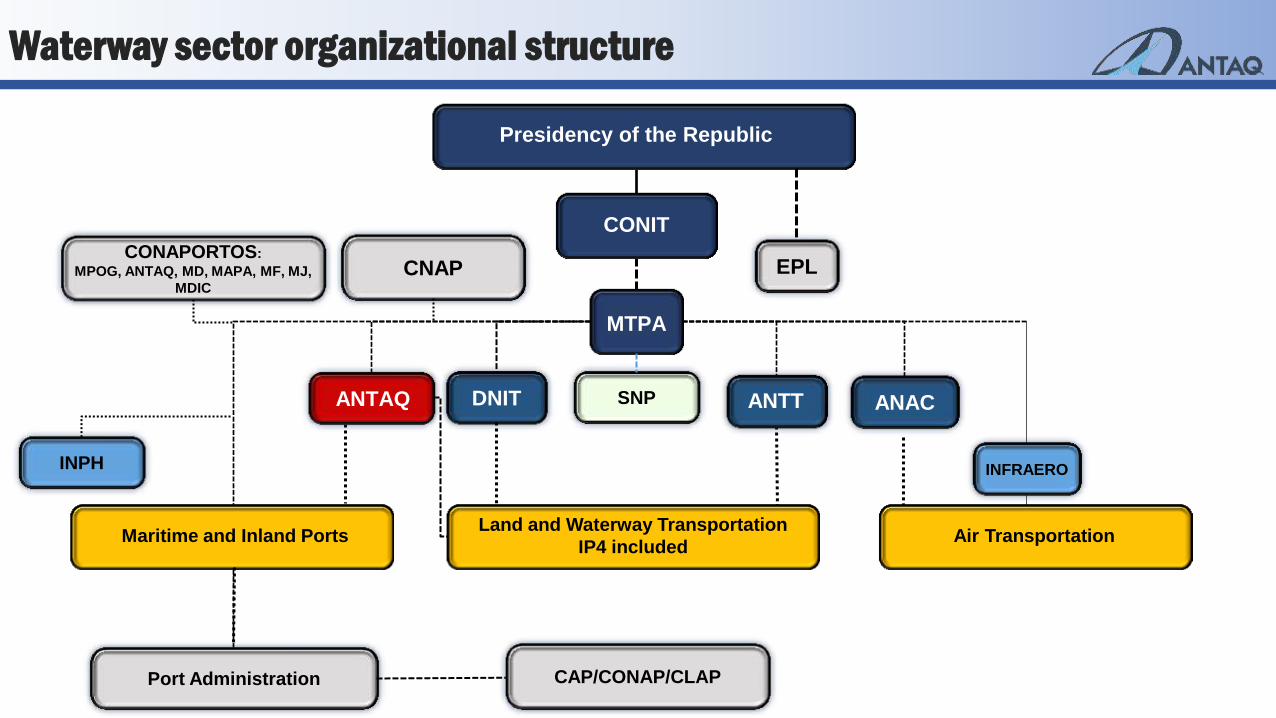
INPH
ANAC
Presidency of the Republic
CONIT
MTPA
Maritime and Inland Ports Land and Waterway Transportation
IP4 included Air Transportation
ANTT
INFRAERO
ANTAQ
EPL
Port Administration CAP/CONAP/CLAP
DNIT
CONAPORTOS:
MPOG, ANTAQ, MD, MAPA, MF, MJ,
MDIC
CNAP
Waterway sector organizational structure
SNP
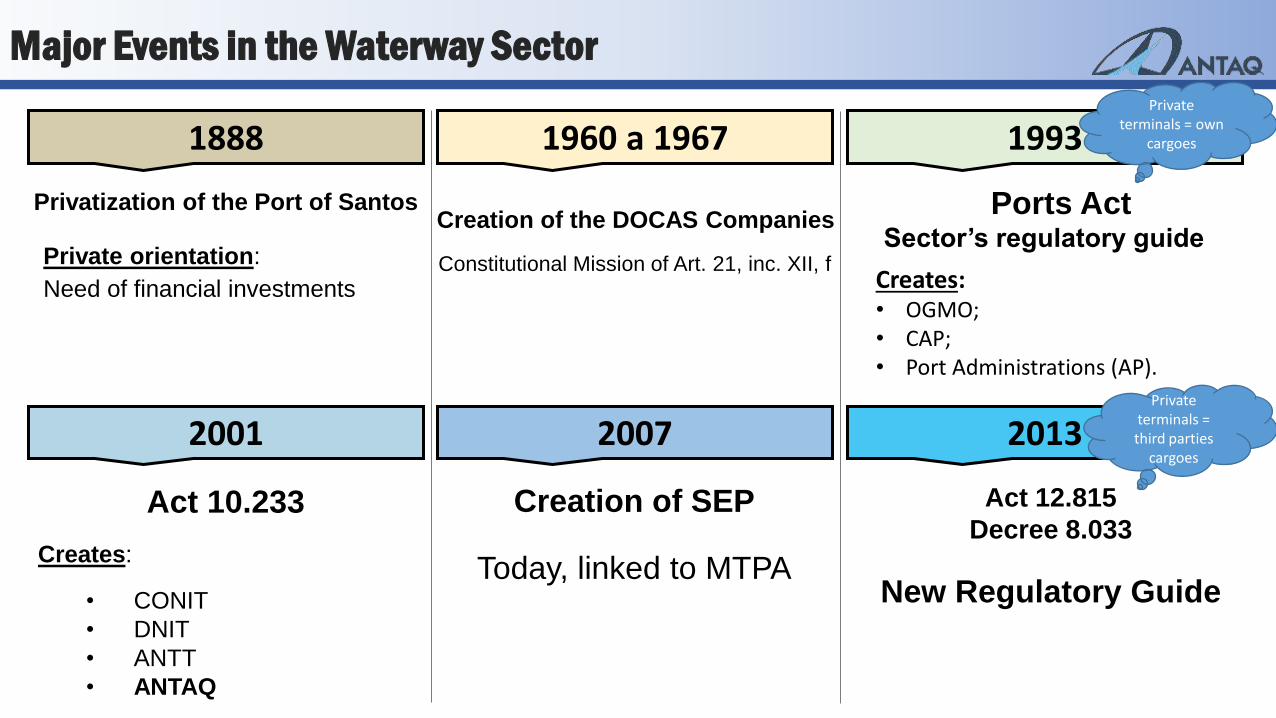
Private orientation:
Need of financial investments
Privatization of the Port of Santos Creation of the DOCAS Companies
Constitutional Mission of Art. 21, inc. XII, f
1888 1960 a 1967 1993
Ports Act
Creates: • OGMO; • CAP; • Port Administrations (AP).
Sector’s regulatory guide
2001 2007 2013
Act 10.233
Creates:
• CONIT
• DNIT
• ANTT
• ANTAQ
Creation of SEP
Today, linked to MTPA
Act 12.815
Decree 8.033
New Regulatory Guide
Major Events in the Waterway Sector
Private terminals = own
cargoes
Private terminals = third parties
cargoes
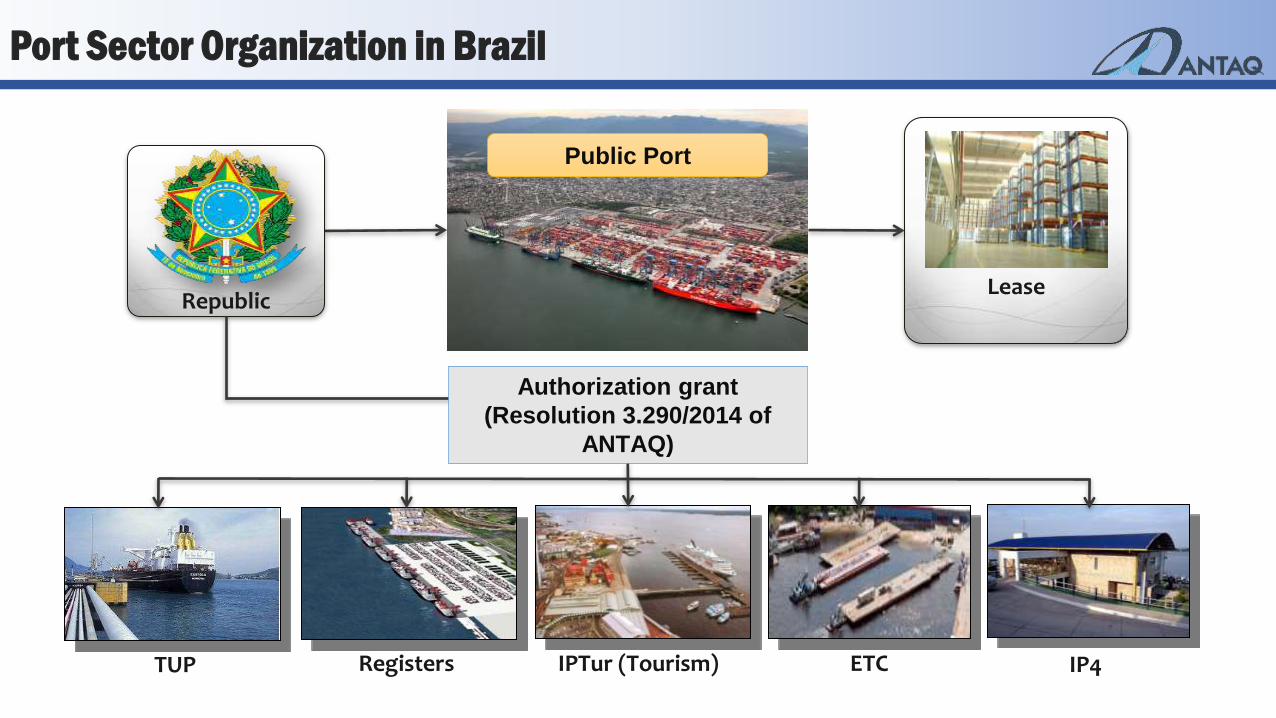
Republic Lease
TUP Registers IP4 IPTur (Tourism) ETC
Public Port
Authorization grant
(Resolution 3.290/2014 of
ANTAQ)
Port Sector Organization in Brazil
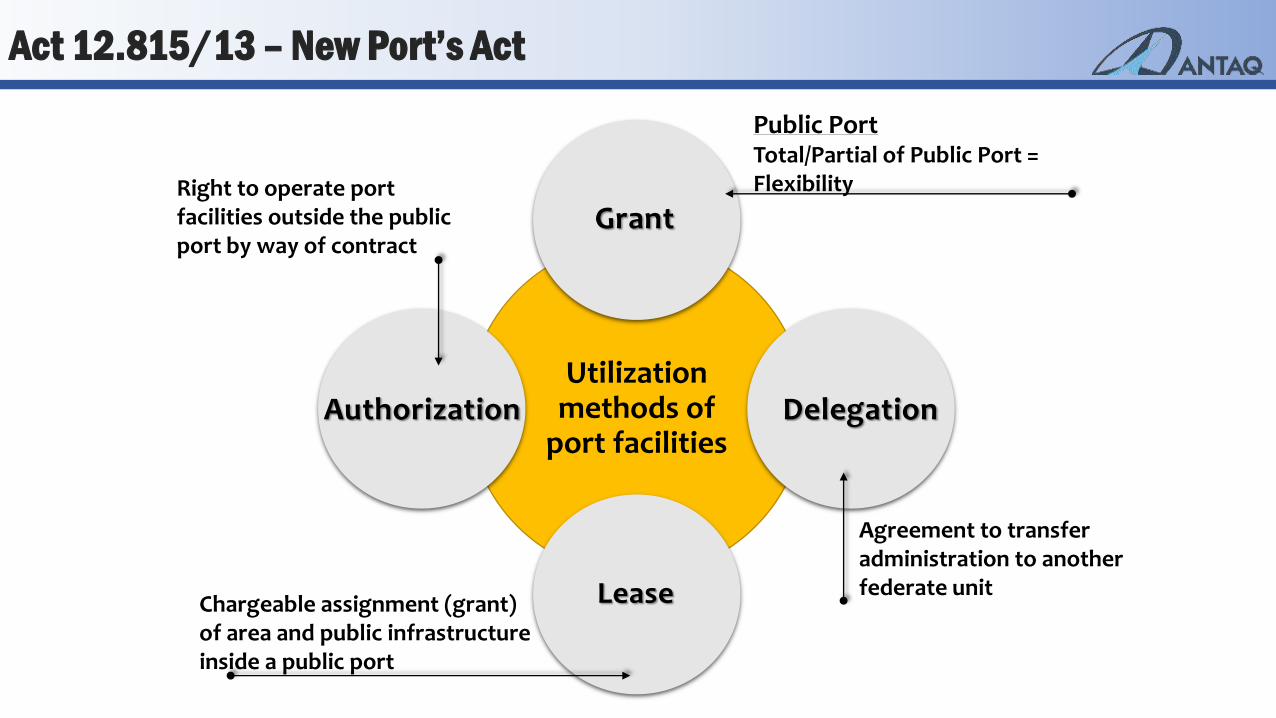
Utilization methods of
port facilities
Right to operate port facilities outside the public port by way of contract
Public Port Total/Partial of Public Port = Flexibility
Agreement to transfer administration to another federate unit
Chargeable assignment (grant) of area and public infrastructure inside a public port
Lease
Authorization Delegation
Grant
Act 12.815/13 – New Port’s Act
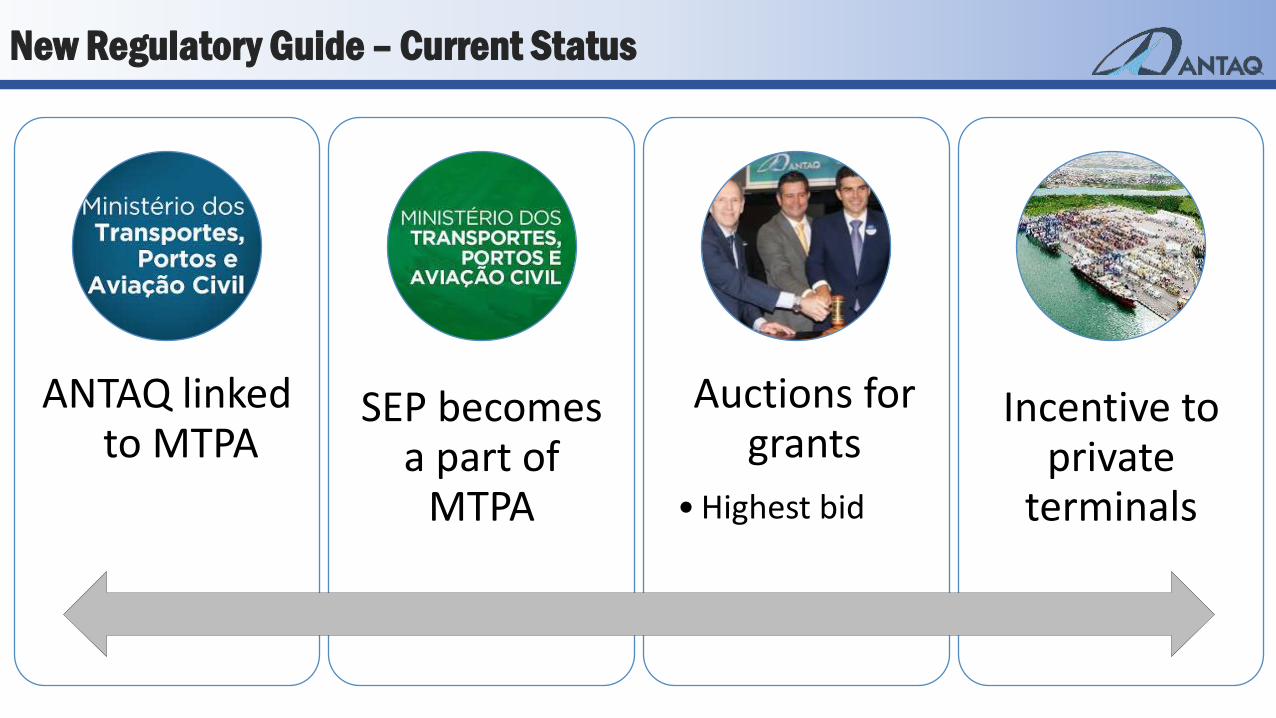
ANTAQ linked to MTPA
SEP becomes a part of
MTPA
Auctions for grants
•Highest bid
Incentive to private
terminals
New Regulatory Guide – Current Status
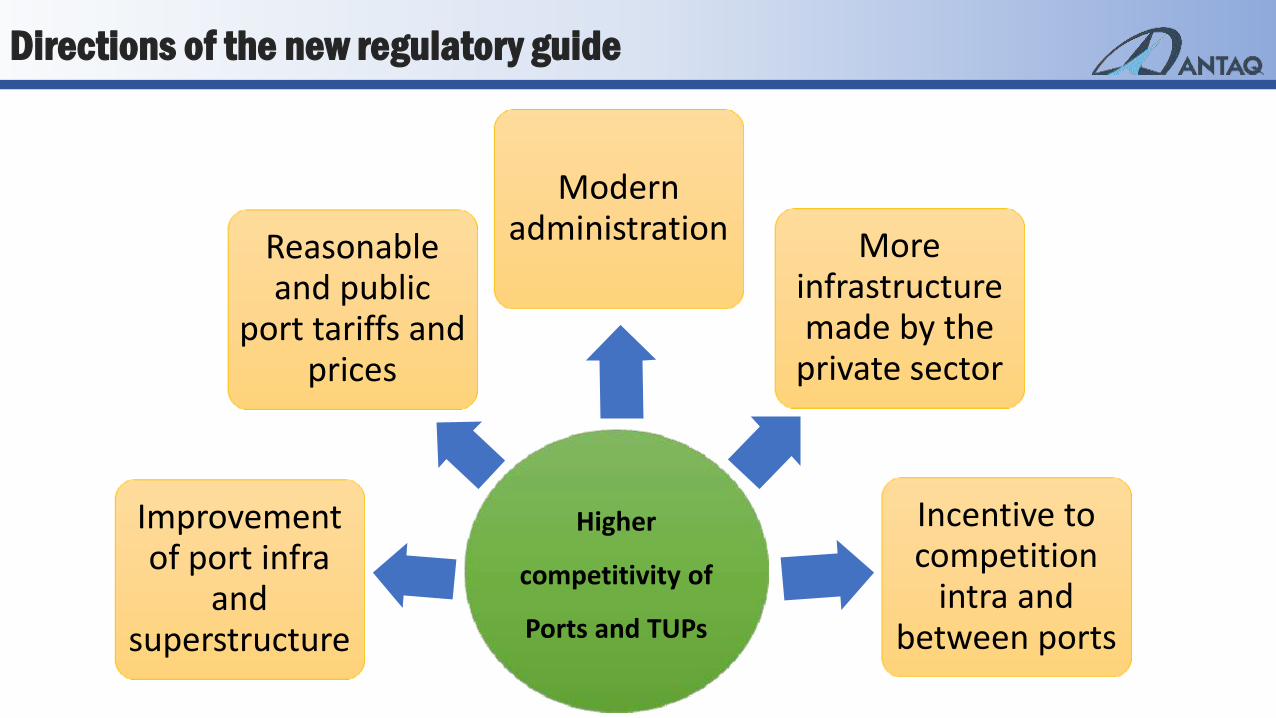
Higher
competitivity of
Ports and TUPs
Improvement of port infra
and superstructure
Reasonable and public
port tariffs and prices
Modern administration More
infrastructure made by the
private sector
Incentive to competition
intra and between ports
Directions of the new regulatory guide
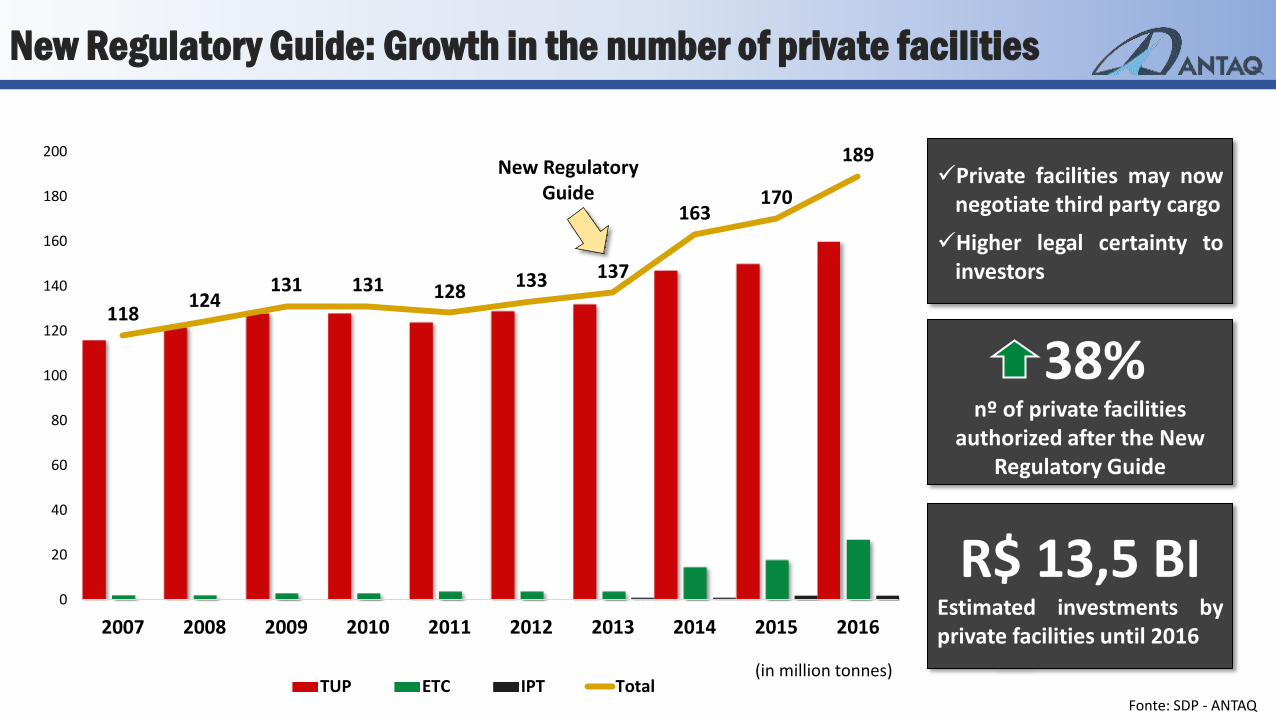
118 124
131 131 128 133 137
163 170
189
0
20
40
60
80
100
120
140
160
180
200
2007 2008 2009 2010 2011 2012 2013 2014 2015 2016
TUP ETC IPT Total
New Regulatory Guide
Private facilities may now
negotiate third party cargo
Higher legal certainty to investors
38% nº of private facilities
authorized after the New Regulatory Guide
R$ 13,5 BI Estimated investments by private facilities until 2016
Fonte: SDP - ANTAQ
(in million tonnes)
New Regulatory Guide: Growth in the number of private facilities
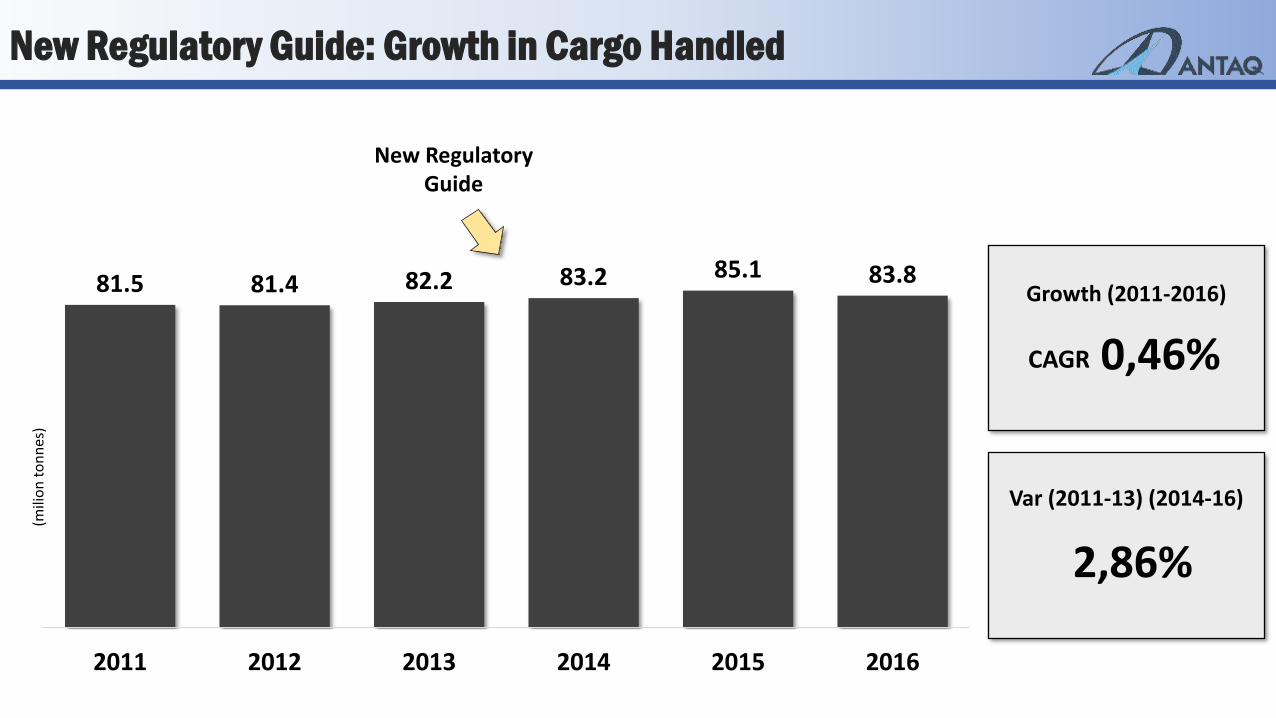
81.5 81.4 82.2 83.2 85.1 83.8
2011 2012 2013 2014 2015 2016
(mili
on
to
nn
es)
New Regulatory Guide: Growth in Cargo Handled
New Regulatory Guide
Growth (2011-2016)
0,46%
Var (2011-13) (2014-16)
2,86%
CAGR
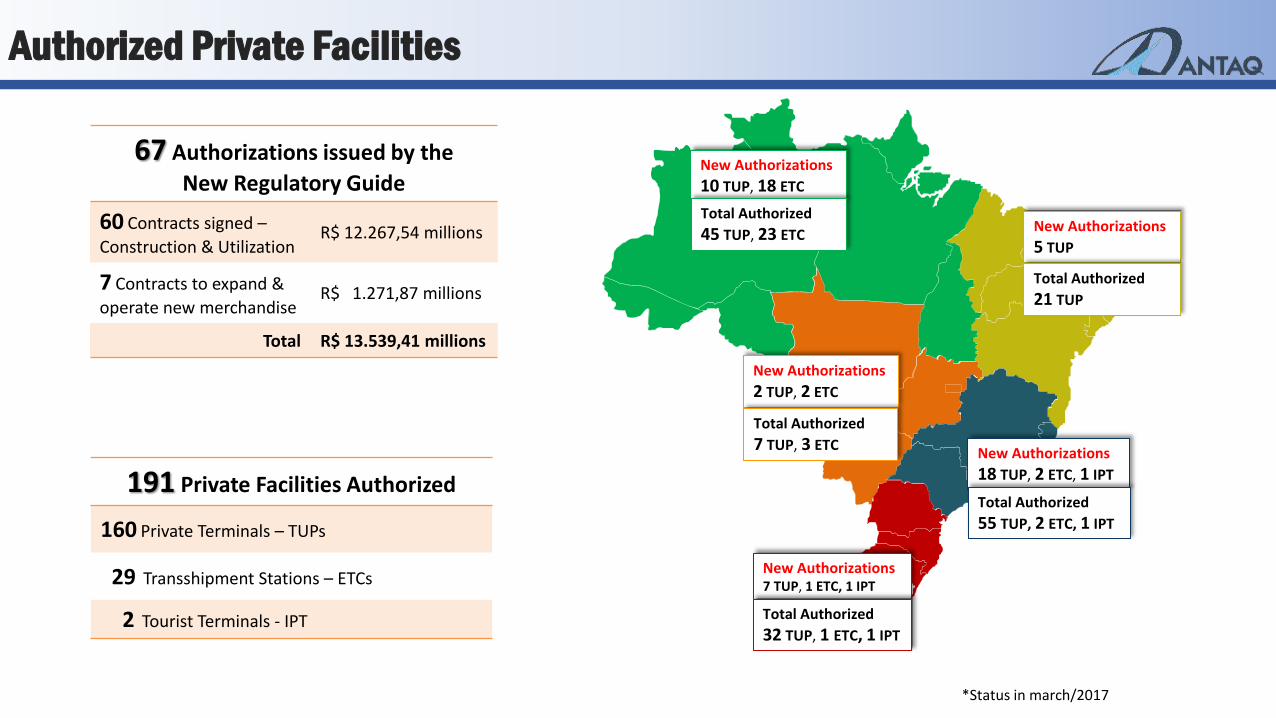
Authorized Private Facilities
MT MT
MG
GO
MG MS
67 Authorizations issued by the
New Regulatory Guide
60 Contracts signed –
Construction & Utilization R$ 12.267,54 millions
7 Contracts to expand &
operate new merchandise R$ 1.271,87 millions
Total R$ 13.539,41 millions
New Authorizations
10 TUP, 18 ETC
New Authorizations
5 TUP
New Authorizations
2 TUP, 2 ETC
New Authorizations
18 TUP, 2 ETC, 1 IPT
New Authorizations 7 TUP, 1 ETC, 1 IPT
Total Authorized
45 TUP, 23 ETC
Total Authorized
21 TUP
Total Authorized
55 TUP, 2 ETC, 1 IPT
Total Authorized
32 TUP, 1 ETC, 1 IPT
Total Authorized
7 TUP, 3 ETC
191 Private Facilities Authorized
160 Private Terminals – TUPs
29 Transshipment Stations – ETCs
2 Tourist Terminals - IPT
*Status in march/2017
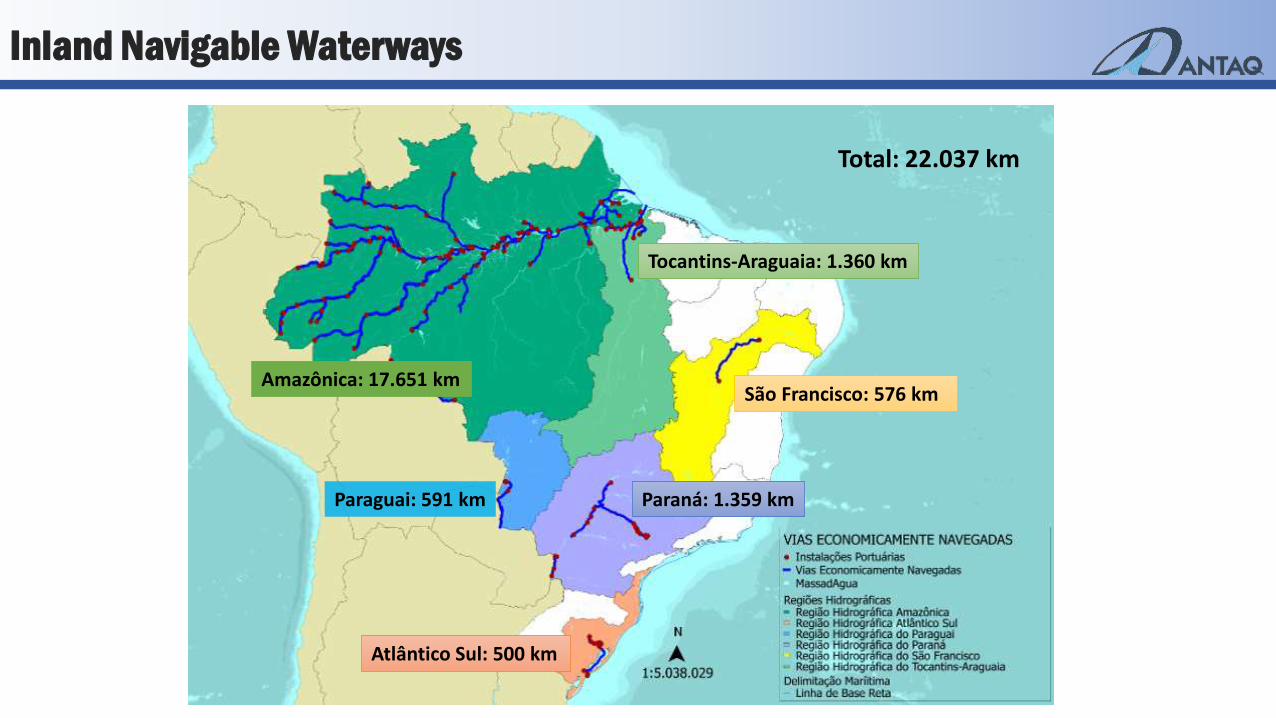
São Francisco: 576 km
Tocantins-Araguaia: 1.360 km
Amazônica: 17.651 km
Paraguai: 591 km
Atlântico Sul: 500 km
Paraná: 1.359 km
Total: 22.037 km
Inland Navigable Waterways
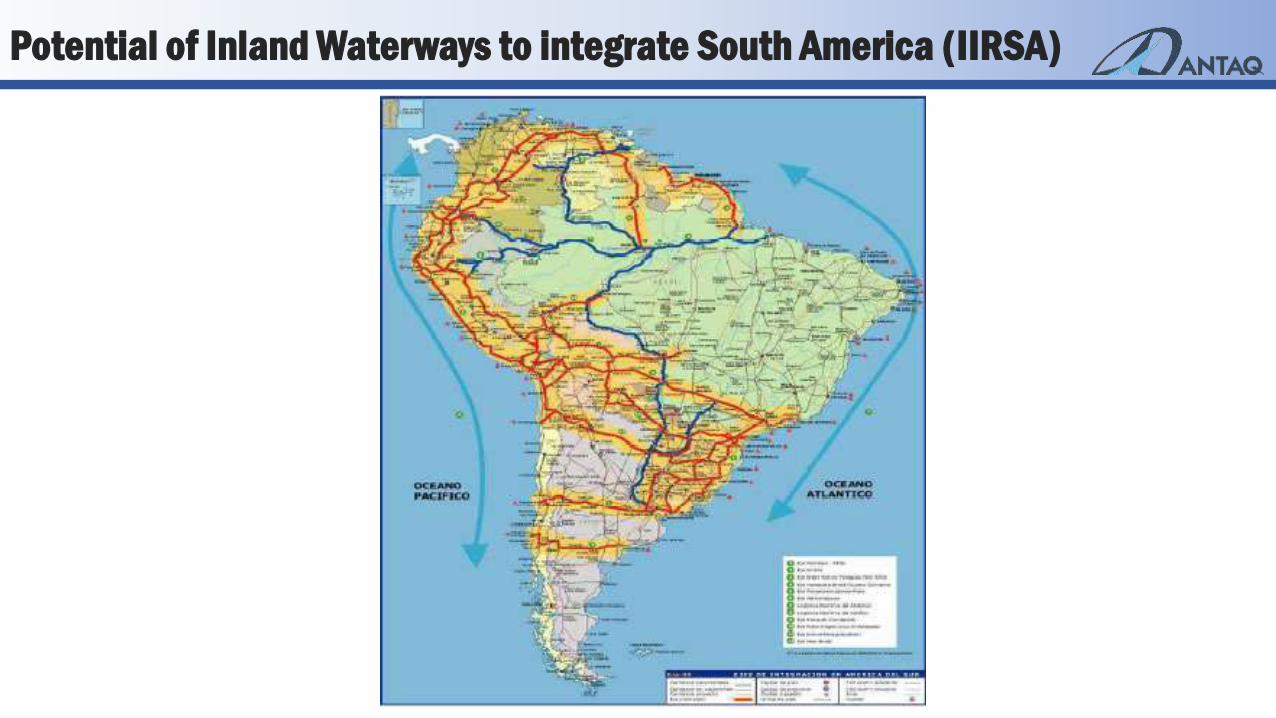
Potential of Inland Waterways to integrate South America (IIRSA)
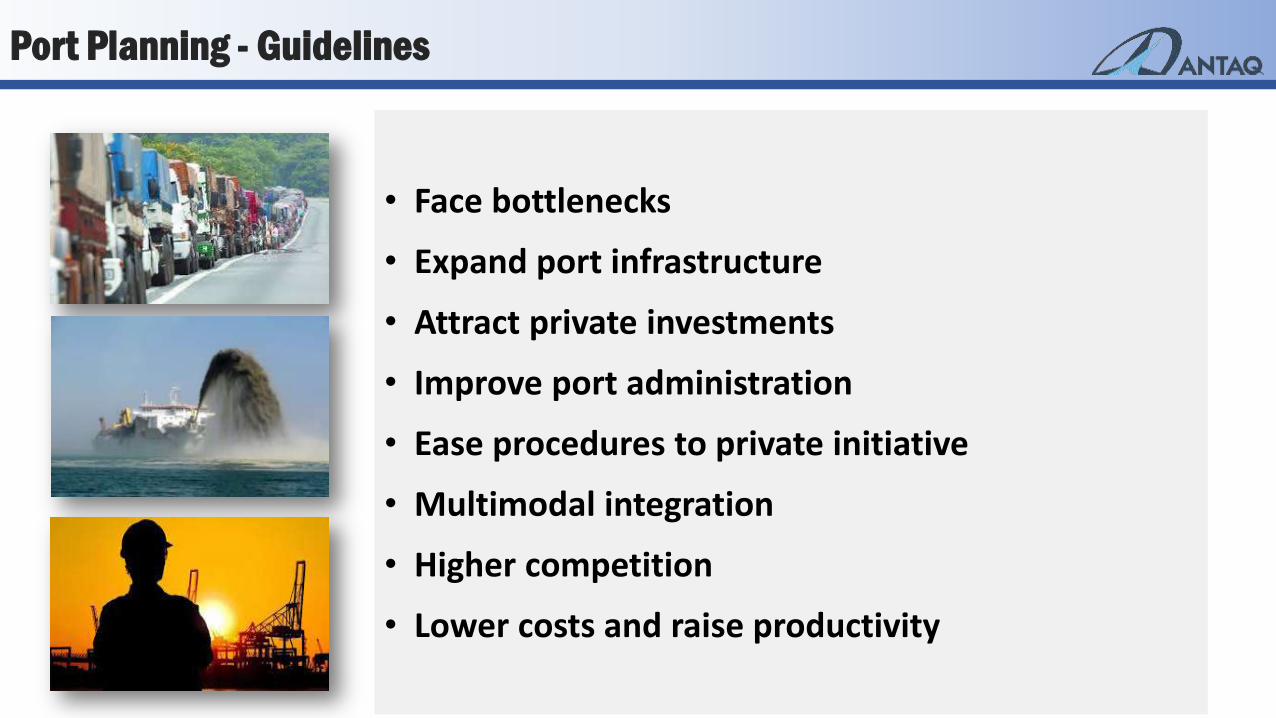
• Face bottlenecks
• Expand port infrastructure
• Attract private investments
• Improve port administration
• Ease procedures to private initiative
• Multimodal integration
• Higher competition
• Lower costs and raise productivity
Port Planning - Guidelines
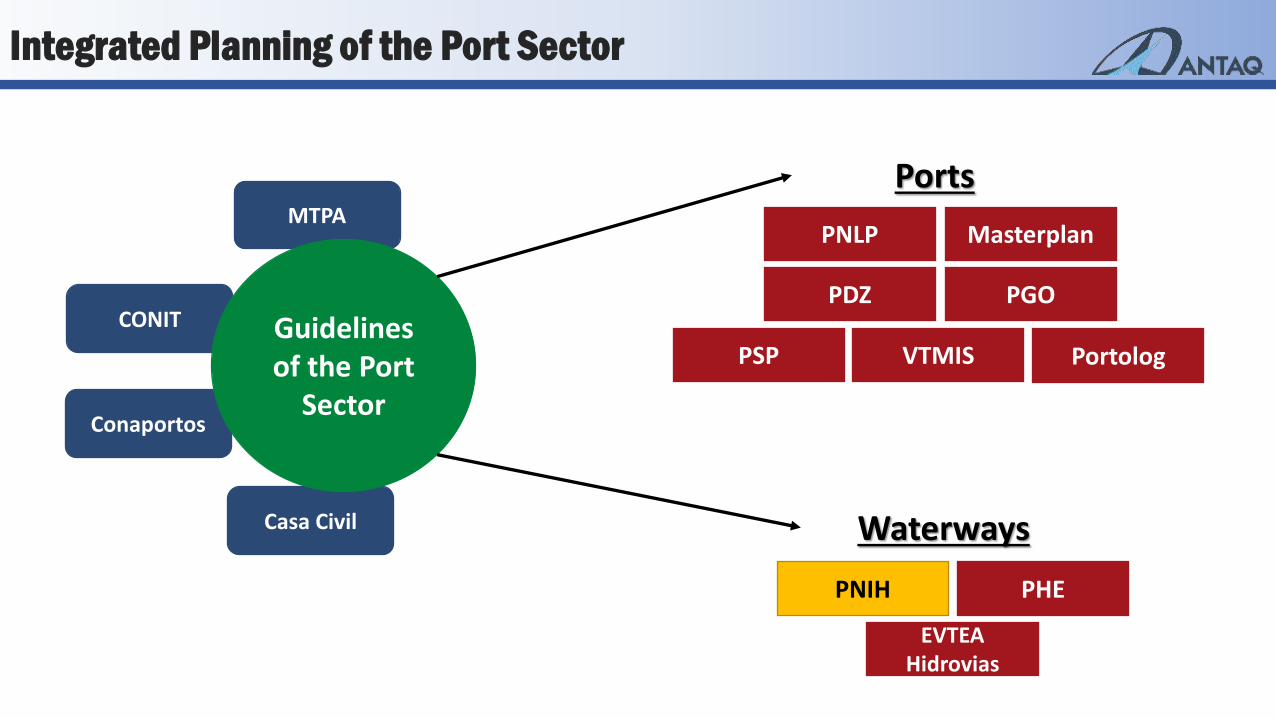
Ports
Waterways
CONIT
MTPA
Conaportos
Casa Civil
Guidelines of the Port
Sector
PNLP Masterplan
PDZ PGO
PNIH PHE
EVTEA Hidrovias
VTMIS Portolog PSP
Integrated Planning of the Port Sector
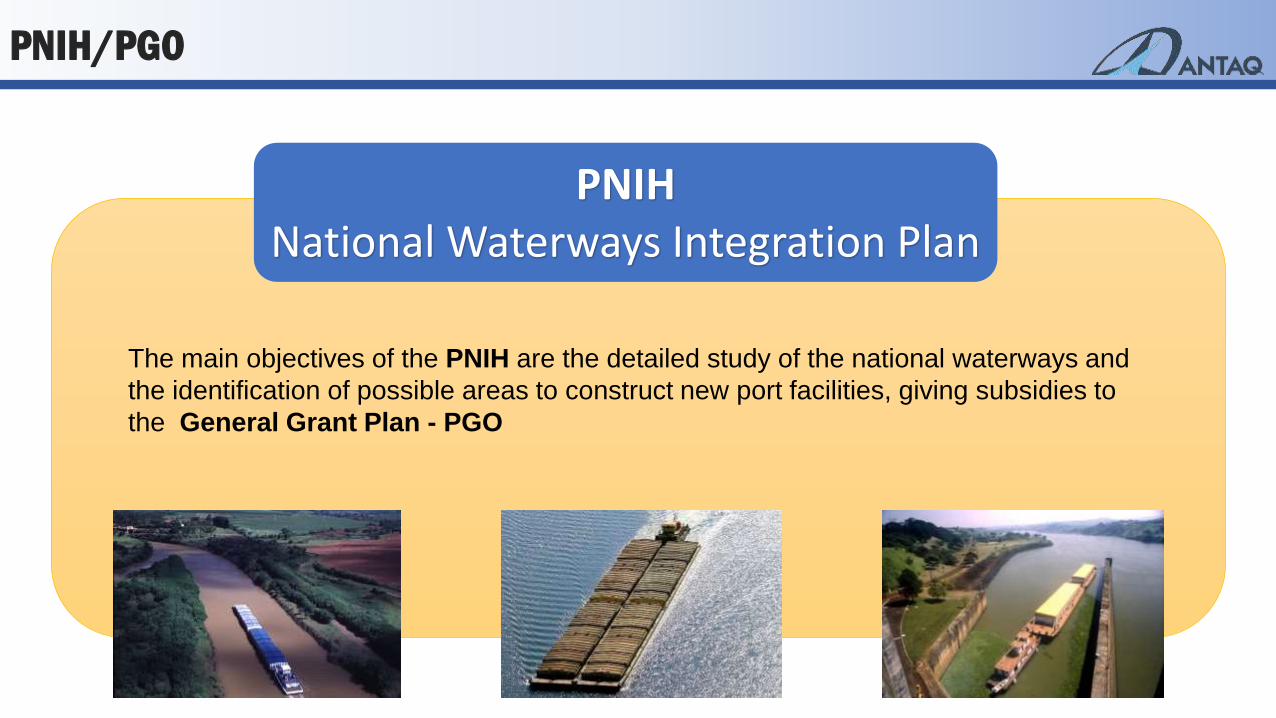
PNIH/PGO
The main objectives of the PNIH are the detailed study of the national waterways and
the identification of possible areas to construct new port facilities, giving subsidies to
the General Grant Plan - PGO
PNIH National Waterways Integration Plan
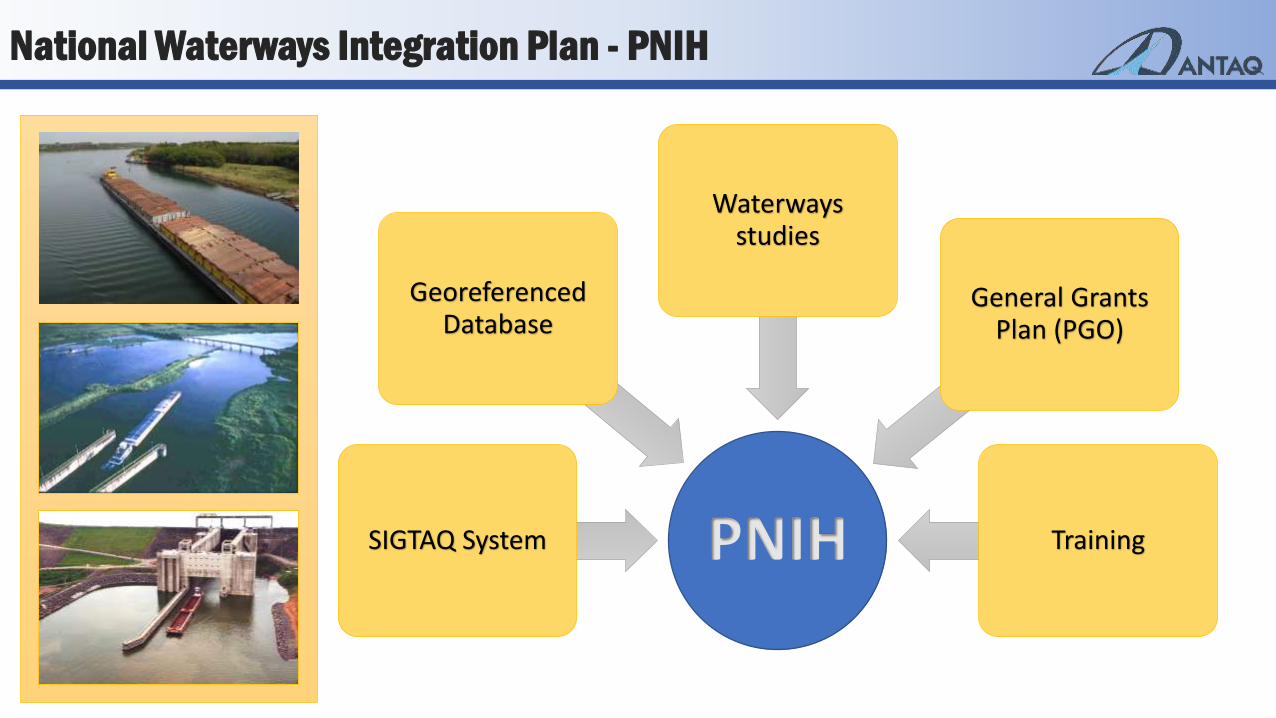
PNIH SIGTAQ System
Georeferenced Database
Waterways studies
General Grants Plan (PGO)
Training
National Waterways Integration Plan - PNIH
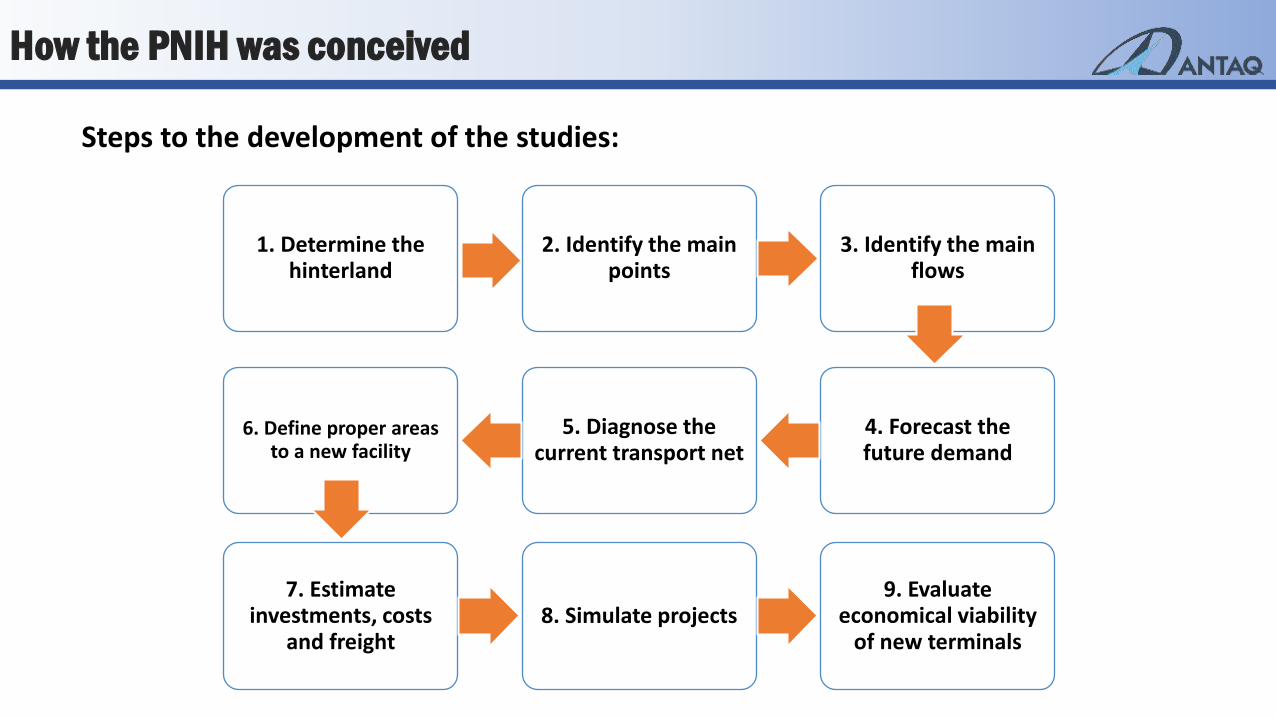
1. Determine the hinterland
2. Identify the main points
3. Identify the main flows
4. Forecast the future demand
5. Diagnose the current transport net
6. Define proper areas to a new facility
7. Estimate investments, costs
and freight 8. Simulate projects
9. Evaluate economical viability
of new terminals
Steps to the development of the studies:
How the PNIH was conceived
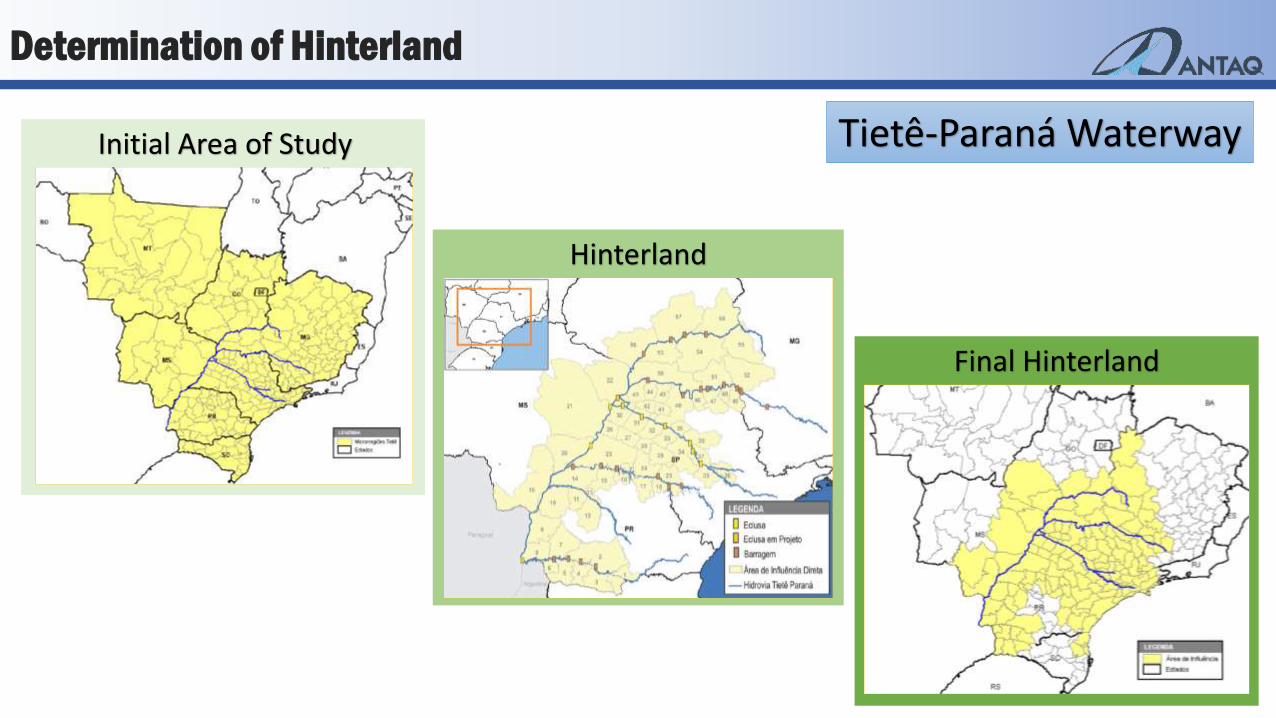
Determination of Hinterland
Initial Area of Study
Hinterland
Final Hinterland
Tietê-Paraná Waterway
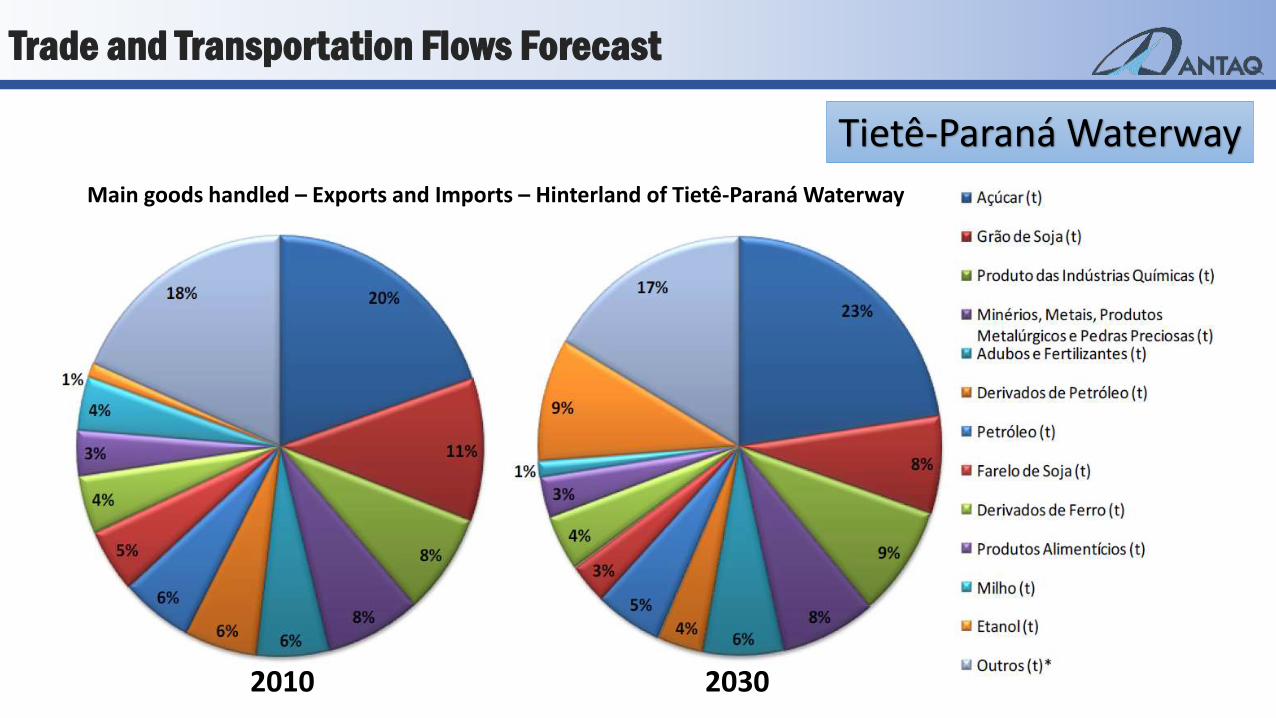
Trade and Transportation Flows Forecast
Main goods handled – Exports and Imports – Hinterland of Tietê-Paraná Waterway
2010 2030
Tietê-Paraná Waterway
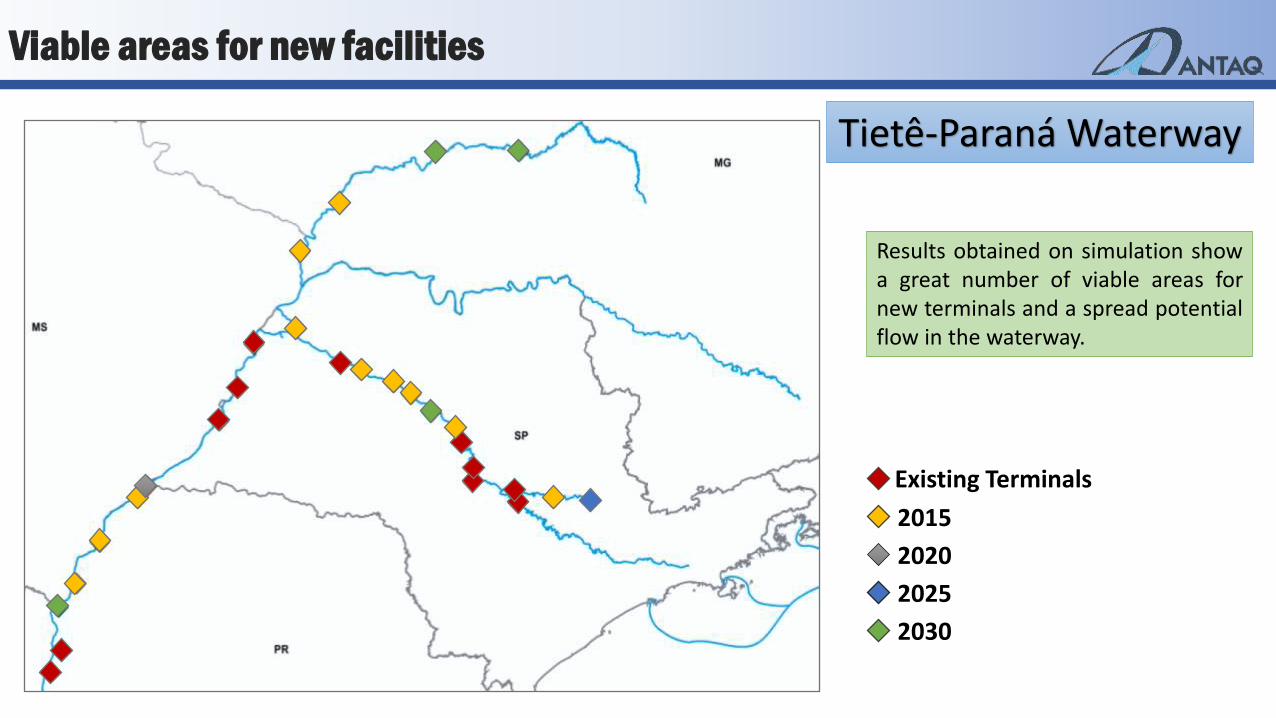
Viable areas for new facilities
Tietê-Paraná Waterway
Existing Terminals
2030
2015
2025
2020
Results obtained on simulation show a great number of viable areas for new terminals and a spread potential flow in the waterway.
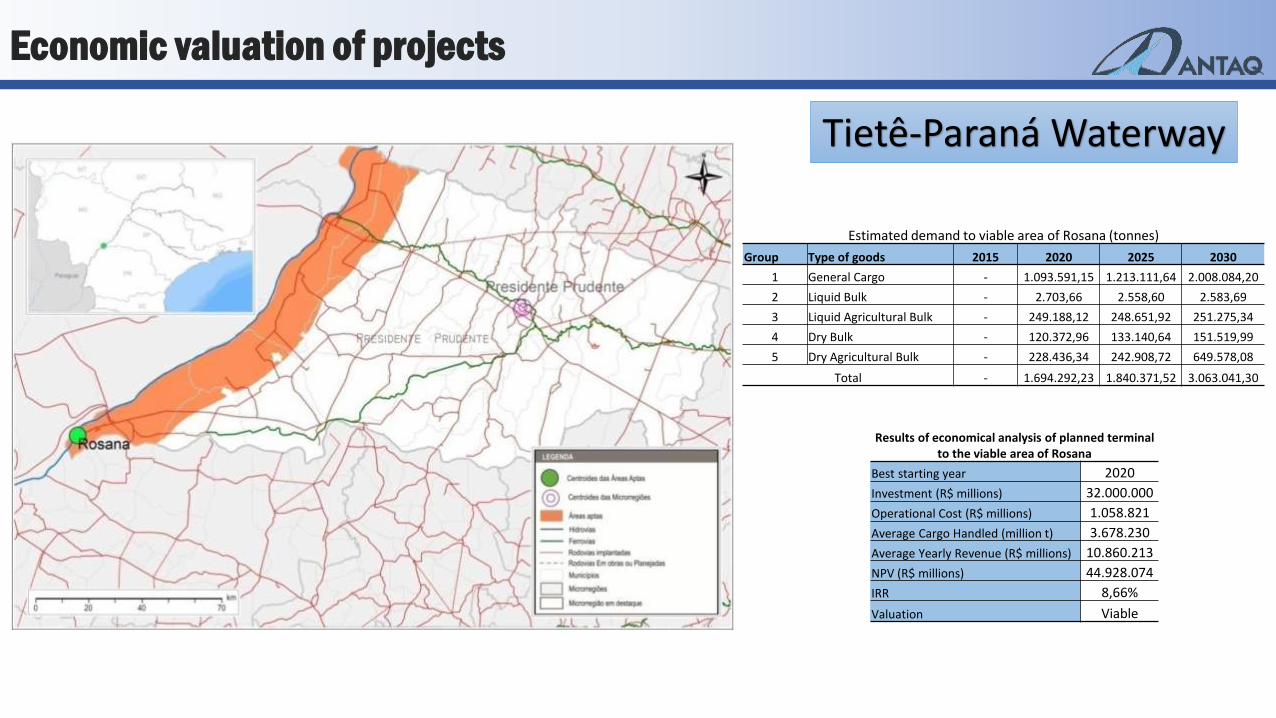
Economic valuation of projects
Tietê-Paraná Waterway
Results of economical analysis of planned terminal to the viable area of Rosana
Best starting year 2020
Investment (R$ millions) 32.000.000
Operational Cost (R$ millions) 1.058.821
Average Cargo Handled (million t) 3.678.230
Average Yearly Revenue (R$ millions) 10.860.213
NPV (R$ millions) 44.928.074
IRR 8,66%
Valuation Viable
Estimated demand to viable area of Rosana (tonnes)
Group Type of goods 2015 2020 2025 2030
1 General Cargo - 1.093.591,15 1.213.111,64 2.008.084,20
2 Liquid Bulk - 2.703,66 2.558,60 2.583,69
3 Liquid Agricultural Bulk - 249.188,12 248.651,92 251.275,34
4 Dry Bulk - 120.372,96 133.140,64 151.519,99
5 Dry Agricultural Bulk - 228.436,34 242.908,72 649.578,08
Total - 1.694.292,23 1.840.371,52 3.063.041,30
Results
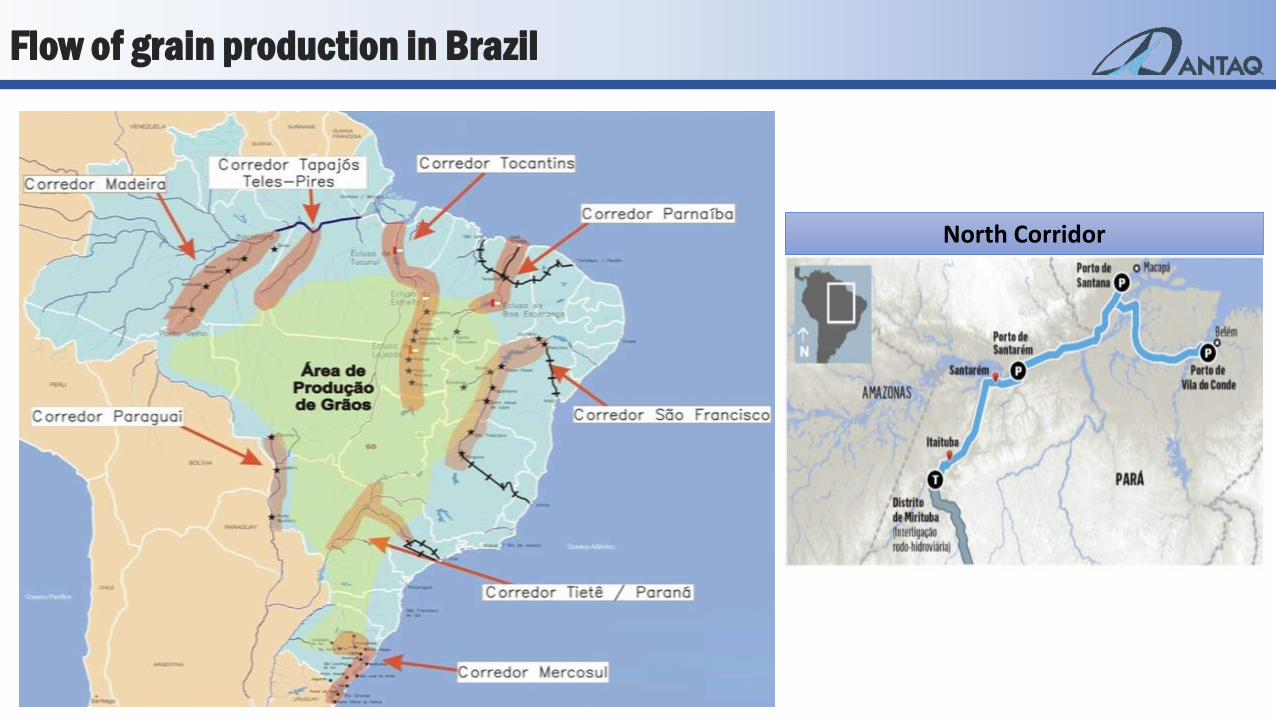
North Corridor
Flow of grain production in Brazil
[CELLRANGE]
[CELLRANGE]
[CELLRANGE]
[CELLRANGE]
[CELLRANGE]
[CELLRANGE]
-
10
20
30
40
50
60
70
80
90
2011 2012 2013 2014 2015 2016
Mill
ion
s o
f to
nn
es
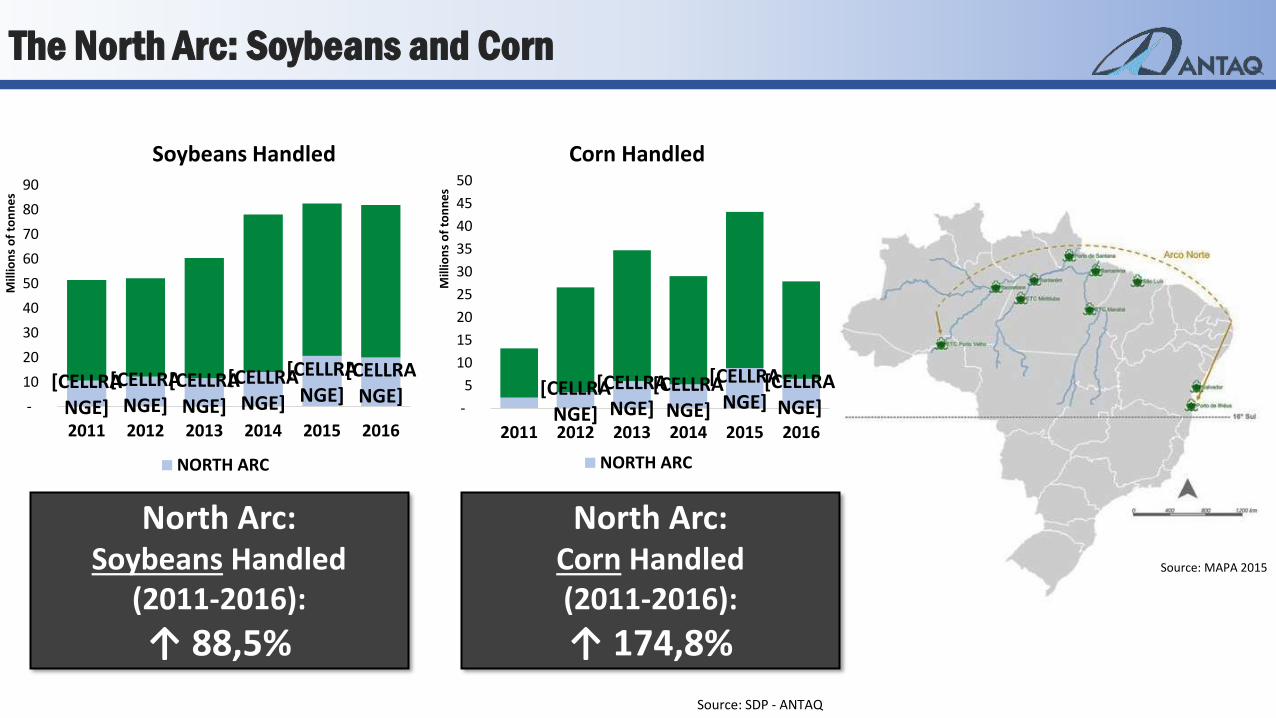
Soybeans Handled
NORTH ARC
North Arc: Soybeans Handled
(2011-2016):
↑ 88,5%
[CELLRANGE]
[CELLRANGE]
[CELLRANGE]
[CELLRANGE]
[CELLRANGE] -
5
10
15
20
25
30
35
40
45
50
2011 2012 2013 2014 2015 2016M
illio
ns
of
ton
ne
s
Corn Handled
NORTH ARC
North Arc: Corn Handled (2011-2016):
↑ 174,8%
Source: MAPA 2015
Source: SDP - ANTAQ
The North Arc: Soybeans and Corn