Embed Size (px)
Citation preview

.. ~ ·~ :-;:~
., :, ' ' <,:, : .. .("'- ~~ ~:·_;;,..,.,~ ... .....,.. .... ~.
;,
I I
;. . .
II r~
ll r-11 r· ll r 1 ll r~
II
1 r I r· il ! l.. . t :
'-i
t tl ~.: l '
" '
' ' :, ·I 'il ' .• } .I
\
ALASKA P0\1ER AUTHORITY
SUSITNA HYDROELECTRIC PROJECT
DESIGN TRANSMITIAL SUBTASK 6.05 - DEVELOPMENT
SELECTION REPORT
MARCH} 1981
ACRES AMERICAN INCORPORATED· 1000 Liberty Bank Building Main at Court Buffalo, New York 1.4202 Telephone (716) 853~7525

:1·. . . ·'I ll ~ .
TASLE OF CONTENTS
tll 1 .- INTRODUCTION
r·-l'l
2 - SY.STEM GENERP~tiON PLANS ~ SUMr·1ARY TABLES . - .
3 - . SUSITNA BASIN DEVELOPMENT SELECTION - SUMMARY TABLES . r- . . .
lll 4 - COMPARISON OF THE SUSITNA BASIN DEVELOPMatr PLAN WITH THE ALL THERMAL OP-TION
1r1 r···
[ll
tfl r PI I .
rtl ll . .
~.-!L I I .
5 - WATANA DAM CONSTRUCTION SCHEDULE
APPENDIX
SYSTEM GENERATION PLANS - SUMMARY TABLES FOR "UPPER LIMITu 1981 SUSITNA BASIN COST ESTIMATES.
Q
:II >I . ;.·t··
:...~.:~ '· _:__:;;:;::::::.-::,::.: .. -~.:-::.-;-:"-·
.I. ~" .
;\· . \\

" < .. .. ..:. ... •
•• r '
··~·
II I ~. r
~. r '
1 . 'j·· r-
tl r· t .•.
rl
I lJ l . [ tl Ll ~I
I
•• ••
1 _ INTRODUCTION
'; _j

.,
I I 1-I ·--
I I -·
I I
....,.
·~I
I ' -
:I I
~
l., 'I ll
' tl lt ' '
Ll
-·· 11 i....
I
'··;
~ .
1 - INTRODilCTION
This transmittal contains the sUi1'111ary tables outlining the results and conclusions of the Susitna Basin Deve1ooment studies. These tables wil'f appear in the subtask 6 .•. 05 Deveiopment Selection Report.
The appendtx contains the results of the system generation plan OGP5 analyses incorporating the recently developed 11 Up~ler 1 imitn 1981 Susitna Basin Cost Estimates ..
Please not~ that rJl the material presented here is preliminary .and i~ sti11 undergoing internal review.
,,

I. ;I· . .. . . [
' ~ ..
~ f
'1:
r I ~. t
* 'I f 'I r i cl r,--
l . ll r-~
' '·I
••••• ~.
·I -~I
··I I -I I.
2- SYSTeM GENERATION PLANS - SUMMARY TABLES
. . i ~I
J
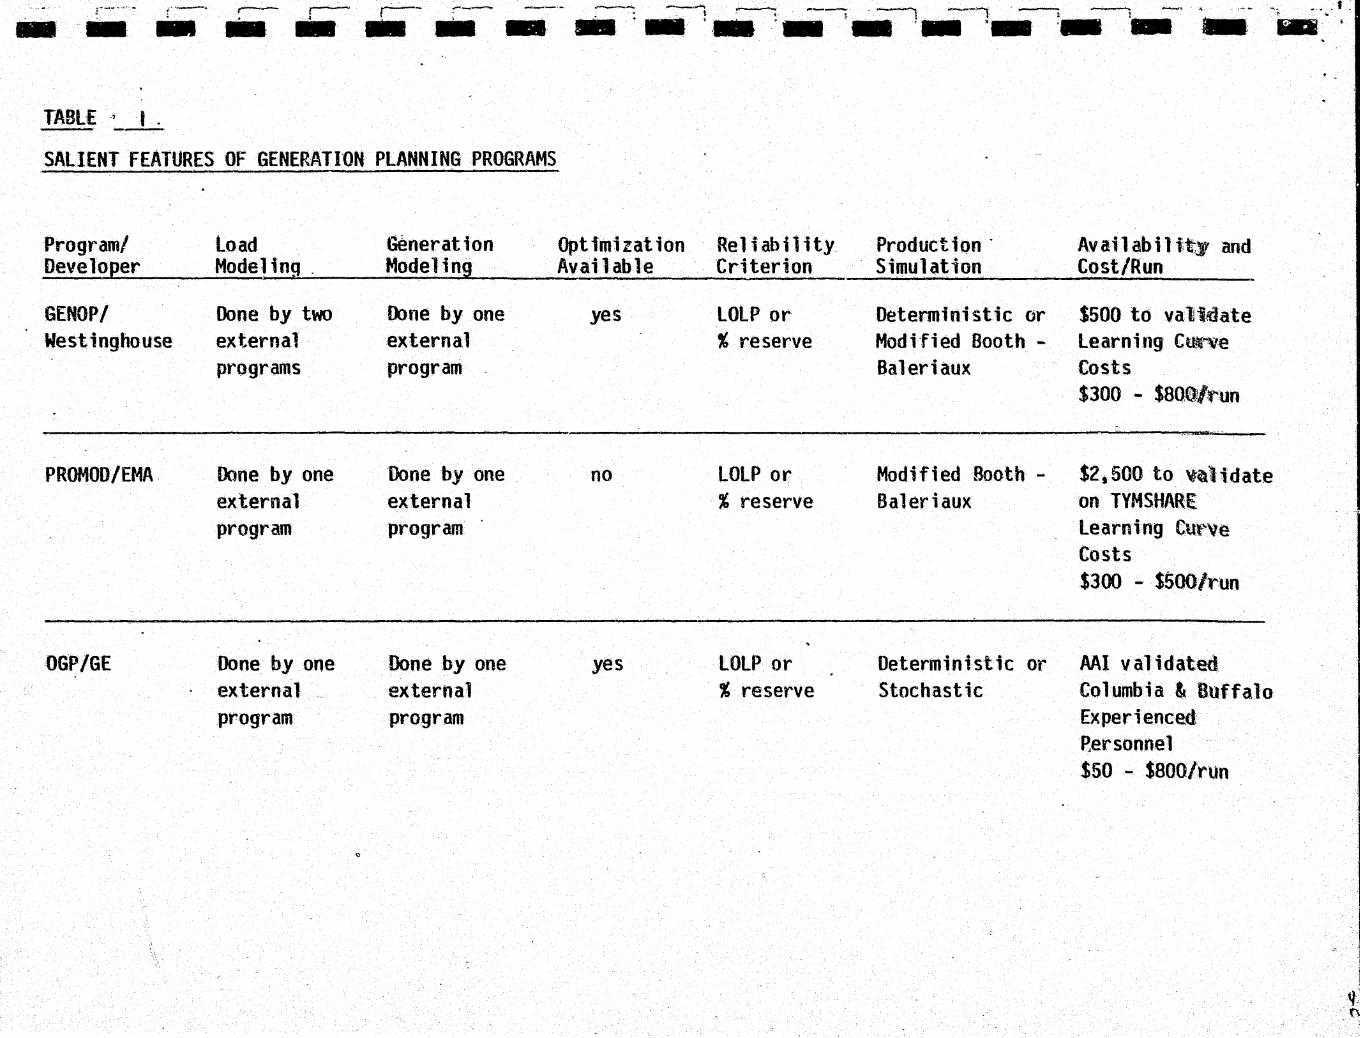
- r---- --TABLE _, I .
SALIENT FEATURES OF GENERATION PlANNING PROGRAMS
Program/ Developer
GENOP/ Westinghouse
PROMOD/EMA
OGP/GE
load Modeling _
Done by two external programs
Done by one external program
Done by one external program
"
Generation Modeling
lbne by one external program
Uone by one . external program
Done by one external program
Optimization Available
yes
no
yes
Re 1 i ab i 1 it y ·. Criterion
LOLP or % reserve
LOLP or % reserve
LOLP. or % reserve
. -
Production · Ava i 1 ab i 1 iit)r and Simulation Cost/Run
Oetermini stic or $500 to validate Modified Booth - learning Cu.f'!Ve Baleriaux Costs
$300 - $80llJ/run
Modified Booth - $2,500 to '6'~lidate Baleriaux on TYMSHAR£
learning Cut"~e Costs $300 - $500/run
Deterministic or AAI validated Stochastic Columbia & Buffalo
Experienced P.ersonnel $50 - $800/run
~-... -.

. . . ·_I
~I ~ •
'I r~
!I r· t I .~-
I 'I
"
' • i. . -,1 I ~
.....
~
~.
I I -I tl Ll . . ~-I
•• ... ,
~·· •••
TABLE z LOAD AND ENERGY FORECASTS* ALASKA RAILBELT AREA
Low Forecast Mid Forecast H~h Forecast YEAR MW 6RFi MW GRFi . GWh
1980 BASE 514 2,789 514 2,789 514 2"1789 1985 578 3,158 ·650 3,565 695 39859 1990 641 3,503 735 4,032 920 5,085 1995 797
" 4,351 944 5,171 1,294 7~119
2000 952 5,198 1,173 6,413 1,669 9~153
2005 1,047 5,707 1,379 7,526 2,287 12s543 2010 1,141 6!\,215 1,635 8,938 2,209 15!1933
* Derived from th~ Woodward-Clyde Consultants submittal of September 23, 1980, adjusted to eliminate industrial self-supplied and two-thirds of the military sector~
:. :.

, .. 1
\ .
;I
I '
Ll
\
~.-. \_
Ll Ll
TABLE .. 3
ANNUAL FIXED CARRYING CHARGES u~ED IN l~ENE~il:TION Pl~NNINr; R"ODEL
30-Year Thermal
(%) --ECONOMIC PARAMETERS (0%-3%) ()
Cost of r.bney 3.00 Pmortization 2.10 Insurance 0.25 TOTALS 5.35
FINANCIAL PARAMETERS - (7%-10%}
Non ... exempt
Cost of t-tl ney 10.00 Mtort i zat ion 0.61 Insurance 0.25 TOTALS 10.8"6"
Tax-exemet .
Cost of Mlney 8.00 Jlmorti zat_ion 0.88 Insurance 0.25 TOTALS 9.13
35-Vear ProJect Life/Tlf!e
So~Vear 2o-Vear Thermal Hydro Thermal
. (%) . (%)._ {~)
3.00. 3;.00 3.00 1.65 0.89 3.72 0.25 0.10 0.25 4.90 3.99 6.97
10.00 10 .. 00 10~00 0.37 0.09 1~75 0.25 0.10 0.25
10.62" TO.l§ 12,. orr
8.00 8.00 8.00 0.58 0.17 2.19 0.25 0.10 0.25 8.83 8.27 10 .. 44

. • t• ' . •• .-• t . •
'I ~:: .. ' •
II r:
'I . ~ ·-'It-l t
~. c l
'I ' ~ '
.. • ~
~. i i il .. -
II ~ ...
ll ~ . :I tl Ll ' '
Ll 11 l .
'
11 '-
'·I :_ '
'I '· . i_ '
I
TABLE . 4 . FUEL PRICES AND ESCALATION. RATES ... . .
Natural Gas
s,a~)e Per i"od {January 1980)
Prices ($/million Btu) ---Mar·ket Pric\~S
Shadtlw {Opportunity) Values
Real Escalation Rates (Percentage
Chang~~ Compounded Annually) -1980 - 1985
1986 - 1990
1991 - 1995 Composite (average) 1980 - 199!i
1996 - 2005 2006 ... 2010
$1.05 2.00
1.79% 6.20 3 .. 99 :3 .. 98
~l. 98
0
-•
Coal
$1.15 1.15
9.56% 2.39
-2 .. 87 2o93
2.93 0
Disti)late
$4.00 4.00
3.38% 3~09
4 .. 27
3.58 3 .. 58
0

..
. "I ... ,, . ll -'i ~. r""' i ~
J !I r·
'I ,,
~. . ll .. 11 ll ;I tl ;i-1
Ll i
!_I
~ .• -·I -I I
- "' ,..,__ .. ,-, ..
TABLE ~ .1 -SUMMARY OF ECONOMIC AND FINANCIAL PARAMETERS FOR GENERATION PLANNING
. 1 --~·Bas.~.J:eriod_~LJ.anuary 1980) Energy Prices {$/mill ion Btu) 1.1 - Natura 1 Gas 1 .. 2 - Coal . . 1.3 - Distillate
Genera~ ion Pl an11~n~ ,Anal-¥sls· Econom1c* 1nanc1a *
2.00 1.15 4.00
2.00 1.15 4.00
2 - General Price lnf1 at ion Per Year (%) not appl icab1e 7
3 - Discount & Interest Rates Per Year 3.1 - Real Discount Rate 3 .. 2 - Nominal Interest Rate
{Non-exempt Case) 3.3 - Nominal Interest Rate
{Tax-exempt Case)
4 - Non-energy Cost Escalation Per Year (%}
(%) 3 not applicable
not app l ieab 1 e
0
( oliO·,) 5 - Energy Price Esca1 at ion Per Year 5.1 - Natural Gas
1980 - 2005 2006 - 2010
5.2 - Coal 1980 - 2005 2006 - 2010
5.3 - Distillate 1980 - 2005 2006 - 2010
6 -Economic Life (Years) 6.1 - Large Steam Turbine 6.2 - Small Steam Turbine 6.3 - Hydro 6.4 - Diesel and Gas Turbine
(Gas-fired) 6.5 -Gas Turbine (Oil-fired)
7 - Amortization Period (Years) 7.1 - Steam 7.2 - Hvdro· 7.3- Diesel and Gas Turbine
(Gas-fired) 7. 4 - 'Gas Turbine ( Oi 1-fi red )
3.98 ·o
2.93 0 :
3.58 0
30 35 50 30
20
not applicable not applicable not appl icab1e
not app1 icable
not applicable 10
8
7
11.26 7.00
10.14 7.00
10.83 1.00
not applicable not applicable not applicable not applicable
not applicable
30 50 30
20
*Note that economic and financial parameters apply to real dollar and escalated dollar analyses respectively.
/

:·· ~
:I
-~-·--~.1
'I ·-· .
'I :-~·
! 1 ;I r !I ~~-·
ll ;I
·I \I . ·~·I
t.l I
Ll
i_~l
~I
TABLE . ., l:. TEN YEAR BASE GENERATION PLAN f'1IO LOAD FORECAST ·~------~--~--~--~--~----~--~~-
SYSTEM (MW) YEAR MW NG OIL OIL
.. .Comnitted. MW
.Ret~ red COAL GT GT DIESEL CC HY
1980 ... - 54 470 168 65 141
1981 - 54 470 168 65 141
1982 60 cc 54 470 168 65 201
1983 54 470 168 65 201
1984 54 470 168 65 201
1985 14 (NGG-r) 54 456 168 65 201
1986 - 50 456 168 65 201
1987 4 (Coal) 50 456 168 65 201
1988 95 HY - 50 456 168 65 201
1989 5 (Coal) 45 456 168 65 201
1990 45 456 168 65 201
*This figures varies s1 ightly fr·an the 943.6 MW reported due to internal computer rounding .
49
49
49
49
49
49
49
49
144
144
144
TOTAL~ .. CAPABILITY
(MW)
947*
947
1007
1007
1007
993
993
989
1084
1079
1079
I ;..,_ :""'"""'"·"""'" r--~ ---- r--""'t -------- --~E:Ou.tM 1
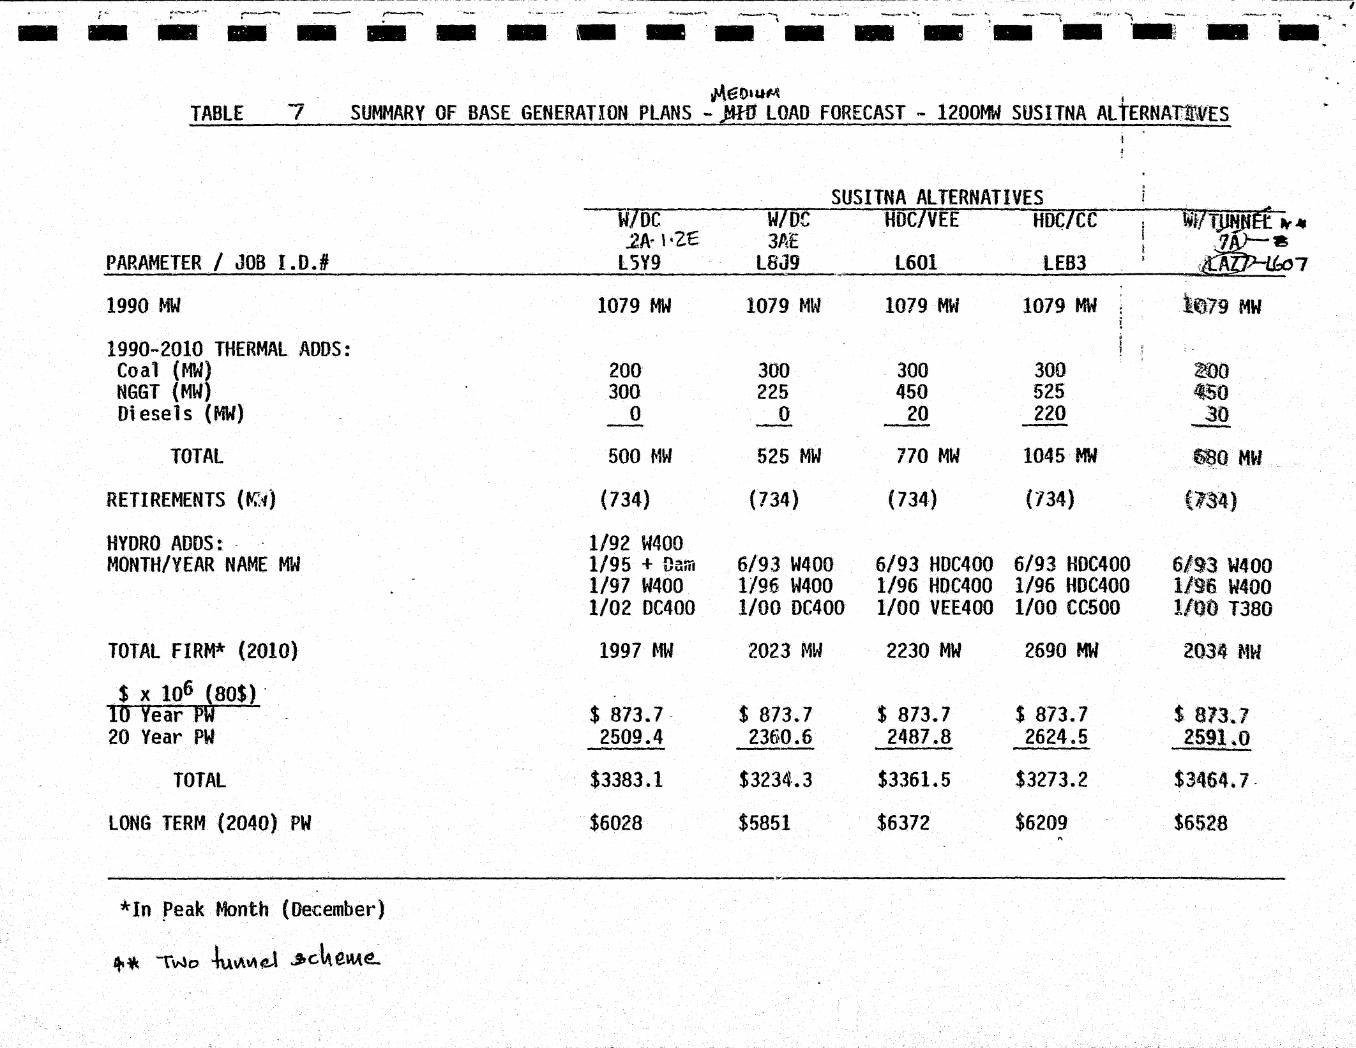
TABlE 7 . SUMMARY OF BASE GENERATION PlANS - J¥11 LOAD FORECAST - 1200MW SUSITNA Al tERNAtl\VES
SUSITNA ALTERNATIVES W/DC W/OC HOC/VEE HDClCC - . WflTJJNJift ., .-2A· \ ·ZE 3AE
~ PARAMETER / JOB I.D.f LSY9 l8J9 l601 LEBJ $.\~ 7
1990 MW 1079 MW 1079 M\~ 1079 MW 1079 MW l({}79 MW
1990-2010 THERMAL AODS: Coal (MW) 200 300 300 300 ~{}0 NGGT {MW) 300 225 450 525 ~0 Oi esel s (MW) 0 0 20 220 30 -
TOTAl 500 ~1W 525 MW 770 MW 1045 MW ~0 MW.
RETIREMENTS (~i) (734) (734) (734·) (734) {1~4)
HYDRO ADDS : - 1/92 W400 MONTH/YEAR NAME MW 1/95 + nam 6/93 W400 6/93 HDC400 6/93 HOC400 6/93 W400
1/97 W400 1/96 W400 1/96 HDC400 1/96 HOC400 1/96 W400 1/02 OC400 1/00 DC400 l/00 VEE.400 1/00 CC500 1/00 T380
TOTAL FIRM* (2010) 1997 ~fW 2023 MW 2230 MW 2690 MW 2034 NW
s x 1o6 ~so$) · 10 Year P $873.7- $ 873.7 $ 873.7 $ 873.7 $ 813.7 20 Year PW 2509.4 2360.6 2487.8 2624.5 2591.0
TOTAl $3383.1 $3234 .• 3 $3361.5 $3273.2 $3464.7-
LONG TERM (2040) PW $6028 $5851 $6372 $6209 $6528 "
,._
*In peak Month (December)
£tt·~ \wo .\u\A\1\.U .Jrc.\,e'"e...

- r---.... - ---.. -- - - - - - -' - -TABLE . 8· · SUSITNA BASIN HYDROELFCTRIC Al TERNIATIVES
Plan
2A
3AE
3A2
6A
7A
Comp. Hydro
gage
1 2 3 4
1 2 3
1 2
1 2
1 2 3
1 2 3
Description
Watana low Dam Raise Watana Dam Add Capacity Devil Canyon Dam
High Watana Dam Add powerhouse capacity Dev i 1 Canyon Dam
Watana High D~ Devil Canyon Dam
High Dev i 1 Canyon Dam Vee Dam
Watana High Dam Add powerhouse capacity Add tunnel capacity
Chakachamna Keetna Snow
*Includes Interest During .Construction (IOC)
On-line Month/Year
1/92 1/95 l/fJ7 1/02
6/93 1/96 l/00
6/93 1/00
1/94 1/00
6/93 1/96 1/00
1/93 1/97 1/02
••'
Construction Period (Yrs)
8 3 3 7
9 3 7
9 7
8 7
9 '3
5
10 8 6
Total Cost* Million 1980$
Installed Capacity:
1774 376 13Q 999
19B4 157 999
1984 999
1570 1177
400 MW i
400 MW 400 MW
TOTAL 1200 MW
400 MW 400 MW 40':) MW
TOTAL l2G'D MW
400 MW ·400 MW
TOTAL BOO MW
400 M\~ 400 MW
TOTAL BOO ~tW
1984 400 MW 157 400 MW
l ~·seQ!!)•"" 380 MW TOTAL ll80 f'.fl
1201 500 MW 463 ~120 MW 223 50 MW
TOTAL 670 MW
..
!Peak ltlnth · Finn
, Capacitr
206 MW 194 MW 400 MW 352 MW
1152 MW
400 MH 400 MW 352 MW
· ll52 MW
400 MW 337 MW 737 ;;!~
351 MW 31:5 MW
. 666 MW
400 MW 400 MW
a·q4ln MW ~ ~1W qCJ4
500 MW 77 MW 22 MW
599 MW

I
r-···· ,.___ .,......__..._~- _1'_... ....-..-- r----... ~ .......,__...~,1 ~--.....--...... "' ._,. _ _,.,.,.. ___ ......_ ... , -~-- ... ~ -.... .., -..... . .. <;. .. ,..__. ..... "' 'J
- - - - - - '-IB! - - ··- -- !- - - ·- - ·--··~. ·-7,· TABLE · 9
PARAMETERS I JOB I.D.# -1990 MW
1990-2010 THERMAl ADDS: Coal (MW) NGGT (MW) Diesels (MW)
TOTAL
RETIREMENTS (MW)
HYDRO ADOS: MONTH/YEAR NAME MW
TOTAl FIRM* *(?010)
$ X 106 (80$) 10 year PW 20 year PW
TOTAl
lONG TERM (2040} PW
* In peak month - December
- ~\1.~\'T~~
SUMMARY OF GENERATION PlANS - MID lOAU FORECAST - 800 MWJALTERNATIVES
W800
l7W7
500 450
--950 MW
(734)
6/93·W400 1/96 W400
2095 MW
$ 873.7 2765.1
$ 3638.8
$ 6955
1\
SUSlTNA AlTERNATIVES HOCBOO · W400/0C400
lE07 LCK5
1079 MW 1079 MW
500 200 450 525
30 50
980 MW 775 MW
(734) (734}
6/93 HDC400 6/93 W400 1/96 HDC400 1/00 OC400
2125 MW 1858 MW
$ 873~7 . $ 873.7 2628.0 2349.6
$ 3501.7 $ 3223.3
$ 6715 $ 5891
HOC/Wee
l825
1019 !MW
40Q 45Q
6Q ~
9lONW
(114~
1/94 HOC 400 1/00 VEE .400
1921 MW
$ 813 .. 7 2624 .• 5
$ 349lt2
$-6620

I
#ct..TE~A"'ft\Je IJ)GD\.U~
TABlE ... . 1.0 ·. SUMMARY OF .&AS£ GENERATION PlANS - -MID lOAD FORECAST
PARAMETER I JOB 1.0.# ~
1990 MW
1990-2010 THERMAl ADDS: Coal (MW) ffGGT (MW) Diesels (MW)
TOTAl
RETIREMENTS (MW)
HYDRO AOOS: MONTH/YEAR NAME MW
TOTAl FIRM* MW{gOlO)
s x to6 {ao$)_ Io Year 'P\4 20 Year PW
"TOTAl
lONG TERM (2040) PW
*In Peak Month (December) **RN - renews
THERMAl .. THERMAl AND
RENEWS NO RENEWS OTHER HYDRO lMEJ lME1 lfl7
1079 MW 107.9 MW 1079 MW
456 RN** 900 900 700 150 600 300 40 .50 10
1546 MW 1550 MW 1010 MW
(734) (734) (734)
1/93 Chaka 500 1/97 Keetna i20, 1/02 Snow 50
1891 MW. 1895 MW 1954 MW
$ 873.7 $ 873.7 $ 873.7 3308.3 3319.4 2802.·2
$4182.0 $4193.1 $367~.9
$8109 $8133 $7038
' .. ~- ~-. "--''l f- ;--~ .~
C\"~ -ka.~-
--------~-------~-----------:--------~-~----- -- -~ ---
.,____.,.__ ,....,__._ ;-.-.... , .... __ .. _ ._- ..... _......_..,_....... ··----~ .._.:__.~ , ..... ,_._... .... ~.. ___ 1
. __ "i _,..:; .. ~ ~"'...,_ .. ~. ..._.._ ..... "_ ~ _ __,._ ..... ..-1
--.......... ·11-...
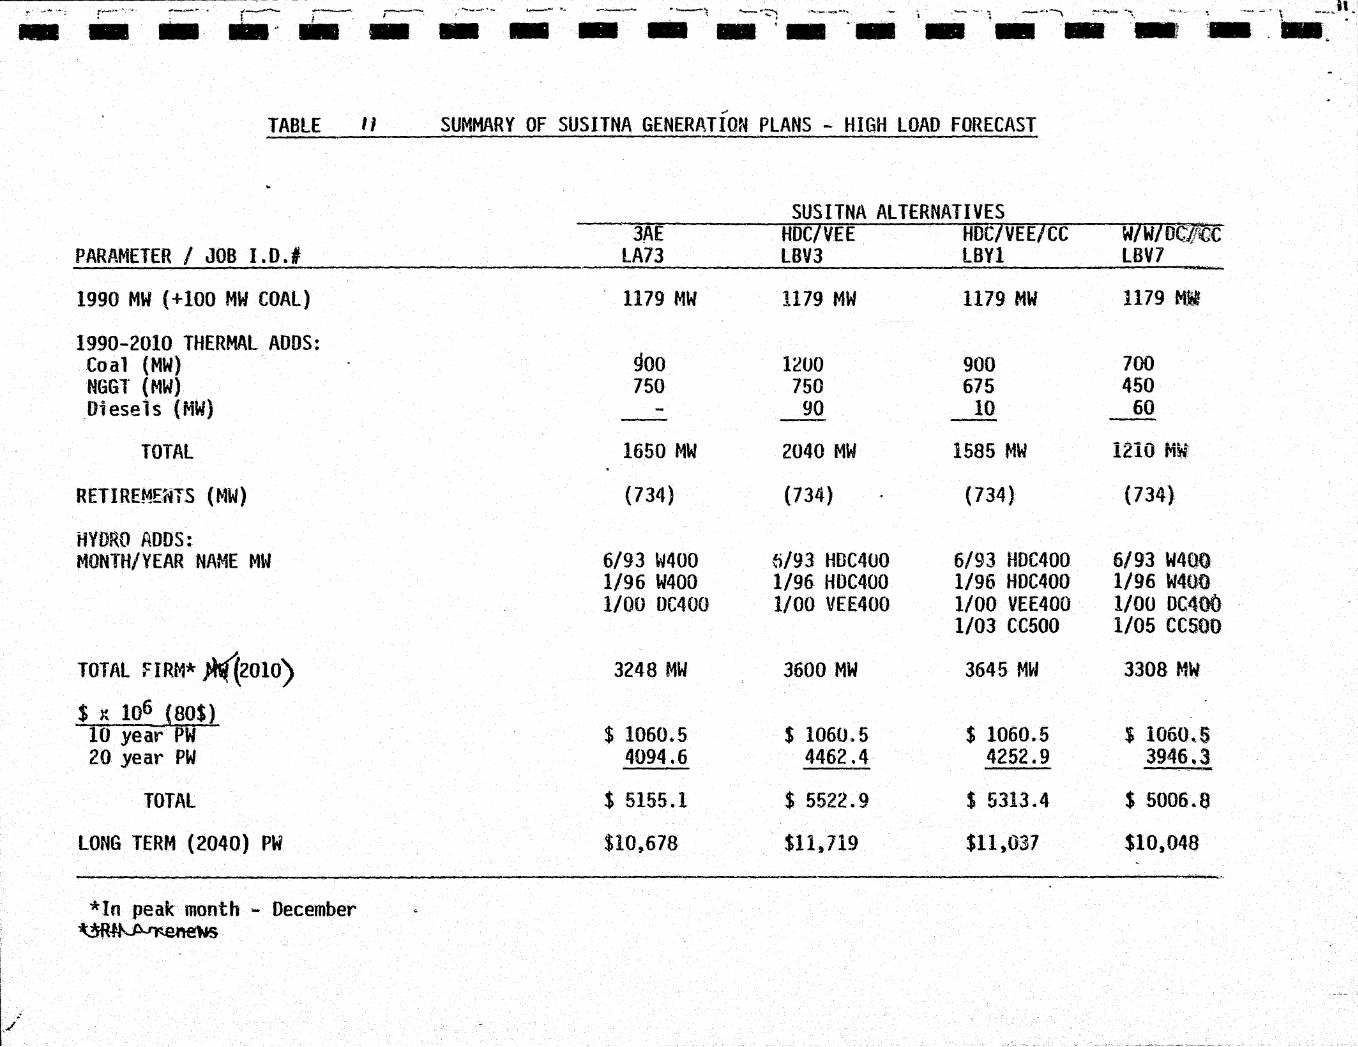
-~ .... - ... - - - - ·- ·- - - -- ----. r-· * .. - ~-:; :-..,....,..~ .. "',-.. ---TABLE II
PARAMETER I JOB I.D.#
1990 MW (+100 MW COAl)
1990-2010 THERMAL ADOS: Coal (MW) NGGT {MW) Diesels ( MW)
TOTAL
RETIREMENTS (~1W)
HYDRO ADDS: MONTH/YEAR NAME MW
TOTAL fiRM* ~2010) $ X 106 (80$)
lO year PW 20 year PW
TOTAL
LONG TERM (2040) PW
*In peale month ... December ~
... SUMMARY OF SUSITNA GENERATION PLANS - HIGH LOAD FORECAST
SUSITNA ALTERNATIVES JAE HOC/VEE HDC/VEE/CC
lA73 LBV3 lBYl
1179 MW 1179 MW 1179 MW
9oo 1200 900 750 750 675
90 10
1650 MW 2040 MW 1585 MW
{734) (734) (734)
6/93 W400 6/93 HOC400 6/93 HDC400 1/96 W400 1/96 HOC400 1/96 HDC400 1/00 OC400 1/00 VEE400 1/00 VEE400
1/03 CC500
3248 MW 3600 MW 3645 MW
$ 1060.5 $ 1060.5 $ 1060.5 4094.6 4462.4 4252.9
$ 5155.1 $ 5522.9 $ 5313.4
$10,678 $11,719 $11,037
.
W/W/OCJ!tc .. LBV7
1179 Mll
700 450
60
i210 Mij
(734)
6/93 W400 1/96 W400 1/00 OC400 1/05 CC500
3308 M~
$ 1060~5 3946.3
$ 5006.8
$10,048

•
-~---~ ... -- ~ •--.--.,.....- •'!""'-_.....-~ ~--.~~ .. ~~ -· .• - --- ·-,-·-- I ---
TABLE 8. 12 SUt4MARY OF SUSITNA GENERJ~TION PLANS - LOW LOAD FORECAST
SUSITNA AfLTERNATIVES W400/0C400 HD HIJC400 W40o- W40Q1:7f ~~~
PARAMETER I JOB I . 0. I . LC07 lGO lBUl LBK7 l60~
1990 M\4 1079MW 1079MW l079MW 1079MW 1o1mmw
1990-2010 THERMAl ADDS: Coal (MW) 100 400 200 -NGGT {MW) 150 225 300 300 37$ Diesels (MW) 40 30 80 ZQ
--:.-- __,...,.,..
TOTAL 190MW 355MW 700MW 580MW 39SMW
RETIREMENTS (MW) (734) (734) {734 )' (734) {7l4l
HYDRO ADDS: MONTH/YEAR NAME MW 6/93 W400 6/93 HDC400 6/93 HDC400 6/93 W400 6/9l Y400
1/02. OC400 1/02 VEE400 1/0?1. l380
TOTAL FIRM* (2010) 1272MW l367MW 1396MW 1325MW 13l!ltW
$ X }06 (80$) lO year-PW $ 744.1 $. 744.1 $ 744.1 $ 744.1 $ 744.1 20 year PW 1635.8 1894.9 1961.6 2029.7 2048,S
~
TOTAL $ 2579.9 $ 2639.0 $2705.7 $2773 .. 8 $279~,6
LONG TERM (2040) PW $ 4350 $ 4557 $4652 $4940 $4997 .. 1
*In peak month - December

i ~ .. , ..
'I -· ll ·r tl r~
il '\
. I . !. r
.~ .• ,_. J, ' 11
r• :I il . ~~-'I -1 ~I
••
••• . I I
TABLE l~. SUMMARY OF GENERATION PLANS - LOAD MANAGEMENT AND CONSERVATION --~--~F~a~~~Ec~A~sr---------------------------------~-~-----
PARAMETER I JOB I.D.#
1990 MW
1990-2010 THERMAL ADDS: Coal (ttfN) NGGT (MW) Diese 1 s ( MW)
TOTAL
RETIREMENTS (MW)
HYDRO ADDS: MONTH/YEAR NAME MW
TOTAL FIRM* MW 2010
_$ X 106 (80$) Io year PW 20 year PW
TOTAL
LONG TERM (2040) PW
*In peak month - December
THERMAL NO RENEWS
LBT7
1079 MW
500 225
90
815 MW
(734)
1160 MW
$ 721.9 2034.3
$ 2756.2
$. 4931
SUSITNA W400/D400
L787
1079 MW
-450
50
500 MW
(734)
.. " ""
1/97 W400 · ··1/05 DC400
1582 MW
$ 721.9 1556o.O
$ 2277.9
$ 3648

r .. , ...
:_I I ,.. ..
I .... i \I
. ,-' . ! ll .~-· } l. ' !I l . ~I ·-· ll ' -
!I r ~I l
II ,~
Ll (" ·.
L.l
·LI !I ~--1
:~I:.
TABlE - 14-~ SUMMARY OF GENERATION PLANS - PROBABILISfiC LOAD FORECAST ----------~----------------------~------~---
PARAMETER I JOB I.O.#
1990 MW
1990-2010 THERMAL ADDS: Coal (MW) NGGT (MW) Diesels (MW)
TOTAL
RETIREMENTS (MW)
HYDRO ADDS: MONTH/YEAR NAME MW
TOTAL FIRM* MW 2010
$ X 106 (80S) · lO year PW
20 year PW
TOTAL
LONG TERM (2040) PW
*In peak month - December
THERMAL NO RENEWS
LOF3
1079 MW
1100 1575
100
2775 MW
(734)
3120 MW
$ 873.7 3353.6
$4227.3
$8324
SUSITNA 3AE
L8T5
1079 ~1
200 1275 140
1615 rttW
{734)
6/93 ~1400 1/96 W400 1/02 DC400
3112 MW
$ 873 .. 7 2546.5
$3420.2
$6292

,£
l
' . I
....... .,.,.
·I '!-'
1-.. . I
TABLE g;· .. ~tNPUT PARAMETERS - INTEREST RATE SENSITIVITY
Interest Rates ._I_.np_u_t_v_a_r_ia_b...,l_e __________ ,_ 3 Percent 5 Percent 9 Percent
-~-·~ - ... - • •• +> ... ~ .. -·-...... -'0' 40'•o - -- ,_,_ • -· ---{I Annual Fixe~, Carrying Charges (%) J-··-·
\
'I , .. l
,,. . ~. r ..
11 ~ -t ;I ' i.l ·,I lJ ;I ·-\
1.1
:I ~I·
30 Year Thenna 1 20 Year Thermal 50 Year Hydro
Total Capital Costs. (S x 106)
250 MW Coal 75 MW·NGGT 10 MW Diesel
1 - Watana 400 2 - Watana 400 3 - Dev i 1 Canyon 400
5.35% 6.97 3.99
$ 686 26 10
$ 1984 157 999
6.75~ 8.27 5.58
$ 727 26.3 10 .. 3
$ 2175 161 1069
9.9~ 11.20 9 .. 37
$ 815 27 10.4
$ 2589. 168 1224

,. ........ ,_ -·-"'-"' ...-,.., ... -~.:.. >'!--'"'~ ~-0'---.... ~~ ~··-~ ~ ~ .... >).<. ")<" ~- ..... - - .... - - - - --·- - . - - - - ~ •• 1- ,! ... -'- '
•
TABLE lb SENSITIVITY ANALYSIS ... iNTEREST RATES
THERMAl . BASECASE SENSITIVITY
PARAMETER I JOB I .D.# LMEl LEA9 LEBl
ESCALATION/ INTEREST RATE
1990-2010 THERMAl ADOS:
. 0% - 3%
~al (~) 000 NGGT (MW) 600 Diesels {MW) 50
TOTAl
RETIREMENTS (MW)
HYDRO ADDS: MONTH/YEAR NAME MW
1550 MW
{734)
0% - 5%
900 600
50
1550 MW
{734)
TOTAL FIRM* MW 2010 1895 K.J · 1895,.,
$·X 106 (80$) 10 Year~ $ 873.7 $ 791.1 20 Year PW 3319.4 2441.7
TOTAL $4193.1 $3232.8,
lONG TERM (2040) PW $8133 $5172
*In Peak f.bnth (December)
0% - 9%
900 600 50
1550 MW
(734)
1895 MW
$ 714.8 1367.2
$2082.0
$2609
BASECASE L8J9
0% - 3%
300 225
525 MW
(734)
6/93 W400 1/96 W400 1/00 OC400
2023 MW
$ 873.7 2360.6
$3234.3
$5851
SUSITNA - 3AE I · . I
SENSITIVITY l LF85 ·lf87'
0% - 5%
300 225
( 734)
6/93 W400 1/96 W400 1/00 OC400
2023 MW
$ 791.1 1977.3
$2768.4
$4226
- !
0% - 9%
300 225
525 MW
(734)
6/93 W400 1/96 W400 1/00 DC400
2023 141
$ 714.8 1469.2
$2184.0
$2691
i . .. i

. tl Ll t
Ll '~1.
l
I
••
TABLE .. :,J7- SENSITIVITY ANALYSIS - FUEL COSTS
THERMAL . -=-sA~SI:"Z'EC~A--s-=-r SENS If 1 VI TY
PARAMETER I JOB I.D.# LMEl L1K7
FUEL COST:( $/MMBTU) Coal Natural Gas Oil
1990-2010 THERMAL ADDS: Coal {MW) NGGT (MW} Diesels· (MW}
TOTAL
$1.15 $2.00 $4.00
900 600
50
1550 MW
RETIREMENTS (MW) (734)
HYDRO ADDS: MONTH/YEAR NAME MW
TOTAL FIRM* MW 2010 1895 MW
$ X 106 (80$) lO year PW $ 873.7 20 year PW 3319.4
TOTAL $4193.1
LONG TERM (2040) PW $8133
* ln Peak M:>nth (December)
$0.92 $1.60 $3.20
800 675
70
1545 MW
(734)
-
1890 MW
$ 716.5 2880.0
$3596.5
$7072
SUSITNA - 3AE BASECASE SENSITIVITY
L8J9 L533
$1.15 $2.00 $4.00
300 225 ..
525 MW
(734)
6/93 W400 1/96 ~~400 1/00 DC400
2023 MW
$ 873:7 2360.6
$3234e3
$5851
$0.92 Sl.60 $3.20
100 375
20
495 MW
{734)
6/93 W400 l/96 W400 1/00 DC400
1993 MW
$ 116.5 2145.2
$2861.7
$5260
NOTE: Sensitivity analysis performed using 0% escalation; 3% interest rate and the mi d1 o.ad foreca.st.

.,-~ ,...---~ :f • J ·- --- .. --.--... __ .... .....
PARAMETER I JOB I.O.#
-~-------
,.~:~--- ----- -- . --~ ....... _, .. ~ __ ... -·-~·-·-. ---.. - -- -,............._' -·- -~- ---l~ - ... - - ... -}- ·- ·- •··- ~- ,_ t- ... - .. TABLE : 18 SENSITIVITY ANALYSIS - FUEL COST ESCALATION
THERMAL BASECASE SENSITIVITY
LMEl l547 L561 BASECASE
l8J9
SUSITNA - 3AE ... SENS lfll"nv:T"trt~· ---
l557 l563
FUEL COST ESCALATION RATES (%) Natural Gas 3.98% 0% 3.98% 3.98% 0% 3.98~ Coal 2.93% 0% 0% 2.93% 0% 0% Oil 3~58% 0% 3.58% 3.58% 0% 3.58%
1990-2010 THERMAL ADDS: Coal (ftM) 900 1100 300 300 NGGT (MW) 600 1500 525 225 450 ;225
· Diese 1 s (MW) 50 10 10 - 30 -,.,..,... ..
TOTAL 1550 MW 1510 MW 1635 MW 525 MW 480 MW S25 MW
RETIREMENTS (MW) (734) (734) {734) ( 734) (734) ·(134}
HYDRO ADOS: MONTH/YEAR NAME MW 6/93 W400 6/93 W400 6/93 W400
1/96 W400 1/96 W400 l/96 W400 1/00 OC400 1/00 OC400 l/00 OC400
TOTAL FIRM* MW 2010 1895 MW 1855 .,., 1980 MW 2023 MW 1978 MW 2023 Kl
_ $ X 106 (80$} 10 year PW $ 873.7 $ 721.8 $ 865.4 $ 873. 1. $ 721.8 $ 965.4 20 year PW 3319 .. 4 1835.0 2854.6 2360.6 1806.4 2307.1
TOTAL $4193.1 $2556.8 $3720.0 $3234.3 $2528~2 $.3172 .. 5
LONG TERM ( 2040) PW $8133 $4558 $6916 $5851 $4357 $5586
* In Peak rt»nth (December)
NOT£: Sensitivity analysis perfor!Jled using 0% escalation, 3% interest rate and the mid load forecast.

·si - : ~-., -. ,I . . . ...12!-. _ ··- -- ·-~- ·- .. _TABLE...: /9 : SENSITIVITY ANALYSIS - THERMAL PLANT RETIREMENT POLICY
~ ~~~-~------------~----~~~~~--~------~-
~ .• THERMAL SUSITNA - 3AE t
. .• PARAMETER I JOB I. D .. # ··r~-~ -------·~· .. --··-· ~ ....... -.. -- --··--··· ·----·-
BASECASE ~ENSITIVITY LMEl L583
B'ASECASE SENSITIVITY L8J9 L585
'I r· t .I r
~. ' '
'
II f ~
Ll ("
\I J.i .. . I
~. ~ .
1 .• !
:I :1 • l Ll
La !J {
l.J ~ • ••
RETIREMENT POLICY (YRS.) Co a 1-fired Steam Natural Gas GT Oil GT
. 1990-2010 THERMAL ADDS: Coal (MW) NGGT (MW) Diesels (MW')
TOJAL
RETIREMENTS ( MW)
HYDRO ADDS: MONTH/YEAR NAME ~~
TOTAL FIRM* MW 2010
$ X 106 (80$) lO year PW 20 year PW
TOTAL
LONG TERM (2040) PW
* In Peak M:lnth {.December)
30 Yrs 30 Yrs 20 Yrs
900 600
50
1550 MW
(734)
-
1895 MW
$ 873~7 3319.4
$4193.1
$8133
45 Yrs 45 Yrs 30 Yrs
1100 75
1175 MW
(290)
-
1973 MW
$ 873.7 3318.3
$4192.0
$7850
30 Yrs 30 Yrs 20 Yrs
300 225
525 MW
(734)
6/93 W400 1/96 W400 1/00 OC400
2023 MW
$ 873". 7 2360.6
$3234.3
$5851
45 Yrs 45 Yrs 30 Yrs
--OMW
{290)
6/93 W400 1/96 W400 1/00 DC400
1951 MW
s 873 .. 7 2382.7
$3256.4
$6100
NOTE: Sensitivity analysis performed using·o% escalation, 3% interest rate and the mid load forecast.
I
r •

-~-·--, ----. .. . ·- ,_. - -~'
THERMAL 0 SUSITNA - 3AE
BASE CASE SENSITIViTY BASECASE SENSITIVITY P·ARAI-tETER I JOB I • 0. I lMEl LAL9 l8J9 LE07
THERMAL PLANT CAPITAL COSTS ($/kW) Coal-fired Steam (250 MW) $2744/kWl . $2135/kW2 $2744/kWl $2135/kW2 Natural Gas GT (75 MW) 350/kW 350/kW 350/kW 350/kW Diesels (10 MW) 778/kW 778/kW 778/kW 778/kW
1990-2010 THERMAl ADDS: Coal (MW) 900 1100 300 300 NGGT (MW) 600 525 225 225 Diesels (MW) 50 10
TOTAL 1550 MW 1635 MW 525 MW 525 MW
RETIREMENTS (MW) (734} (734) ( 734 )· ( 734)
HYDRO ADOS: MONTH/YEAR NAME MW 6/93 W400 6/93 W400
1/96 W400 1/96 W400 ~ 1/00 OC400 1/00 OC400
TOTAl FIRM* MW 2010 1895 MW 1980 MW 2023 MW 2023 MW
$ X 106 (80$} lcf year PH $ 873.7 $ 873.7 $ 873~7 $ 873.7
20 year llW 3319.4 3095.3 2360.6 2344.6
TOTAL $4193.1 $3969 .. 0 $3234.3 $3218.3
LONG TERM (2040) PW $8133 '$7585 $5851 $5744
*In Peak f.bnth (December)
NOTE: Sensitivity analysis performed using 0% excalation, 3% interest rate and the mid load forecast. ·
,
lt.8 Alaskan Adjustment Factor 21.4 Alaskan Adjustment factor

~· . -: :---·· f"*- ... _ r-·_._.,. ~- ._,-.- -- ..,...__..,..~ ... ,.._ - .. ~--- -"~"""'-'~ "":Z'~- ·----~ ~....__.,_ _....._......, -..-~ ~ _ .. ...:.......... - .... ----~1 .. - . - '- : ... ;- - .... ·- !-: -: - ~ .... . ........,_...__ , .. - - - - SENSITIVITY ANAlYSIS z SUSITNA"'£APITAL COSTS (1980$) '
~. \ .. . TABLE 21
PARAMETER I JOB 1.0.#
SUSITNA COST {$xto6) (80$) Watana Dam Oev i 1 Canyon Dam Tunnel
1990-2010 THERMAl ADDS: Coal (r-M) NGGT {MW) Diesels (MW)
TOTAL
RETIREMENTS (MW)
HYDRO ADDS: MONTH/YEAR NAME MW
TOTAL FIRM* MW 2010
$ X 106 !B0$1 I t
· lo yearPW ' 20 year PW
. .l ..•.
[" I I
TOTAL '
LONG TERM (2040) PW -;
.......
*In Peak MOnth (December)
·---··--·---·----- """' · SUS ITNA - 7 . l
8A$ECASE s£NSIT}V1TV . LAZ7 l5F9 I
l !
$1984 $2418 i
I 1314 1949
400 400 300 300
10 10
710 MW 710 MW
(734) (734)
6/93 W400 6/93 W400 l/96 W400 1/96 W400 1/00 T380 l/OO·T380
.
· 2034 MW 2034 MW
$ 873.7 $ 873.7 2584.6 2880.6
$3458.3 $3754.3 •
$6494 $7135 ....... ··- -----
tri14'1ANA jDEN•t- CA:N\Io~
BASECASE L8J9
$1984 999
300 225
525 MW
(734)
6/93 W400 1/96 W400 1/00 OC400
2023 MW
$ 873.7 2360.6
$3234.3
$5851·
SUSITNA - 3AE SENS I TI VI TV
L5Gl l075
$1984 $2976 1110 1498
300 300 225 225
525 MW 525 MW
(734) (734)
6/93 W400 6/93 W400 1/96 W400 1/96 W400 l/00 DC400
2023 MW 2023 MW
$ 873.7 $ 873.7 2546.2 2836.3
$3419.9 $3710.0.
$6212 $6807
NOTE.: Sensitivity analysis performed using 0% esr;alation, 3% interest rate and the midload forecast.
..

' '
___ , ,._ ;---~- .....,_._._-_ r---·- :-"'~;--- - f-.. "::- .r~ ~- . ~~, . ...:.., ~~·~~- ~ -:----1 . ~·...._-~ . -~ ~. . --._ . -~ . ~--~· ~ - - - - - - - - - - -- ·-- - --- - ~--- -; - •.
PARAMETER I JOB I.D.#
1990 MW
1990-2010 THERMAL ADOS: Coal (MW) NGGT (MW) Diesels (MW)
TOTAl
RETIREMENTS (MW) .,
HYDRO ADDS: MONTH/YEAR NAME MW
TOTAL FIRM* (2010)
$ x to6 ~ao$) lo Yea, .. P 20 Year PW
TOTAL
lONG TERM (2040} PW -:-
*In Peak Month (December)
TABLE ZZ,
LtW
WATM'I/
SENSITIVITY. ANALYSIS - TUNNEL CAPITAL COSTS (J9So T~\t.i .
. 1u.M TUNNEL COST TUNNEl COST HAlVED**- MEDIUM lOAD HALVED** -·lOW tOAD
W/T W/T W4co/T 7A. 7A
/)
~'q~.~~--~~_Lo~7~~----~l~6~1~5----------------~l~61~3~-------
1079 MW
200 450
30
680 MW
(734)
6/93 W400 1/96 W400 1/oo r
$ 873.7 2474.2
t3~d7- 0. T "•r•·.J
$6232
1079-MW
375 20
395 MW
(734)
6/93 W400 1/02 T
$ 744.1 1955.8
s.i)cnn n c.u~:s.'!l
$4726
**Scheme involving one--40ft. diameter tunnel utilized.
..
f. ~-
3 - SUSITNA BASIN DEVELOPMENT SELECTION - SUMMARY TABLES

tl fl '
~.
:I r II r• r~
{I' r• IJ " :I .
•• :I lJ l tl ll f . ,tl il' ~ . ..
SCHEME/PLAN EVALUATION CRITERIA:
.. ECONOMIC - ENVIRONMENTAL - SOCIAL - ENERGY CONTRIBUTION
/' a· I: I I I 'I ll r ll .... ' ~
'I !I :I. I I ~I
·L.I
Parameter
Capital Investment
Fuel
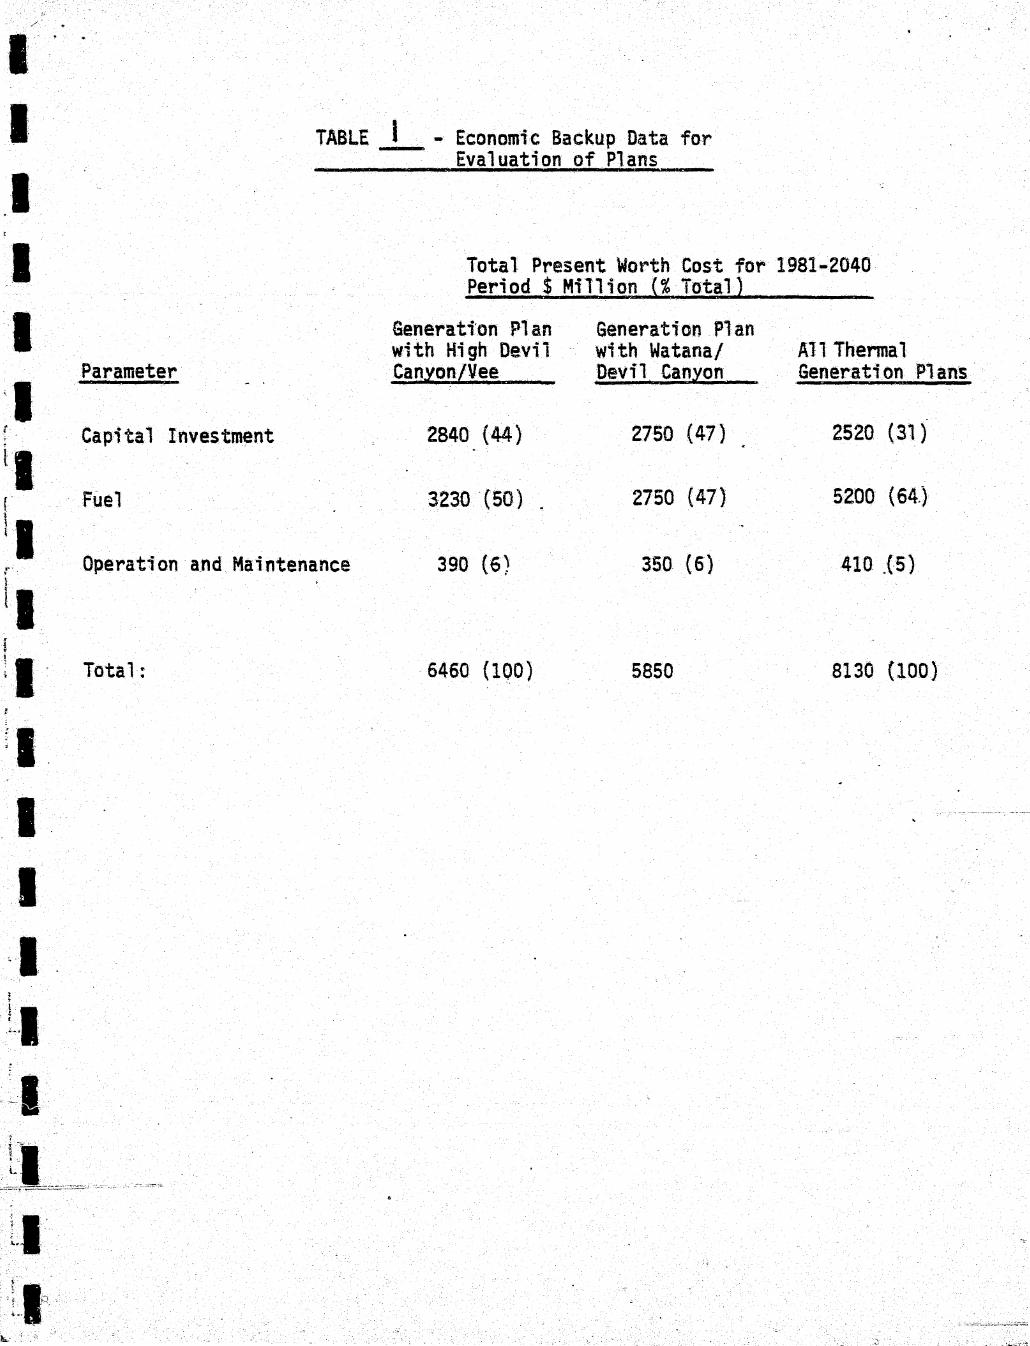
TABLE I - Economic Backup Data for Evaluation of Plans
Total Present Worth Cost for 1981-2040 Period$ Million (%Total)
Generati'on Plan with High Devi 1 Canyon/Vee
2840 (44}
3230 '{50) .
Generation Plan with Watana/ Devil Canyon
2750 (47)
2750 (47)
Al1 Thennal Generation Plans ·
2520 (31)
5200 (64.)
Operation and Maintenance 390 (6) 350 (6) 410 .{5)
Total: 6460 (lQO) 5850 8130 {100)
.~a·
.. !.1 ~-::::;.:;:;:~,:;::.;:::.::=..::.:::..::.:::..'::-.:
I•• i ~. . ·. ' l '
\...,, :
.t

.. : - - ·- - - - - -- --TABLE 2..
ECOHOHIC EYAtUATIOH Of DEVIL CANYON DMt AND TUttNEL SCHEf£5 NfD WATANA!D£Yil CANYOff NtD IUGU D£YJL CANYOH/YE£ PlAHS
ECONOMIC EVAlUATION: Base Case
LOAD GROWTH
Sensfthtt
tow Hi!ih
PERIOD OF ECONOMIC ANAlYSiS Period shortened to 1980 - 2010 ~
DISCOI.JtT RI\TE
FUEL tOST
FUEl COST ESCALATION
ECONOHJt THER~ PLANT liFE
51 as (interpolated) 91
80% basic fuel cost
OS fuel escalation OJ .:oal escalation
501 t!dension 0% extension
680
650 N.A.
230
520
210 N.A.
160
As both tbe capital ~nd fuel c\lsts assoehted with the tunnel schea~e and H.D.C./Vee Platt are higher than for Watana/Devil Can.)'On plan any changes to these paral!leters cannot reduce the Devtl CanJOn or Natana/~vil Can~n net benefit to below z.ero.
£con01Rtc ranldng: De~: ... tan.)'On dft!tltSSt:hew ts superior to Tunnel scheae. Watana/De~il. ~ daa plan Is s ertor .to the Hi Oe~ll Can driiM lin.
Shorter period of eVI1uatton dec~~s econc.\c differences. Rinldn n.at ns linch • iL
Ranking r~ains unchanged.
r- -·----- . ·~--~-~ . ,_ __ .,. ·- r--:- ~~ r~ - ---. ~- ' . J - - - - - - - - ..
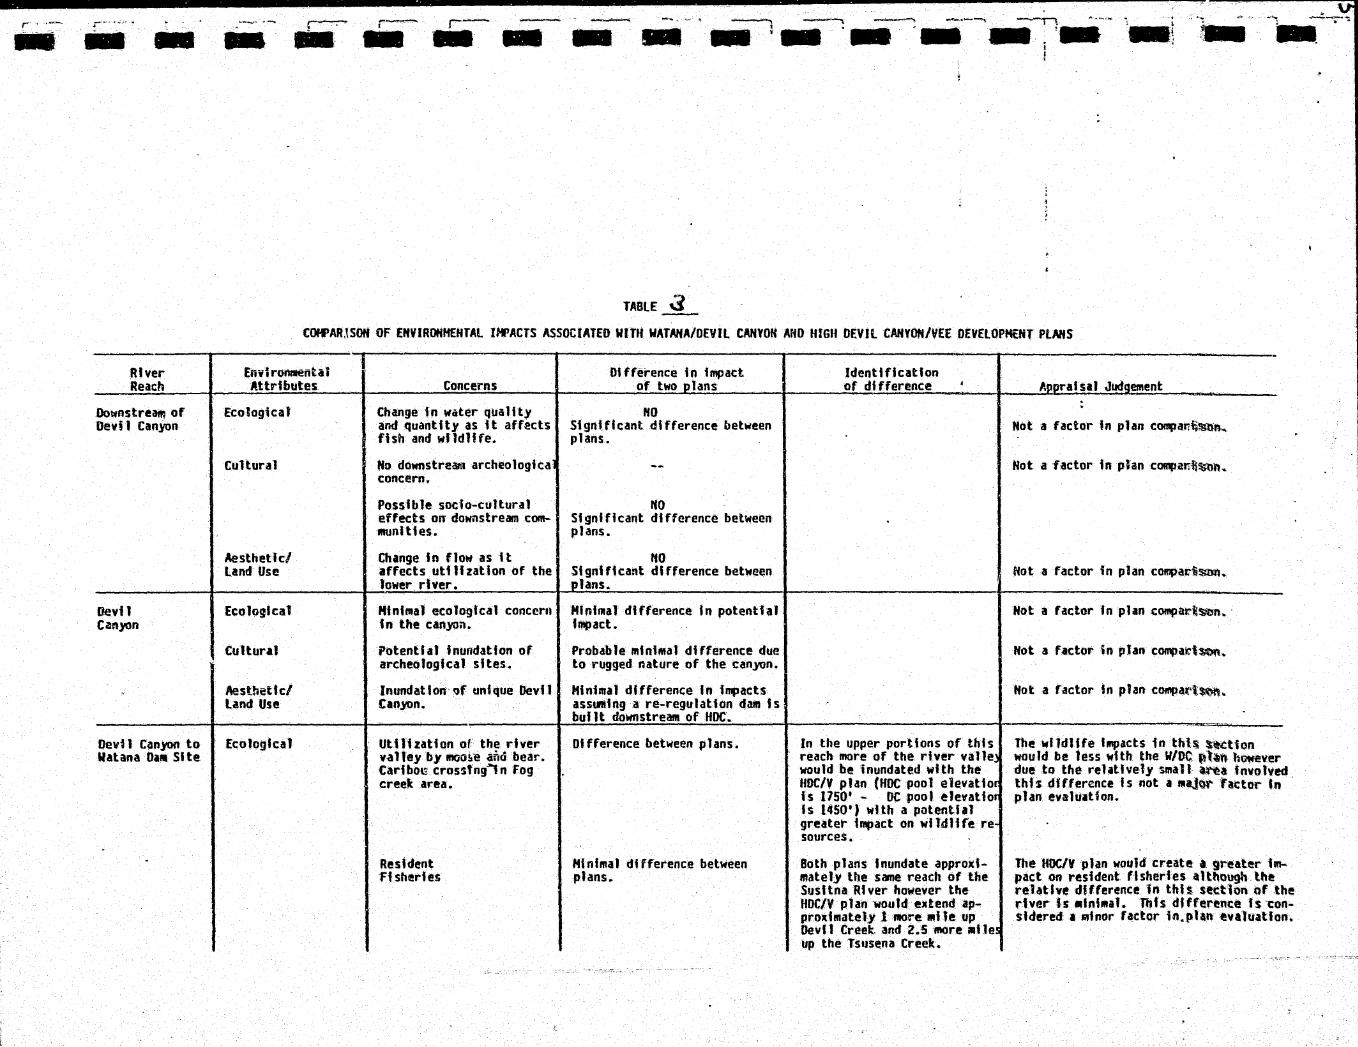
TABLE .:3 COfFAR,\SOH OF fNVIROHHENTAl If-IJACTS ASSOCIATED WITH WATANAIDEVIL CANYON AND HIGH DEVIl CANYON/VEE DEYELOMNT PLANS
-------------r----------------r---...----------------;-------------------------r----------------------~--------------~--------~-----· River Reach
Downstre~ of llevi 1 Canyon
Devfl Can.)'On
Oevi 1 Canyon to llatana Da11 Sl te
Env1r0ililiienhi Attv-ibutes
Ecological
Cultural
Aesthetic/ Land Use
Ecological
Cultural
Aestt.ettc/ Land Use
£co1ogfca1
Concerns
Change fn water quality and quantity as it affacts fish and wfldlffe.
No downstream archeologica concern.
Possible socio-cultural effects on dowg'lstream comlftUnlttes.
Change Jn flow as It affects utf1fzation of the lower_ river.
Htnfmal ecologtca1 concern tn the canyan.
Potential inundation of archeological sttes.
Jnundattolr ~f unique Devt1 tan.)'On.
Utilization of the rher v~lh!y by moa!s-e .afiti bear. Carfbo~ crosstng1n Fog creek area.
Rest dent Fhhertes
Dt fference in 1mpact of two _p_lans
HO Stgntffcant difference between plans.
reo Significant difference between plans.
NO Stgntftca"t difference between plans.
Hhltmal difference Jn potenth1 tmpact.
Probable minimal dtfference due to rugged nature of the canJQn.
Minimal difference In impacts asstmfng a re-regulation dairl is built downstream of HOC.
Difference between plans.
Htnfmal difference between plans.
Identtftcatton of difference
In the upper portions of thh reach more of the. river valle' would be inundated wfth the HDC/V plan (HOC pool ele.vattor Is 1750' - Dt pool eJevatior Is 1450') wtth a potential greater impact on wildlife re sources.
Both plans tnundate approdmate ly tlle sCJne reach of tbe Susttna Rtver however the HDC/V plan would elltend approximately 1 more ... ne up Oevlt Creel;. and 2.5 1110re 111i.1es up the Tsus~na Creek •.
Appraisal Judgement
Not a fador In plan compar;fi%lln ..
Mot a factor in phn cQ!IIpafi.f$~ ..
Hot a factor in plan cCftlpad!S:Dn-..
Not a factor fn plan compat'll!tttm. ·
Hot a factor in plan compa~t~.
The wlldlffe IMpacts in tht~ ~~tion would be less wt th the W/l)(i l!l~n tu~ever due tn the rehtlvely small ~~~ tnvo1ved. thh dffference fs not a t~tajor httor ht plan evalu•tion.
The HOC/V plan would create a g~eater J~ pact on resident. ftsherfes although the rehtfve dffference tn thh set:tlon of the river h •lnh•af. Thts difference h considered. a 111fnor f~ctor in.phn enluaUon.
- -
Rher Reach
- !---- - - -..- --.-..., _ ..... , ---...~ ----.-. ..., - : __ f_--- ____ .... """'
-~ .. .. -
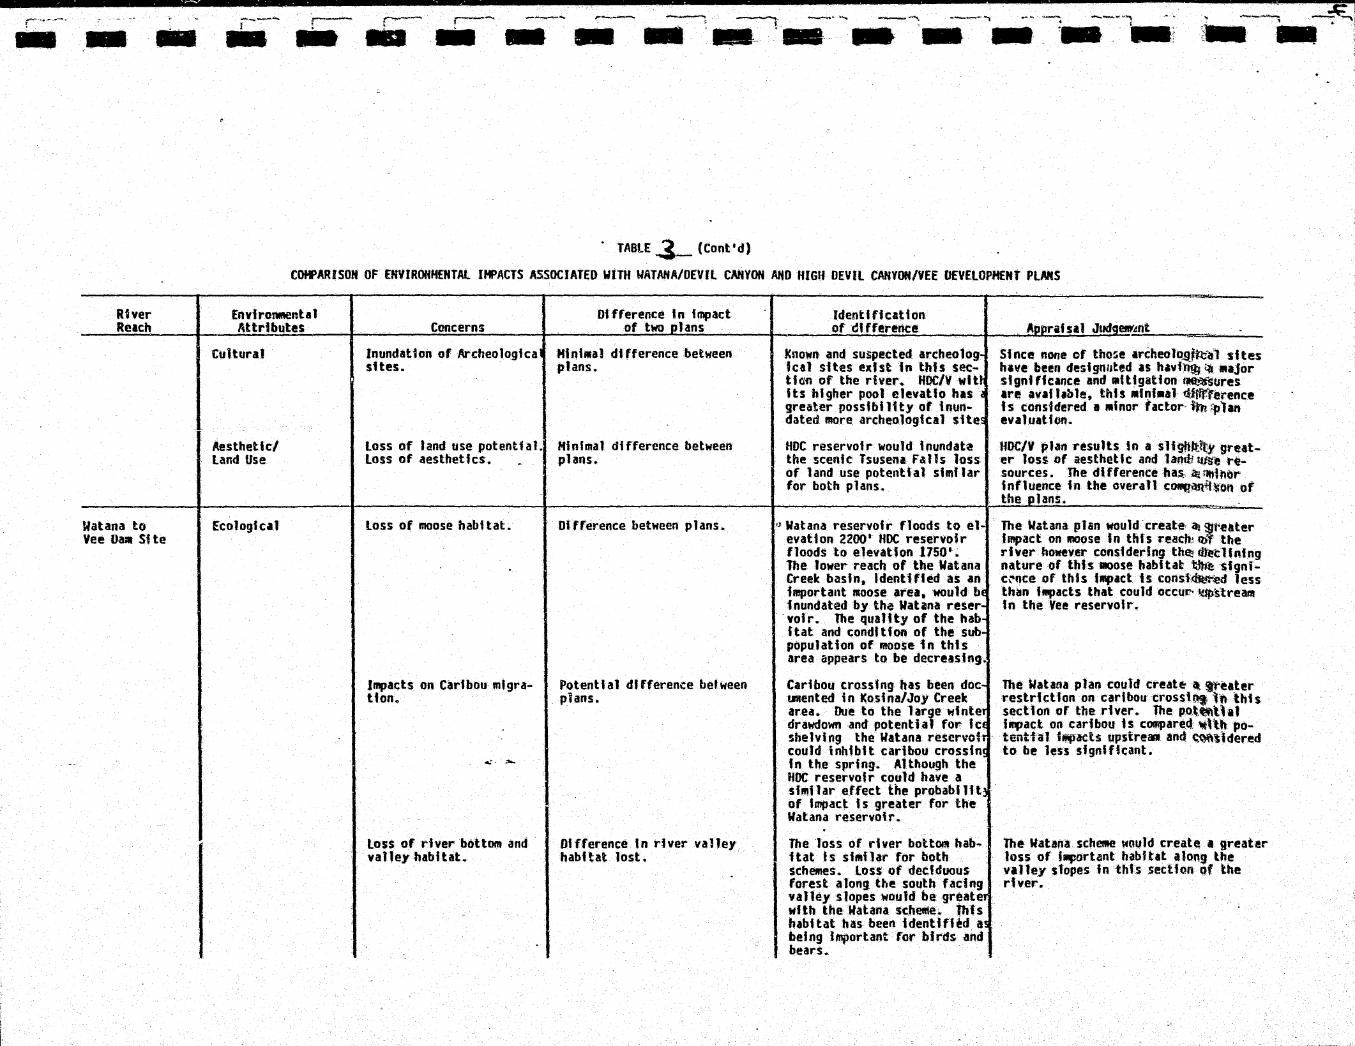
• TABlE 3- (Cont'd)
COMPARISON OF EHYIROHHEHTAl IMPACTS ASSOCIATED WITH WATANA/DEVIl CANYON AND HIGH DEVIL CANYON/VEE DEVELOPMENT PlANS
£nvfron~~enh1 Attributes
Cultural
Aesthetic/ land Use
Concerns Difference In fmpact
of two plans
Inundation of Archeologfcal MiniMa! difference between sites. plans. ·
loss of land use potential. Minfmat difference between loss of aesthetics. • plans.
ldentt ft cation of dffference
f:nown and. suspected archeotog teat sites exht tn this sectlen of the rlver. HQC/V wit~ Its htgher pool e1evaUo has ·~ greater possfbtltty of inundated more archeological sites
HOC reservofr would tnundat~ the scenic Tsusena f&11s loss of land use potential st~f1ar for both plans.
Apprafsa1 Jud~ertnt
Since none cf tho~e archeolo.!!#tt:ct1 sftes have been dest gnuted lS havfmt~ qr ••Jor stgntffcance and •lttgatton ~ures are avaltJble, this •fl'.'li•al r.Utfffet-ence h tonsfdered a 11inor factor·~ ;:plan evaluation.
HDC/V plan results in a sHgfHtlt~ gre•ter lou of aesthetic and land:! ~e rEsources. The dl fference has., ~ nttlnor influence fn the cveral1 c~~ton of the plans.
--------------~----------------;---------------------~~-------------------------+-------------------------r~~~~~--------·-----------· ---Watana to Vee OUI Stte
£cotoglca1 loss of moose habitat.
Impacts on Caribou mfgratton.
loss of river bottom and valley habitat.
Difference between plans.
PotentIa 1 dl fferem:e bet ween plans.
Dt fference In rlver valley habl tat lost.
o Watana reservoir floods to el evatton 2200' HOC reservotr floods to elevaUon 1750'. The lower reach of the Watana Creek basin, Identified as an important moose area, would bE inundated by tha Wat1na reser-
·volr. The quattty of the hab Hat and condt Uon of the sub-population of 1110nse in thts area appears to be decre~sfng.
The Watana plan would.create, at~t'eater impact on mose in this reacbl rtil the river however considering the: d.hrdtnfng nature of thfs 1100se habitat t»ft: ·stgniC\"QCe of this IRtpact Is const~ less than f~~pacts that could occut" ~treant fn the Vee reservoir.
Caribou crosstng has been doc The Wataoa plan could creat~ ~t~eater t111ent~ in tcosina/Joy Creek restriction on caribou crosst~ tnlbh area. Due to the large 1o1fnter secUon of the river. The po,t,~\hl drawdown and potential for lc• hnpact on caribou h COI!IPare4 111tl'tb poshelviflg the Watana re.servoh ·. tentiaJ 1MjJaeh upsireant and. ~\ldered could inhtbt t caribou ctossfn~ to be less sfgnlfh;allt. fn the spring. Although the HOC reservotr could have a sfll!ihr effect the probablltt~ of Impact fs greater for the Watana reservot.r.
The loss of rtver bottOI!t habitat h sfrililar for both SCh~es. lOS$ of deciduouS forest a long_ the south facf ng valley slopes ~o.uld be greatet with the Watana sch~. this habitat has been 1denttnM a~ being J~ortant for birds and bears.
lhe Vatana scheMe wauJd create 1 great~r loss of faportant habftat along the valley slopes fn this sedton of the river.

v _.,..__:___ .... ---~
JO>•~--- - - - - --i
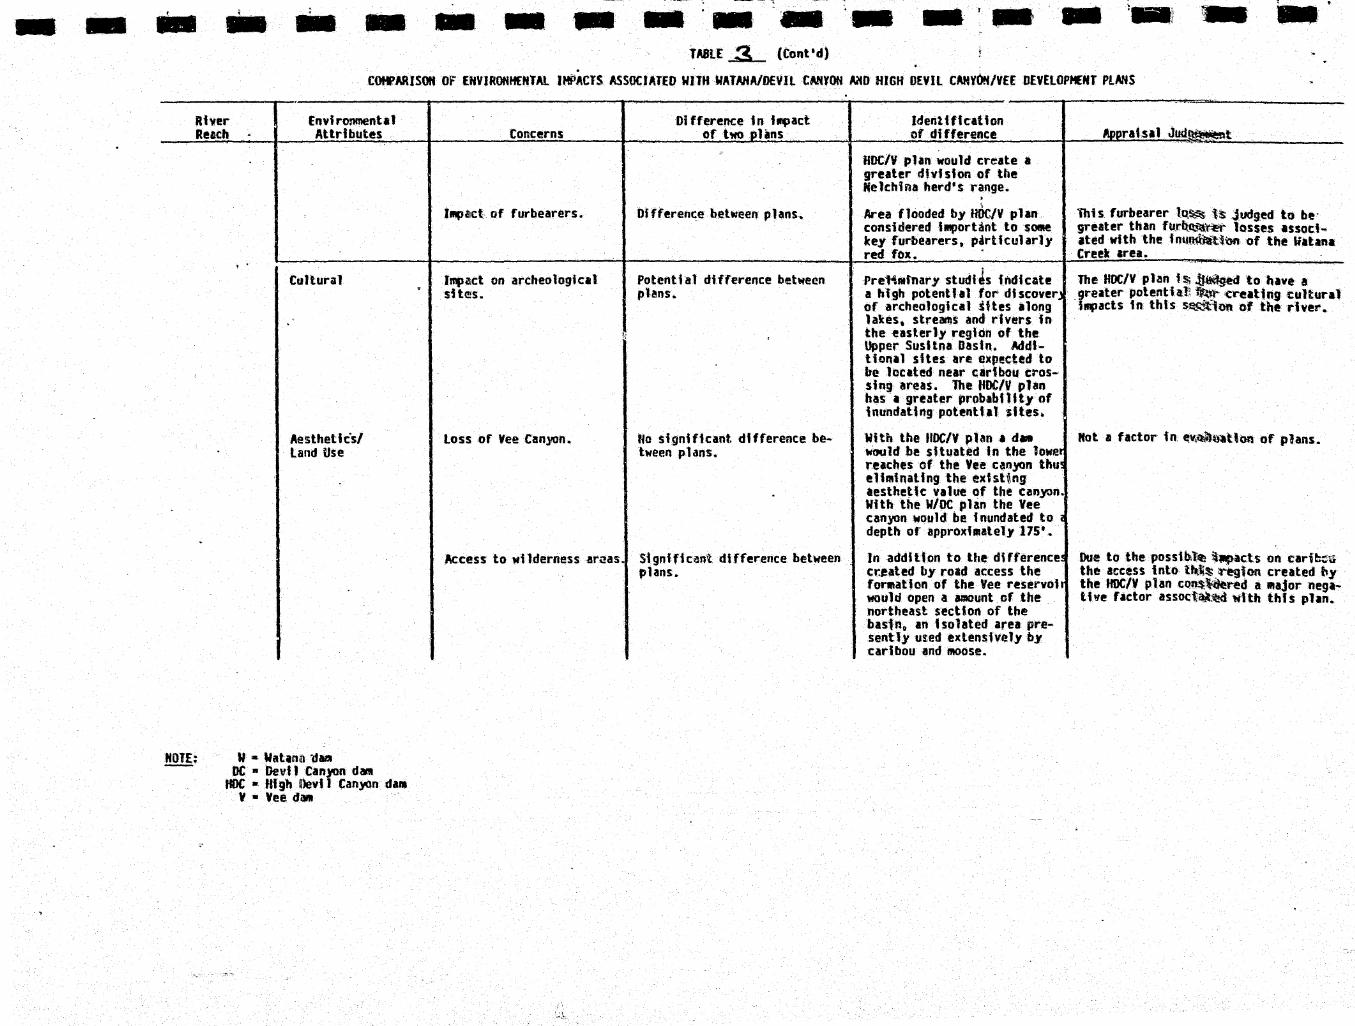
TABLE _3_. (Cont•d) .,
COMPARISON OF EHVIRONHEKTAl IMPACTS ASSaClAT£0 WITH WATAHA/DEYIL CANYON AND HlGH DEVIl CANYON/VEE OEV£LOPHENT PLANS
River Envt ronmenta 1 Difference tn impact tdenttfication Reach Attributes Coocerns of two plans of difference ApprUsa1 Judgement
Cultunl Loss of archeo1ogtcal Ho stgnfftcant difference td~n~ Due to the laryer area of the Not a factor tn plan evilual~ .. sites. tiffed to date. Watana reservQ r tn thts sec-
tion. the probabUtty of 1nun " dating archeological sites fs
• .,creased.
Aesthetics/ Resource agencies are con- location ~nd extent of access More extensive road access My Susttna dcveloprrient wt:lfr! l'lll.:Pt:llse Land Use cerned about creating could vary betwee-n plans. would probably result from thf lltcess to this re1attve1y wii-t\n~ss
access to extensive wilder HDC/V plan due to the con- area. As H is easter tci ~~ access ness areas. On the other structfon requirements at Vee than to Umtt It, schemes wlt?lt :the 1eas t
. hand certain segments of site • Ac(;ess created dt rect 1 Inherent access are cQnsid~ ~upertor the public desire improved by the reservoirs h shnJJar access. . for both schemes in this reac~
of the river.
Vee dam s t te Ecological lnundatfon of resident Dlffer.ence bet~een plans. The Vee reservo.tr muiiiWIII poo The ltDC/Y plan results In <l• lltnl flcant and upstream fhherfes. elevation ts 23~1'. The increase In the loss of res~t
Watana reservoir maximuM pool fisheries habitat ln this ~~ of the elevation ts 2200'. The addl rher. ttona1 too• el~vatton assoct-ated with the Vee d~ would result fn the tnudatton of approximately 12 additional •t les of the Sust tna IU ver 1 n thh reach •. 1-1/2 additional
... - •iles of the Oshetna River an( 5 miles of the Tyone River.
Loss of moose habt tat. Slgnffkant difference between in add! tton to areas Inundate<! The UDC/Y plan would create • 9reahr plans. by the Wat:ana reservoir. the Impact on 110ose in this seett~ of tlte
Vee impoundment would flood rhet·. Thh Impact on 111005~ b Judged 5700 an addilfonal acres of to be of greater s1gnff1cance thin the crH:ical Wint.er rh~r boft0111 toss of ~ose babttat in the Vtta~a
.. hatsitat uUlhed by at least Creek area tesultfng t'rOftl tba ~atana thr.ee subpopuhtlons ilf 1100se reser"ofr. tbat range over large arf!as east of the Susi tna and north of the Maclaren. Rt ver reach.
l~act on c~ribou •lgra- Stgntflcant difference between Area ftooded by HOC/V l'hn ts· This potenthl negative effect _on tfon. plans. historically., used by Neh;hlna carU,ou Is considered a 111ajor factor
car\bou herd~ .Due to. fncreas- tn ~he evduaUon of the HOC/V plan. ed length of rher flooded thE
__ .... '-! -. - - - - - - -- - ·- -~---- - -TABlE _3_ (tont 'd)
COWAR!SOH Ot ENVIROHH£NTAL lttPACTS ASSOCIATED WllH WATAHA/DE~ll CM\'00 ~D HIGH DEVIL CANYDH/V££ DEVELOPMENT PlANS ,, '
Rher Environmental Difference tn i'Pact ldenl t ftcat ton Relch . Attributes Concerns of two plans of difference ADDratu1 Jud~t
:
HDC/V phn would create a greater dhlsfon of the Melchi~a herd'$. range.
' llllpclct of furbearers. Difference between plans. Area flooded by HDc/V plan This. forbearer t~~ l't Judged to be·
considered h1porUot to SOllie greater than fu.rlt~~ losses assoct-key forbearers, particularly ated with the fnt~~lbn of the Wahna red fox. Creek &rea.
'•' ' . Cultural lmp~ct on archeological Potential difference between Pre'M111fnary studl Js fndic;te The HOC/Y pllln f~ ~to have a . sitf!!s. plans. a high potenthl for dhcover. _ ruter JJolenthl\ -~ cruUng -cultural
of archeologica1 iftes ilong . ~acts in thls s~o.-. of the rher. lakes. streams and rfvers in
;; !
the ~asterly region of the Upper Sust tna Oastn.. Mdl-tiortal sites are t!XIU!tted to be located near udbou tros-sing arl!as. The lfDC/V plan has a greater probabt Hty of inundaUng pot.enthl lftes.
Aestheuc·s/ loss of Yee Can.)IOn. No signiftcant. difference be- With the trDC/Y p hn 1 d• ftot a factor fn ev,~m.Umt of plans. Land Use tween plans. woold be situated fn the lower
reaches of the Vee canyon thu! eUmla,alfng the extsUng
. aesthetic value of the canyon lllth the W/OC phn the Vee canyon would be inundated to depth of approximately 175' • .
Access to wilderness -ar~as Significant difference between In -addiUon to the difference! Due to the posstbJ;~ --.act'S on cari~ii plans. cr.eated by road access the the access tnto lh:li~_~ton created by
fonftation of the Vee reservoh the HDC/V plan cQ~~red a 11ajor nega-would open a amount of the the factor associ;~i!!d ltHh thfs plan. northeast section of the basfno an isolated area pre-sently uted extensively by carfbou and 11100se.
W • Nahnill 'dY DC .. Devt I Can)'Ofl da~~
tU • High I!Jevi1 Can}On da11 Y • Yee dfllll ·

t·~ - - .. .. ~---· r---·-.. -Environrwenta1
Attrtbute
Eco1oglta1
Downstream Fisheries and Wildlife
Resident Ft sheries
,--- r---·-- ("--·_,.__--- --~ 4!T'-·---"'-•.o _ ........ ~ --.~ __ _,_ .. -~ - . .. - - - - ·- ·---;-Concerns
Effects resulting fre~~t changes in water quanttty and qualtty ..
loss of resident fishertes habitat.
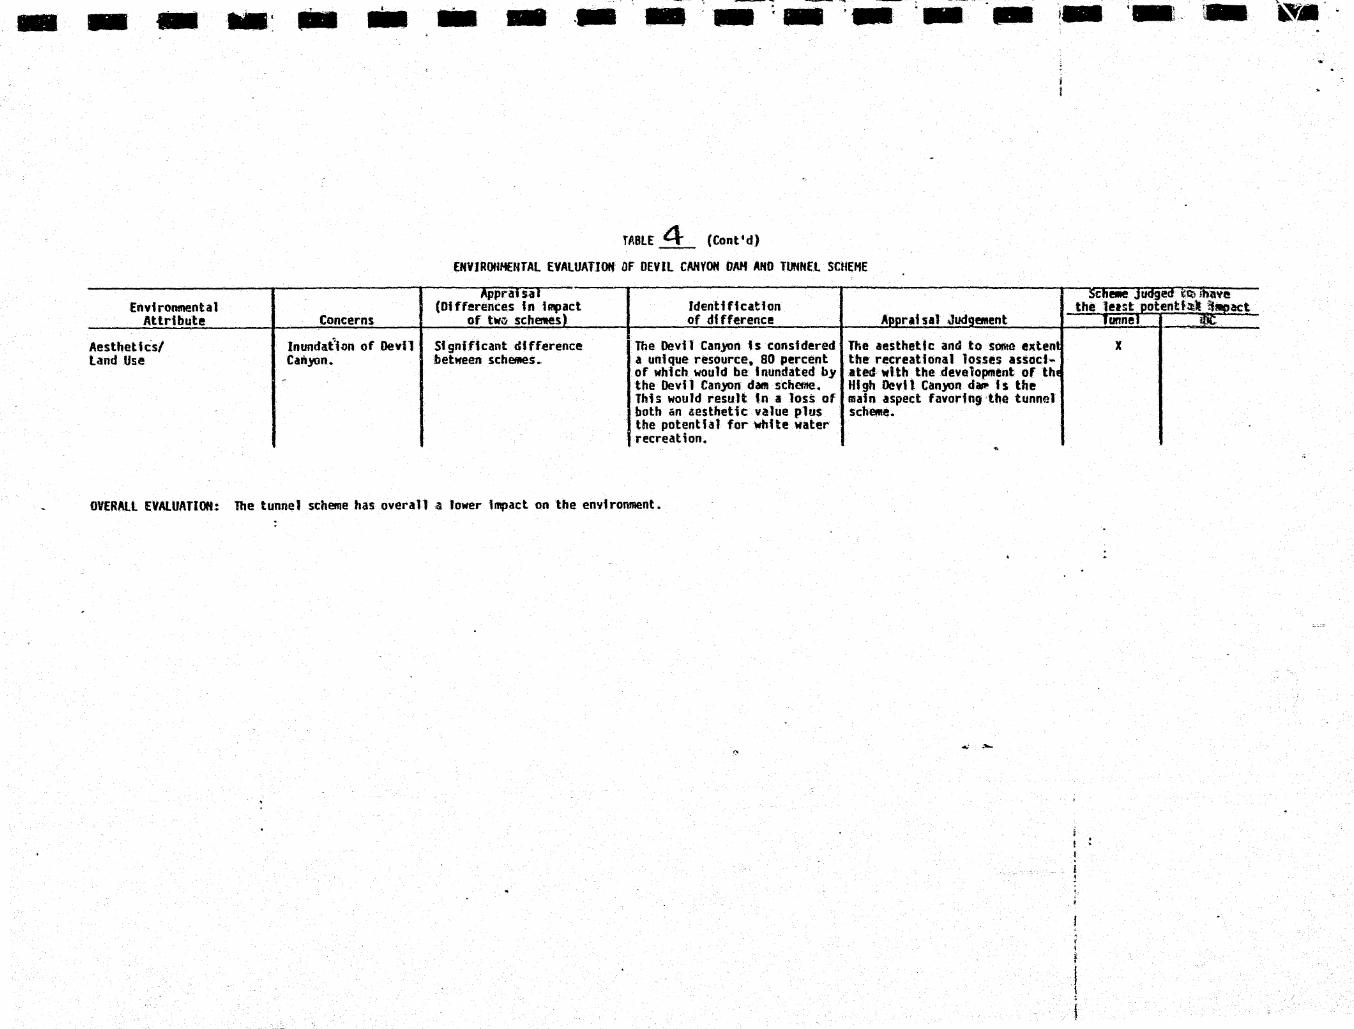
TABL£ 4 ;:-:
EHVJROHMENTAL EVALUATION OF DEVIL CANYON DAM AND TUNNEL SCHEME
Appra1sa1 (Differences in impact
of two schemes)
No significant difference between .schemes regarding effects downstream of Oevtl Canyon.
Differ~nce in reach between Devt 1 Canyon dan and tunnel re-regulation dam.
ldenti ffcat ion of difference
With the tunnel scheme controlled flows between regulation dat~ and downstream powerhouse offers potential for anadromous fisheries enhanceMent in this 11 miie reach of the river.
ftgt a factor in evalu&tion of schee.
If fisheries enharice.ent oppor~ tunUy can be re~lhed the t.unnel scheme offers a postttve •itigatSon .easure not availablE wtth tt\e Cevtl Canyon cb11 'ithe~~~e. This opporhnt t)• t s considered MOderate and fa~or~ the tunnel sche.e~
Hini•al differences between Devil Canyon darn would inundatf This r~ach of river h not con-schemes. 27 mf les of the Susltna River stdered to be highly s1gnfflcant
and approxlmately 2 mtles of for re$1denl ftshertes and thus Devil Creek. The tunnel schemE the dtffer4!nce between the would inundate 16 mil~s of the scheMs Is 111tnor and favor.s the Susitnza River. tunnel scheMe. ,
--------------------~~---------------+--~~-----.----------------~,~~~~~~----------~~~~~~~--------------+-~~----+-----~~----
lU-ldlHe
Cultural
loss of wlldH fe habttat.
lnundaUon of arch eo logic a 1 sites.
Minimal differences between schemes.
lhe most sensitive utldlife ha b1 tat in this reach is upstreM of the tunnel re-regulatton dM. where there ts no signtflcant difference between the schemes The DevH Canyon dam scheme In addtt~on inundate the river vaHO!y between the two dam ti-2. bo dam sites resulting \n • moderate increase tn iq>acts to wildlife.
Potential differences betweer bue to the larger area tnun-schemas. dated the probability of inun
dating archeological sites is increased.
the ~lfference in loss of ~ildlife hnbltet is ~onsldered moderate and favors. the tUilnel scheme.
"o significant sites bay@ been identified. If dlscove.~ea mtt$ gation 111easures are el!stly l~ p!eme~ted. Therefore ~his concern is not cons1der~d a facto~ in sche~~e evaluation. ·
X
-' ~.,
- - ... - ·- - ·- ·- - !~-,~~" ~- ... ~;tv.-:-- - ---·.
TABLE 4 (Cont •d)
ENVIROHHENTAl EVAlUATION DF DEVIl CANYON OAH AND TUNNEl SCMEHE
-f'Ppra1 saT · Environmental (Differences fn tmr::)ct ldenU ftcatton
Attribute Concerns of twv schees of dffference
J\esthet i c·s/ lnundat"ton of Oevn Significant ~tfference The Devil Can)tln is considered land Use Can)Un. between schemes. a unique resource. 80 percent
of which would be Inundated by - the Oevi 1 Canyon dam scheme. This would result tn a loss of both an &esthetic value plus the potential for Whfte water recreation.
OVERALL EVALUATION: The tunnel scheme has overall ~ lower tmpact on the environment.
Aooraf sal Judgement
The aesthetic and to some e~tent the recreatfona1 losses associ-ated With the development Of thE Hfgh Devil Canyon d~ ts the main aspect favoring·the tunnel sch~e.
...: -
5chet~e J~ed. ~ttt lh~tte the 1e1st ootentfiti• -~act
I ! l
! I
'·
Tunnel me X

- - - ~-• - r--· r-----"'· - ·- ~ .. - ' _...-... ..... - - - ;- - - .. TAOCE S
ENVIRONMENTAL EVALUATION Of WATANA/DEVIL CANVON-~l> HIGH DEVIl CANYON/VEE OEVELOHENT PLANS
ENVIRONt£NTAl ATTRIBUTE
Ecological 1) Fisheries
2) Wildlife a) Hoose
PLAN COWARISON
No sJ.gnificant difference in effects on downstream anadromous fisheries.
HDC/V would inundate approximately 58 miles of the Susitna River and 28 miles of tributary streams.
W/DC would inundate app~oximataly 86 miles of the Susitna River and 30 miles Qf tributary streams.
HDC/V would inundate 86 miles of c..-ltical winter river bottom habitat.
W/OC would inundate 116 miles ~?f this river bottom habitat.
HOC/V would inundate a large area upstream of Vee utilized by three subpopulations of moose that range of large areas of the northeast section of the baoio.
W/OC would-· inundate the Walana Creek area utilized by moose: The c~ndition of this aubpnpUiation of moose and the quality of the habitat they are using appears to be <Ecreasing.
APPRAISAL JUDGEMENT
Due to the lesser inundation of resident fisheries habitat and no significant difference in the effects on anadromous fisheries, the W/OC plan is judged to have less impact,
Due to the lower potential for dire.ct impact on moose populations within the Susitna, the W/OC plan is judged superior.
PLAN .lJOGED TO HAVE THE LEAST
POTENTIAl IMPACT
HOC/V ti/DC
X
X
. .. ___ .... --- ~--.,..:- -~·.., .,__, .... -~ ....._,___ - _,..., ___ _.... - - - - - - ~ ... ·- ~- ·--TABLE s I (OMT ~
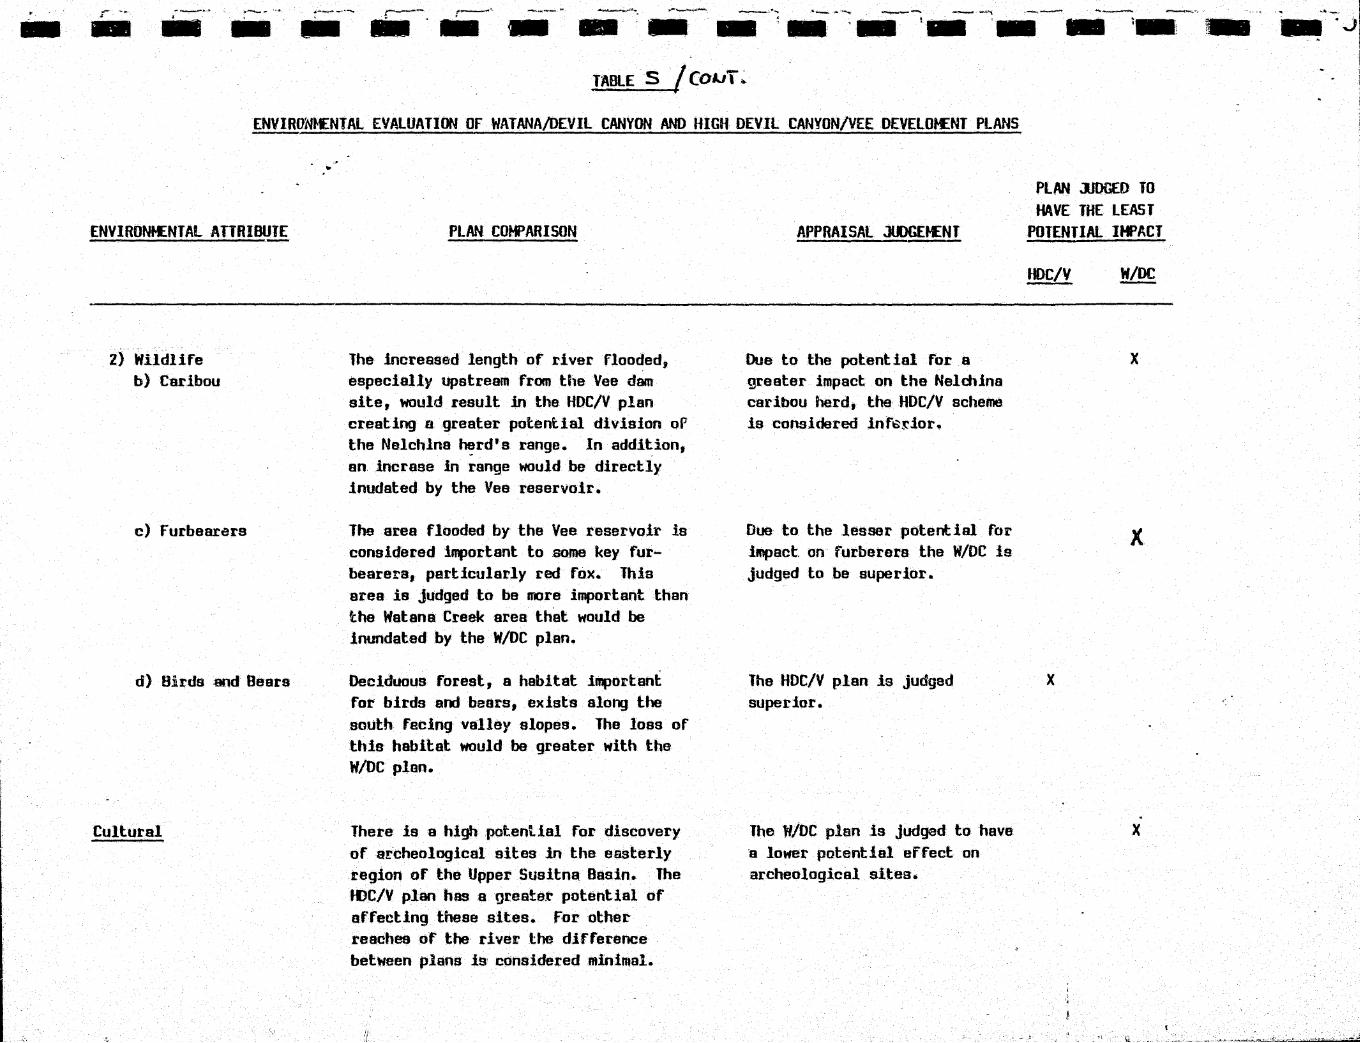
ENVIRUNHENTAL EVALUATION OF WATANA/DEVIL CANYON AND HIGH DEVIL CANYON/VEE DEVELOHENT PlANS
ENVIRONMENTAl ATTRIBUTE
2) Wildlife b) Car.ibou
c) forbearers
d) Birds and Bears
Cultural
•
PlAN COMPARISON
The increased length of river flooded, especially upstream from the Vee dam site, would result in the HOC/V plan creating n greater potential division oP the Nelchlna ~rd's range. In addition, an incrase in range would be directly inudated by the Vee reservoir.
The area flooded by the Vee reservoir is considered important to some key furbearers, particularly red fox. This area is judged to be more important than the Watana Creek area that would be inundated by the W/OC plan.
Deciduous forest, a habitat important for birds and bears, exists along the south feeing valley slopes. The loss of th.is habitat would be greater with the W/DC plan.
There is a high .potential for discovery of archeological sites .in the easterly regiori .of the Upper Susitna Basin. The JDC/V plan has a grea!:e.t potential of affecting these sites. for other reaches of the river the difference between plans is considered minimal.
APPRAISAL JUDGEMENT
Due to the potent .ial for a greater impact on the Nelchina caribou herd, theHDC/V scheme is considered inf~~ior.
Due to the lesser potential for impact on furberers the W/OC is judged to be superior.
The HDC/V plan is judged superior.
The W/DC plan is judged to have a lower potential effect on archeological sites.
PlAN .JJOGEO TO HAVE THE lEAST
POTENTIAL IMPACT
HOC/V W/OC
X
X
. X
ll . ..
-

- i - - r-···· - - ,....--· t -
-----~---------~-·~-· ----- ------ - ~-·------
r----.. __ """ ,..,... ___ ..
- - - .. - - -· TABLE S {CCJMT •
ENVIRONMENTAl EVALUATION Of WATANA/OEVIL CANYON AND HIGH DEVIl CANYON/VEE DEVELOHENT PLANS
ENVIRONHENiAl ATTRIBUTE
Aesthetics/ land Use
Overall Evaluation:
Note: W ;: Watana Dam DC = Devil Canyon Dam
PLAN COMPARISON
With either scheme tha aesthetic quality of both Devil Canyon and Vee Canyon would be impaired~ The HOC/V plan would also inundate Tsuaena fallso
Due to construction of Vee Dam site and tho size of t.he Vee reservoir P t~e li>C/V plan would inherently create accase to a
mora wilderness are than would the W/OC plan.
APPRAISAL .JJ>GEten
Both plans impact the valley aesthetics. The difference is considered minimal
As it is easier to extend access than to limit it, inherent access requirements were considered detrimental and the W/DC plan is judged super lor.. The ecological sensitivity of the area are opened by the lllC/V plan reinforces this judgement.
PlAN .D>CED TO HAVE THE lEAST
POTENTIAL ltflACT
IIJC/V W/OC
X
lesser impact on birds and bears associated with the HOC/V plan are considered to be nearly uutweighed by all the other iqJacts tllich favour the W/DC plan.
.;
fllC :: High Devil Canyon Dent V :: Vee Dam -·
~--"··-··· IJI'!>~.,-, -·-
Social Aspect
Potential non-renewable resource displacement
Impact on State economy
Impact on local economy
Seismic exposure
Overall Evaluation
_.._..,....._,., ~ ... -·
Parameter
Million tons . Beluga coal, qver 50 years
Risk of major structural failure
Potential impact of failure on human life
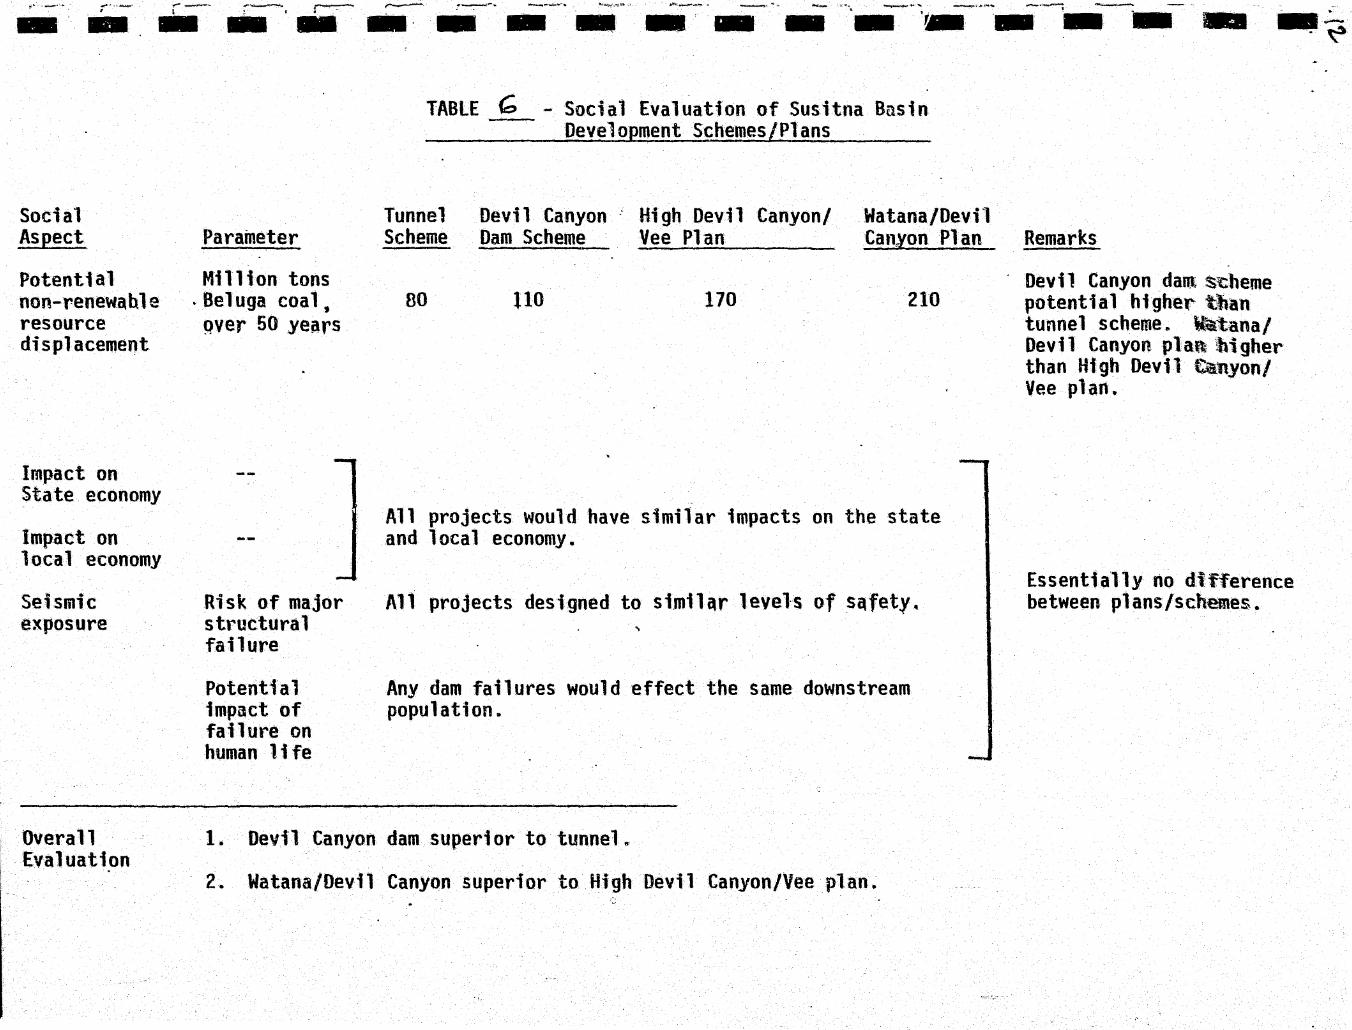
-- ·'<~ ... --- - - -·- ·-- ... ·-- - -TABLE G - Social Evaluation of Susitna Bnsin
Development Schemes/Plans
Tunnel Devil Canyon ·· High Devil Canyon/ Watana/Devil Scheme Dam Scheme Vee Plan Canyon Plan Remarks
80 110 170 210
All projects would have similar impacts on the state and local economy.
All projects designed to similar levels of safety~
Any dam failures would effect the same downstream population.
Devil Canyon dam ~~heme potential higher- tban tunnel schemee \lat.ana/ Devil Canyon pla~ 'higher than High Devil ~nyon/ Vee plan.
Essentially no difference between plans/schemes.
1. Devil Canyon dam superior to tunnel.
2. Watana/Devil Canyon superior to High Devil Canyon/Vee plan.

r,.~
.:1 •• ·-·
'I !'.'~
l
•• ~-~
'I "' • 1
•• !I ..
'I I ' '!I'
, . •
:I -~·
II 1
ll 'i.l
TABLE -7 ENERGY CONTRIBUTION EVALUATI_ON OF THE DEVIL CANYON DAM AND TUNNEL SCHEMES
Par-ameter
Total Energy Production. Capabi 1 it;:
Annual Average Energy GWH
Firm Annual Energy GWH
% Basin Potential ·oeveloped*
Devil __ c_a_n_yo_n ___ u:._T._u_nn_e_l_ Remarks
2850
2590
43
0
2240 Devil Canyon dam annually deve 1 opes 610 GWH
2050 and 540 GWH more average and firm energy respectively than the the Tunnel scheme .
Devil Canyon schemes 32 develops more of the
basin potential
950 -Tunnel scheme incorpor-ates friction 1 asses in
· tunnels. A 1 so the compensation flow released from re-regu 1 at ion d·am ts not used in conjunction with head between re-regul at ion dam and Devil Canyon.
rl L *Based on annual average energy. Full potential based on USSR four dam scheme (Reference ).
~..
11 .
:? I
~~· • :.1
,,

}·4'•
. -• ,_
I f ...... •; , ' ;I i-
~.-r .
'I r· ~-..... , '"~
'I J •• ·-: ~.
:I ~.
~·I .::
! 1· .. > h ..
:I
. TABLE -·B ENERGY CONTRIBUTION EVALUATION OF THE WATA.~A/DEVIL CANYON AND
HlGH DEVIL CANYON/VEE PLANS
Parameter
. __ IotaJ _..Energy Product i on Capabi 1 i ty _
. Annua 1 Average Energy GWH
Firm Annual Energy GWH
% Basin Potential Developed*
Enerly Potentia 1 Not Deve oped_ GWH**
Watana/ Devi 1 Canyon
6070
5520
91
0
High Devi 1 Canyon/Vee
4910
3870
81
550
Remarks
Watana/Devi l Canyon plan annually developes 1160 GWH and 1650 GWH more average ~ and fi rm energy repectively than the High Devil Canyon/Vee Plan ..
vJatana/Devi 1 Canyon plan develops more of the basin potenti a 1
Hi gh Devi l Canyon/Vee Plan does not develop 150 ft gross head between Vee site and Watana reservoir.
*Based on annual average energy. Full potential based on USBR four dam scheme (Reference ).
**Includes losses due to unutilized heado
t ».. , .·f.· '4
,... J t I·· .# ~ .,
ll ~-!
II ,{I
.. r .
:I >'-I
lJ ,. ..
I I I-ll Ll I tl .·
ll I. I .·i· i l .
:_·.··· ~ ..
\" .
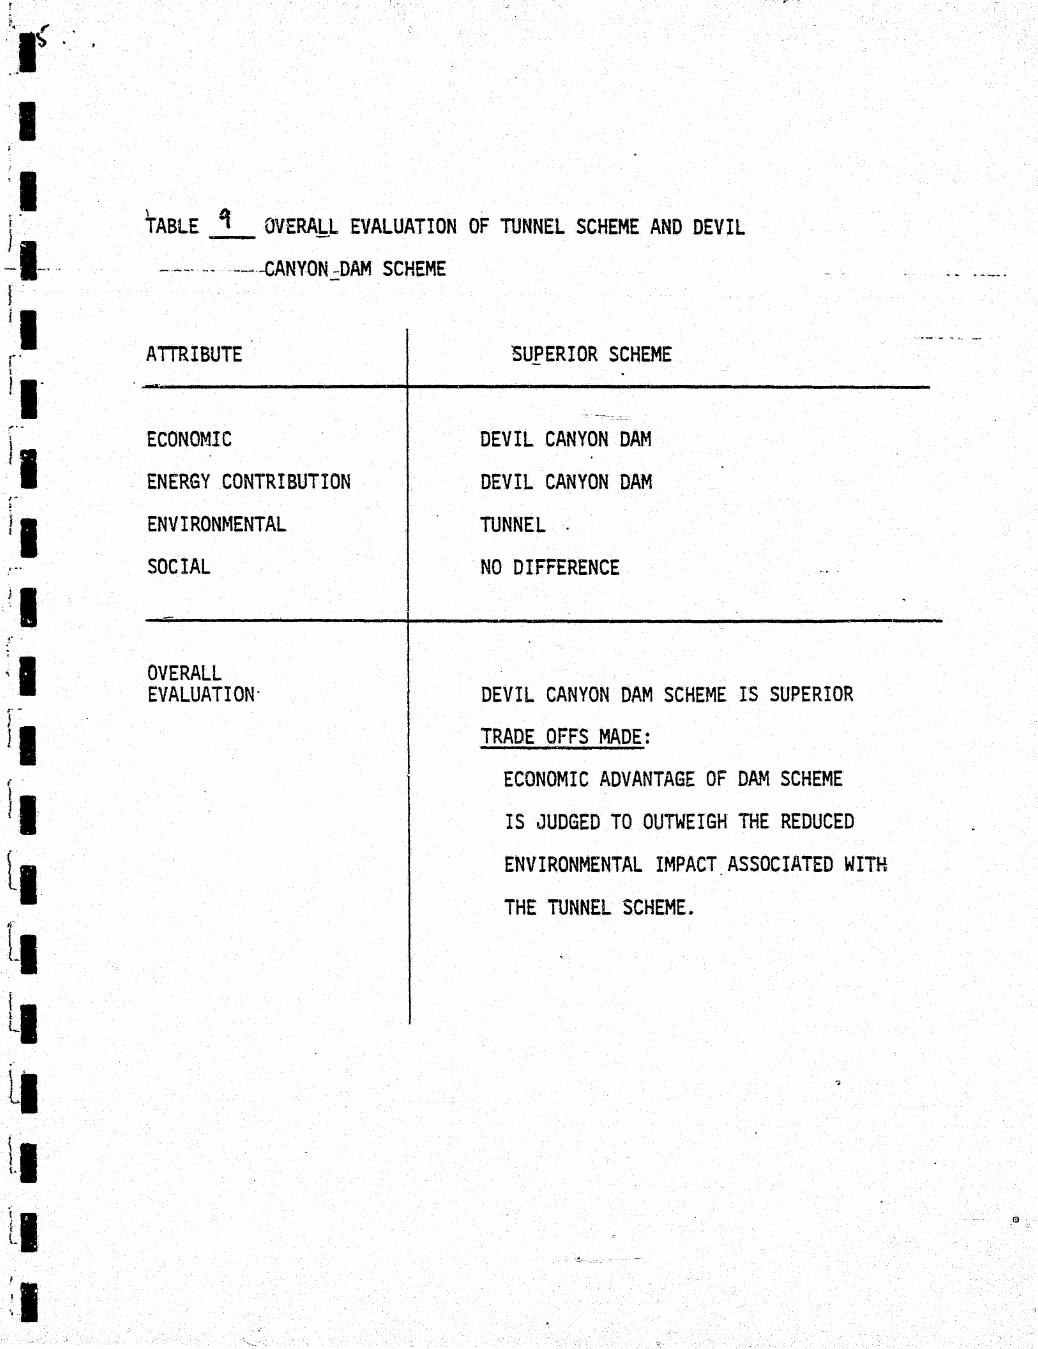
TABLE _tt_ OVERALL EVALUATION OF TUNNEL SCHEME AND DEVIL
--~--CANYON -DAM SCHEME
ATIRIBUTE BU.PERIOR SCHEME
-~---------------~--~----------------------------
ECONOMIC
ENERGY CONTRIBUTION
ENV I RON~1ENTAL
SOCIAL
OVERALL EVALUATION·
DEVIL CANYON DAM
DEVIL CANYON DAM
TUNNEL .
NO DIFFERENCE
DEVIL CANYON DAM SCHEME IS SUPERIOR
TRADE OFFS MADE:
ECONOMIC ADVANTAGE OF DAM SCHEME
IS JUDGED TO OUTWEIGH THE REDUCED
ENVIRONMENTAL IMPACT ASSOCIATED WITH
THE TUNNEL SCHEME.

I I I I ... -·--·· ~
I I I .
I I .
I I I I I I
.,
TABLE 10 OVERALL EVALUATION. OF GENERATION PLANS WITH HIGH DEVIL <
CANYON/VEE AND WATANA/DEVIL CANYON DAM PLANS· · ·
ATTRIBUTE
ECONOMIC
ENERGY CONTRIBUTION
ENVIRONMENTAL
SOCIAL
OVERALL EVALUATION
SUPERIOR PLAN
WITH WATANA/DEVIL CANYON
WITH WATANA/DEVIL CANYON
WITH WATANA/DEVIL CANYON
NO DIFFERENCE .
PLAN WITH WATANA/DEVIL CANYON IS SUPERIOR
TRADEOFFS MADE~ NONE
I
I I
-·-1 .• -1 I I I I
-4 - COMPARISON OF THE SUSITNA .BASIN DEVELOPMENT PLAN WITH THE AU
tHERMAL OPTION
>0}..- ... - ...,. "' ~ ..... _.._.... _ _....,.....
0
c
I I
. J
.~.-. 1: - . ,
'
'I
'• I l . t. I f
II Jl Ll tl {
Ll LJ jl
SCHEME/PLAN EVALUATION CRITERIA:
- ECONOMIC - ENVIRONMENTAL - SOCIAL - ENERGY CONTRIBUTION
c
------~---- ---
- - r - -- - - -lABt£ I ,.....;... __ -·----"""'\ -----
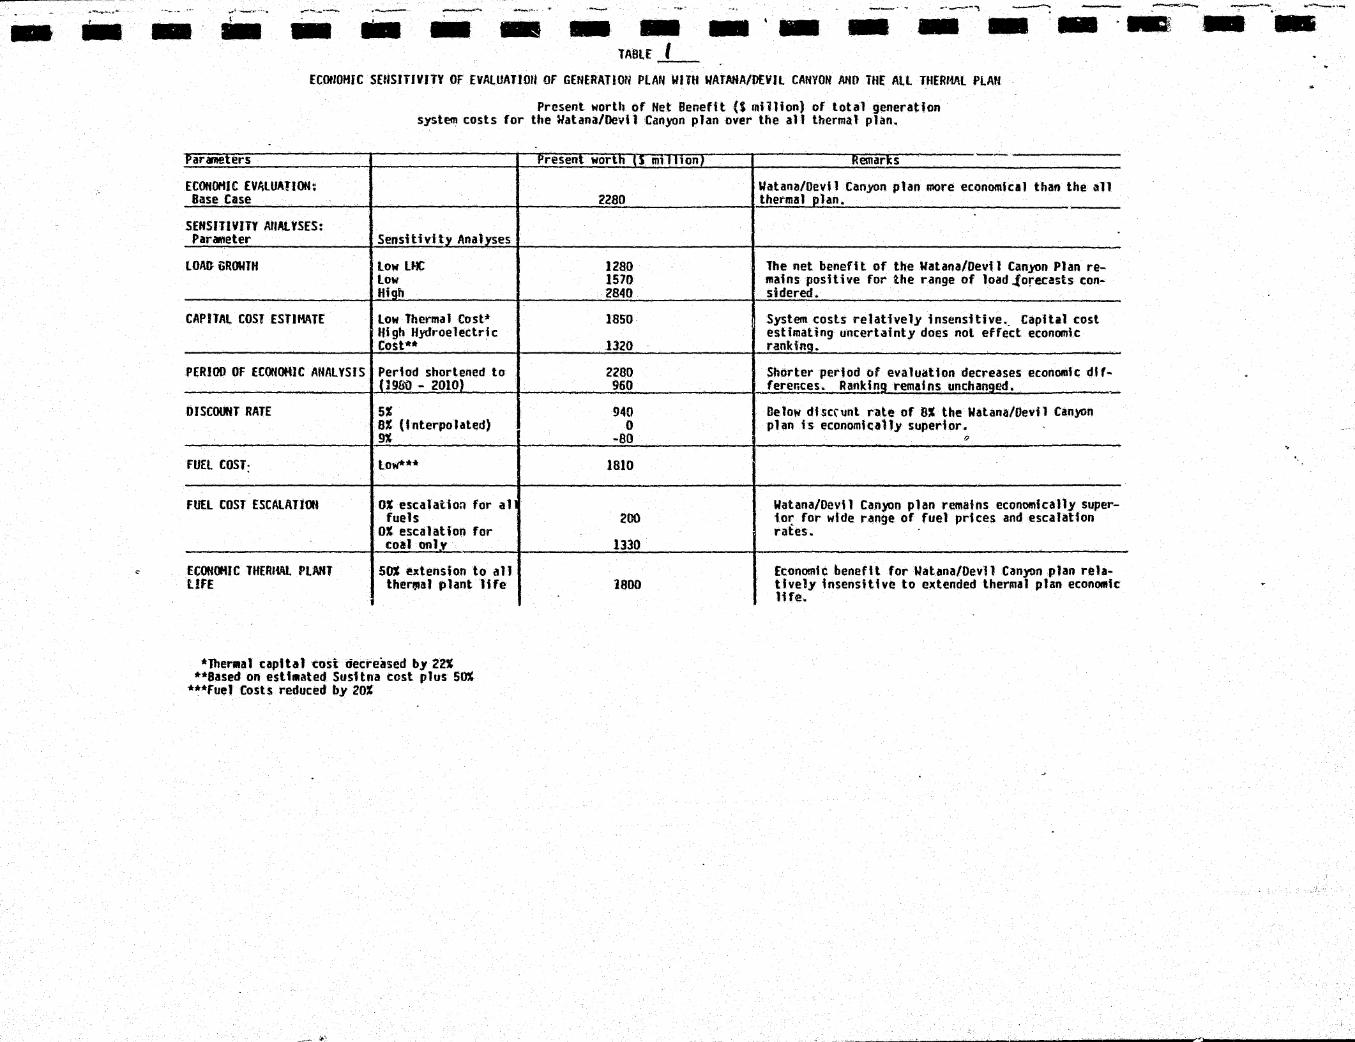
-~- - - - -ECOtiOHIC SEtiSIHVITY OF EVAlUATlOU OF GEflERATIOli PLAN WITH WATAHAIOEVJl CANYOtf Nto THE All TtiERI-iAL PlAN
Present worth Of Net Benefit (S million) of total generatfon system costs for the Uatana/Devl1 Canyon plan over the all thermal plan.
Parameters
ECONOHJC EV~LUA!ION: Base Case
SENSITIVITY AnALYSES: Parameter Sensitivity Analyses
LOA(} i;ROWTH tow LHC Low High
CAPITAL COST ESTif-tATE Low Thermal Cost* High Hydroelectric Cost**
PERIOD OF ECONOMIC ANALYSIS Period shortened to (]9&'0 - 2010)
DISCOUrtT RATE 5% Bt (Interpolated) 9l
FUEl COST: to~**
FUEL COST ESCALATlOH 0% escalatio~ for al fuels
OS escalation for coal onlv
EC:OO<JtiC lHERliAl PLANT 50% extension to all UFE ther~a1 plant life
*Thenna1 capital tost decreased by 2~ *'*Based on estfl1ated SusHna cost plus 5~
***fuel Costs reduced by 20t
Present worth U mllllon) Remarks -Watana/Oevil Canyon plan more economical than the all
2280 thermal ~lan.
1280 The net benefit of the wauna/Devil Can.)'On Plan re-1570 mains positive for the. range of load .!orecasts con-2840 sidered.
1850 System costs relatively insensitive._ Capt ta 1 cost estimating uncertainty does not effect economic
1320 ranking.
2280 Shorter period of evalu~tton decreases economic dlf-960 ferences. RankinQ remains unchanged. -940 Be low df scc-unt rate of 8% the Watana/lkvi 1 Canyon
0 plan is economically superior. -80 ()
1810
Watana/Devi 1 Ca.n)'On plan remains economically super-200 1oa:: for wide range or fuel prices and escafaUon
rates. 1330
1800 Economtc beneftt for Wat.ana/Oevll Can.)'tln plan re1a-the ly 1 nsensi the to extended ther111al plan econQntfc life.
-...._.,._ .. _ ,...-__ ......... - . ---
'·
- ' .. - - --- -- - - -·- ._-. ... . . ' --
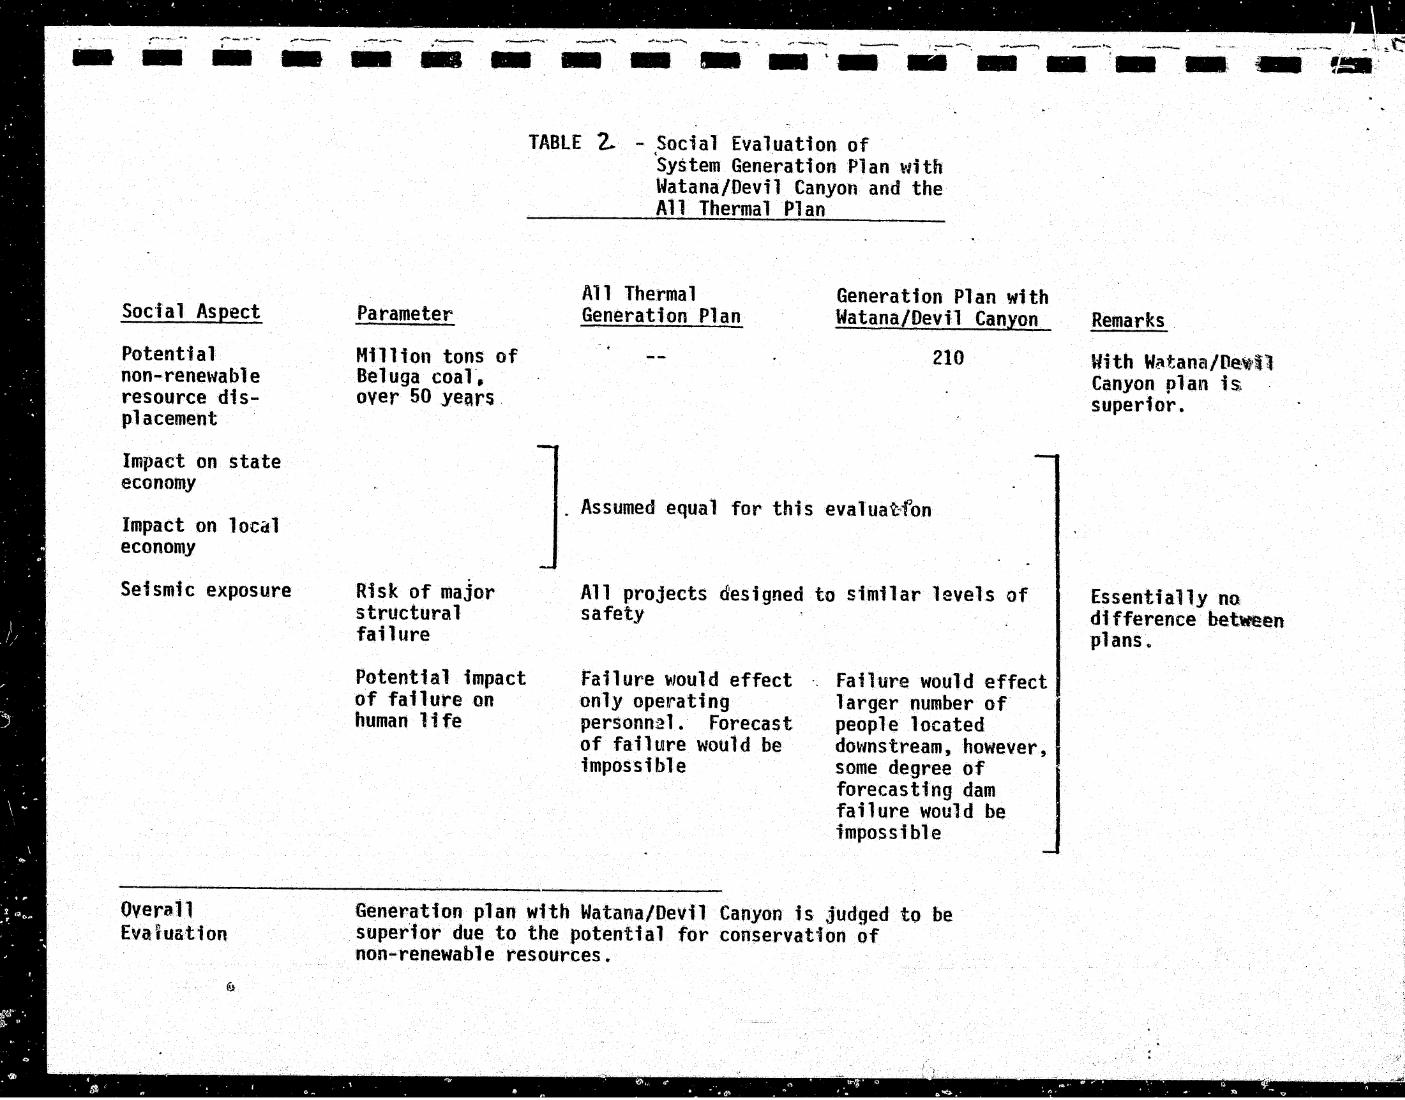
Soc ·fa 1 Aspect
Potential non-renewable resource displacement
Impact on state economy
Impact on local economy
Seismic ~xposure
Overall Evafuation
Parameter
Million tons of Bel uga coa 1·, over 50 yei\rs
Risk of major structural failure
Potential impact of failure on human life
TABLE 2. - Social Evaluation of 'system Gene-ration Plan \'lith Watana/Devil Canyon and the A 11 Thermal Plan
All Thermal Generation Plan
Generation Plan with Watana/Devil Canyon
210
. Assumed equal for this evalua~fon
All projects designed to similar levels of safety
Failure "'ould effect only opefrating personn2l. Forecast of failure would be impossible
Failure would effect larger number of ., people located . do'lmstream, however, some degree of · forecasting dam failure would be impossible
Generation plan with Watana/Devfl Canyon is judged to be super.ior due to the potential for conservation of non-renewable resources.
Remarks
With W~tana/De~ll Canyon plan is superior.
Essentially na difference between plans ..

{
~. t
\I ..
I I I .
·I -I I I I I I I
..
TABLE .3 OVERALL EVALUATION OF ALL THERMAL GENERATION PLANS
WITH THE GENERATION PLAN INCORPORAT!NG WATANA/DEVIL
CANYON DAMS
ATIRIBUTE SUPERIOR PLAN
. ECONOMIC
ENERGY CONTRIBUTION
ENVIRONMENTAL
SOCIAL
WITH WATANA/OEVIL CANYON
NO DIFFERENCE
UNABLE TO DISTINGUISH DIFFERENCE IN
THIS STUDY
NO DIFFERENCE
-----------+-----------------·" ....
OVERALL
EVALUATION
. PLAN WITH WATANA/DEVIL CANYON IS SUPERIOR
TRADEOFFS MADE: NOT FULLY EXPLORED
5 - WATANA DAM CONSTRUCTION SCHEDULE
'f'.
ll [ !I ~. {
t Jj [J (
tJ 'J.I' il' ........
l
·.ll l '.' '
'; •. '' .. '
~. '

-- -. -· , . ~- t- -~---,, ., 1
v - - -·- - - - - - ---·- __ :_ . . .
. -· -1984 1985 1386 1987 1986 1989 1990 1991 1992 1993 199m 1995
YEAR . I 2 3 4 5 6 7 8 9 1.0'1 II
M~IN J(CCE!S l P10Nf£R ROAD '
. .
CONSTRUCTION ACCESS UIIIIIIUIII-.
" . DIVERStOH TUNNElS lllllttiiiiUIIItl
DEWATER
COFF£RO.IiMS ...... . ffOUNDATION f'M:PERATION .
l,f! ~':I~s EXCAVATE ftiltiE . .i.t ....... i MAIN DAM COffEROAf.IS
filL Pl./.ICEMENT ·
- "' .. UttlfUDIIIIIIU , ........ .... . ........ . ........ Dllt- ---. . SE~VICE SP1t.LWAY . .. i
- -· .... !
INTAKE STRUCtURE . . a -· - ..
PENSTOCKS .
"l
-POWERHOUSE -- .
' . -
' TAILRACE ·--I ?
' ------- . . TURB!NE/GENERATOR I ' "l
:-
IMPOfJHOMENT j
-1'~~-·\HT 4
TEST AND "tOMMJSSON UNI1' t t'IWHE rll20NLM:.
-~ .. IOHUNE . . ....... IUUIII
~
--. .. . . .
.. ..,.. ~ -·· . . .
NOTES: lEGEND L£ARLIEST stART OF ACTIVITY . . . '
t. MAIN DAM SCHEIU.£ BASED ON FILL PlACEMENT RATES Of m'"' CRITICAL ~CTMTIES 2.5 TO 3.tl Ml.ltOH Ct."BIC YARDS PER MClfrn .· .
2. AVE lD SU( MONTH f1LL PlACEMEf« SEASO~ ASSUMED - . / EARut.sr FNSH- or ACTIVITY
. ('LATEST FINISH CF ACTrYOtY
-5- SASEO.ON ACCESS FROM OfNAU lflGHWAY .MID ASSUMES OVERt.ANn WINTER ~CESS Al\0 AIRCRAFT SUPPORT DURING 198S liiill WATANA FILL DAM PRELIMINARY CONSTRUCTION SCHEDULE .
f!GlllE .

r L_l
Ll r· . Ll -.. I
--·· •••
. . w .,, ''" ""'' •••• '· '_ ....
APPENDIX
, I

- .............. -· TABLE I SENSITIVITY ANALYStS - 1981 CAPITAL COSTS
"' -sA-:;E CA·~1::. 11 "LO'V \lfE/Y-41'\L fa...tJ~r Co~ II ALASKAN ADJUSTMENT FACTOR 1.8 ALASKAN ADJUSTMENT FACTOR 1.4
PARAMETER 1 Joa 1 .o.# THERMAL ~=sustrNA THERMAL susttRA I
lG07 lGP3 LG09 lGP5
THERMAl PlAtf~ CAPITAL COSTS ( $/kW) .
. Coal-fired Steam (250 MW) :£3064/kW1
. Natural Gas GT (75 HW) 390/kW Diesels (10 MW) 869/kW
1990-2010 THERMAL ADOS: Coal (MW) NGGT (f4W) Di ese 1 s (M'f'l}
TOTAL
RETIREMENTS (~·~~
HYDRO ADDS: MONTH/YEAR NAME MW
TOTAL FIRM* MW 2010
$ x 1o6 ~aU) 10 year 'A 20 yec.r PW
TOTAL
lONG TERM (2040) PW .
*In Peak ~1onth (December)
·goo 600
50 . 1550 MW
(734)
1895 MW
$1001.8 3991.3
$4993.1
$9666
lfirst unit transmission included $7034/kW 2First unit transmission included·$4000/kW 3fi rst unit transmission included $6260/kW 4Ftrst unit transmiss'ion included $3230/kW
$3064/kW2 390/kW 869/kW
100 600
20 720. IMW
(734)
6/93 W400 1/96 W400 1/00 DC600
2249 MW
$1001.8 3333.6
$4335.4
$7937
$2383/kW3 390/kW 869/kW
1100 525 10
!63'S" MW
{734)
1980 MW
$1001.8 3733.7
$4735.5 1
$9036
$2383/kW4 390/kW 869/kW
200 450 .. 80
730 MW
(734)
6/93 W400 l/95 W400 1/00 DC600
2259 MW
$1001.8 3325.7
$4327.5
$7879
NOTE: Sensitivity analysis performed using 0% escalation, 3% interest rate. and the medh.m load torecast.~ • l ~ I
-
~--~~-~--~-------,--~- ---.----
·~-.., - ,_;-...---~ - -· ~ __ ,..__ ' .. - .. -- - -- - -- - .Sij - - -- -·-
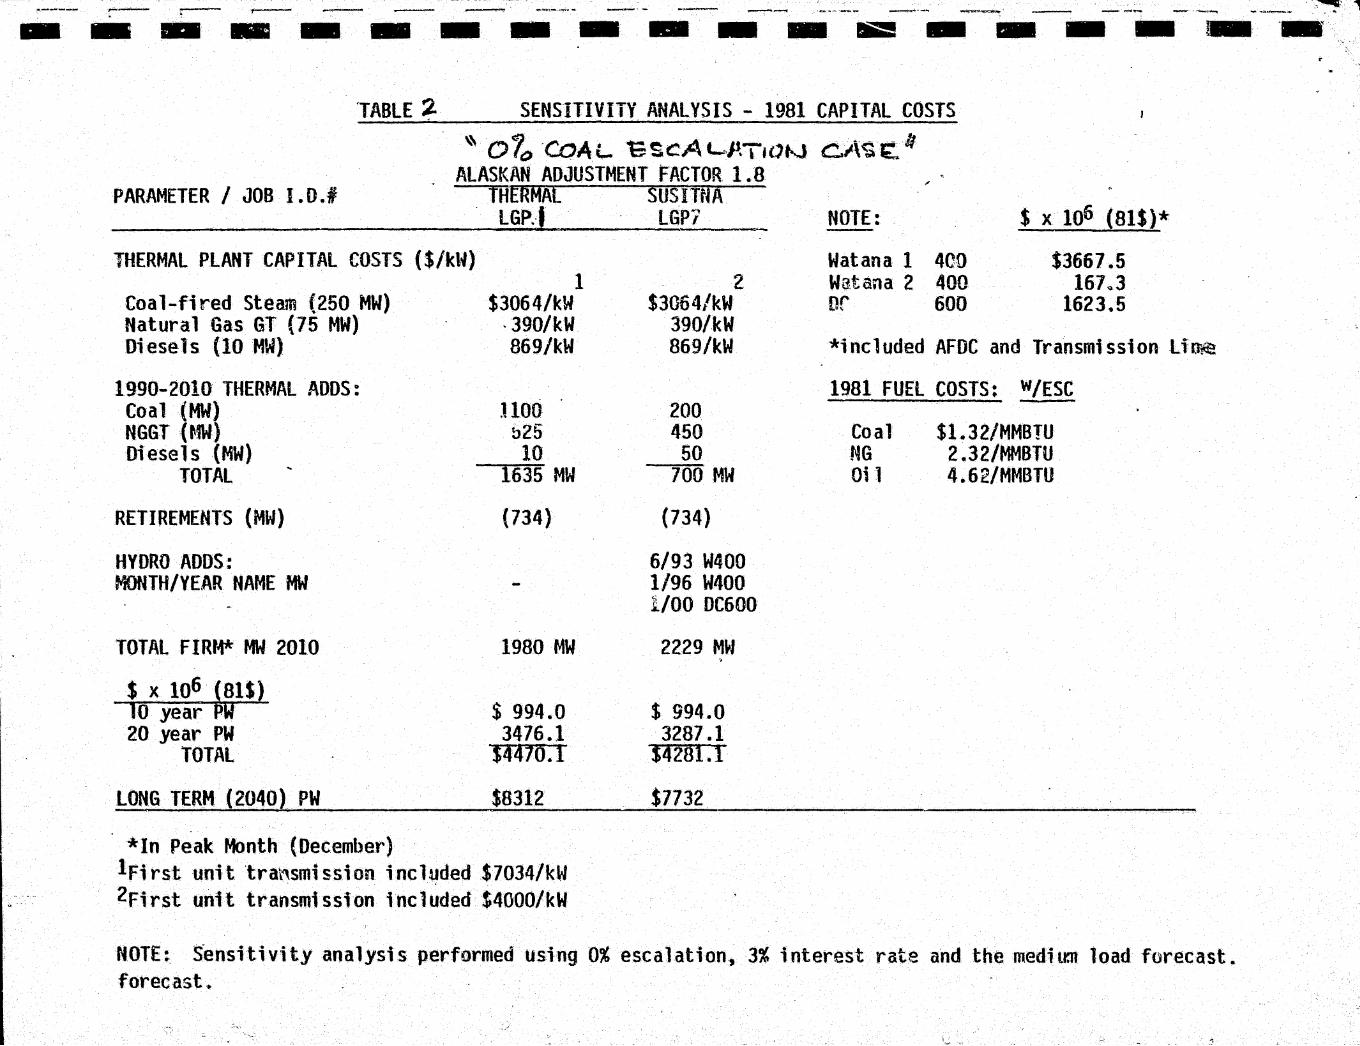
'TABLE ~
PARAMETER I JOB I.D.#
SENSITIVIiY ANALYSIS - 1981 CAPITAL COSTS
~ 01o -coAL t;ScAL.P.Ttat..J C.t\~~h ALASKAN ADJUSTMENT FACTOR 1.8
THERMAl SUSITtiA lGP .. I LGP/ NOTE:
THERMAL PlANT CAPITAl COSTS {$/k\~) Watana 1 400 Watana 2 400 Df 600
s x 106 (81$)*
$3667.5
Coal-fired Steam (250 MW) Natural Gas GT (75 MW) Diesels (10 MW)
1990-2010 THERMAl ADDS: Coal (MW) NGGT {tft4) Diesels (MW}
TOTAl
RETIREMENTS (MW)
HYDRO ADDS: MONTH/YEAR NAME MW
TOTAL FIRr~ MW 2010
$ x to6 (81$) 10 year PW 20 year PW
TOTAL
LON.G TERM ( 2040) PW
*In Peak Month (December)
1 $3064/kW
·390/kW 869/kW
1100 h25 10
l635 MW
(734)
1980 MW
$ 994.0 3476.1
$4470.1
$8312
lfirst unit tra\"\smission included $7034/kW 2first unit transmission inc1~ded $4000/kW
2 $3064/kW
390/kW 869/kW
200 450 50
700 MW
{734}
6/93 W400 1/96 W400 l/00 DC600
2229 M~l .,
$ 994.0 3287.1
$4281.1
$7732.
167 .. 3 1623.5
*included AFDC and Transmission li~
1981 FUEL COSTS: W/ESC
Coal $1.32/MMB!U NG 2.32/MMBTU Oil 4.62/MMBTU
NOTE: s·ensitivity analysis performed using 0% escalation, 3% interest rate and the medium load forecast. forecast.
![Union Calendar No. TH D CONGRESS SESSION H. R. ll · 1 day ago · [FULL COMMITTEE PRINT] Union Calendar No. ll 116TH CONGRESS 2D SESSION H. R. ll [Report No. 116–ll] Making appropriations](https://img.pdfslide.us/doc/110x75/5f2daffb04b50a00ac15fcb3/union-calendar-no-th-d-congress-session-h-r-ll-1-day-ago-full-committee-print.jpg)

![[DISCUSSION DRAFT] TH D CONGRESS SESSION H. R. ll · [Discussion Draft] [DISCUSSION DRAFT] 115TH CONGRESS 2D SESSION H. R. ll To amend title II of the Clean Air Act and title II of](https://img.pdfslide.us/doc/110x75/5c08fa9209d3f2922c8c6e52/discussion-draft-th-d-congress-session-h-r-ll-discussion-draft-discussion.jpg)

![fbi luggage-contents-science-for-vietnam 1972-jun-13 · 1972-06-13 · a .,{a i: r.36 r(iI e' )r' ? 1:.\l1, 'x rti i..i \.+r\ll\\l 'l''ronsr,it tb*: ioii.,i'ri;,.?ilr j$ti i ii li]lA](https://img.pdfslide.us/doc/110x75/5fdbfd6c647af9372938da52/fbi-luggage-contents-science-for-vietnam-1972-jun-13-1972-06-13-a-a-i-r36.jpg)


![i- ). i /’ RE(;: ()1::’,. · 2002-08-14 · L~II |ll,r t,l+lJI, llll hlll~, ill ~(I.Illi llr liv(.i -- ¯ ". ~/lllilil~ Ii illll i’lllll ii W’lllterbot tolll ,],;,%. I ’lllli](https://img.pdfslide.us/doc/110x75/5ecb9b30e6bb7e25642009bc/i-i-a-re-1a-2002-08-14-lii-llr-tllji-llll-hlll-ill-iilli.jpg)


![Union Calendar No. TH D CONGRESS SESSION H. R. ll...Union Calendar No. ll 116TH CONGRESS 2D SESSION H. R. ll [Report No. 116–ll] Making appropriations for the Department of the Interior,](https://img.pdfslide.us/doc/110x75/5ff966d501553e0e807c5400/union-calendar-no-th-d-congress-session-h-r-ll-union-calendar-no-ll-116th.jpg)