Embed Size (px)
Citation preview

29 – 30 January 2010 CESifo Conference Centre, Munich
A joint initiative of Ludwig-Maximilians University’s Center for Economic Studies and the Ifo Institute for Economic Research
The Euro and Structural Reforms
Alberto Alesina, Silvia Ardagna and Vincenzo Galasso
CESifo GmbH Phone: +49 (0) 89 9224-1410 Poschingerstr. 5 Fax: +49 (0) 89 9224-1409 81679 Munich E-mail: [email protected] Germany Web: www.cesifo.de
Ifo / CESifo & OECD Conference on Regulation:
PPoolliittiiccaall EEccoonnoommyy,, MMeeaassuurreemmeenntt aanndd EEffffeeccttss oonn PPeerrffoorrmmaannccee

The Euro and Structural Reforms∗
Alberto AlesinaHarvard University
Silvia ArdagnaHarvard University
Vincenzo GalassoIGIER, Università Bocconi
May 2008Revised: November 2008
Abstract
This paper investigates whether or not the adoption of the Euro hasfacilitated the introduction of structural reforms, defined as deregulationin the product markets and liberalization and deregulation in the labormarkets. After reviewing the theoretical arguments that may link theadoption of the Euro and structural reforms, we investigate the empiricalevidence. We find that the adoption of the Euro has been associated withan acceleration of the pace of structural reforms in the product market.The adoption of the euro does not seem to have accelerated labor marketreforms in the "primary labor market;" however, the run up to the Euroadoption seems to have been accompanied by wage moderation. We alsoinvestigate issues concerning the sequencing of goods and labor marketreforms.
Keywords: Euro, structural reforms, deregulation, European labormarkets.
1 IntroductionOne of the arguments in favor of the introduction of the common currency areain Europe was that it would have pressured member countries to improve theirmacroeconomic policy and pursue “structural reforms,” the latter being definedas labor and product markets’ liberalization and deregulation. Has it worked?Have members of the Euro area had a better policy performance after adoptingthe common currency?High inflation countries have gained a sound monetary policy with the adop-
tion of the common currency and the European Central Bank. The Euro does∗Prepared for the NBER Conference on Europe and the Euro, October 17 & 18, 2008.
We thank Olivier Blanchard, Francesco Caselli, Francesco Giavazzi, Guido Tabellini, SilvanaTenreyro and our discussant Otmar Issing for very useful comments and Carlo Prato andRoberto Robatto for excellent reserarch assistanship.
1
not have any direct implication for fiscal policy1, but its adoption was accom-panied first by the imposition of converge criteria on budget deficits and publicdebt and then by the Stability and Growth Pact (SGP), which established somerules about deficits. For some high-debt countries (e.g., Italy, Belgium, andGreece), the threat of being left out served as an incentive to initiate fiscaladjustments. However, once the Euro was introduced, the threat of exclusionvanished2, large deficits reappeared in several member countries, and the SGPwas widely violated: another chapter in this volume, by Fatas and Mihov, dis-cusses fiscal policy in the Euro area. In this chapter, we focus on structuralreforms.Why should joining the common monetary area accelerate and facilitate
structural reforms? We can think of a few sound economic arguments and somewishful thinking. On the former (and more solid) ground, more competition dueto the single market might increase the cost of regulation in the product markets.The protection of insider firms and workers would become more costly and morevisible to consumers and voters. For example, imagine a country that protects anational airline at the expense of a low-cost one that flies in the rest of the Union:the costs for the travellers and taxpayers would be large and obvious. This wouldalso weaken the insiders of the protected national airline, from union workersto pilots to managers accumulating losses at the expenses of taxpayers. Ofcourse, this argument presupposes that the Euro per se is a necessary conditionfor having a truly common market, a point which requires discussion. Second,the elimination of strategic devaluations shuts down a (possibly temporary)adjustment channel for a country losing competitiveness. In the product market,this means that firms and their organizations may demand deregulation of themarket for inputs such as non-tradable services, energy, and transportationto contain costs. Also, if real wage growth is out of line with productivity, anominal devaluation is not available any more as a solution (or a palliative). Thiscreates incentives for countries to free their labor markets from regulations thatcreate obstacles for real wage adjustments and labor mobility and flexibility. Infact, those who were skeptical about the introduction of the Euro (see Obstfeld1997, for instance) raised precisely the issue of real wage adjustment and labormarket rigidities: the elimination of those was seen as a condition difficult toimplement but necessary for the Euro to survive. It is interesting to note thatthe pre-Euro economic debate focused much more on labor market reforms andmuch less, or not at all, on product markets, while in reality, as we will seebelow, the latter markets were liberalized first.The wishful thinking part was the rhetoric often too common in Europe
according to which any step towards integration is “by definition” good andbrings about all sort of wonderful achievements for the Continent. More se-riously, many commentators viewed the adoption of the Euro as essentially apolitical move, a step towards some sort of United States of Europe. Jacques
1One possible indirect channel is through an interest rate effect caused by very large publicdebt of some (large) countries, but this effect is likely to be small.
2 See the chapter by Barry Eichengreen in this volume on the low probability of a collapseof the Euro system.
2
Delors is quoted as saying, "Obsession about budgetary constraints means thatthe people forget too often about the political objectives of the European con-stitution. The argument in favor of the single currency should be based on thedesire to live together in peace."3
When we started this research project, we were rather skeptical that wewould find any effect of the Euro on structural reforms. English-speaking coun-tries like the US, New Zealand, the UK, and Ireland had started major dereg-ulation processes way before the birth of the Euro, some Nordic countries (inand out of the Euro area) had followed more recently as a result of poor eco-nomic performance in the nineties, and some laggards like Greece, Belgium,Italy, France and Germany were struggling to keep the pace. The Euro did notseem to have much to do with this timing. Much to our surprise, the empiricalresults were different. We uncovered significant correlations between the speedof adoption of structural reforms in the goods market and the adoption of theEuro. With respect to labor markets, the picture is more nuanced and complex.We find no evidence that the adoption of the Euro has accelerated labor marketreforms in the "primary" market. This result does not imply that NO labormarket reforms have occurred in Europe, but rather means that the adoption ofthe Euro has not accelerated reforms. However, in several countries in Europe,we now have a "secondary" market of labor with temporary and much moreflexible contracts (see Bertola, 2008, for an assessment of the role of the EUROon labor market outcomes). We still do not have good data on a comparableinternational basis to examine the evolution of the markets. Indirectly, how-ever, one could look at whether nominal wages have reacted more or less to pastinflation and whether there has been wage moderation and, therefore, a smaller"second round" inflationary effect. We find that, in countries preparing to enterthe Euro during the period from 1993 to 1998, there have indeed been signs ofsubstantial wage moderation and a slowing down of the adjustment of nominalwages to past inflation. This is likely to have been part of the macroeconomicefforts to meet the criteria to enter the monetary union. After the adoption ofthe Euro, wage moderation seems to have lost some steam, perhaps as a resultof "fatigue." However, in certain countries such as Germany, wage moderationcontinued until recently. In others, like Italy and France, the evidence is mixed.We also investigated the sequencing of goods and labor market reforms.
The former have generally come sooner than the latter. This important issuehas been raised by Blanchard and Giavazzi (2003) and empirically investigatedby Fiori, Nicoletti, Scarpetta, and Schiantarelli (2007). Our results show thatderegulation of labor markets is made easier by product market deregulation.However, there are features of the labor market which seem to be a usefulprecondition for product market deregulation: namely, the reduction of firingcosts and, even more, the existence of unemployment benefits. This makessense, since deregulation of product markets implies labor reallocations acrossfirms and sectors, which require some labor market flexibility, any may lead, at
3See Eichengreen, this volume, for the original citation. See Alesina and Perotti (2004) fora criticism of EU rhetoric.
3
least in the short run, to higher unemployment.We should be clear from the start that we are considering a handful of
countries: eleven original members of the Euro area (all but Luxemburg), a fewEU but not Euro members and the remaining OECD countries. We are alsolooking at a one-shot event: the introduction of the Euro. It is possible that acertain timing of reforms across countries may lead to a spurious correlation thathappens to coincide with the adoption of the Euro.4 Or it may be possible that itis not the Euro per se but the membership in the European Union that createsincentives for product market deregulation and there are simply not enoughcountries that are members of the EU but not members of the monetary unionto identify this difference.Finally, the decision to adopt the Euro is clearly not exogenous, and we
try to address issues of endogeneity. The recent literature on currency areas(Alesina and Barro (2002), Alesina, Barro and Tenreyro (2002)) offers insightabout instruments that may have led to the decision of adoption. One should,however, be aware that various countries adopted the Euro for different reasons.In some cases, it was done mostly for anchoring purposes (e.g., in Italy), whilein other cases, the intention was to be at the core of the European integrationprocess (e.g., in France and Germany). In fact, one theme of the pre-Euro debateamongst economists was "What is the benefit for Germany?". There seemed tobe no big economic gains for this country, which seemed to provide the serviceof being an anti-inflation anchor without receiving an obvious benefit in return.However, the benefit was political. To put it differently, the decision was partlydictated by non-economic factors hard to capture with an instrument.We are not the first to investigate the relationship between the adoption of
the Euro and structural reforms. IMF (2004) suggests that belonging to theEU accelerates the reform process in the product market but has no conclusiveeffect on the labor market. Yet this paper fails to disentangle the effects of theadoption of the Euro and of the ESM. Hoj et al. (2006) provide supportingevidence to these results. They find a positive effect of the European SingleMarket (ESM) on product market reforms — particularly in the transportationand telecommunication sectors — but no impact on the labor market. However,they do not directly test for the effects of the Euro. Duval and Elmeskov (2005)instead investigate this issue using a database of OECD countries, in which theyanalyze large structural reforms in the labor and product market. Stacking to-gether these (different) reform measures, they conclude that a lack of monetaryautonomy, which is defined as belonging to the EMU or to other fixed exchangerate regimes,5 can have a negative, significant impact of the probability of un-dertaking large structural reforms, but only in large economies. In a database
4For instance some directive of the European Commission regarding some sectors decidedin the mid nineties implied actions to be taken in 1998 and 2000 for all members of theEuropean Union. This timing coincide with the adoption of the Euro. Note, however, thatthese directives do not apply only to EMU countries but to all the EU countries. Neverthelessthis timing may imply some spurious correlation.
5For instance, Austria is classified under a de facto fixed exchange regime with the DeutscheMark, even before the EMU.
4

of 178 countries on a longer, yet less recent, time span (1970-2000), Belke etal. (2005) obtain different results. They find that a higher degree of monetaryauthority independence, as measured by an index of exchange rate flexibility,has a positive impact on an overall index of reform effort, especially in the finan-cial and banking sectors. They find no robust evidence for an index of marketregulation in the sample of OECD countries.This chapter is organized as follows: In section 2, we discuss the rationale for
which the Euro might favor structural reforms. Section 3 presents our resultson product market deregulation. Section 4 discusses results on labor marketreforms, while the last section contains the conclusion.
2 Structural reforms and the Euro
2.1 Why should the Euro matter?
The adoption of the Euro and the implementation of structural reforms in thelabor and product markets seem, at first glance, to be two largely unrelatedevents. However, the Euro has always been portrayed as the final stage of aprocess of economic integration among the country members of the EuropeanUnion that involved more trade, more labor and capital mobility: in a word,fewer restrictions on the mobility of goods, services and people. To achievethis goal, the introduction of the European Single Market (the ESM) in 1992established a legal framework to increase trade and competition in the EU andallowed the European Commission to rule against state aid or against monop-olistic practices to all EU members. Thus, it seems quite plausible that theESM would have had an effect on product and labor market reform. But thesubsequent adoption of the Euro did not have direct legal effects on competitionpolicies. Did it have economic implications on it?Several commentators have discussed various reasons why the adoption of
the Euro may facilitate or, on the contrary, create obstacles to the adoption ofstructural reforms.On the pro-reform side, one may argue that entrance into the EMU acts as an
external constraint that pushes countries to reform. By relinquishing the controlof the monetary policy to an external authority (the ECB), member countriesbecome unable to use their monetary policy to accommodate negative shocks.This might have created incentives to liberalize the labor and product market inorder to rely more heavily on market-based adjustments that take place throughchanges in prices and wages (Bean, 1998 and Duval and Elmeskov, 2005).A single currency may also increase price transparency and therefore facili-
tate trade. A larger European market increases competition and makes it moredifficult for domestic monopolists to protect their rents. It is certainly true thatEurope does not have a truly common market in every sector, especially in theservice sector, where domestic protection, direct or indirect, is still widespread.Yet, the degree of competition and integration in the European product mar-ket has largely increased in the last two decades. To the extent that a larger
5
common market makes it more difficult for local monopolists to dominate localmarkets, this might have created pressures to deregulate product markets. Yet,is this the result of the Euro increasing the trading opportunities across membercountries, or is it simply the impact of the ESM? In the empirical analysis, wetry to disentangle these two effects.The question of whether a monetary union is necessary for a common market
and whether it reduces trade barriers across countries and facilitates commercein goods, services and financial assets has recently received much attention fol-lowing a provocative paper by Rose (2000). This paper found that monetaryunions have an extremely large effect on trade amongst members. Critics argued(amongst other things) that most monetary unions in Rose’s sample involvedvery small countries and that the effects would have been much smaller in theEuro area, an issue which the chapter by Frankel and Stein in this volume tack-les.6 According to their chapter, the adoption of the Euro appears to havefacilitated trade among member countries, even though the order of magnitudeof this effect is on a different scale relative to Rose (2000) and seems morerealistic. Research applied to Canada and the US showed that trade betweenCanadian provinces, even ones that were thousand of miles apart, was easierthan trade between US states and bordering Canadian provinces, suggestingthat a single currency matters for trade.7
Note that these pro-reform arguments based on the role of trade imply thatmost action should take place in the tradable sector, where competition becomesstronger, rather than in the non-tradable service sector. But firms in the trad-able sector may react to an increase in competition by translating this pressureupstream onto the intermediate goods producers — and hence only on the servicesector — and onto the labor market (see Nicoletti and Scarpetta, 2005).The economic literature also provides some arguments suggesting that the
Euro may hinder structural reforms. Saint-Paul and Bentolila (2000b) arguethat, under the EMS, the up-front cost of structural reforms may increase.Some labor market reforms may have positive long-term effects but entail anegative short-term impact in terms of higher unemployment. For this reason,several commentators have favored a two-handed approach: structural reformon the supply side, accompanied by expansionary aggregate demand policies.Under the Euro, this two-handed policy may be more difficult because aggregatedemand is more constrained at the national level and monetary policy is in thehands of the ECB. A similar argument may apply to pension reforms. Theymay provide long-term savings for the social security funds but may also implyshort-term budget deficits, which may violate the limits imposed by the Growthand Stability Pact.Obstfeld (1997), in his early and wide-ranging review of the pros and cons of
the Euro, emphasized that the Euro would eliminate a major channel of adjust-ment to macroeconomic shocks, namely a nominal devaluation of the exchange
6Alesina and Barro (2002), Alesina, Barro and Tenreyro (2002), Persson (2001), Thomand Welsh (2002), and Tenreyro (2007) address theoretically and empirically a host of issuesrelating the effect of monetary unions on trade.
7 See, for instance, McCallum (1995).
6
rate, to regain competitiveness by reducing real wages for given (rigid) nominalwages. He suggested that this might put pressure on the unions to be moreflexible about allowing adjustments to nominal and real wages and argued thatthis was a necessary condition for the Euro to survive. The pessimists arguedthat unions would not be so flexible in Europe and that, on the contrary, theywould fuel political momentum against the Euro project, leading to its collapse.Reality turned out to be more creative than economists’ predictions. There
have certainly been complaints and political rumblings against the Euro, mainlyin countries which felt they were especially in need of devaluation, as the chapterby Barry Eichengreen in this volume documents, but the Euro has not collapsedand does not seem even close to doing so. Sure enough, the political “battle”with the unions for labor market reforms in many countries is still in place, andthe next few years may be critical.Since, in many European countries, the labor unions have effectively become
unions of old workers, public employees and pensioners (in Italy, for instance,the majority of union members are retired), it should not come as a surprise thatthey tolerated or even endorsed the introduction of temporary job contracts inwhich young, entry-level workers would be hired without much or any protectionat low wages and could be fired at will by the employers. In exchange, they kept avery high degree of protection for older workers in the traditional labor markets.Spain, Italy and France are prime examples.8 In Italy, around a third of thenewly created jobs are temporary contracts, and in Spain, the percentage reaches50%. In the short run, this has worked in terms of increasing employment. In thelast ten years in Europe, about 18 million jobs have been created, just as manyas in the US. But in the medium run, lacking further reforms, this situationmay become explosive, because such a two-tier market might be unsustainable.One may argue that, as these temporary workers became a large minor-
ity of the workforce, they will put pressure on the workers in the traditionalsector to abandon some of their privileges, creating a momentum in favor ofderegulation of the entire labor market.9 However, there is another possibility.These temporary workers may demand to enter the traditional labor marketwith all its implied protection and rules against firing. If all these workers aresimply shifted into the traditionally rigid labor market of union-protected el-derly workers, Europe will move back ten years. In summary, labor marketsin several European countries are then in a precarious position: half-baked re-forms have created a two-tier labor market that is economically inefficient andpolitically unsustainable.Finally, this discussion relates to issues of sequencing of reform, i.e., is it
more politically feasible to move first with product market deregulation or labormarket deregulation? Blanchard and Giavazzi (2003) argued that Europeancountries should first deregulate the product market, claiming this would makelabor market reforms easier. The reasoning is that product market regulation
8See St-Paul (1996) (2000a) for an early discussion of reforms that avoid touching theinterests on incumbents workers and focus only on new entrants and also for a comparison ofFrench and Spanish early reform attempts
9See St-Paul (1999) for a formalization of this argument.
7
creates rents which are enjoyed both by incumbent firms and by labor unions.Unions would strenuously oppose labor market reforms that reduce their rents.Product market reforms would curtail rents, reducing the benefits for the unionsfrom the status quo in the labor market and thus reducing their opposition tolabor market reforms.The argument is compelling, and as we will see below, European countries
have indeed moved faster on product market liberalizations than on labor marketones. There is, however, one important caveat. Deregulation of product marketssometimes implies closures or reductions in size of incumbent firms in favor ofnew entrants and, more generally, reallocation of labor force from firm to firmand sector to sector. This process of “creative destruction” generates temporaryunemployment. In countries in which firing is costly, if not virtually impossible,this process is difficult. In this respect, the elimination or reduction of firingcosts is then a prerequisite for product market liberalization to work. Theelimination of firing costs requires some well-designed system of unemploymentcompensation, but not all European countries have this, a case in point beingItaly. Inefficiencies in the system of unemployment compensation give the unionsammunition to defend existing jobs and oppose restructuring. So in this respect,a labor market reform that reduces firing costs and introduces unemploymentcompensation systems seems like a prerequisite for a well-functioning productmarker deregulation. Denmark is an example of a country in which labor marketreforms have moved exactly in this direction.10
2.2 When do reforms occur?
In addition to the adoption of the Euro, other factors may create incentivesfor governments to adopt structural reforms. On the one hand, one needs totake such factors into account as controls, and they are interesting in theirown right. One commonly held view is that governments reform when theyare in a crisis and they have their backs against the wall. For the case offiscal reforms, one can easily identify a “crisis” as a runaway deficit, and infact, Alesina, Ardagna and Trebbi (2006) show evidence consistent with thishypothesis. Using a large sample of OECD and developing countries, they showthat fiscal adjustments and stabilization of inflation are more likely to occurwhen this kind of macroeconomic imbalance degenerates into a crisis of runaway(hyper) inflation or of very high budget deficits.11 The case of structural reformsis more complicated. Lack of reforms may lead to a slow decline which does notdegenerate into a sudden crisis. However, when the decline, evaluated in termsof prolonged periods of low growth, begins to become “front page news,” thenreform blockers may lose some of their political clout. Recent discussions ofrelative decline in Europe (and particularly of Italy) may be leading in that
10See for instance Alesina and Giavazzi (2006) for some discussion of the Danish case andthe applicability to other European countries.11 See Alesina and Drazen (1991) and Drazen and Grilli (1993) for models consistent with
this hypothesis and Drazen and Easterly (2001) for empirical evidence. See also Drazen (2000)for an extensive discussion of the political economy of stabilization policies.
8
direction.12 However, the recent financial crisis may have generated a politicalmovement in some countries against deregulation and in favor of a return toeasy and long-term state intervention. At the time of this writing (October2008), it is hard to predict how much the tides will move towards re-regulation.Much has also been written about the political cycle and reforms.13 Conven-
tional wisdom suggests that governments should not introduce reforms close toelections and that, in general, liberalizing and/or fiscally conservative reformslead to electoral losses. Thus, if a government has a chance of introducing re-forms, it ought to do so soon after it is appointed for two possible reasons: first,to take advantage of the honeymoon period, and second, because the short-termcosts of reforms will be gone before the next election. We examine the timingof reforms in relation to the electoral cycle, and we do find some evidence thatreforms tend to occur at the beginning of a new term. As for the likelihoodthat the reforming government will lose the next election, one has to maintain ahealthy dose of skepticism with regard to “conventional wisdom.” For instance,Alesina, Perotti and Tavares (1998) show that governments that engaged insharp fiscal adjustments have often been reappointed.
3 Product markets: the evidence
3.1 The data on regulation
We use yearly data on 21 OECD countries (Australia, Austria, Belgium, Canada,Switzerland, Germany, Denmark, Spain, Finland, France, the UK, Greece, Ire-land, Italy, Japan, the Netherlands, New Zealand, Norway, Portugal, Sweden,and the US) covering a maximum time span from 1975 to 2003. The datacome from a variety of different sources. In the next sections, we describe theregulatory, macroeconomic and political data; the Appendix includes the exactdefinition and source of each variable we use in the empirical analysis.We use time-varying measures of regulation for seven non-manufacturing
industries in 21 OECD countries for the period 1975-2003. The data have beencollected by Conway and Nicoletti (2007) from both national sources (by meansof specific surveys) and published sources and are described in detail by Nicolettiand Scarpetta (2003). The regulatory indicators measure, on a scale from 0to 6 (from least to most restrictive), restrictions on competition and privategovernance in the following industries: electricity and gas supply, road freight,air passenger transport, rail transport, post and telecommunications (fixed andmobile).The summary index of regulation includes information on entry barriers,
public ownership, the market share of the dominant player(s) (in the telephone,gas and railroad sectors), and price controls (in the road freight industry). En-try barriers cover legal limitations on the number of companies in potentially12See Alesina and Giavazzi (2006) for a recent discussion of potential European decline due
to insufficient reforms.13 See Alesina, Roubini and Cohen (1997) for work on the political business cycles and
Brender and Drazen (2005) for a political budget cycle model.
9

competitive markets and rules on vertical integration of network industries. Thebarriers to entry indicator takes a value of 0 when entry is free (i.e., a situa-tion with three or more competitors and with complete ownership separationof natural monopoly and competitive segments of the industry) and a valueof 6 when entry is severely restricted (i.e., situations with legal monopoly andfull vertical integration in network industries or restrictive licensing in otherindustries). Intermediate values represent partial liberalization of entry (e.g.,legal duopoly, mere accounting separation of natural monopoly and competitivesegments). Public ownership measures the share of equity owned by central ormunicipal governments in firms of a given sector. The two polar cases are nopublic ownership (a value of 0 for the indicator) and full public ownership (avalue of 6 for the indicator). Whenever data are available (i.e., telecoms, airtransport), intermediate values of the public ownership indicator are calculatedas an increasing function of the actual share of equity held by the governmentin the dominant firm. In some cases (e.g., the energy industries), a simpler scaleis used, pointing to full or majority control by the government (a value of 6),various degrees of mixed public/private ownership (intermediate values), andmarginal public share or full private ownership (a value of 0).The construction of the indicators by the OECD involved the following steps:
First, they separated indicators for barriers to entry, public ownership, and mar-ket share of new entrants, and price controls were created at the finest availablelevel of industry disaggregation (e.g., mobile and fixed telephony). Second, theyaggregated indicators at the industry level, taking simple averages or revenue-weighted averages (when aggregating horizontal segments of industries, such asmobile and fixed telephony). Third, they computed the index of overall regula-tion by averaging, in each of the seven industries, the indicators of barriers toentry, public ownership, market share of new entrants, and price controls.Here, we used simple averaging of the indices to reach the level of indus-
try aggregation for which macroeconomic data (value added, labor costs, andemployment) are available. More specifically, we have aggregated the regula-tion indices for the seven sectors in three broader sectors: energy (electricityand gas), communication (telecommunications and post), and transportation(airlines, road freight and railways).In our benchmark regressions, we use the regulatory indicator REG, which
includes all dimensions except public ownership. In the sensitivity analysis, wealso consider three other indicators of regulation: the overall indicator includingall the regulation dimensions; one indicator which summarizes barriers to entry(comprising legal restrictions and vertical integration); and one indicator whichincludes only public ownership information.In the augmented regressions, we introduced two additional sectors: retail
and professionals. Data on regulation in these two sectors in 21 OECD countriesare available only for two years: 1996 (for professionals) or 1998 (for retail)and 2003. These regulatory indicators range from 0 to 6 (from least to mostrestrictive). In the retail sector, they capture three components: barrier toentry, operational restrictions and price control. For the professionals, indicatorsmeasure entry regulations and conduct regulations in four sectors: accounting,
10

architect, engineer and legal services. For a detailed description, see Conwayand Nicoletti (2007).
3.2 The macroeconomic and political data
The economic data on value added, labor costs, and total employment at thecountry-sector-year level for the period 1975-2003 come from the OECD STANdatabase for Industrial Analysis, Revision 3 (ISIC Rev. 3). This databasecovers both services and manufacturing sectors for the OECD countries. Themacroeconomic data for the non-manufacturing sectors for which we have in-dices of regulation are available at the following level of industry aggregation:(i) electricity, gas and water, (ii) communications and posts, and (iii) transportand storage. From now on, we will name the sectors defined in (i), (ii), and(iii) energy, communications, and transport, respectively. We merge the datafrom STAN data set with the database containing the regulation indices. Asmentioned above, because data on value added, labor costs, and total employ-ment are not available for each single industry for which regulation indices exist,we mapped the industry-level regulatory indicators into the non-manufacturingaggregates covered by the STAN database.Macroeconomic data at the country-year level are from the OECD Economic
Outlook n. 80 database. Finally, the Database of Political Institutions (DPI) ofthe World Bank, compiled by Beck, Clarke, Groff, Keefer, and Walsh (2001) andupdated in 2004, contains all the political variables employed in the analysis.
3.3 Patterns of product market deregulation
Starting in the late seventies, OECD countries have initiated a broad-basedprocess of deregulation. They were not all starting from the same initial position,however. Generally speaking, Anglo-Saxon countries (the US in particular)were less regulated than continental European countries, and they started toderegulate early: the US and the UK in the early eighties, New Zealand in thelate seventies, Ireland in the late eighties. In the last two decades, there hasbeen convergence: the difference in the degree of regulation of product markets(at least for the sector for which we have data) is lower now than it was in theearly eighties. The laggards are catching on.In what follows, we divide the countries into three groups: 1) those that
adopted the Euro (the EMU group): these countries are Austria, Belgium,Finland, France, Germany, Ireland, Italy, the Netherlands, Portugal, and Spain;2) those which are part of the European Union but did not adopt the Euro (wecalled them the European Single Market Group or ESM): these countries areDenmark, Sweden, and the UK; and 3) those which are not in the EU andobviously do not have the Euro: these are Australia, Canada, Japan, NewZealand, Norway, Switzerland, and the US.Figure 1 shows that all sectors have deregulated, communication more than
any other and energy less than any other. Figure 2 shows that non-EU countrieshave deregulated less, but, as we said before, they were starting from a much
11
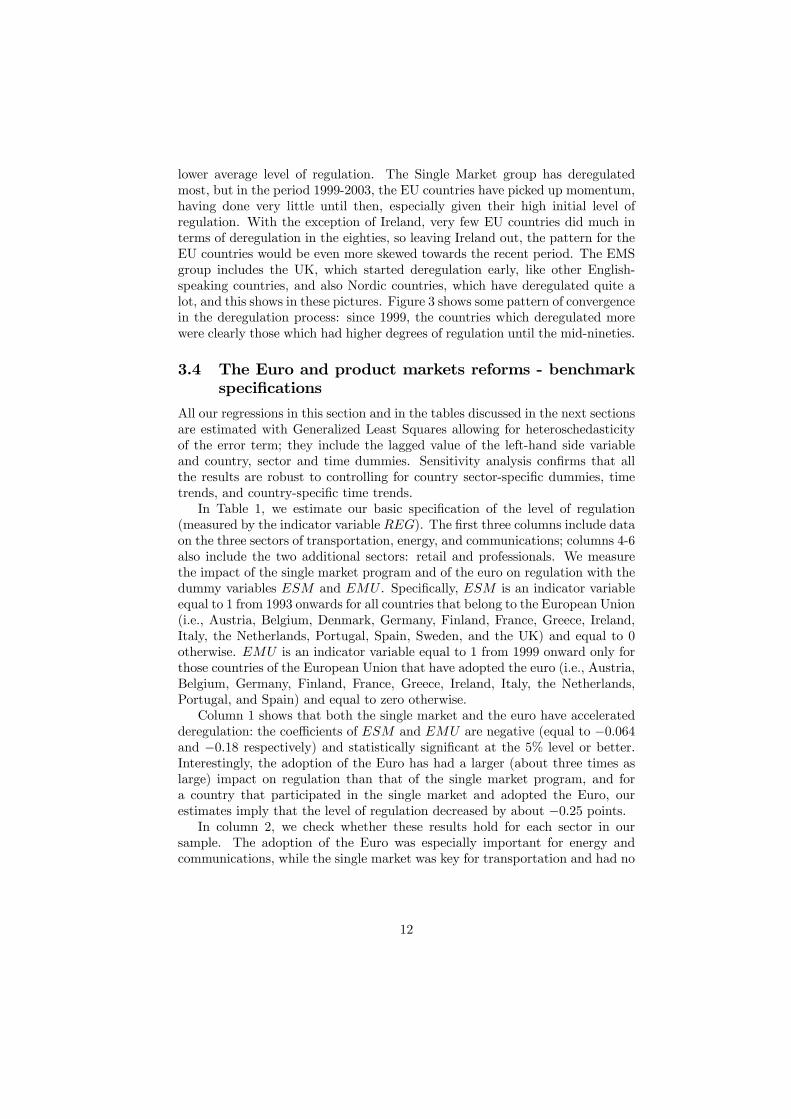
lower average level of regulation. The Single Market group has deregulatedmost, but in the period 1999-2003, the EU countries have picked up momentum,having done very little until then, especially given their high initial level ofregulation. With the exception of Ireland, very few EU countries did much interms of deregulation in the eighties, so leaving Ireland out, the pattern for theEU countries would be even more skewed towards the recent period. The EMSgroup includes the UK, which started deregulation early, like other English-speaking countries, and also Nordic countries, which have deregulated quite alot, and this shows in these pictures. Figure 3 shows some pattern of convergencein the deregulation process: since 1999, the countries which deregulated morewere clearly those which had higher degrees of regulation until the mid-nineties.
3.4 The Euro and product markets reforms - benchmarkspecifications
All our regressions in this section and in the tables discussed in the next sectionsare estimated with Generalized Least Squares allowing for heteroschedasticityof the error term; they include the lagged value of the left-hand side variableand country, sector and time dummies. Sensitivity analysis confirms that allthe results are robust to controlling for country sector-specific dummies, timetrends, and country-specific time trends.In Table 1, we estimate our basic specification of the level of regulation
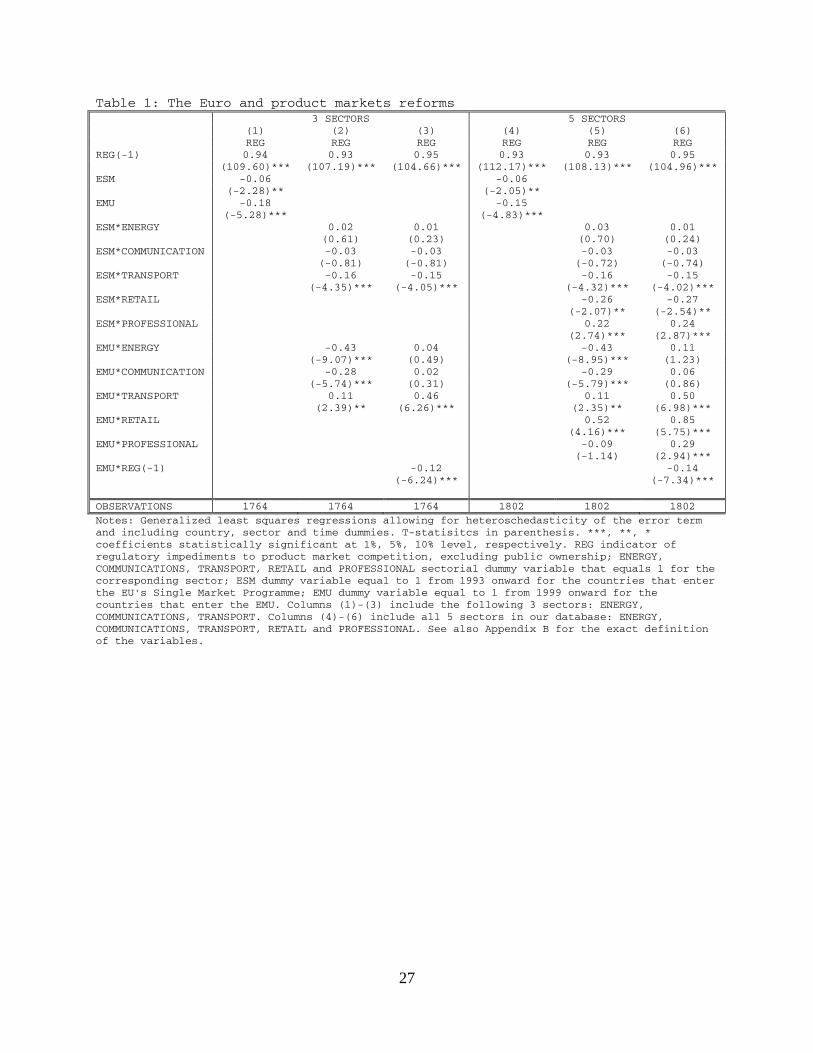
(measured by the indicator variable REG). The first three columns include dataon the three sectors of transportation, energy, and communications; columns 4-6also include the two additional sectors: retail and professionals. We measurethe impact of the single market program and of the euro on regulation with thedummy variables ESM and EMU . Specifically, ESM is an indicator variableequal to 1 from 1993 onwards for all countries that belong to the European Union(i.e., Austria, Belgium, Denmark, Germany, Finland, France, Greece, Ireland,Italy, the Netherlands, Portugal, Spain, Sweden, and the UK) and equal to 0otherwise. EMU is an indicator variable equal to 1 from 1999 onward only forthose countries of the European Union that have adopted the euro (i.e., Austria,Belgium, Germany, Finland, France, Greece, Ireland, Italy, the Netherlands,Portugal, and Spain) and equal to zero otherwise.Column 1 shows that both the single market and the euro have accelerated
deregulation: the coefficients of ESM and EMU are negative (equal to −0.064and −0.18 respectively) and statistically significant at the 5% level or better.Interestingly, the adoption of the Euro has had a larger (about three times aslarge) impact on regulation than that of the single market program, and fora country that participated in the single market and adopted the Euro, ourestimates imply that the level of regulation decreased by about −0.25 points.In column 2, we check whether these results hold for each sector in our
sample. The adoption of the Euro was especially important for energy andcommunications, while the single market was key for transportation and had no
12
statistically significant effect in the energy and communication sectors.14
Finally, we investigate whether the effect of the single market program andthe adoption of the Euro depends on the initial level of regulation by adding thevariables ESM ∗REG(−1) and EMU ∗REG(−1) to the specification of column2. The effect of the single market is independent of the level of regulation: thecoefficient of the interaction term between the single market dummy and thelevel of regulation lagged one is not statistically significant both in a specificationin which we exclude the variable EMU ∗ REG(−1) and in one in which weinclude it (results are not shown but are available upon request).On the contrary, column 3 shows that the effect of the Euro was larger
the larger the initial level of regulation, reemphasizing the process of conver-gence mentioned above. Note that, in column 3, the coefficients of the dummyvariable EMU in the energy and communication sectors become positive butinsignificant (see column 3). However, the magnitude of the coefficients ofthe variables EMU_ENERGY , and EMU_COMMUNICATIONS and ofEMU ∗ REG(−1) imply that, for each value of REG(−1) observed in the en-ergy and communications sectors, adopting the Euro is always associated withderegulation.The last three columns of Table 1 reestimate the specifications of column
1-3 in the sample in which the two additional sectors, retail and professionals,are also included. The estimates show that the single market, not the Euro, wasimportant for the retail sector and that the professional sectors has not beenderegulated at all.Finally, the regulatory variable that we are using (REG) looks at “all” as-
pects of regulation except the one of public ownership. Results hold when weuse the indicator of regulation that only measures barriers to entry and verticalintegration and the more general indicator that also looks at public ownership.Summarizing, the introduction of the Euro has contributed to structural re-
forms in the product markets. This effect is above and beyond the effect of mem-bership in the European Union from 1993 onwards. Moreover, deregulation wasstronger in EMU country-sectors with higher initial levels of regulation. Thismay give some prima-facie and indirect support to the idea that deregulationwas most needed once countries could not rely on exchange rate devaluations toboost competitiveness. In fact, the more heavily regulated (and less productiveand competitive) country-sectors may have been those suffering the most fromthe loss of competitive devaluations and, hence, the ones that were forced toliberalize the most. In the next section, we investigate this idea in more detail.
14We also checked whether the countries that deregulated after the adoption of the Euroin the years following 1999 had experienced a "delay" in deregulation because they were "toobusy" achieving the target criteria to join the monetary union. More specifically, we testedwhat happened to EU countries in the run up to the Euro during the period 1993-99. We didnot find any evidence of an effect of "postponement."
13
3.5 Why should the Euro matter? - empirical evidence
One of the reasons why a country joining the EMU may want to adopt structuralreforms is that the competitive devaluation channel is not available anymore asa tool (or a palliative) to regain competitiveness.15 In Table 2, we explore thisidea. Lacking competitiveness indicators at the country-sector-year level forthe period 1975-2003 for the energy, communications, and transport sectors, wemeasure competitiveness with variables varying only along the country-year di-mension. We use two different indicators: the growth rate of the CPI relative tocompetitors at t-1 (COMPET1(−1)) and the growth rate of the export goodsdeflators relative to competitors at t-1 (COMPET2(−1)). We include the linearand quadratic terms to capture for possible non-linearities; we add the interac-tion term of the competitiveness indicators and the EMU dummy variable toinvestigate whether the loss of exchange rate devaluation as a policy instrumentto boost competitiveness leads to structural reforms. The coefficients of thevariables COMPET1(−1) and COMPET2(−1) and their squares are not sta-tistically significant at conventional critical values, suggesting that deregulationreforms do not generally occur in countries that are loosing competitiveness.However, this is not true for countries that adopted the Euro. In fact, the inter-action terms of the competitiveness indicators and the EMU dummy variableare negative and statistically significant at the 5% level, suggesting that, forEMU countries, the higher the growth rate of CPI and export goods deflatorsrelative to competitors at t-1, the larger the decrease of the regulatory index.Finally, in columns 3 and 6, we control for the number of devaluations countriesthat adopted the Euro experienced in the period 1979-1993. Our idea is thatonly countries that de facto used the exchange rate as a tool to regain compet-itiveness should suffer from its loss and liberalize markets. The variable N. OFDEVALUATIONS FROM 1979-1993 is equal to 5 for France, 1 for Belgium, 7for Italy and 3 for Ireland. It is equal to 0 otherwise. For the EMU countries,the more devaluations a country did from 1979 to 1993, the larger the decreaseof the regulatory index (but the coefficient is statistically significant only at the10% level).Two caveats are worth mentioning. First, we are treating our competitive-
ness indicators as exogenous. While this may clearly not be the case, note that,here, we are not really interested in the effect of competitiveness on regulationbut on its differential effect among EMU and other countries. Hence, even ifthe competitiveness indicators were not exogenous, it is not clear why the biasin our estimates should differ among EMU and other countries. Second, thecoefficient of the variable EMU ∗ REG(−1) remains negative and statisticallysignificant as in Table 1, suggesting that: (i) our competitiveness indicators arenot capturing the loss of competitiveness, and hence the need of reforms, verywell when the exchange rate instrument cannot be used anymore; (ii) the Euro
15The paper by Bugamelli, Schivardi and Zizza in this volume presents some microeco-nomic evidence suggesting that sectors that have gone through deeper transformations andthat enjoyed more productivity gains are exactly those that benefited more from pre-1999devaluation.
14
is important for structural reforms in product markets for other reasons beyondthe fact that the competitive devaluation channel is not available anymore; (iii)what we are identifying as a "Euro effect" is just picking up the impact of someomitted variable; (iv) any combinations of (i), (ii), and/or (iii).
3.6 Other determinants of product market reforms
In this section, we investigate other possible determinants of product marketreforms. We also check that accounting for other critical elements that drivereforms does not alter the results we discussed so far on the effect of the Euroon deregulation of product markets.We begin by testing whether various variables that measure the macroeco-
nomic conditions of each sectors matter. Specifically, in Table 3, we includethe sectors’ value added, labor expenses and total employment at time t-1,measured as a share of country’s total value added, labor expenses, and totalemployment at time t-1. Blanchard and Giavazzi (2003) suggest that, in theshort run, product markets’ deregulation reforms generate costs both for in-cumbent firms and for their workers. Hence, incumbents tend to oppose suchreforms. When rents are lower, however, resistance to deregulation falls as theincumbents’ short-term losses can be easier outweighed by the future benefits ofderegulation. Results in Table 3 support this argument. In fact, we find that reg-ulation decreases when value added and labor costs of the sector fall, i.e., whenthe sector’s rents decrease. We also find that product markets are deregulatedin country-sectors-years with lower employment. Hence, in less labor-intensivesectors, governments can meet less resistance and can more easily implementderegulation measures. In columns 4-6, we also investigate whether there aredifferential effects between EMU and non-EMU countries relative to the effectsof value added, labor costs and employment on regulation, but on this score, wefound no differences between EMU and non-EMU countries.Second, in Table 4, we augment the specifications of Table 3 with several
macroeconomic and political controls. We investigate the "crisis" hypothesis,the role of the countries’ fiscal conditions, the timing of reforms in relation to theelectoral cycle, the interaction between reforms in the product and labor marketsand the effect of reforms occurring in trading partners’ countries. All variablesare measured at time t-1, both to allow for the fact that it may take some timeuntil governments react to macroeconomic events and to reduce the possibilityof reverse causality in our estimates. Several results are worth noting. First,the results on EMU shown thus far are robust to the inclusion of the additionalcontrol variables. Second, we find evidence that deregulation reforms occur incountry-years in which the output gap (defined as the difference of actual outputto potential) is below the 90th percentile of the output gap empirical density(equal to -3.4%). This gives some support to the crisis hypothesis, namely thatreforms are more likely to occur in bad times. Third, the higher the primarydeficit as a share of GDP, the lower the level of regulation, indicating thatreforms’ blockers may be less powerful when they feel that public finances arealso in trouble and that liberalizing the economy can help both in boosting
15

growth and maybe in reducing the likelihood of further increases in taxes orcutting in spending. Fourth, we find some evidence that product market reformshappen at the beginning of the political term (right after an election), but thisresult is not particularly robust to specification changes. Fifth, deregulation intrading partners fosters deregulation at home. This result is consistent with theevidence in Hoj et al (2006).Finally, we looked into the interaction between labor market reforms and
product market reforms. Specifically, our estimates show that an increase inunemployment benefits leads to lower regulation in product markets, while adecrease in the employment protection index is associated with less regulation ofproduct markets (but the coefficient is significant at the 10% level only in column5). Product market liberalization reforms seem easier to implement if workersreceive some kind of protection in the form of social insurance. As mentionedabove, workers of the incumbent firms are more likely to become unemployedand lose in the short run from deregulation. Hence, they can be more willing tobear the short-run costs once the generosity of unemployment benefits increasesthan otherwise. Fiori et al. (2007) find that labor market reforms do notGranger-cause product market reforms. However, their labor market indicator isthe principal component of unemployment benefits and employment protection.Results in Table 4 show that the two variables have opposite effects on regulationin product market. Hence, considering a combination of the two variables mayprevent one from detecting any effect of labor market regulation on productmarket regulation.
3.7 Endogeneity of Euro membership
The decision to join the EMS and especially to adopt the Euro is, of course, notan exogenous variable. In order to investigate this issue, we have reestimatedTable 1 using an instrumental variable procedure. First, we have estimated,with a probit model, the probability that a certain country adopts the Euro.The choice of the right-hand side variable is based upon the gravity literatureon trade and the literature on currency unions.16 The specification, described indetail in Alesina, Ardagna, Galasso (2008), is meant to capture that: i) countriesthat trade more with each other should be more likely to choose to be part ofthe same common currency area; ii) the higher the correlation of the businesscycle frequency (output and prices), the more likely it is that two countries willchoose to join the union; and iii) the higher past inflation, the more likely itis that a country will join the union. In fact, the more two countries tradewith each other, the more they benefit from a common currency. The morecorrelated are their business cycles, the lower the costs of a simple monetarypolicy. Finally a history of high inflation makes a monetary anchor especiallyeffective. We find support, with regard to EMU, for the first two effects butnot for the third17. This is not surprising, since the monetary anchor argument
16See Alesina, Barro and Tenreyro (2002) in particular.17Also Rose (2000) find a significant and negative impact of the inflation rate on the prob-
ability of joining a currency union.
16
certainly did not apply to low-inflation members, e.g., Germany and France.We then use the estimated probability of joining the union as an instrumental
variable for Table 1. The results, shown in Alesina, Ardagna, Galasso (2008),indicate that the coefficients of interests on EMU in Column 1 of Table 1 aregenerally robust to this IV procedure. We have investigated all the specificationsof Table 1 with various degrees of success. In some cases, the IV results remainsignificant, while in some cases the standard errors are too big for statisticalsignificance. As we discussed in the Introduction, we are not convinced thatthe decision to enter the Euro area or not was exogenous only (or mainly) toeconomic variables. Political consideration seemed crucial, and therefore it ishard to measure the decision of whether to join with an instrument.
4 Labor market: the evidence
4.1 The data
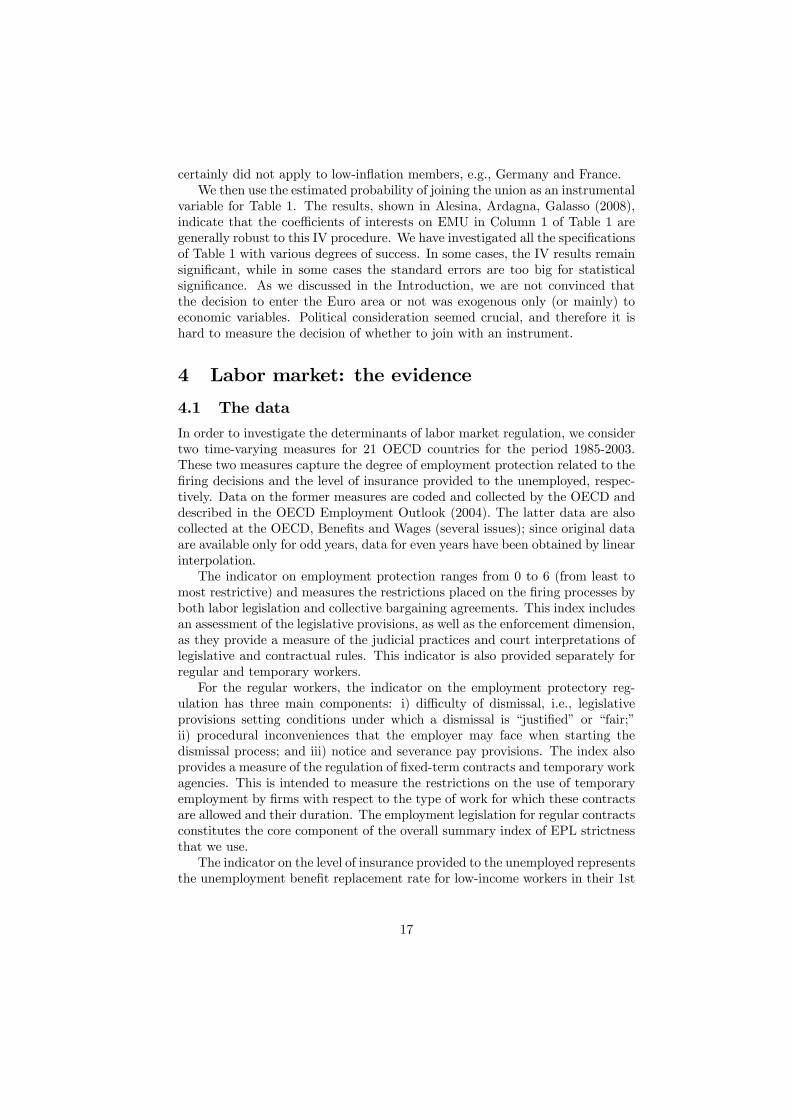
In order to investigate the determinants of labor market regulation, we considertwo time-varying measures for 21 OECD countries for the period 1985-2003.These two measures capture the degree of employment protection related to thefiring decisions and the level of insurance provided to the unemployed, respec-tively. Data on the former measures are coded and collected by the OECD anddescribed in the OECD Employment Outlook (2004). The latter data are alsocollected at the OECD, Benefits and Wages (several issues); since original dataare available only for odd years, data for even years have been obtained by linearinterpolation.The indicator on employment protection ranges from 0 to 6 (from least to
most restrictive) and measures the restrictions placed on the firing processes byboth labor legislation and collective bargaining agreements. This index includesan assessment of the legislative provisions, as well as the enforcement dimension,as they provide a measure of the judicial practices and court interpretations oflegislative and contractual rules. This indicator is also provided separately forregular and temporary workers.For the regular workers, the indicator on the employment protectory reg-
ulation has three main components: i) difficulty of dismissal, i.e., legislativeprovisions setting conditions under which a dismissal is “justified” or “fair;”ii) procedural inconveniences that the employer may face when starting thedismissal process; and iii) notice and severance pay provisions. The index alsoprovides a measure of the regulation of fixed-term contracts and temporary workagencies. This is intended to measure the restrictions on the use of temporaryemployment by firms with respect to the type of work for which these contractsare allowed and their duration. The employment legislation for regular contractsconstitutes the core component of the overall summary index of EPL strictnessthat we use.The indicator on the level of insurance provided to the unemployed represents
the unemployment benefit replacement rate for low-income workers in their 1st
17
year of unemployment. This is measured by the average replacement rate, i.e.,the ratio of the unemployment benefit to the last wage, for a worker that earns66% of average worker earnings.
4.2 The Euro and labor market reforms
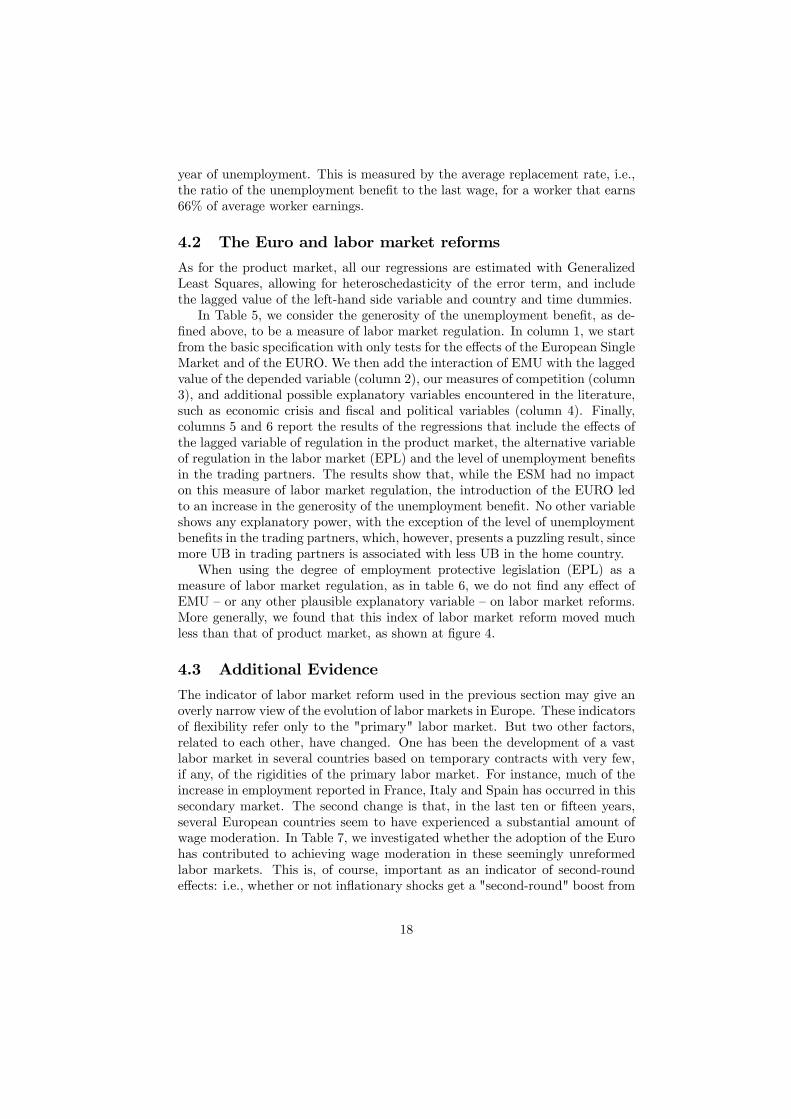
As for the product market, all our regressions are estimated with GeneralizedLeast Squares, allowing for heteroschedasticity of the error term, and includethe lagged value of the left-hand side variable and country and time dummies.In Table 5, we consider the generosity of the unemployment benefit, as de-
fined above, to be a measure of labor market regulation. In column 1, we startfrom the basic specification with only tests for the effects of the European SingleMarket and of the EURO. We then add the interaction of EMU with the laggedvalue of the depended variable (column 2), our measures of competition (column3), and additional possible explanatory variables encountered in the literature,such as economic crisis and fiscal and political variables (column 4). Finally,columns 5 and 6 report the results of the regressions that include the effects ofthe lagged variable of regulation in the product market, the alternative variableof regulation in the labor market (EPL) and the level of unemployment benefitsin the trading partners. The results show that, while the ESM had no impacton this measure of labor market regulation, the introduction of the EURO ledto an increase in the generosity of the unemployment benefit. No other variableshows any explanatory power, with the exception of the level of unemploymentbenefits in the trading partners, which, however, presents a puzzling result, sincemore UB in trading partners is associated with less UB in the home country.When using the degree of employment protective legislation (EPL) as a
measure of labor market regulation, as in table 6, we do not find any effect ofEMU — or any other plausible explanatory variable — on labor market reforms.More generally, we found that this index of labor market reform moved muchless than that of product market, as shown at figure 4.
4.3 Additional Evidence
The indicator of labor market reform used in the previous section may give anoverly narrow view of the evolution of labor markets in Europe. These indicatorsof flexibility refer only to the "primary" labor market. But two other factors,related to each other, have changed. One has been the development of a vastlabor market in several countries based on temporary contracts with very few,if any, of the rigidities of the primary labor market. For instance, much of theincrease in employment reported in France, Italy and Spain has occurred in thissecondary market. The second change is that, in the last ten or fifteen years,several European countries seem to have experienced a substantial amount ofwage moderation. In Table 7, we investigated whether the adoption of the Eurohas contributed to achieving wage moderation in these seemingly unreformedlabor markets. This is, of course, important as an indicator of second-roundeffects: i.e., whether or not inflationary shocks get a "second-round" boost from
18

wage increases. This table shows that the countries that joined the EMU in1999 have experienced a significant increase in wage moderation in the periodleading up to the common currency: i.e., between 1993 and 1999. After thisperiod, there is no evidence of an additional effect of Euro adoption on thedegree of wage moderation. These results are consistent with the fact that, inpreparation for EMU membership, many countries had to "put their houses inorder." This meant inflation reduction and fiscal rigor (in areas including publicsalaries).More specifically, in column 1 of Table 7, the dependent variable is the
growth of nominal wages. On the right-hand side, in addition to the laggeddependent variable, we have lagged inflation and our variables capturing simplemarket membership and EMU membership. The former (but not the latter)has a negative and statistically significant coefficient, indicating, at least at firstsight, an effect of simple market membership on wage moderation. However,in Column 2, we show that this result is driven by the countries’ membershipof the simple market and their preparation to join the EMU and attempts toachieve convergence criteria. In fact, we added a dummy for EMU countriesin the run up to the Euro (1993-1998) and another one after they adoptedthe single currency. As this column shows, the pre-Euro dummy variable hasa significant negative coefficient. Meanwhile, the coefficient on the post-Europeriod is insignificant. We also investigated possible differential effects betweenEMU and non-EMU countries relative to the effects of (lagged) inflation, butwe found no differences.
5 ConclusionsOur statistical analysis suggests that the adoption of the Euro has had a sig-nificant effect in promoting the adoption of product market reforms, at least insome sectors.There are three possible interpretations of the results. One is that it is simply
a coincidence: some countries decided to reform right at the end of the nineties,and this time period happened to coincide with the adoption of the Euro. Thesecond interpretation is that the Euro did indeed have an effect in promotingliberalization by eliminating the palliative of competitive devaluations. Firmsfound themselves losing competitiveness and became more vocal in demandingliberalization in sectors which were providing intermediate goods and services(including non-tradable ones) in order to keep their costs low. A third story,related to the second, is that the Euro did not matter that much economicallyper se but that it was used as a political tool by reformers to argue that countriesbelonging to the Euro area needed structural reform; in other words, the Eurowas used as a justification to promote a product market reform agenda.One should be worried about the possibility of spurious correlations because
of the relatively small number of countries involved in the tests; however, theresults do appear quite robust to a battery of econometric tests. It is hardto entirely disentangle the role of actual economic pressures introduced by the
19

Euro and the political rhetoric associated with it, but certainly the results ofour econometric exercise have moved us from our prior assumptions towardsbelieving that the Euro might indeed have had an effect in, if not promoting, atleast weakening the opposition to product market reforms. Future work shouldtake some further steps towards trying to disentangle these three alternatives.One step in this direction would be to focus on where the political and economicpressure to liberalize certain sectors came from.18
The adoption of the Euro does not seem to have had much of an effect inpromoting labor market reforms, at least in the primary labor market sector: ingeneral, labor markets have proceeded more slowly and tentatively than productmarkets. However, a secondary labor market with temporary labor contractshas grown in a few countries which did not reform the primary labor market. Inaddition, the run up Euro adoption has led to some wage moderation. This tim-ing has led us to consider the question of whether product market reform shouldindeed precede labor market liberalization. We find that regulation decreaseswhen value added and labor costs of the sector fall, i.e., when a sector’s rents de-crease, and that product markets are deregulated in country-sectors-years withlower employment. Hence, in less labor-intensive sectors, governments can meetless resistance and can more easily implement deregulation measures. How-ever, we also find that product market deregulation is easier to implement whenunemployment subsidies are more generous and more difficult when there arehigher firing costs, which interfere with market reallocations. Therefore, thetype of labor market policies more prone to facilitating product market reformsare those in which the workers are protected with unemployment subsidies butspecific jobs are not, making the (re)matching between firms and workers easier.Labor market reforms are multidimensional in nature and are often quite com-plex and difficult to capture with one macro indicator. Also, several countries inthe Euro area have two separate markets: the traditional and highly regulatedmarket and a second, much more flexible, one based on temporary contracts.Further investigation into the role of the Euro in promoting labor market reformis an excellent topic for future research.
18 Interestingly, energy, the sector that was mostly affected by the introduction of the EURO,was found by Barone and Cingano (2008) to be the service sector, whose liberalization hasthe most beneficial effects on the growth rate of the down-stream manufacturing sectors.
20
References[1] Alesina, Alberto, Silvia Ardagna and Vincenzo Galasso. (2008) "The Euro
and Structural Reforms". NBER Working Paper No. 14479
[2] Alesina, Alberto, Silvia Ardagna and Francesco Trebbi. (2006) "Who Ad-justs and When? On the Political Economy of Stabilizations." IMF StaffPapers, Mundell-Fleming Lecture, 53: 1-49.
[3] Alesina, Alberto and Robert Barro. (2002) "Currency Unions." QuarterlyJournal of Economics, 117 (May), 409-30.
[4] Alesina, Alberto, Robert Barro and Silvana Tenreyro. (2002) "OptimalCurrency Areas." NBER Macroeconomic Annual, 301-55, MIT Press, Cam-bridge, MA.
[5] Alesina, Alberto and Allan Drazen. (1991) "Why Are Stabilizations De-layed?" American Economic Review, 81 (December): 1170-1188.
[6] Alesina, Alberto and Francesco Giavazzi. (2006) The Future of Europe:Reform or Decline. MIT Press.
[7] Alesina, Alberto and Roberto Perotti. (2004) "The European Union: Apolitically incorrect view." Journal of Economic Perspectives, (Winter) 26-48.
[8] Alesina, Alberto, Roberto Perotti and José Tavares. (1998) "The PoliticalEconomy of Fiscal Adjustments." Brookings Papers on Economic Activity,(Spring) 197-266.
[9] Alesina, Alberto, Nouriel Roubini and Gerald Cohen. (1997) Political Cy-cles and the Macroeconomy. MIT Press, Cambridge, MA.
[10] Barone, G. and F. Cingano (2008) "Service Regulation and Growth: Evi-dence from OECD Countries" Bank of Italy Working Paper No. 675.
[11] Bean, C. (1998) "The Interaction of Aggregate Demand Policies and LaborMarket Reform." Swedish Economic Policy Review, Vol. 5/2.
[12] Beck, T., G. Clarke, A. Groff, P. Keefer, and P. Walsh (2001) "New Toolsand New Tests in Comparative Political Economy: The Database of Polit-ical Institutions" The World Bank Economic Review, 15; 165-176.
[13] Belke, A., B. Herz, and L. Vogel (2005) "Structural reform and the Ex-change Rate Regime: A Panel Analysis for the World versus OECD Coun-tries", Institute for the Study of Labor (IZA) Discussion Paper No. 1798.
[14] Bertola, G. (2008) "Labor Markets in EMU - What has changed and whatneeds to change" CEPR Discussion Paper 7049.
21

[15] Blanchard, Olivier and Francesco Giavazzi. (2003) "The MacroeconomicEffects of Labor and Product Market Deregulation. Quarterly Journal ofEconomics, 118-3 (August), 879-909.
[16] Brender, Adi and Allan Drazen. (2005) "Political Budget Cycles in Newand Established Democracies." Journal of Monetary Economics, 52.
[17] Bugamelli, Schivardi & Zizza (2008) "The euro and firm restructuring"Unpublished.
[18] Conway, P. and G. Nicoletti (2007), "Product market regulation in non-manufacturing sectors of OECD countries: measurement and highlights",OECD Economics Department Working Papers, 530
[19] Drazen, Allan, (2000) Political Economy in Macroeconomics, PrincetonUniversity Press
[20] Drazen, Allan and Vittorio Grilli. (1993) "The Benefits of Crises for Eco-nomic Reform." American Economic Review, 83.
[21] Drazen, Allan and William Easterly (2001). "Do Crises Induce Reforms?"Economic Policy, 3 (July).
[22] Duval, R. and J. Elmeskov. (2005) "The Effects of EMU on StructuralReforms in Labour and Product Markets." OECD Economics DepartmentWorking Papers, No. 438.
[23] Eichengreen, Barry. (2008) "The Break-up of the Euro-Area." Unpublished.
[24] Fatas, A. and I. Mihov (2008) "The Euro and the Growth and StabilityPact." Unpublished.
[25] Frankel, J. and E. Stein (2008) "The Effects of Euro on Trade" Unpub-lished.
[26] Fiori, Giuseppe, Giuseppe Nicoletti, Stefano Scarpetta and Fabio Schi-antarelli. (2007) "Employment Outcomes and the Interaction betweenProduct and Labor Market Deregulation: Are They Substitutes or Com-plements?" IZA Discussion Papers 2770, Institute for the Study of Labor,Bonn, Germany.
[27] Hoj, J., V. Galasso, G. Nicoletti and T.-T. Dang. (2006) "The PoliticalEconomy of Structural Reform: Empirical Evidence from OECD Coun-tries." OECD Economics Department Working Paper No. 501.
[28] IMF. (2004) "Fostering Structural Reforms in Industrialized Countries."World Economic Outlook, April, 24-128.
[29] McCallum, J. (1995) "National Borders Matter: Canadian-U.S. RegionalTrade Patterns. American Economic Review, June, 615-623.
22
[30] Nicoletti, Giuseppe and Stefano Scarpetta. (2003) "Regulation, Productiv-ity and Growth: OECD Evidence." Economic Policy, 36 (April).
[31] Nicoletti, G. and S. Scarpetta (2005), "Product Market Reforms and Em-ployment in the OECD Countries", OECD Economics Department Work-ing Papers No.472
[32] Obstfeld, M. (1997). "Europe’s Gamble". Brookings Papers on EconomicActivity 2.
[33] Persson, T. (2001) "Currency Union and Trade, How Large Is the Treat-ment Effect?" Economic Policy, 335-348.
[34] Rose, A. (2000) "One money, one market: the effect of common currencieson trade" Economic Policy, 9-45.
[35] Saint Paul, G. (1996), "Exploring the Political Economy of Labor MarketInstitutions", Economic Policy, 23, 265-315.
[36] Saint-Paul, G. (1999), "Assessing the Political viability of Labor MarketReform: the case of Employment Protection", CEPR Discussion Paper,No. 2136
[37] Saint-Paul, G. (2000a), The Political Economy of Labour Market Institu-tions", Oxford University Press
[38] Saint-Paul, Gilles and Samuel Bentolila. (2000b) "Will EMU Increase Eu-rosclerosis?" International Macroeconomics and Labour Economics, CEPRDiscussion Paper No. 2423, April.
[39] Tenreyro, S. (2007) "On the Trade Impact of Exchange Rate Volatility"Journal of Development Economics,82, 2, 485-508
[40] Thom, R. and B. Walsh. (2002) "The Effect of a Currency Union on Trade:Lessons from the Irish Experience." European Economic Review, June,1111-1123.
23

Appendix: Data Sources and Definitions
Our data set includes yearly data on 21 OECD countries (Australia, Austria,Belgium, Canada, Switzerland, Germany, Denmark, Spain, Finland, France,the UK, Greece, Ireland, Italy, Japan, the Netherlands, New Zealand, Norway,Portugal, Sweden, and the US) from 1975 to 2003. Here is a list of variablesused in our regressions, with their definitions and sources.REG : Aggregation of the OECD summary indicator of regulatory impedi-
ments to product market competition, excluding public ownership, in three orfive broad sectors: energy (electricity and gas), communication (telecommuni-cations and post), and transportation (airlines, road freight and railways); andretail and professionals. Data on regulation in professionals are only availablein 1996 and 2003 and for retail in 1998 and 2003. Source: Conway and Nicoletti(2007) and Nicoletti and Scarpetta (2003).ENERGY, COMMUNICATIONS, TRANSPORT, RETAIL and PROFES-
SIONAL: Sectorial dummy variable that equals 1 for the corresponding sector.European Single Market (ESM ): Dummy variable that equals 1 for the coun-
tries that enter the EU’s Single Market Programme after its implementation in1993.EMU : Dummy variable that equals 1 for the countries that enter the EMU
after its implementation in 1999.EMU"variable": Interaction between EMU and the corresponding variable.ESM"variable": Interaction between Single Market and the corresponding
variable.COMPET1 : Indicator of lack of competitiveness at the country-sector-year
level for the period 1975-2003 for the energy, communications, and transportsectors, measured as the growth rate of the CPI relative to competitors at t−1.Source: OECD Economic Outlook n. 80.COMPET2 : Indicator of lack of competitiveness at the country-sector-year
level for the period 1975-2003 for the energy, communications, and transportsectors, measured as the growth rate of the export goods deflators relative tocompetitors at t− 1. Source: OECD Economic Outlook n. 80.N. OF DEVALUTIONS FROM 1979-1993 : Number of devaluations that
a country that belonged to the European Monetary System did from 1979 to1993.VA: Value added for the three sectors: Energy (electricity, gas and water),
Communications (communications and posts), and Transport (transport andstorage). It measures the sector contribution to national GDP, calculated asthe difference between Production and Intermediate inputs. Source: OECDSTAN database for Industrial Analysis, Revision 3 (ISIC Rev. 3)LABOUR EXPENSES : Labor costs or compensation of employees in the
three sectors above. It includes wages and salaries of employees paid by pro-ducers, as well as supplements such as contributions to social security, privatepensions, health insurance, life insurance and similar schemes. Source: OECDSTAN database for Industrial Analysis, Revision 3 (ISIC Rev. 3)
24

TOTEMPLOYMENT : Total Employment in the three sectors above. Source:OECD STAN database for Industrial Analysis, Revision 3 (ISIC Rev. 3)CRISIS : Dummy variable equal to 1 when the output gap (defined as the
difference of actual output to potential) is below the 90th percentile of the outputgap empirical density (equal to −3.4%). Source: OECD Economic Outlookdatabase.PRIMARYSURPLUS/GDP : Primary deficit as a share of GDP. Source:
OECD Economic Outlook database.RIGHTGOV : Dummy variable that equals 1 if the government is led by a
Right party or coalition (Right: parties that are defined as conservative, Chris-tian democratic, or right-wing). Source: Database of Political Institutions (DPI)of the World Bank, compiled by Beck, Clarke, Groff, Keefer, and Walsh (2001)CENTERGOV : Dummy variable that equals 1 if the government is led by
a Center party or coalition (parties that are defined as centrist or when partyposition can best be described as centrist, e.g., party advocates strengtheningprivate enterprise in a social-liberal context). Source: Database of PoliticalInstitutions (DPI) of the World Bank, compiled by Beck, Clarke, Groff, Keefer,and Walsh (2001).ELECTIONYEAR: Dummy variable that equals 1 if (parliamentary or pres-
idential) elections were held during that year. Source: Database of PoliticalInstitutions (DPI) of the World Bank, compiled by Beck, Clarke, Groff, Keefer,and Walsh (2001).REG TRADING PARTNERS : Average of the value of the indicators REG
for the trading partners. Source: Conway and Nicoletti (2007) and Nicoletti andScarpetta (2003) and OECD STAN database for Industrial Analysis, Revision3 (ISIC Rev. 3).UNEMPLOYMENT BENEFIT : Unemployment benefit replacement rate for
low-income workers in their 1st year of unemployment. This is measured by theaverage replacement rate, i.e., the ratio of the unemployment benefit to the lastwage, for a worker that earns 66% of average worker earnings. Source: OECD,Benefits and Wages.EMPLOYMENT PROTECTION : OECD summary indicator of the strin-
gency for Employment Protection Legislation for all contract, defined as the av-erage of values for the Indefinite contract (regular) workers and the Fixed-termcontract (temporary) workers. Source: OECD, Employment Outlook 2004.UNEMPLOYMENT BENEFIT TRADING PARTNERS : Average of the
value of the indicator UNEMPLOYMENT BENEFIT for the trading partners.Source: OECD, Benefits and Wages and OECD STAN database for IndustrialAnalysis, Revision 3 (ISIC Rev. 3).PMKTREGULATION (−1 and −2): country average value (lagged one and
two periods) of the sectorial indicator REG.EMPLOYMENT PROTECTION TRADINGPARTNERS : Average of the
value of the indicators EMPLOYMENT PROTECTION for the trading part-ners. Source: OECD, Employment Outlook 2004 and OECD STAN databasefor Industrial Analysis, Revision 3 (ISIC Rev. 3).
25
POPULATION1SH : The share of the population of a country over the totalpopulation in the 11 EMU countries. Source: Tenreyro (2007).AREA1SH : The share of land mass of a country over the total land mass in
the 11 EMU countries. Source: Tenreyro (2007).PRMSE : The correlation shocks in prices of a country relative to the other
11 EMU countries. Source: Tenreyro (2007).YRMSE : The correlation shocks in output of a country relative to the other
11 EMU countries. Source: Tenreyro (2007).BORDER: The number of the 11 EMU countries with which a country shares
borders. Source: Tenreyro (2007).COMLANG : The number of the 11 EMU countries with which a country
shares a common language. Source: Tenreyro (2007).COLONY : The number of the 11 EMU countries with which a country was
ever in a colonial relationship. Source: Tenreyro (2007).LPASTINLFWDI1 : Lagged value of the average over a five-year period of
the inflation rate, measured using the GDP deflator, in a country. Source: WorldDevelopment Indicator Database.LAGINFLDEVEU11 : Lagged value of the difference between the inflation
rate, measured using the GDP deflator, in a country and the average inflation inthe other 11 EMU countries. Source: World Development Indicator Database.LPASTINFLDEVEU11 : Lagged value of the average over a five-year period
of the difference between the inflation rate, measured using the GDP deflator,in a country and the average inflation in the other 11 EMU countries. Source:World Development Indicator Database.LAGINFLWDI1 : Lagged value of the inflation rate, measured using the
GDP deflator, in a country. Source: World Development Indicator Database.LPASTLNTRADE : Lagged value of the average over a five-year period of
the nominal sum of import and export that a country had with the other 11EMU countries. Source: OECD Bilateral database.LAGLNRTRADE : Lagged value of the real sum of import and export that
a country had with the other 11 EMU countries. Source: OECD Bilateraldatabase.LPASTLNRTRADE : Lagged value of the average over a five-year period of
the real sum of import and export that a country had with the other 11 EMUcountries. Source: OECD Bilateral database.LAGLNTRADE : Lagged value of the nominal sum of import and export
that a country had with the other 11 EMU countries. Source: OECD Bilateraldatabase.
26
27
Table 1: The Euro and product markets reforms 3 SECTORS 5 SECTORS (1) (2) (3) (4) (5) (6) REG REG REG REG REG REG REG(-1) 0.94 0.93 0.95 0.93 0.93 0.95 (109.60)*** (107.19)*** (104.66)*** (112.17)*** (108.13)*** (104.96)*** ESM -0.06 -0.06 (-2.28)** (-2.05)** EMU -0.18 -0.15 (-5.28)*** (-4.83)*** ESM*ENERGY 0.02 0.01 0.03 0.01 (0.61) (0.23) (0.70) (0.24) ESM*COMMUNICATION -0.03 -0.03 -0.03 -0.03 (-0.81) (-0.81) (-0.72) (-0.74) ESM*TRANSPORT -0.16 -0.15 -0.16 -0.15 (-4.35)*** (-4.05)*** (-4.32)*** (-4.02)*** ESM*RETAIL -0.26 -0.27 (-2.07)** (-2.54)** ESM*PROFESSIONAL 0.22 0.24 (2.74)*** (2.87)*** EMU*ENERGY -0.43 0.04 -0.43 0.11 (-9.07)*** (0.49) (-8.95)*** (1.23) EMU*COMMUNICATION -0.28 0.02 -0.29 0.06 (-5.74)*** (0.31) (-5.79)*** (0.86) EMU*TRANSPORT 0.11 0.46 0.11 0.50 (2.39)** (6.26)*** (2.35)** (6.98)*** EMU*RETAIL 0.52 0.85 (4.16)*** (5.75)*** EMU*PROFESSIONAL -0.09 0.29 (-1.14) (2.94)*** EMU*REG(-1) -0.12 -0.14 (-6.24)*** (-7.34)***
OBSERVATIONS 1764 1764 1764 1802 1802 1802
Notes: Generalized least squares regressions allowing for heteroschedasticity of the error term and including country, sector and time dummies. T-statisitcs in parenthesis. ***, **, * coefficients statistically significant at 1%, 5%, 10% level, respectively. REG indicator of regulatory impediments to product market competition, excluding public ownership; ENERGY, COMMUNICATIONS, TRANSPORT, RETAIL and PROFESSIONAL sectorial dummy variable that equals 1 for the corresponding sector; ESM dummy variable equal to 1 from 1993 onward for the countries that enter the EU's Single Market Programme; EMU dummy variable equal to 1 from 1999 onward for the countries that enter the EMU. Columns (1)-(3) include the following 3 sectors: ENERGY, COMMUNICATIONS, TRANSPORT. Columns (4)-(6) include all 5 sectors in our database: ENERGY, COMMUNICATIONS, TRANSPORT, RETAIL and PROFESSIONAL. See also Appendix B for the exact definition of the variables.
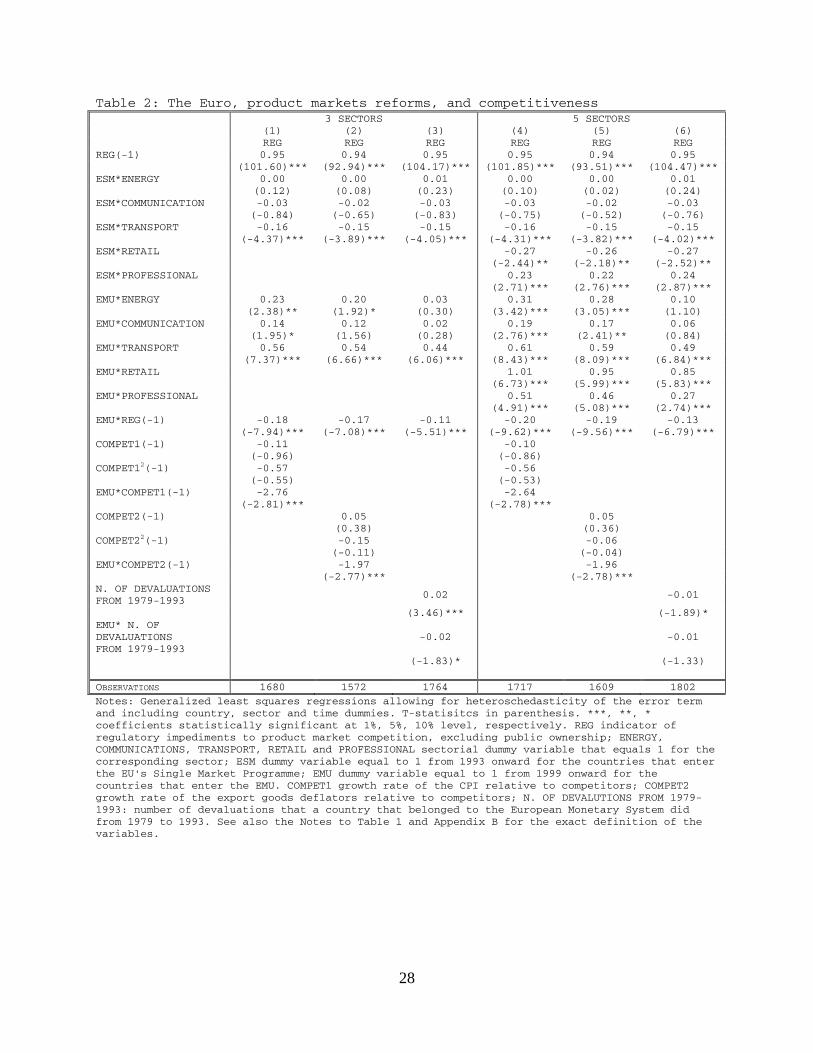
28
Table 2: The Euro, product markets reforms, and competitiveness 3 SECTORS 5 SECTORS (1) (2) (3) (4) (5) (6) REG REG REG REG REG REG REG(-1) 0.95 0.94 0.95 0.95 0.94 0.95 (101.60)*** (92.94)*** (104.17)*** (101.85)*** (93.51)*** (104.47)*** ESM*ENERGY 0.00 0.00 0.01 0.00 0.00 0.01 (0.12) (0.08) (0.23) (0.10) (0.02) (0.24) ESM*COMMUNICATION -0.03 -0.02 -0.03 -0.03 -0.02 -0.03 (-0.84) (-0.65) (-0.83) (-0.75) (-0.52) (-0.76) ESM*TRANSPORT -0.16 -0.15 -0.15 -0.16 -0.15 -0.15 (-4.37)*** (-3.89)*** (-4.05)*** (-4.31)*** (-3.82)*** (-4.02)*** ESM*RETAIL -0.27 -0.26 -0.27 (-2.44)** (-2.18)** (-2.52)** ESM*PROFESSIONAL 0.23 0.22 0.24 (2.71)*** (2.76)*** (2.87)*** EMU*ENERGY 0.23 0.20 0.03 0.31 0.28 0.10 (2.38)** (1.92)* (0.30) (3.42)*** (3.05)*** (1.10) EMU*COMMUNICATION 0.14 0.12 0.02 0.19 0.17 0.06 (1.95)* (1.56) (0.28) (2.76)*** (2.41)** (0.84) EMU*TRANSPORT 0.56 0.54 0.44 0.61 0.59 0.49 (7.37)*** (6.66)*** (6.06)*** (8.43)*** (8.09)*** (6.84)*** EMU*RETAIL 1.01 0.95 0.85 (6.73)*** (5.99)*** (5.83)*** EMU*PROFESSIONAL 0.51 0.46 0.27 (4.91)*** (5.08)*** (2.74)*** EMU*REG(-1) -0.18 -0.17 -0.11 -0.20 -0.19 -0.13 (-7.94)*** (-7.08)*** (-5.51)*** (-9.62)*** (-9.56)*** (-6.79)*** COMPET1(-1) -0.11 -0.10 (-0.96) (-0.86) COMPET12(-1) -0.57 -0.56 (-0.55) (-0.53) EMU*COMPET1(-1) -2.76 -2.64 (-2.81)*** (-2.78)*** COMPET2(-1) 0.05 0.05 (0.38) (0.36) COMPET22(-1) -0.15 -0.06 (-0.11) (-0.04) EMU*COMPET2(-1) -1.97 -1.96 (-2.77)*** (-2.78)*** N. OF DEVALUATIONS FROM 1979-1993
0.02 -0.01
(3.46)*** (-1.89)* EMU* N. OF DEVALUATIONS FROM 1979-1993
-0.02 -0.01
(-1.83)* (-1.33)
OBSERVATIONS 1680 1572 1764 1717 1609 1802
Notes: Generalized least squares regressions allowing for heteroschedasticity of the error term and including country, sector and time dummies. T-statisitcs in parenthesis. ***, **, * coefficients statistically significant at 1%, 5%, 10% level, respectively. REG indicator of regulatory impediments to product market competition, excluding public ownership; ENERGY, COMMUNICATIONS, TRANSPORT, RETAIL and PROFESSIONAL sectorial dummy variable that equals 1 for the corresponding sector; ESM dummy variable equal to 1 from 1993 onward for the countries that enter the EU's Single Market Programme; EMU dummy variable equal to 1 from 1999 onward for the countries that enter the EMU. COMPET1 growth rate of the CPI relative to competitors; COMPET2 growth rate of the export goods deflators relative to competitors; N. OF DEVALUTIONS FROM 1979-1993: number of devaluations that a country that belonged to the European Monetary System did from 1979 to 1993. See also the Notes to Table 1 and Appendix B for the exact definition of the variables.
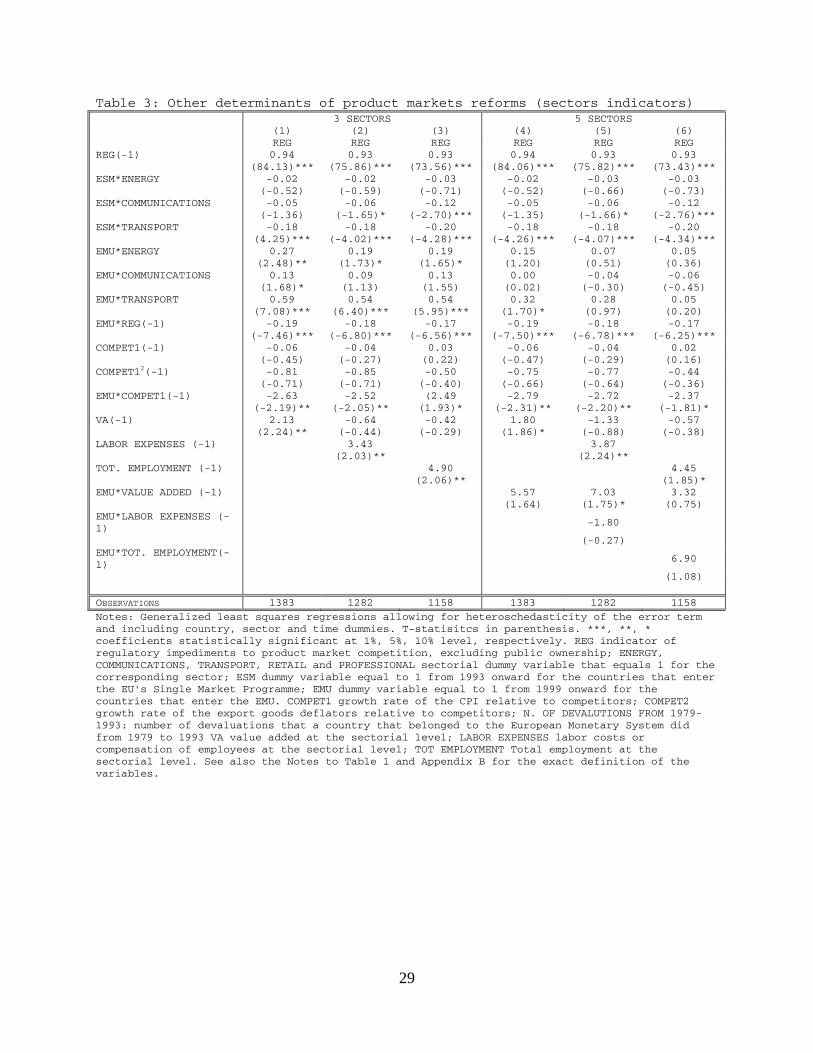
29
Table 3: Other determinants of product markets reforms (sectors indicators) 3 SECTORS 5 SECTORS (1) (2) (3) (4) (5) (6) REG REG REG REG REG REG REG(-1) 0.94 0.93 0.93 0.94 0.93 0.93 (84.13)*** (75.86)*** (73.56)*** (84.06)*** (75.82)*** (73.43)*** ESM*ENERGY -0.02 -0.02 -0.03 -0.02 -0.03 -0.03 (-0.52) (-0.59) (-0.71) (-0.52) (-0.66) (-0.73) ESM*COMMUNICATIONS -0.05 -0.06 -0.12 -0.05 -0.06 -0.12 (-1.36) (-1.65)* (-2.70)*** (-1.35) (-1.66)* (-2.76)*** ESM*TRANSPORT -0.18 -0.18 -0.20 -0.18 -0.18 -0.20 (4.25)*** (-4.02)*** (-4.28)*** (-4.26)*** (-4.07)*** (-4.34)*** EMU*ENERGY 0.27 0.19 0.19 0.15 0.07 0.05 (2.48)** (1.73)* (1.65)* (1.20) (0.51) (0.36) EMU*COMMUNICATIONS 0.13 0.09 0.13 0.00 -0.04 -0.06 (1.68)* (1.13) (1.55) (0.02) (-0.30) (-0.45) EMU*TRANSPORT 0.59 0.54 0.54 0.32 0.28 0.05 (7.08)*** (6.40)*** (5.95)*** (1.70)* (0.97) (0.20) EMU*REG(-1) -0.19 -0.18 -0.17 -0.19 -0.18 -0.17 (-7.46)*** (-6.80)*** (-6.56)*** (-7.50)*** (-6.78)*** (-6.25)*** COMPET1(-1) -0.06 -0.04 0.03 -0.06 -0.04 0.02 (-0.45) (-0.27) (0.22) (-0.47) (-0.29) (0.16) COMPET12(-1) -0.81 -0.85 -0.50 -0.75 -0.77 -0.44 (-0.71) (-0.71) (-0.40) (-0.66) (-0.64) (-0.36) EMU*COMPET1(-1) -2.63 -2.52 (2.49 -2.79 -2.72 -2.37 (-2.19)** (-2.05)** (1.93)* (-2.31)** (-2.20)** (-1.81)* VA(-1) 2.13 -0.64 -0.42 1.80 -1.33 -0.57 (2.24)** (-0.44) (-0.29) (1.86)* (-0.88) (-0.38) LABOR EXPENSES (-1) 3.43 3.87 (2.03)** (2.24)** TOT. EMPLOYMENT (-1) 4.90 4.45 (2.06)** (1.85)* EMU*VALUE ADDED (-1) 5.57 7.03 3.32 (1.64) (1.75)* (0.75) EMU*LABOR EXPENSES (-1)
-1.80
(-0.27) EMU*TOT. EMPLOYMENT(-1)
6.90
(1.08)
OBSERVATIONS 1383 1282 1158 1383 1282 1158
Notes: Generalized least squares regressions allowing for heteroschedasticity of the error term and including country, sector and time dummies. T-statisitcs in parenthesis. ***, **, * coefficients statistically significant at 1%, 5%, 10% level, respectively. REG indicator of regulatory impediments to product market competition, excluding public ownership; ENERGY, COMMUNICATIONS, TRANSPORT, RETAIL and PROFESSIONAL sectorial dummy variable that equals 1 for the corresponding sector; ESM dummy variable equal to 1 from 1993 onward for the countries that enter the EU's Single Market Programme; EMU dummy variable equal to 1 from 1999 onward for the countries that enter the EMU. COMPET1 growth rate of the CPI relative to competitors; COMPET2 growth rate of the export goods deflators relative to competitors; N. OF DEVALUTIONS FROM 1979-1993: number of devaluations that a country that belonged to the European Monetary System did from 1979 to 1993 VA value added at the sectorial level; LABOR EXPENSES labor costs or compensation of employees at the sectorial level; TOT EMPLOYMENT Total employment at the sectorial level. See also the Notes to Table 1 and Appendix B for the exact definition of the variables.
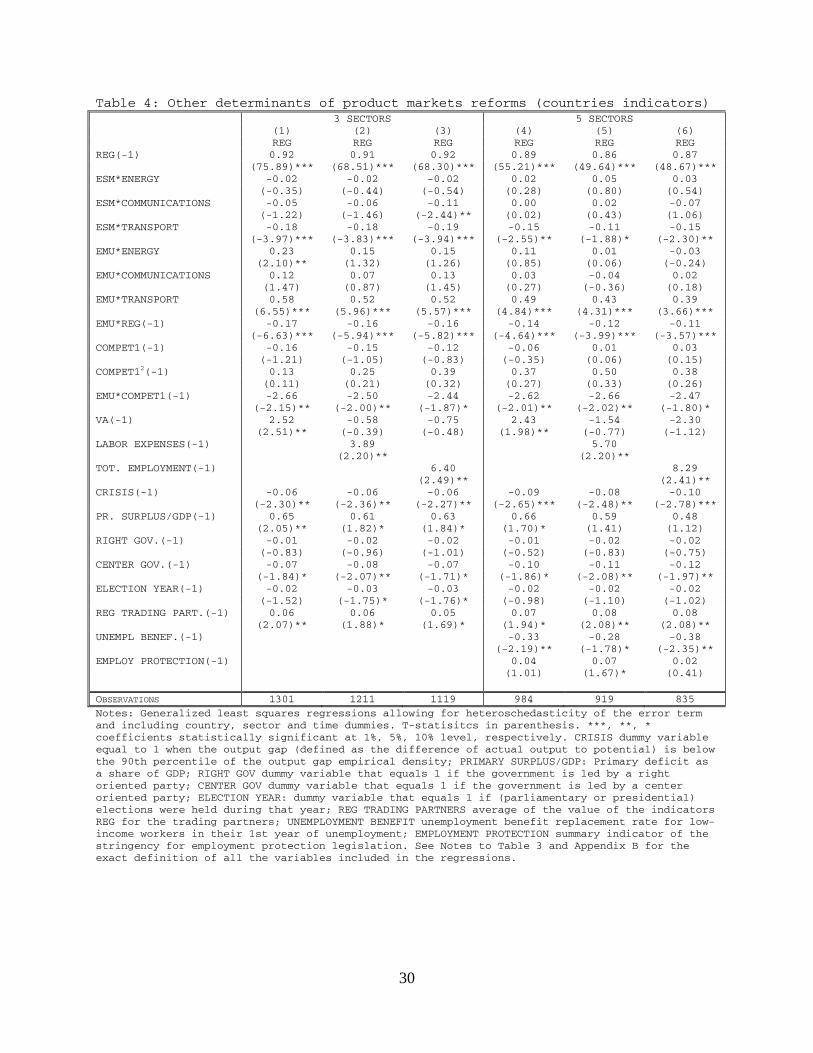
30
Table 4: Other determinants of product markets reforms (countries indicators) 3 SECTORS 5 SECTORS (1) (2) (3) (4) (5) (6) REG REG REG REG REG REG REG(-1) 0.92 0.91 0.92 0.89 0.86 0.87 (75.89)*** (68.51)*** (68.30)*** (55.21)*** (49.64)*** (48.67)*** ESM*ENERGY -0.02 -0.02 -0.02 0.02 0.05 0.03 (-0.35) (-0.44) (-0.54) (0.28) (0.80) (0.54) ESM*COMMUNICATIONS -0.05 -0.06 -0.11 0.00 0.02 -0.07 (-1.22) (-1.46) (-2.44)** (0.02) (0.43) (1.06) ESM*TRANSPORT -0.18 -0.18 -0.19 -0.15 -0.11 -0.15 (-3.97)*** (-3.83)*** (-3.94)*** (-2.55)** (-1.88)* (-2.30)** EMU*ENERGY 0.23 0.15 0.15 0.11 0.01 -0.03 (2.10)** (1.32) (1.26) (0.85) (0.06) (-0.24) EMU*COMMUNICATIONS 0.12 0.07 0.13 0.03 -0.04 0.02 (1.47) (0.87) (1.45) (0.27) (-0.36) (0.18) EMU*TRANSPORT 0.58 0.52 0.52 0.49 0.43 0.39 (6.55)*** (5.96)*** (5.57)*** (4.84)*** (4.31)*** (3.66)*** EMU*REG(-1) -0.17 -0.16 -0.16 -0.14 -0.12 -0.11 (-6.63)*** (-5.94)*** (-5.82)*** (-4.64)*** (-3.99)*** (-3.57)*** COMPET1(-1) -0.16 -0.15 -0.12 -0.06 0.01 0.03 (-1.21) (-1.05) (-0.83) (-0.35) (0.06) (0.15) COMPET12(-1) 0.13 0.25 0.39 0.37 0.50 0.38 (0.11) (0.21) (0.32) (0.27) (0.33) (0.26) EMU*COMPET1(-1) -2.66 -2.50 -2.44 -2.62 -2.66 -2.47 (-2.15)** (-2.00)** (-1.87)* (-2.01)** (-2.02)** (-1.80)* VA(-1) 2.52 -0.58 -0.75 2.43 -1.54 -2.30 (2.51)** (-0.39) (-0.48) (1.98)** (-0.77) (-1.12) LABOR EXPENSES(-1) 3.89 5.70 (2.20)** (2.20)** TOT. EMPLOYMENT(-1) 6.40 8.29 (2.49)** (2.41)** CRISIS(-1) -0.06 -0.06 -0.06 -0.09 -0.08 -0.10 (-2.30)** (-2.36)** (-2.27)** (-2.65)*** (-2.48)** (-2.78)*** PR. SURPLUS/GDP(-1) 0.65 0.61 0.63 0.66 0.59 0.48 (2.05)** (1.82)* (1.84)* (1.70)* (1.41) (1.12) RIGHT GOV.(-1) -0.01 -0.02 -0.02 -0.01 -0.02 -0.02 (-0.83) (-0.96) (-1.01) (-0.52) (-0.83) (-0.75) CENTER GOV.(-1) -0.07 -0.08 -0.07 -0.10 -0.11 -0.12 (-1.84)* (-2.07)** (-1.71)* (-1.86)* (-2.08)** (-1.97)** ELECTION YEAR(-1) -0.02 -0.03 -0.03 -0.02 -0.02 -0.02 (-1.52) (-1.75)* (-1.76)* (-0.98) (-1.10) (-1.02) REG TRADING PART.(-1) 0.06 0.06 0.05 0.07 0.08 0.08 (2.07)** (1.88)* (1.69)* (1.94)* (2.08)** (2.08)** UNEMPL BENEF.(-1) -0.33 -0.28 -0.38 (-2.19)** (-1.78)* (-2.35)** EMPLOY PROTECTION(-1) 0.04 0.07 0.02 (1.01) (1.67)* (0.41)
OBSERVATIONS 1301 1211 1119 984 919 835
Notes: Generalized least squares regressions allowing for heteroschedasticity of the error term and including country, sector and time dummies. T-statisitcs in parenthesis. ***, **, * coefficients statistically significant at 1%, 5%, 10% level, respectively. CRISIS dummy variable equal to 1 when the output gap (defined as the difference of actual output to potential) is below the 90th percentile of the output gap empirical density; PRIMARY SURPLUS/GDP: Primary deficit as a share of GDP; RIGHT GOV dummy variable that equals 1 if the government is led by a right oriented party; CENTER GOV dummy variable that equals 1 if the government is led by a center oriented party; ELECTION YEAR: dummy variable that equals 1 if (parliamentary or presidential) elections were held during that year; REG TRADING PARTNERS average of the value of the indicators REG for the trading partners; UNEMPLOYMENT BENEFIT unemployment benefit replacement rate for low-income workers in their 1st year of unemployment; EMPLOYMENT PROTECTION summary indicator of the stringency for employment protection legislation. See Notes to Table 3 and Appendix B for the exact definition of all the variables included in the regressions.

31
Table 5: The Euro and unemployment benefits (1) (2) (3) (4) (5) (6) UNEMPLOYMENT
BENEFIT UNEMPLOYMENT
BENEFIT UNEMPLOYMENT
BENEFIT UNEMPLOYMENT
BENEFIT UNEMPLOYMENT
BENEFIT UNEMPLOYMENT
BENEFIT UNEMPL BENEF (-1)
0.93 0.93 0.94 0.93 0.93 0.93
(38.57)*** (38.58)*** (38.49)*** (36.90)*** (36.02)*** (35.80)*** ESM 0.00 0.00 -0.01 0.00 0.00 0.00 (1.43) (1.42) (-1.44) (0.77) (0.62) (0.78) EMU 0.01 0.01 0.01 0.01 0.01 0.01 (2.03)** (1.35) (1.62) (2.00)** (2.35)** (2.29)** EMU*UNEMPL BENEF(-1)
-0.01
(-0.45) COMPET(-1) -0.01 (-0.63) COMPET12(-1) -0.04 (-0.26) EMU*COMPET1(-1)
-0.11
(-1.27) CRISIS(-1) 0.00 0.00 0.00 (0.23) (0.23) (0.34) PR.SURPLUS/GDP(-1)
0.04 0.03 0.03
(1.18) (0.76) (0.76) RIGHT GOV(-1) 0.00 0.00 0.00 (0.12) (0.48) (0.32) CENT. GOV(-1) -0.01 -0.01 -0.01 (-0.99) (-0.91) (-1.11) ELECT. YR(-1) 0.00 0.00 0.00 (0.16) (0.05) (0.15) EMPLOYMENT PROTECT.(-1)
0.00 0.00
(0.46) (0.52) UNEMPLOYMENT BENEFIT TRADING PARTNERS(-1)
-0.10 -0.10
(-2.29)** (-2.39)** PMKT REGULAT(-1)
0.00 0.00
(1.38) (0.45) PMKT REGULAT(-2)
0.01
(1.59)
OBSERVATIONS 378 378 360 366 362 362
Notes: Generalized least squares regressions allowing for heteroschedasticity of the error term and including country, sector and time dummies. T-statisitcs in parenthesis. ***, **, * coefficients statistically significant at 1%, 5%, 10% level, respectively. UNEMPLOYMENT BENEFIT TRADING PARTNERS average of the value of the indicator UNEMPLOYMENT BENEFIT for the trading partners; PMKT REGULAT country average value of the sectorial indicator REG. See Notes to Tables 3 and 4 and Appendix B for the exact definition of all the variables included in the regressions.
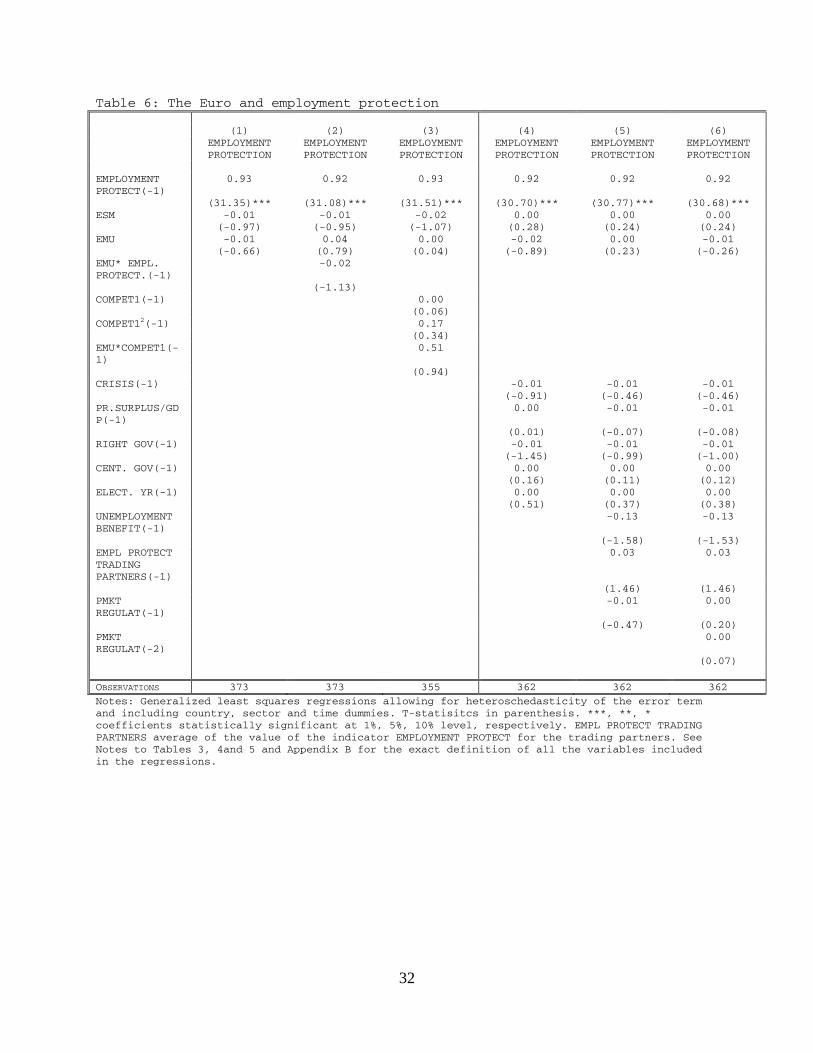
32
Table 6: The Euro and employment protection (1) (2) (3) (4) (5) (6) EMPLOYMENT
PROTECTION EMPLOYMENT PROTECTION
EMPLOYMENT PROTECTION
EMPLOYMENT PROTECTION
EMPLOYMENT PROTECTION
EMPLOYMENT PROTECTION
EMPLOYMENT PROTECT(-1)
0.93 0.92 0.93 0.92 0.92 0.92
(31.35)*** (31.08)*** (31.51)*** (30.70)*** (30.77)*** (30.68)*** ESM -0.01 -0.01 -0.02 0.00 0.00 0.00 (-0.97) (-0.95) (-1.07) (0.28) (0.24) (0.24) EMU -0.01 0.04 0.00 -0.02 0.00 -0.01 (-0.66) (0.79) (0.04) (-0.89) (0.23) (-0.26) EMU* EMPL. PROTECT.(-1)
-0.02
(-1.13) COMPET1(-1) 0.00 (0.06) COMPET12(-1) 0.17 (0.34) EMU*COMPET1(-1)
0.51
(0.94) CRISIS(-1) -0.01 -0.01 -0.01 (-0.91) (-0.46) (-0.46) PR.SURPLUS/GDP(-1)
0.00 -0.01 -0.01
(0.01) (-0.07) (-0.08) RIGHT GOV(-1) -0.01 -0.01 -0.01 (-1.45) (-0.99) (-1.00) CENT. GOV(-1) 0.00 0.00 0.00 (0.16) (0.11) (0.12) ELECT. YR(-1) 0.00 0.00 0.00 (0.51) (0.37) (0.38) UNEMPLOYMENT BENEFIT(-1)
-0.13 -0.13
(-1.58) (-1.53) EMPL PROTECT TRADING PARTNERS(-1)
0.03 0.03
(1.46) (1.46) PMKT REGULAT(-1)
-0.01 0.00
(-0.47) (0.20) PMKT REGULAT(-2)
0.00
(0.07)
OBSERVATIONS 373 373 355 362 362 362
Notes: Generalized least squares regressions allowing for heteroschedasticity of the error term and including country, sector and time dummies. T-statisitcs in parenthesis. ***, **, * coefficients statistically significant at 1%, 5%, 10% level, respectively. EMPL PROTECT TRADING PARTNERS average of the value of the indicator EMPLOYMENT PROTECT for the trading partners. See Notes to Tables 3, 4and 5 and Appendix B for the exact definition of all the variables included in the regressions.
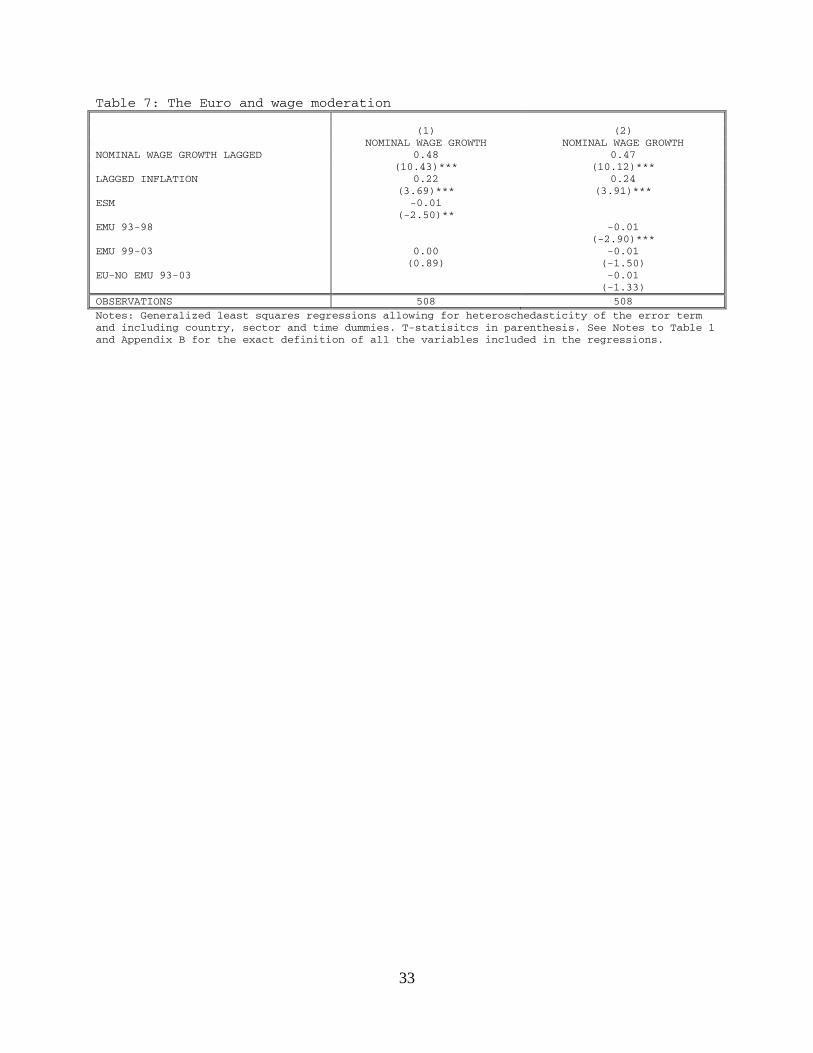
33
Table 7: The Euro and wage moderation (1) (2) NOMINAL WAGE GROWTH NOMINAL WAGE GROWTH NOMINAL WAGE GROWTH LAGGED 0.48 0.47 (10.43)*** (10.12)*** LAGGED INFLATION 0.22 0.24 (3.69)*** (3.91)*** ESM -0.01 (-2.50)** EMU 93-98 -0.01 (-2.90)*** EMU 99-03 0.00 -0.01 (0.89) (-1.50) EU-NO EMU 93-03 -0.01 (-1.33)
OBSERVATIONS 508 508
Notes: Generalized least squares regressions allowing for heteroschedasticity of the error term and including country, sector and time dummies. T-statisitcs in parenthesis. See Notes to Table 1 and Appendix B for the exact definition of all the variables included in the regressions.
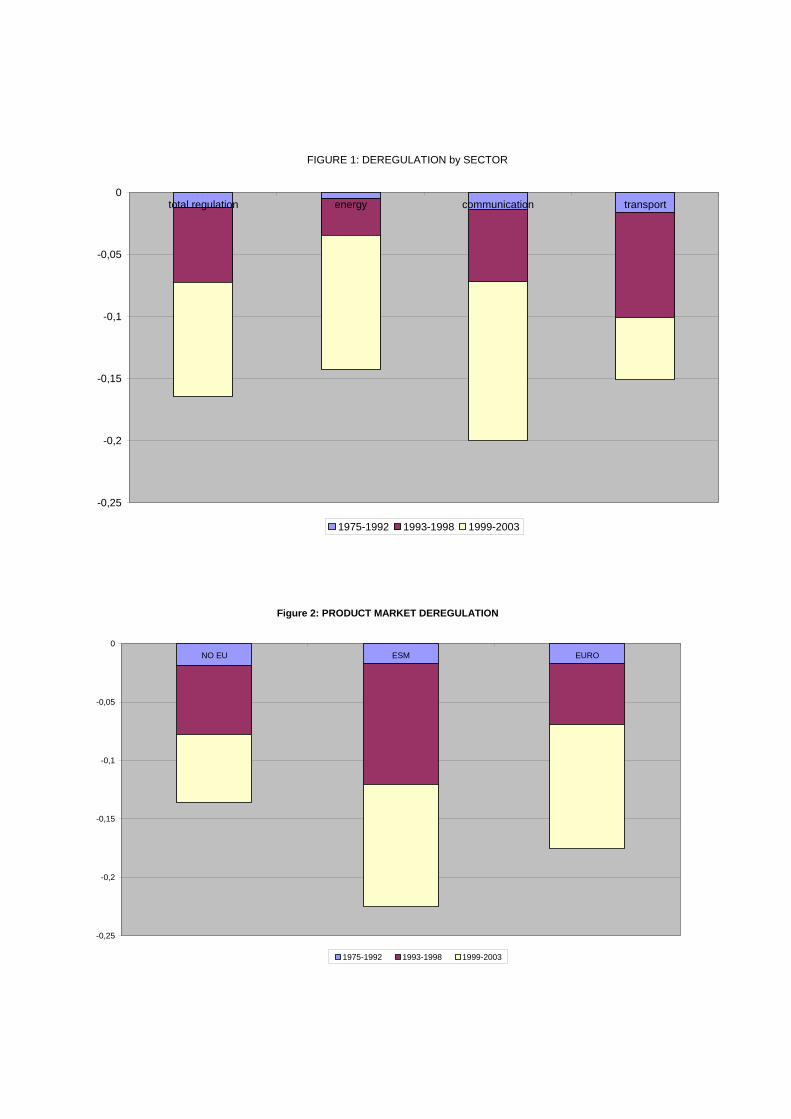
FIGURE 1: DEREGULATION by SECTOR
-0,25
-0,2
-0,15
-0,1
-0,05
0total regulation energy communication transport
1975-1992 1993-1998 1999-2003
Figure 2: PRODUCT MARKET DEREGULATION
-0,25
-0,2
-0,15
-0,1
-0,05
0NO EU ESM EURO
1975-1992 1993-1998 1999-2003
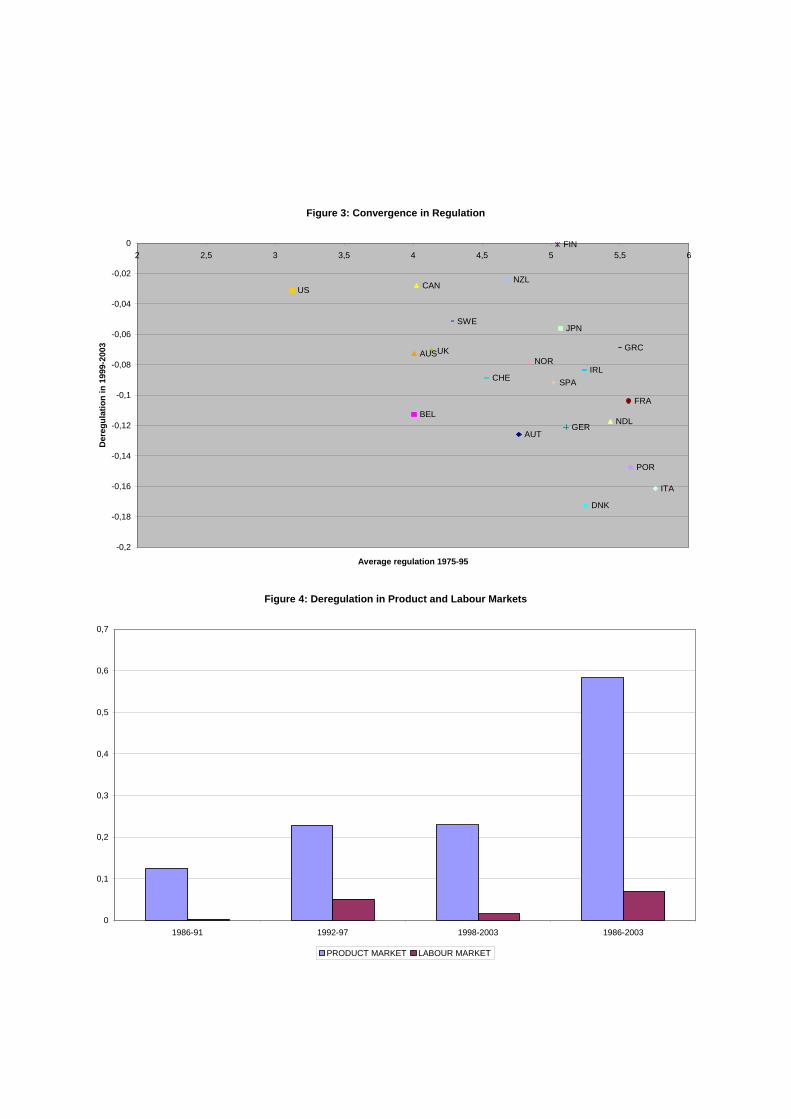
Figure 3: Convergence in Regulation
AUT
BEL
CAN
DNK
FIN
FRA
GER
GRC
IRL
ITA
JPN
NDL
NZL
NOR
POR
SPA
SWE
CHE
UK
US
AUS
-0,2
-0,18
-0,16
-0,14
-0,12
-0,1
-0,08
-0,06
-0,04
-0,02
02 2,5 3 3,5 4 4,5 5 5,5 6
Average regulation 1975-95
Der
egul
atio
n in
199
9-20
03
Figure 4: Deregulation in Product and Labour Markets
0
0,1
0,2
0,3
0,4
0,5
0,6
0,7
1986-91 1992-97 1998-2003 1986-2003
PRODUCT MARKET LABOUR MARKET