Embed Size (px)
Citation preview
DI
SC
US
SI
ON
P
AP
ER
S
ER
IE
S
Forschungsinstitut zur Zukunft der ArbeitInstitute for the Study of Labor
E-Lections:Voting Behavior and the Internet
IZA DP No. 6545
May 2012
Oliver FalckRobert GoldStephan Heblich
E-Lections:
Voting Behavior and the Internet
Oliver Falck University of Munich, Ifo Institute
and CESifo
Robert Gold Max Planck Institute of Economics
Stephan Heblich
University of Stirling, SERC and IZA
Discussion Paper No. 6545 May 2012
IZA
P.O. Box 7240 53072 Bonn
Germany
Phone: +49-228-3894-0 Fax: +49-228-3894-180
E-mail: [email protected]
Any opinions expressed here are those of the author(s) and not those of IZA. Research published in this series may include views on policy, but the institute itself takes no institutional policy positions. The Institute for the Study of Labor (IZA) in Bonn is a local and virtual international research center and a place of communication between science, politics and business. IZA is an independent nonprofit organization supported by Deutsche Post Foundation. The center is associated with the University of Bonn and offers a stimulating research environment through its international network, workshops and conferences, data service, project support, research visits and doctoral program. IZA engages in (i) original and internationally competitive research in all fields of labor economics, (ii) development of policy concepts, and (iii) dissemination of research results and concepts to the interested public. IZA Discussion Papers often represent preliminary work and are circulated to encourage discussion. Citation of such a paper should account for its provisional character. A revised version may be available directly from the author.
IZA Discussion Paper No. 6545 May 2012
ABSTRACT
E-Lections: Voting Behavior and the Internet*
This paper analyses the effect of information disseminated by the Internet on voting behavior. We address endogeneity in Internet availability by exploiting regional and technological peculiarities of the preexisting voice telephony network that hinder the roll-out of fixed-line broadband infrastructure for high-speed Internet. We find small negative effects of Internet availability on voter turnout, and no evidence that the Internet systematically benefits single parties. Robustness tests including placebo estimations from the pre-Internet era confirm our results. We relate differences in the Internet effect between national and local elections to a crowding out of national but not local newspapers. JEL Classification: D72, C50, L86 Keywords: elections, political economy, instrumental variables, mass media, internet Corresponding author: Stephan Heblich University of Stirling Division of Economics Stirling, FK9 4LA United Kingdom E-mail: [email protected]
* We thank Sascha Becker, Nina Czernich, Rob Fairlie, Ronny Freier, Bob Hart, Tarjei Havnes, Jed Kolko, Fabian Waldinger, Ludger Woessmann and seminar participants at the University of Munich (LMU), University of Jena, University of Stirling, and the Christmas meeting 2011 of the German Speaking Economists abroad for insightful comments and suggestions. We further thank Deutsche Telekom AG for providing data on the voice telephony network and IVW for providing data on newspaper circulation.
3
1. Introduction
A growing body of literature analyses the political economy of mass media. This literature
shows that the emergence of newspapers, the radio, and television facilitated the distribution
of information among larger and larger shares of the population. At the same time, selection
and filtering during the editorial process of media production may affect the formation of
voters’ opinions and change the way people vote. It appears that more information comes at
the cost of a potential media-induced bias because scale economies in the provision of
information imply a concentration of media outlets. Specifically, biases may arise from media
actively supporting a certain political ideology (cf. DellaVigna and Kaplan 2007; Durante and
Knight, 2011) or the media might concentrate on political issues of general interest and crowd
out local topics since the media serve increasingly integrated markets (Snyder and Strömberg,
2010; Gentzkow, 2006).
The emergence of the Internet as the new mass medium of the 21st century now changes the
market of mass media substantially. Information can be distributed at high speed, low cost,
and broad scope and as a result, there is egalitarian access to the production and the
consumption of news (cf. Prat and Strömberg, 2011). The unanswered question is whether the
possibility to avoid editorial filtering does indeed influence voting behavior. We might expect
a more differentiated supply of information but we also see the editorial offices of existing
media outlets setting up webpages that distribute news in real time at an even larger scale.
Moreover, Internet access per se does not guarantee more information because the possibility
to self-select information bears the risk of an ideological polarization or even a decrease in
information if voters prefer entertainment over information. Unfortunately, little is yet known
about the role of the Internet with the result that “some of the allegedly greater democracy in
cyberspace is based more on hope and hype than on careful research” (Putnam, 2000, p.173).
This paper analyzes the effect of the new mass medium Internet on voting behavior. We
combine rich data on local elections, state elections, and national elections in Germany at
different points in time with unique telecommunication data that document the availability of
broadband Internet access across roughly 12.000 German municipalities. Broadband Internet
provides access rates of at least 384 Kbit/s. At lower access rates, the information function of
the Internet is severely limited thus not constituting a relevant alternative to traditional mass
media. The structure of our data allows us to compare voting behavior before the Internet era
4
prior to the year 2000 to voting behavior after the Internet era began in the year 2004.1 Based
on this data, we analyze two potential effects of the Internet on voting behavior: (i) the effect
of the Internet on voter turnout; (ii) the relative importance of the Internet for single parties,
that is, established parties and small parties at the left and right fringes. In both cases, the
effect of the Internet on voting behavior is not entirely clear a priori and the identification of a
causal relation is additionally complicated by endogeneity concerns. Rolling out the
infrastructure for high-speed Internet is quite costly what makes it efficient to exploit scale
economies in densely populated areas. Accordingly, the mere correlation between Internet
availability and voting behavior might just as well reflect selective migration to agglomerated
areas. If, for instance, people in urban areas were more (less) interested in politics or political
participation, OLS estimates would be upward (downward) biased. We resolve this
endogeneity problem by exploiting exogenous variations in who has access to the Internet.2
The identification strategy builds on the incidence that the first generation of DSL broadband
technology in Germany was entirely built on the preexisting voice telephony network which
did not fully support DSL technology.3 We derive three plausibly exogenous sets of
instruments from predetermined characteristics of the preexisting voice telephony network
that affect the supply of fixed-line broadband Internet. The first is that the traditional public
switched telephone network is based on copper wires. These wires were rolled out long before
the Internet era with the goal to provide universal voice telephone service to all German
households. For our purpose, the relevant part of the telephone network is the copper wires
that connect households to a main distribution frame (MDF). As the exact distance did not
affect the quality of voice telephone services, the layout of this last connection part was
mostly determined by the availability of buildings to host the central office with the operators
manually switching telephone calls. In contrast to telephone services, the capacity of the DSL
technology does depend on the length of the copper wire between the household and the
MDF. When surpassing a technologically determined threshold of 4.2 kilometers (2.61 miles),
DSL technology is no longer feasible and parts of the copper wire need to be bypassed with
fiber wire. This involves costly earthworks as wires are rolled out subsurface in Germany. As
1Broadband Internet infrastructure was initially rolled out in Germany between the years 2000 and 2004. Consequently, we discard this “rollout period” from our analysis. 2 This strategy is similar to other identification strategies that exploit exogenous variation in technological possibilities to determine the effects of comparable media on voting behavior and political participation. For instance, Strömberg (2004a) uses geological features that affect the quality of radio reception as instruments for the share of households with a radio and Olken (2009) exploits topographical differences that affect signal strength to identify the effect of exposure to television. 3Digital subscriber line (DSL) is the dominant Internet technology in Germany. DSL includes all technologies that employ the copper wires of a local telephone network to transmit data.
5
a result, the probability of a municipality having access to broadband Internet decreases above
this threshold. We exploit this kink at the threshold to determine a technical explanation for a
systematically lower availability of DSL in municipalities surpassing the threshold.
A second distance related instrument exploits “wrongly” connected municipalities as source
of exogenous variation in the availability of DSL. About 6% of the municipalities in Germany
were connected to an MDF at a distance larger than 4.2 kilometers despite the existence of a
closer MDF at a distance below the threshold. The choice of “wrong” MDFs relates to the
geographic layout of telephone access areas. Organizational considerations led the state-
owned monopolistic operator of the telephone network (Deutsche Bundespost) to connect
municipalities only to the one MDF within their telephone access area even though there was
a closer MDF in adjacent telephone access areas. This procedure reflects that distance did not
affect the quality of telephone services. Now that distance does play a role for the Internet
transmission quality, it is often cheaper for the telecommunication carrier to connect a
municipality to the closer MDF than replace the copper wire to the “wrong” MDF that
actually serves the municipality. This leaves us with a technical explanation why some of the
municipalities above the threshold are more likely to have DSL access.
Beyond these distance-related instruments, a third instrument exploits the variation from a
technological mistake affecting the provision of broadband Internet till today. After the
German reunification in 1990, there was a lack of telephone access lines in many parts of East
Germany.4 The new infrastructure that closed this gap was built on the basis of a special type
of fiber wires instead of copper wires. This new OPAL technology was expected to dominate
the ICT future as it was suitable for voice-telephony services, ISDN services, and a limited
amount of data transmission. However, the ongoing request for higher bandwidths soon
overextended the OPAL capacities and instead DSL became the leading access technology for
broadband Internet in Germany. This development was the misfortune of roughly 11% of the
East German households because the fiber wires were not compatible with the copper cable
based DSL technology. Large investments were necessary to reverse this mistake and as a
result, many of these areas cannot access DSL until today. This provides an additional source
of exogenous variation in DSL availability that is not based on geographical distance.
All sources of technical variation turn out to be highly relevant in our instrumental variable
estimations and they show the expected signs. The results of the second stage voting behavior
estimations suggest that an increase in DSL availability from 0 to 100 percent decreases voter
4 Just before reunification, only about 10 percent of the East German households had telephone access.
6
turnout by 1.9 to 2.5 percentage points. Given an average turnout of 64.4 percent, this
translates into a reduction of 3.0 to 3.9 percent. Our findings further suggest that single parties
cannot systematically benefit from the Internet as platform to increase their publicity.
However, in some specifications, we do find a marginally significant but sizable effect on the
vote share for extremist right wing parties suggesting that an increase in DSL availability
from 0 to 100 percent reduces their vote share by 0.4 percentage points. Given their average
vote share of 2.2 percent, this is, after all, a 20 percent lower vote share.
The magnitude of the Internet effect on voter turnout is comparable to the effect of the
introduction of TV on voter turnout in the US reported in Gentzkow (2006). He estimates that
the introduction of television in the 1940s and 1950s reduced voter turnout in congressional
races by 2 percent. While the negative effect of TV on voter turnout is particularly
pronounced in local elections our estimations suggest that the Internet effect on voter turnout
is driven by non-local elections. We can further show that those municipalities that comply
with our instruments experience a significantly stronger decrease in the circulation of national
daily newspapers than in the circulation of local daily newspapers. This crowding out of
national newspapers reflects the increasing popularity of online newspapers like the most
popular German news portal spiegel-online. Online news portals provide constantly updated
information on a wide range of political topics. On the downside, this information becomes
increasingly superficial because the common practice to report what happens before the eyes
leaves no time to collect background information. The decrease in in-depth coverage and
information on broader issues is in line with the observed decrease in voter turnout in state-
and national elections. At the same time, local newspapers faced less competition at the
beginning of the Internet era because of their limit range and local focus. As a result, the
Internet crowds out less local information and we find no indication of voter turnout in local
elections being affected by broadband Internet access.
Robustness tests confirm the validity of our results. First, we consider the existence of time-
persistent effects which explain systematic differences between municipalities with high DSL
availability and municipalities with low DSL availability that are not related to the
introduction of DSL. To test for this competing explanation, we exploit the time dimension of
our data and shift the window of our analyses to elections before the emergence of broadband
Internet, i.e. before 2000. In line with our arguments, we do not find any indication of
differing voting behaviors between complier municipalities and control municipalities. In a
second robustness check, we consider an alternative explanation for the observed effect of the
Internet on voter turnout. Imagine that the Internet improved the economic conditions of
7
municipalities with high DSL availability systematically. If better economic conditions which
translate into higher wages and employment reduced voter turnout (Charles and Stephens Jr.,
2011) this would provide an alternative explanation for the observed differences in voter
turnout. To test this competing explanation, we perform comparable instrumental variable
regressions with a municipality’s unemployment rate as outcome variable. We find no
significant effect of DSL availability on the unemployment rate suggesting that we indeed
identify an information crowding-out effect of the Internet on voter turnout.
The remainder of the paper is organized as follows. Section 2 reviews the existing literature
on the political economy of mass media and discusses the expected effect of the Internet on
voting behavior. Section 3 introduces the data and shows the association between Internet
availability and voting behavior in a multivariate framework. Section 4 advances our
empirical strategy to a causal analysis and introduces our instrumental variable strategy. We
present our baseline results and contest them with placebo regressions from the pre-
broadband-Internet era. We also explore the heterogeneity of the Internet effect on voting
behavior. Section 5 sheds light on the mechanisms behind the Internet effect on voting
behavior. Precisely, we explore whether the Internet crowds out daily newspapers and the
effect of the Internet on local unemployment. Section 6 concludes.
2. The Political Economy of Mass Media
Media are the main source of information for voters about government policies and
ideological positions of parties and politicians. Theoretical models that formally express this
relationship suggest that more information is generally good for voters because it helps them
monitor politicians more efficiently (cf. Besley and Prat, 2006; Strömberg, 2004b). This
simple insight is reflected in freedom of information legislations that guarantee access to
government information. However, the quality of information provided by the media may
vary across political issues and across regions thus giving rise to different kinds of media bias.
One obvious bias would arise from a situation where the broad range of mass media was
strategically employed to manipulate the public opinion (cf. McMillan and Zoido, 2004). We
usually observe this in rather totalitarian regimes. However, even in the absence of strategic
manipulation, media can still exert a tendentious influence on the public opinion as they might
strengthen voters’ predispositions by pervasive selection and filtering (cf. Prat and Strömberg,
2011). The intense Media coverage of an issue can make people believe that this issue is
important (agenda setting); people may evaluate politicians’ decisions based on the issues
8
covered in the media (priming); and the way an issue is characterized in news reports can
have an influence on how it is understood by audiences (framing).
These different sources of biases seem especially feasible in the context of traditional mass
media like newspapers, the radio or TV where editorial boards determine which topics are
covered. For instance, DellaVigna and Kaplan (2007) analyze the impact of the introduction
of Fox News in the United States on voting behavior between 1996 and 2000 and find that the
entry of Fox News had a significant effect on the Presidential elections in 2000 with the
Republican vote share increasing by 0.4 to 0.7 percentage points. Similarly, Enikolopov,
Petrova, and Zhuravskaya (2011) analyze the expansion of the first private Russian TV
channel (NTV) which supported the opposition in the 1999 parliamentary elections in Russia.
Their estimations suggest that the presence of the independent TV channel decreased the
aggregate vote for the government party by 2.5 percentage points while the combined vote for
major opposition parties increased by 2.1 percentage points. Moreover, Prat and Strömberg
(2006) analyze the introduction of a new commercial TV channel in Sweden as additional
source of political information. Using survey data from the same respondents in two
consecutive general elections before and after the entry of the commercial channel in 1990,
they find significant effects on voters’ political knowledge and voter turnout.
For the case of information provided by newspapers, Snyder and Strömberg (2010) find that a
poor fit between newspaper markets and political districts reduces press coverage
significantly. Increasing the congruence of newspaper markets and political districts from 0 to
1 is associated with 170 more articles written about the district’s congressman. The authors
then employ this variation in press coverage to infer on voter information and its effect on
politicians’ actions and policies. They find that voters living in areas with less coverage of
their U.S. House representative are less likely to recall their representative’s name and they
are less able to describe and rate her. This lack of information (and accountability) leads to
significantly lower amounts of federal funds flowing into less congruent districts.5 Newspaper
coverage does also influence voting behavior. Gentzkow et al. (2011) analyze the effect of
increased newspaper coverage in a panel of all U.S. newspapers published in English
language that existed between 1869 and 2004. They estimate that one extra newspaper is
associated with a 0.3 percent increase in voter turnout. These effects appear to be stronger in
the period before 1929, i.e. before the rise of radio and TV.
5A similar relationship between newspaper penetration and government spending is also reported by Besley and Burgess (2002) for the case of India. Bruns and Himmler (2011) show for the case of Norway that the circulation of local newspapers has a positive effect on local government efficiency.
9
Studies on the effect of the introduction of radio and television on political participation again
suggest an effect of mass media on voting behavior. Strömberg (2004a) analyses the
introduction of the radio in the United States in the period from 1920 to 1940 in the context of
an unemployment relief program that was implemented during the diffusion period of the
radio between 1933 and 1935. He estimates that an increase in the share of households
owning a radio from 0 to 100 percent increases the voter turnout by 7 percentage points in this
period. At the same time, regions with higher radio reception received higher funds from the
unemployment relief program. This supports the idea that voters’ access to mass media
influences voter turnout and government policies.
Gentzkow (2006) studies the effect of the introduction of television in the U.S. on voter
turnout in an attempt to explain the observed decrease of voter participation in the period from
1940 to 1970. Using variation across regions in the timing of the introduction of this mass
medium, he shows that the introduction of television had a negative effect on voter
participation. The estimations suggest that the introduction of television in the 1940s and
1950s reduced the turnout in congressional races (without simultaneous presidential elections)
by two percentage points. Gentzkow argues that the effect is caused by TV crowding out
media with more extensive coverage on political issues thus reducing the electorates’
knowledgeability of political issues. In line with this, the introduction of television in a region
was accompanied by a strong decrease of the diffusion of newspapers and radio in this region.
By contrast, Oberholzer-Gee and Waldfogel (2009) find that the introduction of local
Spanish-language television in US metropolitan areas improved the availability of
information and eventually increased voter turnout among Hispanics in the metro area by 5 to
10 percentage points.
This paper focuses on the new mass medium of the 21st century, the Internet, and the effect of
its introduction on voting behavior. Previous research on the effect of mass media on voting
behavior suggests that the Internet may similarly crowd out traditional media thus affecting
voter turnout and election outcomes. In line with this concern, Liebowitz and Zentner (2011)
show that the Internet has a small crowding out effect on TV. Whether and to which extent
the Internet crowds out newspapers has not been analyzed so far. This paper will also provide
evidence on this. The main reason why the Internet may affect voting behavior is its potential
to provide direct and cheap access to the consumption and production of information without
editorial filtering. However, the absence of editorial filtering may also come at some costs. If
people now filter news by themselves and only consume the information and topics they want
to hear and read about this might very well cause ideological lock-ins (Sunstein, 2001). While
10
the consumption of traditional media such as newspapers, radio or TV still urges people to
encounter diverse viewpoints and to be exposed to new topics and ideas, self-selected news
consumption according to prior beliefs bears the risk of segregation thus leading to
ideological polarization.6 Accordingly, the introduction and diffusion of the Internet may
increase or decrease the range of news and opinions people are exposed to. We thus
hypothesize that the Internet–like other mass media–does affect voting behavior, but we do
not have a priori assumptions about the direction of this effect.
In an attempt to get a better understanding of the potential ideological bias caused by a
selective use of the Internet, Gentzkow and Shapiro (2010b) analyze the ideological
segregation of individuals’ online news consumption. Their data for the U.S. suggests that
segregation on the Internet is low, however higher than in most traditional media, and
significantly lower than segregation in face-to-face interactions. Online news consumption is
mostly concentrated on a small number of relatively centrist outlets whereas ideologically
extreme outlets such as political blogs or activist sites only account for a very small share of
online news consumption. This paper takes the initial studies on the effect of the Internet on
political participation and political opinions one step further: It analyzes how the introduction
of the Internet and the possibility to consume online news affects actual voting behavior and
assesses the causality of this relationship.
3. High-speed Internet Availability and Voting Behavior
3.1 High-speed Internet availability in German municipalities
Figure 1 shows the development of broadband subscriptions in Germany from 2001 to 2010.
Broadband Internet connections via DSL technology were introduced to the market for private
households in July 1999 by the incumbent network provider Deutsche Telekom. By the end of
this year, 100,000 subscriptions existed (Bundesnetzagentur, 2000). The increasing
importance of the Internet pushed the success of DSL and led Deutsche Telekom and its
competitors to further develop the broadband infrastructure. As DSL networks where set up in
larger cities, 8% of the population could access DSL in 2001 (Bundesnetzagentur, 2001). Out
of 1.9 million broadband subscriptions registered in the year 2001, only 30,000 relayed on
another technology than DSL. This underlines the role of DSL as dominant technology for
broadband Internet connections which persisted over the following years. Only in 2007, 6Campante and Hojman (2010) find that the introduction of radio and TV contributed to a reduction in the ideological polarization of the United States in the mid-20th century.
11
broadband subscriptions via other technologies (mainly via the cable TV network) reached
more than 5% market share. While this share is increasing since then, DSL is by far the most
commonly used technology to access the Internet in Germany.
<<Figure 1 about here >>
In this analysis, we employ data on high-speed Internet availability on the municipality-level.
These data are taken from the German broadband atlas (Breitbandatlas Deutschland), an
annual survey on broadband Internet availability conducted by the German Ministry of
Economics and Technology since the year 2005. Network providers self-report the geographic
areas they cover with their networks. This information is combined in a comprehensive
dataset documenting the percentage of households that can access DSL across more than
12,000 German municipalities.7 The high geographical resolution of our data becomes
obvious when considering that the average German municipality corresponds to a circle of
radius 3.1 km (1.9 miles). Figure 2 shows histograms of DSL availability across German
municipalities for the years 2005 to 2008 which is the time span covered in our analyses.
Average DSL availability increased from 67 percent of the households in 2005 to 85 percent
of the households in 2008. Furthermore, the share of so called white spots, this is
municipalities with no DSL availability, decreased over this time span from more than 5
percent in 2005 to about 2 percent in 2008.
<< Figure 2 about here >>
We now turn to the question for what purposes individuals use the Internet. We are interested
in the information function of the Internet thus implicitly assuming that individuals use the
Internet to some extent to access news. To further assess this assumption, we employ a study
by Arbeitsgemeinschaft Media-Analyse that asked nearly 19,000 individuals in Germany for
which purpose they use the Internet (cf. Table 1). The survey was conducted in 2007 and
allowed multiple answers. The most frequent answer was “Information Search” (94.6 %)
closely followed by “Email” (89.4%), and “News” (71.7%). By contrast, “Entertainment” has
been chosen by only 48.8% of the interviewees. Along with an Internet usage rate of 60.2
percent of the German population in 2007 (Initiative D21, 2010), these figures suggest that
the Internet does have an information function and with its various news sites and information
7Note for the interpretation of all subsequent results that the municipality-level DSL rate is measured as DSL availability, i.e. the percentage of households in a municipality for which a DSL subscription is technically available. However, it is not the pure availability of DSL but its use that will affect the outcome variables on voting behavior. We thus estimate the effect of DSL availability on the outcome variable and not the effect of DSL use. Technically, we estimate the intention to treat effect and not the treatment effect, a procedure that does overcome endogeneity problems when assessing the effect of DSL use on voting behavior.
12
channels, the Internet has become an important player in the mass media market. It is however
worth noting that a bandwidth of at least 384 Kbit/s is the minimum requirement to use the
Internet to access online news properly. We simulated, for example, the time to access the
webpage Spiegel Online, one of the most viewed news sites in Germany, at different
bandwidths. The main elements of this site loaded within 15 seconds at a DSL connection of
384 Kbit/s. With a dial-up Internet connection of 56k, loading the same site took more than
one minute.
<<Table 1 about here >>
3.2 Election data
We measure the effect of the Internet on two aspects of voting behavior: (i) voter turnout and
(ii) the vote share of single parties, including established parties as well as radical parties. We
observe these outcome variables at the municipality-level for elections at the three main levels
of governance in Germany, i.e. elections for the Federal Parliament (Bundestagswahlen),
elections for the State Parliaments (Landtagswahlen), and elections for the municipal- or city
councils (Gemeinderatswahlen or Stadtratswahlen).8 The data are obtained from the statistical
offices of the 16 German states.9 For each election type, we consider three elections–two
elections from the time before the year 2000, i.e., before the DSL infrastructure roll-out, and
one election from the year 2004, i.e., a time when DSL diffusion has surpassed a critical mass
of users. We exploit information from elections before the year 2000 in value-added models
and placebo regressions. Data from different municipalities are collapsed if municipalities
merged during the period of our analysis. Our final dataset is a balanced panel of election data
that draws a precise picture of political preferences and their changes across roughly 12,000
German municipalities over the last 20 years. Table 2 summarizes the timing of the three
types of elections selected for our analysis.
8Note that many German cities do not belong to a county (kreisfreie Staedte). Those municipalities elect their own city council, but they do not participate in elections for a county council. Hence we discard elections for the county councils that always take place simultaneously to the elections for the municipality councils from our analysis. 9Namely these are the Statistisches Amt fuer Hamburg und Schleswig-Holstein (Hamburg and Schleswig-Holstein), Statistisches Landesamt Sachsen-Anhalt (Saxony-Anhalt), Amt fuer Statistik Berlin-Brandenburg (Berlin and Brandenburg), Bayerisches Landesamt fuer Statistik und Datenverarbeitung (Bavaria), Statistisches Landesamt Baden-Wuerttemberg (Baden-Wuerttemberg), Hessisches Statistisches Landesamt (Hesse), Statistisches Landesamt Rheinland-Pfalz (Rhineland-Palatinate), Statistisches Amt Saarland (Saarland), Landesbetrieb fuer Statistik und Kommunikationstechnologie Niedersachsen (Lower Saxony), Landesbetrieb Information und Technik Nordrhein-Westfalen (North Rhine-Westphalia), Statistisches Landesamt Bremen (Bremen), Statistisches Landesamt des Freistaates Sachsen (Saxony), Statistisches Amt Mecklenburg-Vorpommern (Mecklenburg-Western Pomerania) and Thueringer Landesamt fuer Statistik (Thuringia).
13
<< Table 2 here >>
In the absence of irregular early elections, Federal elections take place every four years. The
legislative periods of state parliaments vary between 4 and 5 years. Federal parliaments and
state parliaments are both legislative bodies that elect and control the respective government.
For all German parliaments, the electoral system mainly rests on the principle of
proportionality, i.e. a party’s vote share translates into its share of seats in the elected
parliament. Voters deliberately choose their preferred parties and this decision expresses their
preference for a party’s political profile. Accordingly, the proportional vote is an appropriate
approximation of the policy-orientation within a specific region.10
Elections for the municipal- or city councils are held every 4 to 6 years. Those councils do not
have legislative authority but control and advice authorities at the corresponding regional
level. Nevertheless, councils influence local policy outcomes, since their resolutions are
binding for the local authorities, thus determining the overall goals and measures of political
action on the local level. The actual election systems for the municipal- or city councils vary
significantly between states, mainly with regard to the way mandates are distributed. But
nearly all municipalities still distribute the seats in the respective councils by proportional
rule. The few remaining municipalities who apply majority rule as major principle to their
council elections are excluded from our analysis. We further exclude the three city-states
Hamburg, Bremen, and Berlin from our analysis. Elections on the sub-national level are
subject to the special institutional setup in these small city states and a comparison with sub-
national elections in the other 13 states would likely be biased.
The vote shares of single parties are calculated as share of the overall votes in an election and
municipality. Established parties are the conservative parties CDU and CSU11, the social
democratic party SPD, the liberal party FDP and the ecologist green party GRUENE. These
parties are active on all levels of governance, have sub-organizations in all German states,
always participate in all German elections, regularly gain seats in the German parliaments,
and usually provide the federal government and state governments respectively. All five
parties have been active for at least 30 years and arguably dominate the political life in
Germany during the time window of our analysis.
10Note that federal elections and many state elections also contain an element of majority vote as voters can use a second ballot to elect their districts representative. With this ballot, voters decide on individual nominees who are mostly party delegates. If they win a majority of votes in their election district, they are elected for parliament. As the election of individual candidates does not affect the distribution of seats in parliaments, the proportional vote is the decisive vote in all German federal and state elections. Therefore, we restrict our outcome to the proportional vote ballots. 11With the CSU being the Bavarian branch of the CDU.
14
The group of not established parties consists of numerous organizations of different sizes and
ideological backgrounds that only occasionally gain seats in state parliaments or the federal
parliament.12 Within this group, we are especially interested in the vote shares of parties from
the extreme right-wing and the extreme left-wing of the political spectrum. The most
prominent among the extreme right wing parties’ include the radical nationalist parties NPD,
DVU and REP. At the other end of the political spectrum, we look at vote shares of various
Marxist and Leninist parties, first and foremost the socialist party LINKE and its predecessors
PDS and WASG.13
<< Table 3 about here >>
Table 3 shows summary statistics on different election outcomes. From the year 2004 on,
voter turnout varied between 60 percent and 73 percent depending on the type of elections.
The vote share of established parties reached more than 80 percent in supra-regional elections.
In local elections, established parties only reached a vote share of about 55 percent. The vote
share of extreme right wing parties was about 3 percent in supra-regional elections and close
to zero in local elections. Note that, in general, a single party must reach a vote share of 5
percent in supra-regional elections to get a seat in the respective parliament. Extreme left
wing parties reached vote shares of up to 10 percent which is mainly driven by the socialist
party LINKE and its predecessors PDS and WASG.
3.3 The association between high-speed Internet availability and voting behavior
Table 4 shows the results of simple multivariate regressions of DSL availability (measured as
share of households having access to broadband Internet in a municipality) on different
measures of voting outcome. As we concentrate on elections after the DSL infrastructure roll-
out, we consider election outcomes from the year 2004 on and add year of election
dummies.14 In our main specification, we pool the three types of elections (municipality, state,
and national) and add election type dummies as controls. All regressions further condition on
a set of municipality-level control variables including surface, population, female population 12Nevertheless they might play some role when it comes to city or municipality councils. 13 One might argue that the socialist party LINKE is also an “established” party. LINKE is a merger of the PDS, i.e. the successor of the socialist unity party formerly ruling the German Democratic Republic and thus mostly active in East Germany, and some leftist parties and factions rooted in West Germany. While LINKE nowadays manages to gain a fair amount of votes all across Germany, during our period of analysis it was mainly an East German party. We thus choose to label it as small party instead of incumbent party. Changing this does not affect our results. 14 DSL availability on the municipality-level is not available for the year 2004. We thus merge election outcomes from the year 2004 with DSL availability in the year 2005. For all other years, we can merge our election data with our data on DSL availability on a year-to-year basis.
15
share, age structure of the population, and unemployment rate. To guarantee that we only
compare municipalities that are most similar with the exception of DSL availability, we
finally add a full set of county dummies. The average German county contains about 27
municipalities and represents a quite homogenous regional entity. Our standard errors are
clustered on the municipality level because voting outcomes in the three types of election
might be correlated within municipalities.
<< Table 4 here>>
Conditional on our municipality-level control variables, election type dummies, year of
election dummies, and county dummies, we find a significantly negative association between
DSL availability in a municipality and voter turnout (Column 1); a significantly positive
association between DSL availability and the vote share of established parties (Column 3);
and a significantly positive association between DSL availability and the vote share of
extreme right-wing parties (Column 7). We find no significant association between DSL
availability in a municipality and the vote share of left wing parties (Column 5).
We do not interpret these results as causal effect of DSL availability on voting outcomes since
there might be unobserved municipality characteristics that are correlated with both the DSL
availability and voting outcomes. Such a bias would arise from a selection of individuals into
certain locations. Let us assume that open-minded and highly educated individuals who are
also interested in political issues prefer to move to dense areas rich of amenities and job
opportunities. At the same time, dense areas face cost advantages in the provision of
broadband infrastructure because of scale effects in the roll-out process. Combined with a
large number of broadband Internet subscriptions in dense areas—presumably from young
and highly-educated individuals—profit-oriented telecommunication carriers started rolling
out broadband infrastructure in dense areas. As result our OLS estimates should be upward
biased. Of course, one can think of many other stories why OLS estimates might tell us little
about the true underlying causal relationship between broadband Internet access and voting
behavior.
To overcome estimation biases that result from unobserved time persistent factors that
influenced past election outcomes, still influence contemporaneous election outcomes, and are
correlated with DSL roll-out across municipalities, we exploit the time dimension of our data
and include the respective voting outcomes from the years before the introduction of DSL in
2000. This procedure is often referred to as value-added model. It is especially valuable in the
context of German election outcomes since norms and values that likely influence election
16
outcomes are highly persistent over time and on a small geographic scale (Voigtlaender and
Voth, 2012).
The results of the value-added models are shown in Table 4. We still find a significant
negative association between DSL availability and voter turnout (Column 2) and a positive
association between DSL availability and the vote share of established parties (Column 4).
The association between DSL availability and the vote share of extreme left-wing parties
becomes positive (Column 6); the association between DSL availability and the vote share for
extreme right-wing parties becomes significantly negative (Column 8). While this step should
control for all time persistent factors that might bias our results, we still worry about biases
from time varying factors that simultaneously came up with the DSL technology and that are
correlated with voting outcomes. To overcome this concern, we now turn to instrumental
variable estimations where we exploit regional and technological peculiarities of the
preexisting voice telephony network that hinder the roll-out of fixed-line broadband
infrastructure for high-speed Internet.
4. Assessing Causality
4.1. Technical foundations of DSL infrastructure
We develop our instrumental variables from regional and technological peculiarities of the
traditional public switched telephone network in Germany which affect certain municipalities’
possibilities to access broadband Internet. The voice telephony network was rolled out at a
time when considerations of its suitability for DSL technology were not a concern. As early as
1936, we observe 6,647 local telephone networks with about 3.4 million connections and the
network was further developed to its current layout from the 1950s on. This allows us to
identify a group of municipalities that got worse initial conditions to access DLS technology
at a time when DSL was not yet thought of. In the following, we will explain the
technological peculiarities underlying our instrumental variable estimations in more detail.
The early generations of DSL technology in Germany completely rely on the copper wires
between the household and the main distribution frame (MDF)–the so called ‘last mile’ of the
traditional public switched telephone network (cf. Figure 3 for a graphical illustration of the
telephone network structure). Employing the existing wires is a significant cost advantage
because all wires are rolled out subsurface in Germany. The public switched telephone
network was rolled out at a time when the provision of telephone services was a state
17
monopoly with the declared goal to provide universal telephone service to all German
households. While dense municipalities always have at least one own MDF, more rural
municipalities typically share an MDF. The length of the copper wires was irrelevant for the
quality of the telephone services and accordingly, the choice of MDF locations in more rural
areas was determined by restrictions like the availability of buildings to host an MDF.
However, in a DSL access network distance does play a crucial role because the maximum
bandwidth depends on the length of the copper wire between the household and the MDF.
When surpassing a threshold of about 4,200 meters (2.6 miles), DSL technology is no more
feasible and one has to replace parts of the copper wire by fiber wire which involves costly
earthworks that increase with the length of the bypass.
<<Figure 3 and 4 here >>
Using GIS, we calculate the geographic distance from the geographic centroids of all
municipalities to the MDF that serves the municipality. There are more than 8,000 MDFs in
Germany which underlines the ‘micro-geographic’ structure of our data (cf. Figure 4).
Figure 5 plots the DSL rate of a municipality against its distance to the actual MDF. The plot
shows all municipalities around the critical threshold of 4,200 meters (2.6 miles). For clarity,
the figure plots the average DSL availability of municipalities in bins of 100 meters (0.06
miles) as dots while the fitted lines depicting the DSL share (conditional on distance to the
MDF) are calculated on the basis of all single observations. The figure clearly shows the kink
in the DSL share at the threshold of 4,200 meters (2.6 miles). Municipalities with distances
below 4,200 meters all have DSL shares between 70 to 80 % (red line). At distances above the
critical threshold DSL availably begins to decrease sharply (blue line).
<<Figure 5 here>>
A second source of technical variation comes from some 6% of the municipalities with a
distance to their actual MDF that is greater than 4,200 meters (2.6 miles) where a closer MDF
exists at a distance below the threshold of 4,200 meters (2.6 miles). This peculiarity is the
result of the geographic layout of the telephone access areas that were designed when distance
was irrelevant (cf. Figure 6). At that time, organizational considerations determined the
allocation of municipalities within certain telephone access areas. The assignment to a certain
telephone access area tied the municipality to a particular MDF which, in some cases, was
further away than a neighboring telephone access area’s MDF. In such a situation it is now
often cheaper for the telecommunication carrier to provide DSL to a municipality via the
closer MDF than via the “wrong” MDF the municipality is actually connected to. Still, both
18
procedures imply costly earthworks to roll-out new wires. We construct a dummy variable
that equals unity for municipalities that are actually connected to a “wrong” MDF at a
distance of more than 4,200 meters (2.6 miles) which could be connected to another MDF at a
distance below 4,200 meters (2.6 miles). We expect this dummy variable to have a significant
positive impact on DSL availability in the municipality.
<< Figure 6 about here >>
The third source of technical variation is independent of distance. After the German
reunification in 1990, there was a huge lack of telephone access lines in many parts of East
Germany. To close this lack, telephony infrastructure was rolled out which was built on the
basis of a special type of fiber wires, the so called OPAL technology, instead of the
traditionally used copper wires. In the early 1990s, this technology was regarded to be the
state-of-the-art technology that would dominate the ICT future. It is suited for voice-
telephony services, ISDN services, and a limited amount of data transmission. OPAL
technology was eventually rolled out in 213 East German areas (cf. Figure 7). But then things
changed dramatically: The world saw the Internet revolution taking over with the Internet
becoming a mass phenomenon and services on the Internet demanding higher and higher
bandwidths. For reasons described above, DSL technologies became the leading access
technologies for broadband Internet in Germany. This was, however, the misfortune for the
thought-to-be-high-tech OPAL areas. The reason for this is that OPAL technology is simply
not compatible with DSL technologies. In order to still provide broadband Internet to OPAL
areas, two very costly alternatives were feasible. One could either replace the OPAL wires of
the access network by copper wires or, what is even more expensive; install new hardware
and software at the networks’ nodes. We construct a dummy that equals unity for
municipalities being situated in a (former) East German OPAL access area. We expect this
dummy to have a significant negative impact on DSL availability.
<< Figure 7 about here>>
Table 5 shows the results of a multivariate regression of DSL availability in a municipality in
years of elections on the variables that are technically derived from the characteristics of the
pre-existing voice telephony network. These variables include the distance to the actual MDF,
a threshold dummy for distances above 4,200 meters (2.6 miles), the interaction between
distance and the threshold dummy, a dummy for municipalities which are actually connected
to a “wrong” MDF, a dummy for municipalities that are actually connected to a ‘wrong’ MDF
with another MDF at a distance below 4,200 meters (2.6 miles), and an OPAL dummy.
19
<< Table 5 >>
The results clearly confirm our technical predictions. Distance turns out to be irrelevant for
DSL availability in a municipality below the critical threshold of 4,200 meters (2.6 miles). At
the threshold, DSL availability drops by 3.1 percentage points. Above this threshold the DSL
share decreases by 5.9 percentages points with every kilometer (0.6 miles) the municipality is
farther away from the MDF. Not being connected to the closest MDF only shows a small
positive effect of 2.3 percentage points. However, for municipalities that are actually
connected to an MDF farther away than 4.2 kilometers (2.6 miles) but for which another MDF
is closer by the DSL share additionally increases by 8.4 percentage points reflecting the
possibility to redirect DSL access to the closer MDF. Finally, the DSL share of municipalities
located in OPAL areas is 8.0 percentage points lower.
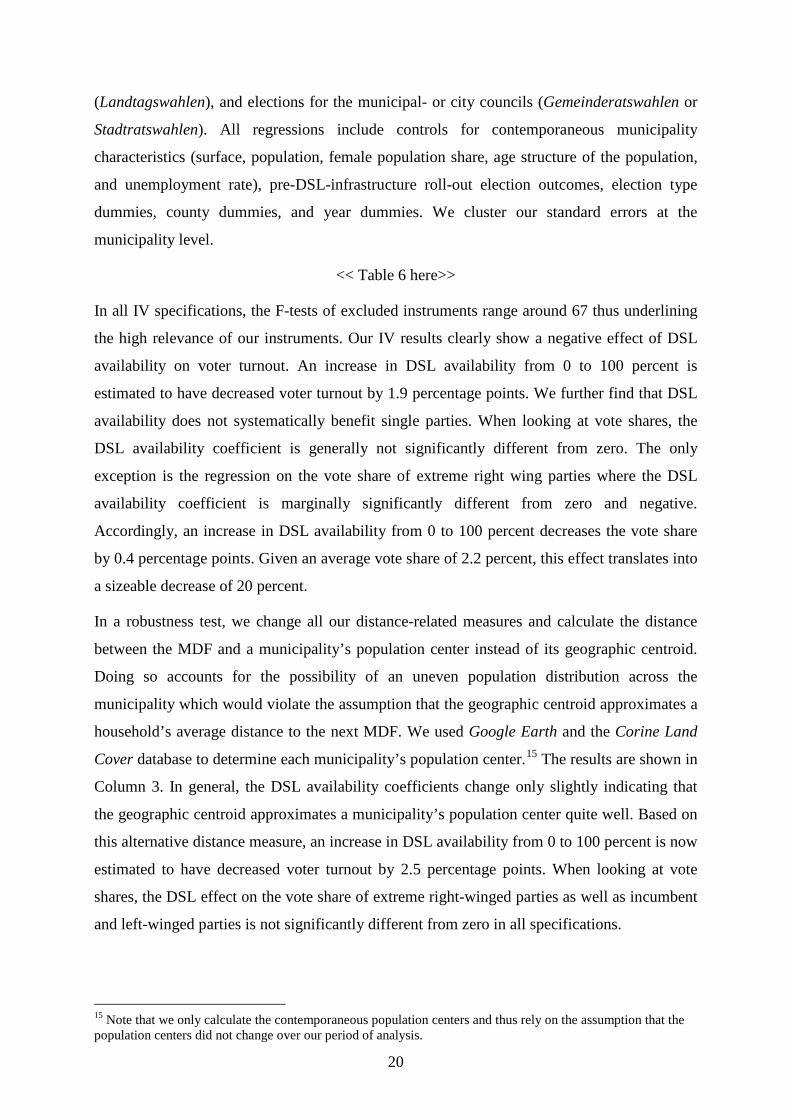
4.2 The causal effect of high-speed Internet availability on voting behavior
We now turn to IV estimations that exploit the regional and technical features of the pre-
existing voice telephony network to identify an arguably causal effect of high-speed Internet
availability on voting behavior. We restrict our analysis to municipalities without an own
MDF because our distance-related instruments are especially valid if we assume that the
choice where to locate an MDF of the voice telephony network was as-good-as random. This
is obviously not true for urban municipalities which all have at least one own MDF. However,
more rural municipalities with a lower population density typically shared an MDF. Variation
in DSL availability among the rural municipalities without an own MDF results from the fact
that decades after the roll-out of the voice telephony network some of the municipalities were
lucky to be closer than 4,200 meter (2.6 miles) to the next MDF while others were unlucky
and more than 4,200 meters (2.6 miles) away. Concentrating on the more than 6,600 rural
municipalities without an own MDF is a conservative approach that reduces the probability of
unobserved heterogeneity between these municipalities. Within this subset, we compare
municipalities within a county which had a lucky draw to those with an unlucky draw.
The regression results for the subsample of municipalities without an own MDF are shown in
Table 6. Each cell shows the DSL availability coefficient from a separate regression. As a
starting point, column 1 shows the value-added results for our sample. The results are
comparable to those for the full sample shown in Table 4. Again, we pool outcomes of
elections after 2004 at three main levels of governance in Germany, i.e. elections for the
Federal Parliament (Bundestagswahlen), elections for the State Parliaments
20
(Landtagswahlen), and elections for the municipal- or city councils (Gemeinderatswahlen or
Stadtratswahlen). All regressions include controls for contemporaneous municipality
characteristics (surface, population, female population share, age structure of the population,
and unemployment rate), pre-DSL-infrastructure roll-out election outcomes, election type
dummies, county dummies, and year dummies. We cluster our standard errors at the
municipality level.
<< Table 6 here>>
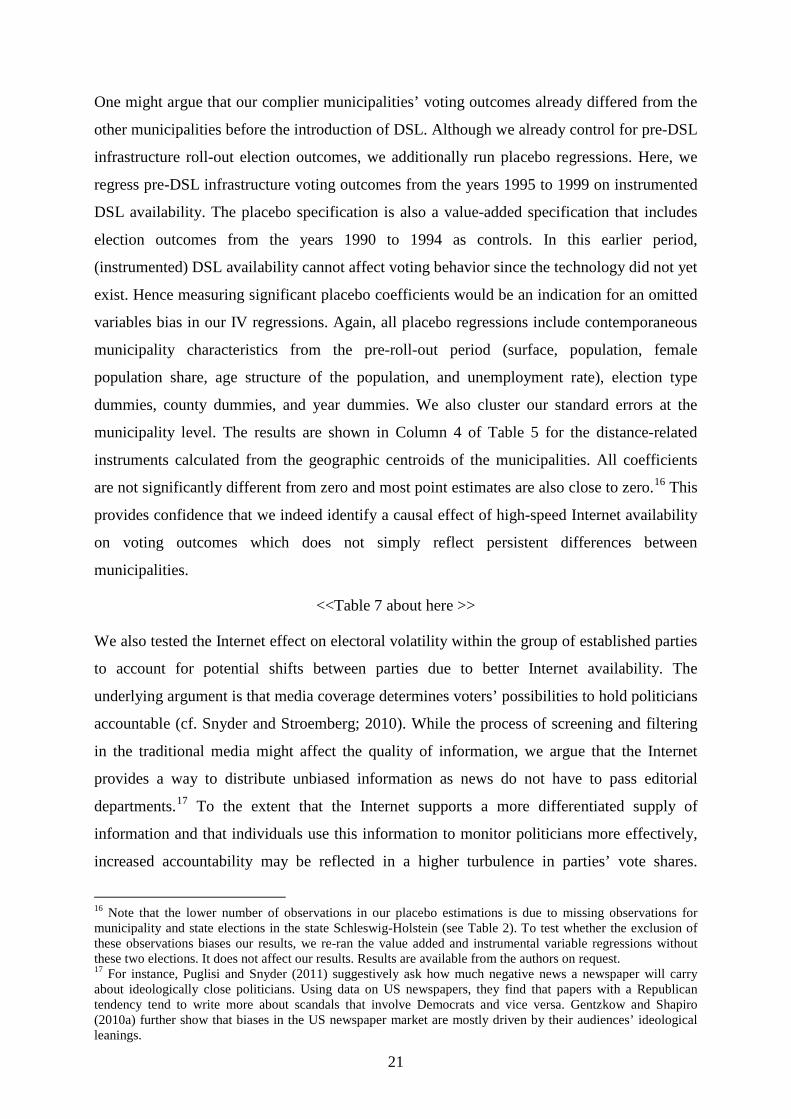
In all IV specifications, the F-tests of excluded instruments range around 67 thus underlining
the high relevance of our instruments. Our IV results clearly show a negative effect of DSL
availability on voter turnout. An increase in DSL availability from 0 to 100 percent is
estimated to have decreased voter turnout by 1.9 percentage points. We further find that DSL
availability does not systematically benefit single parties. When looking at vote shares, the
DSL availability coefficient is generally not significantly different from zero. The only
exception is the regression on the vote share of extreme right wing parties where the DSL
availability coefficient is marginally significantly different from zero and negative.
Accordingly, an increase in DSL availability from 0 to 100 percent decreases the vote share
by 0.4 percentage points. Given an average vote share of 2.2 percent, this effect translates into
a sizeable decrease of 20 percent.
In a robustness test, we change all our distance-related measures and calculate the distance
between the MDF and a municipality’s population center instead of its geographic centroid.
Doing so accounts for the possibility of an uneven population distribution across the
municipality which would violate the assumption that the geographic centroid approximates a
household’s average distance to the next MDF. We used Google Earth and the Corine Land
Cover database to determine each municipality’s population center.15 The results are shown in
Column 3. In general, the DSL availability coefficients change only slightly indicating that
the geographic centroid approximates a municipality’s population center quite well. Based on
this alternative distance measure, an increase in DSL availability from 0 to 100 percent is now
estimated to have decreased voter turnout by 2.5 percentage points. When looking at vote
shares, the DSL effect on the vote share of extreme right-winged parties as well as incumbent
and left-winged parties is not significantly different from zero in all specifications.
15 Note that we only calculate the contemporaneous population centers and thus rely on the assumption that the population centers did not change over our period of analysis.
21
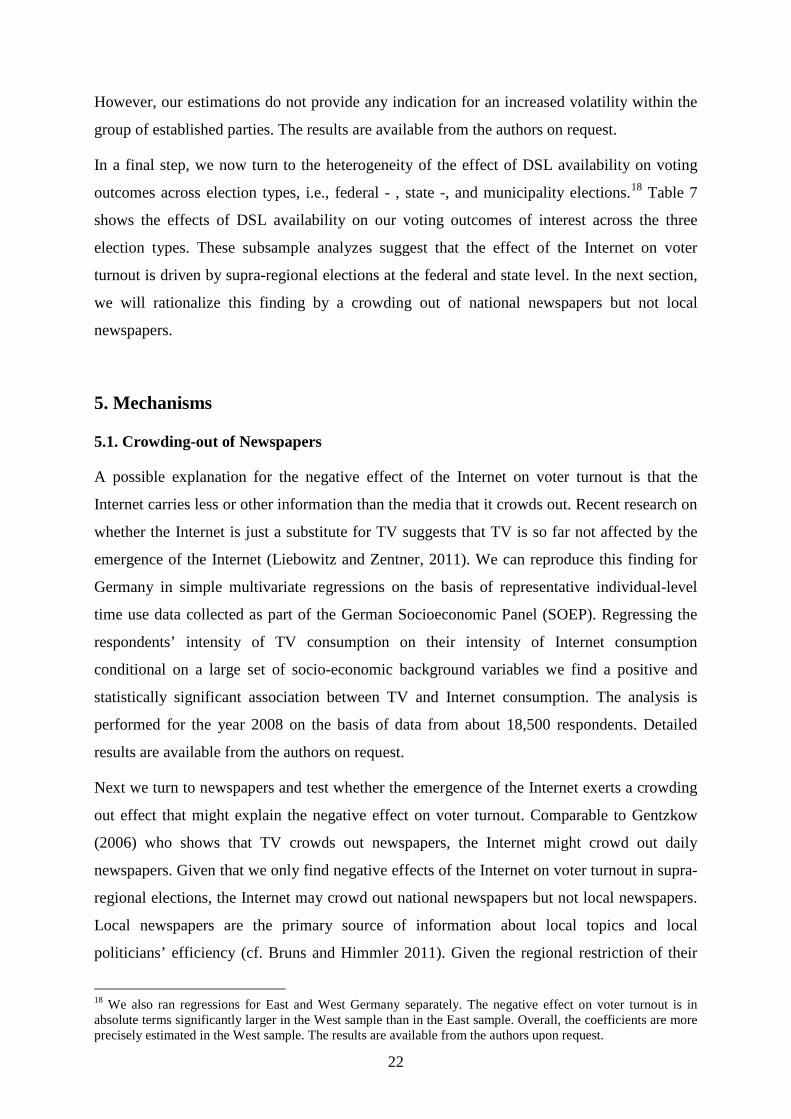
One might argue that our complier municipalities’ voting outcomes already differed from the
other municipalities before the introduction of DSL. Although we already control for pre-DSL
infrastructure roll-out election outcomes, we additionally run placebo regressions. Here, we
regress pre-DSL infrastructure voting outcomes from the years 1995 to 1999 on instrumented
DSL availability. The placebo specification is also a value-added specification that includes
election outcomes from the years 1990 to 1994 as controls. In this earlier period,
(instrumented) DSL availability cannot affect voting behavior since the technology did not yet
exist. Hence measuring significant placebo coefficients would be an indication for an omitted
variables bias in our IV regressions. Again, all placebo regressions include contemporaneous
municipality characteristics from the pre-roll-out period (surface, population, female
population share, age structure of the population, and unemployment rate), election type
dummies, county dummies, and year dummies. We also cluster our standard errors at the
municipality level. The results are shown in Column 4 of Table 5 for the distance-related
instruments calculated from the geographic centroids of the municipalities. All coefficients
are not significantly different from zero and most point estimates are also close to zero.16 This
provides confidence that we indeed identify a causal effect of high-speed Internet availability
on voting outcomes which does not simply reflect persistent differences between
municipalities.
<<Table 7 about here >>
We also tested the Internet effect on electoral volatility within the group of established parties
to account for potential shifts between parties due to better Internet availability. The
underlying argument is that media coverage determines voters’ possibilities to hold politicians
accountable (cf. Snyder and Stroemberg; 2010). While the process of screening and filtering
in the traditional media might affect the quality of information, we argue that the Internet
provides a way to distribute unbiased information as news do not have to pass editorial
departments.17 To the extent that the Internet supports a more differentiated supply of
information and that individuals use this information to monitor politicians more effectively,
increased accountability may be reflected in a higher turbulence in parties’ vote shares.
16 Note that the lower number of observations in our placebo estimations is due to missing observations for municipality and state elections in the state Schleswig-Holstein (see Table 2). To test whether the exclusion of these observations biases our results, we re-ran the value added and instrumental variable regressions without these two elections. It does not affect our results. Results are available from the authors on request. 17 For instance, Puglisi and Snyder (2011) suggestively ask how much negative news a newspaper will carry about ideologically close politicians. Using data on US newspapers, they find that papers with a Republican tendency tend to write more about scandals that involve Democrats and vice versa. Gentzkow and Shapiro (2010a) further show that biases in the US newspaper market are mostly driven by their audiences’ ideological leanings.
22
However, our estimations do not provide any indication for an increased volatility within the
group of established parties. The results are available from the authors on request.
In a final step, we now turn to the heterogeneity of the effect of DSL availability on voting
outcomes across election types, i.e., federal - , state -, and municipality elections.18 Table 7
shows the effects of DSL availability on our voting outcomes of interest across the three
election types. These subsample analyzes suggest that the effect of the Internet on voter
turnout is driven by supra-regional elections at the federal and state level. In the next section,
we will rationalize this finding by a crowding out of national newspapers but not local
newspapers.
5. Mechanisms
5.1. Crowding-out of Newspapers
A possible explanation for the negative effect of the Internet on voter turnout is that the
Internet carries less or other information than the media that it crowds out. Recent research on
whether the Internet is just a substitute for TV suggests that TV is so far not affected by the
emergence of the Internet (Liebowitz and Zentner, 2011). We can reproduce this finding for
Germany in simple multivariate regressions on the basis of representative individual-level
time use data collected as part of the German Socioeconomic Panel (SOEP). Regressing the
respondents’ intensity of TV consumption on their intensity of Internet consumption
conditional on a large set of socio-economic background variables we find a positive and
statistically significant association between TV and Internet consumption. The analysis is
performed for the year 2008 on the basis of data from about 18,500 respondents. Detailed
results are available from the authors on request.
Next we turn to newspapers and test whether the emergence of the Internet exerts a crowding
out effect that might explain the negative effect on voter turnout. Comparable to Gentzkow
(2006) who shows that TV crowds out newspapers, the Internet might crowd out daily
newspapers. Given that we only find negative effects of the Internet on voter turnout in supra-
regional elections, the Internet may crowd out national newspapers but not local newspapers.
Local newspapers are the primary source of information about local topics and local
politicians’ efficiency (cf. Bruns and Himmler 2011). Given the regional restriction of their
18 We also ran regressions for East and West Germany separately. The negative effect on voter turnout is in absolute terms significantly larger in the West sample than in the East sample. Overall, the coefficients are more precisely estimated in the West sample. The results are available from the authors upon request.
23
readership, local newspapers likely face less competition from online news because of limited
returns to scale. Local newspapers being unaffected by the Internet would also be in line with
findings on a crowding out of social capital by TV or the Internet. Local newspapers are often
seen as a measure for local social capital or the “civicness” of the local population (Putnam
1993). Olken (2009) shows that TV crowds out local social capital while the Internet does not
seem to crowd out social capital measured over several dimensions (Bauernschuster et al.
2011).
To test whether the Internet crowds out national newspapers but not local newspapers, we use
municipality-level information about the circulation of all German daily national and local
newspapers from 2000 to 2010. Data are provided every two years by the
Informationsgemeinschaft zur Feststellung der Verbreitung von Werbeträgern e.V. (IVW). On
average, 50 percent of the households in the municipalities without an own MDF read a daily
local newspaper at the beginning of the Internet period in 2004 and 7.4 percent read a daily
national newspaper. By the end of our observation period in 2008, these numbers decreased to
an average of 46 percent of the households reading a daily local newspaper and 6.8 percent
reading a daily national newspaper. Figure 8 shows the average number of daily national and
local newspapers across the subsample of municipalities without an own MDF over the whole
period 2000 to 2010. The figure clearly shows that the circulation of both national and local
daily newspapers decreases over time. However, at the beginning of the Internet era, the
relative decrease of national newspapers becomes relatively steeper than the decrease of local
newspapers.19
<< Figure 8 about here >>
To directly relate the relative decline of national and local newspapers to the availability of
broadband Internet, we run a three equation seemingly unrelated regression model. The first
equation relates the growth rate of local newspapers per household in a municipality from
2004 to 2006 (2008 or 2010 respectively) to the DSL availability at the beginning of the
period. The second equation repeats these estimations for national newspapers. Finally, the
third equation relates DSL availability in 2005 to the full set of instruments. We also
condition these estimations on the same set of municipality characteristics used before and on
the log of the initial number of local newspapers per household in 2004. The results of our
regressions are shown in Table 8. Across all timespans and specifications, results point to the
19 Note in this context that only a small part of the sharp decline in national printed newspapers can be explained by subscriptions for e-paper versions of national daily newspapers. In 2005, about 27,000 e-papers were sold Germany-wide. This number only increased to about 57,000 sold e-papers in 2010.
24
same direction. In municipalities with high DSL availability, the decline of national daily
newspaper circulation is accelerated while the generally flatter decline of local daily
newspaper circulation even decelerates. We interpret this finding as one explanation for the
observed negative effect of DSL availability on voter turnout in supra-regional elections but
not in local elections.
<< Table 8 about here>>
5.2. Internet, Unemployment and voting Behavior
Charles and Stephens Jr. (2011) argue that activities that provide political information are
substitutive to labor market activity. As a consequence, increased labor market activity should
go in hand with lower voter turnout. The Internet might thus affect voter turnout through two
channels: (i) through the information channel as discussed above and (ii) through an economic
channel. If the Internet increased economic activity and thus labor market participation we
would expect that voter turnout decreases. Indeed, Czernich et al. (2011) show important
economic growth effects of broadband infrastructure in a cross-country analysis. Cross-
regional evidence for the U.S. however suggests that the local economic benefits of
broadband expansion for a single location are limited (Kolko, 2012). Taking these two results
together, one might come to the conclusion that the Internet does have positive effects on
macroeconomic growth which result from increased transparency, more competition, or ICT-
based organizational innovations within firms; however, the Internet did not change the
spatial distribution of economic activity within a country.
<<Table 9 about here>>
To test whether this alternative and indirect mechanism is at work, we re-run our cross-
municipality analyses with the unemployment rate as alternative outcome variable. We
consider the unemployment rate to be a comprehensive measure of the overall economic
activity in a municipality. The results are shown in Table 9. Once we instrument Internet
availability and thus come to a causal interpretation of our results, we do not find any
indication of this alternative economic mechanism. Differences in the availability of
broadband Internet do not cause any significant differences in the local unemployment rates.
This finding additional supports our strategy and conclusion that we identify an information
(crowding-out) effect of the Internet on voter turnout.
25
6. Conclusions
This paper analyses the effect of the Internet on voting behavior. Research on the introduction
of the equally influential mass media radio and TV shows that increased media coverage
provides more information for voters. However, while more information is generally good for
voters because it promotes the accountability of politicians, research on the political economy
of mass media also suggests that editorial filtering and the selection of certain topics can lead
to adverse effects. If the media disseminate biased information, more information does not
necessarily imply more transparency. In the Internet, editorial filtering is per se not a problem.
Everyone can consume and produce information without any restriction and at reasonable
costs. At the same time, the almost unlimited possibility to supply information bears the risk
of an information overflow. As a result, people may concentrate on a limited number of topics
and areas they want to hear and read about which may foster segregation and ideological
polarization. An alternative reaction to an overflow of information would be that people
demand aggregated sources of information. In this case, existing media outlets could simply
use their infrastructure to provide their news and information through an additional channel,
the Internet.
Our paper tests the effect of the Internet on different aspects of voting behavior. First, we look
at voter participation and find statistically significant and negative effects of Internet access
on voter turnout. Subsample estimations show no Internet effect on voter turnout in local
elections but only on supra-regional elections. One possible explanation for this finding could
be that the Internet crowds out other media that contain more or better information. TV is
broadcasted nationally and does not help explain this finding. By contrast, newspapers are less
homogeneous. On the one hand, there are national newspapers that distribute supra-regional
information for a large audience. These newspapers are indeed affected by the Internet as new
channel to disseminate information on a broad scale. On the other hand, there are local
newspapers with an endemic focus. Clearly, there are less scale economies in the
dissemination of region-specific information by the Internet and accordingly, we find that the
Internet exerts higher competitive pressure on national newspapers than on local newspapers.
This crowding-out of national newspapers may affect the dissemination of supra-regional
information which translates into a lower voter turnout in supra-regional elections. Beyond
the effect on voter turnout, we find some indication of a negative effect of Internet availability
on extremist right wing parties’ vote shares. Other parties’ vote shares are not systematically
affected by the availability of broadband Internet.
26
Taken together, we believe that our instrumental variable strategy enables us to report first
causal evidence for an Internet effect on different aspects of voting behavior. However, we
should also stress that our paper only analyses the introduction of the Internet. Further
research is needed to assess whether the estimated effects persist when considering additional
mobilization effects from web 2.0 applications like blogs or Facebook. Web 2.0 applications
might especially be of interest for people who are interested in topics off the main policy
issues. Before the Web 2.0 era, voting for small parties without a chance to win a significant
vote share was one way to make a political statement. In the Web 2.0 era, blogging may be a
more effective way to express political opinions on specific topics. However, these recent
developments are not yet covered in our election data and thus remain the subject of future
research.
27
References
Anell, P., S. Jay, and T. Plückebaum (2007). Nachfrage nach Internetdiensten – Dienstearten, Verkehrseigenschaften und Quality of Service, wik Discussion Paper 302.
Bauernschuster, S., O. Falck, and L. Woessmann (2011). Surfing Alone? The Internet and Social Capital: Evidence from an Unforeseeable Technological Mistake. IZA Discussion Paper 5747.
Bruns, C. and O. Himmler (2011). Newspaper Circulation and Local Government Efficiency. Scand. Journal of Economics 113(2): 470–492.
Czernich, N., Falck, O., T. Kretschmer, and L. Woessmann (2011). Broadband Infrastructure and Economic Growth, Economic Journal, 121(May): 505-532.
Besley, T. and A. Prat (2006). Handcuffs for the Grabbing Hand? The Role of the Media in Political Accountability. American Economic Review 96(3): 720-736.
Besley, T. and R. Burgess (2002). The Political Economy of Government Responsiveness: Theory and Evidence from India, Quarterly Journal of Economics 117 (4): 1414-1451.
Bundesnetzagentur, (2000). Jahresbericht 1999, Bonn.
Bundesnetzagentur, (2001). Jahresbericht 2000, Bonn.
Campante, F. R. and D. Hojman (2010). Media and Polarization. Working Paper, Harvard Kennedy School.
Charles, K. K. and M. Stephens Jr. (2011). Employment, Wages and Voter Turnout, NBER Working Paper 17270.
DellaVigna, S. and E. Kaplan (2007). The Fox News Effect: Media Bias and Voting, Quarterly Journal of Economics 122 (3): 1187-1234.
Durante, R., and B. Knight (2011). Partisan Control, Media Bias, and Viewer Responses: Evidence from Berlusconi’s Italy, Journal of European Economic Association, forthcoming.
Enikolopov, R., M. Petrova, and E. V. Zhuravskaya (2011). Media and Political Persuasion: Evidence from Russia, American Economic Review 101(7): 3253-3285.
Gentzkow, M. (2006). Television and Voter Turnout, Quarterly Journal of Economics 121 (3): 931-972.
Gentzkow, M. and J. Shapiro (2010a). What Drives Media Slant? Evidence from U.S. Daily Newspapers, Econometrica 78(1): 35-71.
Gentzkow M. and J. M. Shapiro (2010b). Ideological Segregation Online and Offline,
Quarterly Journal of Economics 126(4): 1799-1839.
28
Gentzkow, M., J. Shapiro, and M. Sinkinson (2011). The Effect of Newspaper Entry and Exit
on Electoral Politics, American Economic Review, 101: 2980–3018.
Initiative D21 (2010). (N)ONLINER Atlas 2010. Berlin.
Kolko, J. (2012). Broadband and Local Growth. Journal of Urban Economics 71(1): 100-113.
Liebowitz, S. J., and A. Zentner (2011). Clash of the Titans: Does Internet Use Reduce Television Viewing? Review of Economics Statistics, forthcoming.
McMillan, J. and P. Zoido (2004). How to Subvert Democracy: Montesinos in Peru, Journal of Economic Perspectives 18(4): 69-92.
Oberholzer-Gee, F. and J. Waldfogel (2009). Media Markets and Localism: Does Local News en Espanol Boost Hispanic Voter Turnout? American Economic Review 99(5): 2120-28.
Olken, B.A. (2009). Do Television and Radio Destroy Social Capital? Evidence From Indonesian Villages. American Economic Journal: Applied Economics 1(4): 1-33.
Prat, A. and D. Strömberg (2006). Commercial Television and Voter Information. CEPR Discussion Paper No. 4989.
Prat, A. and D. Strömberg (2011). The Political Economy of Mass Media. Stockholm University Working Paper.
Puglisi, R. and J. M. Snyder, Jr. (2011). News Coverage of Political Scandals, Journal of Politics 73(3): 931-950.
Putnam, R. D. (1993). Making Democracy Work. Civic Traditions in Modern Italy. Princeton, NJ: Princeton University Press.
Putnam, R.D. (2000). Bowling Alone : The Collapse and Revival of American Community. New York: Simon & Schuster.
Snyder, J. M. and D. Strömberg (2010). Press Coverage and Political Accountability. Journal of Political Economy 118(2): 355-408.
Strömberg, D. (2004a). Radios Impact on Public Spending. Quarterly Journal of Economics 119(1):189-221.
Strömberg, D. (2004b). Mass Media Competition, Political Competition, and Public Policy. Review of Economic Studies 71(1): 265-284.
Sunstein, C. R. (2001). Republic.com. Princeton, NJ: Princeton University Press.
Voigtlaender, N. and J. Voth (2012). Persecution Perpetuated: Medieval of Anti-Semitic Violence in Nazi Germany, Quarterly Journal of Economics, forthcoming.
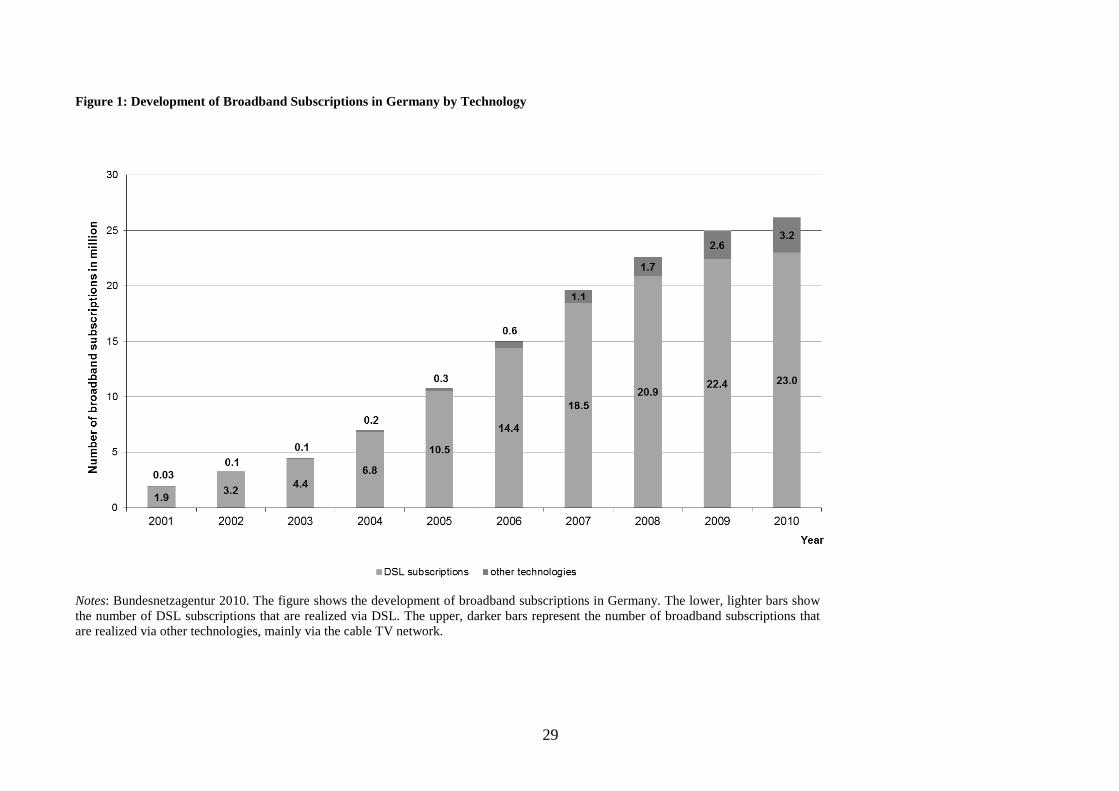
29
Figure 1: Development of Broadband Subscriptions in Germany by Technology
Notes: Bundesnetzagentur 2010. The figure shows the development of broadband subscriptions in Germany. The lower, lighter bars show the number of DSL subscriptions that are realized via DSL. The upper, darker bars represent the number of broadband subscriptions that are realized via other technologies, mainly via the cable TV network.
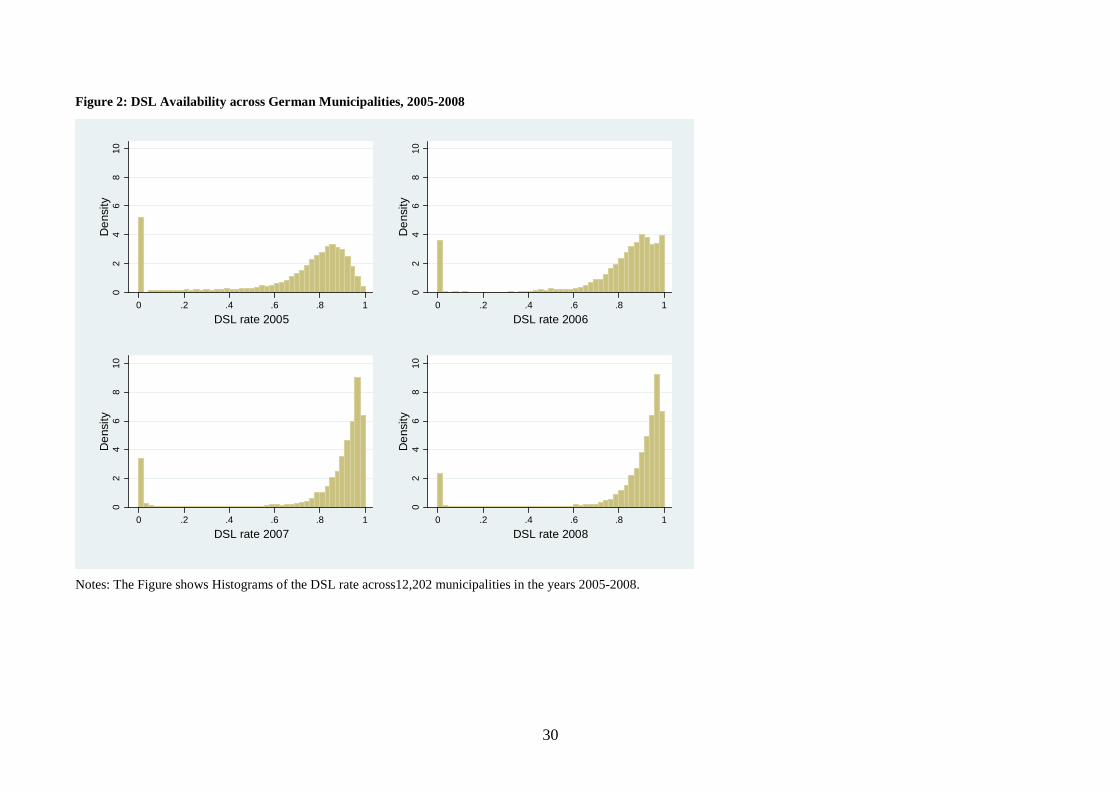
30
Figure 2: DSL Availability across German Municipalities, 2005-2008
Notes: The Figure shows Histograms of the DSL rate across12,202 municipalities in the years 2005-2008.
02
46
810
Den
sity
0 .2 .4 .6 .8 1DSL rate 2005
02
46
810
Den
sity
0 .2 .4 .6 .8 1DSL rate 2006
02
46
810
Den
sity
0 .2 .4 .6 .8 1DSL rate 2007
02
46
810
Den
sity
0 .2 .4 .6 .8 1DSL rate 2008
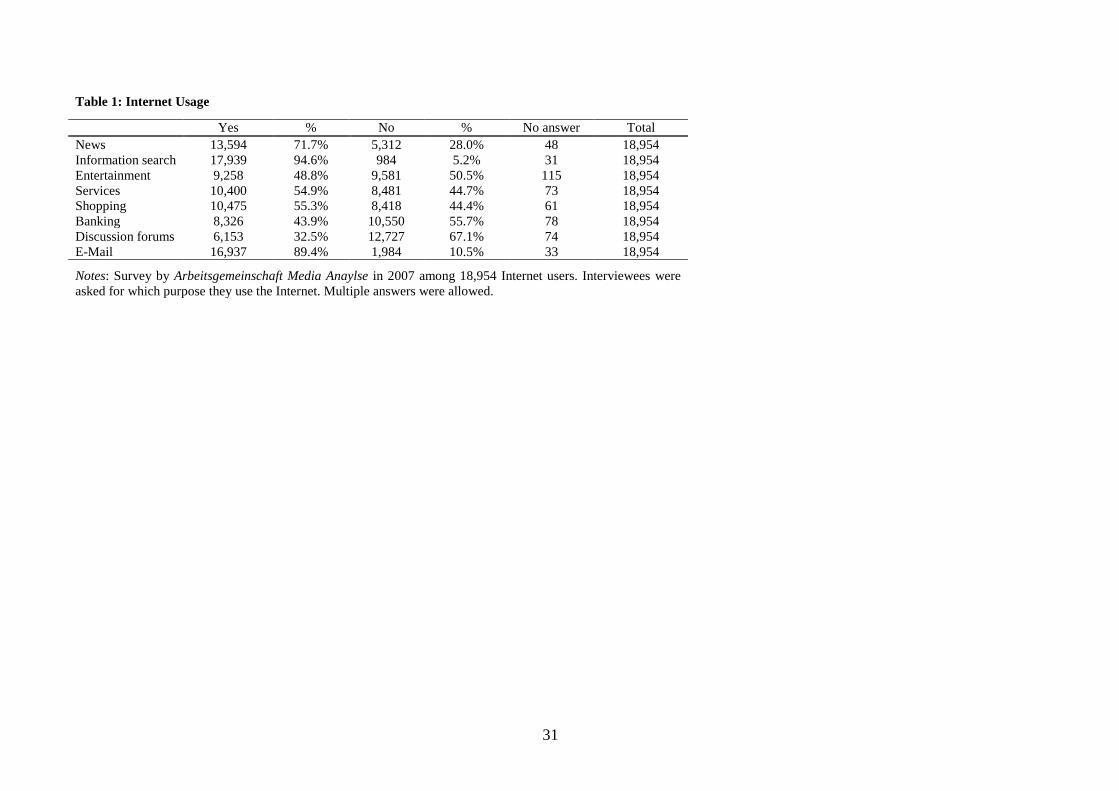
31
Table 1: Internet Usage
Yes % No % No answer Total News 13,594 71.7% 5,312 28.0% 48 18,954 Information search 17,939 94.6% 984 5.2% 31 18,954 Entertainment 9,258 48.8% 9,581 50.5% 115 18,954 Services 10,400 54.9% 8,481 44.7% 73 18,954 Shopping 10,475 55.3% 8,418 44.4% 61 18,954 Banking 8,326 43.9% 10,550 55.7% 78 18,954 Discussion forums 6,153 32.5% 12,727 67.1% 74 18,954 E-Mail 16,937 89.4% 1,984 10.5% 33 18,954
Notes: Survey by Arbeitsgemeinschaft Media Anaylse in 2007 among 18,954 Internet users. Interviewees were asked for which purpose they use the Internet. Multiple answers were allowed.
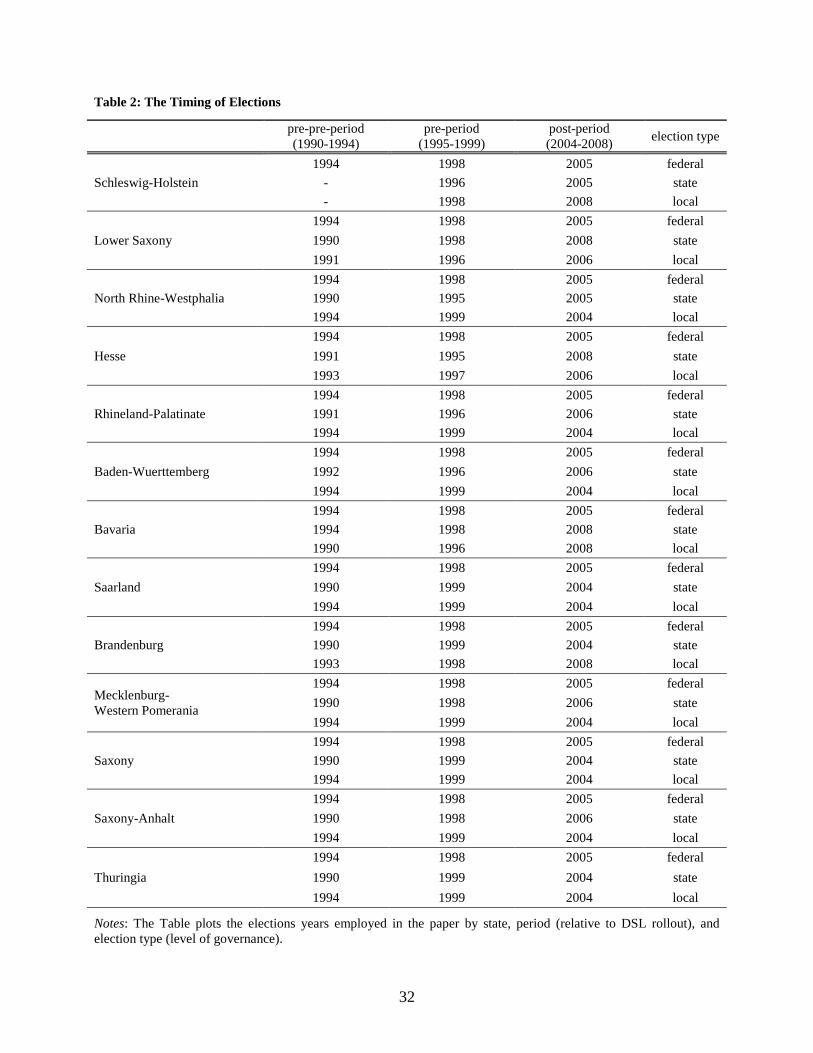
32
Table 2: The Timing of Elections
pre-pre-period (1990-1994)
pre-period (1995-1999)
post-period (2004-2008) election type
Schleswig-Holstein 1994 1998 2005 federal
- 1996 2005 state - 1998 2008 local
Lower Saxony 1994 1998 2005 federal 1990 1998 2008 state 1991 1996 2006 local
North Rhine-Westphalia 1994 1998 2005 federal 1990 1995 2005 state 1994 1999 2004 local
Hesse 1994 1998 2005 federal 1991 1995 2008 state 1993 1997 2006 local
Rhineland-Palatinate 1994 1998 2005 federal 1991 1996 2006 state 1994 1999 2004 local
Baden-Wuerttemberg 1994 1998 2005 federal 1992 1996 2006 state 1994 1999 2004 local
Bavaria 1994 1998 2005 federal 1994 1998 2008 state 1990 1996 2008 local
Saarland 1994 1998 2005 federal 1990 1999 2004 state 1994 1999 2004 local
Brandenburg 1994 1998 2005 federal 1990 1999 2004 state 1993 1998 2008 local
Mecklenburg- Western Pomerania
1994 1998 2005 federal 1990 1998 2006 state 1994 1999 2004 local
Saxony 1994 1998 2005 federal 1990 1999 2004 state 1994 1999 2004 local
Saxony-Anhalt 1994 1998 2005 federal 1990 1998 2006 state 1994 1999 2004 local
Thuringia 1994 1998 2005 federal 1990 1999 2004 state 1994 1999 2004 local
Notes: The Table plots the elections years employed in the paper by state, period (relative to DSL rollout), and election type (level of governance).
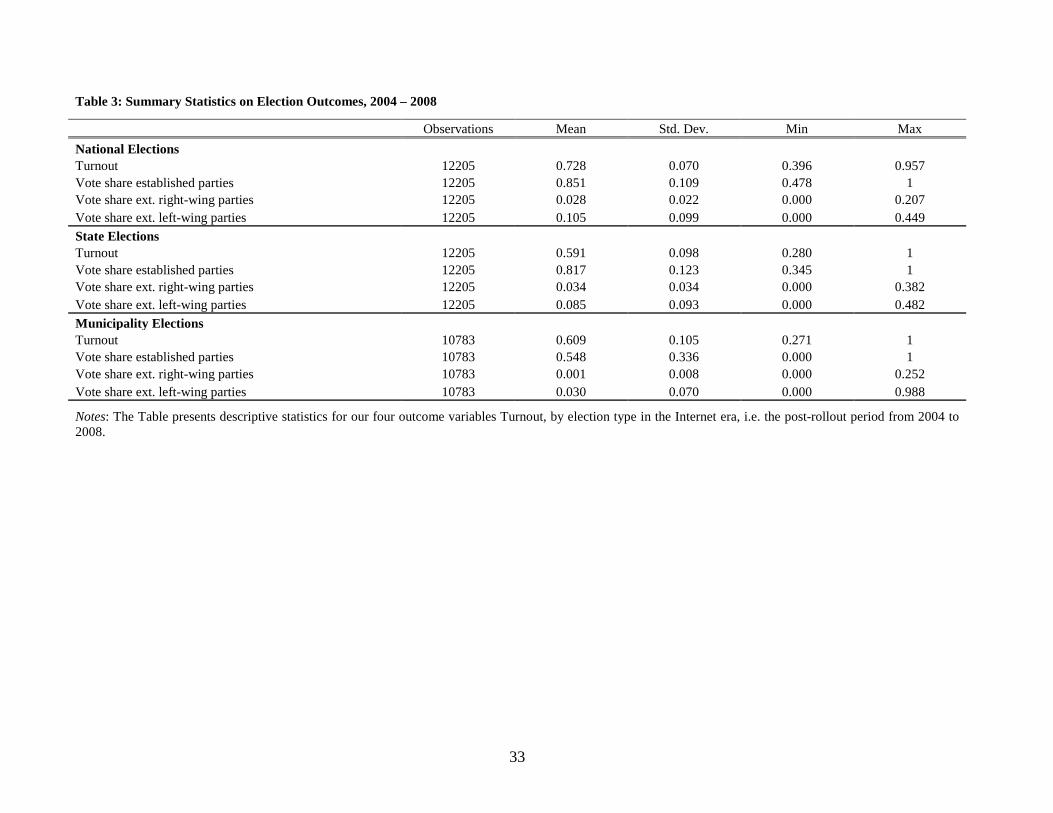
33
Table 3: Summary Statistics on Election Outcomes, 2004 – 2008
Observations Mean Std. Dev. Min Max
National Elections Turnout 12205 0.728 0.070 0.396 0.957
Vote share established parties 12205 0.851 0.109 0.478 1 Vote share ext. right-wing parties 12205 0.028 0.022 0.000 0.207 Vote share ext. left-wing parties 12205 0.105 0.099 0.000 0.449 State Elections
Turnout 12205 0.591 0.098 0.280 1 Vote share established parties 12205 0.817 0.123 0.345 1 Vote share ext. right-wing parties 12205 0.034 0.034 0.000 0.382 Vote share ext. left-wing parties 12205 0.085 0.093 0.000 0.482 Municipality Elections
Turnout 10783 0.609 0.105 0.271 1 Vote share established parties 10783 0.548 0.336 0.000 1 Vote share ext. right-wing parties 10783 0.001 0.008 0.000 0.252 Vote share ext. left-wing parties 10783 0.030 0.070 0.000 0.988
Notes: The Table presents descriptive statistics for our four outcome variables Turnout, by election type in the Internet era, i.e. the post-rollout period from 2004 to 2008.
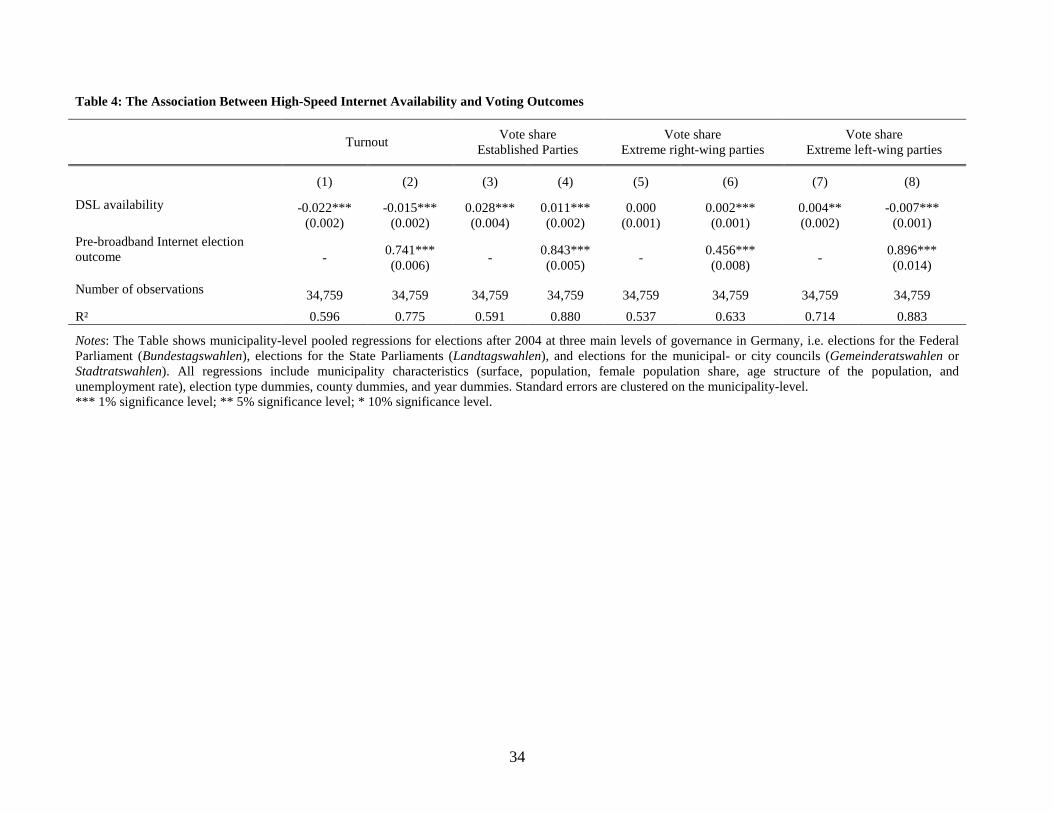
34
Table 4: The Association Between High-Speed Internet Availability and Voting Outcomes
Turnout Vote share
Established Parties Vote share
Extreme right-wing parties Vote share
Extreme left-wing parties
(1) (2) (3) (4) (5) (6) (7) (8)
DSL availability -0.022*** (0.002)
-0.015*** (0.002)
0.028*** (0.004)
0.011*** (0.002)
0.000 (0.001)
0.002*** (0.001)
0.004** (0.002)
-0.007*** (0.001)
Pre-broadband Internet election outcome - 0.741***
(0.006) - 0.843*** (0.005) - 0.456***
(0.008) - 0.896*** (0.014)
Number of observations 34,759 34,759 34,759 34,759 34,759 34,759 34,759 34,759 R² 0.596 0.775 0.591 0.880 0.537 0.633 0.714 0.883
Notes: The Table shows municipality-level pooled regressions for elections after 2004 at three main levels of governance in Germany, i.e. elections for the Federal Parliament (Bundestagswahlen), elections for the State Parliaments (Landtagswahlen), and elections for the municipal- or city councils (Gemeinderatswahlen or Stadtratswahlen). All regressions include municipality characteristics (surface, population, female population share, age structure of the population, and unemployment rate), election type dummies, county dummies, and year dummies. Standard errors are clustered on the municipality-level. *** 1% significance level; ** 5% significance level; * 10% significance level.
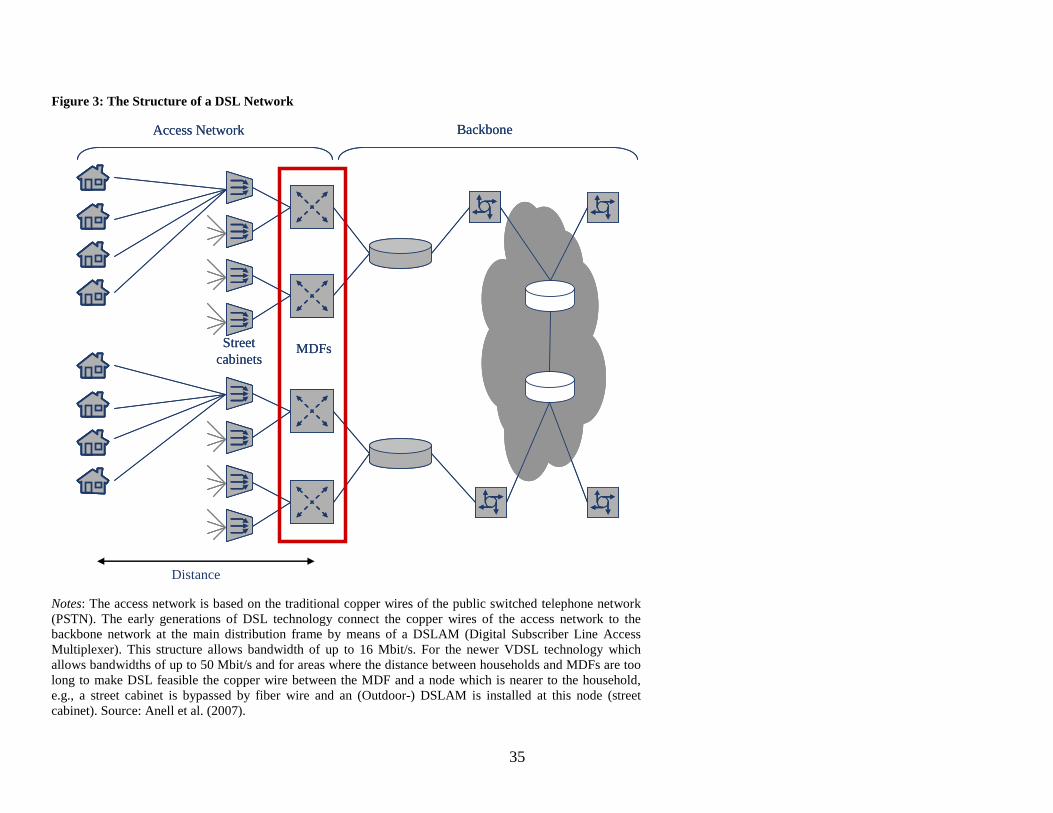
35
Figure 3: The Structure of a DSL Network
Notes: The access network is based on the traditional copper wires of the public switched telephone network (PSTN). The early generations of DSL technology connect the copper wires of the access network to the backbone network at the main distribution frame by means of a DSLAM (Digital Subscriber Line Access Multiplexer). This structure allows bandwidth of up to 16 Mbit/s. For the newer VDSL technology which allows bandwidths of up to 50 Mbit/s and for areas where the distance between households and MDFs are too long to make DSL feasible the copper wire between the MDF and a node which is nearer to the household, e.g., a street cabinet is bypassed by fiber wire and an (Outdoor-) DSLAM is installed at this node (street cabinet). Source: Anell et al. (2007).
Streetcabinets
MDFs
BackboneAccess Network
Streetcabinets
MDFs
BackboneAccess Network
Distance
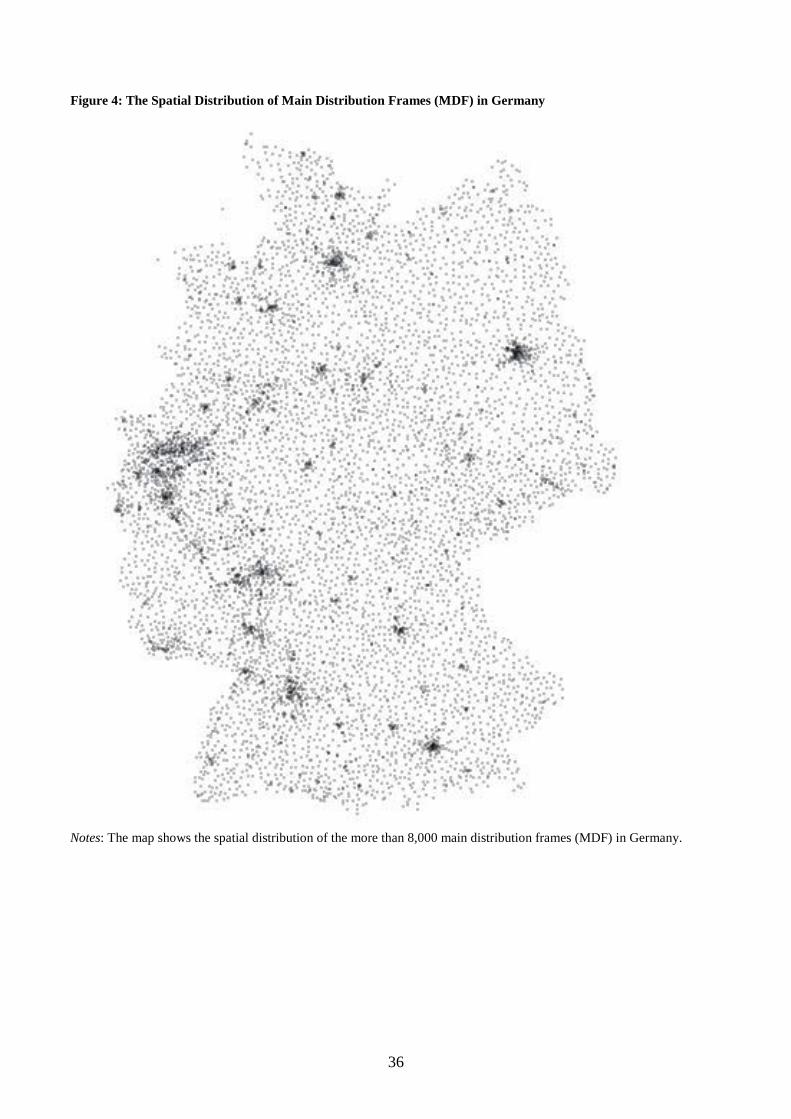
36
Figure 4: The Spatial Distribution of Main Distribution Frames (MDF) in Germany
Notes: The map shows the spatial distribution of the more than 8,000 main distribution frames (MDF) in Germany.
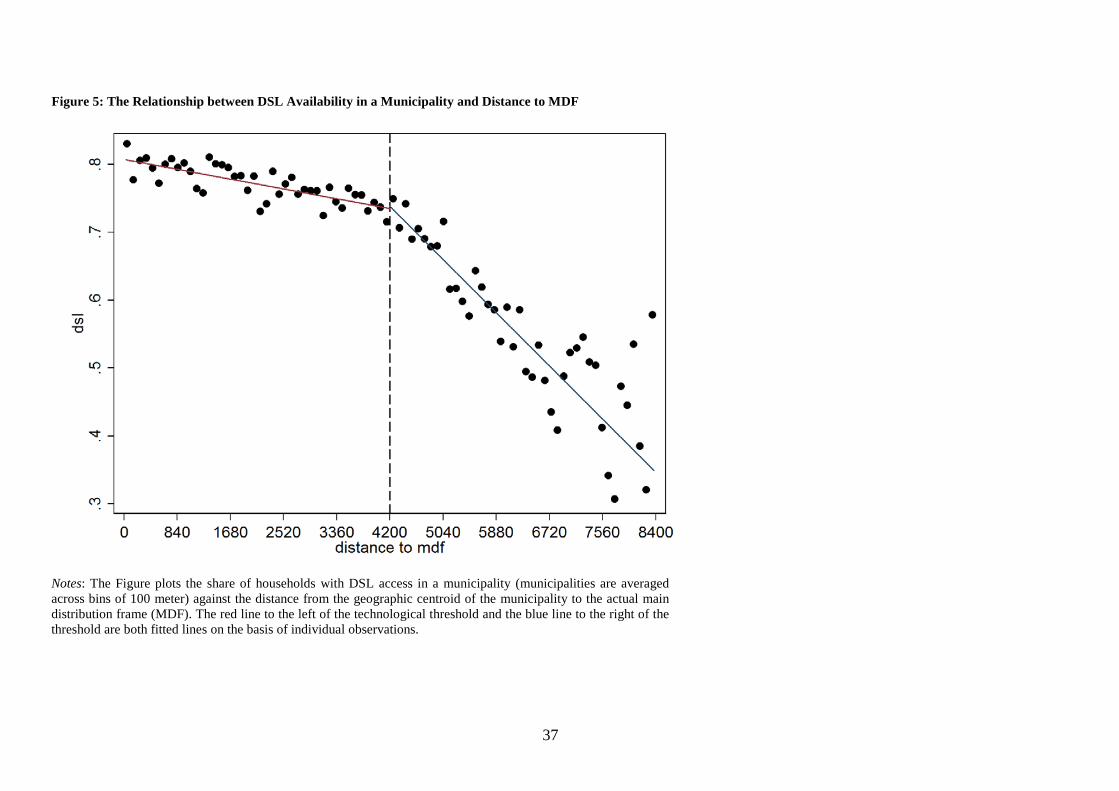
37
Figure 5: The Relationship between DSL Availability in a Municipality and Distance to MDF
Notes: The Figure plots the share of households with DSL access in a municipality (municipalities are averaged across bins of 100 meter) against the distance from the geographic centroid of the municipality to the actual main distribution frame (MDF). The red line to the left of the technological threshold and the blue line to the right of the threshold are both fitted lines on the basis of individual observations.

38
Figure 6: The Geographic Layout of Telephone Access Areas in Germany
Notes: The map shows the geographic layout of the more than 5,000 telephone access areas in Germany.
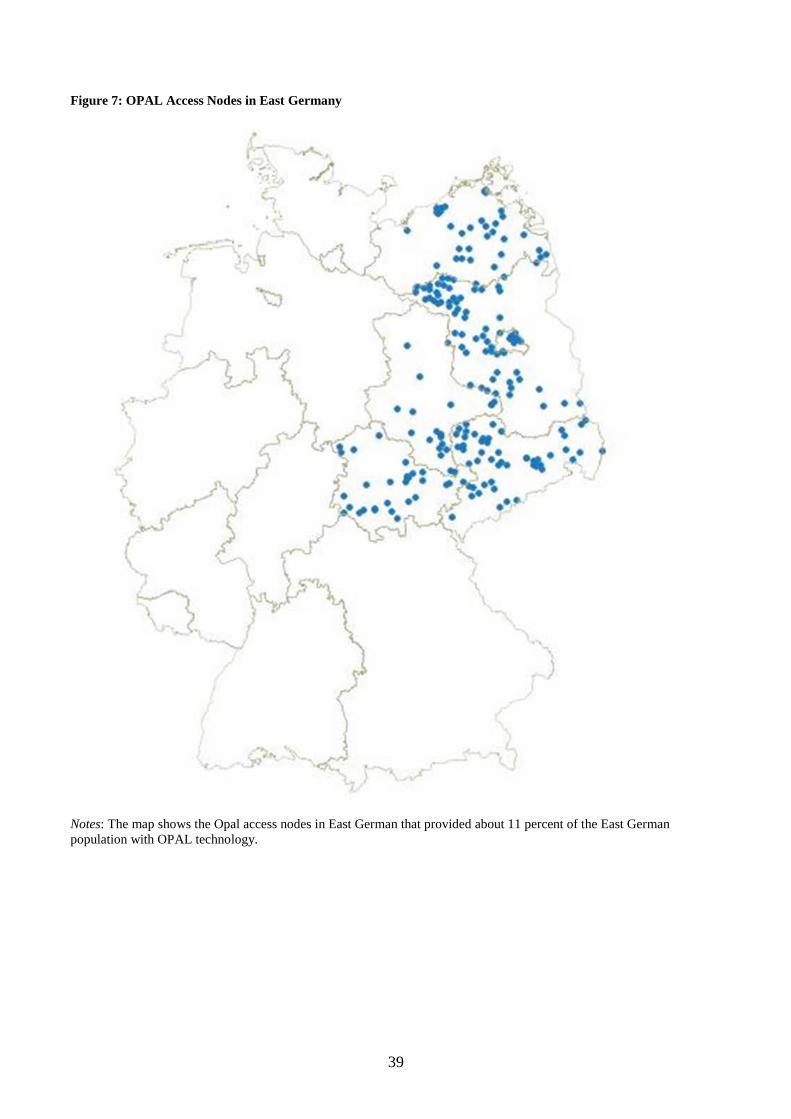
39
Figure 7: OPAL Access Nodes in East Germany
Notes: The map shows the Opal access nodes in East German that provided about 11 percent of the East German population with OPAL technology.
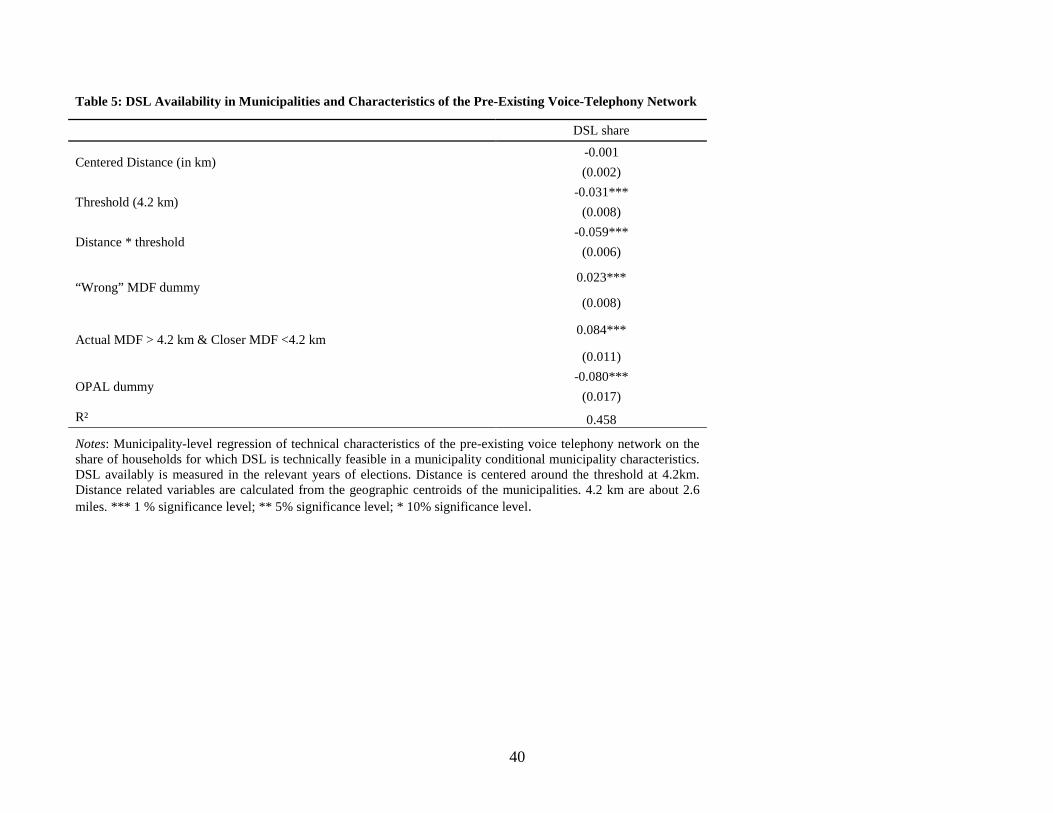
40
Table 5: DSL Availability in Municipalities and Characteristics of the Pre-Existing Voice-Telephony Network
DSL share
Centered Distance (in km) -0.001 (0.002)
Threshold (4.2 km) -0.031***
(0.008)
Distance * threshold -0.059***
(0.006)
“Wrong” MDF dummy 0.023***
(0.008)
Actual MDF > 4.2 km & Closer MDF <4.2 km 0.084***
(0.011)
OPAL dummy -0.080***
(0.017) R² 0.458
Notes: Municipality-level regression of technical characteristics of the pre-existing voice telephony network on the share of households for which DSL is technically feasible in a municipality conditional municipality characteristics. DSL availably is measured in the relevant years of elections. Distance is centered around the threshold at 4.2km. Distance related variables are calculated from the geographic centroids of the municipalities. 4.2 km are about 2.6 miles. *** 1 % significance level; ** 5% significance level; * 10% significance level.
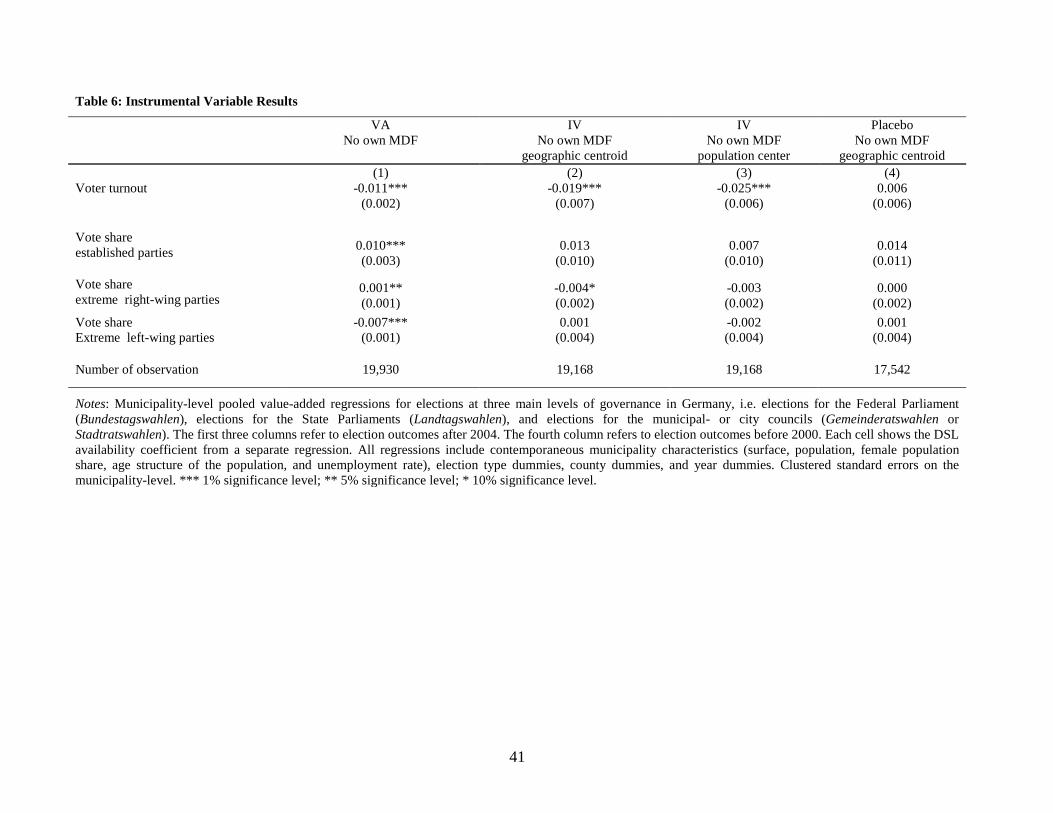
41
Table 6: Instrumental Variable Results
VA No own MDF
IV No own MDF
geographic centroid
IV No own MDF
population center
Placebo No own MDF
geographic centroid (1) (2) (3) (4)
Voter turnout -0.011*** (0.002)
-0.019*** (0.007)
-0.025*** (0.006)
0.006 (0.006)
Vote share established parties 0.010***
(0.003) 0.013
(0.010) 0.007
(0.010) 0.014
(0.011)
Vote share extreme right-wing parties
0.001** (0.001)
-0.004* (0.002)
-0.003 (0.002)
0.000 (0.002)
Vote share Extreme left-wing parties
-0.007*** (0.001)
0.001 (0.004)
-0.002 (0.004)
0.001 (0.004)
Number of observation 19,930 19,168 19,168 17,542
Notes: Municipality-level pooled value-added regressions for elections at three main levels of governance in Germany, i.e. elections for the Federal Parliament (Bundestagswahlen), elections for the State Parliaments (Landtagswahlen), and elections for the municipal- or city councils (Gemeinderatswahlen or Stadtratswahlen). The first three columns refer to election outcomes after 2004. The fourth column refers to election outcomes before 2000. Each cell shows the DSL availability coefficient from a separate regression. All regressions include contemporaneous municipality characteristics (surface, population, female population share, age structure of the population, and unemployment rate), election type dummies, county dummies, and year dummies. Clustered standard errors on the municipality-level. *** 1% significance level; ** 5% significance level; * 10% significance level.
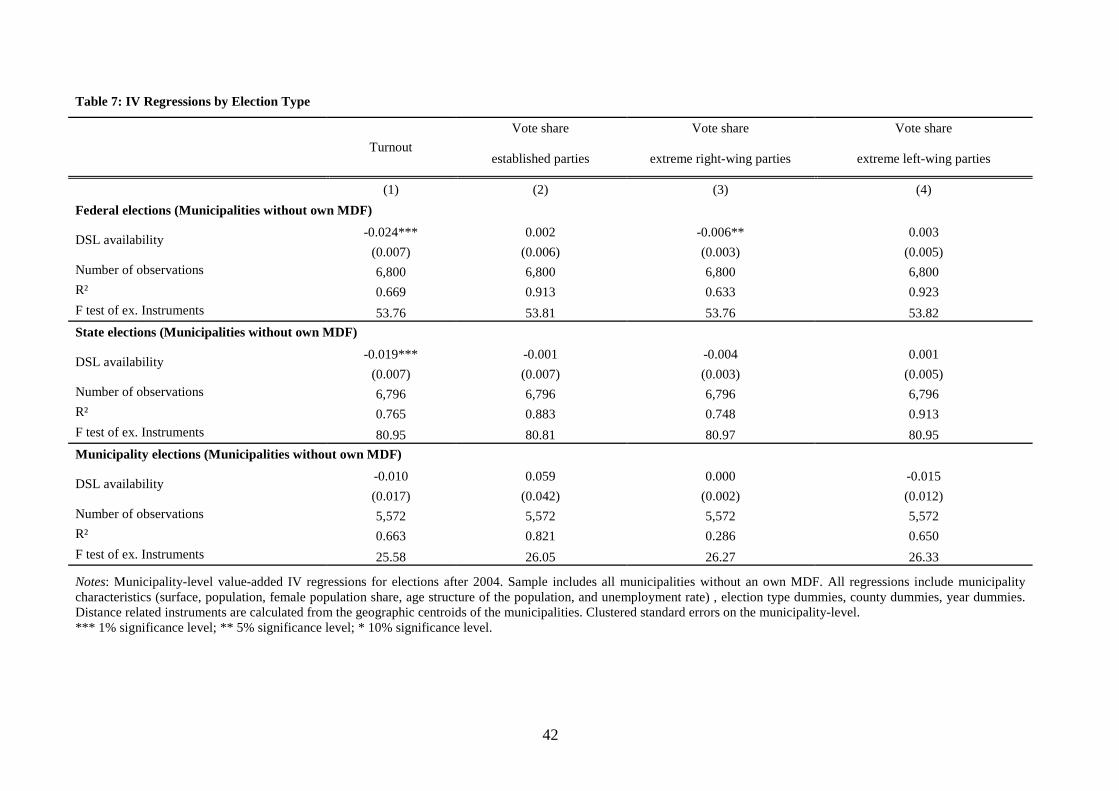
42
Table 7: IV Regressions by Election Type
Turnout Vote share Vote share Vote share
established parties extreme right-wing parties extreme left-wing parties
(1) (2) (3) (4) Federal elections (Municipalities without own MDF)
DSL availability -0.024*** 0.002 -0.006** 0.003 (0.007) (0.006) (0.003) (0.005)
Number of observations 6,800 6,800 6,800 6,800 R² 0.669 0.913 0.633 0.923 F test of ex. Instruments 53.76 53.81 53.76 53.82 State elections (Municipalities without own MDF)
DSL availability -0.019*** -0.001 -0.004 0.001 (0.007) (0.007) (0.003) (0.005)
Number of observations 6,796 6,796 6,796 6,796 R² 0.765 0.883 0.748 0.913 F test of ex. Instruments 80.95 80.81 80.97 80.95 Municipality elections (Municipalities without own MDF)
DSL availability -0.010 0.059 0.000 -0.015 (0.017) (0.042) (0.002) (0.012)
Number of observations 5,572 5,572 5,572 5,572 R² 0.663 0.821 0.286 0.650 F test of ex. Instruments 25.58 26.05 26.27 26.33
Notes: Municipality-level value-added IV regressions for elections after 2004. Sample includes all municipalities without an own MDF. All regressions include municipality characteristics (surface, population, female population share, age structure of the population, and unemployment rate) , election type dummies, county dummies, year dummies. Distance related instruments are calculated from the geographic centroids of the municipalities. Clustered standard errors on the municipality-level. *** 1% significance level; ** 5% significance level; * 10% significance level.
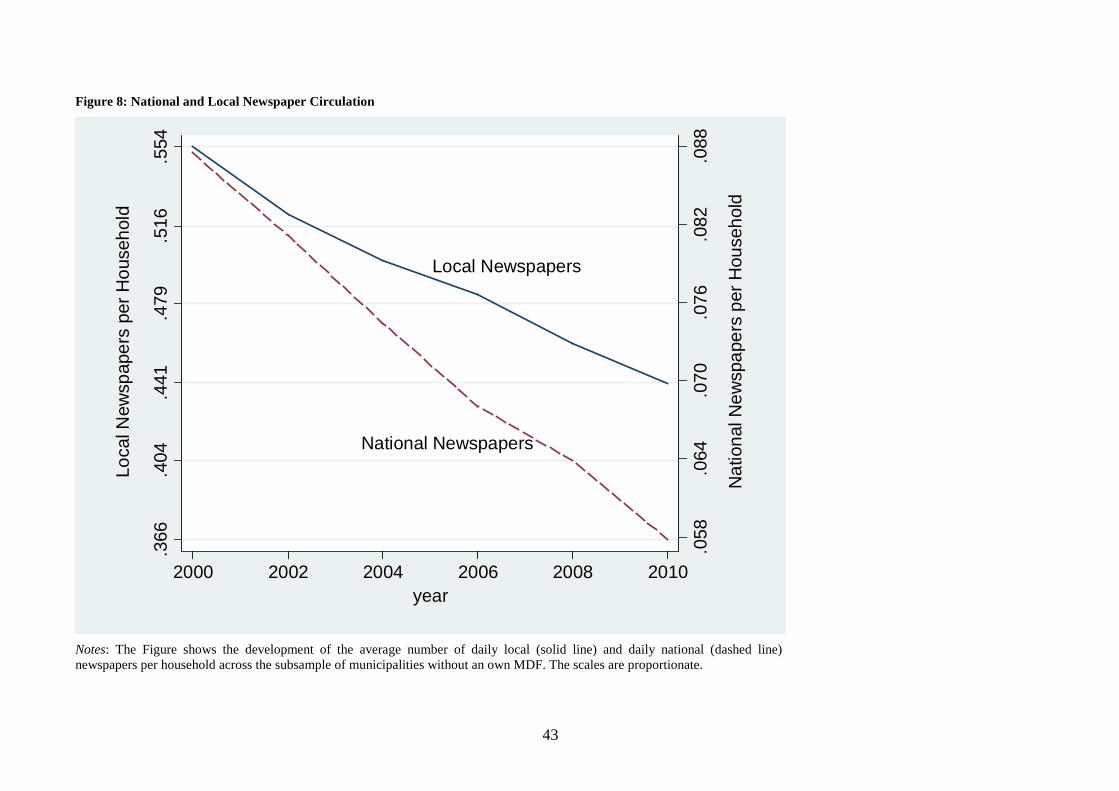
43
Figure 8: National and Local Newspaper Circulation
Notes: The Figure shows the development of the average number of daily local (solid line) and daily national (dashed line) newspapers per household across the subsample of municipalities without an own MDF. The scales are proportionate.
National Newspapers
Local Newspapers
.058
.064
.070
.076
.082
.088
Nat
iona
l New
spap
ers
per H
ouse
hold
.366
.404
.441
.479
.516
.554
Loca
l New
spap
ers
per H
ouse
hold
2000 2002 2004 2006 2008 2010year
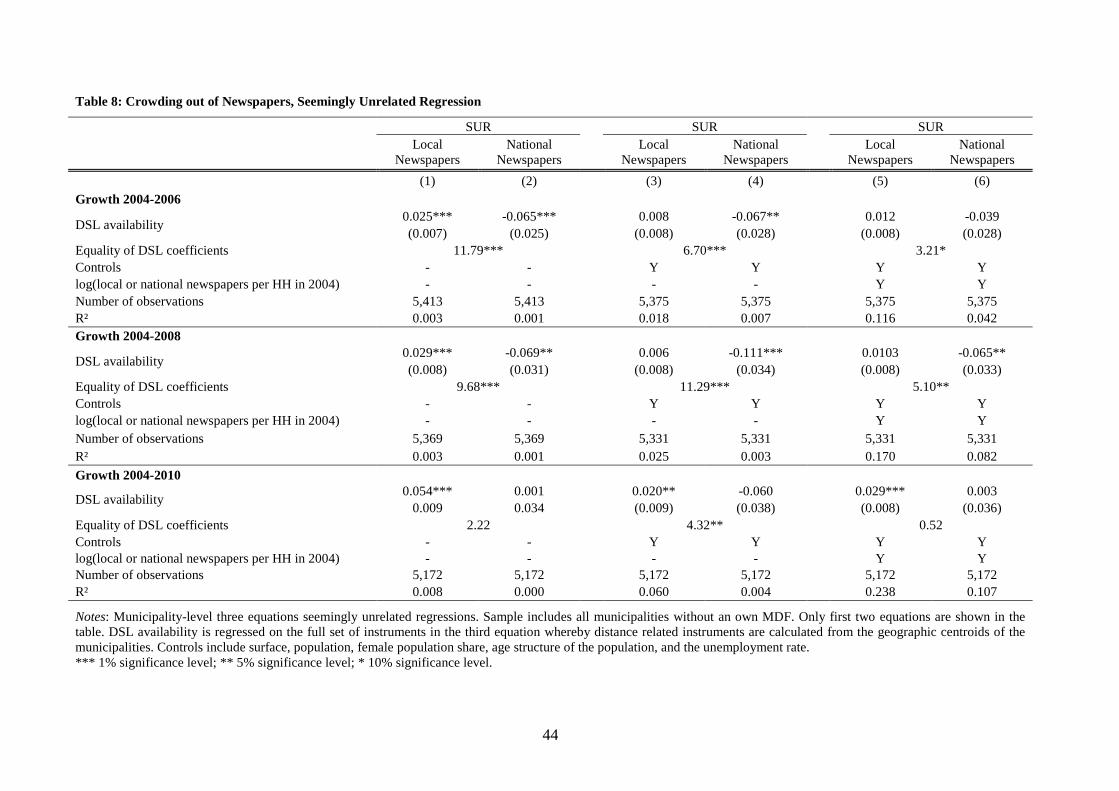
44
Table 8: Crowding out of Newspapers, Seemingly Unrelated Regression
SUR SUR SUR
Local Newspapers
National Newspapers Local
Newspapers National
Newspapers Local Newspapers
National Newspapers
(1) (2) (3) (4) (5) (6) Growth 2004-2006
DSL availability 0.025*** -0.065*** 0.008 -0.067** 0.012 -0.039 (0.007) (0.025) (0.008) (0.028) (0.008) (0.028)
Equality of DSL coefficients 11.79*** 6.70*** 3.21* Controls - - Y Y Y Y log(local or national newspapers per HH in 2004) - - - - Y Y Number of observations 5,413 5,413 5,375 5,375 5,375 5,375 R² 0.003 0.001 0.018 0.007 0.116 0.042 Growth 2004-2008 DSL availability 0.029*** -0.069** 0.006 -0.111*** 0.0103 -0.065**
(0.008) (0.031) (0.008) (0.034) (0.008) (0.033) Equality of DSL coefficients 9.68*** 11.29*** 5.10** Controls - - Y Y Y Y log(local or national newspapers per HH in 2004) - - - - Y Y Number of observations 5,369 5,369 5,331 5,331 5,331 5,331 R² 0.003 0.001 0.025 0.003 0.170 0.082 Growth 2004-2010 DSL availability 0.054*** 0.001 0.020** -0.060 0.029*** 0.003
0.009 0.034 (0.009) (0.038) (0.008) (0.036) Equality of DSL coefficients 2.22 4.32** 0.52 Controls - - Y Y Y Y log(local or national newspapers per HH in 2004) - - - - Y Y Number of observations 5,172 5,172 5,172 5,172 5,172 5,172 R² 0.008 0.000 0.060 0.004 0.238 0.107
Notes: Municipality-level three equations seemingly unrelated regressions. Sample includes all municipalities without an own MDF. Only first two equations are shown in the table. DSL availability is regressed on the full set of instruments in the third equation whereby distance related instruments are calculated from the geographic centroids of the municipalities. Controls include surface, population, female population share, age structure of the population, and the unemployment rate. *** 1% significance level; ** 5% significance level; * 10% significance level.
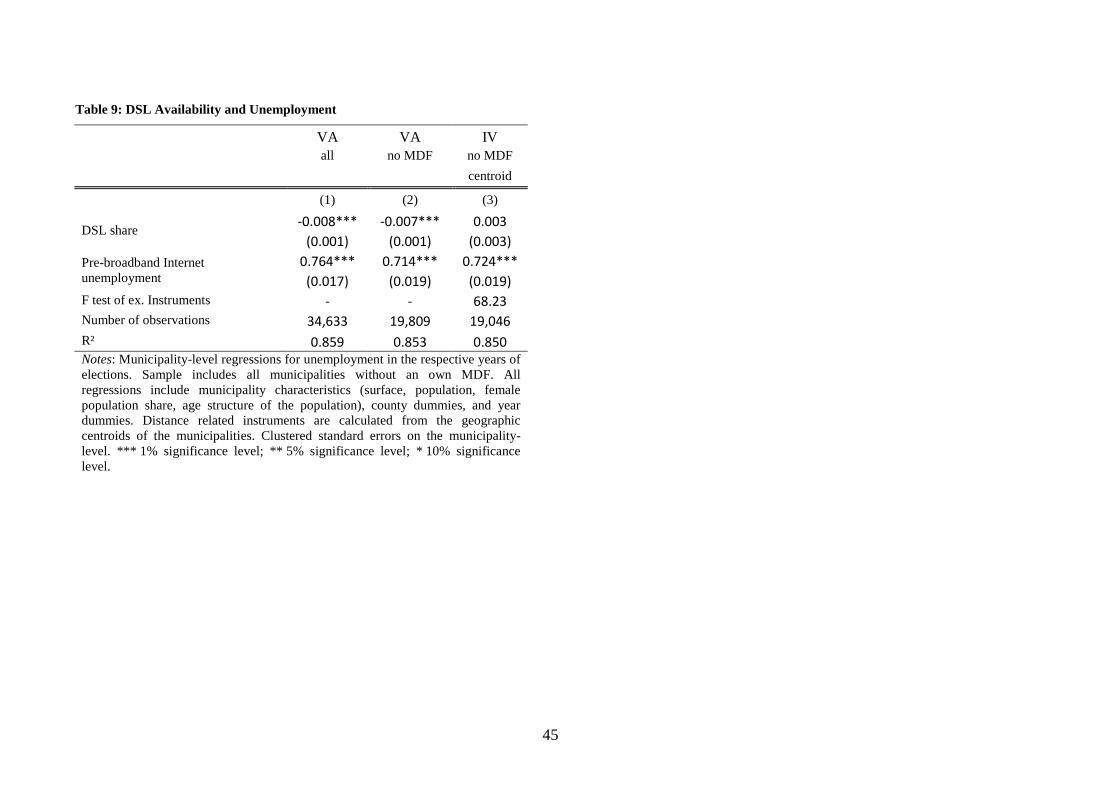
45
Table 9: DSL Availability and Unemployment
VA VA IV
all no MDF no MDF
centroid
(1) (2) (3)
DSL share -0.008*** -0.007*** 0.003 (0.001) (0.001) (0.003)
Pre-broadband Internet unemployment
0.764*** 0.714*** 0.724*** (0.017) (0.019) (0.019)
F test of ex. Instruments - - 68.23 Number of observations 34,633 19,809 19,046 R² 0.859 0.853 0.850 Notes: Municipality-level regressions for unemployment in the respective years of elections. Sample includes all municipalities without an own MDF. All regressions include municipality characteristics (surface, population, female population share, age structure of the population), county dummies, and year dummies. Distance related instruments are calculated from the geographic centroids of the municipalities. Clustered standard errors on the municipality-level. *** 1% significance level; ** 5% significance level; * 10% significance level.