Embed Size (px)
Citation preview
DYFS Runaway Study
l?repared.by:
Nichae1 C. Tomaszewicz Bureau. of Research May 19, 1978
\
If you have issues viewing or accessing this file contact us at NCJRS.gov.
JUL1 91979·
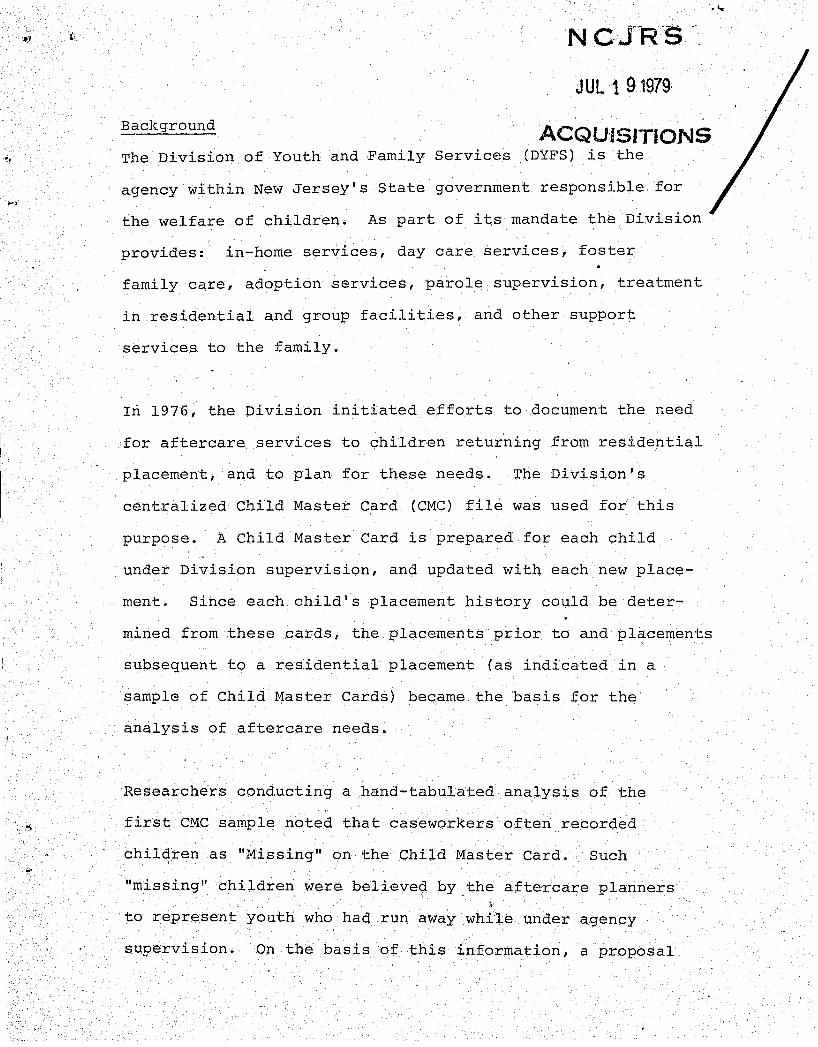
Background ACQU'ISJTIONS
The Division of Youth and Family Services (DYFS) is the
agency within New Jersey's State government responsible for
the welfare of children. As part of its mandate the Division
provides: in-home services, day care services, foster
family care, adoption services, parole supervision, treatment
in residential and group facilities, and other support
services to the family.
In 1976, the Division initiated efforts to document the need
for aftercare services to children returning from residential
placement, and to plan for these needs. The Division's
centralized Child Master Card (CMC) file was used for this
purpose. A Child Master Card is prepared for each child
under Division supervision, and updated with each new place-
mente Since each child's placement history could be deter-
mined from these cards, the placements prior to and placements
subsequent to a residential placement (as indicated in a
sample of Child Master Cards) became. the basis for the
analysis of aftercare needs.
Research~rs conducting a hand-tabulated analysis of the
first CMC sample noted that caseworkers often recorded
children as "Missing" on the Child Master Card. Such
"missing" children were believed by.the aftercare planners
to represent youth who had run away white under agency
supervision. On th~ basis of this information, a proposal
-2--
was prepared and submitted to the Region II Office of Youth
Development for a sma.ll grant to study patterns of runaway
behavior a:;:nong these "missing" children. A copy of this
proposal is attached as Appendix A.
Objectives
The proposal requested $700.00 to provide for keypunching
and c?mputer analyses of. representative sampl~s selected
from the Child Master Cards. The products to be developed
included:
1) a statistical profile of youth who had runaway while under Division supervision including demographic characteristics, the typestof living situations these children had run away from, and the types of living situations these children had experienced upon return from their runaway experience.
2) an analysis of placement histories to determine if -Division placement practices had encouraged children to runaway.
3) an analysis of the placement histories of children returning from long-term residential treatment (in lieu of juvenile correction placement) to identify which children fail to readjust to the community.
A draft ~f a report prepared in accord~nce with the proposal
was submitted to Region II, DHEW on August 19, 1977. As a
part of the revision to the initial draft, a computer analysis
of the Child Master Record (CMR) was made to provide addition-
al data on runaways in an average daily caseload (12/31/75).
Unlike the Child Master Card samples, in which only children
.it! •
-3-
ten years old or older had been analyzed, the CMR analysis
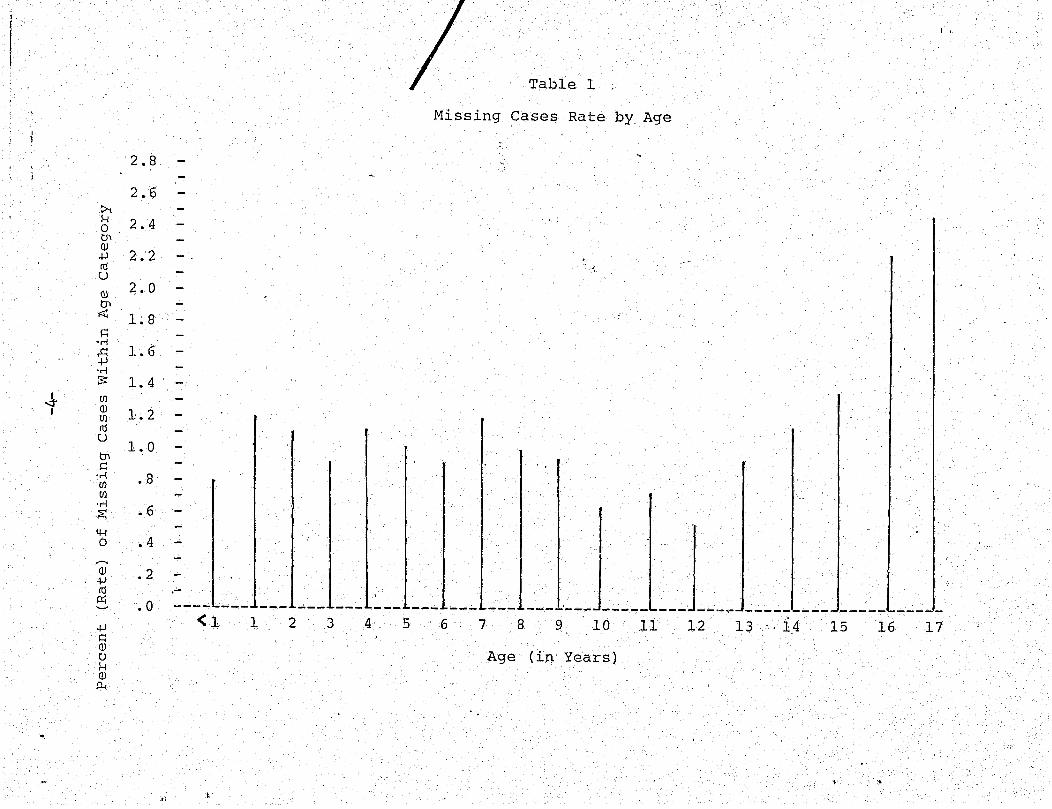
was not restricted by age. Table 1 presents the results of
this analysis. Children "missing" as of 12/31/75 are ,cross
tabulated by age.
On a percentage -basis, more children under DYFS supervision
on 12/31/75 who were less than nine years of age were "missing"
than children ten, eleven, twelve or thirteen years of age.
The missing rate among one year olds (1.2%) was nearly as
large as the missing rate for thirteen year olds (1.4%).
Logic dictates that preschool age children should not be
running away at the same rate as teen-agers. Further
research revealed that there is a dual meaning to the official
designation, "missing," used on the agency document that
forms the basis for the centralized records investigated in
this study. This original or source document is a Transaction
Form which is completed by a caseworker every time there is
a change in a client's status. A Transaction Form could
occasionally be filed because the client was missing by
virtue of an unreported change in his/her family's residence,
rather than by virtue of running away. The discovery of the
dual meaning of the designation "mtssing" meant that the
aata contained in the first draft submitted to Region II did
not necessarily reflect only youths who had run away. This
is described in greater detail in the following section.
'\
I ,
Table 1 .
Missing Cases Rate by Age
2.8
2.6 ~ H 2.4 0 en OJ
2.2 .j.J ". ClJ U
~.
OJ 2.0 tn
.::r: 1.8 ~
·rl ..c: 1.6 .j.J
'rl 8= 1.4
.1t Ul I OJ 1.2 Ul
ClJ u tn
1.0 ~
·rl · 8 Ul
Ul ·rl .6 ~
lH 0 • 4
OJ · 2 .j.J
ClJ -p:j
· 0 --- --- ---.j.J <1 1 2 3 4 5 6 7 8 9 10 11 12 13 '·14 15 16 17 ~ OJ U H
Age (in Years) OJ
tJ.J
...
; . . ;
-5-
Methodology - Planned vs. Actual
iThe study, as initially planned, required the drawing of two
random samples from the Child Master Card files. The Child
Master Cards (CMC) briefly described above are a set of
noncomputeriz~dcards listing all the "transactions" (and,
hence, all placements) ever completed for an active case. A
history of the placements made for any child can be determined
from an examination of that child's Child Master Card.
A random sample of active cases which had at least one
placement other than with parents, relatives, or foster parents,
was drawn in March, 1976. This sample, referred to in this
report as the Res'idential Placement Sample, was to be used
to study poss,ible relationships between residential placements
made by the Division of Youth and Family Services, and the
propensity of children returning from such placements to run
away.
A second sample, referred to in this, study as the AWOL Sample,
was drawn from the Child Master Cards in July 1976. Unlike
the Residential Placement Sample, the AWOL Sample did not
sample exclusively those youths whose case history reflected
a residential placement; the criterion for selection for the
AWOL sample was only that the youth have a "missing" event
in his/her placement history. The objectives in drawing
this sample were to:
-6-
a) isolate a larger number of runaways for analysis
b) compare the "missing" rate for children in the Division caseload as a whole compared to the missing rate for children who had experienced one or more out-of-home placements.
Information from the Child Master Cards drawn for these two
samples was coded and keypunched. This information was then
used to create two computerized files for each sample. The
first file, denoted by the label Youths, contained basic
demographic information (age, sex, race) for each child
along with his/her placement history. The unit of analysis
is each child.
The second computerized file, labeled Events, contains
information concerning placements made for the children
included in the two samples. The unit of analysis is the
event represented by each placement rather than the children
themselves. Missing events were abstracted from the Child
Master Cards and placed in the computerized file, along with
the placements preceding and following each such missing
event.
The Events file was created to provide information concerning
where the child was living prior to a missing event and
where the child was living following a missing event.
Questions concerning not only the fixed characteristics of
runaway youth, but also about each episode of runaway behavior
were to be addressed in this manner.
-7-
Runaway rates by type of placement could be computed from
analysis of this data, permitting the Division to determine
if children under its supervison were running away more
frequently from foster homes, group homes, residential
treatment centers (RTC's), JINS shelters and other out-of
horne placements' than from their natural homes. This analysis
was conducted and formed the basis for the draft report
submitted on August 19, 1977.
The discovery of the dual meaning of the designa.tion "missing"
led to a drastic revision in the methodology employed in the
study. Young children reported on the CMR and Child Master
Cards as "missing" were probab:1..y given this designation
because their family could not be located by the sociaL
worker assigned to the case. Restricting the analysis to
older children would not permit distinguishing bonafide
runaways and the other type of missing case.
There is, however, reqson to believe that children in out
of-home placements (eg. foster homes or reside:t4ltial facilities)
are much less likely than clients living with parents or
relatives to be designated missing when they are not runaways.
This is bedause foster parents and residential facilities
redeive payment from the Division for maintenance of clients,
whereas parents and relatives do not. Therefore, foster
parents and facilities are not likely to move without notifying
·":8-
the agency. Any clients who are residing outside the home
of parents or relatives and who are designated missing are
probably runaways rather than clients that the caseworker
merely cannot locate.
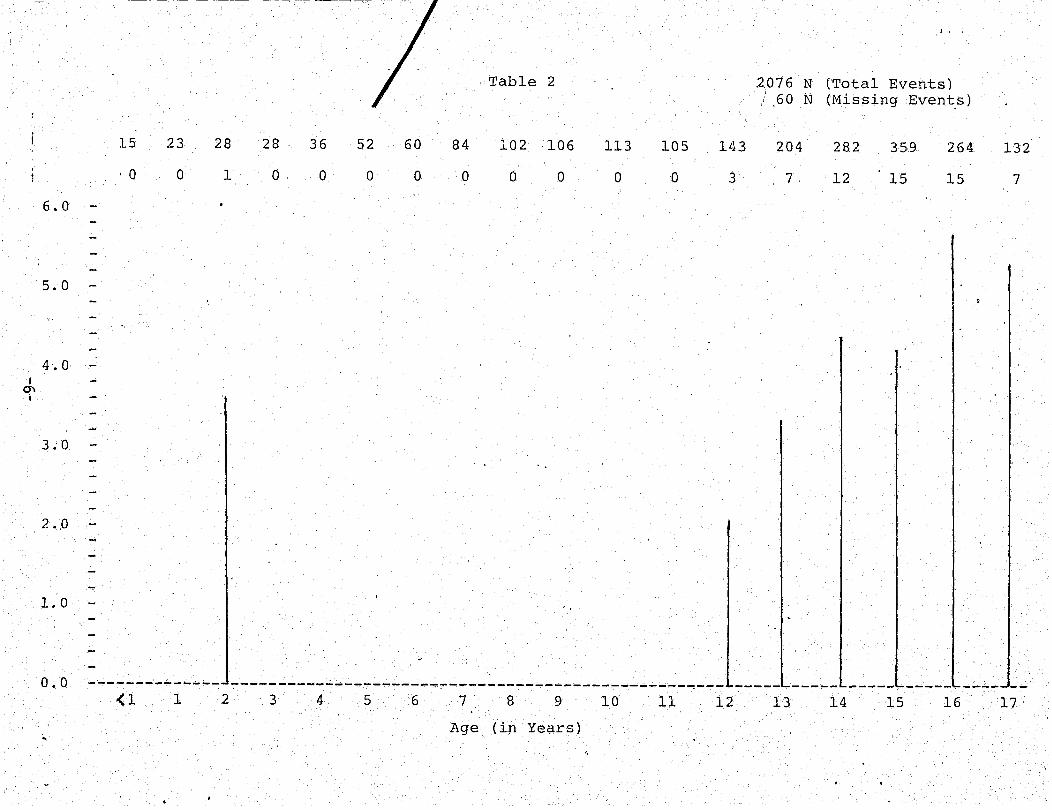
To test this assumption, the age distribution of missing
cases following placement in a foster home was analyzed
using the Events file of the AWOL sC).mple. The results of
this analysis are presented in Table 2.
Table 2 reveals only one "missing" event involving a child
below the age of twelve for children listed as "missing"
from a foster home or other out-of-home placement. Other
than this case, the occurence of "missing" events is consis
tent with'what might logically be expected in terms of the
age at which children are capable of running away.
The findings contained in Table 2 support the contention
that cases designated as "missing" for reasons other than
runaway behavior are confined to cases in which placement in
the home of a parent or relatives occurred immediately
before the runaway event. While this is an inferred conclus
ion, the circumstantial evidence described above is' fairly
conclusive. Because out-of-home placements tend to be
stable, at least in terms of the ability of a caseworker to
physically locate such placements, children "missing" from
• 0\ I
, .
Table 2 2076 N (Total Events) ) .60 N (Missing Event,s)
15 23 28 28 36 52 60 84 102 106 113 105 143 204 282 359 264 132
,0 o 1 o o o o o o 0 o o 3 7 12 15 15 7
6.0
5.0
4.0
3.0
2.0
1.0
0.0 ------------~- ~--------------------~~-------------~--_________ ~--- ________________________ ~_ (I 1 2 3 4 5 6 7 8 9 10 11 12 13 14 15 16 17
Age (in Years)
-10-
such placements represent the most accurate population of
bonafide runaways which could be identified using the Child
Master Cards.
Unfortunately, restricting the analysis to those children
and "missing" events involving probable runaways from a
foster home or otheL out-of-home placement severely limits
the study's usefulness. First, the number of probable
runaway events from such placements included in the sample
through the sampling procedures described in this section is
too small to be statistically manipulated meaningfully.
Second, without a valid group of bonafide runaway events
involving children fleeing from the homes of parents and
relatives, very few conc'lusions can be drawn concerning the
effect of DYFS placement policies in comparison to children
running away from their natural homes.
In light of the severe restrictions of the sample due to the
dual meaning of IImissing", the analys.is contained in this
report should be appreciated as a pilot demonstr~tion of the
kinds of questions that can be addressed using available
agency dat=_ The final section of this report suggests how
these data may be improved so as to generate conclusions in
which more confidence can be placed.
ReE;ults
Tables 3, 4, 5, and 6 present basic de~ogr~phic information
concerning" Youths in the Residentia'IPlacement Sample. As
-11-
described in the previous section, only children who have
been in one or more placements outside of the home of their
parents, relatives, or foster homes were included in this ,
sample.
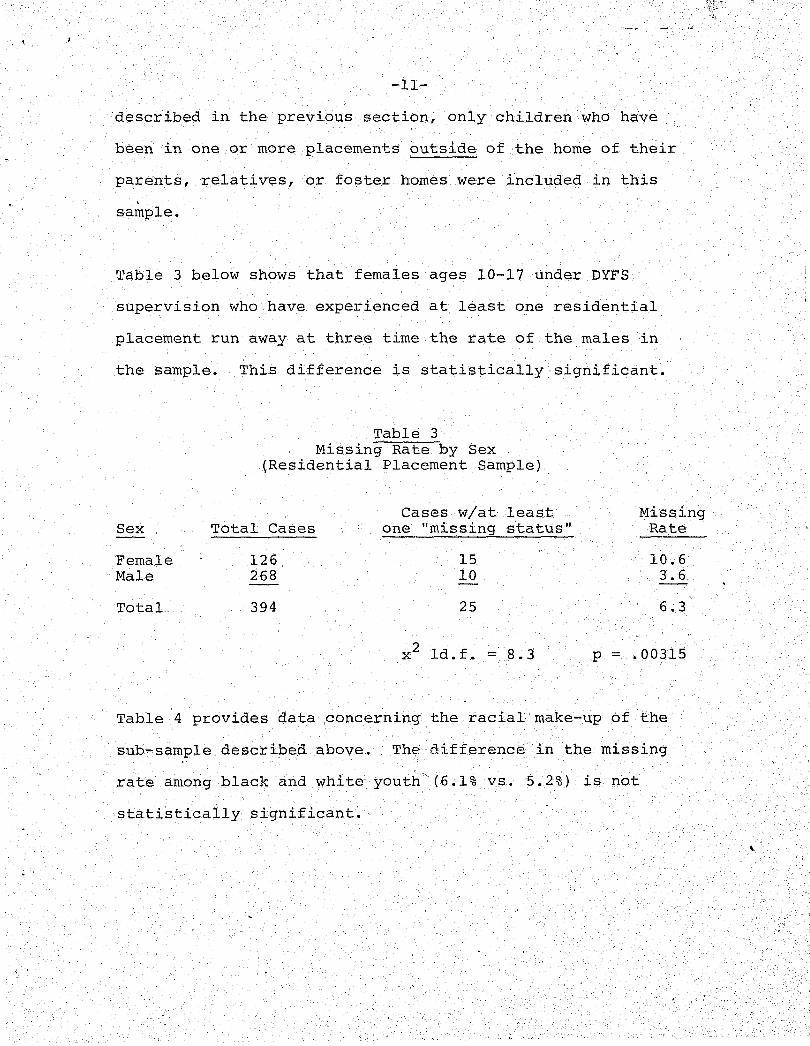
Table 3 below shows that females ages 10-17 under DYFS
supervision who have experienced at least one residential
placement run away at three time,the rate of the males in
the sample. This difference is statistically significant.
Sex
Female Male
Total
Table 3 Missi.ng Rate by Sex
(Residential Placement Sample)
Cases w/at leas.t Total Cases one "missing status"
126 15 268 10
394 25
x 2 ld.f. = 8.3
Missing Rate
10.6 3.6
6.3
P = .00315
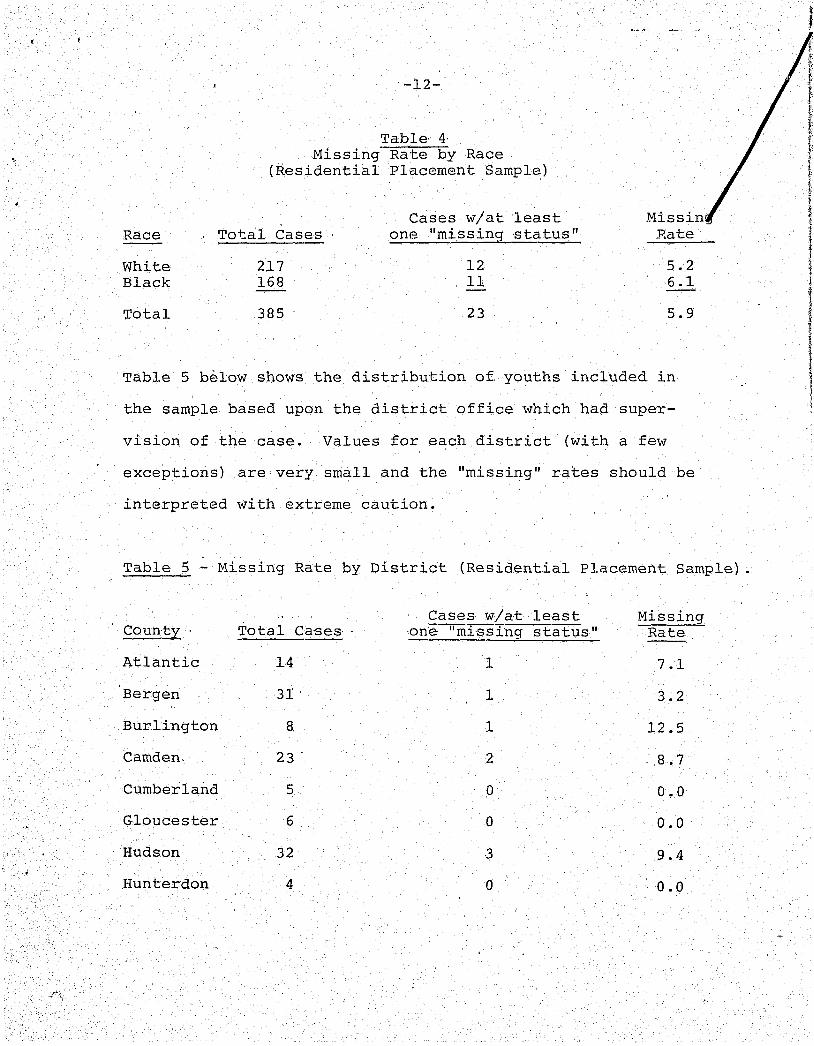
Table 4 provides data concerning the racial make-up of the
sub-sample described above. The difference in the missing
rate among black and white yout~~(6.l% vs. 5.2%) is not
statistically significant.
,. ,$)
"
Race
White Black
Total
-12-
Table· 4· Missing Rate by Race
(Residential Placement Sample)
Cases w/at least Total Cases one "missing 'status"
217 12 168 11
385 23
.Missin Hate
5.2 6.1
5.9
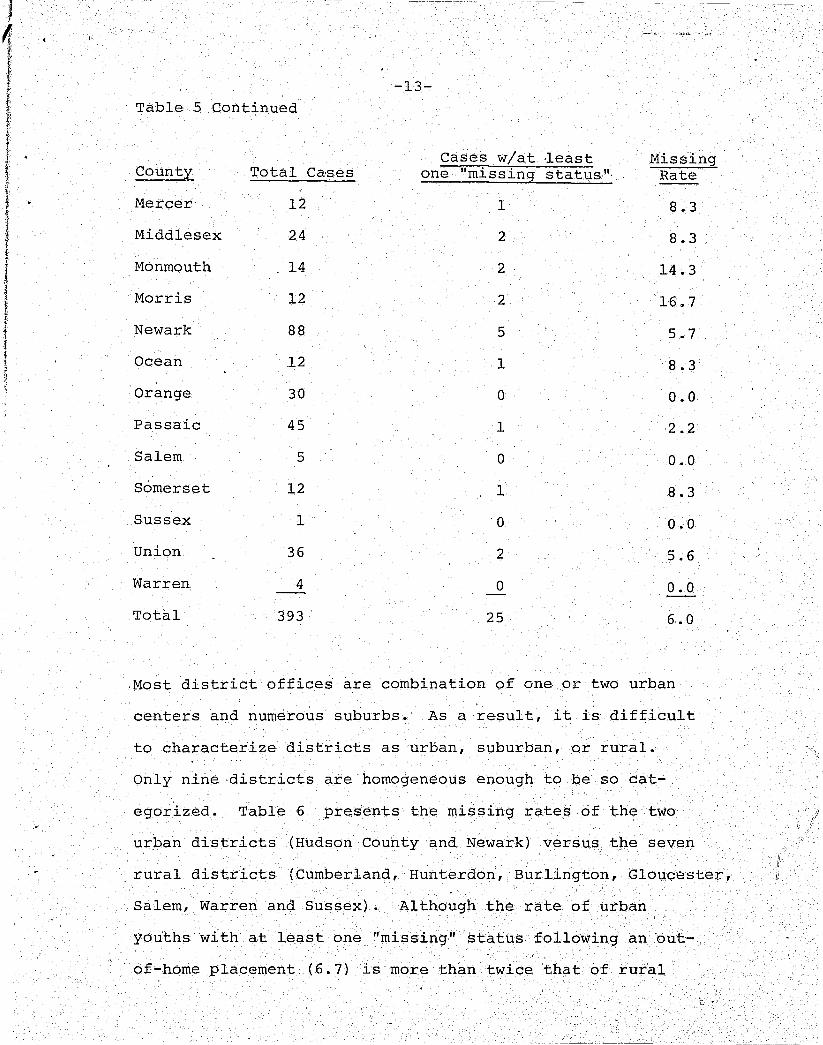
Table 5 below shows the distribution o~ youths included in
the sample based upon the district office which had super-
vision of the case. Values for each district (with a few
exceptions) are very small and the "missing" rates should be
interpreted with extreme caution.
Table 5 - Missing Rate by District (Residential Placement Sample) .
Cases w/a,t least Missing Coun,ty . Total Ca·ses one "missing status" Rate
Atlantic 14 1 7.1
Bergen 31 1 3.2
Burlington 8 1 12.5
Camden. 23' 2 8.7
Cumberland 5 0 0.0
Gloucester 6 0 0.0
Hudson 32 3 9.4
Hunterdon 4 0 0.0
J
,.
-13-Table 5 Continued
Cases w/at ·least Missing County Total Ca:ses one "missing status·"· Rate
Mercer 12 1 8.3
Middlesex 24 2 8.3
Monmouth 14 2 14.3
Morris 12 2 16,,7
Newark 88 5 5.7
Ocean 12 1 8.3
Orange 30 0 0.0
Passaic 45 1 2.2
Salem 5 0 0.0
Somerset 12 1 8.3
Sussex 1 0 0.0
Union 36 2 5.6
Warren 4 0 0.0
Total 393 25 6.0
.Most district offices are combination of one or two urban
centers and numerous suburbs. As a result, it is difficult
to characterize districts as urban, suburban, or rural.
Only nine districts are homogeneous enough to be so cat-
egorized. Table 6 presents the missing rates of the two
urban districts (Hudson County and Newark) versus the seven
rural districts (Cumberland, Hunterdon, Burlington, Glouc~ste:r.,
Salem, Warren and Sussex). Although the rate of urban
youths with at least one "missing" status following an out-
of-home placement (6.7) is more than twice that of rural
-14-
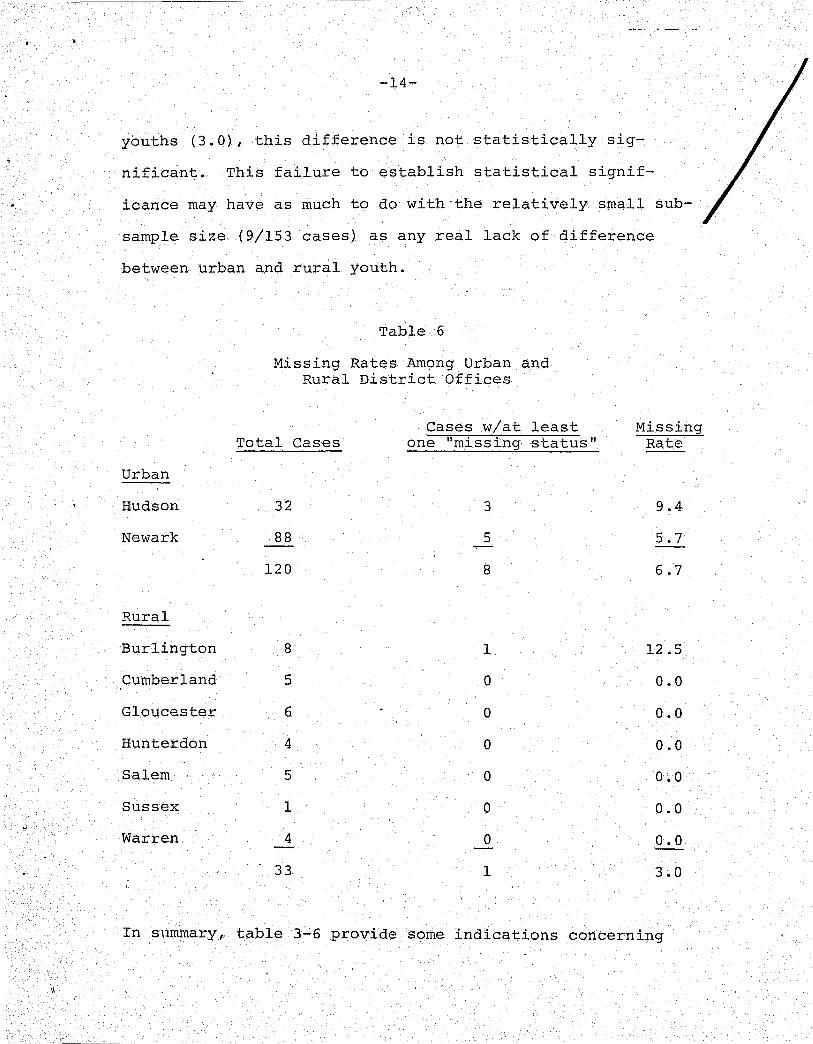
youths (3.0), this difference is not statistically sig-
nificant. This failure to establish statistical signif-
icance may have as much to do with·the relatively small sub-
sample size (9/153 ·cases) as any real lack of difference
between urban a.nd rural youth.
Table 6
Missing Rates Arn9ng Urban and Rural District Offices
Cases w/at least Missing Total Cases one "missihg ·status" Rate
Urban
Hudson 32 3 9.4
Newark 88 5 5.7
120 8 6.7
Rural
Burlington 8 1 12.5
Cumberland 5 0 0.0
Gloucester 6 0 0.0
Hunterdon 4 0 0.0
Salem 5 0 0.0
Sussex 1 0 0.0
Warren 4 0 0.0
33 1 3.0
In snrnrnary, table 3"":6 provide some indications concerning
1\

\'
-15-
the youths with some history of residential treatment who
a~e running away from these and other out-of-home place
ments. The only statistically significant result is the
indication that females are missing (with a high probability
of being a bonafide runaway) at a higher rate than males.
Tables 7 and 8 present findings concerning the AWOL Sample.
This sample "captures" a larger number of runaways because,
unlike the-Residential Placement Sample, a child need not
have had a placement history which included an out~of-home
placement in a residential treatment center, group home,
JINS shelter, or other nonfoster home out-of-homeplacement.
The criteria for selection was only that the child have a
"missing" event in his/her case history.
Due to the dual meaning of the term "missing," analysis of
the AWOL Sample excludes missing events if the child was
living in the home of a parent or relative immediately prior
to the missing event. As a result, it is not possible to
compare the rate at which children run away from their own
homes to the 'rate at ~hich they run away from DYFS placements
(foster homes, residential and group home placements and
other out-of-home placements). However, because the sample
is not systema-cically weighted to select in favor of residen
tial out-of-home 'placements (as is the Residential Placement
Sample), the sample permits comparison between runaway rat~s
~rom foster care and group homes, residential facilities and
"
"
".
-16-
other out-of-home placements. Runaway events from all out
of-home settings had an equal probability for selection in
the AWOL Sample.
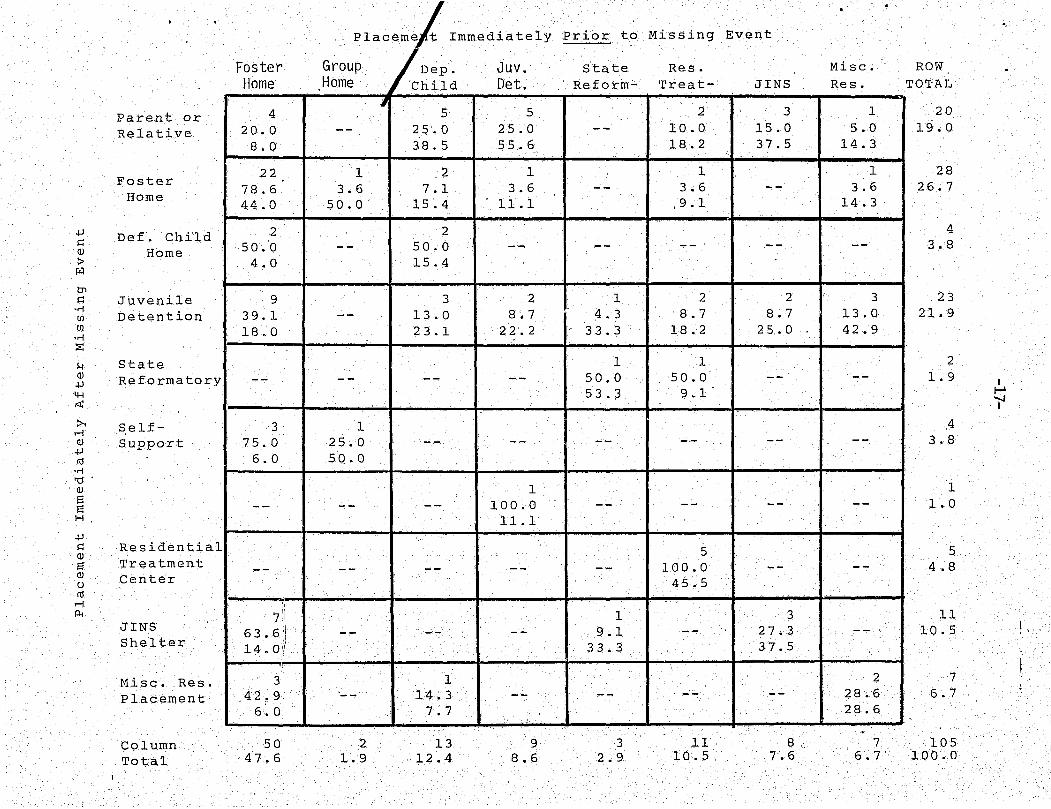
Table 7 presents information concerning 105 missing events
contained in the case histories of 82 youths. These events
are regarded as having a high probability of representing
true runaway behavior.
In interpreting Table 7, the placements prior to probable
runaway events are listed horizontally across the top of the
table. Placements following a probable runaway event are
listed along the left-side of the table.
Each cell- within the table contains:
a) the number (N) of runaway events tab~lated
b) the % of the ~ these events represent
c) the % of the column these events represent.
Reading across the row headed by the title Foster Home (and
noting the first and second value in each cell) it is apparent
that of the 28 runaway events that re"sulted in a foster
placement, 22 or 78.6% involved a youth who had runaway from
a foster home.
Parent or Relative
Foster Ho.me
.jJ Def. Child >:: QJ Horne
.l> ~
tJ)
>:: Juvenile ·ri
Detention UJ UJ ·ri :::E:
H State QJ Reformatory .jJ
4-1 ~
:>, Self-r-I QJ Support .jJ
ro ·ri 'd QJ f:i f:i H
.jJ
>:: Residentia,l QJ f:i Treatment QJ Center u ro
r-I p.,
JINS Shelter
Misc. Res. Placement
Column Total
Foster Home
4 20.0 8.0
22 78.6 44.0
2 50.0 4.0
9 39.1 18.0
--
3 75.0
6.0
--
--
:. 71 1 -
- 1\ 63.6:1 i)
14. OJ! .. -,
3 42~9
6.0
50 47.6
Placeme t Immediately
Group Home
--
1 3.6
50.0
--
--
--
1 25.0 5Q.0
--
--
--
--
2 1.9
~
Dep. Child
5 25.0 38.5
2 7.1
15.4
2 50.0 15.4
3 13.0 23.1
--
--
--
--
--
1 14.3
7.7
13 12.4
,
JUV. Det.
5 25.0 55.6
1 3.6
11.1
--
2 8.7
22.2
--
--
1 100.0 11.1
--
--
--
9 8.6
Prior to
State Reform-
--
--
--
1 4.3
33.3
1 50.0 53.3
--
--
--
1 9.1
33.3
--3
2.9
----
Missing
Res. Treat-
2 10.0 18.2
1 3.6
,9.1
--
2 8.7
18.2
1 50.0
9.1
--
--
5 100.0
45.5
--
--
11 10.5
--- -----
Event
JINS
3 15.0 37.5
--
--
2 8.7
25.0
--
--
--
--
3 27.3 37.5
--
8. 7.6
.
Misc. Res.
1 5.0
14.3
1 3.6
14.3
--
3 13.0 42.9
--
--
--
--
--
2 28.6 28.6
7 6.7
.
ROW TOrr'AL
20 19.0
28 26.7
4 3.8
23 21.9
2 1.9
4 3.8
1 1.0
5 4.8
11 10.5
7 6.7
105 100.0
'-
I t--' '-J I
\.
.
-18-
In all, runaway events from foster homes represent 47.6% of
all such events sampled, more than any other category.
Probable runaway events from homes for dependent children
(12.47%) and residential treatment centers (10.5%) con-
tribute the second and third largest number of runaway
events.
Analysis s>f the AWOL Sample shows that, among children in
DYFS supervised out-of-home placements who runaway, the
largest proportion of such running away is done by children
leaving their foster homes. Further analysis of Table 7
indicates that most of these runaway foster children (44%)
are returned to a foster home, although it was not possible
to determine if they were returned to the foster home from
which they had been reported missing. Nearly a third of the
runaway foster children (32%) had involvement with the
juvenile justice system as the next placement on their
official record following the missing event; 18% were next
reported in juvenile detention and 14% in a JINS (Juvenile
in Need of Supervison) shelter. These placements probably
represent apprehension of the runaway by the police. For
youths placed in a juvenile detention facility, this appre
hension was probably made in connection with a serious
offense.
It had been initially thought that children fleeing from
-19-
residential treatment settings would contribute a large
number of runaway youth to the sample. As can be seen in
Table 7, the "refugee" from a residential placement is. a
rather small part of the runaway problem among children
under DYFS supervision who runaway from their out-of-home
placements. Only 12.4% (13) of the runaway events included
in the sample involved a child listed as missing from a
residential treatment center or group home.
Moreover, the apprehension that juveniles discharged from
long-term care become overwhelmed when returned "cold turkey"
to their communities and then runaway may be unfounded.
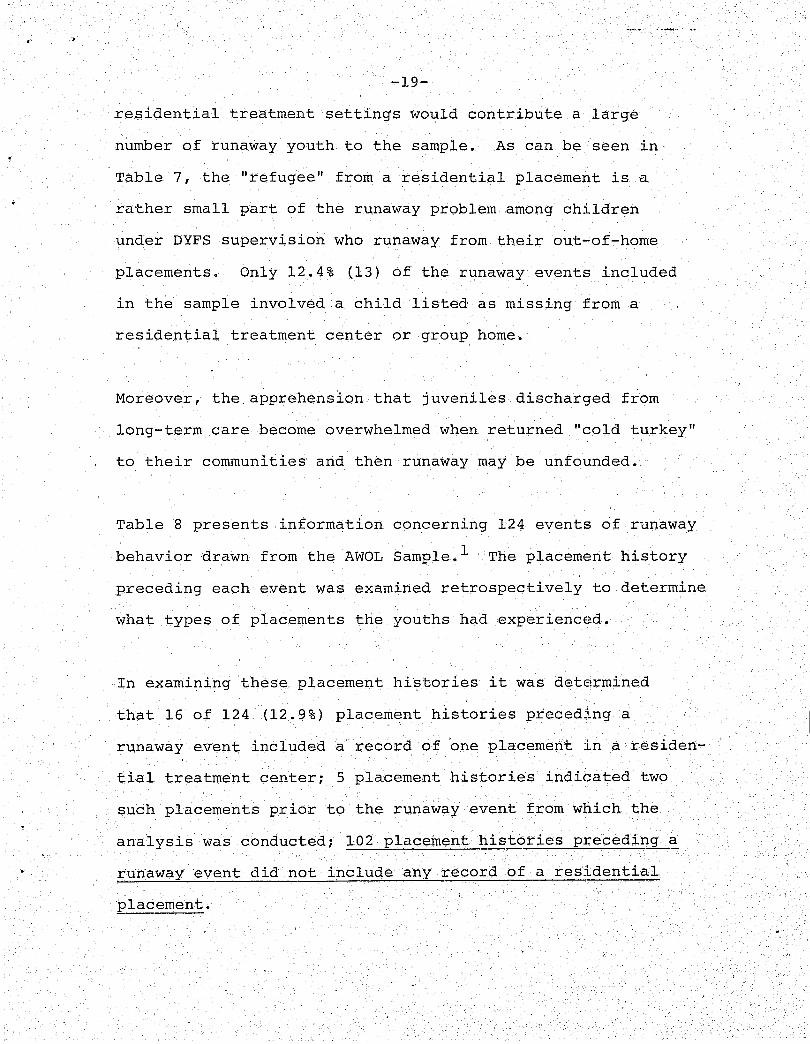
Table 8 presents information conce.t:ning 124 events of runaway
behavior ·drawn from the AWOL Sample. l The placement history
preceding each event was examined retrospectively to determine
what types of placements the youths had experienced.
In examining these placement histories it was determined
that 16 of 124 (12.9%) placement histories preceding a
runaway event included a record of one placement in a residen
tial treatment center; 5 placement histories indicated two
such placements prior to the runaway event from which the
analysis was conducted; 102 placement histories preceding a
r'unawayevent did not include any record of a residential
·placement.

':;
-20-
This finding supports the results of the analysis of the
Residential Placement Sample. A history of placement in a
Residental Treatment Center or other nonfoster home, out-of
home placement (group home, JINS shelter, etc.) is not
necessarily a strong indicator of propensity to run away
when compared to the runaway rates from other types of
placement. For example, almost two-thirds of the placement
histories preceding a runaway event in the AWOL Sample
included an indication of foster care placement. This
finding is not surprising in view of the fact that the
missing events included in this analysis of the A,WOL Sample
were restricted solely to those events in which the child
had runaway from an out-of-home placement. Foster home
placements comprise the majority of such placements.
However, -what is important is that the bulk of the missing
events with a high probability of being a bonafide episode
of running away pertain to clients who have not been institu~
tionalized.
-21-·
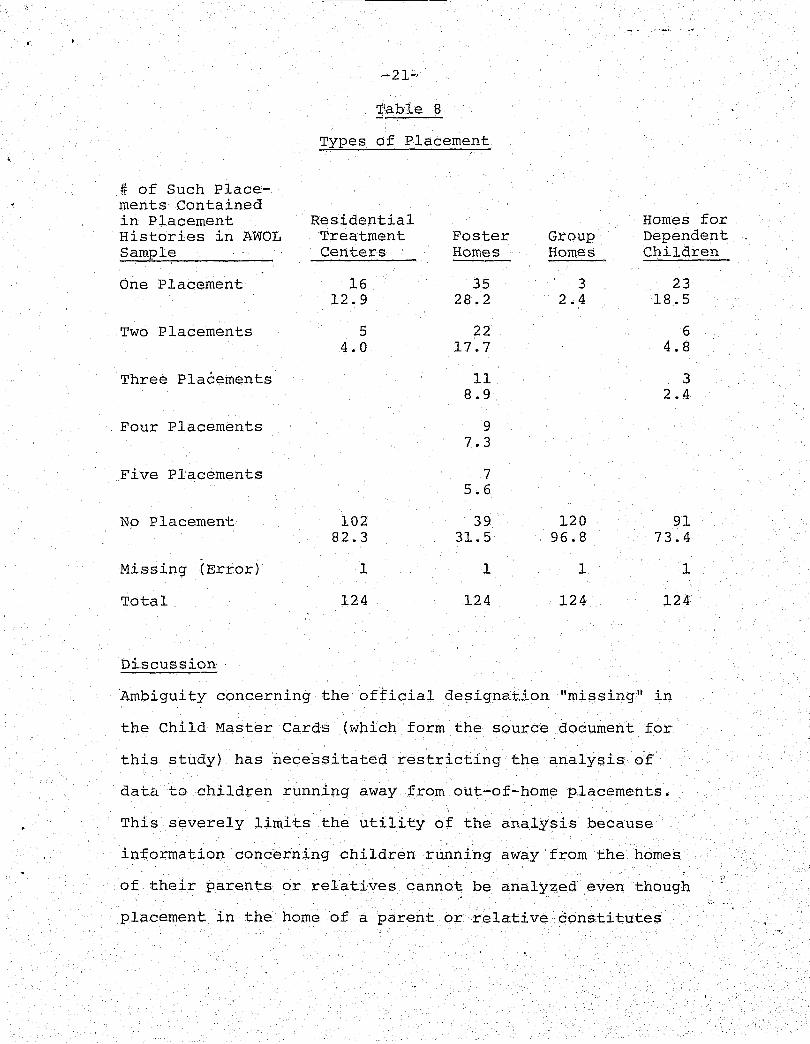
'I'able 8
Types of Placement
# of Such Place-ments contained in Placement Residential Homes for Histories in AWOL Treatment Foster Group Dependent Sample Centers Homes Homes Children
One Placement 16 35 3 23 12.9 28.2 2.4 18.5
Two Placements 5 22 6 4.0 17.7 4.8
Three Placements 11 3 8.9 2.4
Four Placements 9 7.3
Five Placements 7 5.6
No Placement 102 39 120 91 82.3 31.5 96.8 73.4
-Missing (Error) 1 1 1 1
Total 124 124 124 124
Discussion·
Ambigui ty concerning the official de~ignEtt:.ion "missing" in
the Child Master Cards (which form the source document for
this study) has necessitated restricting the analysis of
data to children running away from out-of-home placements.
This severely limits the utility Of the analysis because
information concerning children running away from the homes
of their parents or relatives cannot be analyzed even though
placement in the home of a parent or relative constitutes
-22-
64% of the DYFS caseload. 2 As a result, it is not possible
to determine what effect, if any, DYFS placement policies
have upon the propensity of children who have been placed to
runaway.
However, some tentative findings are indicated based upon an
analysis of the available data:
1. Females with at least one placement in a residential
.treatment center in the Residential Placement
Sample runaway at three times the rate of males
(15/126 versus 10/268); this difference is statis
tically significant.
2. No statistica~ly significant difference was found
between the runaway rate for black versus white or
urban versus rural youth in the Residential Place
ment Sample; in the latter instance, very small
cell frequencies may have precluded a statistically
significant finding.
3. Almost half (47.6%) of the children with at least
one missing episode in their placement history
followi~g an out-of-home placement were missing
following placement in a foster home; only 10.5%
were listed as "missing" from a residential treat
ment center.
~2,3.--
4. Relatively few of the runaway youth with at least
one missing episode in their placement histories
following an out-of-home placement had prior ex
perience with placement in.a residential settingi
this finding tentatively supports a conclusion
that, ·at least among children who run away from an
out-of-home placement, most of these runaways are
in flight from a foster home and most such children
.are probably not runni!lg away due to the shock of
returning from highly structured placements.
CO'nsiderable caution must be exercised in interpreting these
·findin'gs. The numbers of cases in some cells are small, and
in the absence of reliable data concerning children "missing"
from the home of a parent or relative, this severely limits
the usefulness of the study.
The above short-comings notwithstanding, this study has been
1,lseful in a variety of ways. First, the computer programming
developed to analyze the data drawn from the Child Master
Cards is bei!lg employed by the Division of Youth and Family
Services to conduct other studies using this previously
untapped source of data.
Use of the Child Master Cards could provide an alternative
means of capturing a sample of runaway y?uthfor future"
-24-
studies. A large, mUltipurpose sample of the active caseload
could be drawn from the Child Master Cards. Clients who
have ever had a "missing" designation in their placement
history can be readlly identified by the computer programs
established for this study and their case numbers could be
listed. A quick examination of the case folder of these
cases will permit distinguishing between runaways and other
"missing" cases. In this way, a large number of runaway
cases could be identified without having to review thousands
of case folders.
The impact of existing DYFS programs, particularly out-of
home placements, could be more readily assessed utilizing
such data. Of particular interest would be an analysis of
the characteristics of bona fide runaways leaving the homes
of parents and relativies who have had a particular history
of out-of-home placement as opposed to those who have had no
such previous history.
This study, then, must be regarded as successful in a limited
manner. The problems which have been identified can readily
be corrected thiough an analysis of a moderate sized sample
of case records identified by the programming developed for
the study~ Such an effort, however, must be regarded as
beyond the scope of this report.

"'
. "
J..
-25-
FOOTNO'I'ES
Note that Table 8 contains information of 19 "missing" or runaway events relating to youths who were still missing at the time the AWOL Sample was taken. As a result, no information concerning the placement subsequent to these missing events was available and these missing events do not appear on Table 7.
2. As of December 31, 1976 .

APPENDIX A
",.
i
This is a proposal to the Office of Yo nth Development
of a~~ from the Bureau of Research, Planning, and Program
DevelopmeT.lt of the Division of Youth and Family Services of
the State of 'NeTJ-t Jersey for a small grant to support a
research project \'l'hich \'1ill determine patterns of runa\1ay
behavior by youth served by the Division.
The basic product from this grant \'1ill be a research
paper based upon a computer analysis of a sample of DYFS
case records. This analysis will serve a number of purposes.
1. One product will be a statistical profile of youth
who have run away while under DYFS supervision.
This profile \-li11 not only give demographic charac-
teristics but \1i11 also shoy! where the youth 't~ere
living befor:e they ran away, aml the types of
living situatioris they e~~erienced when they·
returned. This career data will be useful to both
QYD and DYFS in that it will indicate the types of
services now available to runaways and should also
point to present gaps in servioes.
2 • ~:m analysis of career data l'lill also indicate
t-rhether, as is now hypothesized, DYFS placp...ment
practices in f~ct encourage children to run at-my.
If this is determined to be the case, hopefully
this study will also shed light on hot., DYFS might
change its pqlicies to minimize this behavior ..
This JIk"ly lead to institution:al change, a .major
aspect of OYD'a general strategy of p~omoting
healthy youth development.
( ..
· , -~-
3. A third product wi11 be an analysis of the place
ment history of a significant sample of children
who have been placed by the Division in long-term
residentialtreaunent in lieu of correctional
placem~nt. The Division is aware that many such
children fail ~\Fhen they return to the community,
and nO~l is peg inning to structure services to
prevent such failures. The information derived
from this study should help in this effort.
OverVie\'l
The Division of Youth and Fa~ily Services is New Jersey's
division of state government responsible for the welfare of
children. As part of thi~ mandate \10 provide: treatlnent
for children in residential facilities, adoption services,
day care services, parole supervision, and a host of other
seJ"vices. Recently we considered responding to OYD I S runa~qay
progrlaIn initiative, but because of a severe budget cru..'lch
within our own Division and wi thin Ne\'l Jersey's stat.e govern
ment in general, it was decided that we could not initiate
providing this additional service at this time. We did,
hovlever, offer technical assistance to various private
agencies who have responded to OYD's program, and we re~~in
deeply concerned about the runa,\.;ay problem in this state.
History
In a recent study, Jackson Toby, of the Institute for
Criminological Research at Rutgers, indicated that many
-3-
children provided therapeutic trea~~t by the Division, in
long-term residential facilities, later rail in the community~
even though these children apparently have received good
prognoses in their treatment programs. ~obyls conclusion
was that the Division should begin to consider providing
aftercare services for these youth. In order to plan for
such services, Kenneth Stevenson was appointed by the Division
director to coordinate a divisionwide task force to design
the needed services.
Quickly it bec&~e apparent that in order to plan for
aftercare it was necessary to know which types of children
ware returning to the community and what type of problems
these children exhibited. Almost as quickly it became
apparent that the Division's existing information system
would not produce the data needed. This system was designed -
to reimburse vendors for services provided to.children who
were presently in placement and not to provide historical
social information. It could be used to provide some basic
data on those receiving services, but it could not tell us
where children ca~e from or to where t~ey were returned.
Fortunately, it ",as discovered that in the Division's central
record unit, t.here was also a manual back-up system of file
cards which did contain a historical record. As there were
over 50,000 active cases, it was deternuned that it would be
necessary to sample this file. r~he sample '\-las a systematic
random sample of approximately 8S0 cases 'bf chil~~n who had
been in somoform of institutional placement. Institutional
.'
, 'i'
.'
placement might have meant county detention shelters,
county ,shelters for neglected chilar~~, JINS she1ters, long-
term residential treatment, or ,state correctional facilities.
These cards were then xeroxed and became the study's
source da'l:.a record. The cards were prepared for hand tabula-
tion and all 'chose cases of children age 10 or under were
removed from the file. ~his left a total of approximately
650 cases. At present, then, we have a syste:-natic random
sample of histories of approximately 650 New Jersey juveniles
who have been under the Divisions supervision while in
various types of institutional placa~ent.
Initial manual analysis shows that approximately 100 of
these children were recorded as having run a~l<lY sometime
lV'hile under Dl'FS supervision. A large proportion appeared
to have run from institutions, although many also ran from
foster homes and \-,ere subsequently placed in institutions.
In other words, if running away is seen as a behavior, the
frequency of "'hich should be reduced, then it might be
argued that the Division through its plac~~ent activities is
adding to the runavlay problem. From a ,different perspective,
hm'laver, it could be argued that x:u..l'ming a\'.1ay is actually
just another symptom of a child's disturbed behavior, and it
is disturbed behavior that society's institutions, including
those of: the Division, are attempting to treat.
At an~l rate, it is clear from the sample that the
significIDlt proportion of children und~r DYFS supervision
run away_ wnat we propose then, is to take a more intensive
look at this problem .•
•.
-5-
NethodolO9'l
The procedure would be to return to the child master
record file and dra,'l another random sample. This sample
would be a systematic random sample of children who had run
away at some time while under DYFS supervision. A new
sample is necessary because the earlier one, by focusing
strictly on children who had received institutional placement,
is biased toward children who have been placed. The new
sample with a broader representation may show that runat'lays
for tile ~ost part are actually running from abusive homes
rather than institutions.
This data would b;en be entered onto computer cards and
analyzed at the Rutgers computer center using SPSS (the
Statistical Package for the Social Sciences), a package of
computer progra..'t'.s specificallY designed for this type of
analysis.
The product of this analysis will be a research document
which shoul~ give the Division and OYD a clear picture of ·a
significant proportion of New Jersey's runaways. Although
detailed psychological and social data would not be available
from this source, we would be able to determine such things
as the age, race, and sex. We should also be able to tell
\.,ere they run from, .;how long they remain missing , and were
they are place:d \-lhen they return. We will also come to ltnm'l1
something of their hist.ories in. terms of adjudications.
~'his study '1i11 be conducted by Dr. Micheal Wasserman ,
who has recently joined the Bureau of Research, Planning,

ir
..
-6-
and Program Development. Dr. Wasserman previous ly worked
for six years at the Institute for Criminological Re~;,tJarch
at Rutgers under Dr. Toby. During much of that time
Dr. Wasserman was involved 't'lith the analysis of data, similar
to that invisioned in this project. Dr. Wasserman's vita is
attached.
He will be assisted by a graduate sociology student
from Rutgers who is presently completing a coding task for
the Institu~e for Criminology. The assistant will be primarily
conc~rned with drawing the new sample and coding data in
preparation for key punching.
The Bureau will pay Dr. Wasserman's salary; however, it
is impossible for us to provide funds for the computer
analysis, keypunching, or coding. We are therefore requesting
support fo~ these activities. A budget is attached •
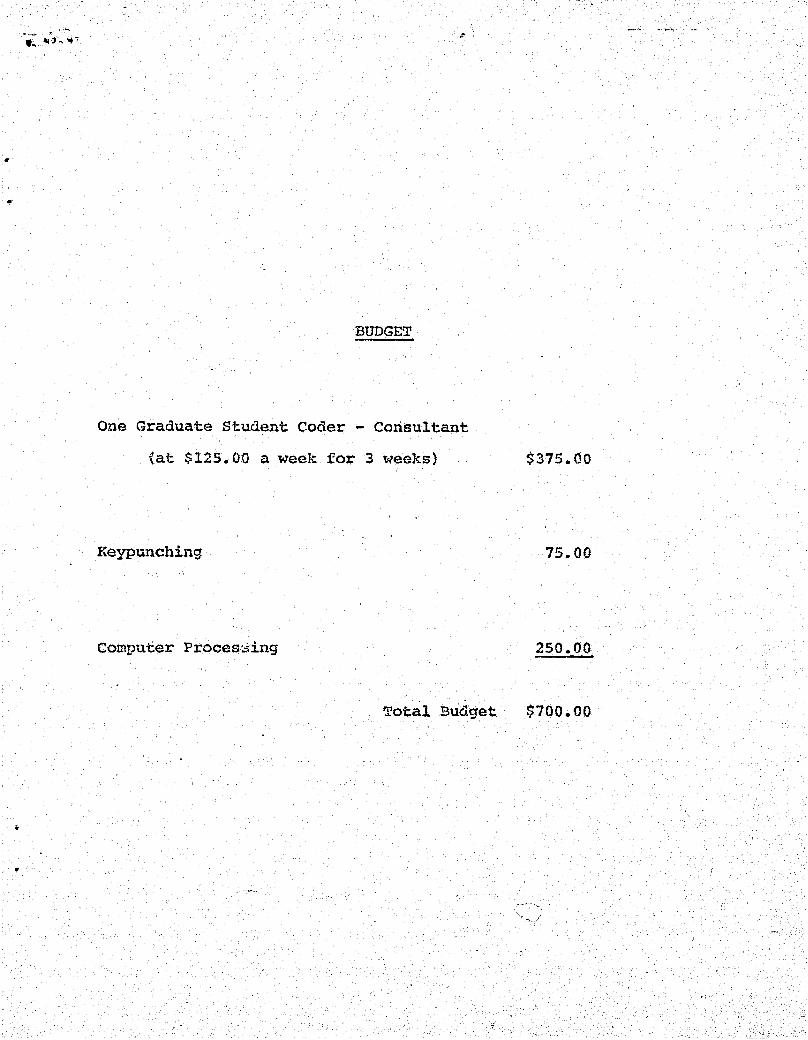
BUDGET .
One Graduate Student Coder - Consultant
(at $125.00 a week for 3 weeks) $375.00
Keypunching 75.00
computer Proces:.$ing 250.00
Total Budget $700.00
•