Embed Size (px)
Citation preview

Photographer
WeddingPlanner
OnlineInfluencer
Invest in ELSS - Equity Linked Saving Scheme
If you can be so much more,why can’t your ELSS fund?#SaveTaxGainMore
Aim for
Wealth CreationTax Savings up to `46,800*u/s 80C of Income Tax
Lowest Lock-inof 3 years
To know more, contact your financial advisor.
Scan to know more about Alia.
FACT SHEETJanuary 2020
*Calculated at the highest tax slab rate for FY19-20 applicable on investments u/s 80C. Surcharge has been ignored for ease of calculation. All Mutual Fund investors have to go through a one-time KYC (Know Your Customer) process. Investors should deal only with Registered Mutual Funds (‘RMF’). For more info on KYC, RMF & procedure to lodge/redress complaints, visit pgimindiamf.com/IEID. This is an investor education and awareness initiative by PGIM India Mutual Fund. Mutual Fund investments are subject to market risks, read all scheme related documents carefully. © 2019 Prudential Financial, Inc. (PFI) and its related entities. Prudential Financial, Inc. of the United States is not affiliated in any manner with Prudential plc, incorporated in the United Kingdom or with Prudential Assurance Company, a subsidiary of M&G plc, incorporated in the United Kingdom. The PGIM logo and the Rock symbol are service marks of PFI and its related entities, registered in many jurisdictions worldwide.

Index
Page No.
From the CEO’s desk 3
Market Review 4
Snapshot of Equity Funds Reckoner 5
PGIM India Large Cap Fund (Large Cap Fund - An open ended equity scheme predominantly investing in large cap stocks)
7
PGIM India Diversified Equity Fund (Multi Cap Fund - An open ended equity scheme investing across large cap, mid cap, small cap stocks)
8
PGIM India Midcap Opportunities Fund (Mid Cap Fund- An open ended equity scheme predominantly investing in mid cap stocks)
9
PGIM India Long Term Equity Fund (An Open Ended Equity Linked Savings Scheme with a statutory lock-in of 3 years and tax benefit)
10
PGIM India Hybrid Equity Fund (An open ended hybrid scheme investing predominantly in equity and equity related instruments)
11
PGIM India Euro Equity Fund (An open ended fund of fund scheme investing in Pramerica SICAV Euro Equity)
12
PGIM India Global Equity Opportunities Fund(An open ended fund of fund scheme investing in PGIM Jennison Global Equity Opportunities Fund)
13
PGIM India Arbitrage Fund (An open ended scheme investing in arbitrage opportunities)
14
PGIM India Equity Savings Fund(An Open Ended Scheme investing in equity, arbitrage and debt)
15
Snapshot of Debt Funds Reckoner 16
PGIM India Overnight Fund (An open ended debt scheme investing in overnight securities)
18
PGIM India Insta Cash Fund(An Open Ended Liquid Scheme)
19
PGIM India Ultra Short Term Fund (An open ended ultra-short term debt scheme investing in instruments such that the Macaulay duration of the portfolio is between 3 months to 6 months)
20
PGIM India Low Duration Fund (An open ended low duration debt scheme investing in instruments such that the Macaulay duration of the portfolio is between 6 months to 12 months)
21
PGIM India Short Maturity Fund (An open ended short term debt scheme investing in instruments such that the Macaulay duration of the portfolio is between 1 year to 3 years)
22
PGIM India Banking and PSU Debt Fund (An open ended debt scheme predominantly investing in Debt instruments of banks, Public Sector Undertakings, Public Financial Institutions and Municipal Bonds)
23
PGIM India Credit Risk Fund(An open ended debt scheme predominantly investing in AA and below rated corporate bonds (excluding AA+ rated corporate bonds))
24
PGIM India Dynamic Bond Fund (An open ended dynamic debt scheme investing across duration)
25
PGIM India Premier Bond Fund (An open ended debt scheme predominantly investing in AA+ and above rated corporate bonds)
26
PGIM India Gilt Fund (An open ended debt scheme investing in government securities across maturities)
27
Performance of Other Funds 28
SIP Performance 29
How to read the Factsheet 30
3
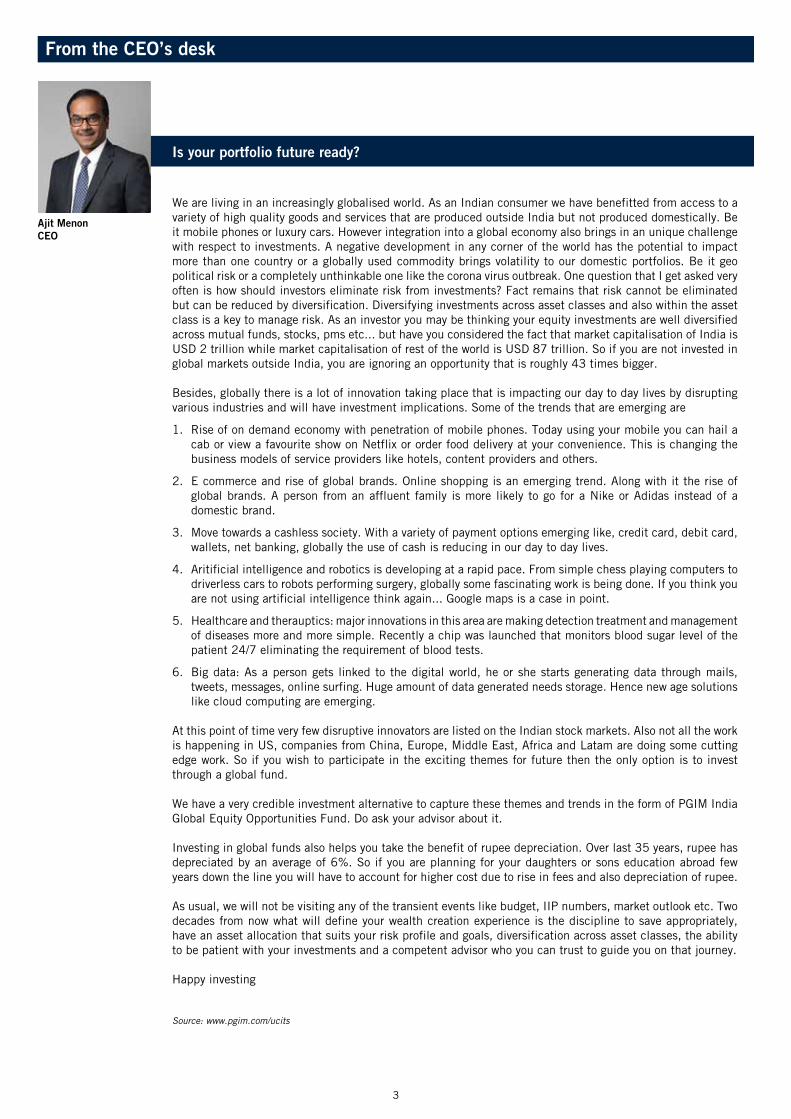
We are living in an increasingly globalised world. As an Indian consumer we have benefitted from access to a variety of high quality goods and services that are produced outside India but not produced domestically. Be it mobile phones or luxury cars. However integration into a global economy also brings in an unique challenge with respect to investments. A negative development in any corner of the world has the potential to impact more than one country or a globally used commodity brings volatility to our domestic portfolios. Be it geo political risk or a completely unthinkable one like the corona virus outbreak. One question that I get asked very often is how should investors eliminate risk from investments? Fact remains that risk cannot be eliminated but can be reduced by diversification. Diversifying investments across asset classes and also within the asset class is a key to manage risk. As an investor you may be thinking your equity investments are well diversified across mutual funds, stocks, pms etc... but have you considered the fact that market capitalisation of India is USD 2 trillion while market capitalisation of rest of the world is USD 87 trillion. So if you are not invested in global markets outside India, you are ignoring an opportunity that is roughly 43 times bigger.
Besides, globally there is a lot of innovation taking place that is impacting our day to day lives by disrupting various industries and will have investment implications. Some of the trends that are emerging are
1. Rise of on demand economy with penetration of mobile phones. Today using your mobile you can hail a cab or view a favourite show on Netflix or order food delivery at your convenience. This is changing the business models of service providers like hotels, content providers and others.
2. E commerce and rise of global brands. Online shopping is an emerging trend. Along with it the rise of global brands. A person from an affluent family is more likely to go for a Nike or Adidas instead of a domestic brand.
3. Move towards a cashless society. With a variety of payment options emerging like, credit card, debit card, wallets, net banking, globally the use of cash is reducing in our day to day lives.
4. Aritificial intelligence and robotics is developing at a rapid pace. From simple chess playing computers to driverless cars to robots performing surgery, globally some fascinating work is being done. If you think you are not using artificial intelligence think again... Google maps is a case in point.
5. Healthcare and therauptics: major innovations in this area are making detection treatment and management of diseases more and more simple. Recently a chip was launched that monitors blood sugar level of the patient 24/7 eliminating the requirement of blood tests.
6. Big data: As a person gets linked to the digital world, he or she starts generating data through mails, tweets, messages, online surfing. Huge amount of data generated needs storage. Hence new age solutions like cloud computing are emerging.
At this point of time very few disruptive innovators are listed on the Indian stock markets. Also not all the work is happening in US, companies from China, Europe, Middle East, Africa and Latam are doing some cutting edge work. So if you wish to participate in the exciting themes for future then the only option is to invest through a global fund.
We have a very credible investment alternative to capture these themes and trends in the form of PGIM India Global Equity Opportunities Fund. Do ask your advisor about it.
Investing in global funds also helps you take the benefit of rupee depreciation. Over last 35 years, rupee has depreciated by an average of 6%. So if you are planning for your daughters or sons education abroad few years down the line you will have to account for higher cost due to rise in fees and also depreciation of rupee.
As usual, we will not be visiting any of the transient events like budget, IIP numbers, market outlook etc. Two decades from now what will define your wealth creation experience is the discipline to save appropriately, have an asset allocation that suits your risk profile and goals, diversification across asset classes, the ability to be patient with your investments and a competent advisor who you can trust to guide you on that journey.
Happy investing
Source: www.pgim.com/ucits
Is your portfolio future ready?
Ajit MenonCEO
From the CEO’s desk

4
Source: RBI & BloombergThe views of the Fund Manager should not be construed as an advice and investors must make their own investment decisions regarding investment/disinvestment in securities market and/or suitability of the funds based on their specific investment objectives and financial positions and using such independent advisors as they believe necessary. None of the information contained in this document shall be constituted as a recommendation to buy or sell any particular security. Mutual Fund investments are subject to market risks, read all scheme related documents carefully.
Equity Market
Debt Market
Market Review Details as on January 31, 2020
The market that was
Led by global cues (Iran tensions and Coronavirus scare), Indian markets were weak in January 2020. Sector wise, metals, energy and banks were laggards while realty and cement sectors were outperformers. While large caps saw a muted month (Nifty down 1.7%), the focus was clearly on midcaps and small caps and the respective indices were up 5.3% and 6.7% in the first month of 2020.
Nov IIP (+1.8%) rose after 3 months of contraction, while Dec manufacturing PMI print came in at its highest level since May 2019. Spike in vegetable inflation (+60% YoY) pushed the December headline CPI print to 7.35% and was at a 65-month high. Furthermore, fuel and telecom inflation too came higher than expected and core inflation came in at 3.7%. The trade Deficit narrowed further to $11.3bn in Dec 2019 as fall in imports at 8.8% was much higher than the fall in exports at 1.8%.
GDP growth is likely to come in at 5% in FY2020 from 6.8% in FY2019, according to first advance estimate released by Government of India, making it the lowest growth rate in recent years. For FY2021, growth has been projected at 6.3%.
FIIs were net buyers to the tune of $1.4bn (partly due to fund raise in Telecom sector) in January whereas DIIs were net buyers of $0.3bn. Domestic Mutual Funds were net buyers of $0.2bn whereas Domestic Insurance companies bought $0.1bn during January.
Going Forward
The Union Budget was presented on 1st February and while there were no stark negatives, a lack of stimulus and policy measures disappointed in the backdrop of heightened expectations. There was no significant growth in allocation for core sectors which could have been used to accelerate investments in a sluggish economy. The Union Budget is a routine exercise of balancing revenue and expenditures of the government and it is not the only policy and stimulus event for the country. Steps have been taken outside of the Budget as well (e.g. corporate tax rate cuts in September 2019).
We reckon the economy is on the path of a gradual recovery. Earnings are seeing buoyancy led by lower tax rates and a low base of FY2019. At the time of writing this report, 30 out of 50 Nifty companies have reported Q3FY2020 results (with 84% weightage in Nifty) and adjusted profits are up ~17% YoY (though aggregate profits are significantly higher led by a low base of last year). Consequently, Nifty P/E (trailing) which was ~26x about a month ago has moderated to 23x (with five year average being 22.4x). With earnings catching up and valuations coming off from peaks, risk reward continues to be favourable and as when economy gains traction, the dichotomy of market performance and economy’s performance should contract towards alignment.
local headwinds to growth. For the first time in 10 years, there was no capital allocation to banks in the budget, which together with sub par credit conditions could impede credit and GDP growth.
Also, capital markets locally need to stay adequately buoyant to help see through the rather ambitious disinvestment drive. In FY 20 for instance, the disinvestment target has been scaled down from INR 1.05 trillion to INR 0.65 trillion, while the realised figure stands at INR 0.18 trillion.
Besides the world is preparing to face fresh risks arising from the effects of the health epidemic in China which could seriously slow down its GDP and pull down global growth in the near term.
Given this backdrop, we find the short end of the curve (upto 5 years) attractive due to attractive term spread over the overnight rate and easy liquidity conditions. The long end of the curve will stay elevated in medium term because of ample supply starting Apr 2020 and higher reliance on funding the fiscal deficit through small saving scheme (INR 2.4 trillion).
Recommended Products
We recommend short duration products in the average maturity range up to 5 years, given the evolving macro backdrop.
We recommend the PGIM India Banking & PSU Debt Fund along and PGIM India Premier Bond Fund within this category as suitable investment options for investors seeking moderate duration exposure and a preference for high quality (AAA) portfolio.
PGIM India Dynamic Bond Fund is recommended for Investors with a higher appetite for volatility.
Fixed Income Market December 2019 January 2020 Change
(in bps)
Overnight rate (NSE MIBOR) 5.26% 4.90% -36
1 yr CD 6.02% 5.95% -7
10 yr GOI Yield 6.56% 6.60% 4
USD/INR 71.38 71.36 -2 paise
IIP (Monthly with 2 month lag) -4.00% 1.80% 580
CPI (Monthly with 1 month lag) 5.54% 7.35% 181
5 Yr AAA PSU spread (bps) 48 35 -13
5 Yr OIS 5.54% 5.41% -13
US 10 Yr yield 1.92% 1.56% -36
CRR 4.00% 4.00% 0
Reverse REPO 4.90% 4.90% 0
REPO 5.15% 5.15% 0
Source: RBI Weekly Statistical Supplement & Bloomberg
Note:IIP has been revised downwards for the previous reading.
Macro Review
CPI for December 2019 printed at 7.35%, higher than both RBI’s 4% target and market expectation of 6.7%. Core inflation inched only marginally higher from 3.50% to 3.70% due to partial impact of mobile tariff rise. In general we continued to witness weak pricing power amongst producers, which is reflected in the subdued core CPI. Headline CPI however moved up strongly due to a rapid increase in food prices, which rose 2.37% on a m/m basis. On a annual basis, the increase was 14.12% led by volatile perishables (milk, eggs, meat, veggies) and protein (pulses) rich items. The recent price rise is widely foreseen to be transitory on the back of adverse base effect, erratic weather conditions and supply disruptions.
Liquidity and Rates
Liquidity conditions continued to improve despite the government lowering spending in a bid to contain the fiscal deficit. Government borrowed almost INR 1.3 trillion through WMA (overdraft with RBI) at the month beginning, thus pushing the system liquidity to INR 400 bio. Average daily system balances for January stood at INR 3.16 trillion compared to INR 2.56 trillion in December. INR was mostly stable, appreciating by 2 paise (0.03%) against the USD in January.
Crude witnessed increased volatility rising to USD 70 per bbl due to a spike in tensions in the middle east but later settled to under USD 66 per bbl. Crude fell to USD 57 per bbl in the latter part of the month in response to concerns over falling demand due to the fear of spread of coronavirus.
Government bonds remained volatile on the back of crude oil prices which were elevated. RBI continued with its operation twist and conducted 2 operations aggregating INR 20,000 cr. RBI also switched INR 40,000 cr directly with the Govt, enabling a maturity elongation. Despite the ongoing operation twist, the long end of the curve underperformed as market turned cautious ahead of the budget.
India Government presented the Union Budget on February 1st, 2020. In line with market expectation, the government invoked the escape clause to revise FY20 fiscal deficit higher to 3.8% of GDP vs the initial target of 3.3% and fiscal deficit is budgeted at 3.5% for FY21. The budget however relies heavily on non tax revenues to bridge the revenue shortfall next year with a bulk of revenues expected from disinvestment (INR 2.1 lakh cr), telecom receipts (INR 1.33 lakh cr) and RBI/PSU dividends (INR 1.55 lakh cr).
The bond markets were surprised as the budget did not propose any extra borrowing for FY20 against market expectation of INR 30,000 Cr. The nominal GDP growth for FY 21 was budgeted to rise by 10% which appears reasonable, though still 2.5% above the level for FY 20. For FY21, the net g-sec borrowing is budgeted to increase to INR 5.45 trillion from INR 4.74 trillion. The gross borrowing for FY21 is pegged at INR 7.8 trillion which came in line with market expectation. Bonds reacted positively post budget by 10bps in 10yr as the borrowing numbers came in line with market expectation and market positioning was light before the budget.
Outlook
We expect the bond market to remain positive in the near term as demand and supply dynamics is favorable due to fiscal year end investment demand from Insurance and Provident funds. Continuance of operation twist could further help push yields lower. There are also positive sentiments due to the likelihood of India being included in global bond indices and a proposed increase in FPI limits for corporate bonds to 15%.
Despite opting for prudence over a big bang stimulus and realistic forecasts, downside risks exist. Delayed recovery to a 10% nominal rate is the biggest risk given the continuing

5
EQ
UIT
Y F
UN
DS
R
EC
KO
NE
R
Sche
me
Nam
ePG
IM In
dia
Larg
e Ca
p Fu
ndPG
IM In
dia
Dive
rsifi
ed E
quity
Fun
dPG
IM In
dia
Mid
cap
Oppo
rtun
ities
Fun
dPG
IM In
dia
Long
Ter
m E
quity
Fun
d
Idea
l Inv
estm
ent H
oriz
on $
3 Ye
ars+
3 Ye
ars+
4 Ye
ars+
3 Ye
ars+
Ince
ptio
n Da
teRe
gula
r Pla
n: 2
1/01
/200
3; D
irect
Pla
n: 0
1/01
/201
3Re
gula
r Pla
n: 0
4/03
/201
5; D
irect
Pla
n: 0
4/03
/201
5Re
gula
r Pla
n: 0
2/12
/201
3; D
irect
Pla
n: 0
2/12
/201
3Re
gula
r Pla
n: 1
1/12
/201
5; D
irect
Pla
n: 1
1/12
/201
5
Fund
Man
ager
Alok
Aga
rwal
is m
anag
ing
sinc
e Ju
ly 27
, 201
7An
irudd
ha N
aha
is m
anag
ing
sinc
e Ap
ril 0
5, 2
018
Aniru
ddha
Nah
a is
man
agin
g si
nce
April
05,
201
8Sr
iniv
as R
ao R
avur
i is
man
agin
g si
nce
Sept
embe
r 14,
201
9
Benc
hmar
kNi
fty 5
0 TR
Inde
xS&
P BS
E 20
0 TR
Inde
xNi
fty M
idca
p 10
0 TR
Inde
xS&
P BS
E 20
0 TR
Inde
x
Fund
Det
ails
as
on Ja
nuar
y 31
, 202
0
Mon
th E
nd A
UM (i
n Cr
ores
)32
8.59
136.
0115
0.99
354.
19
Port
folio
Turn
over
(Las
t 1 y
ear)
1.30
1.66
1.65
1.13
Stan
dard
Dev
iatio
n of
Fun
d (A
nnua
l)13
.33%
13.5
0%15
.69%
12.3
9%
Stan
dard
Dev
iatio
n of
Ben
chm
ark
(Ann
ual)
13.7
5%12
.91%
17.2
2%12
.91%
Beta
0.95
1.00
0.86
0.92
Shar
pe R
atio
**0.
530.
330.
330.
38
** R
isk
free
rate
ass
umed
to
be 6
.69%
(ba
sed
on M
IBOR
as
on
31/0
1/20
20)
** R
isk
free
rate
ass
umed
to
be 6
.17%
(ba
sed
on M
IBOR
as
on
31/0
1/20
20)
** R
isk
free
rate
ass
umed
to
be 6
.69%
(ba
sed
on M
IBOR
as
on
31/0
1/20
20)
** R
isk
free
rate
ass
umed
to
be 6
.17%
(ba
sed
on M
IBOR
as
on
31/0
1/20
20)
Port
folio
Cla
ssifi
catio
n (%
) as
on Ja
nuar
y 31
, 202
0
Larg
e Ca
p (%
) (1s
t-10
0th
stoc
k) 8
5.64
5
1.42
6
.57
71.
01
Mid
Cap
(%) (
101s
t-25
0th
stoc
k) 7
.63
21.
83
67.
62
13.
54
Smal
l Cap
(%) (
251s
t sto
ck o
nwar
ds)
1.9
3 2
3.96
2
2.46
1
2.29
Cash
(%)
4.8
0 2
.79
3.3
5 3
.16
Not C
lass
ified
(%)
——
——
Port
folio
Cla
ssifi
catio
n By
Indu
stry
Allo
catio
n (%
) as
on Ja
nuar
y 31
, 202
0
Port
folio
Cla
ssifi
catio
n By
Indu
stry
Allo
catio
n (%
) (T
op 1
0)In
dust
ry%
to N
et
Asse
ts
Bank
s25
.64
Fina
nce
17.7
2
Softw
are
11.1
5
Petro
leum
Pro
duct
s9.
72
Cons
umer
Non
Dur
able
s7.
39
Auto
3.86
Phar
mac
eutic
als
3.51
Cons
truct
ion
Proj
ect
3.13
Cem
ent
2.98
Ferro
us M
etal
s2.
04
Indu
stry
% to
Net
As
sets
Fina
nce
17.8
5
Bank
s12
.89
Softw
are
10.5
1
Cons
umer
Dur
able
s8.
71
Cem
ent
6.58
Chem
ical
s5.
16
Petro
leum
Pro
duct
s4.
98
Auto
3.92
Auto
Anc
illar
ies
3.69
Cons
umer
Non
Dur
able
s3.
38
Indu
stry
% to
Net
As
sets
Fina
nce
15.9
8
Bank
s9.
82
Cons
umer
Dur
able
s8.
51
Phar
mac
eutic
als
7.40
Pest
icid
es6.
29
Cons
umer
Non
Dur
able
s6.
14
Auto
5.23
Text
ile P
rodu
cts
4.27
Softw
are
4.26
Auto
Anc
illar
ies
3.63
Indu
stry
% to
Net
As
sets
Bank
s26
.78
Softw
are
13.7
8
Petro
leum
Pro
duct
s11
.34
Phar
mac
eutic
als
6.64
Cons
umer
Non
Dur
able
s5.
37
Fina
nce
5.15
Powe
r4.
02
Ferti
liser
s3.
98
Cons
truct
ion
Proj
ect
3.56
Cem
ent
2.96
Othe
r Det
ails
Exit
Load
Refe
r pag
e no
. 7Re
fer p
age
no. 8
Refe
r pag
e no
. 9Ni
l
Sour
ce: B
loom
berg
.
$ In
vest
ors
shou
ld c
onsu
lt th
eir f
inan
cial
adv
isor
for t
ax im
plic
atio
ns o
n th
eir i
nves
tmen
ts.

6
Sche
me
Nam
ePG
IM In
dia
Hybr
id E
quity
Fun
dPG
IM In
dia
Euro
Equ
ity F
und
PGIM
Indi
a Gl
obal
Equ
ity O
ppor
tuni
ties
Fund
PGIM
Indi
a Ar
bitr
age
Fund
PGIM
Indi
a Eq
uity
Sav
ings
Fun
d
Idea
l Inv
estm
ent H
oriz
on $
2 Ye
ars+
3 Ye
ars+
3 Ye
ars+
3 M
onth
s+2
Year
s+
Ince
ptio
n Da
teRe
gula
r Pla
n: 2
9/01
/200
4; D
irect
Pla
n: 0
1/01
/201
3Re
gula
r Pla
n: 1
1/09
/200
7; D
irect
Pla
n: 0
1/01
/201
3Re
gula
r Pla
n: 1
4/05
/201
0; D
irect
Pla
n: 0
1/01
/201
3Re
gula
r Pla
n: 2
7/08
/201
4; D
irect
Pla
n: 2
7/08
/201
4Re
gula
r Pla
n: 2
9/01
/200
4; D
irect
Pla
n: 0
1/01
/201
3
Fund
Man
ager
Alok
Aga
rwal
(Equ
ity p
ortio
n) is
man
agin
g si
nce
June
201
6 an
d Ku
mar
esh
Ram
akris
hnan
(Deb
t po
rtion
) is
man
agin
g si
nce
April
05,
201
8
Alok
Aga
rwal
is m
anag
ing
sinc
e Ju
ly 27
, 201
7Al
ok A
garw
al is
man
agin
g si
nce
July
27, 2
017
Utka
rsh
Katk
oria
is m
anag
ing
sinc
e M
arch
201
6 an
d Hi
tash
Dan
g (E
quity
Mar
ket)
is m
anag
ing
sinc
e M
ay 2
017
and
Kum
ares
h Ra
mak
rishn
an
(Deb
t Mar
ket)
is m
anag
ing
sinc
e Au
gust
201
4
Alok
Aga
rwal
(Equ
ity P
ortio
n) is
man
agin
g si
nce
Augu
st 2
016
and
Kum
ares
h Ra
mak
rishn
an (D
ebt
Porti
on) i
s m
anag
ing
sinc
e Ap
ril 0
5, 2
018
Benc
hmar
kCR
ISIL
Hyb
rid 3
5+65
- Ag
gres
ive
Inde
xM
SCI E
MU
Inde
xM
SCI A
ll Co
untri
es W
orld
Inde
xNi
fty 5
0 Ar
bitra
ge T
R In
dex
70%
of t
he N
IFTY
50
Arbi
trage
TR
Inde
x and
30%
of
the
NIFT
Y 50
TR
Inde
x
Fund
Det
ails
as
on Ja
nuar
y 31
, 202
0
Mon
th E
nd A
UM (i
n Cr
ores
)14
3.83
2.83
48.9
417
2.66
35.7
3
Port
folio
Tur
nove
r (La
st 1
yea
r)1.
05 (F
or E
quity
)—
—2.
490.
47 (F
or E
quity
)
Stan
dard
Dev
iatio
n of
Fun
d (A
nnua
l)3
year
s: 8
.54%
; 6 y
ears
: 11.
29%
——
1.08
%4.
39%
Stan
dard
Dev
iatio
n of
Ben
chm
ark
(Ann
ual)
3 ye
ars:
8.1
1%; 6
yea
rs: 8
.91%
——
1.36
%17
.83%
Beta
3 ye
ars:
0.9
8; 6
yea
rs: 1
.19
——
0.42
0.12
Shar
pe R
atio
**3
year
s: -0
.02;
6 y
ears
: 0.3
8—
—-0
.24
0.55
** R
isk
free
rate
ass
umed
to b
e 6.
69%
(bas
ed
on M
IBOR
as
on 3
1/01
/202
0)—
—**
Ris
k fre
e ra
te a
ssum
ed to
be
6.17
% (b
ased
on
MIB
OR a
s on
31/
01/2
020)
** R
isk
free
rate
ass
umed
to b
e 6.
69%
(bas
ed
on M
IBOR
as
on 3
1/01
/202
0)
Port
folio
Cla
ssifi
catio
n (%
) as
on Ja
nuar
y 31
, 202
0 #
Larg
e Ca
p (%
) (1s
t-10
0th
stoc
k) 8
7.14
—
——
—
Mid
Cap
(%) (
101s
t-25
0th
stoc
k) 1
0.71
—
——
—
Smal
l Cap
(%) (
251s
t sto
ck o
nwar
ds)
2.1
4 —
——
—
Cash
(%)
——
——
—
Not C
lass
ified
(%)
——
——
—
Port
folio
Cla
ssifi
catio
n By
Indu
stry
Allo
catio
n (%
) as
on Ja
nuar
y 31
, 202
0
Port
folio
Cla
ssifi
catio
n By
Indu
stry
Allo
catio
n (%
) (T
op 1
0)In
dust
ry%
to N
et
Asse
ts
Bank
s22
.92
Fina
nce
13.4
8
Petro
leum
Pro
duct
s9.
53
Softw
are
5.91
Cons
umer
Non
Dur
able
s5.
40
Phar
mac
eutic
als
5.07
Auto
3.91
Cons
truct
ion
Proj
ect
3.57
Cem
ent
2.33
Text
ile P
rodu
cts
1.61
Indu
stry
% to
Net
As
sets
Fina
nce
18.2
0
Cons
umer
Dis
cret
iona
ry13
.88
Indu
stria
ls12
.33
IT11
.10
Mat
eria
ls9.
44
Publ
ic U
tiliti
es8.
85
Cons
umer
Sta
ples
8.51
Ener
gy6.
76
Heal
th5.
68
Tele
com
mun
icat
ions
3.59
Indu
stry
% to
Net
As
sets
Cons
umer
Dis
cret
iona
ry35
.8
Info
rmat
ion
Tech
nolo
gy27
.8
Heal
thca
re17
.0
Com
mun
icat
ion
Serv
ices
7.2
Indu
stria
ls6.
4
Cons
umer
Sta
ples
2.4
Mat
eria
ls2.
3
Indu
stry
% to
Net
As
sets
Fina
nce
9.55
Cons
umer
Non
Dur
able
s9.
00
Bank
s7.
16
Petro
leum
Pro
duct
s6.
13
Cem
ent
5.82
Powe
r5.
59
Cons
umer
Dur
able
s3.
77
Ferro
us M
etal
s2.
67
Softw
are
2.44
Tran
spor
tatio
n2.
28
Indu
stry
% to
Net
As
sets
Bank
s18
.32
Fina
nce
11.5
9
Tele
com
- Se
rvic
es9.
52
Softw
are
8.81
Petro
leum
Pro
duct
s7.
90
Cons
umer
Dur
able
s3.
49
Auto
2.47
Phar
mac
eutic
als
1.34
Cons
truct
ion
Proj
ect
1.34
Cons
umer
Non
Dur
able
s1.
32
Othe
r Det
ails
Exit
Load
Refe
r pag
e no
. 11
with
in 1
year
- 1%
with
in 1
year
- 1%
with
in 3
0 da
ys -
0.50
%Re
fer p
age
no. 1
5
Sour
ce: B
loom
berg
. # T
he a
bove
dat
a is
giv
en fo
r equ
ity a
lloca
tion.
$ In
vest
ors
shou
ld c
onsu
lt th
eir f
inan
cial
adv
isor
for t
ax im
plic
atio
ns o
n th
eir i
nves
tmen
ts.
EQ
UIT
Y F
UN
DS
R
EC
KO
NE
R

7
Performance (CAGR)Fund Nifty 50 TR Index^ SENSEX TR Index #
Period Returns (%) Value (INR)* Returns (%) Value (INR)* Returns (%) Value (INR)*
Regular Plan - Growth Option
Last 1 Year 12.06 11,205.51 11.84 11,184.43 13.59 11,358.87
Last 3 Years 10.20 13,381.14 13.29 14,539.51 15.16 15,271.98
Last 5 Years 6.51 13,711.57 7.68 14,479.16 8.29 14,898.05
Since Inception 18.38 1,76,524.01 17.09 1,46,456.02 17.84 1,63,343.19
Direct Plan - Growth Option
Last 1 Year 13.43 11,343.09 11.84 11,184.43 13.59 11,358.87
Last 3 Years 11.83 13,986.43 13.29 14,539.51 15.16 15,271.98
Last 5 Years 8.07 14,742.94 7.68 14,479.16 8.29 14,898.05
Since Inception 13.37 24,323.95 11.73 21,945.95 12.41 22,899.25
Date of Inception: Regular Plan: January 21, 2003; Direct Plan: January 01, 2013. CAGR – Compounded Annual Growth Rate
^ Scheme Benchmark. # Standard Benchmark. *Based on standard investment of ` 10,000 made at the beginning of the relevant period. Past performance may or may not be sustained in future and should not be used as a basis for comparison with other investments.
Different plans have a different expense structure. For Total Expense Ratio as on January 31, 2020 refer page no. 28
Alok Agarwal is managing this fund since July 27, 2017. For performance of schemes managed by Alok Agarwal refer page no. 7, 11-13, 15, 28
For SIP Performance, please refer page no. 29
Portfolio Classification (%)Large Cap (%) (1st-100th stock) 85.64
Mid Cap (%) (101st-250th stock) 7.63
Small Cap (%) (251st stock onwards) 1.93
Cash (%) 4.80
Regular Plan and Direct Plan are available for subscription as per the below details
Inception Date: Regular Plan: 21/01/2003, Direct Plan: 01/01/2013. Application Amount: ` 5000/- and in multiples of ` 1/- thereafter. Additional Purchase Amount: ` 1000/- and in multiples of `1/-thereafter or 100 units. Repurchase / Redemption Amount: Minimum of ` 100/- and in multiples of ` 1/- thereafter or 0.1 unit or account balance whichever is lower. SIP/STP/SWP: Available. Investment Amount for SIP/STP/SWP: SIP/STP: Monthly: 10 installments of ` 500/- each and in multiples of ` 1/- thereafter. Quarterly: 5 installments of ` 1000/- each and in multiples of ` 1/- thereafter. STP Daily: 60 installments of ` 100/- and in multiples of ` 100/- thereafter from PGIM India Insta Cash Fund. SWP (Monthly and Quarterly): 2 (two) installments of ` 100/-.
Fund Details
Investment Style Box:
Investment Objective: To generate long term capital growth from a diversified portfolio of equity and equity related securities of predominantly large cap companies.
Fund Manager: Mr. Alok Agarwal (Over 17 years of experience in equity market & Finance).
Benchmark: Nifty 50 TR Index
Option: Dividend (Payout/Reinvestment) and Growth.
Quarterly (Oct-Dec 2019) Average AUM (` in Cr): 323.85
Monthly Average AUM (` in Cr): 332.64
AUM as on 31/01/2020 (` in Cr.): 328.59
Portfolio Turnover: 1.30
Volatility Measures (6 Years):
Standard Deviation of Fund (Annual): 13.33%
Standard Deviation of Benchmark (Annual): 13.75%
Beta: 0.95 Sharpe Ratio***: 0.53 Tracking Error: 2.68%
*** Risk Free Rate assumed to be 6.69% (based on MIBOR as on 31/01/2020)
Fund Manager's Report: During the month the fund increased weightage in Cement; decreased weightage in Banks and Software.
NAV: Regular Plan Direct PlanGrowth ` 177.26 ` 193.74Dividend ` 15.80 ` 20.63
Load Structure$: Entry Load: NA. Exit Load: 10% of the units allotted may be redeemed without any exit load on or before 12 months from the date of allotment; Any redemptions in excess of the above mentioned limit would be subject to an exit load of 1%, if the units are redeemed on or before completion of 12 months from the date of allotment of units; Nil - If the units are redeemed after completion of 12 months from the date of allotment of units.
$No exit load will be charged for switches and STP between Schemes of PGIM India Mutual Fund except from PGIM India Insta Cash Fund.
PortfolioIssuer % to Net AssetsAuto 3.86Maruti Suzuki India Ltd. 2.74Mahindra & Mahindra Ltd. 1.12Banks 25.64HDFC Bank Ltd. 10.19ICICI Bank Ltd. 6.40Kotak Mahindra Bank Ltd. 6.28Axis Bank Ltd. 2.77Cement 2.98Ultratech Cement Ltd. 1.29ACC Ltd. 1.19Ambuja Cements Ltd. 0.50Chemicals 0.94Vinati Organics Ltd. 0.91Aarti Surfactants Ltd. 0.03Construction Project 3.13Larsen & Toubro Ltd. 3.13Consumer Durables 0.01Blue Star Ltd. 0.01Consumer Non Durables 7.39Hindustan Unilever Ltd. 3.10ITC Ltd. 1.54Tata Global Beverages Ltd. 1.17United Spirits Ltd. 1.13Kansai Nerolac Paints Ltd. 0.46Ferrous Metals 2.04JSW Steel Ltd. 0.99Tata Steel Ltd. 0.88Tata Metaliks Ltd. 0.17Fertilisers 0.61Coromandel International Ltd. 0.61Finance 17.72Housing Development Finance Corporation Ltd. 5.66Bajaj Finance Ltd. 4.45HDFC Life Insurance Company Ltd. 3.19ICICI Lombard General Insurance Co. Ltd. 2.01
Issuer % to Net AssetsCan Fin Homes Ltd. 1.25ICICI Prudential Life Insurance Co Ltd. 1.17Gas 0.85Indraprastha Gas Ltd. 0.85Minerals/Mining 0.50Coal India Ltd. 0.50Non - Ferrous Metals 1.04Hindalco Industries Ltd. 1.04Oil 0.50Oil & Natural Gas Corporation Ltd. 0.50Petroleum Products 9.72Reliance Industries Ltd. 9.11Mangalore Refinery & Petrochemicals Ltd. 0.61Pharmaceuticals 3.51Cipla Ltd. 1.24Sun Pharmaceutical Industries Ltd. 1.19Divi's Laboratories Ltd. 0.59Astrazeneca Pharma India Ltd. 0.49Power 1.03NTPC Ltd. 0.52Power Grid Corporation Of India Ltd. 0.51Software 11.15Infosys Ltd. 6.38Tata Consultancy Services Ltd. 1.98Hexaware Technologies Ltd. 1.11HCL Technologies Ltd. 1.08L&T Technology Services Ltd. 0.61Telecom - Services 0.72Bharti Airtel Ltd. 0.72Textile Products 1.75Page Industries Ltd. 1.75Equity Holdings Total 95.07Margin Fixed Deposit 3.20HDFC Bank Ltd. 3.20Cash & Current Assets 1.74Total 100.00
This product is suitable for investors who are seeking*
• Capital growth over the long term
• Investment predominantly in equity and equity related securities of Large Cap companies.
• Degree of risk – MODERATELY HIGH
* Investors should consult their financial advisers if in doubt about whether the product is suitable for them.
Moderate
Moderately
Low
Low
ModeratelyHigh
High
LOW HIGH
Moderately High — investors understand that their principal will be at moderately high risk.
Dividend HistoryRegular Plan Direct Plan
Record Date
Dividend/unit (`)#
NAV (`) Dividend/unit (`)#
NAV (`)
27-Jun-16 0.50 18.37 0.18 19.4629-Sep-16 0.50 19.18 0.50 20.7729-Dec-16 0.50 17.40 0.45 18.9424-Mar-17 1.00 19.12 0.22 21.0129-Jun-17 0.50 19.01 0.50 21.9128-Sep-17 0.50 18.92 0.60 21.9628-Dec-17 0.50 19.58 0.60 22.8123-Mar-18 1.29 17.91 1.56 20.9302-Jul-18 0.44 17.40 0.44 20.3628-Sep-18 0.44 17.17 0.44 20.2428-Dec-18 0.44 16.15 0.44 19.2025-Mar-19 0.44 16.32 0.44 19.5528-Jun-19 0.44 16.78 — —27-Sep-19 0.44 15.99 — —26-Dec-19 0.35 16.31 0.30 21.09
# On face value of ̀ 10. Post Dividend per unit NAV will fall to the extent of the payout and applicable tax/surcharges/cess/other statutory levies. Dividend distribution is subject to availability of distributable surplus. Past Performance may or may not be sustained in future.
Details as on January 31, 2020
Large Cap Fund - An Open - Ended Equity Scheme Predominantly Investing in Large Cap StocksLARGE CAP FUNDPGIM INDIA

8
Portfolio Classification (%)
Large Cap (%) (1st-100th stock) 51.42
Mid Cap (%) (101st-250th stock) 21.83
Small Cap (%) (251st stock onwards) 23.96
Cash (%) 2.79
Regular Plan and Direct Plan are available for subscription as per the below details
Inception Date: Regular Plan: 04/03/2015, Direct Plan: 04/03/2015. Application Amount: ` 100/- and in multiples of ` 1/- thereafter. Additional Purchase Amount: ` 100/- and in multiples of ` 1/- thereafter. Repurchase / Redemption Amount: Minimum of ` 100/- and in multiples of ` 1/- thereafter or 0.1 unit or account balance whichever is lower. SIP/STP/SWP: Available. Investment Amount for SIP/STP/SWP: SIP/STP: Monthly: 60 installments of ` 100/- each and in multiples of ` 1/- thereafter. Quarterly: 20 installments of ` 300/- each and in multiples of ` 1/- thereafter. STP Daily: 60 installments of ` 100/- and in multiples of ` 100/- thereafter from PGIM India Insta Cash Fund. SWP (Monthly and Quarterly): 2 (two) installments of ` 100/-
Fund Details
Investment Style Box:
Investment Objective: To generate income & capital appreciation by predominantly investing in an actively managed diversified portfolio of equity & equity related instruments including derivatives.
Fund Manager: Mr. Aniruddha Naha (Over 18 years of experience in the equity and debt market)
Benchmark: Nifty 500 TR Index
Option: Dividend (Payout/Reinvestment) and Growth.
Quarterly (Oct-Dec 2019) Average AUM (` in Cr): 121.33
Monthly Average AUM (` in Cr): 131.48
AUM as on 31/01/2020 (` in Cr.): 136.01
Portfolio Turnover: 1.66
Volatility Measures (4 Years):
Standard Deviation of Fund (Annual): 13.50%
Standard Deviation of Benchmark (Annual): 12.91%
Beta: 1.00 Sharpe Ratio***: 0.33 Tracking Error: 3.98%
*** Risk Free Rate assumed to be 6.17% (based on MIBOR as on 31/01/2020)
Fund Manager's Report: During the month the fund increased weightage in Chemicals and Telecom Services; decreased weightage in Banks and Petroleum Products.
NAV Regular Plan Direct Plan
Growth ` 14.24 ` 15.22
Dividend ` 11.57 ` 12.07
Load Structure$: Entry Load: NA. Exit Load: 10% of the units allotted may be redeemed without any exit load on or before 12 months from the date of allotment; Any redemptions in excess of the above mentioned limit would be subject to an exit load of 1%, if the units are redeemed on or before completion of 12 months from the date of allotment of units; Nil - If the units are redeemed after completion of 12 months from the date of allotment of units.
$No exit load will be charged for switches and STP between Schemes of PGIM India Mutual Fund except from PGIM India Insta Cash Fund.
This product is suitable for investors who are seeking*
• Capital appreciation over long term.
• To generate income and capital appreciation by predominantly investing in an actively managed diversified portfolio of equity and equity related instruments including derivatives.
• Degree of risk – MODERATELY HIGH
* Investors should consult their financial advisers if in doubt about whether the product is suitable for them.
Moderate
Moderately
Low
Low
ModeratelyHigh
High
LOW HIGH
Moderately High — investors understand that their principal will be at moderately
high risk.
Performance (CAGR)Fund Nifty 500 TR Index^ NIFTY 50 TR Index #
Period Returns (%) Value (INR)* Returns (%) Value (INR)* Returns (%) Value (INR)*
Regular Plan - Growth Option
Last 1 Year 14.84 11,483.87 10.83 11,083.09 11.84 11,184.43
Last 3 Years 10.03 13,320.86 11.53 13,874.69 13.29 14,539.51
Since Inception 7.46 14,240.00 7.64 14,362.76 7.51 14,278.10
Direct Plan - Growth Option
Last 1 Year 16.99 11,698.69 10.83 11,083.09 11.84 11,184.43
Last 3 Years 12.08 14,079.56 11.53 13,874.69 13.29 14,539.51
Since Inception 8.69 15,063.18 7.64 14,362.76 7.51 14,278.10
Date of Inception: Regular Plan: March 04, 2015; Direct Plan: March 04, 2015. CAGR – Compounded Annual Growth Rate^ Scheme Benchmark. # Standard Benchmark. *Based on standard investment of ` 10,000 made at the beginning of the relevant period. Past performance may or may not be sustained in future and should not be used as a basis for comparison with other investments.w.e.f. November 01, 2019 benchmark of the scheme has been changed from S&PBSE 200 TR Index to Nifty 500 TR Index.Last 5 years retuns are not provided since scheme has not completed 5 years.Different plans have a different expense structure. For Total Expense Ratio as on January 31, 2020 refer page no. 28Aniruddha Naha is managing this fund since April 05, 2018. For performance of schemes managed by Aniruddha Naha refer page no. 8, 9For SIP Performance, please refer page no. 29
PortfolioIssuer % to Net AssetsAuto 3.92Maruti Suzuki India Ltd. 2.54Eicher Motors Ltd. 1.12Tata Motors Ltd. 0.26Auto Ancillaries 3.69Subros Ltd. 1.43MRF Ltd. 1.40GNA Axles Ltd. 0.46Motherson Sumi Systems Ltd. 0.39Banks 12.89ICICI Bank Ltd. 5.18Axis Bank Ltd. 4.56HDFC Bank Ltd. 3.16Cement 6.58Ultratech Cement Ltd. 2.92ACC Ltd. 2.49Birla Corporation Ltd. 1.17Chemicals 5.16Vinati Organics Ltd. 1.96Aarti Industries Ltd. 1.58Phillips Carbon Black Ltd. 0.92Nocil Ltd. 0.70Construction Project 1.01Larsen & Toubro Ltd. 1.01Consumer Durables 8.71Dixon Technologies (India) Ltd. 4.11Voltas Ltd. 3.06Whirlpool Of India Ltd. 1.55Consumer Non Durables 3.38Tata Global Beverages Ltd. 3.38Ferrous Metals 3.23APL Apollo Tubes Ltd. 1.45Tata Steel Ltd. 0.97
Issuer % to Net AssetsMaithan Alloys Ltd. 0.82Fertilisers 1.33Chambal Fertilizers & Chemicals Ltd. 1.33Finance 17.85Bajaj Finance Ltd. 5.62ICICI Lombard General Insurance Co. Ltd. 3.39Mahindra & Mahindra Financial Services Ltd 2.17Cholamandalam Investment & Finance Co. Ltd. 1.93ICICI Prudential Life Insurance Co Ltd. 1.50HDFC Life Insurance Company Ltd. 1.32Max Financial Services Ltd. 1.12Nippon Life India Asset Management Ltd. 0.80Industrial Products 3.17Timken India Ltd. 2.33Ramkrishna Forgings Ltd. 0.83Pesticides 2.84Bharat Rasayan Ltd. 2.84Petroleum Products 4.98Reliance Industries Ltd. 3.63Bharat Petroleum Corporation Ltd. 1.34Pharmaceuticals 2.87Divi's Laboratories Ltd. 2.87Software 10.51Tata Elxsi Ltd. 3.49Larsen & Toubro Infotech Ltd. 3.42Majesco Ltd. 2.07Tata Consultancy Services Ltd. 1.53Telecom - Services 2.19Bharti Airtel Ltd. 2.19Textile Products 2.87Page Industries Ltd. 2.87Cash & Current Assets 2.79Total 100.00
Dividend History
Regular Plan Direct Plan
Record Date
Dividend/unit (`)#
NAV (`) Dividend/unit (`)#
NAV (`)
28-Sep-17 0.25 12.55 0.27 12.81
28-Dec-17 0.25 13.36 0.27 13.67
23-Mar-18 1.39 12.14 1.40 12.44
02-Jul-18 0.22 11.04 0.22 11.39
28-Sep-18 0.22 10.40 0.22 10.78
28-Dec-18 — — 0.16 10.64
# On face value of ̀ 10. Post Dividend per unit NAV will fall to the extent of the payout and applicable tax/surcharges/cess/other statutory levies. Dividend distribution is subject to availability of distributable surplus. Past Performance may or may not be sustained in future.
Details as on January 31, 2020
DIVERSIFIED EQUITY FUNDPGIM INDIA
Multi Cap Fund - An open ended equity scheme investing across large cap, mid cap, small cap stocks

9
Details as on January 31, 2020
This product is suitable for investors who are seeking*• Capital appreciation over long run.• To achieve long term capital appreciation by
predominantly investing in equity and equity related instruments of mid cap companies.
• Degree of risk – MODERATELY HIGH
* Investors should consult their financial advisers if in doubt about whether the product is suitable for them.
Moderate
Moderately
Low
Low
ModeratelyHigh
High
LOW HIGH
Moderately High — investors understand that their principal will be at moderately
high risk.
Fund Details
Investment Style Box:
Investment Objective: The primary objective of the Scheme is to achieve long-term capital appreciation by predominantly investing in equity & equity related instruments of mid cap companies.
Fund Manager: Mr. Aniruddha Naha (Over 18 years of experience in the equity and debt market)
Benchmark: Nifty Midcap 100 TR Index
Option: Dividend (Payout / Reinvestment) and Growth.
Quarterly (Oct-Dec 2019) Average AUM (` in Cr): 124.71
Monthly Average AUM (` in Cr): 140.99
AUM as on 31/01/2020 (` in Cr): 150.99
Portfolio Turnover: 1.65
Volatility Measures (6 Years):
Standard Deviation of Fund (Annual): 15.69%
Standard Deviation of Benchmark (Annual): 17.22%
Beta: 0.86 Sharpe Ratio***: 0.33 Tracking Error: 5.70%
*** Risk Free Rate assumed to be 6.69% (based on MIBOR as on 31/01/2020)
Fund Manager's Report: During the month the fund increased weightage in Finance and Petroleum Products; decreased weightage in Auto Ancillaries and Ferrous Metals.
NAV: Regular Plan Direct PlanGrowth ` 19.54 ` 20.80Dividend ` 11.84 ` 17.25
Load Structure$: Entry Load: NA. Exit Load: 10% of the units allotted may be redeemed without any exit load on or before 12 months from the date of allotment; Any redemptions in excess of the above mentioned limit would be subject to an exit load of 1%, if the units are redeemed on or before completion of 12 months from the date of allotment of units; Nil - If the units are redeemed after completion of 12 months from the date of allotment of units.
$No exit load will be charged for switches and STP between Schemes of PGIM India Mutual Fund except from PGIM India Insta Cash Fund.
Regular Plan and Direct Plan are available for subscription as per the below details
Inception Date: Regular Plan: 02/12/2013, Direct Plan: 02/12/2013. Application Amount: ` 5000/- and in multiples of ` 1/- thereafter. Additional Purchase Amount: ` 1000/- and in multiples of ` 1/- thereafter or 100 units. Repurchase / Redemption Amount: Minimum of ` 100/- and in multiples of ` 1/- thereafter or 0.1 unit or account balance whichever is lower. SIP/STP/SWP: Available. Investment Amount for SIP/STP/SWP: SIP/STP: Monthly: 10 installments of ` 500/- each and in multiples of ` 1/- thereafter. Quarterly: 5 installments of ` 1000/- each and in multiples of ` 1/- thereafter. STP Daily: 60 installments of ` 100/- and in multiples of ` 100/- thereafter from PGIM India Insta Cash Fund. SWP (Monthly and Quarterly): 2 (two) installments of ` 100/-
Performance (CAGR)Fund Nifty Midcap 100 TR Index^ NIFTY 50 TR Index #
Period Returns (%) Value (INR)* Returns (%) Value (INR)* Returns (%) Value (INR)*Regular Plan - Growth Option
Last 1 Year 14.47 11,446.98 7.56 10,756.34 11.84 11,184.43 Last 3 Years 6.21 11,980.38 6.46 12,065.21 13.29 14,539.51 Last 5 Years 5.07 12,806.45 7.69 14,489.62 7.68 14,479.16
Since Inception 11.47 19,540.00 15.94 24,901.48 12.57 20,755.57 Direct Plan - Growth Option
Last 1 Year 16.14 11,613.62 7.56 10,756.34 11.84 11,184.43 Last 3 Years 7.85 12,545.24 6.46 12,065.21 13.29 14,539.51 Last 5 Years 6.28 13,561.58 7.69 14,489.62 7.68 14,479.16 Since Inception 12.28 20,427.76 15.94 24,901.48 12.57 20,755.57
Date of Inception: Regular Plan: December 02, 2013; Direct Plan: December 02, 2013. CAGR – Compounded Annual Growth Rate^ Scheme Benchmark. # Standard Benchmark. *Based on standard investment of ` 10,000 made at the beginning of the relevant period. Past performance may or may not be sustained in future and should not be used as a basis for comparison with other investments.Different plans have a different expense structure. For Total Expense Ratio as on January 31, 2020 refer page no. 28W.e.f. April 02, 2018, the benchmark has been renamed from Nifty Free Float Midcap 100 Index to Nifty Midcap 100 TR IndexAniruddha Naha is managing this fund since April 05, 2018. For performance of schemes managed by Aniruddha Naha refer page no. 8, 9. For SIP Performance, please refer page no. 29
Dividend HistoryRegular Plan Direct Plan
Record Date
Dividend/unit (`)#
NAV (`) Dividend/unit (`)#
NAV (`)
28-Mar-16 0.25 12.49 0.25 12.6329-Sep-16 0.30 14.44 — —29-Dec-16 0.30 12.84 — —24-Mar-17 0.30 14.55 — —29-Jun-17 0.30 14.99 — —28-Sep-17 0.30 14.50 — —28-Dec-17 0.30 16.18 — —23-Mar-18 1.33 14.31 — —02-Jul-18 0.27 13.18 — —28-Sep-18 0.27 11.77 — —28-Dec-18 0.27 11.51 — —25-Mar-19 0.27 11.38 — —28-Jun-19 0.27 11.22 — —
# On face value of ̀ 10. Post Dividend per unit NAV will fall to the extent of the payout and applicable tax/surcharges/cess/other statutory levies. Dividend distribution is subject to availability of distributable surplus. Past Performance may or may not be sustained in future.
Issuer % to Net AssetsAuto 5.23Escorts Ltd. 2.66Ashok Leyland Ltd. 1.49V.S.T Tillers Tractors Ltd. 1.08Auto Ancillaries 3.63Sharda Motor Industries Ltd. 1.93Balkrishna Industries Ltd. 1.70Banks 9.82City Union Bank Ltd. 3.45AU Small Finance Bank Ltd. 2.82RBL Bank Ltd. 2.00DCB Bank Ltd. 0.94The Federal Bank Ltd. 0.60Cement 3.10The Ramco Cements Ltd. 3.10Chemicals 3.25Atul Ltd. 3.25Construction 1.54Kajaria Ceramics Ltd. 1.54Consumer Durables 8.51Voltas Ltd. 3.45Whirlpool Of India Ltd. 3.11Relaxo Footwears Ltd. 1.95Consumer Non Durables 6.14Tata Global Beverages Ltd. 3.94Balrampur Chini Mills Ltd. 2.20Ferrous Metals 1.82APL Apollo Tubes Ltd. 1.82Fertilisers 3.14Coromandel International Ltd. 3.14Finance 15.98Bajaj Finance Ltd. 4.05Cholamandalam Investment & Finance Co. Ltd. 2.82
Portfolio
Issuer % to Net AssetsMax Financial Services Ltd. 2.68Can Fin Homes Ltd. 2.68Muthoot Finance Ltd. 2.53Mahindra & Mahindra Financial Services Ltd 1.22Gas 1.75Indraprastha Gas Ltd. 1.75Industrial Capital Goods 2.11CMI FPE Ltd. 2.11Industrial Products 2.34Ramkrishna Forgings Ltd. 2.34Pesticides 6.29Bharat Rasayan Ltd. 3.20P I Industries Limited 3.09Petroleum Products 1.60Mangalore Refinery & Petrochemicals Ltd. 1.60Pharmaceuticals 7.40IPCA Laboratories Ltd. 2.25Abbott India Ltd. 2.07Alembic Pharmaceuticals Ltd. 1.25Syngene International Ltd. 1.04Alkem Laboratories Ltd. 0.79Retailing 1.64Trent Ltd. 1.64Services 2.81Indian Railway Catering &Tou. Corp. Ltd. 2.81Software 4.26L&T Technology Services Ltd. 2.78Majesco Ltd. 1.48Textile Products 4.27Page Industries Ltd. 2.27SRF Ltd. 2.00Cash & Current Assets 3.35Total 100.00
MIDCAP OPPORTUNITIES FUNDPGIM INDIA
Mid Cap Fund- An open ended equity scheme predominantly investing in mid cap stocks
Portfolio Classification (%)Large Cap (%) (1st-100th stock) 6.57
Mid Cap (%) (101st-250th stock) 67.62
Small Cap (%) (251st stock onwards) 22.46
Cash (%) 3.35
Not Classified (%) —

10
Portfolio Classification (%)
Large Cap (%) (1st-100th stock) 71.01
Mid Cap (%) (101st-250th stock) 13.54
Small Cap (%) (251st stock onwards) 12.29
Cash (%) 3.16
Fund Details
Investment Style Box:
Investment Objective: The primary objective of the Scheme is to generate long-term capital appreciation by predominantly investing in equity & equity related instruments and to enable eligible investors to avail deduction from total income, as permitted under the Income Tax Act, 1961 as amended from time to time.
Fund Manager: (w.e.f. September 14, 2019) Mr. Srinivas Rao Ravuri (Over 24 years of experience in Indian financial markets, primarily in equity research & Fund Management).
Benchmark: S&P BSE 200 TR Index
Option: Dividend (Payout) and Growth.
Quarterly (Oct-Dec 2019) Average AUM (` in Cr): 356.40
Monthly Average AUM (` in Cr): 358.89
AUM as on 31/01/2020 (` in Cr): 354.19
Portfolio Turnover: 1.13
Volatility Measures (4 Years):
Standard Deviation of Fund (Annual): 12.39%
Standard Deviation of Benchmark (Annual): 12.91%
Beta: 0.92 Sharpe Ratio***: 0.38 Tracking Error: 3.47%
*** Risk Free Rate assumed to be 6.17% (based on MIBOR as on 31/01/2020)
Fund Manager's Report: During the month the fund increased weightage in Petroleum Products and Pharmaceuticals; decreased weightage in Software.
NAV: Regular Plan Direct Plan
Growth ` 14.72 ` 15.61
Dividend ` 11.45 ` 11.35
Load Structure$: Entry Load: NA. Exit Load: Nil
$No exit load will be charged for switches and STP between Schemes of PGIM India Mutual Fund except from PGIM India Insta Cash Fund.
Regular Plan and Direct Plan are available for subscription as per the below details
Inception Date: Regular Plan: 11/12/2015, Direct Plan: 11/12/2015. Application Amount: Minimum of ̀ 500/- and in multiples of ̀ 500/- thereafter. Additional Purchase Amount: Minimum of ̀ 500/- and in multiples of ` 500/- thereafter. Repurchase / Redemption Amount: Minimum of ` 100/- and in multiples of ` 1/- thereafter or 0.1 unit or account balance whichever is lower. SIP/STP/SWP: Available. Investment Amount for SIP/STP/SWP: SIP: Monthly: 10 installments of ` 500/- each and in multiples of ` 500/- thereafter. Quarterly: 5 installments of ` 1000/- each and in multiples of ` 500/- thereafter. STP: Daily: 30 installments of ` 500/- and in multiples of ` 500/- thereafter from PGIM India Insta Cash Fund. Monthly: 10 installments of ` 500/- each and in multiples of ` 100/- thereafter. Quarterly: 5 installments of ` 1000/- each and in multiples of ` 100/- thereafter. SWP (Monthly and Quarterly): 2 (two) installments of ` 100/-.
This product is suitable for investors who are seeking*• Long-term capital appreciation• To generate long-term capital appreciation by predominantly
investing in equity & equity related instruments and to enable eligible investors to avail deduction from total income, as permitted under the Income Tax Act, 1961 as amended from time to time.
• Degree of risk – MODERATELY HIGH
* Investors should consult their financial advisers if in doubt about whether the product is suitable for them.
Moderate
Moderately
Low
Low
ModeratelyHigh
High
LOW HIGH
Moderately High — investors understand that their principal will be
at moderately high risk.
Performance (CAGR)
Fund S&P BSE 200 TR Index^ NIFTY 50 TR Index #
Period Returns (%) Value (INR)* Returns (%) Value (INR)* Returns (%) Value (INR)*
Regular Plan - Growth Option
Last 1 Year 8.71 10,871.49 11.15 11,114.72 11.84 11,184.43
Last 3 Years 10.03 13,321.27 12.25 14,142.89 13.29 14,539.51
Since Inception 9.78 14,720.00 12.74 16,431.33 12.98 16,577.32
Direct Plan - Growth Option
Last 1 Year 10.47 11,047.42 11.15 11,114.72 11.84 11,184.43
Last 3 Years 11.90 14,012.57 12.25 14,142.89 13.29 14,539.51
Since Inception 11.05 15,439.53 12.74 16,431.33 12.98 16,577.32
Date of Inception: Regular Plan: December 11, 2015; Direct Plan: December 11, 2015. CAGR – Compounded Annual Growth Rate^ Scheme Benchmark. # Standard Benchmark. *Based on standard investment of ` 10,000 made at the beginning of the relevant period. Past performance may or may not be sustained in future and should not be used as a basis for comparison with other investments.Last 5 years returns are not provided since the scheme has not completed 5 years. Different plans have a different expense structure. For Total Expense Ratio as on January 31, 2020 refer page no. 28Srinivas Rao Ravuri is managing this fund since September 14, 2019. No other scheme is managed by Srinivas Rao Ravuri.For SIP Performance, please refer page no. 29
Portfolio
Issuer % to Net AssetsAuto 0.69Ashok Leyland Ltd. 0.69Banks 26.78HDFC Bank Ltd. 7.14ICICI Bank Ltd. 7.03Axis Bank Ltd. 3.69State Bank Of India 3.63The Federal Bank Ltd. 2.58Kotak Mahindra Bank Ltd. 2.10DCB Bank Ltd. 0.60Cement 2.96Ambuja Cements Ltd. 1.36ACC Ltd. 0.98Ultratech Cement Ltd. 0.62Chemicals 0.84Vinati Organics Ltd. 0.69Aarti Industries Ltd. 0.14Aarti Surfactants Ltd. 0.01Construction Project 3.56Larsen & Toubro Ltd. 3.56Consumer Durables 1.06Century Plyboards (India) Ltd. 1.06Consumer Non Durables 5.37ITC Ltd. 3.65Hindustan Unilever Ltd. 1.72Ferrous Metals 0.62Tata Steel Ltd. 0.62Fertilisers 3.98Chambal Fertilizers & Chemicals Ltd. 2.08Coromandel International Ltd. 1.90Finance 5.15Housing Development Finance Corporation Ltd. 3.32HDFC Life Insurance Company Ltd. 1.21ICICI Lombard General Insurance Co. Ltd. 0.62
Issuer % to Net AssetsGas 2.94Gail (India) Ltd. 2.94Hotels/ Resorts And Other Recreational Activities
1.33
The Indian Hotels Company Ltd. 1.33Industrial Capital Goods 2.16Praj Industries Ltd. 2.16Industrial Products 1.56Time Technoplast Ltd. 1.56Petroleum Products 11.34Reliance Industries Ltd. 6.63Mangalore Refinery & Petrochemicals Ltd. 2.01Hindustan Petroleum Corporation Ltd. 1.41Bharat Petroleum Corporation Ltd. 1.29Pharmaceuticals 6.64Cipla Ltd. 2.40Divi's Laboratories Ltd. 1.70Alembic Pharmaceuticals Ltd. 1.38Sun Pharmaceutical Industries Ltd. 1.16Power 4.02NTPC Ltd. 2.27Power Grid Corporation Of India Ltd. 1.76Software 13.78Infosys Ltd. 6.48Firstsource Solutions Ltd. 1.84Majesco Ltd. 1.70Hexaware Technologies Ltd. 1.54L&T Technology Services Ltd. 1.28Tata Consultancy Services Ltd. 0.94Telecom - Services 0.78Bharti Airtel Ltd. 0.78Textiles - Cotton 1.29Vardhman Textiles Ltd. 1.29Cash & Current Assets 3.16Total 100.00
Dividend History
Regular Plan Direct Plan
Record Date
Dividend/unit (`)#
NAV (`) Dividend/unit (`)#
NAV (`)
29-Jun-17 0.24 12.15 0.24 12.32
28-Sep-17 0.24 12.15 0.25 12.36
28-Dec-17 0.24 13.06 0.25 13.32
23-Mar-18 0.80 11.86 1.12 12.03
02-Jul-18 0.21 11.49 0.21 11.38
28-Sep-18 0.18 11.20 0.21 11.12
28-Jun-19 0.03 11.72 — —
27-Sep-19 0.10 11.43 0.03 11.02
26-Dec-19 0.16 11.45 — —
# On face value of ̀ 10. Post Dividend per unit NAV will fall to the extent of the payout and applicable tax/surcharges/cess/other statutory levies. Dividend distribution is subject to availability of distributable surplus. Past Performance may or may not be sustained in future.
Details as on January 31, 2020
LONG TERM EQUITY FUNDPGIM INDIA
An Open Ended Equity Linked Savings Scheme with a statutory lock-in of 3 years and tax benefit

11
Performance (CAGR)Fund CRISIL Hybrid 35+65 - Aggresive Index^ Nifty 50 TR Index #
Period Returns (%) Value (INR)* Returns (%) Value (INR)* Returns (%) Value (INR)*Regular Plan - Growth Option
Last 1 Year 8.53 10,852.56 11.38 11,138.02 11.84 11,184.43 Last 3 Years 6.54 12,092.27 10.54 13,506.96 13.29 14,539.51 Last 5 Years 4.03 12,186.94 8.40 14,972.68 7.68 14,479.16 Since Inception 13.02 70,863.45 11.98 61,129.06 14.03 81,641.79 Direct Plan - Growth Option
Last 1 Year 10.25 11,025.42 11.38 11,138.02 11.84 11,184.43 Last 3 Years 8.11 12,635.09 10.54 13,506.96 13.29 14,539.51 Last 5 Years 5.52 13,086.37 8.40 14,972.68 7.68 14,479.16 Since Inception 10.79 20,672.04 11.20 21,209.91 11.73 21,945.95 Date of Inception: Regular Plan: January 29, 2004; Direct Plan: January 01, 2013. CAGR – Compounded Annual Growth Rate^ Scheme Benchmark. # Standard Benchmark. *Based on standard investment of ` 10,000 made at the beginning of the relevant period. Past performance may or may not be sustained in future and should not be used as a basis for comparison with other investments.## The benchmark of the scheme has been changed from BSE 200 Index to CRISIL Balanced Fund - Aggresive Index w.e.f. close of business hours March 04, 2016, pursuant to change in fundamental attributes of the scheme. Hence, 3 years data of qualitative/volatility measures has also been shown to reflect the correct risk attribute of the scheme. Further, the name of the benchmark has been changed from CRISIL Balanced Fund - Aggresive Index to CRISIL Hybrid 35+65 - Aggresive Index w.e.f. January 31, 2018.The debt component of the benchmark is TRI since inception. For equity component of the benchmark, i.e. S&P BSE 200 PRI value is used till 31st July 2006 and TRI is used since 1st Aug 2006.Scheme performance may not strictly be comparable with that of its Additional Benchmark in view of balanced nature of the scheme where a portion of scheme’s investments are made in debt instruments.Different plans have a different expense structure. For Total Expense Ratio as on January 31, 2020 refer page no. 28.Alok Agarwal (Equity Portion) is managing this scheme since June 2016 and Kumaresh Ramakrishnan (Debt Portion) is managing this scheme since April 05, 2018. For performance of schemes managed by Kumaresh Ramakrishnan refer page no. 11, 14-15,18-22, 24, 28. For performance of schemes managed by Alok Agarwal refer page no. 7, 11-13, 15, 28For SIP Performance, please refer page no. 29
Dividend HistoryRegular Plan Direct Plan
Record Date
Dividend/unit (`)#
NAV (`) Dividend/unit (`)#
NAV (`)
DIVIDEND28-Jun-19 0.30 13.15 0.48 21.3327-Sep-19 0.30 12.74 0.48 20.7526-Dec-19 0.24 12.94 0.41 21.17MONTHLY DIVIDEND18-Nov-19 0.12 20.56 0.13 21.3917-Dec-19 0.12 20.71 0.14 21.5717-Jan-20 0.12 20.89 0.14 21.77QUARTERLY DIVIDEND28-Dec-17 — — 0.17 17.0928-Jun-18 — — 0.0010 16.6528-Sep-18 — — 0.0885 16.83
# On face value of ̀ 10. Post Dividend per unit NAV will fall to the extent of the payout and applicable tax/surcharges/cess/other statutory levies. Dividend distrib ution is subject to availability of distributable surplus. Past Performance may or may not be sustained in future.
PortfolioIssuer % to Net
AssetsRating
Auto 3.91Maruti Suzuki India Ltd. 3.12Mahindra & Mahindra Ltd. 0.79Banks 22.92HDFC Bank Ltd. 9.80Kotak Mahindra Bank Ltd. 5.88ICICI Bank Ltd. 4.95Axis Bank Ltd. 2.28Cement 2.33Ultratech Cement Ltd. 1.47ACC Ltd. 0.50Ambuja Cements Ltd. 0.36Chemicals 0.33Vinati Organics Ltd. 0.31Aarti Surfactants Ltd. 0.02Construction Project 3.57Larsen & Toubro Ltd. 3.57Consumer Durables 0.02Blue Star Ltd. 0.02Consumer Non Durables 5.40Hindustan Unilever Ltd. 2.12United Spirits Ltd. 1.29ITC Ltd. 0.85Tata Global Beverages Ltd. 0.79Kansai Nerolac Paints Ltd. 0.35Ferrous Metals 1.27Tata Steel Ltd. 0.73JSW Steel Ltd. 0.42Tata Metaliks Ltd. 0.12Fertilisers 0.46Coromandel International Ltd. 0.46Finance 13.48Bajaj Finance Ltd. 3.64Housing Development Finance Corp. Ltd. 3.36HDFC Life Insurance Company Ltd. 2.50ICICI Lombard General Insurance Co. Ltd. 2.02Can Fin Homes Ltd. 1.01ICICI Prudential Life Insurance Co Ltd. 0.96Gas 0.78Indraprastha Gas Ltd. 0.78
Issuer % to Net Assets
Rating
Industrial Products 0.15Orient Refractories Ltd. 0.15Non - Ferrous Metals 0.53Hindalco Industries Ltd. 0.53Pesticides 0.27Bayer Cropscience Ltd. 0.27Petroleum Products 9.53Reliance Industries Ltd. 8.83Mangalore Refinery & Petrochemicals Ltd. 0.70Pharmaceuticals 5.07Alkem Laboratories Ltd. 2.17Cipla Ltd. 1.15Sun Pharmaceutical Industries Ltd. 0.95Divi's Laboratories Ltd. 0.43Astrazeneca Pharma India Ltd. 0.37Software 5.91Infosys Ltd. 2.75Tata Consultancy Services Ltd. 1.25HCL Technologies Ltd. 0.70Hexaware Technologies Ltd. 0.63L&T Technology Services Ltd. 0.58Textile Products 1.61Page Industries Ltd. 1.61Equity Holdings Total 77.55Corporate Debt 10.97Non-Convertible Debentures 10.89National Bank For Agriculture & Rural Development
8.77 CRISIL AAA
Small Industries Development Bank Of India 2.13 CARE AAAZero Coupon Bond 0.08Aditya Birla Finance Ltd. 0.08 ICRA AAAState Government Bond 1.56State Government Of Maharashtra 1.56 SOVEREIGNState Government Of Andhra Pradesh 0.00 SOVEREIGNMargin Fixed Deposit 7.82HDFC Bank Ltd. 7.82TREPS / REPO 2.55Cash & Current Assets -0.45Total 100.00
Details as on January 31, 2020
This product is suitable for investors who are seeking*
• Capital growth over the long term
• Investing predominantly in equity and equity related securities.
• Degree of risk – MODERATELY HIGH
* Investors should consult their financial advisers if in doubt about whether the product is suitable for them.
Moderate
Moderately
Low
Low
ModeratelyHigh
High
LOW HIGH
Moderately High — investors understand that their principal will be at moderately high risk.
Fund Details
Investment Style Box:
Investment Objective: The investment objective of the scheme is to seek to generate long term capital appreciation and income from a portfolio of equity and equity related securities as well as fixed income securities.Fund Manager: Mr. Alok Agarwal (Equity portion) (Over 17 years of experience in equity market & Finance) and Mr. Kumaresh Ramakrishnan (Debt portion) (Over 20 years of experience in Fixed Income markets as Fund Manager and Analyst).Benchmark: CRISIL Hybrid 35+65 - Aggresive IndexOption: Dividend, Monthly Dividend, Quarterly Dividend and Annual Dividend - (Payout/Reinvestment) and Growth.Quarterly (Oct-Dec 2019) Average AUM (` in Cr): 148.83Monthly Average AUM (` in Cr): 146.43AUM as on 31/01/2020 (` in Cr.): 143.83Portfolio Turnover: 1.05 (For Equity)
For Debt part of the Portfolio:Average Maturity: 1.47 yrs Modified Duration: 1.27 yrsPortfolio Yield: 6.21%
Volatility Measures 3 Years## 6 YearsStandard Deviation of Fund (Annual) 8.54% 11.29%Standard Deviation of Benchmark (Annual)
8.11% 8.91%
Beta 0.98 1.19Sharpe Ratio*** -0.02 0.38Tracking Error 3.13% 4.29%
*** Risk Free Rate assumed to be 6.69% (based on MIBOR as on 31/01/2020)Fund Manager's Report: During the month the fund increased weightage in Cement, Gas and Pharmaceuticals; decreased weightage in Banks and Software.
NAV: Regular Plan Direct PlanGrowth ` 71.03 ` 77.63Dividend ` 12.61 ` 20.65Monthly Dividend ` 20.31 ` 21.16Quarterly Dividend ` 18.05 ` 18.26Annual Dividend ` 10.97 ` 11.04
Load Structure$: Entry Load: NA Exit Load: 10% of the units allotted may be redeemed without any exit load on or before 12 months from the date of allotment; Any redemptions in excess of the above mentioned limit would be subject to an exit load of 1%, if the units are redeemed on or before completion of 12 months from the date of allotment of units; Nil - If the units are redeemed after completion of 12 months from the date of allotment of units.
$No exit load will be charged for switches and STP between Schemes of PGIM India Mutual Fund except from PGIM India Insta Cash Fund.
Regular Plan and Direct Plan are available for subscription as per the below detailsInception Date: Regular Plan: 29/01/2004, Direct Plan: 01/01/2013. Application Amount: ` 5000/- and in multiples of ` 1/- thereafter. Additional Purchase Amount: ` 1000/- and in multiples of ` 1/- thereafter or 100 units. Repurchase / Redemption Amount: Minimum of ` 100/- and in multiples of ` 1/- thereafter or 0.1 unit or account balance whichever is lower. SIP/STP/SWP: Available. Investment Amount for SIP/STP/SWP: SIP/STP: Monthly: 10 installments of ` 500/- each and in multiples of ` 1/- thereafter. Quarterly: 5 installments of ` 1000/- each and in multiples of ` 1/- thereafter. STP Daily: 60 installments of ` 100/- and in multiples of ` 100/- thereafter from PGIM India Insta Cash Fund. SWP (Monthly and Quarterly): 2 (two) installments of ` 100/-
An open ended hybrid scheme investing predominantly in equity and equity related instrumentsHYBRID EQUITY FUNDPGIM INDIA
Portfolio Classification (%)**Large Cap (%) (1st-100th stock) 87.14
Mid Cap (%) (101st-250th stock) 10.71 Small Cap (%) (251st stock onwards) 2.14
** The above data is given for equity allocation

12
Fund Details
Investment Objective: The primary investment objective of the scheme is to generate long-term capital growth from a diversified portfolio of units of overseas mutual funds.
Fund Manager: Mr. Alok Agarwal (Over 17 years of experience in equity market & Finance).
Underlying Fund: Pramerica SICAV Euro Equity (The name of the underlying fund has been changed from UBI SICAV Euro Equity to Pramerica SICAV Euro Equity)
Benchmark: MSCI EMU Index
Option: Dividend (Payout/Reinvestment) and Growth.
Quarterly (Oct-Dec 2019) Average AUM (` in Cr): 2.79
Monthly Average AUM (` in Cr): 2.87
AUM as on 31/01/2020 (` in Cr): 2.83
NAV: Regular Plan Direct Plan
Growth ` 14.41 ` 15.52
Dividend ` 13.24 ` 11.76
The investors will be bearing the recurring expenses of the scheme, in addition to the expenses of the underlying scheme.
Load Structure$: Entry Load: NA. Exit Load: 1% if redeemed within 12 months of allotment.
$No exit load will be charged for switches and STP between Schemes of PGIM India Mutual Fund except from PGIM India Insta Cash Fund.
Portfolio of PGIM India Euro Equity Fund as of January 31, 2020
Issuer % to Net Assets
Pramerica SICAV Euro Equity E Cap 98.29
Cash & Current Assets 1.71
Total 100.00
Details as on January 31, 2020
This product is suitable for investors who are seeking*
• Capital growth over the long term
• Investment in units of overseas mutual funds having diversified portfolio.
• Degree of risk – HIGH
* Investors should consult their financial advisers if in doubt about whether the product is suitable for them.
Moderate
Moderately
Low
Low
ModeratelyHigh
High
LOW HIGH
High — investors understand that their principal will be at high risk.
Regular Plan and Direct Plan are available for subscription as per the below details
Inception Date: Regular Plan: 11/09/2007, Direct Plan: 01/01/2013. Application Amount: ̀ 5000/- and in multiples of ̀ 1/- thereafter. Additional Purchase Amount: ̀ 1000/- and in multiples of ̀ 1/- thereafter or 100 units. Repurchase / Redemption Amount: Minimum of ̀ 100/- and in multiples of ̀ 1/- thereafter or 0.1 unit or account balance whichever is lower. SIP/STP/SWP: Available. Investment Amount for SIP/STP/SWP: SIP/STP: Monthly: 10 installments of ̀ 500/- each and in multiples of ̀ 1/- thereafter. Quarterly: 5 installments of ̀ 1000/- each and in multiples of ̀ 1/- thereafter. SWP (Monthly and Quarterly): 2 (two) installments of ̀ 100/-
Performance (CAGR)
Fund MSCI EMU Index^ Nifty 50 TR Index #
Period Returns (%) Value (INR)* Returns (%) Value (INR)* Returns (%) Value (INR)*
Regular Plan - Growth Option
Last 1 Year 10.17 11,016.82 13.25 11,324.58 11.84 11,184.43
Last 3 Years 6.50 12,078.79 10.03 13,322.05 13.29 14,539.51
Last 5 Years 4.24 12,307.12 7.90 14,629.30 7.68 14,479.16
Since Inception 2.99 14,410.00 5.16 18,653.11 9.49 30,766.67
Direct Plan - Growth Option
Last 1 Year 11.65 11,165.47 13.25 11,324.58 11.84 11,184.43
Last 3 Years 7.97 12,587.19 10.03 13,322.05 13.29 14,539.51
Last 5 Years 5.44 13,032.96 7.90 14,629.30 7.68 14,479.16
Since Inception (CAGR) 6.34 15,458.25 9.97 19,612.31 11.73 21,945.95
Date of Inception: Regular Plan: September 11, 2007; Direct Plan: January 01, 2013. CAGR – Compounded Annual Growth Rate
^ Scheme Benchmark. # Standard Benchmark. *Based on standard investment of ` 10,000 made at the beginning of the relevant period. Past performance may or may not be sustained in future and should not be used as a basis for comparison with other investments.
W.e.f. October 30, 2017 the underlying fund of the scheme has been changed.
Scheme performance may not strictly be comparable with that of its Additional Benchmark in view of type of the scheme i.e. Overseas Fund of Fund.
Alok Agarwal is managing this fund since July 27, 2017.
For performance of schemes managed by Alok Agarwal refer page no. 7, 11-13, 15, 28
Different plans have a different expense structure. For Total Expense Ratio as on January 31, 2020 refer page no. 28
Dividend History - Regular Plan
Record Date Dividend per unit (`)# NAV (`)
26-Sept-14 1.00 12.21
# On face value of ̀ 10. Post Dividend per unit NAV will fall to the extent of the payout and applicable tax/surcharges/cess/other statutory levies. Dividend distribution is subject to availability of distributable surplus. Past Performance may or may not be sustained in future.
Top Ten Holdings of Pramerica SICAV Euro Equity (Underlying Fund) as of December 31, 2019
Sector Ending Weight (% of equity)
SAP SE 4.51
PRYSMIAN SPA 4.08
SAMPO OYJ-A SHS 3.42
SANOFI 2.80
TOTAL SA 2.74
INTESA SANPAOLO 2.65
ING GROEP NV 2.61
LVMH MOET HENNESSY LOUIS VUITTON 2.59
DEUTSCHE TELEKOM AG-REG 2.49
UNICREDIT SPA 2.44
Geographic Distribution of Pramerica SICAV Euro Equity (Underlying Fund) as of December 31, 2019
Country %
France 28.43
Germany 18.30
Italy 16.11
Great Britain 9.41
Holland 6.32
Finland 5.23
Spain 4.04
Switzerland 3.19
Portugal 2.37
EURO EQUITY FUNDPGIM INDIA
An open ended fund of fund scheme investing in Pramerica SICAV Euro Equity

13
Fund Details
Investment Objective: The primary investment objective of the Scheme is to generate long term capital growth from a diversified portfolio of units of overseas mutual funds. However, there can be no assurance that the investment objective of the Scheme will be achieved. The Scheme does not guarantee/ indicate any returns.
Fund Manager: Mr. Alok Agarwal (Over 17 years of experience in equity market & Finance).
Underlying Fund: PGIM Jennison Global Equity Opportunities Fund
Benchmark: MSCI All Countries World Index
Option: Dividend (Payout/Reinvestment) and Growth.
Quarterly (Oct-Dec 2019) Average AUM (` in Cr): 25.70
Monthly Average AUM (` in Cr): 41.19
AUM as on 31/01/2020 (` in Cr): 48.94
NAV Regular Plan Direct Plan
Growth ` 21.34 ` 22.83
Dividend ` 20.01 ` 22.83
The investors will be bearing the recurring expenses of the scheme, in addition to the expenses of the underlying scheme.
Load Structure$: Entry Load: NA. Exit Load: 1% if redeemed within 12 months of allotment.
$No exit load will be charged for switches and STP between Schemes of PGIM India Mutual Fund except from PGIM India Insta Cash Fund.
Portfolio of PGIM India Global Equity Opportunities Fund as of January 31, 2020
Issuer % to Net Assets
PGIM JENNSN GLEQ OP-USD AC I 96.65
Cash & Current Assets 3.35
Total 100.00
Top Ten Holdings of PGIM Jennison Global Equity Opportunities Fund (Underlying Fund) as of December 31, 2019
Security Ending Weight (% of equity)
Amazon.com 5.6
Mastercard 4.9
Alibaba 4.4
NIKE 4.0
LVMH Moet Hennessy Louis Vuitton 4.0
Adyen 3.9
Microsoft 3.6
Edwards Lifesciences 3.5
Netflix 3.4
Ferrari 3.3
Top Ten Geographic Distribution of PGIM Jennison Global Equity Opportunities Fund (Underlying Fund) as of December 31, 2019
Country %
United States 53.8
France 11.3
China 10.3
Netherlands 7.2
Switzerland 4.8
Canada 3.3
Italy 3.3
United Kingdom 2.4
Germany 2.4
This product is suitable for investors who are seeking*
• Capital growth over the long term
• Investment in units of overseas mutual funds that invest in equity securities of companies around the world in the early stage of acceleration in their growth.
• Degree of risk – HIGH
* Investors should consult their financial advisers if in doubt about whether the product is suitable for them.
Moderate
Moderately
Low
Low
ModeratelyHigh
High
LOW HIGH
High — investors understand that their principal will be at high risk.
Regular Plan and Direct Plan are available for subscription as per the below details
Inception Date: Regular Plan: 14/05/2010, Direct Plan: 01/01/2013. Application Amount: ̀ 5000/- and in multiples of ̀ 1/- thereafter. Additional Purchase Amount: ̀ 1000/- and in multiples of ̀ 1/- thereafter or 100 units. Repurchase / Redemption Amount: Minimum of ̀ 100/- and in multiples of ̀ 1/- thereafter or 0.1 unit or account balance whichever is lower. SIP/STP/SWP: Available. Investment Amount for SIP/STP/SWP: SIP/STP: Monthly: 10 installments of ̀ 500/- each and in multiples of ̀ 1/- thereafter. Quarterly: 5 installments of ̀ 1000/- each and in multiples of ̀ 1/- thereafter. SWP (Monthly and Quarterly): 2 (two) installments of ̀ 100/-
Dividend History
Regular Plan Direct Plan
Record Date
Dividend/unit (`)#
NAV (`) Dividend/unit (`)#
NAV (`)
18-Mar-14 1.00 15.94 — —
# On face value of ̀ 10. Post Dividend per unit NAV will fall to the extent of the payout and applicable tax/surcharges/cess/other statutory levies. Dividend distribution is subject to availability of distributable surplus. Past Performance may or may not be sustained in future.
Performance (CAGR)
Fund MSCI All Country World Index^ Nifty 50 TR Index #
Period Returns (%) Value (INR)* Returns (%) Value (INR)* Returns (%) Value (INR)*
Regular Plan - Growth Option
Last 1 Year 22.29 12,229.23 14.69 11,469.12 11.84 11,184.43
Last 3 Years 14.25 14,912.65 10.98 13,670.69 13.29 14,539.51
Last 5 Years 5.92 13,331.27 9.43 15,697.93 7.68 14,479.16
Since Inception 8.11 21,344.56 11.97 30,026.63 10.35 26,067.47
Direct Plan - Growth Option
Last 1 Year 21.18 12,117.83 14.69 11,469.12 11.84 11,184.43
Last 3 Years 15.67 15,477.97 10.98 13,670.69 13.29 14,539.51
Last 5 Years 7.02 14,043.20 9.43 15,697.93 7.68 14,479.16
Since Inception 6.81 15,945.09 11.42 21,515.53 11.73 21,945.95
Date of Inception: Regular Plan: May 14, 2010; Direct Plan: January 01, 2013. CAGR – Compounded Annual Growth Rate
^ Scheme Benchmark. # Standard Benchmark. *Based on standard investment of ` 10,000 made at the beginning of the relevant period. Past performance may or may not be sustained in future and should not be used as a basis for comparison with other investments.
w.e.f. October 17, 2018 benchmark for the scheme has been changed to MSCI All Country World Index. Further w.e.f October 17, 2018 the underlying fund of the scheme has been changed.
The Scheme has undergone change in Fundamental attributes w.e.f. October 17, 2018 changed its Underlying Fund. Accordingly, the Scheme’s benchmark has also changed. Hence, the past performance of the Scheme may not strictly be comparable with that of the new benchmark.
Scheme performance may not strictly be comparable with that of its Additional Benchmark in view of type of the scheme i.e. Overseas Fund of Fund.
Alok Agarwal is managing this fund since July 27, 2017.
For performance of schemes managed by Alok Agarwal refer page no. 7, 11-13, 15, 28
Different plans have a different expense structure. For Total Expense Ratio as on January 31, 2020 refer page no. 28
Details as on January 31, 2020
GLOBAL EQUITYOPPORTUNITIES FUND
PGIM INDIA
An open ended fund of fund scheme investing in PGIM Jennison Global Equity Opportunities Fund
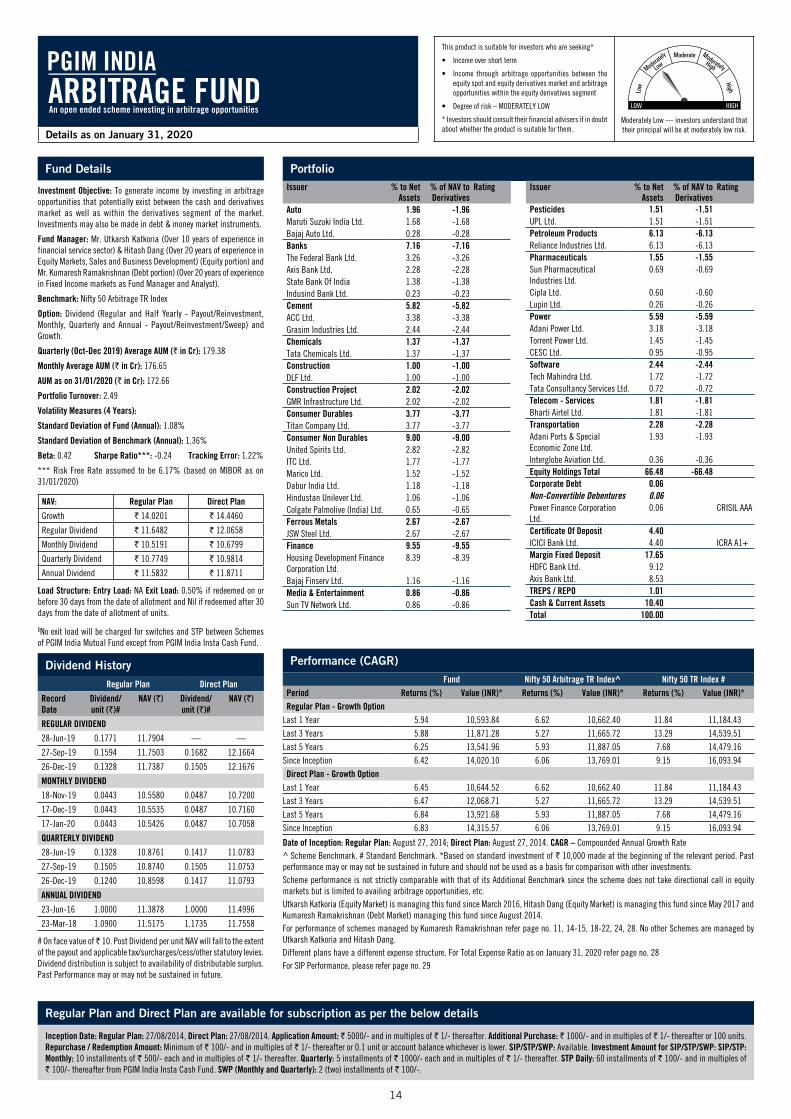
14
Fund Details
Investment Objective: To generate income by investing in arbitrage opportunities that potentially exist between the cash and derivatives market as well as within the derivatives segment of the market. Investments may also be made in debt & money market instruments.
Fund Manager: Mr. Utkarsh Katkoria (Over 10 years of experience in financial service sector) & Hitash Dang (Over 20 years of experience in Equity Markets, Sales and Business Development) (Equity portion) and Mr. Kumaresh Ramakrishnan (Debt portion) (Over 20 years of experience in Fixed Income markets as Fund Manager and Analyst).
Benchmark: Nifty 50 Arbitrage TR Index
Option: Dividend (Regular and Half Yearly - Payout/Reinvestment, Monthly, Quarterly and Annual - Payout/Reinvestment/Sweep) and Growth.
Quarterly (Oct-Dec 2019) Average AUM (` in Cr): 179.38
Monthly Average AUM (` in Cr): 176.65
AUM as on 31/01/2020 (` in Cr): 172.66
Portfolio Turnover: 2.49
Volatility Measures (4 Years):
Standard Deviation of Fund (Annual): 1.08%
Standard Deviation of Benchmark (Annual): 1.36%
Beta: 0.42 Sharpe Ratio***: -0.24 Tracking Error: 1.22%
*** Risk Free Rate assumed to be 6.17% (based on MIBOR as on 31/01/2020)
NAV: Regular Plan Direct Plan
Growth ` 14.0201 ` 14.4460
Regular Dividend ` 11.6482 ` 12.0658
Monthly Dividend ` 10.5191 ` 10.6799
Quarterly Dividend ` 10.7749 ` 10.9814
Annual Dividend ` 11.5832 ` 11.8711
Load Structure: Entry Load: NA Exit Load: 0.50% if redeemed on or before 30 days from the date of allotment and Nil if redeemed after 30 days from the date of allotment of units.
$No exit load will be charged for switches and STP between Schemes of PGIM India Mutual Fund except from PGIM India Insta Cash Fund.
Details as on January 31, 2020
This product is suitable for investors who are seeking*
• Income over short term
• Income through arbitrage opportunities between the equity spot and equity derivatives market and arbitrage opportunities within the equity derivatives segment
• Degree of risk – MODERATELY LOW
* Investors should consult their financial advisers if in doubt about whether the product is suitable for them.
Moderate
Moderately
Low
Low
ModeratelyHigh
High
LOW HIGH
Moderately Low — investors understand that their principal will be at moderately low risk.
Regular Plan and Direct Plan are available for subscription as per the below details
Inception Date: Regular Plan: 27/08/2014, Direct Plan: 27/08/2014. Application Amount: ` 5000/- and in multiples of ` 1/- thereafter. Additional Purchase: ` 1000/- and in multiples of ` 1/- thereafter or 100 units. Repurchase / Redemption Amount: Minimum of ` 100/- and in multiples of ` 1/- thereafter or 0.1 unit or account balance whichever is lower. SIP/STP/SWP: Available. Investment Amount for SIP/STP/SWP: SIP/STP: Monthly: 10 installments of ` 500/- each and in multiples of ` 1/- thereafter. Quarterly: 5 installments of ` 1000/- each and in multiples of ` 1/- thereafter. STP Daily: 60 installments of ` 100/- and in multiples of ` 100/- thereafter from PGIM India Insta Cash Fund. SWP (Monthly and Quarterly): 2 (two) installments of ` 100/-.
Performance (CAGR)Fund Nifty 50 Arbitrage TR Index^ Nifty 50 TR Index #
Period Returns (%) Value (INR)* Returns (%) Value (INR)* Returns (%) Value (INR)*Regular Plan - Growth Option
Last 1 Year 5.94 10,593.84 6.62 10,662.40 11.84 11,184.43 Last 3 Years 5.88 11,871.28 5.27 11,665.72 13.29 14,539.51 Last 5 Years 6.25 13,541.96 5.93 11,887.05 7.68 14,479.16 Since Inception 6.42 14,020.10 6.06 13,769.01 9.15 16,093.94 Direct Plan - Growth Option
Last 1 Year 6.45 10,644.52 6.62 10,662.40 11.84 11,184.43 Last 3 Years 6.47 12,068.71 5.27 11,665.72 13.29 14,539.51 Last 5 Years 6.84 13,921.68 5.93 11,887.05 7.68 14,479.16 Since Inception 6.83 14,315.57 6.06 13,769.01 9.15 16,093.94
Date of Inception: Regular Plan: August 27, 2014; Direct Plan: August 27, 2014. CAGR – Compounded Annual Growth Rate^ Scheme Benchmark. # Standard Benchmark. *Based on standard investment of ` 10,000 made at the beginning of the relevant period. Past performance may or may not be sustained in future and should not be used as a basis for comparison with other investments.Scheme performance is not strictly comparable with that of its Additional Benchmark since the scheme does not take directional call in equity markets but is limited to availing arbitrage opportunities, etc.Utkarsh Katkoria (Equity Market) is managing this fund since March 2016, Hitash Dang (Equity Market) is managing this fund since May 2017 and Kumaresh Ramakrishnan (Debt Market) managing this fund since August 2014.For performance of schemes managed by Kumaresh Ramakrishnan refer page no. 11, 14-15, 18-22, 24, 28. No other Schemes are managed by Utkarsh Katkoria and Hitash Dang.Different plans have a different expense structure. For Total Expense Ratio as on January 31, 2020 refer page no. 28For SIP Performance, please refer page no. 29
Dividend HistoryRegular Plan Direct Plan
Record Date
Dividend/unit (`)#
NAV (`) Dividend/unit (`)#
NAV (`)
REGULAR DIVIDEND
28-Jun-19 0.1771 11.7904 — —
27-Sep-19 0.1594 11.7503 0.1682 12.1664
26-Dec-19 0.1328 11.7387 0.1505 12.1676
MONTHLY DIVIDEND
18-Nov-19 0.0443 10.5580 0.0487 10.7200
17-Dec-19 0.0443 10.5535 0.0487 10.7160
17-Jan-20 0.0443 10.5426 0.0487 10.7058
QUARTERLY DIVIDEND
28-Jun-19 0.1328 10.8761 0.1417 11.0783
27-Sep-19 0.1505 10.8740 0.1505 11.0753
26-Dec-19 0.1240 10.8598 0.1417 11.0793
ANNUAL DIVIDEND
23-Jun-16 1.0000 11.3878 1.0000 11.4996
23-Mar-18 1.0900 11.5175 1.1735 11.7558
# On face value of ̀ 10. Post Dividend per unit NAV will fall to the extent of the payout and applicable tax/surcharges/cess/other statutory levies. Dividend distribution is subject to availability of distributable surplus. Past Performance may or may not be sustained in future.
PortfolioIssuer % to Net
Assets% of NAV to Derivatives
Rating
Auto 1.96 -1.96Maruti Suzuki India Ltd. 1.68 -1.68Bajaj Auto Ltd. 0.28 -0.28Banks 7.16 -7.16The Federal Bank Ltd. 3.26 -3.26Axis Bank Ltd. 2.28 -2.28State Bank Of India 1.38 -1.38Indusind Bank Ltd. 0.23 -0.23Cement 5.82 -5.82ACC Ltd. 3.38 -3.38Grasim Industries Ltd. 2.44 -2.44Chemicals 1.37 -1.37Tata Chemicals Ltd. 1.37 -1.37Construction 1.00 -1.00DLF Ltd. 1.00 -1.00Construction Project 2.02 -2.02GMR Infrastructure Ltd. 2.02 -2.02Consumer Durables 3.77 -3.77Titan Company Ltd. 3.77 -3.77Consumer Non Durables 9.00 -9.00United Spirits Ltd. 2.82 -2.82ITC Ltd. 1.77 -1.77Marico Ltd. 1.52 -1.52Dabur India Ltd. 1.18 -1.18Hindustan Unilever Ltd. 1.06 -1.06Colgate Palmolive (India) Ltd. 0.65 -0.65Ferrous Metals 2.67 -2.67JSW Steel Ltd. 2.67 -2.67Finance 9.55 -9.55Housing Development Finance Corporation Ltd.
8.39 -8.39
Bajaj Finserv Ltd. 1.16 -1.16Media & Entertainment 0.86 -0.86Sun TV Network Ltd. 0.86 -0.86
Issuer % to Net Assets
% of NAV to Derivatives
Rating
Pesticides 1.51 -1.51UPL Ltd. 1.51 -1.51Petroleum Products 6.13 -6.13Reliance Industries Ltd. 6.13 -6.13Pharmaceuticals 1.55 -1.55Sun Pharmaceutical Industries Ltd.
0.69 -0.69
Cipla Ltd. 0.60 -0.60Lupin Ltd. 0.26 -0.26Power 5.59 -5.59Adani Power Ltd. 3.18 -3.18Torrent Power Ltd. 1.45 -1.45CESC Ltd. 0.95 -0.95Software 2.44 -2.44Tech Mahindra Ltd. 1.72 -1.72Tata Consultancy Services Ltd. 0.72 -0.72Telecom - Services 1.81 -1.81Bharti Airtel Ltd. 1.81 -1.81Transportation 2.28 -2.28Adani Ports & Special Economic Zone Ltd.
1.93 -1.93
Interglobe Aviation Ltd. 0.36 -0.36Equity Holdings Total 66.48 -66.48Corporate Debt 0.06Non-Convertible Debentures 0.06Power Finance Corporation Ltd.
0.06 CRISIL AAA
Certificate Of Deposit 4.40ICICI Bank Ltd. 4.40 ICRA A1+Margin Fixed Deposit 17.65HDFC Bank Ltd. 9.12Axis Bank Ltd. 8.53TREPS / REPO 1.01Cash & Current Assets 10.40Total 100.00
ARBITRAGE FUNDPGIM INDIA
An open ended scheme investing in arbitrage opportunities

15
Fund Details
Investment Objective: The investment objective of the scheme is to provide capital appreciation and income distribution to the investors by using equity and equity related instruments, arbitrage opportunities and investments in debt and money market instruments.
Fund Manager: Mr. Alok Agarwal (Equity portion) (Over 17 years of experience in equity market & Finance) and Mr. Kumaresh Ramakrishnan (Debt portion) (Over 20 years of experience in Fixed Income Market as a Fund Manager and Analyst)
Benchmark: 70% of the NIFTY 50 Arbitrage TR Index and 30% of the NIFTY 50 TR Index
Option: Dividend (Regular, Monthly, Quarterly, Half Yearly and Annual - Payout/Reinvestment) and Growth.
Quarterly (Oct-Dec 2019) Average AUM (` in Cr): 35.27
Monthly Average AUM (` in Cr): 36.12
AUM as on 31/01/2020 (` in Cr): 35.73
Portfolio Turnover: 0.47 (For Equity)
For Debt part of the Portfolio:Average Maturity: 0.13 yrs Modified Duration: 0.11 yrsPortfolio Yield: 7.76%
Volatility Measures (6 Years):Standard Deviation of Fund (Annual): 4.39%Standard Deviation of Benchmark (Annual): 17.83%Beta: 0.12 Sharpe Ratio***: 0.55 Tracking Error: 16.16%*** Risk Free Rate assumed to be 6.69% (based on MIBOR as on 31/01/2020)
NAV Regular Plan Direct PlanGrowth ` 33.3267 ` 35.8348Regular Dividend ` 11.1023 —Monthly Dividend ` 11.2517 ` 11.7069Quarterly Dividend ` 11.3277 ` 11.7763Half Yearly Dividend — ` 11.2261Annual Dividend ` 15.1049 ` 15.4557
Load Structure$: Entry Load: NA Exit Load: 10% of the units allotted may be redeemed without any exit load on or before 12 months from the date of allotment; Any redemptions in excess of the above mentioned limit would be subject to an exit load of 1%, if the units are redeemed on or before completion of 12 months from the date of allotment of units; Nil - If the units are redeemed after completion of 12 months from the date of allotment of units.
$No exit load will be charged for switches and STP between Schemes of PGIM India Mutual Fund except from PGIM India Insta Cash Fund.
This product is suitable for investors who are seeking*
• Capital appreciation and Income distribution over the medium term
• Investment primarily in equity and equity related securities and a small allocation to debt securities
• Degree of risk – MODERATELY HIGH
* Investors should consult their financial advisers if in doubt about whether the product is suitable for them.
Moderate
Moderately
Low
Low
ModeratelyHigh
High
LOW HIGH
Moderately High — investors understand that their principal will be at moderately high risk.
Regular Plan and Direct Plan are available for subscription as per the below details
Inception Date: Regular Plan: 29/01/2004, Direct Plan: 01/01/2013. Application Amount: Minimum of ` 5000/- and in multiples of ` 1/- thereafter. Additional Purchase: Minimum of ` 1000/- and in multiples of ` 1/- thereafter or 100 units. Repurchase / Redemption Amount: Minimum of ` 100/- and in multiples of ` 1/- thereafter or 0.1 unit or account balance whichever is lower. SIP/STP/SWP: Available. Investment Amount for SIP/STP: SIP/STP: Monthly: 10 installments of ` 500/- each and in multiples of ` 1/- thereafter. Quarterly: 5 installments of ` 1000/- each and in multiples of ` 1/- thereafter. STP Daily: 60 installments of ` 100/- and in multiples of ` 100/- thereafter from PGIM India Insta Cash Fund. SWP (Monthly and Quarterly): 2 (two) installments of ` 100/-.
Dividend HistoryRegular Plan Direct Plan
Record Date
Dividend/unit (`)#
NAV (`) Dividend/unit (`)#
NAV (`)
MONTHLY DIVIDEND
18-Nov-19 0.0549 11.3886 0.0655 11.8583
17-Dec-19 0.0549 11.4714 0.0655 11.9425
17-Jan-20 0.0549 11.4612 0.0655 11.9307
QUARTERLY DIVIDEND
28-Jun-19 0.1062 11.3663 0.1948 11.9550
27-Sep-19 0.1771 11.3593 0.1859 11.8784
26-Dec-19 0.0708 11.4852 0.1682 12.0372
ANNUAL DIVIDEND
26-Sept-14 0.9000 12.2533 — —
23-Mar-18 1.4233 15.6000 1.4300 15.6900
25-Mar-19 0.8854 15.2067 0.8854 15.4266
# On face value of ̀ 10. Post Dividend per unit NAV will fall to the extent of the payout and applicable tax/surcharges/cess/other statutory levies. Dividend distribution is subject to availability of distributable surplus. Past Performance may or may not be sustained in future.
Performance (CAGR)
Fund 70% of the NIFTY 50 Arbitrage TR Index and 30% of the NIFTY 50 TR Index ^
Nifty 50 TR Index #
Period Returns (%) Value (INR)* Returns (%) Value (INR)* Returns (%) Value (INR)*
Regular Plan - Growth Option
Last 1 Year 9.13 10,912.83 8.38 10,837.63 11.84 11,184.43
Last 3 Years 7.10 12,284.85 7.78 12,519.23 13.29 14,539.51
Last 5 Years 7.19 14,153.98 6.65 13,803.00 7.68 14,479.16
Since Inception 7.81 33,278.70 NA NA 14.03 81,641.79
Direct Plan - Growth Option
Last 1 Year 10.22 11,021.95 8.38 10,837.63 11.84 11,184.43
Last 3 Years 8.35 12,720.82 7.78 12,519.23 13.29 14,539.51
Last 5 Years 8.36 14,939.99 6.65 13,803.00 7.68 14,479.16
Since Inception 9.20 18,660.77 8.37 17,676.66 11.73 21,945.95
Date of Inception: Regular Plan: January 29, 2004; Direct Plan: January 01, 2013. CAGR – Compounded Annual Growth Rate
^ Scheme Benchmark. # Standard Benchmark. *Based on standard investment of ` 10,000 made at the beginning of the relevant period. Past performance may or may not be sustained in future and should not be used as a basis for comparison with other investments.
The benchmark of the scheme has been changed from 75% of CRISIL Liquid Fund Index and 25% in Nifty 50 to 70% of the NIFTY 50 Arbitrage Index and 30% of the NIFTY 50 Index w.e.f. September 13, 2017, pursuant to change in fundamental attributes of the scheme.
Scheme performance may not strictly be comparable with that of its Additional Benchmark in view of hybrid nature of the scheme where a portion of scheme’s investments are made in debt & derivatives.
Alok Agarwal (Equity Portion) is managing this fund since August 2016 and Kumaresh Ramakrishnan (Debt Portion) is managing this fund since April 05, 2018.
For performance of schemes managed by Alok Agarwal refer page no. 7, 11-13, 15, 28
For performance of schemes managed by Kumaresh Ramakrishnan refer page no. 11, 14-15, 18-22, 24, 28
Different plans have a different expense structure. For Total Expense Ratio as on January 31, 2020 refer page no. 28
NA - Not Available
For SIP Performance, please refer page no. 29
Portfolio
Issuer % to Net Assets
% of NAV to Derivatives
Rating
Auto 2.47
Maruti Suzuki India Ltd. 2.47
Banks 18.32
HDFC Bank Ltd. 8.58
Kotak Mahindra Bank Ltd. 4.73
ICICI Bank Ltd. 3.38
City Union Bank Ltd. 1.62
Construction Project 1.34
Larsen & Toubro Ltd. 1.34
Consumer Durables 3.49 -3.49
Titan Company Ltd. 3.49 -3.49
Consumer Non Durables 1.32
ITC Ltd. 1.32
Finance 11.59 -9.46
Housing Development Finance Corporation Ltd.
9.46 -9.46
HDFC Life Insurance Company Ltd.
1.84
HDFC Asset Management Company Ltd.
0.29
Industrial Products 0.09
Orient Refractories Ltd. 0.09
Pesticides 0.18
Bayer Cropscience Ltd. 0.18
Issuer % to Net Assets
% of NAV to Derivatives
Rating
Petroleum Products 7.90 -2.59
Reliance Industries Ltd. 7.90 -2.59
Pharmaceuticals 1.34
Alkem Laboratories Ltd. 1.34
Software 8.81 -5.73
Tata Consultancy Services Ltd.
5.24 -4.11
Infosys Ltd. 1.95
HCL Technologies Ltd. 1.62 -1.62
Telecom - Services 9.52 -9.52
Bharti Airtel Ltd. 9.52 -9.52
Equity Holdings Total 66.37 -30.80
Corporate Debt 5.72
Zero Coupon Bond 5.72ECL Finance Ltd. 3.10 ICRA AA-
Edelweiss Rural And Corporate Serv Ltd.
1.76 CRISIL AA-
Edelweiss Rural And Corporate Serv Ltd.
0.86 ICRA AA-
Margin Fixed Deposit 8.37
HDFC Bank Ltd. 5.60
HDFC Bank Ltd. 2.77
TREPS / REPO 4.52
Cash & Current Assets 15.02
Total 100.00
Details as on January 31, 2020
EQUITY SAVINGS FUNDPGIM INDIA
An Open Ended Scheme investing in equity, arbitrage and debt

16
DE
BT
FU
ND
S
RE
CK
ON
ER
Deta
ilsPG
IM In
dia
Over
nigh
t Fun
dPG
IM In
dia
Inst
a Ca
sh F
und
PGIM
Indi
a Ul
tra
Shor
t Ter
m F
und
PGIM
Indi
a Lo
w Du
ratio
n Fu
ndPG
IM In
dia
Shor
t Mat
urity
Fun
d
Why
Inve
st?
Park
sur
plus
fun
ds a
nd m
anag
e sh
ort
term
liqu
idity
fo
r as
low
as 1
Day
Cash
Man
agem
ent.
Any m
oney
ove
r 7 D
ays
Inve
stor
s lo
okin
g to
par
k th
eir f
unds
for a
per
iod
over
3
Mon
ths
For
mon
ey o
ver
6 m
onth
s. P
ositi
oned
bet
ween
Ultr
a Sh
ort a
nd S
hort
Mat
urity
. Acc
rual
Stra
tegy
Activ
ely
man
aged
Sho
rt M
atur
ity F
und
with
a m
ix of
PS
U an
d Co
rpor
ate
bond
s
Port
folio
Fea
ture
s#In
vest
men
ts i
n ov
erni
ght
secu
ritie
s wi
th m
atur
ity o
f 1
Day
Inve
stm
ents
in d
ebt a
nd m
oney
mar
ket s
ecur
ities
with
m
atur
ity o
f up
to 9
1 Da
ysCo
nser
vativ
e Ul
tra S
hort
Term
Fun
d wi
th a
dur
atio
n ra
nge
of 3
Mon
ths
to 6
Mon
ths
Inve
stm
ents
in d
ebt a
nd m
oney
mar
ket s
ecur
ities
with
a
dura
tion
rang
e of
6 M
onth
s to
1 Y
ear
Spec
ified
dur
atio
n ra
nge
of 1
to 3
Yea
rs w
ith ta
ctic
al
allo
catio
n to
Gov
ernm
ent S
ecur
ities
not
exce
edin
g 15
%
Idea
l Inv
estm
ent H
oriz
on$
1 Da
y +7
Days
+3
Mon
ths
+6
Mon
ths
+1
Year
+
Ince
ptio
n Da
teRe
gula
r Pla
n: 2
7/08
/201
9; D
irect
Pla
n: 2
7/08
/201
9Re
gula
r Pla
n: 0
5/09
/200
7; D
irect
Pla
n: 0
1/01
/201
3Re
gula
r Pla
n: 1
8/11
/200
8; D
irect
Pla
n: 0
1/01
/201
3Re
gula
r Pla
n: 2
2/06
/200
7; D
irect
Pla
n: 0
1/01
/201
3Re
gula
r Pla
n: 2
1/01
/200
3; D
irect
Pla
n: 0
1/01
/201
3
Fund
Man
ager
Kum
ares
h Ra
mak
rishn
an a
nd K
unal
Jain
Kum
ares
h Ra
mak
rishn
an a
nd K
unal
Jain
Kum
ares
h Ra
mak
rishn
an a
nd K
unal
Jain
Kum
ares
h Ra
mak
rishn
anPu
neet
Pal
and
Kum
ares
h Ra
mak
rishn
an
Benc
hmar
kNi
fty 1
D Ra
te In
dex
CRIS
IL L
iqui
d Fu
nd In
dex
CRIS
IL U
ltra
Shor
t Ter
m D
ebt I
ndex
CRIS
IL L
ow D
urat
ion
Debt
Inde
xCR
ISIL
Sho
rt Te
rm B
ond
Fund
Inde
x
Fund
Det
ails
as
on Ja
nuar
y 31
, 202
0
Mon
th E
nd A
UM (i
n cr
ores
)15
1.90
1035
.56
127.
2511
4.44
44.4
8
Aver
age
Mat
urity
1 da
y0.
08 ye
ar0.
45 ye
ar0.
74 ye
ar2.
46 ye
ars
Mac
aula
y Du
ratio
n—
— 5
.40
mon
ths
8.16
mon
ths
2.18
year
s
Mod
ified
Dur
atio
n1
day
0.07
year
0.42
year
0.65
year
2.05
year
s
Port
folio
Yie
ld5.
04%
5.35
%5.
89%
6.59
%6.
68%
Asse
t Mix
Com
mer
cial
Pap
er—
47.2
0%3.
91%
12.1
7%—
Cert
ifica
te o
f Dep
osit
—26
.92%
44.9
8%1.
72%
—
PSU
Bond
s—
3.02
%19
.23%
22.4
9%61
.02%
Bank
Fix
ed D
epos
it—
——
——
Bill
Redi
scou
ntin
g—
——
——
Trea
sury
Bill
s—
1.42
%—
——
Corp
orat
e De
bt—
6.45
%28
.19%
42.4
8%15
.10%
Cash
& C
urre
nt A
sset
s0.
31%
14.9
9%-1
.18%
7.23
%14
.97%
TREP
S—
—4.
87%
——
GOI S
ecur
ities
——
——
8.91
%
Reve
rse
Repo
99.6
9%—
——
—
Bank
Bon
ds—
——
——
Net R
ecei
evab
le (R
efer
Not
e on
pa
ge n
o. 2
1)—
——
13.9
1%—
Ratin
g M
ix
AAA/
A1+/
Sove
reig
n &
equi
vale
nts
100.
00%
100.
00%
100.
00%
61.9
3%94
.77%
AA+
——
——
5.23
%
AA*
——
—38
.07%
—
A+—
——
——
Othe
rs—
——
——
Load
Str
uctu
re
Exit
Load
Nil
Refe
r pag
e no
. 19
Nil
Nil
0.5%
if re
deem
ed o
n or
bef
ore
6 m
onth
s an
d Ni
l if
rede
emed
afte
r 6 m
onth
s fro
m th
e da
te o
f allo
tmen
t
*AA
incl
ude
secu
ritie
s ra
ted
as A
A an
d AA
-. $
IInve
stor
s sh
ould
con
sult
thei
r fin
anci
al a
dvis
or fo
r tax
impl
icat
ions
on
thei
r inv
estm
ents
.#
Thes
e ar
e ba
sed
on fu
nd m
anag
er’s
curre
nt o
utlo
ok &
Sub
ject
to c
hang
e.

17
DE
BT
FU
ND
S
RE
CK
ON
ER
Deta
ilsPG
IM In
dia
Bank
ing
& PS
U De
bt F
und
PGIM
Indi
a Cr
edit
Risk
Fun
dPG
IM In
dia
Dyna
mic
Bon
d Fu
ndPG
IM In
dia
Prem
ier B
ond
Fund
PGIM
Indi
a Gi
lt Fu
nd
Why
Inve
st?
Activ
ely
man
aged
fu
nd
with
80
%
allo
catio
n to
Ba
nkin
g an
d PS
U bo
nds
Accr
ual f
und
with
med
ium
mat
urity
Dyna
mic
ally
man
aged
dur
atio
n fu
nd in
vest
ing
acro
ss
the
curv
e by
iden
tifyin
g be
st o
ppor
tuni
ties
on th
e yie
ld
curv
e
High
Qua
lity
por
tfolio
in
vest
ing
pred
omin
antly
in
Corp
orat
e Bo
nds.
Min
imum
80%
por
tfolio
allo
catio
n wi
ll be
in C
orpo
rate
Bon
ds
Activ
ely m
anag
ed m
ediu
m /
long
dur
atio
n fu
nd
Port
folio
Fea
ture
s#In
vest
men
ts
pred
omin
antly
in
AA
A se
curit
ies
and
Sove
reig
n Bo
nds
with
a d
urat
ion
rang
e of
1 to
4 Y
ears
Inve
stm
ents
pre
dom
inan
tly i
n Co
rpor
ate
Bond
s of
va
rious
mat
uriti
es a
nd a
cros
s ra
tings
Inve
stm
ents
in A
AA B
onds
and
Gov
ernm
ent S
ecur
ities
wi
th a
dur
atio
n ra
nge
of 2
-8 Y
ears
Inve
stm
ents
in
Corp
orat
e Bo
nds
with
the
hig
hest
cr
edit
ratin
g an
d so
me
expo
sure
to S
over
eign
Bon
ds –
(M
ax 1
0%) w
ith a
dur
atio
n ra
nge
of 1
.5-5
Yea
rs
Inve
stm
ents
in
Ce
ntra
l an
d St
ate
Gove
rnm
ent
Secu
ritie
s
Idea
l Inv
estm
ent H
oriz
on$
3 Ye
ars
+3
Year
s +
3 Ye
ars
+3
Year
s +
3 Ye
ars
+
Ince
ptio
n Da
teRe
gula
r Pla
n: 1
1/03
/201
3; D
irect
Pla
n: 1
1/03
/201
3Re
gula
r Pla
n: 2
9/09
/201
4; D
irect
Pla
n: 2
9/09
/201
4Re
gula
r Pla
n: 1
2/01
/201
2; D
irect
Pla
n: 0
1/01
/201
3Re
gula
r Pla
n: 3
0/01
/200
3; D
irect
Pla
n: 0
1/01
/201
3Re
gula
r Pla
n: 2
7/10
/200
8; D
irect
Pla
n: 0
1/01
/201
3
Fund
Man
ager
Pune
et P
alKu
mar
esh
Ram
akris
hnan
and
Vira
l Sha
hPu
neet
Pal
Pune
et P
alPu
neet
Pal
Benc
hmar
kCR
ISIL
Ban
king
& P
SU D
ebt I
ndex
Nifty
Cre
dit R
isk
Bond
Inde
xCR
ISIL
Com
posi
te B
ond
Fund
Inde
xCR
ISIL
Com
posi
te B
ond
Fund
Inde
xI-S
ec M
i-Bex
Fund
Det
ails
as
on Ja
nuar
y 31
, 202
0
Mon
th E
nd A
UM (i
n cr
ores
)64
.26
353.
7943
.18
53.1
933
.51
Aver
age
Mat
urity
2.67
year
s1.
82 ye
ars
6.25
year
s2.
34 ye
ars
7.42
year
s
Mac
aula
y Du
ratio
n—
——
——
Mod
ified
Dur
atio
n2.
20 ye
ars
1.40
year
s4.
50 ye
ars
1.96
year
s5.
25 ye
ars
Port
folio
Yie
ld6.
86%
10.3
3%6.
83%
6.86
%6.
62%
Asse
t Mix
Com
mer
cial
Pap
er—
——
——
Cert
ifica
te o
f Dep
osit
3.09
%1.
12%
——
—
PSU
Bond
s65
.80%
31.6
6%33
.61%
39.2
6%—
Bank
Fix
ed D
epos
it—
——
——
Bill
Redi
scou
ntin
g—
——
——
Trea
sury
Bill
s—
——
——
Corp
orat
e De
bt2.
72%
62.5
9%8.
28%
46.6
2%—
Cash
& C
urre
nt A
sset
s7.
17%
4.63
%12
.82%
6.47
%12
.45%
TREP
S—
——
——
GOI S
ecur
ities
8.65
%—
45.2
9%7.
65%
87.5
5%
Reve
rse
Repo
——
——
—
Bank
Bon
ds12
.57%
——
——
Ratin
g M
ix
AAA/
A1+/
Sove
reig
n &
equi
vale
nts
80.9
0%21
.62%
89.0
0%10
0.00
%10
0.00
%
AA+
12.5
7%1.
44%
11.0
0%—
—
AA*
6.53
%55
.24%
——
—
A+—
13.1
2%—
——
Othe
rs—
8.58
%—
——
Load
Str
uctu
re
Exit
Load
Nil
Refe
r pag
e no
. 24
1% if
rede
emed
with
in 3
0 da
ys o
f allo
tmen
t and
Nil
If re
deem
ed a
fter 3
0 da
ys fr
om th
e da
te o
f allo
tmen
tNi
lNi
l
*AA
incl
ude
secu
ritie
s ra
ted
as A
A an
d AA
-. $
IInve
stor
s sh
ould
con
sult
thei
r fin
anci
al a
dvis
or fo
r tax
impl
icat
ions
on
thei
r inv
estm
ents
.#
Thes
e ar
e ba
sed
on fu
nd m
anag
er’s
curre
nt o
utlo
ok &
Sub
ject
to c
hang
e.

18
Fund Details
Investment Style Box:
Investment Objective: The Scheme aims to provide reasonable returns commensurate with low risk and providing a high level of liquidity, through investments made primarily in overnight securities having maturity of 1 business day.
Fund Manager: Mr. Kumaresh Ramakrishnan (Over 20 years of experience in Fixed Income market as Fund Manager and Analyst) and Mr. Kunal Jain (Over 10 years of experience in the fund management of fixed income securities).
Benchmark: NIFTY 1D Rate Index
Option: Dividend (Daily - Reinvestment, Weekly - Payout/Reinvestment) and Growth.
Quarterly (Oct-Dec 2019) Average AUM (` in Cr): 102.07
Monthly Average AUM (` in Cr): 128.52
AUM as on 31/01/2020 (` in Cr): 151.90
Average Maturity: 1 day
Modified Duration: 1 day Portfolio Yield: 5.04%
Fund Manager’s Report: The fund is deployed in overnight securities mainly comprising reverse repo and treps.
NAV Regular Plan Direct Plan
Growth ` 1021.2398 ` 1021.7429
Daily Dividend ` 1000.0000 ` 1000.0000
Weekly Dividend ` 1000.9235 ` 1000.9862
Load Structure$: Entry Load: NA. Exit Load: Nil
$No exit load will be charged for switches and STP between Schemes of PGIM India Mutual Fund except from PGIM India Insta Cash Fund.
## For rating methodology refer page no. 28
Details as on January 31, 2020
This product is suitable for investors who are seeking*
• Income over a short term investment horizon
• Investment in debt and money market instruments having maturity of upto 1 business day
• Degree of risk – LOW
* Investors should consult their financial advisers if in doubt about whether the product is suitable for them.
Moderate
Moderately
Low
Low
ModeratelyHigh
High
LOW HIGH
Low — investors understand that their principal will be at low risk.
Asset Allocation (%) Credit Quality Profile (%)
Regular Plan and Direct Plan are available for subscription as per the below details
Inception Date: Regular Plan: 27/08/2019, Direct Plan: 27/08/2019. Application Amount: ` 100/- and in multiples of ` 1/- thereafter. Additional Purchase Amount: Minimum of ` 100/- and in multiples of ` 1/- thereafter or 100 Units. Repurchase / Redemption Amount: ` 100/- and in multiples of ` 1/- thereafter or 0.1 unit or account balance, whichever is lower. SIP/STP/SWP: Available. Investment Amount for SIP/STP/SWP: SIP: Monthly: 10 installments of ` 500/- each and in multiples of ` 1/- thereafter. Quarterly: 5 installments of ` 1000/- each and in multiples of ` 1/- thereafter. STP: Monthly: 10 installments of ` 500/- each and in multiples of ` 100/- thereafter. Quarterly: 5 installments of ` 1000/- each and in multiples of ` 100/- thereafter. SWP (Monthly/Quarterly): 2 (two) installments of ` 100/-.
Portfolio
Issuer % to Net Assets
Reverse Repo 99.69
Cash & Current Assets 0.31
Total 100.00
OVERNIGHT FUNDPGIM INDIA
An open ended debt scheme investing in overnight securitiesRated A1+mfs by ICRA##
Returns are not provided as the scheme has not completed one year of performance.
0.31
99.69
Cash & Current Assets
Reverse Repo 100.00AAA / A1+

19
Fund Details
Investment Style Box:
Investment Objective: To generate steady returns along with high liquidity by investing in a portfolio of short-term, high quality money market and debt instruments.Fund Manager: Mr. Kumaresh Ramakrishnan (Over 20 years of experience in Fixed Income market as Fund Manager and Analyst) and Mr. Kunal Jain (Over 10 years of experience in the fund management of fixed income securities).Benchmark: CRISIL Liquid Fund IndexOption: Dividend (Daily Reinvestment only, Weekly, Monthly - Payout/Reinvestment/Sweep) and Growth.Quarterly (Oct-Dec 2019) Average AUM (` in Cr): 482.48Monthly Average AUM (` in Cr): 713.75AUM as on 31/01/2020 (` in Cr): 1035.56Average Maturity: 0.08 yr Modified Duration: 0.07 yrPortfolio Yield: 5.35%Fund Manager’s Report: The fund maintains a judicious mix of near liquid and predominantly short term money market securities to deliver steady returns.
NAV Regular Plan Direct PlanGrowth ` 254.7198 ` 255.9557Daily Dividend ` 100.3040 ` 103.9541Weekly Dividend ` 100.6899 ` 100.6085Monthly Dividend ` 109.2054 ` 108.4477Bonus ` 174.1373 —
Load Structure$: Entry Load: NA.Exit Load (w.e.f. October 20, 2019):
Investor exit upon subscription
Exit load as a % of redemption/ switch proceeds
Day 1 0.0070%Day 2 0.0065%Day 3 0.0060%Day 4 0.0055%Day 5 0.0050%Day 6 0.0045%
Day 7 onwards 0.0000%$No exit load will be charged for switches and STP between Schemes of PGIM India Mutual Fund except from PGIM India Insta Cash Fund.## For rating methodology refer page no. 28
Asset Allocation (%) Credit Quality Profile (%)
Details as on January 31, 2020
This product is suitable for investors who are seeking*
• Liquidity and generate income in the short term
• Investment in debt and money market securities with maturity upto 91 days only
• Degree of risk – LOW
* Investors should consult their financial advisers if in doubt about whether the product is suitable for them.
Moderate
Moderately
Low
Low
ModeratelyHigh
High
LOW HIGH
Low — investors understand that their principal will be at low risk.
Regular Plan and Direct Plan are available for subscription as per the below detailsInception Date: Regular Plan: 05/09/2007, Direct Plan: 01/01/2013. Application Amount: ` 100/- and in multiples of ` 1/- thereafter. Additional Purchase Amount: Minimum of ` 100/- and in multiples of ` 1/- thereafter. Repurchase / Redemption Amount: ` 100/- and in multiples of ` 1/- thereafter or 0.1 unit or account balance, whichever is lower. SIP/STP/SWP: Available. Investment Amount for SIP/STP/SWP: SIP/STP: Monthly: 60 installments of ` 100/- each and in multiples of ` 1/- thereafter. Quarterly: 20 installments of ` 300/- each and in multiples of ` 1/- thereafter. STP Daily: 60 installments of ` 100/- and in multiples of ` 100/- thereafter to all open ended equity schemes except PGIM India Long Term Equity Fund. In case of PGIM India Long Term Equity Fund, 30 installments of ` 500/- and in multiples of ` 500/- thereafter. SWP (Monthly/Quarterly): 2 (two) installments of ` 100/-.
Dividend HistoryRegular Plan Direct Plan
Record Date
Dividend / unit (`)#
NAV (`) Dividend / unit (`)#
NAV (`)
MONTHLY DIVIDEND29-Nov-19 0.3135 109.1884 0.3202 108.420027-Dec-19 0.3135 109.1430 0.3202 108.378331-Jan-20 0.3135 109.2054 0.3202 108.4477QUARTERLY DIVIDEND28-Dec-18 1.4674 144.5086 1.5342 146.443825-Mar-19 1.4674 144.7950 1.5342 146.678228-Jun-19 1.4674 145.3521 1.5342 147.1883ANNUAL DIVIDEND28-Mar-14 8.4000 114.3787 — —23-Mar-18 6.6916 141.2863 — —
# On face value of ̀ 100. Post Dividend per unit NAV will fall to the extent of the payout and applicable tax/surcharges/cess/other statutory levies. Dividend distribution is subject to availability of distributable surplus. Past Performance may or may not be sustained in future.
Performance
Fund CRISIL Liquid Fund Index ^ CRISIL 1 Year T-Bill Index #
Period Returns (%) Value (INR)* Returns (%) Value (INR)* Returns (%) Value (INR)*
Regular Plan - Growth Option
7 Days (24 Jan 2020 To 31 Jan 2020) 5.19 10,009.70 5.68 10,010.59 5.00 10,009.36
15 Days (16 Jan 2020 To 31 Jan 2020) 5.19 10,020.81 5.58 10,022.34 5.59 10,022.39
30 Days (31 Dec 2019 To 31 Jan 2020) 5.16 10,042.81 5.60 10,046.36 5.65 10,046.81
Last 1 Year (CAGR) 6.52 10,652.34 6.68 10,668.14 7.25 10,725.17
Last 3 Years (CAGR) 6.91 12,218.54 7.01 12,254.37 6.70 12,149.25
Last 5 Years (CAGR) 7.33 14,247.49 7.32 14,236.32 7.09 14,085.07
Since Inception (CAGR) 7.82 25,472.14 7.47 24,470.43 6.54 21,949.55
Direct Plan - Growth Option
7 Days (24 Jan 2020 To 31 Jan 2020) 5.39 10,010.06 5.68 10,010.59 5.00 10,009.36
15 Days (16 Jan 2020 To 31 Jan 2020) 5.39 10,021.59 5.58 10,022.34 5.59 10,022.39
30 Days (31 Dec 2019 To 31 Jan 2020) 5.36 10,044.47 5.60 10,046.36 5.65 10,046.81
Last 1 Year (CAGR) 6.62 10,661.72 6.68 10,668.14 7.25 10,725.17
Last 3 Years (CAGR) 6.98 12,242.33 7.01 12,254.37 6.70 12,149.25
Last 5 Years (CAGR) 7.40 14,289.57 7.32 14,236.32 7.09 14,085.07
Since Inception (CAGR) 7.70 16,920.78 7.83 17,065.81 7.15 16,311.17
Date of Inception: Regular Plan: September 05, 2007; Direct Plan: January 01, 2013. CAGR – Compounded Annual Growth Rate
^ Scheme Benchmark. # Standard Benchmark. *Based on standard investment of ` 10,000 made at the beginning of the relevant period. Past performance may or may not be sustained in future and should not be used as a basis for comparison with other investments.
Returns for the benchmark have been calculated using TRI values.
Returns for period of less than 1 year are Simple Annualised Returns. Kurmaresh Ramakrishnan is managing this fund since January 2011. Kunal Jain is Managing this fund since January 2018. For performance of schemes managed by Kumaresh Ramakrishnan refer page no. 11, 14-15, 18-22, 24, 28. For performance of schemes managed by Kunal Jain refer page no. 18-20.
Different plans have a different expense structure. For Total Expense Ratio as on January 31, 2020 refer page no. 28
PortfolioIssuer % to Net
AssetsRating
Certificate Of Deposit 26.92Indusind Bank Ltd. 6.89 CRISIL A1+Small Industries Development Bank Of India
5.28 CARE A1+
ICICI Bank Ltd. 2.84 ICRA A1+IDFC First Bank Limited 2.30 CARE A1+Andhra Bank 2.29 CARE A1+HDFC Bank Ltd. 2.29 IND A1+National Bank For Agriculture & Rural Development
2.29 CRISIL A1+
Axis Bank Ltd. 1.83 ICRA A1+Axis Bank Ltd. 0.91 CRISIL A1+Commercial Paper 47.20Reliance Jio Infocomm Limited 6.89 CARE A1+Indian Oil Corporation Ltd. 6.88 IND A1+Chennai Petroleum Corporation Ltd 4.59 CRISIL A1+Berger Paints Limited 4.58 CRISIL A1+Alembic Pharmaceuticals Ltd. 4.54 CRISIL A1+
Issuer % to Net Assets
Rating
Hero Fincorp Limited 4.53 CRISIL A1+Redington (India) Limited 3.30 CRISIL A1+Deutsche Investments India Private Ltd 2.74 CRISIL A1+Reliance Jio Infocomm Limited 2.29 CRISIL A1+Blue Star Ltd 2.29 CRISIL A1+SRF Limited 2.29 CRISIL A1+Network 18 Media & Investments Ltd 2.28 ICRA A1+Corporate Debt 6.45Housing Development Finance Corp. Ltd. 5.99 CRISIL AAAKotak Mahindra Investments Limited 0.46 CRISIL AAAPSU Bonds 3.02Exim Bank 2.30 CRISIL AAAPower Finance Corporation Ltd. 0.72 CRISIL AAATreasury Bills 1.4263 Day Cash Management Bill Mat 2020 1.42 SOVCash & Current Assets 14.99Total 100.00
INSTA CASH FUNDPGIM INDIA
An Open Ended Liquid SchemeRated AAAmfs by ICRA##
1.42
3.02
6.45
14.99
26.92
47.20
Treasury Bills
PSU Bonds
Corporate Debt
Cash & Current Assets
Certificate of Deposit
Commercial Paper
1.42
98.58
SOVEREIGN
AAA / A1+
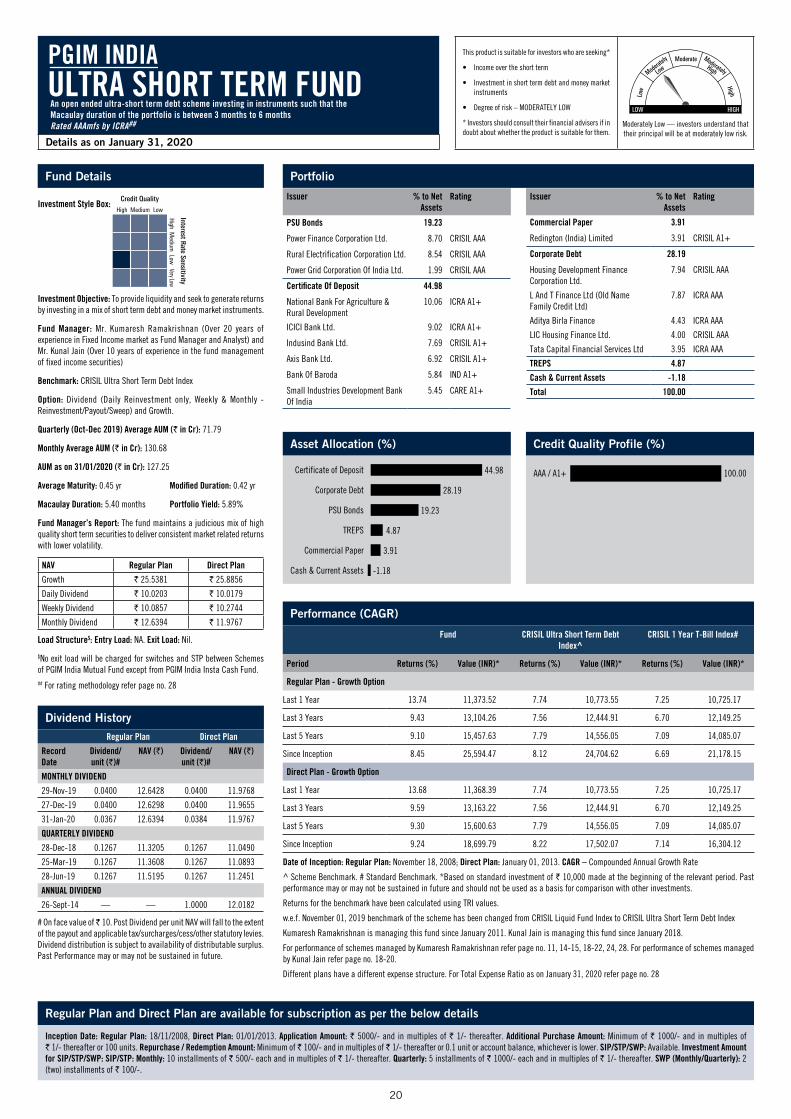
20
Regular Plan and Direct Plan are available for subscription as per the below details
Inception Date: Regular Plan: 18/11/2008, Direct Plan: 01/01/2013. Application Amount: ` 5000/- and in multiples of ` 1/- thereafter. Additional Purchase Amount: Minimum of ` 1000/- and in multiples of ` 1/- thereafter or 100 units. Repurchase / Redemption Amount: Minimum of ̀ 100/- and in multiples of ̀ 1/- thereafter or 0.1 unit or account balance, whichever is lower. SIP/STP/SWP: Available. Investment Amount for SIP/STP/SWP: SIP/STP: Monthly: 10 installments of ` 500/- each and in multiples of ` 1/- thereafter. Quarterly: 5 installments of ` 1000/- each and in multiples of ` 1/- thereafter. SWP (Monthly/Quarterly): 2 (two) installments of ` 100/-.
Fund Details
Investment Style Box:
Investment Objective: To provide liquidity and seek to generate returns by investing in a mix of short term debt and money market instruments.
Fund Manager: Mr. Kumaresh Ramakrishnan (Over 20 years of experience in Fixed Income market as Fund Manager and Analyst) and Mr. Kunal Jain (Over 10 years of experience in the fund management of fixed income securities)
Benchmark: CRISIL Ultra Short Term Debt Index
Option: Dividend (Daily Reinvestment only, Weekly & Monthly - Reinvestment/Payout/Sweep) and Growth.
Quarterly (Oct-Dec 2019) Average AUM (` in Cr): 71.79
Monthly Average AUM (` in Cr): 130.68
AUM as on 31/01/2020 (` in Cr): 127.25
Average Maturity: 0.45 yr Modified Duration: 0.42 yr
Macaulay Duration: 5.40 months Portfolio Yield: 5.89%
Fund Manager’s Report: The fund maintains a judicious mix of high quality short term securities to deliver consistent market related returns with lower volatility.
NAV Regular Plan Direct Plan
Growth ` 25.5381 ` 25.8856
Daily Dividend ` 10.0203 ` 10.0179
Weekly Dividend ` 10.0857 ` 10.2744
Monthly Dividend ` 12.6394 ` 11.9767
Load Structure$: Entry Load: NA. Exit Load: Nil.
$No exit load will be charged for switches and STP between Schemes of PGIM India Mutual Fund except from PGIM India Insta Cash Fund.## For rating methodology refer page no. 28
Asset Allocation (%) Credit Quality Profile (%)
Portfolio
Issuer % to Net Assets
Rating
PSU Bonds 19.23
Power Finance Corporation Ltd. 8.70 CRISIL AAA
Rural Electrification Corporation Ltd. 8.54 CRISIL AAA
Power Grid Corporation Of India Ltd. 1.99 CRISIL AAA
Certificate Of Deposit 44.98
National Bank For Agriculture & Rural Development
10.06 ICRA A1+
ICICI Bank Ltd. 9.02 ICRA A1+
Indusind Bank Ltd. 7.69 CRISIL A1+
Axis Bank Ltd. 6.92 CRISIL A1+
Bank Of Baroda 5.84 IND A1+
Small Industries Development Bank Of India
5.45 CARE A1+
Issuer % to Net Assets
Rating
Commercial Paper 3.91
Redington (India) Limited 3.91 CRISIL A1+
Corporate Debt 28.19
Housing Development Finance Corporation Ltd.
7.94 CRISIL AAA
L And T Finance Ltd (Old Name Family Credit Ltd)
7.87 ICRA AAA
Aditya Birla Finance 4.43 ICRA AAA
LIC Housing Finance Ltd. 4.00 CRISIL AAA
Tata Capital Financial Services Ltd 3.95 ICRA AAA
TREPS 4.87
Cash & Current Assets -1.18
Total 100.00
Details as on January 31, 2020
This product is suitable for investors who are seeking*
• Income over the short term
• Investment in short term debt and money market instruments
• Degree of risk – MODERATELY LOW
* Investors should consult their financial advisers if in doubt about whether the product is suitable for them.
Moderate
Moderately
Low
Low
ModeratelyHigh
High
LOW HIGH
Moderately Low — investors understand that their principal will be at moderately low risk.
Performance (CAGR)
Fund CRISIL Ultra Short Term Debt Index^
CRISIL 1 Year T-Bill Index#
Period Returns (%) Value (INR)* Returns (%) Value (INR)* Returns (%) Value (INR)*
Regular Plan - Growth Option
Last 1 Year 13.74 11,373.52 7.74 10,773.55 7.25 10,725.17
Last 3 Years 9.43 13,104.26 7.56 12,444.91 6.70 12,149.25
Last 5 Years 9.10 15,457.63 7.79 14,556.05 7.09 14,085.07
Since Inception 8.45 25,594.47 8.12 24,704.62 6.69 21,178.15
Direct Plan - Growth Option
Last 1 Year 13.68 11,368.39 7.74 10,773.55 7.25 10,725.17
Last 3 Years 9.59 13,163.22 7.56 12,444.91 6.70 12,149.25
Last 5 Years 9.30 15,600.63 7.79 14,556.05 7.09 14,085.07
Since Inception 9.24 18,699.79 8.22 17,502.07 7.14 16,304.12
Date of Inception: Regular Plan: November 18, 2008; Direct Plan: January 01, 2013. CAGR – Compounded Annual Growth Rate
^ Scheme Benchmark. # Standard Benchmark. *Based on standard investment of ` 10,000 made at the beginning of the relevant period. Past performance may or may not be sustained in future and should not be used as a basis for comparison with other investments.
Returns for the benchmark have been calculated using TRI values.
w.e.f. November 01, 2019 benchmark of the scheme has been changed from CRISIL Liquid Fund Index to CRISIL Ultra Short Term Debt Index
Kumaresh Ramakrishnan is managing this fund since January 2011. Kunal Jain is managing this fund since January 2018.
For performance of schemes managed by Kumaresh Ramakrishnan refer page no. 11, 14-15, 18-22, 24, 28. For performance of schemes managed by Kunal Jain refer page no. 18-20.
Different plans have a different expense structure. For Total Expense Ratio as on January 31, 2020 refer page no. 28
Dividend HistoryRegular Plan Direct Plan
Record Date
Dividend/unit (`)#
NAV (`) Dividend/unit (`)#
NAV (`)
MONTHLY DIVIDEND
29-Nov-19 0.0400 12.6428 0.0400 11.9768
27-Dec-19 0.0400 12.6298 0.0400 11.9655
31-Jan-20 0.0367 12.6394 0.0384 11.9767
QUARTERLY DIVIDEND
28-Dec-18 0.1267 11.3205 0.1267 11.0490
25-Mar-19 0.1267 11.3608 0.1267 11.0893
28-Jun-19 0.1267 11.5195 0.1267 11.2451
ANNUAL DIVIDEND
26-Sept-14 — — 1.0000 12.0182
# On face value of ̀ 10. Post Dividend per unit NAV will fall to the extent of the payout and applicable tax/surcharges/cess/other statutory levies. Dividend distribution is subject to availability of distributable surplus. Past Performance may or may not be sustained in future.
ULTRA SHORT TERM FUNDPGIM INDIA
An open ended ultra-short term debt scheme investing in instruments such that the Macaulay duration of the portfolio is between 3 months to 6 monthsRated AAAmfs by ICRA##
-1.18
3.91
4.87
19.23
28.19
44.98
Cash & Current Assets
Commercial Paper
TREPS
PSU Bonds
Corporate Debt
Certificate of Deposit 100.00AAA / A1+
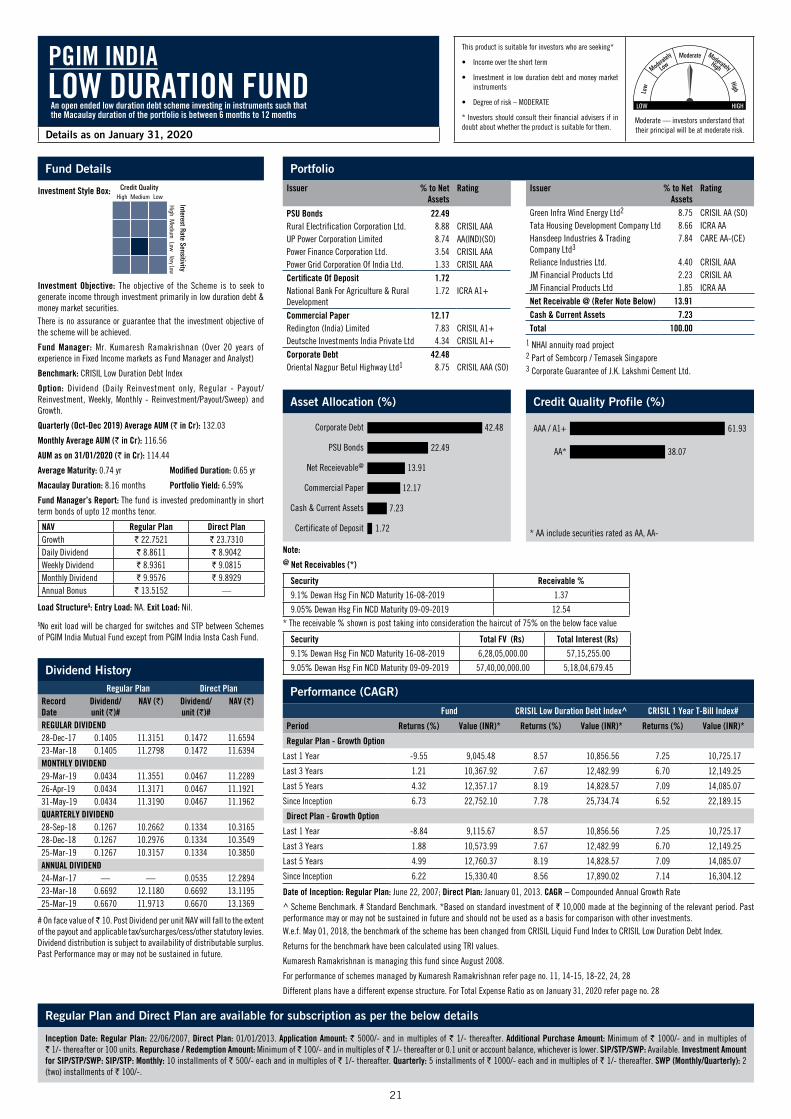
21
Details as on January 31, 2020
This product is suitable for investors who are seeking*
• Income over the short term
• Investment in low duration debt and money market instruments
• Degree of risk – MODERATE
* Investors should consult their financial advisers if in doubt about whether the product is suitable for them.
Moderate
Moderately
Low
Low
ModeratelyHigh
High
LOW HIGH
Moderate — investors understand that their principal will be at moderate risk.
Fund Details
Investment Style Box:
Investment Objective: The objective of the Scheme is to seek to generate income through investment primarily in low duration debt & money market securities.There is no assurance or guarantee that the investment objective of the scheme will be achieved.
Fund Manager: Mr. Kumaresh Ramakrishnan (Over 20 years of experience in Fixed Income markets as Fund Manager and Analyst)
Benchmark: CRISIL Low Duration Debt Index
Option: Dividend (Daily Reinvestment only, Regular - Payout/Reinvestment, Weekly, Monthly - Reinvestment/Payout/Sweep) and Growth.
Quarterly (Oct-Dec 2019) Average AUM (` in Cr): 132.03
Monthly Average AUM (` in Cr): 116.56
AUM as on 31/01/2020 (` in Cr): 114.44
Average Maturity: 0.74 yr Modified Duration: 0.65 yr
Macaulay Duration: 8.16 months Portfolio Yield: 6.59%
Fund Manager’s Report: The fund is invested predominantly in short term bonds of upto 12 months tenor.
NAV Regular Plan Direct PlanGrowth ` 22.7521 ` 23.7310Daily Dividend ` 8.8611 ` 8.9042Weekly Dividend ` 8.9361 ` 9.0815Monthly Dividend ` 9.9576 ` 9.8929Annual Bonus ` 13.5152 —
Load Structure$: Entry Load: NA. Exit Load: Nil.
$No exit load will be charged for switches and STP between Schemes of PGIM India Mutual Fund except from PGIM India Insta Cash Fund.
Asset Allocation (%) Credit Quality Profile (%)
Portfolio
Issuer % to Net Assets
Rating
PSU Bonds 22.49Rural Electrification Corporation Ltd. 8.88 CRISIL AAAUP Power Corporation Limited 8.74 AA(IND)(SO)Power Finance Corporation Ltd. 3.54 CRISIL AAAPower Grid Corporation Of India Ltd. 1.33 CRISIL AAACertificate Of Deposit 1.72National Bank For Agriculture & Rural Development
1.72 ICRA A1+
Commercial Paper 12.17Redington (India) Limited 7.83 CRISIL A1+Deutsche Investments India Private Ltd 4.34 CRISIL A1+Corporate Debt 42.48Oriental Nagpur Betul Highway Ltd1 8.75 CRISIL AAA (SO)
Issuer % to Net Assets
Rating
Green Infra Wind Energy Ltd2 8.75 CRISIL AA (SO)Tata Housing Development Company Ltd 8.66 ICRA AAHansdeep Industries & Trading Company Ltd3
7.84 CARE AA-(CE)
Reliance Industries Ltd. 4.40 CRISIL AAAJM Financial Products Ltd 2.23 CRISIL AAJM Financial Products Ltd 1.85 ICRA AANet Receivable @ (Refer Note Below) 13.91Cash & Current Assets 7.23Total 100.00
* AA include securities rated as AA, AA-
Regular Plan and Direct Plan are available for subscription as per the below details
Inception Date: Regular Plan: 22/06/2007, Direct Plan: 01/01/2013. Application Amount: ` 5000/- and in multiples of ` 1/- thereafter. Additional Purchase Amount: Minimum of ` 1000/- and in multiples of ` 1/- thereafter or 100 units. Repurchase / Redemption Amount: Minimum of ̀ 100/- and in multiples of ̀ 1/- thereafter or 0.1 unit or account balance, whichever is lower. SIP/STP/SWP: Available. Investment Amount for SIP/STP/SWP: SIP/STP: Monthly: 10 installments of ` 500/- each and in multiples of ` 1/- thereafter. Quarterly: 5 installments of ` 1000/- each and in multiples of ` 1/- thereafter. SWP (Monthly/Quarterly): 2 (two) installments of ` 100/-.
Dividend HistoryRegular Plan Direct Plan
Record Date
Dividend/unit (`)#
NAV (`) Dividend/unit (`)#
NAV (`)
REGULAR DIVIDEND28-Dec-17 0.1405 11.3151 0.1472 11.659423-Mar-18 0.1405 11.2798 0.1472 11.6394MONTHLY DIVIDEND29-Mar-19 0.0434 11.3551 0.0467 11.228926-Apr-19 0.0434 11.3171 0.0467 11.192131-May-19 0.0434 11.3190 0.0467 11.1962QUARTERLY DIVIDEND28-Sep-18 0.1267 10.2662 0.1334 10.316528-Dec-18 0.1267 10.2976 0.1334 10.354925-Mar-19 0.1267 10.3157 0.1334 10.3850ANNUAL DIVIDEND24-Mar-17 — — 0.0535 12.289423-Mar-18 0.6692 12.1180 0.6692 13.119525-Mar-19 0.6670 11.9713 0.6670 13.1369
# On face value of ̀ 10. Post Dividend per unit NAV will fall to the extent of the payout and applicable tax/surcharges/cess/other statutory levies. Dividend distribution is subject to availability of distributable surplus. Past Performance may or may not be sustained in future.
Performance (CAGR)
Fund CRISIL Low Duration Debt Index^ CRISIL 1 Year T-Bill Index#
Period Returns (%) Value (INR)* Returns (%) Value (INR)* Returns (%) Value (INR)*
Regular Plan - Growth Option
Last 1 Year -9.55 9,045.48 8.57 10,856.56 7.25 10,725.17
Last 3 Years 1.21 10,367.92 7.67 12,482.99 6.70 12,149.25
Last 5 Years 4.32 12,357.17 8.19 14,828.57 7.09 14,085.07
Since Inception 6.73 22,752.10 7.78 25,734.74 6.52 22,189.15
Direct Plan - Growth Option
Last 1 Year -8.84 9,115.67 8.57 10,856.56 7.25 10,725.17
Last 3 Years 1.88 10,573.99 7.67 12,482.99 6.70 12,149.25
Last 5 Years 4.99 12,760.37 8.19 14,828.57 7.09 14,085.07
Since Inception 6.22 15,330.40 8.56 17,890.02 7.14 16,304.12
Date of Inception: Regular Plan: June 22, 2007; Direct Plan: January 01, 2013. CAGR – Compounded Annual Growth Rate
^ Scheme Benchmark. # Standard Benchmark. *Based on standard investment of ` 10,000 made at the beginning of the relevant period. Past performance may or may not be sustained in future and should not be used as a basis for comparison with other investments.W.e.f. May 01, 2018, the benchmark of the scheme has been changed from CRISIL Liquid Fund Index to CRISIL Low Duration Debt Index.
Returns for the benchmark have been calculated using TRI values.
Kumaresh Ramakrishnan is managing this fund since August 2008.
For performance of schemes managed by Kumaresh Ramakrishnan refer page no. 11, 14-15, 18-22, 24, 28
Different plans have a different expense structure. For Total Expense Ratio as on January 31, 2020 refer page no. 28
1 NHAI annuity road project2 Part of Sembcorp / Temasek Singapore3 Corporate Guarantee of J.K. Lakshmi Cement Ltd.
LOW DURATION FUNDPGIM INDIA
An open ended low duration debt scheme investing in instruments such that the Macaulay duration of the portfolio is between 6 months to 12 months
Note:@ Net Receivables (*)
Security Receivable %
9.1% Dewan Hsg Fin NCD Maturity 16-08-2019 1.37
9.05% Dewan Hsg Fin NCD Maturity 09-09-2019 12.54
* The receivable % shown is post taking into consideration the haircut of 75% on the below face value
Security Total FV (Rs) Total Interest (Rs)
9.1% Dewan Hsg Fin NCD Maturity 16-08-2019 6,28,05,000.00 57,15,255.00
9.05% Dewan Hsg Fin NCD Maturity 09-09-2019 57,40,00,000.00 5,18,04,679.45
1.72
7.23
12.17
13.91
22.49
42.48
Certificate of Deposit
Cash & Current Assets
Commercial Paper
Net Receievable@
PSU Bonds
Corporate Debt
38.07
61.93
AA*
AAA / A1+

22
Details as on January 31, 2020
This product is suitable for investors who are seeking*
• Income over the short term
• Investment in short term debt and money market instruments
• Degree of risk – MODERATE
* Investors should consult their financial advisers if in doubt about whether the product is suitable for them.
Moderate
Moderately
Low
Low
ModeratelyHigh
High
LOW HIGH
Moderate — investors understand that their principal will be at moderate risk.
Fund Details
Investment Style Box:
Investment Objective: The investment objective of the Scheme is to seek to generate returns with low to medium market risk for investors by investing in a portfolio of short -medium term debt and money market securities.Fund Manager: Mr. Puneet Pal (Over 16 years of experience in Debt Market) and Mr. Kumaresh Ramakrishnan (Over 20 years of experience in Fixed Income markets as Fund Manager and Analyst)Benchmark: CRISIL Short Term Bond Fund IndexOption: Dividend (Monthly, Quarterly & Annual - Payout/Reinvestment/Sweep) and Growth.Quarterly (Oct-Dec 2019) Average AUM (` in Cr): 73.62Monthly Average AUM (` in Cr): 44.96AUM as on 31/01/2020 (` in Cr): 44.48Average Maturity: 2.46 yrs Modified Duration: 2.05 yrsMacaulay Duration: 2.18 years Portfolio Yield: 6.68%Fund Manager’s Report: The fund is invested in short duration AAA securities. We will continue with the same positioning and maintain the portfolio duration between 1-3.
NAV Regular Plan Direct Plan
Growth ` 32.8431 ` 34.8649
Monthly Dividend ` 11.8665 ` 12.4297
Quarterly Dividend ` 9.9779 ` 10.5711
Half Yearly Bonus ` 13.2702 —
Annual Bonus ` 21.8954 —
Load Structure$: Entry Load: NA. Exit Load: w.e.f. February 01, 2018: 0.50% If redeemed on or before 6 months from the date of allotment and Nil If redeemed after 6 months from the date of allotment.
$No exit load will be charged for switches and STP between Schemes of PGIM India Mutual Fund except from PGIM India Insta Cash Fund.
Asset Allocation (%) Credit Quality Profile (%)
Regular Plan and Direct Plan are available for subscription as per the below details
Inception Date: Regular Plan: 21/01/2003, Direct Plan: 01/01/2013. Application Amount: ` 5000/- and in multiples of ` 1/- thereafter. Additional Purchase Amount: Minimum of ` 1000/- and in multiples of ` 1/- thereafter or 100 units. Repurchase / Redemption Amount: Minimum of ̀ 100/- and in multiples of ̀ 1/- thereafter or 0.1 unit or account balance, whichever is lower. SIP/STP/SWP: Available. Investment Amount for SIP/STP/SWP: SIP/STP: Monthly: 10 installments of ` 500/- each and in multiples of ` 1/- thereafter. Quarterly: 5 installments of ` 1000/- each and in multiples of ` 1/- thereafter. SWP (Monthly/Quarterly): 2 (two) installments of ` 100/-.
Dividend HistoryRegular Plan Direct Plan
Record Date
Dividend/unit (`)#
NAV (`) Dividend/unit (`)#
NAV (`)
MONTHLY DIVIDEND29-Nov-19 0.0400 11.9803 0.0484 12.555327-Dec-19 0.0400 11.9059 0.0484 12.473531-Jan-20 0.0477 11.8665 0.0524 12.4297QUARTERLY DIVIDEND28-Sep-18 0.1334 10.3974 0.1401 10.901928-Dec-18 0.1334 10.4080 0.1401 10.937625-Mar-19 0.1334 10.3993 0.1401 10.9523ANNUAL DIVIDEND24-Mar-17 0.5353 11.1047 — —23-Mar-18 0.6022 10.9914 — —25-Mar-19 0.4136 10.6908 — —
# On face value of ̀ 10. Post Dividend per unit NAV will fall to the extent of the payout and applicable tax/surcharges/cess/other statutory levies. Dividend distribution is subject to availability of distributable surplus. Past Performance may or may not be sustained in future.
Peformance (CAGR)
Fund CRISIL Short TermBond Fund Index^
CRISIL 1 Year T-Bill Index#
Period Returns (%) Value (INR)* Returns (%) Value (INR)* Returns (%) Value (INR)*
Regular Plan - Growth Option
Last 1 Year -1.10 9,889.52 9.92 10,991.63 7.25 10,725.17
Last 3 Years 3.59 10,358.62 7.45 12,406.01 6.70 12,149.25
Last 5 Years 5.75 13,228.95 8.14 14,791.35 7.09 14,085.07
Since Inception 7.23 32,805.44 7.28 33,070.36 6.08 27,324.54
Direct Plan - Growth Option
Last 1 Year -0.38 9,962.45 9.92 10,991.63 7.25 10,725.17
Last 3 Years 4.46 11,400.09 7.45 12,406.01 6.70 12,149.25
Last 5 Years 6.65 13,802.45 8.14 14,791.35 7.09 14,085.07
Since Inception 7.54 16,732.68 8.52 17,848.21 7.14 16,304.12
Date of Inception: Regular Plan: January 21, 2003; Direct Plan: January 01, 2013. CAGR – Compounded Annual Growth Rate
^ Scheme Benchmark. # Standard Benchmark. *Based on standard investment of ` 10,000 made at the beginning of the relevant period. Past performance may or may not be sustained in future and should not be used as a basis for comparison with other investments.
Returns for the benchmark have been calculated using TRI values.
Puneet Pal is managing this fund since December 2017 and Kumaresh Ramakrishnan is managing this fund since December 2017
For performance of schemes managed by Puneet Pal refer page no. 22-23, 25-27
For performance of schemes managed by Kumaresh Ramakrishnan refer page no. 11, 14-15, 18-22, 24, 28
Different plans have a different expense structure. For Total Expense Ratio as on January 31, 2020 refer page no. 28
Issuer % to Net Assets
Rating
GOI Securities 8.91
6.18 Govt Stock Mat 2024 8.91 SOV
PSU Bonds 61.02
Rural Electrification Corporation Ltd. 9.58 CRISIL AAA
National Bank For Agriculture & Rural Development
9.52 CRISIL AAA
Bharat Petroleum Corporation Ltd. 8.83 CRISIL AAA
Power Finance Corporation Ltd. 8.43 CRISIL AAA
Small Industries Development Bank Of India
8.02 CARE AAA
Indian Railway Finance Corporation Ltd 7.99 CRISIL AAA
National Highways Authority Of India 2.28 CRISIL AAA
Portfolio
Issuer % to Net Assets
Rating
Housing & Urban Development Corporation Ltd
1.14 ICRA AAA
State Bank Of India 5.23 CRISIL AA+
Corporate Debt 15.10
Reliance Jio Infocomm Limited 6.00 CRISIL AAA
L And T Finance Ltd (Old Name Family Credit Ltd)
5.63 CRISIL AAA
Reliance Industries Ltd. 1.39 CRISIL AAA
Housing Development Finance Corporation Ltd.
1.39 CRISIL AAA
Britannia Industries Limited 0.69 CRISIL AAA
Cash & Current Assets 14.97
Total 100.00
SHORT MATURITY FUNDPGIM INDIA
An open ended short term debt scheme investing in instruments such that the Macaulay duration of the portfolio is between 1 year to 3 years
8.91
14.97
15.10
61.02
GOI Securities
Cash & Current Assets
Corporate Debt
PSU Bonds
8.91
5.23
85.86
SOVEREIGN
AA+
AAA / A1+

23
Fund Details
Investment Style Box:
Investment Objective: The primary objective of the Scheme is to seek to generate income and capital appreciation by investing predominantly in debt instruments issued by banks, Public Sector Undertakings, Public Financial institutions and Municipal Bonds.
Fund Manager: Mr. Puneet Pal (Over 16 years of experience in Debt Market)
Benchmark: CRISIL Banking & PSU Debt Index
Option: Dividend (Regular - Payout/Reinvestment, Weekly, Monthly, Quarterly and Annual - Payout/Reinvestment/Sweep) and Growth.
Quarterly (Oct-Dec 2019) Average AUM (` in Cr): 54.46
Monthly Average AUM (` in Cr): 64.11
AUM as on 31/01/2020 (` in Cr): 64.26
Average Maturity: 2.67 yrs
Modified Duration: 2.20 yrs Portfolio Yield: 6.86%
Fund Manager’s Report: The fund is invested in shorter tenor AAA PSU and Bank Bonds. We will continue with the same positioning.
NAV Regular Plan Direct Plan
Growth ` 17.4225 ` 18.0101
Monthly Dividend ` 10.6311 ` 10.7695
Weekly Dividend — —
Quarterly Dividend ` 10.6429 —
Annual Dividend — ` 10.6207
Load Structure$: Entry Load: NA. Exit Load: Nil.
$No exit load will be charged for switches and STP between Schemes of PGIM India Mutual Fund except from PGIM India Insta Cash Fund.## For rating methodology refer page no. 28
Regular Plan and Direct Plan are available for subscription as per the below details
Inception Date: Regular Plan: 11/03/2013, Direct Plan: 11/03/2013 Application Amount: ̀ 5000/- and in multiples of ̀ 1/- thereafter. Additional Purchase Amount: Minimum of ̀ 1000/- and in multiples of ̀ 1/- thereafter or 100 units. Repurchase / Redemption Amount: ̀ 100/- and in multiples of ̀ 1/- thereafter or 0.1 units or account balance, whichever is lower. SIP/STP/SWP: Available. Investment Amount for SIP/STP/SWP: SIP/STP: Monthly: 10 installments of ` 500/- each and in multiples of ` 1/- thereafter. Quarterly: 5 installments of ` 1000/- each and in multiples of ` 1/- thereafter. SWP (Monthly/Quarterly): 2 (two) installments of ` 100/-.
Details as on January 31, 2020
This product is suitable for investors who are seeking*
• Income over the short term
• Investment in debt instruments issued by Banks and Public Sector Undertakings, Public Financial institutions and Municipal Bonds
• Degree of risk – MODERATELY LOW
* Investors should consult their financial advisers if in doubt about whether the product is suitable for them.
Moderate
Moderately
Low
Low
ModeratelyHigh
High
LOW HIGH
Moderately Low — investors understand that their principal will be at moderately low risk.
Asset Allocation (%) Credit Quality Profile (%)
Performance (CAGR)
Fund CRISIL Banking & PSU Debt Index ^ CRISIL 1 Year T-Bill Index#
Period Returns (%) Value (INR)* Returns (%) Value (INR)* Returns (%) Value (INR)*
Regular Plan - Growth Option
Last 1 Year 11.29 11,128.96 11.07 11,107.35 7.25 10,725.17
Last 3 Years 7.33 12,363.05 7.89 12,559.31 6.70 12,149.25
Last 5 Years 7.95 14,663.17 8.51 15,045.76 7.09 14,085.07
Since Inception 8.36 17,412.07 8.93 18,049.42 7.12 16,075.56
Direct Plan - Growth Option
Last 1 Year 11.82 11,182.16 11.07 11,107.35 7.25 10,725.17
Last 3 Years 7.87 12,552.08 7.89 12,559.31 6.70 12,149.25
Last 5 Years 8.48 15,028.42 8.51 15,045.76 7.09 14,085.07
Since Inception 8.66 17,740.16 8.93 18,049.42 7.12 16,075.56
Date of Inception: Regular Plan: March 11, 2013; Direct Plan: March 11, 2013. CAGR – Compounded Annual Growth Rate
^ Scheme Benchmark. # Standard Benchmark. *Based on standard investment of ` 10,000 made at the beginning of the relevant period. Past performance may or may not be sustained in future and should not be used as a basis for comparison with other investments.
Returns for the benchmark have been calculated using TRI values.
w.e.f. November 01, 2019 benchmark of the scheme has been changed from CRISIL Short Term Bond Fund Index to CRISIL Banking & PSU Debt Index.
Puneet Pal is managing this fund since December 2017
For performance of schemes managed by Puneet Pal refer page no. 22-23, 25-27
Different plans have a different expense structure. For Total Expense Ratio as on January 31, 2020 refer page no. 28
Dividend HistoryRegular Plan Direct Plan
Record Date
Dividend/unit (`)#
NAV (`) Dividend/unit (`)#
NAV (`)
MONTHLY DIVIDEND
29-Nov-19 0.0384 10.6373 0.0417 10.7751
27-Dec-19 0.0384 10.5998 0.0417 10.7369
31-Jan-20 0.0407 10.6311 0.0427 10.7695
QUARTERLY DIVIDEND
28-Jun-19 0.1201 10.5731 — —
27-Sep-19 0.1201 10.6530 — —
26-Dec-19 0.1201 10.7274 — —
ANNUAL DIVIDEND
23-Mar-18 — — 0.4684 10.7710
25-Mar-19 — — 0.4669 10.7808
# On face value of ̀ 10. Post Dividend per unit NAV will fall to the extent of the payout and applicable tax/surcharges/cess/other statutory levies. Dividend distribution is subject to availability of distributable surplus. Past Performance may or may not be sustained in future.
Issuer % to Net Assets
Rating
GOI Securities 8.65
6.18 Govt Stock Mat 2024 4.63 SOV
7.32% GOI Mat 2024 4.02 SOV
PSU Bonds 65.80
Indian Railway Finance Corporation Ltd
9.46 CRISIL AAA
Rural Electrification Corporation Ltd.
8.38 CRISIL AAA
Power Finance Corporation Ltd. 8.29 CRISIL AAA
National Bank For Agriculture & Rural Development
8.28 CRISIL AAA
Power Grid Corporation Of India Ltd.
7.91 CRISIL AAA
Housing & Urban Development Corporation Ltd
7.11 ICRA AAA
Portfolio
Issuer % to Net Assets
Rating
National Highways Authority Of India
7.10 CRISIL AAA
UP Power Corporation Limited 6.53 AA(IND)(SO)
Mahanagar Telephone Nigam Ltd. 2.11 CRISIL AAA(CE)
Small Industries Development Bank Of India
0.63 CARE AAA
Certificate Of Deposit 3.09
Bank Of Baroda 3.09 IND A1+
Corporate Debt 2.72
Reliance Jio Infocomm Limited 2.72 CRISIL AAA
Bank Bonds 12.57
State Bank Of India 6.29 CRISIL AA+
Axis Bank Ltd. 6.28 CRISIL AA+
Cash & Current Assets 7.17
Total 100.00
* AA include securities rated as AA and AA-
BANKING AND PSU DEBT FUNDPGIM INDIA
An open ended debt scheme predominantly investing in Debt instruments of banks,Public Sector Undertakings, Public Financial Institutions and Municipal BondsRated AAAmfs by ICRA##
2.72
3.09
7.17
8.65
12.57
65.80
Corporate Debt
Certificate of Deposit
Cash & Current Assets
GOI Securities
Bank Bonds
PSU Bonds
8.65
6.53
12.57
72.25
SOVEREIGN
AA*
AA+
AAA / A1+

24
Fund Details
Investment Style Box:
Investment Objective: The investment objective of the Scheme is to seek to generate income and capital appreciation by investing predominantly in AA and below rated corporate debt (excluding AA+ rated corporate bonds).
Fund Manager: Mr. Kumaresh Ramakrishnan (Over 20 years of experience in Fixed Income market as Fund Manager and Analyst) and Mr. Viral Shah (w.e.f. December 01, 2019) (Over 9 years of experience in Debt Market).
Benchmark: NIFTY Credit Risk Bond Index
Option: Dividend (Regular - Payout/Reinvestment, Monthly, Quarterly & Annual - Payout/Reinvestment/Sweep) and Growth.
Quarterly (Oct-Dec 2019) Average AUM (` in Cr): 403.43
Monthly Average AUM (` in Cr): 359.29
AUM as on 31/01/2020 (` in Cr): 353.79
Average Maturity: 1.82 yrs
Modified Duration: 1.40 yrs Portfolio Yield: 10.33%
Fund Manager’s Report: The fund remains predominantly invested in corporate bonds in the 1-3 year segement. The fund holdings are well diversified across ratings ranging from AA to A category.
NAV Regular Plan Direct PlanGrowth ` 14.7811 ` 15.6039Regular Dividend — —Monthly Dividend ` 10.2070 ` 10.3638Quarterly Dividend ` 10.3779 ` 10.5676Annual Dividend ` 12.7884 ` 13.2897
Load Structure$: Entry Load: NA. Exit Load: (w.e.f. October 03, 2019) 10% – of the units allotted may be redeemed without any exit load within 1 year from the date of allotment; Any redemptions in excess of the abovementioned limit would be subject to an exit load of 1%, if the units are redeemed within 1 year from the date of allotment of units; Nil – If the units are redeemed after 1 year from the date of allotment of units.
$No exit load will be charged for switches and STP between schemes of PGIM India Mutual Fund except from PGIM India Insta Cash Fund. However, exit load will continue to apply for redemptions.
Details as on January 31, 2020
This product is suitable for investors who are seeking*
• Income and capital appreciation over medium to long term
• Investments predominantly in AA and below rated corporate debt securities (excluding AA+ rated corporate bonds) of various maturities
• Degree of risk – MODERATE
* Investors should consult their financial advisers if in doubt about whether the product is suitable for them.
Moderate
Moderately
Low
Low
ModeratelyHigh
High
LOW HIGH
Moderate — investors understand that their principal will be at moderate risk.
Asset Allocation (%) Credit Quality Profile (%)
* AA include securities rated as AA and AA-
Regular Plan and Direct Plan are available for subscription as per the below details
Inception Date: Regular Plan: 29/09/2014, Direct Plan: 29/09/2014. Application Amount: ̀ 5000/- and in multiples of ̀ 1/- thereafter. Additional Purchase Amount: Minimum of ̀ 1000/- and in multiples of ̀ 1/- thereafter or 100 units. Repurchase / Redemption Amount: ̀ 100/- and in multiples of ̀ 1/- thereafter or 0.1 units or account balance, whichever is lower. SIP/STP/SWP: Available. Investment Amount for SIP/STP/SWP: SIP/STP: Monthly: 10 installments of ` 500/- each and in multiples of ` 1/- thereafter. Quarterly: 5 installments of ` 1000/- each and in multiples of ` 1/- thereafter. SWP (Monthly/Quarterly): 2 (two) installments of ` 100/-.
Dividend HistoryRegular Plan Direct Plan
Record Date Dividend/unit (`)#
NAV (`) Dividend/unit (`)#
NAV (`)
REGULAR DIVIDEND28-Dec-18 0.1801 12.5515 — —25-Mar-19 0.1801 12.5118 — —28-Jun-19 0.1801 11.8167 — —MONTHLY DIVIDEND25-Oct-19 0.0367 10.1631 0.0434 10.232629-Nov-19 0.0450 10.1586 0.0484 10.260631-Jan-20 0.0450 10.2070 0.0517 10.3638QUARTERLY DIVIDEND28-Jun-19 — — 0.0800 10.280327-Sep-19 0.0600 10.3339 0.0600 10.493926-Dec-19 0.0934 10.4044 0.1001 10.5919ANNUAL DIVIDEND24-Mar-17 0.0602 12.8235 — —23-Mar-18 0.6022 13.6137 0.6692 14.040925-Mar-19 0.6003 13.4182 0.6670 13.9035
# On face value of ̀ 10. Post Dividend per unit NAV will fall to the extent of the payout and applicable tax/surcharges/cess/other statutory levies. Dividend distribution is subject to availability of distributable surplus. Past Performance may or may not be sustained in future.
Performance (CAGR)Fund NIFTY Credit Risk Bond Index^ CRISIL 1 Year T-Bill Index#
Period Returns (%) Value (INR)* Returns (%) Value (INR)* Returns (%) Value (INR)*
Regular Plan - Growth Option
Last 1 Year 3.40 10,340.48 9.40 10,939.59 7.25 10,725.17
Last 3 Years 5.11 11,614.15 7.78 12,519.89 6.70 12,149.25
Last 5 Years 7.05 14,058.58 8.66 15,149.09 7.09 14,085.07
Since Inception 7.59 14,781.10 8.93 15,795.49 7.23 14,518.75
Direct Plan - Growth Option
Last 1 Year 4.43 10,443.33 9.40 10,939.59 7.25 10,725.17
Last 3 Years 6.21 11,980.51 7.78 12,519.89 6.70 12,149.25
Last 5 Years 8.15 14,800.62 8.66 15,149.09 7.09 14,085.07
Since Inception 8.46 15,433.64 8.93 15,795.49 7.23 14,518.75
Date of Inception: Regular Plan: September 29, 2014; Direct Plan: September 29, 2014. CAGR – Compounded Annual Growth Rate
^ Scheme Benchmark. # Standard Benchmark. *Based on standard investment of ` 10,000 made at the beginning of the relevant period. Past performance may or may not be sustained in future and should not be used as a basis for comparison with other investments.
w.e.f. November 01, 2019 benchmark of the scheme has been changed from CRISIL Composite AA Short Term Bond Index to NIFTY Credit Risk Bond Index.
Returns for the benchmark have been calculated using TRI values.
Kumaresh Ramakrishnan is managing this fund since March 2016
For performance of schemes managed by Kumaresh Ramakrishnan refer page no. 11, 14-15, 18-22, 24, 28
Different plans have a different expense structure. For Total Expense Ratio as on January 31, 2020 refer page no. 28
1 Wholly owned by J.K. Lakshmi Cement2 Part of Sembcorp / Temasek Singapore3 Owned by Nirma Group4 Part of Shapoorji Pallonji group5 NHAI annuity road project
Portfolio
Issuer % to Net Assets
Rating
PSU Bonds 31.66
UP Power Corporation Limited 9.89 AA(IND)(SO)
National Bank For Agriculture & Rural Development
4.99 CRISIL AAA
Rural Electrification Corporation Ltd. 2.87 CRISIL AAA
Bharat Petroleum Corporation Ltd. 1.46 CRISIL AAA
SBI Cards And Payment Services 0.71 CRISIL AAA
Power Finance Corporation Ltd. 0.17 CRISIL AAA
Punjab And Sind Bank 10.07 ICRA A+
State Bank Of India 1.44 CRISIL AA+
Syndicate Bank 0.06 CARE A+
Certificate Of Deposit 1.12
ICICI Bank Ltd. 1.12 ICRA A1+
Corporate Debt 62.59
Hansdeep Industries & Trading Company Ltd1
11.35 CARE AA-(SO)
Green Infra Wind Energy Ltd2 11.32 CRISIL AA (CE)
Issuer % to Net Assets
Rating
Nuvuco Vistas Ltd3 8.55 CRISIL AA
Tata Housing Development Company Ltd
7.19 ICRA AA
Yes Bank Ltd. 6.20 ICRA BBB
Nirma Limited 6.94 CRISIL AA-
S.D. Corporation Pvt Ltd. 2.99 CARE A+ (CE)
Housing Development Finance Corporation Ltd.
2.83 CRISIL AAA
Sunny View Estates Private Limited4 2.38 ICRA A (CE)
Reliance Industries Ltd. 1.42 CRISIL AAA
Oriental Nagpur Betul Highway Limited5
1.42 CRISIL AAA (SO)
Cash & Current Assets 4.63
Total 100.00
CREDIT RISK FUNDPGIM INDIA
An open ended debt scheme predominantly investing in AA and below rated corporate bonds (excluding AA+ rated corporate bonds)
1.12
4.63
31.66
62.59
Certificate of Deposit
Cash & Current Assets
PSU Bonds
Corporate Debt
8.58
13.12
55.24
1.44
21.62
OTHERS
A+
AA*
AA+
AAA / A1+

25
Fund Details
Investment Style Box:
Investment Objective: The objective of the Scheme is to seek to generate returns through active management of a portfolio of debt and money market instruments.
Fund Manager: Mr. Puneet Pal (Over 16 years of experience in Debt Market)
Benchmark: CRISIL Composite Bond Fund Index
Option: Dividend (Monthly and Quarterly - Payout/Reinvestment) and Growth.
Quarterly (Oct-Dec 2019) Average AUM (` in Cr): 41.65
Monthly Average AUM (` in Cr): 43.00
AUM as on 31/01/2020 (` in Cr): 43.18
Average Maturity: 6.25 yrs
Modified Duration: 4.50 yrs Portfolio Yield: 6.83%
Fund Manager’s Report: The fund will invest in a mix of G-Sec/AAA Bonds while managing the duration dynamically to generate alpha.
NAV Regular Plan Direct Plan
Growth ` 1928.8198 ` 2053.8798
Monthly Dividend ` 1081.8042 ` 1449.2502
Quarterly Dividend ` 1131.0867 ` 1201.1680
Load Structure$: Entry Load: NA. Exit Load: If the units are redeemed on or before 30 days of allotment – 1%; If the units are redeemed after 30 days – Nil
$No exit load will be charged for switches and STP between Schemes of PGIM India Mutual Fund except from PGIM India Insta Cash Fund.
## For rating methodology refer page no. 28
Details as on January 31, 2020
This product is suitable for investors who are seeking*
• Regular income for short term.
• To generate returns through active management of a portfolio of debt and money market instruments.
• Degree of risk – MODERATE
* Investors should consult their financial advisers if in doubt about whether the product is suitable for them.
Moderate
Moderately
Low
Low
ModeratelyHigh
High
LOW HIGH
Moderate — investors understand that their principal will be at moderate risk.
Asset Allocation (%) Credit Quality Profile (%)
Performance (CAGR)
Fund CRISIL Composite Bond Fund Index^
CRISIL 10 YearGilt Index#
Period Returns (%) Value (INR)* Returns (%) Value (INR)* Returns (%) Value (INR)*
Regular Plan - Growth Option
Last 1 Year 10.91 11,090.88 11.33 11,133.02 10.84 11,084.33
Last 3 Years 7.06 12,271.21 6.92 12,222.53 5.04 11,588.76
Last 5 Years 8.01 14,703.43 8.33 14,922.08 7.34 14,249.60
Since Inception 8.49 19,288.20 8.69 19,569.57 7.39 17,768.19
Direct Plan - Growth Option
Last 1 Year 11.70 11,169.52 11.33 11,133.02 10.84 11,084.33
Last 3 Years 8.08 12,626.31 6.92 12,222.53 5.04 11,588.76
Last 5 Years 9.13 15,482.28 8.33 14,922.08 7.34 14,249.60
Since Inception 9.05 18,478.32 8.62 17,969.76 7.20 16,361.45
Date of Inception: Regular Plan: January 12, 2012; Direct Plan: January 01, 2013. CAGR – Compounded Annual Growth Rate
^ Scheme Benchmark. # Standard Benchmark. *Based on standard investment of ` 10,000 made at the beginning of the relevant period. Past performance may or may not be sustained in future and should not be used as a basis for comparison with other investments.
Returns for the benchmark have been calculated using TRI values.
Puneet Pal is managing this fund since December 2017
For performance of schemes managed by Puneet Pal refer page no. 22-23, 25-27
Different plans have a different expense structure. For Total Expense Ratio as on January 31, 2020 refer page no. 28
Dividend HistoryRegular Plan Direct Plan
Record Date
Dividend/unit (`)#
NAV (`) Dividend/unit (`)#
NAV (`)
MONTHLY DIVIDEND
29-Nov-19 4.1689 1085.1269 — —
27-Dec-19 4.1689 1083.0078 — —
31-Jan-20 3.5019 1081.8042 — —
QUARTERLY DIVIDEND
25-Mar-19 12.0064 1105.0105 13.3404 1166.8635
28-Jun-19 12.0064 1132.5904 13.3404 1197.2471
27-Sep-19 12.0064 1136.1605 12.0064 1200.3473
# On face value of ` 1000. Post Dividend per unit NAV will fall to the extent of the payout and applicable tax/surcharges/cess/other statutory levies. Dividend distribution is subject to availability of distributable surplus. Past Performance may or may not be sustained in future.
Issuer % to Net Assets
Rating
GOI Securities 45.29
7.26% GOI Mat 2029 29.72 SOV
7.32% GOI Mat 2024 7.18 SOV
6.45 GOI Mat 2029 4.58 SOV
6.18 Govt Stock Mat 2024 3.44 SOV
7.17 Govt. Stock 2028 0.37 SOV
PSU Bonds 33.61
Indian Railway Finance Corporation Ltd 9.27 CRISIL AAA
National Highways Authority Of India 9.05 CRISIL AAA
Bharat Petroleum Corporation Ltd. 2.87 CRISIL AAA
Portfolio
Issuer % to Net Assets
Rating
Small Industries Development Bank Of India
1.42 CARE AAA
Rural Electrification Corporation Ltd. 1.17 CRISIL AAA
National Bank For Agriculture & Rural Development
1.17 CRISIL AAA
State Bank Of India 8.66 CRISIL AA+
Corporate Debt 8.28
Axis Bank Ltd. 2.34 CRISIL AA+
Reliance Jio Infocomm Limited 5.94 CRISIL AAA
Cash & Current Assets 12.82
Total 100.00
Regular Plan and Direct Plan are available for subscription as per the below details
Inception Date: Regular Plan: 12/01/2012, Direct Plan: 01/01/2013. Application Amount: ̀ 5000/- and in multiples of ̀ 1/- thereafter. Additional Purchase Amount: Minimum of ̀ 1000/- and in multiples of ̀ 1/- thereafter or 100 units. Repurchase / Redemption Amount: ̀ 100/- and in multiples of ̀ 1/- thereafter or 0.1 units or account balance, whichever is lower. SIP/STP/SWP: Available. Investment Amount for SIP/STP/SWP: SIP/STP: Monthly: 10 installments of ` 500/- each and in multiples of ` 1/- thereafter. Quarterly: 5 installments of ` 1000/- each and in multiples of ` 1/- thereafter. SWP (Monthly/Quarterly): 2 (two) installments of ` 100/-.
DYNAMIC BOND FUNDPGIM INDIA
An open ended dynamic debt scheme investing across durationRated AAAmfs by ICRA##
8.28
12.82
33.61
45.29
Corporate Debt
Cash & Current Assets
PSU Bonds
GOI Securities
45.29
11.00
43.71
SOVEREIGN
AA+
AAA / A1+
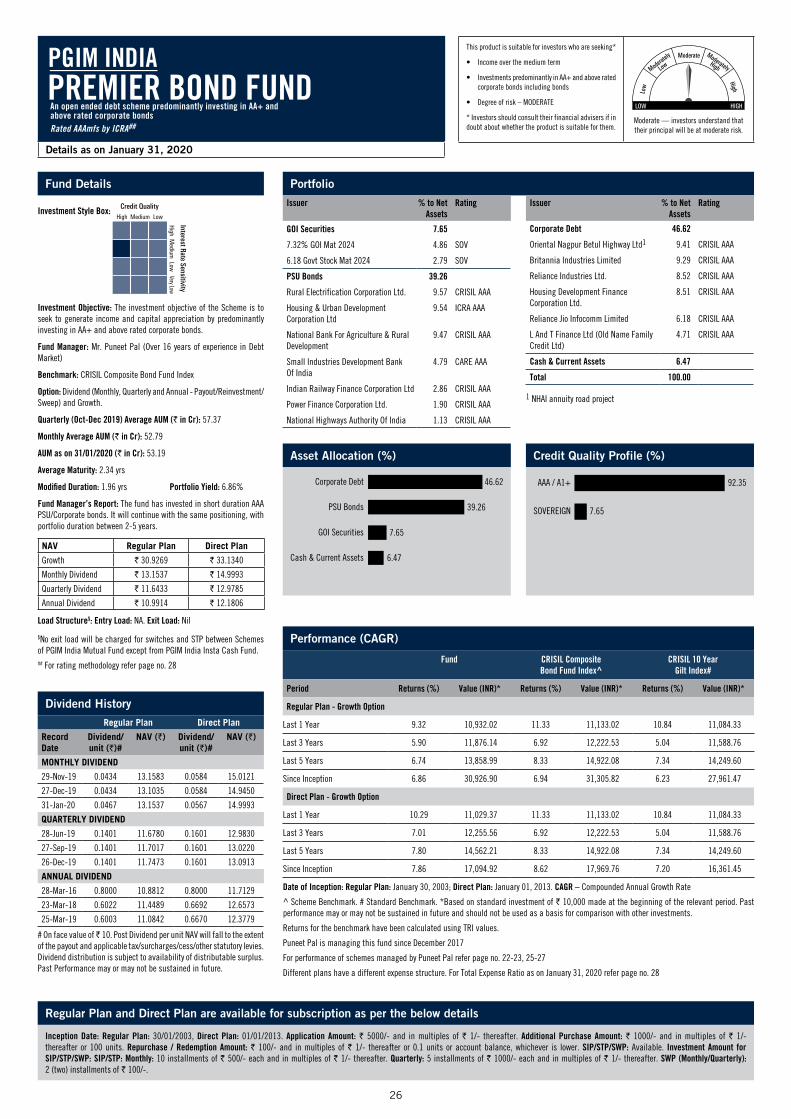
26
Fund Details
Investment Style Box:
Investment Objective: The investment objective of the Scheme is to seek to generate income and capital appreciation by predominantly investing in AA+ and above rated corporate bonds.
Fund Manager: Mr. Puneet Pal (Over 16 years of experience in Debt Market)
Benchmark: CRISIL Composite Bond Fund Index
Option: Dividend (Monthly, Quarterly and Annual - Payout/Reinvestment/Sweep) and Growth.
Quarterly (Oct-Dec 2019) Average AUM (` in Cr): 57.37
Monthly Average AUM (` in Cr): 52.79
AUM as on 31/01/2020 (` in Cr): 53.19
Average Maturity: 2.34 yrs
Modified Duration: 1.96 yrs Portfolio Yield: 6.86%
Fund Manager’s Report: The fund has invested in short duration AAA PSU/Corporate bonds. It will continue with the same positioning, with portfolio duration between 2-5 years.
NAV Regular Plan Direct Plan
Growth ` 30.9269 ` 33.1340
Monthly Dividend ` 13.1537 ` 14.9993
Quarterly Dividend ` 11.6433 ` 12.9785
Annual Dividend ` 10.9914 ` 12.1806
Load Structure$: Entry Load: NA. Exit Load: Nil
$No exit load will be charged for switches and STP between Schemes of PGIM India Mutual Fund except from PGIM India Insta Cash Fund.## For rating methodology refer page no. 28
Regular Plan and Direct Plan are available for subscription as per the below details
Inception Date: Regular Plan: 30/01/2003, Direct Plan: 01/01/2013. Application Amount: ` 5000/- and in multiples of ` 1/- thereafter. Additional Purchase Amount: ` 1000/- and in multiples of ` 1/- thereafter or 100 units. Repurchase / Redemption Amount: ` 100/- and in multiples of ` 1/- thereafter or 0.1 units or account balance, whichever is lower. SIP/STP/SWP: Available. Investment Amount for SIP/STP/SWP: SIP/STP: Monthly: 10 installments of ` 500/- each and in multiples of ` 1/- thereafter. Quarterly: 5 installments of ` 1000/- each and in multiples of ` 1/- thereafter. SWP (Monthly/Quarterly): 2 (two) installments of ` 100/-.
Details as on January 31, 2020
This product is suitable for investors who are seeking*
• Income over the medium term
• Investments predominantly in AA+ and above rated corporate bonds including bonds
• Degree of risk – MODERATE
* Investors should consult their financial advisers if in doubt about whether the product is suitable for them.
Moderate
Moderately
Low
Low
ModeratelyHigh
High
LOW HIGH
Moderate — investors understand that their principal will be at moderate risk.
Asset Allocation (%) Credit Quality Profile (%)
Performance (CAGR)
Fund CRISIL Composite Bond Fund Index^
CRISIL 10 YearGilt Index#
Period Returns (%) Value (INR)* Returns (%) Value (INR)* Returns (%) Value (INR)*
Regular Plan - Growth Option
Last 1 Year 9.32 10,932.02 11.33 11,133.02 10.84 11,084.33
Last 3 Years 5.90 11,876.14 6.92 12,222.53 5.04 11,588.76
Last 5 Years 6.74 13,858.99 8.33 14,922.08 7.34 14,249.60
Since Inception 6.86 30,926.90 6.94 31,305.82 6.23 27,961.47
Direct Plan - Growth Option
Last 1 Year 10.29 11,029.37 11.33 11,133.02 10.84 11,084.33
Last 3 Years 7.01 12,255.56 6.92 12,222.53 5.04 11,588.76
Last 5 Years 7.80 14,562.21 8.33 14,922.08 7.34 14,249.60
Since Inception 7.86 17,094.92 8.62 17,969.76 7.20 16,361.45
Date of Inception: Regular Plan: January 30, 2003; Direct Plan: January 01, 2013. CAGR – Compounded Annual Growth Rate
^ Scheme Benchmark. # Standard Benchmark. *Based on standard investment of ` 10,000 made at the beginning of the relevant period. Past performance may or may not be sustained in future and should not be used as a basis for comparison with other investments.
Returns for the benchmark have been calculated using TRI values.
Puneet Pal is managing this fund since December 2017
For performance of schemes managed by Puneet Pal refer page no. 22-23, 25-27
Different plans have a different expense structure. For Total Expense Ratio as on January 31, 2020 refer page no. 28
Dividend HistoryRegular Plan Direct Plan
Record Date
Dividend/unit (`)#
NAV (`) Dividend/unit (`)#
NAV (`)
MONTHLY DIVIDEND
29-Nov-19 0.0434 13.1583 0.0584 15.0121
27-Dec-19 0.0434 13.1035 0.0584 14.9450
31-Jan-20 0.0467 13.1537 0.0567 14.9993
QUARTERLY DIVIDEND
28-Jun-19 0.1401 11.6780 0.1601 12.9830
27-Sep-19 0.1401 11.7017 0.1601 13.0220
26-Dec-19 0.1401 11.7473 0.1601 13.0913
ANNUAL DIVIDEND
28-Mar-16 0.8000 10.8812 0.8000 11.7129
23-Mar-18 0.6022 11.4489 0.6692 12.6573
25-Mar-19 0.6003 11.0842 0.6670 12.3779
# On face value of ̀ 10. Post Dividend per unit NAV will fall to the extent of the payout and applicable tax/surcharges/cess/other statutory levies. Dividend distribution is subject to availability of distributable surplus. Past Performance may or may not be sustained in future.
Portfolio
Issuer % to Net Assets
Rating
GOI Securities 7.65
7.32% GOI Mat 2024 4.86 SOV
6.18 Govt Stock Mat 2024 2.79 SOV
PSU Bonds 39.26
Rural Electrification Corporation Ltd. 9.57 CRISIL AAA
Housing & Urban Development Corporation Ltd
9.54 ICRA AAA
National Bank For Agriculture & Rural Development
9.47 CRISIL AAA
Small Industries Development Bank Of India
4.79 CARE AAA
Indian Railway Finance Corporation Ltd 2.86 CRISIL AAA
Power Finance Corporation Ltd. 1.90 CRISIL AAA
National Highways Authority Of India 1.13 CRISIL AAA
Issuer % to Net Assets
Rating
Corporate Debt 46.62
Oriental Nagpur Betul Highway Ltd1 9.41 CRISIL AAA
Britannia Industries Limited 9.29 CRISIL AAA
Reliance Industries Ltd. 8.52 CRISIL AAA
Housing Development Finance Corporation Ltd.
8.51 CRISIL AAA
Reliance Jio Infocomm Limited 6.18 CRISIL AAA
L And T Finance Ltd (Old Name Family Credit Ltd)
4.71 CRISIL AAA
Cash & Current Assets 6.47
Total 100.00
1 NHAI annuity road project
PREMIER BOND FUNDPGIM INDIA
An open ended debt scheme predominantly investing in AA+ and above rated corporate bondsRated AAAmfs by ICRA##
6.47
7.65
39.26
46.62
Cash & Current Assets
GOI Securities
PSU Bonds
Corporate Debt
7.65
92.35
SOVEREIGN
AAA / A1+

27
Fund Details
Investment Style Box:
Investment Objective: To seek to generate reasonable returns by investing in Central/State Government securities of various maturities.
Fund Manager: Mr. Puneet Pal (Over 16 years of experience in Debt Market)
Benchmark: I-Sec Mi-Bex
Option: Dividend (Payout & Reinvestment) and Growth.
Quarterly (Oct-Dec 2019) Average AUM (` in Cr): 59.72
Monthly Average AUM (` in Cr): 40.84
AUM as on 31/01/2020 (` in Cr): 33.51
Average Maturity: 7.42 yrs
Modified Duration: 5.25 yrs Portfolio Yield: 6.62%
Fund Manager’s Report: The fund will be investing in Central/State Government securities, actively managing the portfolio to generate alpha over the Benchmark.
NAV Regular Plan Direct Plan
Growth ` 21.9485 ` 22.4753
Dividend ` 14.3656 ` 14.6192
Load Structure$: Entry Load: NA. Exit Load: Nil.
$No exit load will be charged for switches and STP between Schemes of PGIM India Mutual Fund except from PGIM India Insta Cash Fund.
Details as on January 31, 2020
This product is suitable for investors who are seeking*
• Income over the medium term
• Investments only in Central/State securities of various maturities
• Degree of risk – MODERATE
* Investors should consult their financial advisers if in doubt about whether the product is suitable for them.
Moderate
Moderately
Low
Low
ModeratelyHigh
High
LOW HIGH
Moderate — investors understand that their principal will be at moderate risk.
Asset Allocation (%) Credit Quality Profile (%)
Regular Plan and Direct Plan are available for subscription as per the below details
Inception Date: Regular Plan: 27/10/2008, Direct Plan: 01/01/2013. Application Amount: ` 5000/- and in multiples of ` 1/- thereafter. Additional Purchase Amount: ` 1000/- and in multiples of ` 1/- thereafter or 100 units. Repurchase / Redemption Amount: ` 100/- and in multiples of ` 1/- thereafter or 0.1 unit or account balance, whichever is lower. SIP/STP/SWP: Available. Investment Amount for SIP/STP/SWP: SIP/STP: Monthly: 10 installments of ` 500/- each and in multiples of ` 1/- thereafter. Quarterly: 5 installments of ` 1000/- each and in multiples of ` 1/- thereafter. SWP (Monthly/Quarterly): 2 (two) installments of ` 100/-.
Dividend History
Regular Plan Direct Plan
Record Date
Dividend/unit (`)#
NAV (`) Dividend/unit (`)#
NAV (`)
26-Sept-14 0.5971 13.0387 0.5971 13.0491
27-Mar-15 0.5385 13.2882 0.5385 13.3183
28-Mar-16 0.6692 13.3825 0.6692 13.4458
28-Dec-17 0.1472 14.1658 0.1539 14.2942
23-Mar-18 0.1472 14.0648 0.1539 14.1995
28-Jun-18 0.1467 13.8354 0.1534 13.9846
28-Sep-18 0.1467 13.7418 0.1534 13.9057
28-Dec-18 0.1467 14.0894 0.1534 14.2709
25-Mar-19 0.1467 14.1145 0.1534 14.3081
28-Jun-19 0.1467 14.6098 0.1534 14.8243
27-Sep-19 0.1668 14.5706 0.1668 14.7926
26-Dec-19 0.1668 14.5677 0.1668 14.8132
# On face value of ̀ 10. Post Dividend per unit NAV will fall to the extent of the payout and applicable tax/surcharges/cess/other statutory levies. Dividend distribution is subject to availability of distributable surplus. Past Performance may or may not be sustained in future.
Performance (CAGR)
Fund I-Sec Mi-Bex ^ CRISIL 10 Year Gilt Index #
Period Returns (%) Value (INR)* Returns (%) Value (INR)* Returns (%) Value (INR)*
Regular Plan - Growth Option
Last 1 Year 10.14 11,013.79 10.67 11,066.78 10.84 11,084.33
Last 3 Years 6.43 12,054.38 7.57 12,447.31 5.04 11,588.76
Last 5 Years 7.70 14,490.98 8.67 15,156.07 7.34 14,249.60
Since Inception 7.23 21,948.50 8.74 25,712.50 6.63 20,607.57
Direct Plan - Growth Option
Last 1 Year 10.71 11,070.92 10.67 11,066.78 10.84 11,084.33
Last 3 Years 6.93 12,226.20 7.57 12,447.31 5.04 11,588.76
Last 5 Years 8.10 14,764.09 8.67 15,156.07 7.34 14,249.60
Since Inception 8.20 17,474.98 9.07 18,496.21 7.20 16,361.45
Date of Inception: Regular Plan: October 27, 2008; Direct Plan: January 01, 2013. CAGR – Compounded Annual Growth Rate
^ Scheme Benchmark. # Standard Benchmark. *Based on standard investment of ` 10,000 made at the beginning of the relevant period. Past performance may or may not be sustained in future and should not be used as a basis for comparison with other investments.
Returns for the benchmark have been calculated using TRI values.
Puneet Pal is managing this fund since December 2017.
For performance of schemes managed by Puneet Pal refer page no. 22-23, 25-27
Different plans have a different expense structure. For Total Expense Ratio as on January 31, 2020 refer page no. 28
Issuer % to Net Assets
Rating
GOI Securities 87.55
7.27 Govt Stock Mat 2026 30.84 SOV
7.26% GOI Mat 2029 22.98 SOV
7.57 GOI Mat 2033 16.15 SOV
6.45 GOI Mat 2029 8.86 SOV
Portfolio Holdings
Issuer % to Net Assets
Rating
7.32% GOI Mat 2024 6.17 SOV
8.27% Rajasthan SDL Special Mat 2023 2.37 SOV
6.65 GOI Mat 2020 0.18 SOV
Cash & Current Assets 12.45
Total 100.00
GILT FUNDPGIM INDIA
An open ended debt scheme investing ingovernment securities across maturities
12.45
87.55
Cash & Current Assets
GOI Securities
87.55
12.45
SOVEREIGN
AAA / A1+
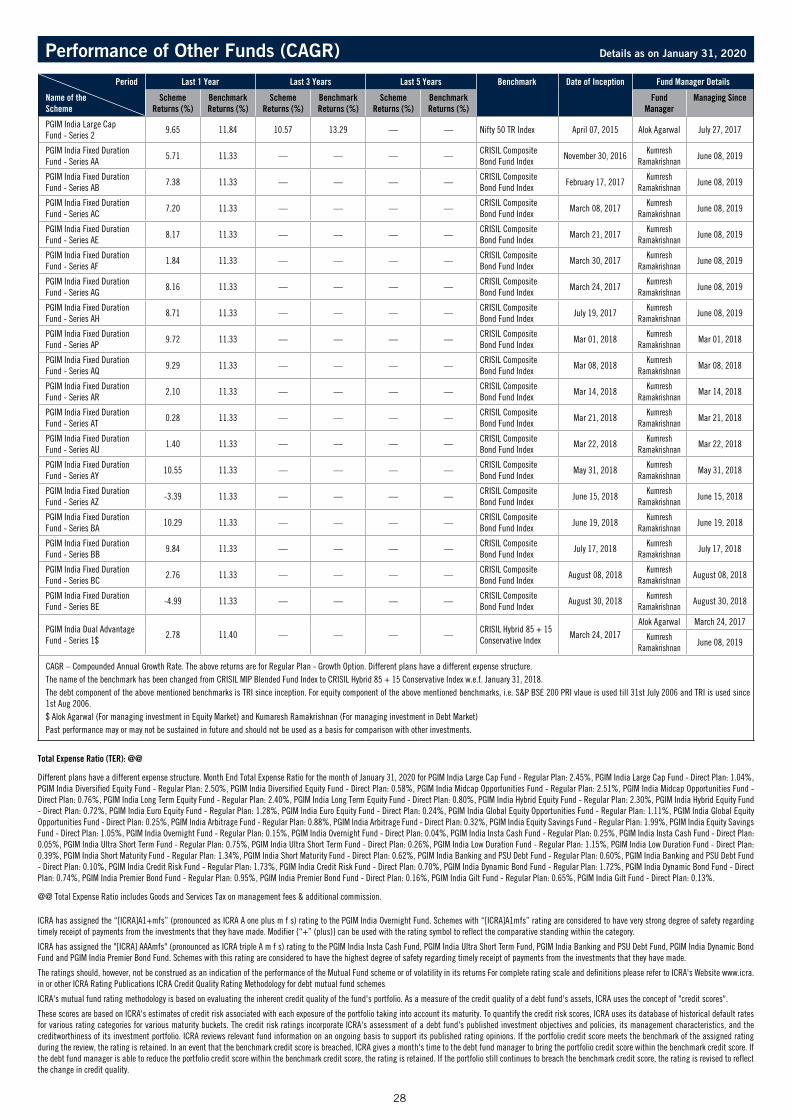
28
Total Expense Ratio (TER): @@
Different plans have a different expense structure. Month End Total Expense Ratio for the month of January 31, 2020 for PGIM India Large Cap Fund - Regular Plan: 2.45%, PGIM India Large Cap Fund - Direct Plan: 1.04%, PGIM India Diversified Equity Fund - Regular Plan: 2.50%, PGIM India Diversified Equity Fund - Direct Plan: 0.58%, PGIM India Midcap Opportunities Fund - Regular Plan: 2.51%, PGIM India Midcap Opportunities Fund - Direct Plan: 0.76%, PGIM India Long Term Equity Fund - Regular Plan: 2.40%, PGIM India Long Term Equity Fund - Direct Plan: 0.80%, PGIM India Hybrid Equity Fund - Regular Plan: 2.30%, PGIM India Hybrid Equity Fund - Direct Plan: 0.72%, PGIM India Euro Equity Fund - Regular Plan: 1.28%, PGIM India Euro Equity Fund - Direct Plan: 0.24%, PGIM India Global Equity Opportunities Fund - Regular Plan: 1.11%, PGIM India Global Equity Opportunities Fund - Direct Plan: 0.25%, PGIM India Arbitrage Fund - Regular Plan: 0.88%, PGIM India Arbitrage Fund - Direct Plan: 0.32%, PGIM India Equity Savings Fund - Regular Plan: 1.99%, PGIM India Equity Savings Fund - Direct Plan: 1.05%, PGIM India Overnight Fund - Regular Plan: 0.15%, PGIM India Overnight Fund - Direct Plan: 0.04%, PGIM India Insta Cash Fund - Regular Plan: 0.25%, PGIM India Insta Cash Fund - Direct Plan: 0.05%, PGIM India Ultra Short Term Fund - Regular Plan: 0.75%, PGIM India Ultra Short Term Fund - Direct Plan: 0.26%, PGIM India Low Duration Fund - Regular Plan: 1.15%, PGIM India Low Duration Fund - Direct Plan: 0.39%, PGIM India Short Maturity Fund - Regular Plan: 1.34%, PGIM India Short Maturity Fund - Direct Plan: 0.62%, PGIM India Banking and PSU Debt Fund - Regular Plan: 0.60%, PGIM India Banking and PSU Debt Fund - Direct Plan: 0.10%, PGIM India Credit Risk Fund - Regular Plan: 1.73%, PGIM India Credit Risk Fund - Direct Plan: 0.70%, PGIM India Dynamic Bond Fund - Regular Plan: 1.72%, PGIM India Dynamic Bond Fund - Direct Plan: 0.74%, PGIM India Premier Bond Fund - Regular Plan: 0.95%, PGIM India Premier Bond Fund - Direct Plan: 0.16%, PGIM India Gilt Fund - Regular Plan: 0.65%, PGIM India Gilt Fund - Direct Plan: 0.13%.
@@ Total Expense Ratio includes Goods and Services Tax on management fees & additional commission.
ICRA has assigned the “[ICRA]A1+mfs” (pronounced as ICRA A one plus m f s) rating to the PGIM India Overnight Fund. Schemes with “[ICRA]A1mfs” rating are considered to have very strong degree of safety regarding timely receipt of payments from the investments that they have made. Modifier {“+” (plus)} can be used with the rating symbol to reflect the comparative standing within the category.
ICRA has assigned the "[ICRA] AAAmfs" (pronounced as ICRA triple A m f s) rating to the PGIM India Insta Cash Fund, PGIM India Ultra Short Term Fund, PGIM India Banking and PSU Debt Fund, PGIM India Dynamic Bond Fund and PGIM India Premier Bond Fund. Schemes with this rating are considered to have the highest degree of safety regarding timely receipt of payments from the investments that they have made.
The ratings should, however, not be construed as an indication of the performance of the Mutual Fund scheme or of volatility in its returns For complete rating scale and definitions please refer to ICRA's Website www.icra.in or other ICRA Rating Publications ICRA Credit Quality Rating Methodology for debt mutual fund schemes
ICRA's mutual fund rating methodology is based on evaluating the inherent credit quality of the fund's portfolio. As a measure of the credit quality of a debt fund's assets, ICRA uses the concept of "credit scores".
These scores are based on ICRA's estimates of credit risk associated with each exposure of the portfolio taking into account its maturity. To quantify the credit risk scores, ICRA uses its database of historical default rates for various rating categories for various maturity buckets. The credit risk ratings incorporate ICRA's assessment of a debt fund's published investment objectives and policies, its management characteristics, and the creditworthiness of its investment portfolio. ICRA reviews relevant fund information on an ongoing basis to support its published rating opinions. If the portfolio credit score meets the benchmark of the assigned rating during the review, the rating is retained. In an event that the benchmark credit score is breached, ICRA gives a month's time to the debt fund manager to bring the portfolio credit score within the benchmark credit score. If the debt fund manager is able to reduce the portfolio credit score within the benchmark credit score, the rating is retained. If the portfolio still continues to breach the benchmark credit score, the rating is revised to reflect the change in credit quality.
Performance of Other Funds (CAGR) Details as on January 31, 2020
Period Last 1 Year Last 3 Years Last 5 Years Benchmark Date of Inception Fund Manager Details
Name of the Scheme
Scheme Returns (%)
Benchmark Returns (%)
Scheme Returns (%)
Benchmark Returns (%)
Scheme Returns (%)
Benchmark Returns (%)
Fund Manager
Managing Since
PGIM India Large Cap Fund - Series 2
9.65 11.84 10.57 13.29 — — Nifty 50 TR Index April 07, 2015 Alok Agarwal July 27, 2017
PGIM India Fixed Duration Fund - Series AA
5.71 11.33 — — — —CRISIL Composite Bond Fund Index
November 30, 2016Kumresh
RamakrishnanJune 08, 2019
PGIM India Fixed Duration Fund - Series AB
7.38 11.33 — — — —CRISIL Composite Bond Fund Index
February 17, 2017Kumresh
RamakrishnanJune 08, 2019
PGIM India Fixed Duration Fund - Series AC
7.20 11.33 — — — —CRISIL Composite Bond Fund Index
March 08, 2017Kumresh
RamakrishnanJune 08, 2019
PGIM India Fixed Duration Fund - Series AE
8.17 11.33 — — — —CRISIL Composite Bond Fund Index
March 21, 2017Kumresh
RamakrishnanJune 08, 2019
PGIM India Fixed Duration Fund - Series AF
1.84 11.33 — — — —CRISIL Composite Bond Fund Index
March 30, 2017Kumresh
RamakrishnanJune 08, 2019
PGIM India Fixed Duration Fund - Series AG
8.16 11.33 — — — —CRISIL Composite Bond Fund Index
March 24, 2017Kumresh
RamakrishnanJune 08, 2019
PGIM India Fixed Duration Fund - Series AH
8.71 11.33 — — — —CRISIL Composite Bond Fund Index
July 19, 2017Kumresh
RamakrishnanJune 08, 2019
PGIM India Fixed Duration Fund - Series AP
9.72 11.33 — — — —CRISIL Composite Bond Fund Index
Mar 01, 2018Kumresh
RamakrishnanMar 01, 2018
PGIM India Fixed Duration Fund - Series AQ
9.29 11.33 — — — —CRISIL Composite Bond Fund Index
Mar 08, 2018Kumresh
RamakrishnanMar 08, 2018
PGIM India Fixed Duration Fund - Series AR
2.10 11.33 — — — —CRISIL Composite Bond Fund Index
Mar 14, 2018Kumresh
RamakrishnanMar 14, 2018
PGIM India Fixed Duration Fund - Series AT
0.28 11.33 — — — —CRISIL Composite Bond Fund Index
Mar 21, 2018Kumresh
RamakrishnanMar 21, 2018
PGIM India Fixed Duration Fund - Series AU
1.40 11.33 — — — —CRISIL Composite Bond Fund Index
Mar 22, 2018Kumresh
RamakrishnanMar 22, 2018
PGIM India Fixed Duration Fund - Series AY
10.55 11.33 — — — —CRISIL Composite Bond Fund Index
May 31, 2018Kumresh
RamakrishnanMay 31, 2018
PGIM India Fixed Duration Fund - Series AZ
-3.39 11.33 — — — —CRISIL Composite Bond Fund Index
June 15, 2018Kumresh
RamakrishnanJune 15, 2018
PGIM India Fixed Duration Fund - Series BA
10.29 11.33 — — — —CRISIL Composite Bond Fund Index
June 19, 2018Kumresh
RamakrishnanJune 19, 2018
PGIM India Fixed Duration Fund - Series BB
9.84 11.33 — — — —CRISIL Composite Bond Fund Index
July 17, 2018Kumresh
RamakrishnanJuly 17, 2018
PGIM India Fixed Duration Fund - Series BC
2.76 11.33 — — — —CRISIL Composite Bond Fund Index
August 08, 2018Kumresh
RamakrishnanAugust 08, 2018
PGIM India Fixed Duration Fund - Series BE
-4.99 11.33 — — — —CRISIL Composite Bond Fund Index
August 30, 2018Kumresh
RamakrishnanAugust 30, 2018
PGIM India Dual Advantage Fund - Series 1$
2.78 11.40 — — — —CRISIL Hybrid 85 + 15 Conservative Index
March 24, 2017Alok Agarwal March 24, 2017
Kumresh Ramakrishnan
June 08, 2019
CAGR – Compounded Annual Growth Rate. The above returns are for Regular Plan - Growth Option. Different plans have a different expense structure.The name of the benchmark has been changed from CRISIL MIP Blended Fund Index to CRISIL Hybrid 85 + 15 Conservative Index w.e.f. January 31, 2018.The debt component of the above mentioned benchmarks is TRI since inception. For equity component of the above mentioned benchmarks, i.e. S&P BSE 200 PRI vlaue is used till 31st July 2006 and TRI is used since 1st Aug 2006.$ Alok Agarwal (For managing investment in Equity Market) and Kumaresh Ramakrishnan (For managing investment in Debt Market)Past performance may or may not be sustained in future and should not be used as a basis for comparison with other investments.

29
SIP Performance (CAGR) Details as on January 31, 2020
PGIM India Large Cap FundPeriod Amount (Rs.) Returns (Annualised) (%)
Investment PGIM India Large Cap Fund PGIM India Large Cap Fund Nifty 50 TR Index^
Last 1 Year 1,20,000 1,26,291.64 9.80 8.32
Last 3 Years 3,60,000 4,00,698.36 7.07 14.30
Last 5 Years 6,00,000 7,37,745.93 8.19 12.13
Since Inception 20,40,000 71,78,489.26 13.40 13.23
Date of Inception: Regular Plan: January 21, 2003. Alok Agarwal managing this fund since July 27, 2017.
The fund offers flexible and convenient Systematic Investment Plan (SIP) facility. To illustrate the advantages of SIP investments, this is how your investments would have grown if you had invested ` 10,000 on the 1st Business day of every month over a period of time
PGIM India Diversified Equity FundPeriod Amount (Rs.) Returns (Annualised) (%)
Investment PGIM India Diversified Equity Fund PGIM India Diversified Equity Fund Nifty 500 TR Index^
Last 1 Year 1,20,000 1,30,260.42 16.12 9.28
Last 3 Years 3,60,000 3,97,602.24 6.55 6.89
Since Inception 5,80,000 7,07,420.23 8.15 9.50
Date of Inception: Regular Plan: March 04, 2015. Anniruddha Naha managing this fund since April 05, 2018. Last 5 years retuns are not provided since scheme has not completed 5 years.
PGIM India Midcap Opportunities FundPeriod Amount (Rs.) Returns (Annualised) (%)
Investment PGIM India Midcap Opportunities Fund PGIM India Midcap Opportunities Fund Nifty Midcap 100 TR Index^
Last 1 Year 1,20,000 1,34,083.07 22.31 12.68
Last 3 Years 3,60,000 4,10,037.96 8.62 10.81
Last 5 Years 6,00,000 6,85,761.83 5.28 6.18
Since Inception 7,40,000 8,59,384.22 4.79 7.32
Date of Inception: Regular Plan: December 02, 2013. Aniruddha Naha managing this fund since April 05, 2018.
^Benchmark.NA - Not Available.The above performance is for Regular Plan - Growth Option. Different plans have a different expense structure. Past performance may or may not be sustained in future and should not be used as a basis for comparison with other investments.
PGIM India Long Term Equity FundPeriod Amount (Rs.) Returns (Annualised) (%)
Investment PGIM India Long Term Equity Fund PGIM India Long Term Equity Fund S&P BSE 200 TR Index^
Last 1 Year 1,20,000 1,24,134.03 6.41 9.28
Last 3 Years 3,60,000 3,87,714.58 4.87 6.89
Since Inception 4,90,000 5,70,637.73 7.40 8.97
Date of Inception: Regular Plan: December 11, 2015. Srinivas Rao Ravuri is managing since September 14, 2019. Last 5 years returns are not provided since the scheme has not completed 5 years.
PGIM India Hybrid Equity FundPeriod Amount (Rs.) Returns (Annualised) (%)
Investment PGIM India Hybrid Equity Fund PGIM India Hybrid Equity Fund CRISIL Hybrid 35+65 - Aggresive Index^
Last 1 Year 1,20,000 1,24,991.80 7.75 9.64
Last 3 Years 3,60,000 3,86,212.13 4.61 8.33
Last 5 Years 6,00,000 6,87,523.91 5.38 9.61
Since Inception 19,10,000 45,92,518.40 10.22 11.17
Date of Inception: Regular Plan: January 29, 2004. The debt component of the benchmark is TRI since inception. For equity component of the benchmark, i.e. S&P BSE 200 PRI vlaue is used till 31st July 2006 and TRI is used since 1st Aug 2006. Alok Agarwal (Equity Portion) is managing this scheme since June 2016 and Kumaresh Ramakrishnan (Debt Portion) is managing this scheme since April 05, 2018.
PGIM India Arbitrage FundPeriod Amount (Rs.) Returns (Annualised) (%)
Investment PGIM India Arbitrage Fund PGIM India Arbitrage Fund Nifty 50 Arbitrage TR Index^
Last 1 Year 1,20,000 1,23,761.69 5.83 6.04
Last 3 Years 3,60,000 3,93,185.71 5.80 5.72
Last 5 Years 6,00,000 6,96,841.74 5.93 5.61
Since Inception 6,50,000 7,65,873.11 5.99 5.66
Date of Inception: Regular Plan: August 27, 2014. Utkarsh Katkoria (Equity Market) is managing this fund since March 2016, Hitash Dang (Equity Market) is managing this fund since May 2017 and Kumaresh Ramakrishnan (Debt Market) managing this fund since August 2014.
PGIM India Equity Savings FundPeriod Amount (Rs.) Returns (Annualised) (%)
Investment PGIM India Equity Savings Fund PGIM India Equity Savings Fund 70% NIFTY 50 Arbitrage TR Index and 30% NIFTY 50 TR Index^
Last 1 Year 1,20,000 1,24,586.16 7.12 6.91
Last 3 Years 3,60,000 3,96,418.00 6.35 6.96
Last 5 Years 6,00,000 7,11,167.49 6.73 7.22
Since Inception 19,10,000 37,60,650.96 7.89 NA
Date of Inception: Regular Plan: January 29, 2004. Alok Agarwal (Equity Portion) is managing this fund since August 2016 and Kumaresh Ramakrishnan (Debt Portion) is managing this fund since April 05, 2018.

30
Fund Manager:An employee of the asset management company such as a mutual fund or life insurer, who manages investments of the scheme. He is usually part of a larger team of fund managers and research analysts.
Application Amount for Fresh Subscription:This is the minimum investment amount for a new investor in a mutual fund scheme.
Minimum Additional Amount:This is the minimum investment amount for an existing investor in a mutual fund scheme.
Yield to Maturity:The Yield to Maturity or the YTM is the rate of return anticipated on a bond if held until maturity. YTM is expressed as an annual rate. The YTM factors in the bond’s current market price, par value, coupon interest rate and time to maturity.
SIP:SIP or systematic investment plan works on the principle of making periodic investment of a fixed sum. It works similar to a recurring bank deposit. For instance, an investor may opt for an SIP that invests Rs. 500 every 15th of the month in an equity fund for a period of three years.
NAV:The NAV or the net asset value is the total asset value per unit of the mutual fund after deducting all related and permissible expenses. The NAV is calculated at the end of every business day. It is the value at which the investor enters or exits the mutual fund.
Benchmark:A group of securities, usually a market index, whose performance is used as a standard or benchmark to measure investment performance of mutual funds, among other investments. Some typical benchmarks include the Nifty, Sensex, BSE200, BSE500, 10- year Gsec.
Entry Load:A mutual fund may have a sales charge or load at the time of entry and/or exit to compensate the distributor/agent.
Entry load is charged at the time an investor purchases the units of a mutual fund. The entry load is added to the prevailing NAV at the time of investment. For instance, if the NAV is Rs. 100 and the entry load is 1%, the investor will enter the fund at Rs. 101.
Note: SEBI, vide circular dated June 30, 2009 has abolished entry load and mandated that the upfront commission to distributors will be paid by the investor directly to the distributor, based on his assessment of various factors including the service rendered by the distributor.
Exit load:Exit load is charged at the time an investor redeems the units of a mutual fund. The exit load is deducted from the prevailing NAV at the time of redemption. For instance, if the NAV is Rs. 100 and the exit load is 1%, the redemption price would be Rs. 99 per unit.
Modified Duration:Modified duration is the price sensitivity and the percentage change in price for a unit change in yield.
Macaulay Duration:The Macaulay duration is the weighted average term to maturity of the cash flows from a bond. The weight of each cash flow is determined by dividing the present value of the cash flow by the price.
Standard Deviation:Standard Deviation is a statistical measure of the range of an investment’s performance. When a mutual fund has a high standard deviation, its means its range of performance is wide, implying greater volatility.
Sharpe Ratio:The Sharpe Ratio, named after its founder, the Nobel Laureate William Sharpe, is a measure of risk-adjusted returns. It is calculated using standard deviation and excess return to determine reward per unit of risk.
Beta:Beta is a measure of an investment’s volatility vis-à-vis the market. Beta of less than 1 means that the security will be less volatile than the market. A beta of greater than 1 implies that the security’s price will be more volatile than the market.
AUM:AUM or assets under management refers to the recent/ updated cumulative market value of investments managed by a mutual fund or any investment firm.
Holdings:The holdings or the portfolio is a mutual fund’s latest or updated reported statement of investments/ securities. These are usually displayed in terms of percentage to net assets or the rupee value or both. The objective is to give investors an idea of where their money is being invested by the fund manager.
Nature of Scheme:The investment objective and underlying investments determine the nature of the mutual fund scheme. For instance, a mutual fund that aims at generating capital appreciation by investing in stock markets is an equity fund or growth fund. Likewise, a mutual fund that aims at capital preservation by investing in debt markets is a debt fund or income fund. Each of these categories may have sub-categories.
Rating Profile:Mutual funds invest in securities after evaluating their creditworthiness as disclosed by the ratings. A depiction of the mutual fund in various investments based on their ratings becomes the rating profile of the fund. Typically, this is a feature of debt funds.
Portfolio Turnover:Portfolio Turnover is a measure of how frequently assets within a fund are bought and sold by the managers.
R-Squared:R-Squared is a statistical measure that represents the percentage of a fund or security’s movements that can be explained by movements in a benchmark index.
Average Maturity:In a mutual fund containing debt securities, Average Maturity is the average amount of time until the debt securities mature.
Portfolio Yield:Portfolio Yield is computed by determining the cash flows for the portfolio and determining the interest rate that will make the present value of the cash flows equal to the market value of the portfolio.
Total Expense Ratio:Weighted Average i.e. Total Expense of the month / average Asset / number of days in month* days in a year.
How to read the Factsheet

Enter Exit+Re-Enter
This information/disclosure is made at the discretion of PGIM India Asset Management Private Limited (‘the AMC’) and is for information purpose only. This information/disclosure does not constitute a distribution, an endorsement, an offer to buy or sell or the solicitation of an offer to buy or sell any securities or any other financial products / investment facility (collectively “Products”) mentioned in this information/disclosure or an attempt to influence the opinion or behavior of the Investors/Recipients. The information incorporated in this disclosure is solely to enhance the transparency of the product/facility offered by the AMC and should not be treated as an endorsement in any manner whatsoever. This disclosure is not meant to serve as a professional advice for the Investors/Recipients and Investors/Recipients are advised to seek independent professional advice and arrive at an informed investment decision before making any investments.
Stop trying to time the market ! Invest in a P/E based strategyIn the equity markets, one should invest when the valuation (P/E) is low, not the index level. Simply put we should invest when market is cheaper and the P/E ratio helps us decide this.
Methodology adopted for P/E based Strategy illustrations:Ÿ Asset allocation is done on the basis of the table shown here;Ÿ The equity market/component is represented by NIFTY 50;Ÿ The balance allocation (i.e. portfolio value minus equity allocation) is considered as debt component;Ÿ Debt component returns is considered at 6% per annum for the calculation purpose;Ÿ Any allocation into or out of equity is carried out on the first working day of the month;Ÿ Variation is defined as the deviation of 20 day Average trailing P/E of NIFTY 50 as at the month-end, compared with its Long-Term Average P/E Ÿ(i.e. from 1st Jan. 1999).
Historic P/E Strategy Returns for Variation Band Between 31% and 40%
Data Source : NIFTY 50, Market Data and Internal Calculations. The above graph and table are intended for illustration purpose only. To help understand the performance of the equity market, represented by the index NIFTY 50, on a monthly rolling for 5 years CAGR basis from January 1999 to January 2020 based on the various bands of P/E variation. P/E variation is defined as the deviation of trailing PE of NIFTY 50 (observed on a 20 days moving average basis) from Long-Term Average PE of NIFTY 50. Past performance may or may not be sustained in the future.
The information contained herein is provided by PGIM India Asset Management Private Limited (the AMC) on the basis of publicly available information, internally developed data and other third party sources believed to be reliable. However, the AMC cannot guarantee the accuracy of such information, assure its completeness, or warrant such information will not be changed. The information contained herein is current as of the date of issuance (or such earlier date as referenced herein) and is subject to change without notice. There can be no assurance that any forecast made herein will be actually realized. These materials do not take into account individual investor’s objectives, needs or circumstances or the suitability of any securities, financial instruments or investment strategies described herein for particular investor. Hence, each investor is advised to consult his or her own professional investment / tax advisor / consultant for advice in this regard. These materials are not intended for distribution to or use by any person in any jurisdiction where such distribution would be contrary to local law or regulation.
Disclaimer for Dynamic Advantage Asset Allocation Facility: Dynamic Advantage Asset Allocation Facility offered by PGIM India Asset Management Private Limited (erstwhile DHFL Pramerica Asset Managers Private Limited) or its affiliates is not sponsored, endorsed, sold or promoted by India Index Services & Products Limited (IISL) and its affiliates. IISL and its affiliates do not make any representation or warranty, express or implied (including warranties of merchantability or fitness for particular purpose or use) to the owners of Dynamic Advantage Asset Allocation Facility or any member of the public regarding the advisability of investing in securities generally or in the Dynamic Advantage Asset Allocation Facility linked to Nifty 50 Index or particularly in the ability of the Nifty 50 Index to track general stock market performance in India. Please read the full Disclaimers in relation to Nifty 50 Index in the Scheme Information Document.”
PGIM India Dynamic Advantage Asset Allocation Facility (Formerly known as DHFL Pramerica Dynamic Advantage Asset Allocation Facility)
Details as on 3rd February 2020Long - term Average P/E of Nifty 50 19.91
Last 20 Days Moving Average of Nifty 50 27.89
Applicable P/E Variation Band Between 31% and 40%
Initial Asset Allocation 0% Allocation to Equity
Re - balancing Allocation 50% from Equity to Debt
Mutual Fund Investments are subject to market risks, read all scheme related documents carefully. © 2019 Prudential Financial, Inc. (PFI) and its related entities. Prudential Financial, Inc. of the United States is not affiliated in any manner with Prudential plc, incorporated in the United Kingdom or with Prudential Assurance Company, a subsidiary of M&G plc, incorporated in the United Kingdom. The PGIM logo and the Rock symbol are service marks of PFI and its related entities, registered in many jurisdictions worldwide.
5 Years
Minimum 10.55% 4.00%
Maximum 13.94% 5.94%
Average 11.98% 5.34%
5 Years
Minimum 10.76% 9.87%
Maximum 21.09% 20.19%
Average 15.14% 14.12%
Variation* from long-termAverage PE
% Equity Allocation
Above 40%
Between 31% to 40%
Between 21% to 30%
Between 11% to 20%
Between 1% to 10%
Between -10% to 0%
Between -20% to -11%
Less than -20%
0%
0%
40%
60%
80%
100%
100%
100%
Variation* from long-termAverage PE
Above 40%
Between 31% to 40%
Between 21% to 30%
Between 11% to 20%
Between 1% to 10%
Between -10% to 0%
Between -20% to -11%
Less than -20%
Asset Allocation - Move fromEquity to Debt
100%
50%
—
—
—
—
—
—
Asset Allocation - Move fromDebt to Equity
—
—
—
—
—
10%
50%
100%
SIP Returns P/E BasedStrategy Nifty
Lumpsum Returns P/E BasedStrategy Nifty

Mutual Fund Investments are subject to market risks, read all scheme related documents carefully. © 2019 Prudential Financial, Inc. (PFI) and its related entities. Prudential Financial, Inc. of the United States is not affiliated in any manner with Prudential plc, incorporated in the United Kingdom or with Prudential Assurance Company, a subsidiary of M&G plc, incorporated in the United Kingdom. The PGIM logo and the Rock symbol are service marks of PFI and its related entities, registered in many jurisdictions worldwide.
C225/19-20
1800 2667 446pgim india mutual fund
Scan to watchhow Raghuis able to followhis heart.
Well-planned Investments Help You Follow Your Heart.GAIN FROM EXPERIENCE.
Experience gives you an edge. Powered by its in-depth learnings, PGIM India Mutual Fund helps you manage money better.
PGIM, built on 140 years of wealth creation.
To know more, contact your financial advisor.
Raghu Bakshi, 28.Engineer by profession.Philanthropist at heart.
Connect with us on: