Embed Size (px)
Citation preview
1
Venezuela: Energy in Figures 2013
Venezuela:
Energy in figures 2013Oil and gas sector

2
Venezuela: Energy in Figures 2013

3
Venezuela: Energy in Figures 2013
Index
Oilsector
Gassector
Oil figures 2013Oil Industry and Local Content Regulations in VenezuelaAverage Oil Prices
Exploration and ProductionReserves 2013Production in 2013 PDVSA Production, consumption and oil reserves in Venezuela, 1980-2013Labor ForceInvestmentProduction by type of schemeProjects with third partiesrefiningSubsidies
Commercialization
Fiscal Policy and the Oil SectorPDVSA’s Investment Plan: Siembra PetroleraOil and gas aspects of Plan de la Patria LawAmounts and investment scheme
569
101011
15161719212931
33
36404142
Gas figures 2013
Exploration and productionReservesPDVSA: Reserves, production and consumptionTransport and distributionDomestic gasInvesmentGas prices
PDVSA’s performancecompared with other Latin-American State controlled companies Production per employeeProfitsLeveragePerformance and autonomy
42
43434547474855
56
56575758
2012 – 2035 PROYECTIONSOil SectorGas Sector
596063
01
02
03

4
Venezuela: Energy in Figures 2013
OIL SECTOR

5
Venezuela: Energy in Figures 2013
Oil Figures 2013
• Conventional oil reserves (light and medium): 40.054 billion barrels.• Heavy and extra-heavy crude reserves: 258.299 billion barrels.• Production: 2.899 million barrels a day on average1.
• Global refining capacity of Petróleos de Venezuela, SA (PDVSA): 2.8 million barrels per day.• Internal consumption: 703 thousand barrels a day (tbd)2.
RESERVES(BILLIONS OF BARRELS)
PRODUCTION(BILLIONS OF BARRELS)
CONSUMPTION(BILLIONS OF BARRELS)
WORLD 1687,9 86,8 91331
NORTH & SOUTH AMERICA 559 24,1 30,066
VENEZUELA
CONVENTIONAL CRUDES
40,054
2,6-2,899 703-777HEAVY & EXTRA-HEAVY WEIGHT
CRUDES 258,299
TOTAL 298,353
AS % OF TOTAL RESERVESAS % OF TOTAL PRODUCTION
AS % OF TOTAL CONSUMPTION
VENEZUELA / NORTH & SOUTH AMERICA 53% 10,8%-12,02% 2,3% - 2,58%
VENEZUELA / WORLD 18% 2,99% - 3,4% 0,77% - 0,85%
AS % OF CONVENTIONAL RESERVES
VENEZUELA / NORTH & SOUTH AMERICA 30%
VENEZUELA / WORLD 3%
OIL OUTLOOK 2013
1 International sources reported a production of 2.6 million barrels per day. 2 According to the International Energy Agency (IEA) domestic consumption now stands at 777 thousand barrels per day.Source: Informe de Gestión Anual de PDVSA (2013), OPEC, BP Statistical Review of World Energy 2013 and own calculations.

6
Venezuela: Energy in Figures 2013
To achieve a transition from a natural resource owner to an actor inside the oil business, Venezuela had to put in place a diversity of poli-cies that promoted national participation in the oil sector without hindering incentives for in-vestments. Throughout its history, Venezuela’s government has implemented key policies with different levels of success; what follows is a small summary of the measures that had more impact.At the beginning of the XX Century, capital, la-bor and oil production technologies belonged to foreign firms that operated in Venezuelan land and the major source of income the State received came from the figure of royalties. The “Reventón” of the Barrozos-2 well that showed the country’s petroleum potential, generated interest to invest from several international oil companies. In order to channel investment efforts, they developed high level technical studies, and production plans. On the other hand, the Venezuelan State moved to acquire more regulation skills and designed mechanisms that took advantage of this external investment potential.
The introduction of the 1943’s Ley de Hidrocar-buros unified the fiscal regime for all the existing and new concessions to foreign oil companies. This regime increased the State’s participation on oil revenues and established new require-ments of oil refined inside the country by the concessioners. These requirements led to the construction of oil refineries that processed over 250 thousand barrels a day (tbd) in 1950.During the 1940’s, particularly during the government of the Revolutionary Jun-ta (1945-1948), the State emphasized on
the necessity to create its own channels of commercialization and to link Venezuelan person-nel with hydrocarbon marketing, with the goal to develop criteria on the price at which oil was sold.At that moment, the idea to create a State-owned oil company was born. That company would take advantage of all the fields with oil potential that had not been granted to foreign firms. That idea fell apart doing the 1950s, when the government granted new concessions.
However, during that decade took place a personnel substitution process where foreign employees gave way to Venezuelans to work in the oil industry. This process was carried out either by foreign corporations’ own initia-tives – as in the case of the Royal Dutch Shell, that faced the cost of moving human capital between its headquarters – as well as by new regulations, such as the Architecture and En-gineering Practice Law. These initiatives re-duced the proportion of foreign personnel in the oil sector from 13.3 % in 1952 to 2.2 % in 1975. When, at the end of the 1950s, the new demo-cratic government took power, interest for the creation of a national petroleum company grew again. In 1960, the Venezuelan Petro-leum Corporation (CVP) was created. It was a vertically integrated company that looked, among its objectives, to strengthen the links between national personnel and the industry. However, the CVP was less profitable than its foreign competition. Some of the possible causes for its low profitability were: low initial capital, difficulties to attract talented employees (with wages 40 % lower than in the foreign compa-nies), the quality of oil fields that were assigned
OIL INDUSTRY AND LOCAL
CONTENT REGULATIONS IN VENEZUELA

7
Venezuela: Energy in Figures 2013
to it, price obstacles set by the International oil companies and the lack of a clear training strategy. Afterwards, those reasons shaped the way the nationalization was planned, in response to critics that were not sure that the CVP would be able to assume all the operations in the oil sector.Looking to maintain stable cash flows and to prevent operation interruptions, the Venezuelan State created Petróleos de Venezuela, Sociedad Anónima (PDVSA) as a holding company for all the enterprises that operated the country’s oil industry, including the CVP and the foreign concessionaries. Therefore, a progressive trans-fer of operations and projects was established, counting with cooperation from the parent com-panies of the concessionaries within a range of as-pects that covered operations, technical services, special projects and human resources and training.At the moment of the nationalization in 1976, a significant technological breach (i.e. 37 % in the refining area) between the foreign and na-tional industries shaped the way the transfer took place: technological links with the foreign companies for at least 70 % of the industry, according to studies by INVEPET (now INTEVEP).This institution also stressed on the need to create a data processing and services center that supported exploration and production activities that would be able to adapt secondary recovery techniques to Venezuelan conditions while also developing technologi-cal advancements for heavy-crude production during the first years of the nationalized industry.In order to achieve those goals, Technical Association Agreements -- Convenios de Aso-ciación Estratégica in Spanish – were estab-lished. They later evolved into the exploration of the Orinoco’s Oil Belt and of offshore reserves, a modification of refining canons and to the in-troduction of better practices for international marketing. These agreements were seen as an
option that eased the pathway for new tech-nologies while keeping traditional markets for Venezuelan products. On the other hand, they were considered as a kind of compensation towards the old concessionaries affected by the nationalization.Additionally, Technological Cooperation Agree-ments were created with the goal of develop-ing joint research, working under collaborative standards and oriented on the study for the enhancement of heavy and extra heavy crude oil, horizontal and deep water perforations, gas and wells engineering among other subjects that were directly linked with PDVSA’s operations.During that period, several regulations were put in place in order to increase the number of Venezuelan professionals hired and to raise the share of nationally-manufactured goods inside the industry. The most important were the N° 1234 decree in 1981 and the “Compra Venezolano” decree. At the same time, the State granted incentives for the development of technologies that produced Venezuelan value and limited thelevel of dependence on foreign products. Additionally, it set evaluation mecha-nisms for national suppliers to the in-dustry, achieving significant progress.With the implementation of the Apertura Pe-trolera during the 1990s, new operative agree-ments were established for the reactivation of several production fields; strategic partner-ships were created to raise production in the complex Orinoco Oil Belt and several contracts for off-shore gas exploitation were signed. Regarding other related areas such as the nationally patented Orimulsion technology, the national petrochemical industry and the services sector the Apertura also managed to bring significant foreign investment and partnerships.The participation of national private equity was expected and promoted in order to accomplish integration gains in the ser-
8
Venezuela: Energy in Figures 2013
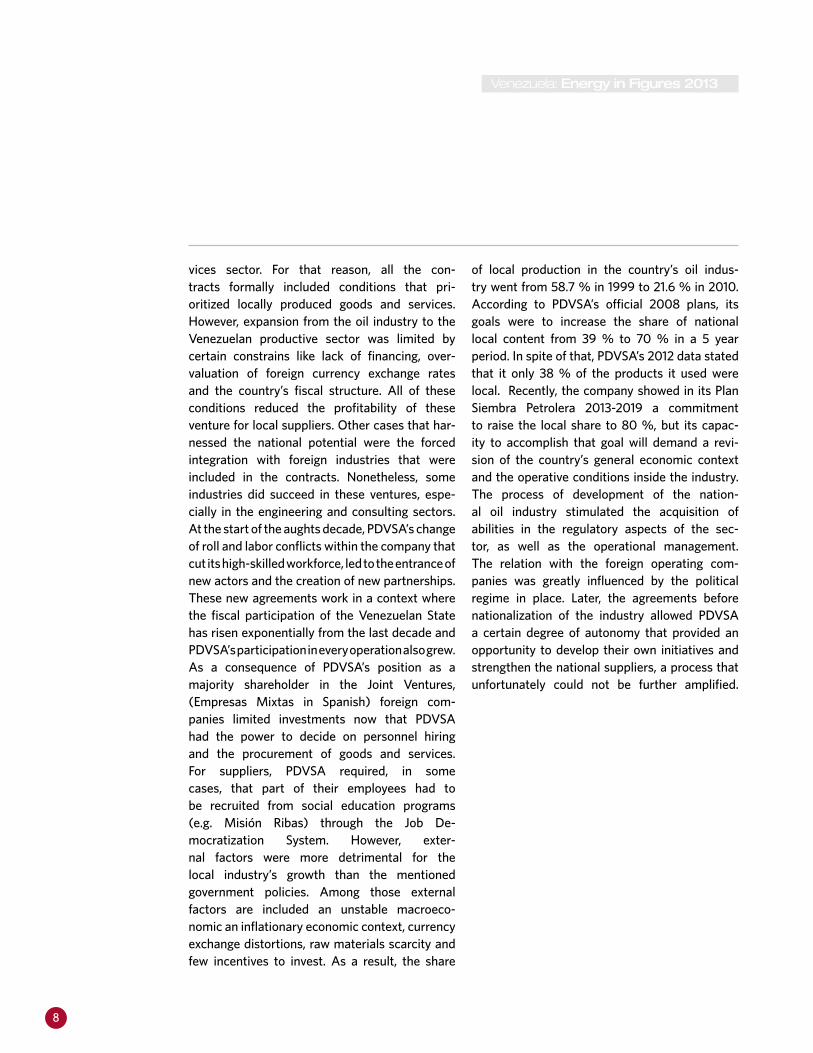
vices sector. For that reason, all the con-tracts formally included conditions that pri-oritized locally produced goods and services.However, expansion from the oil industry to the Venezuelan productive sector was limited by certain constrains like lack of financing, over-valuation of foreign currency exchange rates and the country’s fiscal structure. All of these conditions reduced the profitability of these venture for local suppliers. Other cases that har-nessed the national potential were the forced integration with foreign industries that were included in the contracts. Nonetheless, some industries did succeed in these ventures, espe-cially in the engineering and consulting sectors. At the start of the aughts decade, PDVSA’s change of roll and labor conflicts within the company that cut its high-skilled workforce, led to the entrance of new actors and the creation of new partnerships. These new agreements work in a context where the fiscal participation of the Venezuelan State has risen exponentially from the last decade and PDVSA’s participation in every operation also grew. As a consequence of PDVSA’s position as a majority shareholder in the Joint Ventures, (Empresas Mixtas in Spanish) foreign com-panies limited investments now that PDVSA had the power to decide on personnel hiring and the procurement of goods and services. For suppliers, PDVSA required, in some cases, that part of their employees had to be recruited from social education programs (e.g. Misión Ribas) through the Job De-mocratization System. However, exter-nal factors were more detrimental for the local industry’s growth than the mentioned government policies. Among those external factors are included an unstable macroeco-nomic an inflationary economic context, currency exchange distortions, raw materials scarcity and few incentives to invest. As a result, the share
of local production in the country’s oil indus-try went from 58.7 % in 1999 to 21.6 % in 2010.According to PDVSA’s official 2008 plans, its goals were to increase the share of national local content from 39 % to 70 % in a 5 year period. In spite of that, PDVSA’s 2012 data stated that it only 38 % of the products it used werelocal. Recently, the company showed in its Plan Siembra Petrolera 2013-2019 a commitment to raise the local share to 80 %, but its capac-ity to accomplish that goal will demand a revi-sion of the country’s general economic context and the operative conditions inside the industry. The process of development of the nation-al oil industry stimulated the acquisition of abilities in the regulatory aspects of the sec-tor, as well as the operational management. The relation with the foreign operating com-panies was greatly influenced by the political regime in place. Later, the agreements before nationalization of the industry allowed PDVSA a certain degree of autonomy that provided an opportunity to develop their own initiatives and strengthen the national suppliers, a process that unfortunately could not be further amplified.

9
Venezuela: Energy in Figures 2013
Source: Ministerio del Poder Popular de Petróleo y Minería 2014.
PRECIOS DEL PETRÓLEO
Average Oil Prices 2007-2013 (USD)
Venezuelan Basket Nominal Price 1999-2014
During 2013, the average price of the Venezuelan oil basket was 99.9 United States Dollars (USD). The basket was above 100 USD per barrel during the first and third quarters (102.70 USD and 101.60 USD respectively) and dipped below that threshold in the second and fourth quarters (97.03 USD and 95.71 USD, respectively).
YEAR WTI OPEC BASKET VENEZUELAN BASKET
2007 72,24 69,08 64,74
2008 99,90 94,45 86,49
2009 61,82 61,06 57,08
2010 79,52 77,45 71,97
2011 95,12 107,47 101,06
2012 94,23 109,53 103,42
2013 97,96 105,90 99,9
2014 93,06 96,30 88,42
140
120
100
80
60
40
20
0
JAN
-99
JUL-
99
JAN
-00
JUL-
00
JAN
-01
JUL-
01
JAN
-02
JUL-
02
JAN
-03
JUL-
03
JAN
-04
JUL-
04
JAN
-05
JUL-
05
JAN
-06
JUL-
06
JAN
-07
JUL-
07
JAN
-08
JUL-
08
JAN
-09
JUL-
09
JAN
-10
JUL-
10
JAN
-11
JUL-
11
JAN
-12
JUL-
12
JAN
-13
JUL-
13
JAN
-14
JUL-
14
USD
/Bar
rel
10
Venezuela: Energy in Figures 2013
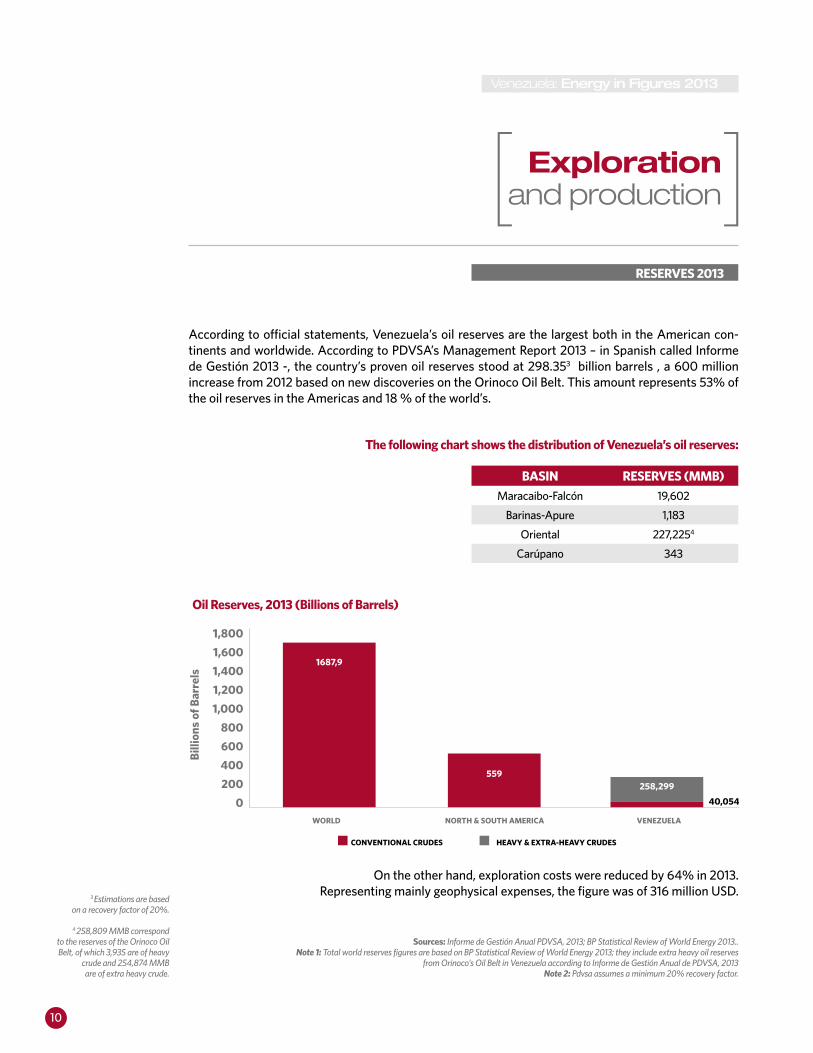
On the other hand, exploration costs were reduced by 64% in 2013. Representing mainly geophysical expenses, the figure was of 316 million USD.
Exploration and production
RESERVES 2013
3 Estimations are based on a recovery factor of 20%.
4 258,809 MMB correspond to the reserves of the Orinoco Oil Belt, of which 3,935 are of heavy
crude and 254,874 MMB are of extra heavy crude.
Sources: Informe de Gestión Anual PDVSA, 2013; BP Statistical Review of World Energy 2013..Note 1: Total world reserves figures are based on BP Statistical Review of World Energy 2013; they include extra heavy oil reserves
from Orinoco’s Oil Belt in Venezuela according to Informe de Gestión Anual de PDVSA, 2013Note 2: Pdvsa assumes a minimum 20% recovery factor.
BASIN RESERVES (MMB)
Maracaibo-Falcón 19,602
Barinas-Apure 1,183
Oriental 227,2254
Carúpano 343
Oil Reserves, 2013 (Billions of Barrels)
1,800
1,600
1,400
1,200
1,000
800
600
400
200
0WORLD NORTH & SOUTH AMERICA VENEZUELA
CONVENTIONAL CRUDES HEAVY & EXTRA-HEAVY CRUDES
Bill
ions
of B
arre
ls
1687,9
559258,299
40,054
According to official statements, Venezuela’s oil reserves are the largest both in the American con-tinents and worldwide. According to PDVSA’s Management Report 2013 – in Spanish called Informe de Gestión 2013 -, the country’s proven oil reserves stood at 298.353 billion barrels , a 600 million increase from 2012 based on new discoveries on the Orinoco Oil Belt. This amount represents 53% of the oil reserves in the Americas and 18 % of the world’s.
The following chart shows the distribution of Venezuela’s oil reserves:

11
Venezuela: Energy in Figures 2013
Source: OPEC Monthly Oil Market Report.
PRODUCTION IN 2013INTERNATIONAL SORCES
Oil production 2001-2014- OPEC
According the Organization of Petroleum Exporting Countries (OPEC)’s July 2014 Monthly Report, Venezuela´s oil production in 2013 was of 2.356 million barrels per day. This level of production, takes into account the production of conventional crude oil and extra-heavy crude from the Orinoco Belt, once upgraded. This figure does not include condensed liquids or natural gas liquids, explaining part of OPEC’s difference with other international sources such as BP, both of which consolidate all production into one figure.
According to BP’s Statistical Yearbook 2014, Venezuela’s oil production was 2.623 million barrrels per day in 2013; including associated liquids besides crude oil and natural gas. That level represents approximately 11 % of the continent’s production and 3 % of the total world’s production.
Relative to the magnitudes reached towards the end of the last decade, there has been a downward trend in the last nine years. Production has fallen by about 16 % from its value in the year 1999 com-pared with 2013.
3,500
3,000
2,500
2,000
1,500
1,000
500
0
JAN
01
JUL
01
JAN
02
JUL
02
JAN
03
JUL
03
JAN
04
JUL
04
JAN
05
JUL
05
JAN
06
JUL0
6
JAN
07
JUL
07
JAN
08
JUL
08
JAN
09
JUL
09
JAN
10
JUL
10
JAN
11
JUL
11
JAN
12
JUL
12
JAN
13
JUL
13
JAN
14
JUL
14
TB
D
OIL PRODUCTION

12
Venezuela: Energy in Figures 2013
160
140
120
100
80
60
1998 1999 2000 2001 2002 2003 2004 2005 2006 2007 2008 2009 2010 2011 2012 2013
TB
D
VENEZUELA SAUDI ARABIA IRAN IRAQ UNITED ARAB EMIRATES KUWAIT
Source: BP Statistical Review of World Energy 2013.
Venezuelan Oil production, Consumption and Reserves 1980-2013
OPEC Countries’ Oil Production(1998=100)
3,500
3,000
2,500
2,000
1,500
1,000
500
0
300
250
200
150
100
50
0
1980
1981
1982
1983
1984
1985
1986
1987
1988
1989
1990
1991
1992
1993
1994
1995
1996
1997
1998
1999
2000
2001
2002
2003
2004
2005
2006
2007
2008
2009
2010
2011
2012
2013
RESERVES BILLIONS OF BARRELS PRODUCTION THOUSANDS BD CONSUMPTION
TB
D

13
Venezuela: Energy in Figures 2013
Venezuela Vs. OPEC
The chart shows the difference between Venezuela’s production and the rest of OPEC in the past 15 years. Iraq’s production break in 2003 was caused by the Second Gulf War.
Comparing the behavior of Venezuela related with other oil producers in the region, there are evident similarities between Venezuela and Mexico, both traditional exporters. Additionally, the effect of the discovery of the oil sands in Canada and Brazil’s large deposits can be observed in the graphic. In the last 5 years there has also been a significant increase in production in the U.S. due to the shale oil revo-lution and in Colombia, following important institutional reforms in its oil sector.
14,000
12,000
10,000
8,000
6,000
4,000
2,000
01998 1999 2000 2001 2002 2003 2004 2005 2006 2007 2008 2009 2010 2011 2012 2013
TB
D
VENEZUELA SAUDI ARABIA IRAN IRAQ UNITED ARAB EMIRATES

14
Venezuela: Energy in Figures 2013
Venezuela Vs. Américas (1998=100)
250
200
150
100
50
1998 1999 2000 2001 2002 2003 2004 2005 2006 2007 2008 2009 2010 2011 2012 2013
VENEZUELA CANADA BRAZIL MEXICO COLOMBIA E.E.U.U.
Venezuela Vs. Américas
12,000
10,000
8,000
6,000
4,000
2,000
0
1998
1999
200
0
200
1
200
2
200
3
200
4
200
5
200
6
200
7
200
8
200
9
2010
2011
2012
2013
VENEZUELA
TB
D
CANADA MEXICO COLOMBIA BRAZIL E.E.U.U.
Source: BP Statistical Review of World Energy 2013
15
Venezuela: Energy in Figures 2013
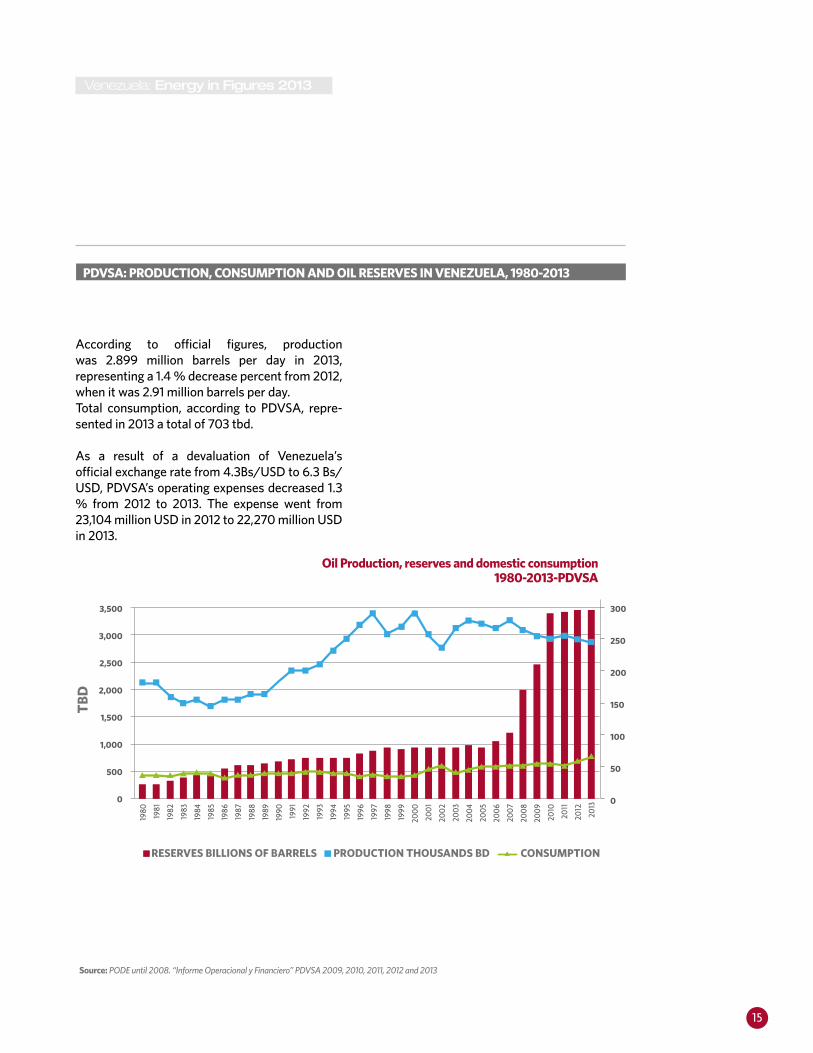
PDVSA: PRODUCTION, CONSUMPTION AND OIL RESERVES IN VENEZUELA, 1980-2013
Source: PODE until 2008. “Informe Operacional y Financiero” PDVSA 2009, 2010, 2011, 2012 and 2013
According to official figures, productionwas 2.899 million barrels per day in 2013, representing a 1.4 % decrease percent from 2012, when it was 2.91 million barrels per day. Total consumption, according to PDVSA, repre-sented in 2013 a total of 703 tbd.
As a result of a devaluation of Venezuela’s official exchange rate from 4.3Bs/USD to 6.3 Bs/USD, PDVSA’s operating expenses decreased 1.3 % from 2012 to 2013. The expense went from 23,104 million USD in 2012 to 22,270 million USD in 2013.
3,500
3,000
2,500
2,000
1,500
1,000
500
0
300
250
200
150
100
50
0
1980
1981
1982
1983
1984
1985
1986
1987
1988
1989
1990
1991
1992
1993
1994
1995
1996
1997
1998
1999
2000
2001
2002
2003
2004
2005
2006
2007
2008
2009
2010
2011
2012
2013
RESERVES BILLIONS OF BARRELS PRODUCTION THOUSANDS BD CONSUMPTION
TB
D
Oil Production, reserves and domestic consumption1980-2013-PDVSA

16
Venezuela: Energy in Figures 2013
Source: PODE e Informe de Gestión de PDVSA 2011, 2012 y 2013.
Workers on Payroll and production per worker
PDVSA’s Production per employee indicator has had two stages of growth. The first stage was between 1954 and 1973 as a result of significant staff reduction; the second stage began in 1990 as a result of the apertura petrolera6 and accelerated in the start of the 2000’s in the Orinoco’s Belt projects.
Since 2004, production has shown a declining trend while the number of workers has escalated. By the year 2013, PDVSA had on payroll a total of 140,626 workers.
LABOR FORCE
120,000
100,000
80,000
60,000
40,000
20,000
0
NUMBER OF EMPLOYEES PRODUCTION PER EMPLOYEE
180
160
140
120
100
80
60
40
20
0
1936
1938
194
0
194
2
194
4
194
6
194
8
1950
1952
1954
1956
1958
1960
1962
196
4
1966
1968
1970
1972
1974
1976
1978
198
0
198
2
198
4
198
6
198
8
1990
1992
1994
1996
1998
200
0
200
4
200
6
200
8
2010
2012
Tho
usan
ds o
f wor
kers
Prod
ucti
on/w
orke
rs
6 An official company policy designed to attract foreign
investment by developing strategic partnerships with international firms selected by public biding
processes in order to exploit Venezuela’s oil potential
by increasing production.

17
Venezuela: Energy in Figures 2013
INVESTMENT
Source: Informe de Gestión Anual PDVSA 2013
Investments in the country’s Oil industry in 2013 were of 23,530 million USD, a 4 % reduction from 2012.
The largest share of the investment funds focused on Exploration and Production, approximately 12,750 million USD. The “Others” category had a 55% increase from 2010, growing from 2,943 million USD to 6,613 million USD.
Investments by sector 2013
21%12
%
13%
54%EXPLORACIÓN Y PRODUCCIÓN
REFINNING, COMMERCIALIZING AND SUPLY
GAS
FOOD AND MASSIVE CONSUMPTION PRODUCTS/ AFFILIATES UNRELATED TO OIL
OTHERS

18
Venezuela: Energy in Figures 2013
Source: Baker Hughes International Rig Count.
Source: OPEC Monthly Oil Market Report and Baker Hughes International Rig Count
Operative Rigs, January 1995-July 2013
Operative Rigs and Oil production 2001-2014
An indicator that illustrates the approximate size of the investment in exploration and production of hydrocarbons is the number of active rigs. The number of rigs and the amount of production generally move in the same direction: when the number increases or decreases, production tends to increase or decrease accordingly, albeit more slowly.
Between 2005 and 2008, activation and removal of this equipment was relatively volatile: the num-ber of rigs in operation ranged from 63 to 84. By December 2009 that number was reduced to 49. However, in the course of 2010, drilling ac-tivity recovered, closing in December 2010 with 83 active rigs, to decrease again during the last quarter of 2011 with 69 operating in December. Between January 2013 and July 2014, the total number of operative rigs ranged from 62 to 81.
JAN
-01
JUL-
01
JAN
-02
JUL-
02
JAN
-03
JUL-
03
JAN
-04
JUL-
04
JAN
-05
JUL-
05
JAN
-06
JUL-
06
JAN
-07
JUL-
07
JAN
-08
JUL-
08
JAN
-09
JUL-
09
JUL-
10
JUL-
10
JAN
-11
JUL-
11
JAN
-12
JUL-
12
JAN
-13
JUL-
13
JAN
-14
JUL-
14
3,500
3,000
2,500
2,000
1,500
1,000
500
0
1009080706050403020100
TB
D
UN
ITS
OIL PRODUCTION OPERATIVE OIL RIGS
140
120
100
80
60
40
20
0
JAN
-95
JUL-
95JA
N-9
6JU
L-96
JAN
-97
JUL-
97JA
N-9
8JU
L-98
JAN
-99
JUL-
99JA
N-0
0JU
L-0
0JA
N-0
1JU
L-0
1JA
N-0
2JU
L-0
2JA
N-0
3JU
L-0
3JA
N-0
4JU
L-0
4JA
N-0
5JU
L-0
5JA
N-0
6JU
L-0
6JA
N-0
7JU
L-0
7JA
N-0
8JU
L-0
8JA
N-0
9JU
L-0
9JA
N-1
0JU
L-10
JAN
-11
JUL-
11JA
N-1
2JU
L-12
JAN
-13
JUL-
13JA
N-1
4JU
L-14
GAS
OIL
TOTAL
UN
ITS

19
Venezuela: Energy in Figures 2013
PRODUCTION BY TYPE OF SCHEME
Source: Ministerio de Energía y Petróleo (PODE 2007-2008); Informe de la Gestión y resultados de Pdvsa, 2009, 2010, 2011 & 2013.Note 1: Since 2006 the conventional crude operative agreements transformed into Joint VenturesNote 2: Since 2007, the heavy oil strategic agreements transformed into Joint Ventures.Note 3: Production data does not include Natural Gas Liquids.
According to PDVSA’s Informe de Gestión 2013, the total audited production of crude oil in Venezuela was 2.899 million barrels per day.Venezuela’s daily production, including 124 tbd of natural gas, was of 3.015 million barrels a day. PDVSA’s own effort summed 1.775 million bpd oil in the following areas of the country: • East: 881 tbd • West: 485 tbd • Belt: 495 tbd • PDVSA Gas: 24 tbd
The remaining production came from projects in which PDVSA participates jointly with third parties (Empresas Mixtas): • Joint ventures of conventional oil: 459 tbd • Joint ventures of extra heavy oil: 665 tbd
Oil production classified by contract conditions, Venezuela 1990-2013
According to official figures, production of wells solely operated by PDVSA reached a record high in 1997 at 2.92 million barrels per day. However, from 1992 to 2005 sole production by PDVSA as a percentage of total production tended to de-crease while there were progressive gains on wells operated by private enterprises in the former operating agreements and strategic partnerships.
This trend reversed after 2006 due to contrac-tual changes giving PDVSA greater participa-tion in all projects. However, as of 2008, a de-crease can be observed again in PDVSA’s own efforts as a percentage of total production.
3,5
3
2,5
2
1,5
1
0,5
0
HEAVY-WEIGHT CRUDES, JOINT VENTURES (FORMERS STRATEGIC AGREEMENTS)
CONVENTIONAL CRUDES, JOINT VENTURES(FORMER OPERATIVE AGREEMENTS)
PDVSA DIRECT MANAGEMENT
TB
D
1990
1991
1992
1993
1994
1995
1996
1997
1998
1999
200
0
200
1
200
2
200
3
200
4
200
5
200
6
200
7
200
8
200
9*
2010
*
2011
*
2012
*
2013
*

20
Venezuela: Energy in Figures 2013
Source: Informe de Gestión Anual de PDVSA de 2013
Source: Ministerio de Energía y Petróleo (PODE 2007-2008); Informe de la Gestión y resultados de Pdvsa, 2009, 2010, 2011, 2012 and 2013Note 1: Since 2006 the conventional crude operative agreements transformed into Joint Ventures
Note 2: Since 2007 the heavy crude strategic agreements transformed into Joint VenturesNote 3: Production data doesn´t include Natural Gas Liquids
Oil production by contract conditions, 2013
PDVSA direct managment and joint ventures production 1990-2013
16%
23%
61%PDVSA DIRECT MANAGEMENT
CONVENTIONAL CRUDES, JOINT VENTURES(FORMER OPERATIVE AGREEMENTS)
HEAVY-WEIGHT CRUDES, JOINT VENTURES(FORMER STRATEGIC AGREEMENTS)
100%
90%
80%
70%
60%
50%
40%
30%
20%
10%
0%
199
0
199
1
1992
1993
1994
1995
199
6
1997
199
8
199
9
200
0
200
1
200
2
200
3
200
4
200
5
200
6
200
7
200
8
200
9
2010
2011
2012
2013
PDVSA DIRECT MANAGEMENT
% o
f tot
al p
rodu
ctio
n
JOINT VENTURES

21
Venezuela: Energy in Figures 2013
PROJECTS WITH THIRD PARTIES
Exploration projects and conventional and extra heavy oil production in Venezuela are developed under two schemes: A) PDVSA’s own effort B) Joint ventures between PDVSA and third parties
1. Conventional oil projectsSince 2006, projects in conventional oil fields have been developed by 21 joint ventures which were previously linked to the figure of the operating agreements. These operations are aimed primarily at maintaining production levels because they operate in mature fields with a natural tendency of decline in production.Joint ventures are formed between the Venezue-lan Petroleum Corporation (CVP), a subsidiary of PDVSA, with a minimum stake of 60 %, and private companies (mostly foreign), with a maxi-mum of 40 %.
2. Heavy crude projects Orinoco Belt -- in Spanish Faja Petrolífera del Orinoco (FPO): • Location: south of the states Guárico, Anzoátegui and Monagas. • Geographical Area: approximately 55 thousand square kilometers. • Area exploitation: about 12 thousand square kilometers. • Petroleum in site7 : approximately between 914 billion and 1.36 trillion barrels, besides the 37 billion barrels made official in 2005.
• Reserves 2013: 259,460 million barrels8 . -Petroleum heavy: 3,795 million barrels. -Petroleum extra-heavy: 255,664 million barrels. • Average API: 8.6 degrees API.
PDVSA and BP, Chevron, ConocoPhillips, ExxonMobil, Statoil and Total, started in the late nineties, the exploitation of extra-heavy crude with the establishment of strategic partnerships. These agreements represent an investment of about 17 billion dollars, making possible to reach an average produc-tion in 2006 of 560 thousand barrels per day. Strategic partnerships were developed with the aim of vertically integrating the business of heavy oil from the Orinoco Belt including, beyond mining activities, upgrading plants to produce synthetic crude with higher API grav-ity, better traded in international markets. According to this scheme, the participa-tion of PDVSA averaged forty percent and a majority stake was in the hands of private partners.Since 2007, these strategic partnerships migra-ted to a mixed enterprise scheme, which con-sisted of increasing PDVSA’s share to at least 60 percent as well as the demarcation of areas for operation. The size of exploration areas was re-duced to stimulate recovery factor of at least 20%.
3. Exploration projectsSince 2007, the exploration activities projects, for-mer exploration, risk and profit sharing agreements are operating under the new contractual scheme of joint ventures (empresas mixtas in Spanish).
7 The Orinoco Belt also has a large volume of original gas in place, which is a potential source of sup-ply for future development projects that will eventually need large amounts of gas.
8According to the United States Geological Survey Service (USGS) Orinoco Belt’s reserves could be estimated at 380 – 650 billion barrels based on recovery factor of 45 percent (this rate takes into account technological advances that have not been made yet).

22
Venezuela: Energy in Figures 2013
Reserves certification projects
Orinoco Magna Reserve Project (In Spanish Proyecto Orinoco Magna Reserva) is part of the Plan Siem-bra Petrolera 2005-2030 and is intended to quantify and certify the hydrocarbon reserves in the Ori-noco Oil Belt. • The FPO has been divided into 30 blocks, nested according to their technical and strategic conditions in four areas: -Boyacá, Junín, Ayacucho and Carabobo (excludes firms assigned area Petrocedeño, SA, Petromonagas, SA, Petrozuata, CA and Oil Sinovensa, SA).
From these blocks: • 22 will be quantified in a joint effort between the CVP and 28 foreign companies, mainly National Oil Companies. • The rest of the blocks will be quantified with PDVSA’s own effort.
Source: Informe de Gestión Anual de PDVSA de 2013.

23
Venezuela: Energy in Figures 2013
Comprehensive Exploration Project
This project aims at the discovery and incorpora-tion of hydrocarbon reserves up to 8,045 MMB and 40,001 million cubic feet of gas.
The project comprehends the following subprojects:
PROJECT
ESTIMATED OIL
RESERVES (MBD)
ESTIMATED GAS
RESERVES (MMMPC)
EXPECTED OIL WELLS
ESTIMATED INVESTMENT
(MMUSD)
PROJECT COMPLETION (%)
PERIOD
PIEX Fachada-Caribe
1,798 15,349 49 1,343 4,40 2008-2021
PIEX Golfo de Venezuela Falcón
1,813 11,187 18 541 26,12 2010-2021
PIEX Anzoátegui Monagas Central
Pantano1,136 3,379 22 611 4,40 2007-2021
PIEX Norte Monagas Serranía
1,242 4,938 20 558 24,57 2007-2021
PIEX Trend Anaco Guárico
195 1,286 7 349 2,05 2009-2019
PIEX Zulia Oriental Falcón
1,075 1,380 20 653 25,2 2007-2021
PIEX Centro Sur 376 347 12 264 26,6 2007-2020
PIEX Centro Sur Norte
410 2,135 25 478 18,4 2007-2018
TOTAL 8,045 40,001 173 4,797
Source: Informe de Gestión Anual de PDVSA de 2013.

24
Venezuela: Energy in Figures 2013
Joint Ventures 2013
EAST JOINT VENTURE DATE (%) PDVSA´S SHARE
(%) ASSOCIATED FIRM SHARE
MINORITY SHAREHOLDER FORMERLY
KNOWN AS
Furial division
PetroquiriquireAugust 21,
200660 40 Repsol
Operating agreement Quiriquire
BoquerónOctober 11,
200660
26,67BoquerónHoldings
Operating agreementBoquerón13,33 Pei
Costa Afueradivision
PetrowaraoAugust 9,
200660 40 Perenco
Operating agreement Pedernales
PetrosucreDecember 19,
200774 26 ENI
Agreementoperating
shared risk and profits Golfo
de Paria Oeste (CoroCoro)
Petrolera PariaDecember 19,
200760
32
SINOPEC
Agreementoperating
shared risk and profits Golfo
de Paria Este (Posa) 8
Petrolera Güiria
January 10, 2008
64,25
19,5 ENI Agreementoperating
shared risk and profits Golfo
de Paria Central16,25
INE Oil & Gas Inc.

25
Venezuela: Energy in Figures 2013
WEST JOINT VENTURE DATE (%) PDVSA´S SHARE
(%) ASSOCIATED FIRM SHARE
MINORITY SHAREHOLDER
FORMERLY KNOWN AS
Lago division
Petroregional del Lago
August 11, 2006
60 40 Shell Operating agreement Urdaneta
Petroindependiente
August 11, 2006
74,8 25,2 Chevron Operating agreement LL-652
LagopetrolDecember 5,
200769
26,35 HocolOperating agreement
B2X.70/803,1 Ehcopek
CIP1,55
PetrowaraoAugust 9,
200660 40 Perenco Operating agreement
Ambrosio
Petrolera Sino
Venezolana
November 28, 2006
75 25 CNPC Operating agreement Intercampo Norte
Petrolera Bielove-nezolana
December 14, 2007
60 40
Unión de Empresas Productoras Belorusneft
Operating agreement Bloque X
Costa Occidental del Lago
division
PetroboscánAugust 11,
200660
39,2 Chevron Operating agreement Boscán0,8 INEMAKA
BaripetrolAugust 9,
200660
17,5 Suizum
Operating agreement Colón
17,5 PERENCO
5 PFC
PetroperijáSeptember
21, 200660 40 DZO Operating agreement
DZO
PetrowayuSeptember 4,
200660
36 PETROBRAS
Operating agreement La Concepción
4Williams
International Oil & Gas
Petrourdaneta**
April 3, 2012 60 40Odebrecht
E & P
Costa Oriental del Lago
division
PetrocabimasOctober 2,
200660 40 SEPCA Operating agreement
Cabimas
Petrocu-marebo
October 24, 2006
60 40 PFCOperating agreement
Falcón Este y Falcón Oeste
Petrozamora** May 4, 2012 60 40Gazprom-
ban
Sur del Lagodivision
PetroquiriquireAugust 21,
200660 40 REPSOL Operating agreement
Mene Grande

26
Venezuela: Energy in Figures 2013
BELT JOINT VENTURE DATE (%) PDVSA´S SHARE
(%) ASSOCIATED FIRM SHARE
MINORITY SHAREHOLDER
FORMERLY KNOWN AS
Juníndivision
Petrolera Indo-venezolana
April 8, 2008 60 40 ONGC Operating agreement San Cristóbal
PetrocedeñoDecember 11,
200760
30,32 Total Partnershipstrategic Sincor9,677 StatoilHydro
Petroanzo-átegui
February 21, 2008
100
Petromiranda*April 20,
201060 40
Consorcio Nacional Petrolero
Petromacareo*September 17,
201060 40
Petro-vietnam
Petrourica*December 14,
201060 40 CNPC
Petrojunín*December 14,
201060 40 ENI
Carabobodivision
PetrodeltaOctober 3,
200760 40 HRN Operating agreement
Monagas Sur
Petrolera Sinovensa
February 1, 2008
64,25 35,75 CNPC
PetromonagasFebruary 21,
200883,33 16,67 BP
Partnershipstrategic
Cerro Negro
Petrocarabobo*
June 25, 2010 60
11 REPSOL
11 PC Venezuela
11Petro
carabobo Ganga
7Indoil
Netherlands B. V.
Petroinde-pendencia*
June 25, 2010 60
34 Chevron
Japan CaraboboUk5
Suelopetrol1
27
Venezuela: Energy in Figures 2013
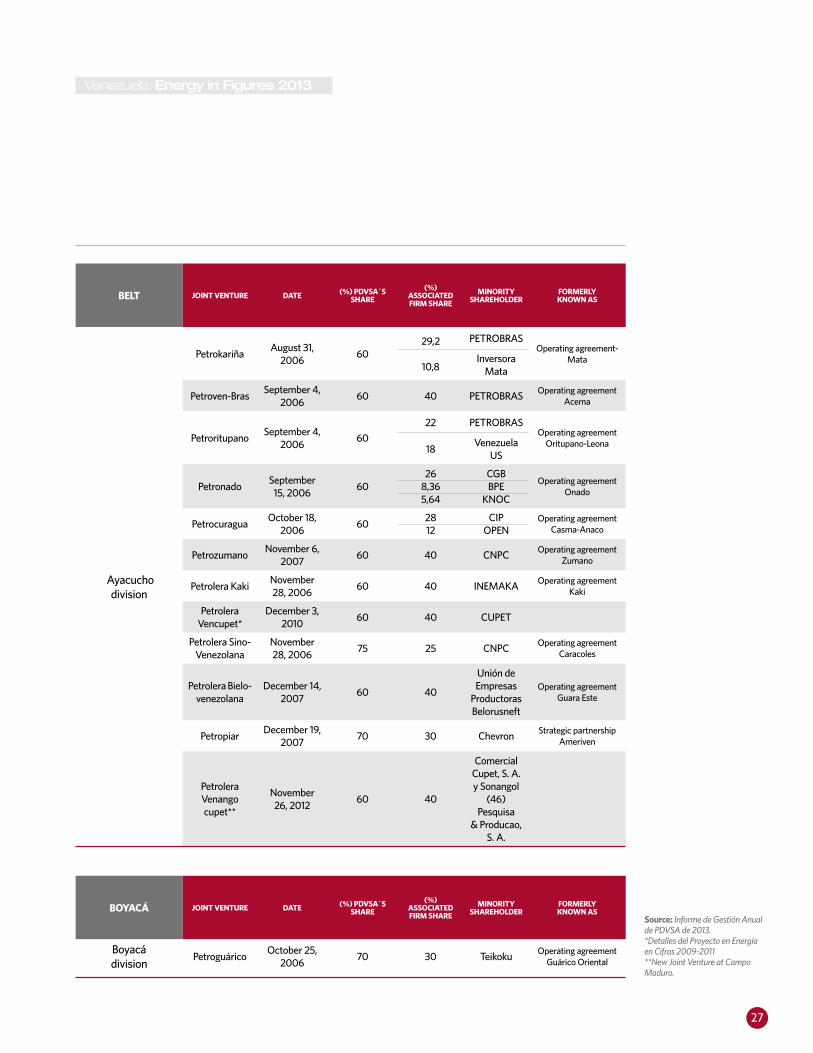
BELT JOINT VENTURE DATE (%) PDVSA´S SHARE
(%) ASSOCIATED FIRM SHARE
MINORITY SHAREHOLDER
FORMERLY KNOWN AS
Ayacuchodivision
PetrokariñaAugust 31,
200660
29,2
10,8
PETROBRASOperating agreement-
MataInversora Mata
Petroven-BrasSeptember 4,
200660 40 PETROBRAS Operating agreement
Acema
PetroritupanoSeptember 4,
200660
22 PETROBRASOperating agreement
Oritupano-Leona18Venezuela
US
PetronadoSeptember
15, 200660
268,365,64
CGBBPE
KNOC
Operating agreement Onado
PetrocuraguaOctober 18,
200660
2812
CIPOPEN
Operating agreement Casma-Anaco
PetrozumanoNovember 6,
200760 40 CNPC Operating agreement
Zumano
Petrolera KakiNovember 28, 2006
60 40 INEMAKA Operating agreement Kaki
Petrolera Vencupet*
December 3, 2010
60 40 CUPET
Petrolera Sino-Venezolana
November 28, 2006
75 25 CNPC Operating agreement Caracoles
Petrolera Bielo-venezolana
December 14, 2007
60 40
Unión de Empresas
Productoras Belorusneft
Operating agreement Guara Este
PetropiarDecember 19,
200770 30 Chevron Strategic partnership
Ameriven
Petrolera Venangocupet**
November 26, 2012
60 40
Comercial Cupet, S. A. y Sonangol
(46) Pesquisa
& Producao, S. A.
BOYACÁ JOINT VENTURE DATE (%) PDVSA´S SHARE
(%) ASSOCIATED FIRM SHARE
MINORITY SHAREHOLDER
FORMERLY KNOWN AS
Boyacádivision
PetroguáricoOctober 25,
200670 30 Teikoku Operating agreement
Guárico Oriental
Source: Informe de Gestión Anual de PDVSA de 2013.*Detalles del Proyecto en Energía en Cifras 2009-2011**New Joint Venture at Campo Maduro.
28
Venezuela: Energy in Figures 2013
REFINERY CAPACITY (TBD) LOCATION
National
Paraguaná CRP Refining Center (Amuay & Cardón Refineries)
955 Falcón
Puerto La Cruz 187 Anzoátegui
El Palito 140 Carabobo
Bajo Grande 16 Zulia
San Roque 5 Anzoátegui
Total national 1,303
REFINERY CAPACITY (TBD) LOCATION
International
Isla 335 Curazao
Camilo Cienfuegos 32 Cuba
Jamaica 17 Jamaica
Haina 17 República Dominicana
Lake Charles 425 Estados Unidos
Corpus Christi 157 Estados Unidos
Lemont 167 Estados Unidos
Chalmette 92 Estados Unidos
Saint Croix 248 Estados Unidos
Nynashamn 15 Suecia
Gothenburg 5 Suecia
Dundee 4 Escocia
Eastham 5 Inglaterra
Total International 1,519
Total PDVSA Refining Capacity 2,822
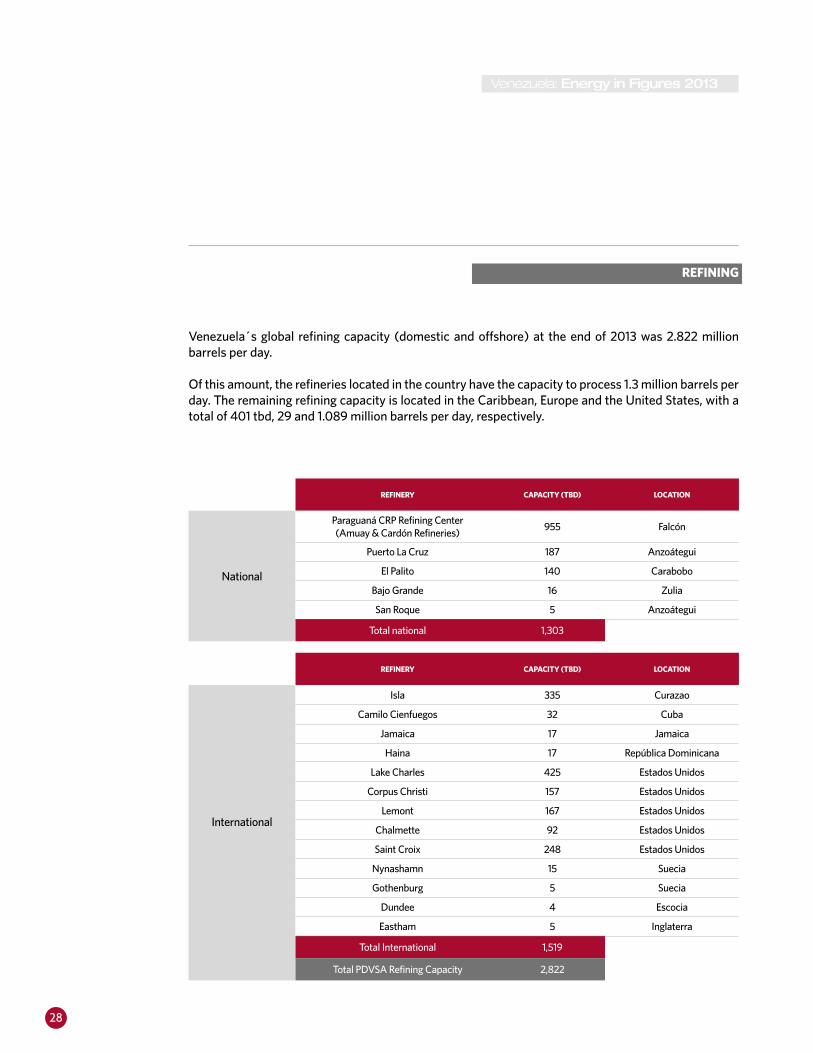
REFINING
Venezuela´s global refining capacity (domestic and offshore) at the end of 2013 was 2.822 million barrels per day.
Of this amount, the refineries located in the country have the capacity to process 1.3 million barrels per day. The remaining refining capacity is located in the Caribbean, Europe and the United States, with a total of 401 tbd, 29 and 1.089 million barrels per day, respectively.

29
Venezuela: Energy in Figures 2013
Source: Informe de Gestión Anual de PDVSA de 2013.
PDVSA Refining Capacity 2013% Total refining
Refineries outside Venezuela
REFINERIES LOCATION COMPANY REFINING CAPACITY (MBD)
PDVSA CAPACITY (MBD) SHARE
Lake Charles United States CITGO 425 425 100%
Corpus Christi
United States CITGO 157 157 100%
Lemont United States CITGO 167 167 100%
Chalmette United StatesChalmetteRefining2 184 92 50%
Saint Croix United States Hovensa3 495 248 50%
Camilo Cienfuegos4
Cuba CUVENPETROL 65 32 49%
Jamaica5 Jamaica Petrojam 35 17 49%
Isla6 Curazao PDVSA 335 335 100%
Haina7 Dominican Republic Nynas 34 17 49%
Dundee Scotland Nynas 9 4 50%
Eastham England Nynas 18 5 25%
Nynashamn Sweden Nynas 29 15 50%
Gothenburg Sweden Nynas 11 5 50%
14%
39%1%
46%EUROPE
UNITED STATES
CARIBBEAN
VENEZUELA
Source: Informe Operacional y Financiero PDVSA 2012.
2 Joint Venture in association with ExxonMobil Co.3 Joint Venture in association with Hess Co.4 Joint Venture in association with Comercial Cupet S.A.5 Joint Venture in association with Petroleum Corporation of Jamaica (PCJ).6 Leased in 1994. Leasing agreement ends in 2019.7 Joint Venture in association with Refidomsa.

30
Venezuela: Energy in Figures 2013
Processed Oil Volume and Inputs Directed Towards Processes and Mixtures 2011 – 2013
NATIONAL REFINING PROCESSED OIL VOLUME - 2013 (TBD)
PROCESSED OIL VOLUME - 2012 (TBD)
PROCESSED OIL VOLUME - 2011 (TBD)
PROCESS AND MIXTURES INPUTS - 2012 (TBD)
Paraguaná Refining center
654 638 699 103
Puerto La Cruz Refinery
173 171 169 56
El Palito Refinery 128 127 127 101
Total 955 936 995 260
INTERNATIONAL REFINING
PROCESSED OIL VOLUME (INCLUDES PROCESS AND MIXTURES INPUTS) - 2013
(TBD)
PROCESSED OIL VOLUME (INCLUDES PROCESS AND MIXTURES INPUTS) - 2012
(TBD)
PROCESSED OIL VOLUME (INCLUDES PROCESS AND MIXTURES INPUTS) - 2011
(TBD)
CITGO Petroleum Corporation* 685 637 659
Chalmette Refinery 138 133 131
Saint Croix Refinery ** ** 283
Isla Refinery 170 176 170
Camilo Cienfuegos Refinery 54 55 55
Jamaica Refinery 23 23,8 24,5
Haina Refinery 28 24,6 26,2
Nynas*** 34 55,7 56,6
Total 1,132 1105,1 1405,3
Source: Informe de Gestión Anual de PDVSA 2013, 2012 y 2011.*Lake Charles, Corpus Christi & Lemont refineries.
**Closed since February 2012.***Dundee, Eastham, Nynashamn & Gothenburg refineries.

31
Venezuela: Energy in Figures 2013
SUBSIDIES
Fuel prices in Venezuela are set by the govern-ment and have not changed since 1997. They stand at 0.097 BsF / liter for 95 octane gasoline and 0,075 BsF/liter for 91 octane gasoline. On the other hand, export prices have grown 269 % in real terms (an annual rate of 9.77 %), raising the barrel price from 29.96 USD to 110.54 USD.In that time span, Venezuela’s official currency has experienced 1,039 % devaluation, creating a 0.7USD/liter price gap.
The gap has raised the opportunity cost of selling gasoline in the country, increasing the economic subsidy for the last 15 years.
In 2013, according to PDVSA’s Informe de Gestión, gasoline consumption was of 299 tbd, repre-senting an equivalent subsidy of 12.121 billion USD and 3.5 % of GDP
Source: EIA, Bureau of Labor Statistics, Informe Financiero y Operacional PDVSA, MENPET.Note 1: New York Harbor American Price was used as a referenceNote 2: Average liter Price of gasoline in Venezuela
14,000
12,000
10,000
8,000
6,000
4,000
2,000
0
-2,000
12,121
1,959
198
9
1990
1991
1992
1993
1994
1995
1996
1997
1998
1999
200
0
200
1
200
2
200
3
200
4
200
5
200
6
200
7
200
8
200
9
2010
200
1
2012
2013
USD
Mill
ions
32
Venezuela: Energy in Figures 2013
Sources: EIA, Bureau of Labor Statistics, Informe Financiero y Operacional PDVSA, MENPET.Note 1: Includes extraction, refining and import costs
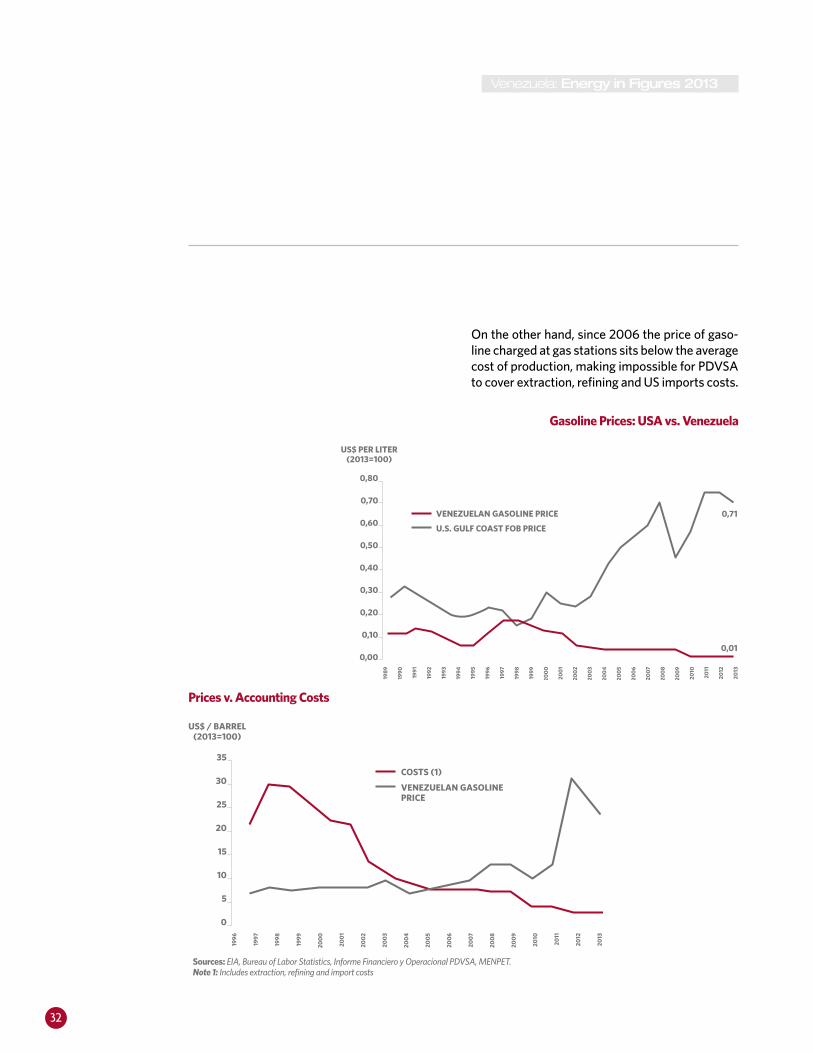
On the other hand, since 2006 the price of gaso-line charged at gas stations sits below the average cost of production, making impossible for PDVSA to cover extraction, refining and US imports costs.
Gasoline Prices: USA vs. Venezuela
Prices v. Accounting Costs
0,80
0,70
0,60
0,50
0,40
0,30
0,20
0,10
0,00
0,71
0,01
198
9
1990
1991
1992
1993
1994
1995
1996
1997
1998
1999
200
0
200
1
200
2
200
3
200
4
200
5
200
6
200
7
200
8
200
9
2010
2011
2012
2013
US$ PER LITER(2013=100)
VENEZUELAN GASOLINE PRICE
U.S. GULF COAST FOB PRICE
35
30
25
20
15
10
5
0
1996
1997
1998
1999
200
0
200
1
200
2
200
3
200
4
200
5
200
6
200
7
200
8
200
9
2010
2011
2012
2013
US$ / BARREL(2013=100)
COSTS (1)
VENEZUELAN GASOLINEPRICE

33
Venezuela: Energy in Figures 2013
According to official figures, Venezuela’s exports of oil and refined products reached 2.425 million barrels per day in 2013 to include: Raw: 1.935 million barrels per dayRefined products and natural gas liquids 490 thousand barrels per day
Of the total exports, commercialization by region was the following:North America845 million barrels per dayCentral America and the Caribbean369 tbdAsia1115 tbdEurope107 tbdSouth America67 tbdAfrica10 tbdOther12 tbd
Commercialization
Source: Informe Operacional Financiero de PDVSA del año 2007 y Informe de Gestión Anual de PDVSA de 2008, 2009, 2010, 2011, 2012 y 2013.
Exports by Region 2006-2013(Thousands B/D)
North America (St. Croix included)
Central America & The Caribbean
Asia
Europe
South America
Africa
Others
MDV
0 200 400 600 800 1000 1200 1400 1600 1800
2013 2012 2011 2010 2009 2008 2007 2006

34
Venezuela: Energy in Figures 2013
Exports classified by product 2005-2013 (Thousands B/D)
PRODUCT TYPE 2013 2012 2011 2010 2009 2008 2007 2006
Gasoline & naphtha 36 30 46 49 48 69 80 95
Distillates 6 43 64 63 108 104 133 140
Residual fuel oil 281 258 268 215 297 227 160 174
Asphalt 6 5 1 0,3 1 0 10 16
Kerosene/Turbo fuels/Jet 51 57 66 59 59 64 59 58
Others 41 40 33 43 33 61 74 82
Source: Informe de Gestión Anual de PDVSA de 2013.
35
Venezuela: Energy in Figures 2013
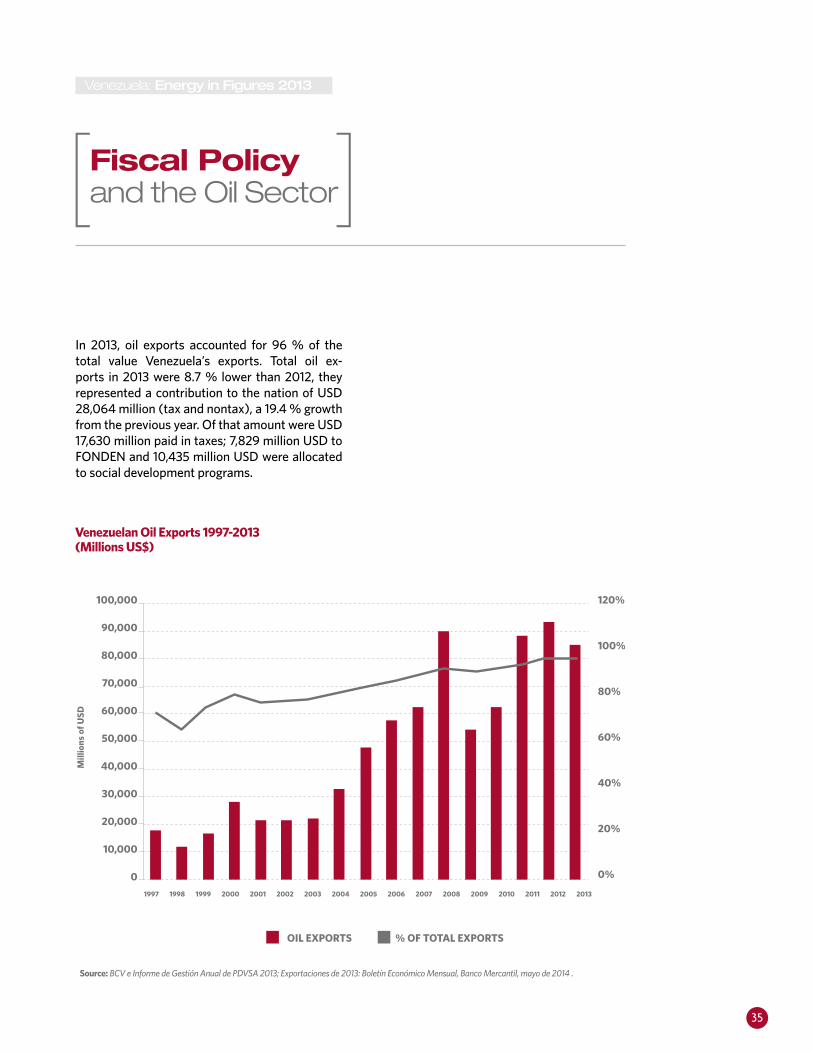
In 2013, oil exports accounted for 96 % of the total value Venezuela’s exports. Total oil ex-ports in 2013 were 8.7 % lower than 2012, they represented a contribution to the nation of USD 28,064 million (tax and nontax), a 19.4 % growth from the previous year. Of that amount were USD 17,630 million paid in taxes; 7,829 million USD to FONDEN and 10,435 million USD were allocated to social development programs.
Fiscal Policy and the Oil Sector
Source: BCV e Informe de Gestión Anual de PDVSA 2013; Exportaciones de 2013: Boletín Económico Mensual, Banco Mercantil, mayo de 2014 .
Venezuelan Oil Exports 1997-2013(Millions US$)
100,000
90,000
80,000
70,000
60,000
50,000
40,000
30,000
20,000
10,000
0
OIL EXPORTS % OF TOTAL EXPORTS
120%
100%
80%
60%
40%
20%
0%
1997 1998 1999 2000 2001 2002 2003 2004 2005 2006 2007 2008 2009 2010 2011 2012 2013
Mill
ions
of U
SD
36
Venezuela: Energy in Figures 2013
2005 2006* 2007 2008 2009 2010 2011 2012 2013
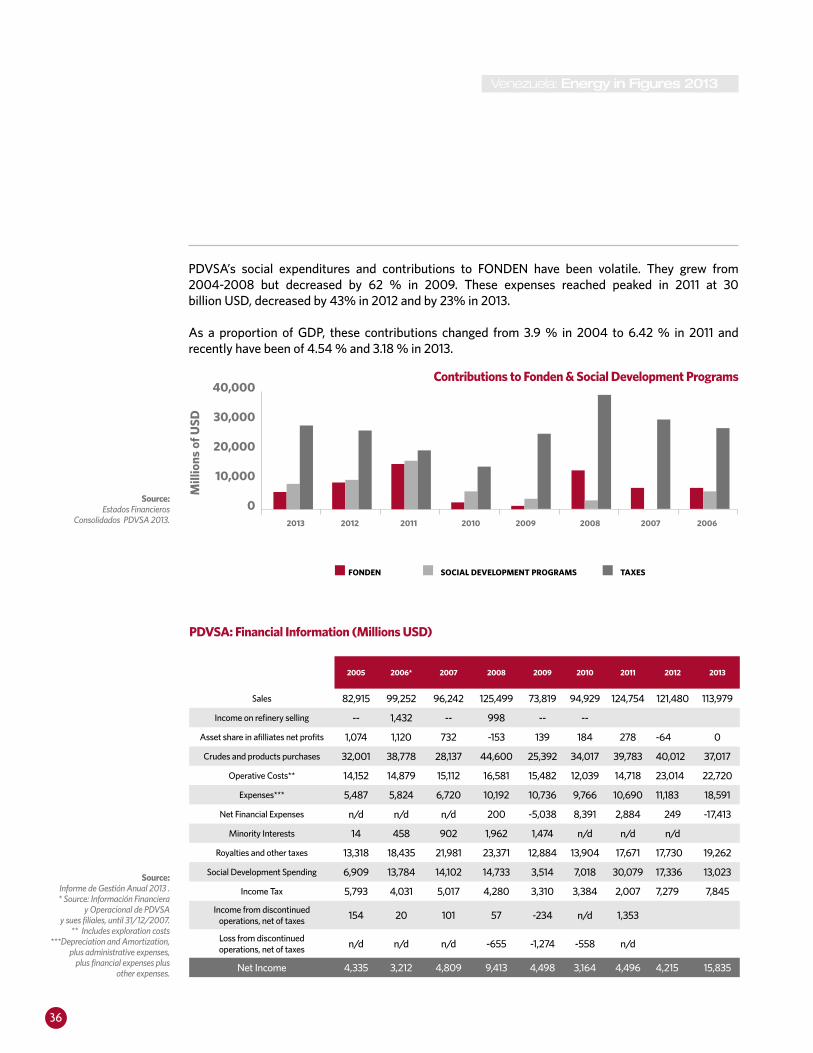
Sales 82,915 99,252 96,242 125,499 73,819 94,929 124,754 121,480 113,979
Income on refinery selling -- 1,432 -- 998 -- --
Asset share in afilliates net profits 1,074 1,120 732 -153 139 184 278 -64 0
Crudes and products purchases 32,001 38,778 28,137 44,600 25,392 34,017 39,783 40,012 37,017
Operative Costs** 14,152 14,879 15,112 16,581 15,482 12,039 14,718 23,014 22,720
Expenses*** 5,487 5,824 6,720 10,192 10,736 9,766 10,690 11,183 18,591
Net Financial Expenses n/d n/d n/d 200 -5,038 8,391 2,884 249 -17,413
Minority Interests 14 458 902 1,962 1,474 n/d n/d n/d
Royalties and other taxes 13,318 18,435 21,981 23,371 12,884 13,904 17,671 17,730 19,262
Social Development Spending 6,909 13,784 14,102 14,733 3,514 7,018 30,079 17,336 13,023
Income Tax 5,793 4,031 5,017 4,280 3,310 3,384 2,007 7,279 7,845
Income from discontinued operations, net of taxes 154 20 101 57 -234 n/d 1,353
Loss from discontinued operations, net of taxes n/d n/d n/d -655 -1,274 -558 n/d
Net Income 4,335 3,212 4,809 9,413 4,498 3,164 4,496 4,215 15,835
Source: Estados Financieros
Consolidados PDVSA 2013.
PDVSA’s social expenditures and contributions to FONDEN have been volatile. They grew from 2004-2008 but decreased by 62 % in 2009. These expenses reached peaked in 2011 at 30 billion USD, decreased by 43% in 2012 and by 23% in 2013.
As a proportion of GDP, these contributions changed from 3.9 % in 2004 to 6.42 % in 2011 and recently have been of 4.54 % and 3.18 % in 2013.
Contributions to Fonden & Social Development Programs40,000
30,000
20,000
10,000
02013 2012 2011 2010 2009 2008 2007 2006
FONDEN SOCIAL DEVELOPMENT PROGRAMS
Mill
ions
of U
SD
TAXES
Source: Informe de Gestión Anual 2013 . * Source: Información Financiera
y Operacional de PDVSA y sues filiales, until 31/12/2007.
** Includes exploration costs***Depreciation and Amortization,
plus administrative expenses, plus financial expenses plus
other expenses.
PDVSA: Financial Information (Millions USD)

37
Venezuela: Energy in Figures 2013
PDVSA Social Contributions 2007-2013
50%
40%
30%
20%
10%
0%2007 2008 2009 2010 2011 2012 2013
SOCIAL PROGRAMS
% O
f tot
al c
ontr
ibut
ions
FONDEN
Source: Informe de Gestión Anual de PDVSA 2013 y Estados Financieros Consolidados PDVSA 2013.

38
Venezuela: Energy in Figures 2013
PDVSA’S INVESTMENT PLAN: SIEMBRA PETROLERA
PDVSA announced in 2005 the Siembra Petrolera Plan 2005-2012, proposing the use of oil resourc-es to enhance the energy production capacity of Venezuela. According to the plan’s official docu-ments, oil production by the end of 2012 should have almost doubled reaching 5.837 million bar-rels a day. Production in 2013 represented almost half of that figure.
In PDVSA´s Annual Report for 2012, a new Siembra Petrolera Plan for 2013 to 2019 was an-nounced.
Goals for 2019• Increase the level of oil production to 6 million barrels per day in 2019, of which 4 million barrels per day come from the Orinoco Oil Belt.
• Increase production of natural gas to a volume of 11,947 million cubic feet, with a significant pro-portion coming from the gas belt of our territorial waters.
• Increase production of Liquid Natural Gas to 255 thousand barrels per day.
• Raise the domestic refining capacity to 2.2 thou-sand barrels per day and to 2.4 thousand barrels per day internationally, for a total capacity of 4.6 thousand barrels per day.
• Achieve a level of exports of crude and products of 5.6 thousand barrels per day.
• Develop a systematic and sustainable industrial capacity for goods and services required by the hydrocarbon core activities.
• Strengthen the national capacity to transport crude and products.

39
Venezuela: Energy in Figures 2013
The Plan de la Patria Law introduces new objec-tives for Venezuela’s petroleum industry, which are the following:
Deepen a market diversification strategy with an oil export goal of 1,335 tbd that would be headed towards Latin America and the Caribbean, and 3,162 tbd headed towards China, India and Japan by the year 2019.Enhance the methane gas distribution network to reduce GLP consumption, improve quality of life and decrease environmental contamination through the deployment of 8,625 km of pipelines and 16,818 km of internal lines, in order to benefit over 728,900 families.Build 5 thermo-electrical plants with a total ca-pacity of 2,620 MW.Develop a Venezuelan gas belt to reach a total production capacity 300 tbd by the year 2014 and 2,030 tbd by the year 2016.
The following are Plan de la Patria Law’s changes from the original Siembra Petrolera’s strategies:
• In the new framework, total gas production for 2019 is expected to be of 10,494 tcf• By 2019, refining capacity is now expected to grow by 1,800 tbd• Natural Gas Liquids production is expected to grow by 130 tbd.
OIL AND GAS ASPECTS OF PLAN DE LA PATRIA LAW:

40
Venezuela: Energy in Figures 2013
AMOUNTS AND INVESTMENT SCHEME
PDVSA estimates that implementation of the Plan will require an investment of approximately U.S. $ 256,986 million in the period 2013-2019. Of that amount, PDVSA is expected to provide 81 %; the remaining 19 percent will be contributed by its partners. Of total investments, 74 percent will be directed towards exploration and production, 9
The disaggregated investment plan 2012-2019 shows a significant increase in exploration and production until 2018, and a refining effort con-centrated between 2014 and 2018. Investment in non-oil subsidiaries tends slow down, flattening out around 2014. According to 2013-2019 pro-jected investments, an E&P effort is evident until 2018. Refining projects will be focused between 2014 and 2018 and the category Other Organiza-tions will grow during at the beginning of the Plan to stabilize in the final years.It should be noted the abrupt reduction of detail in planned disbursements information in relation with 2011 and 2012 Management Reports. In addition to reduction in categories, the tempo-ral profile of investments changed considerably.
Investments disbursements ( MM USD) 2013-2019
percent will be invested in PDVSA Gas, 10 percent in Refining, 2 percent in Trade and Supply, and the remaining 5 percent in Other Organizations.
Source: Informe Operacional y Financiero, PDVSA 2013.
50,000
40,000
30,000
20,000
10,000
02013 2014 2015 2016 2017 2018 2019
OTHERS
TOTAL REFINING, COMMERCIALIZINGAND SUPPLY
ON SHORE NATURAL GAS
EXPLORATION AND PRODUCTION TOTAL
Mill
ions
of
USD

41
Venezuela: Energy in Figures 2013
GASSECTOR

42
Venezuela: Energy in Figures 2013
Gasfigures 2013
Gas Reserves: 197.089 trillion cubic feet, of which 64.072 trillion cubic feet are associated with the Orinoco Oil Belt and 35.339 trillion cubic feet associated with extra heavy crude are present in Eastern and Barinas-Apure basins.
Gas production: 7,395 million cubic feet per day, of which 2,779 are reinjected.
Rate Reserves / Production: 73 years.
Average price of gas in Venezuela 2013: $ 0.19 / MPC.
Offshore exploration and exploitation projects:• Mariscal Sucre Project• Rafael Urdaneta Project (Falcón) • Plataforma Deltana Project• Liquefied Natural Gas Project • Golfo de Paria Oeste y Punta Pescador Project• Blanquilla-Tortuga Project
On shore projects: • Anaco Gas Project• San Tomé Gas Project• Fractioning Capacity Increase in Jose • Soto Deep Extraction Plant • IV Train in San Joaquin • Piritial I• Handling and Disposal of CO2
• G/J José Francisco Bermudez (SINORGAS) Northeastern Natural Gas Pipeline • Expansion of the Baja Grande Ulé Amuay Transport System• Ulé Amuay Center-Eastern Pipe Interconnection Segment• National Gasification

43
Venezuela: Energy in Figures 2013
Venezuela is the country with the eighth largest gas reserves. According to BP’s Statistical Review of World Energy 2014, the country has approxi-mately 197.76 billion cubic feet of gas, which con-stitute the second largest reserves in the Ameri-cas, the United States hold the largest at 300 trillion cubic feet9. Venezuela’s reserves account for 73 % of Central and South America and 3 % of world’s total.
Venezuela’s reserves have remained relatively stable since the mid-90s, growing at an average annual rate of nearly 1 %. From the year 2006 there have been significant additions: natural gas reserves have increased 15 % over the past seven years.
Exploration and Production
RESERVES
Source: BP Statistical Review of World Energy, 2014
Venezuelan Natural Gas proved reserves1985-2013
240
190
140
90
401987 1989 1991 1993 1995 1997 1999 2001 2003 2005 2007 2009 2011 2013
Trill
ion
Cub
ic F
eet
9 Shale gas reserves have not yet been incorporatedinto these figures.

44
Venezuela: Energy in Figures 2013
SHALE GAS RESERVES HAVE NOT YET BEEN INCORPORATED INTO THESE FIGURES.
According to the PDVSA’s Informe de Gestión Anual 2013, certified gas reserves in Venezuela now amount to 197,089 trillion cubic feet, about 30 percent of which are associated with Orino-co’s Oil Belt (FPO).
In 2013, 667 million cubic feet of gas were incor-porated as a result of the discovery of 8 new de-posits -- 98 % coming from exploratory efforts and 2 % from studies financed by PDVSA Gas -. Most of the reserves are located in the northern
Gas Reserves distribution classified by vessel 2013
and northeastern parts of the country but also at the eastern basin and on the shores of the Caribbean and Atlantic continental shelf, spreading across an area of over 500 thousand square kilometers.
The chart below shows the distribution basins of natural gas reserves:
Source: Informe de Gestión Anual de PDVSA 2013.
0,4
%
22,4%
69,9%MARACAIBO-FALCÓN
BARINAS-APURE
ORIENTAL
CARÚPANO
7,3%
45
Venezuela: Energy in Figures 2013
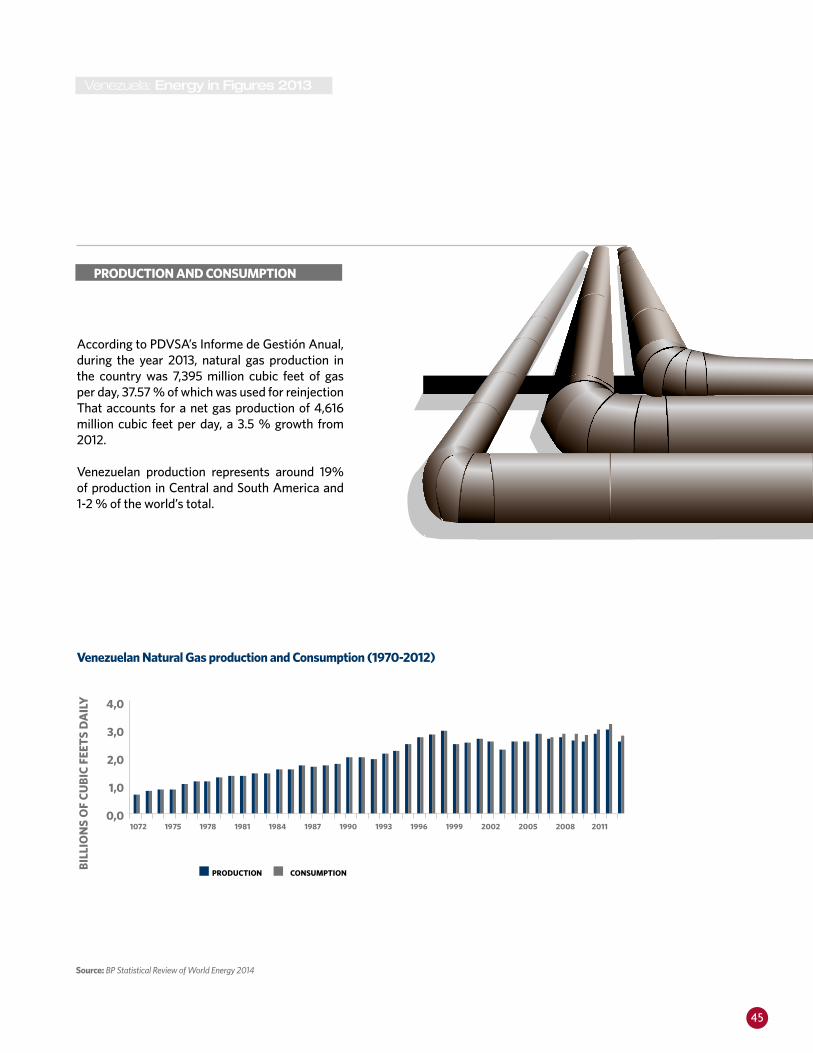
According to PDVSA’s Informe de Gestión Anual, during the year 2013, natural gas production in the country was 7,395 million cubic feet of gas per day, 37.57 % of which was used for reinjection That accounts for a net gas production of 4,616 million cubic feet per day, a 3.5 % growth from 2012.
Venezuelan production represents around 19% of production in Central and South America and 1-2 % of the world’s total.
PRODUCTION AND CONSUMPTION
Source: BP Statistical Review of World Energy 2014
Venezuelan Natural Gas production and Consumption (1970-2012)
4,0
3,0
2,0
1,0
0,01072 1975 1978 1981 1984 1987 1990 1993 1996 1999 2002 2005 2008 2011
PRODUCTION
BIL
LIO
NS
OF
CU
BIC
FEE
TS
DA
ILY
CONSUMPTION

46
Venezuela: Energy in Figures 2013
In the past three years, production levels have decreased while consumption has exceeded the amounts of gas elaborated in the country. Venezuela has therefore had to resort to imports.
Since 2008, Venezuela has been receiving gas from Colombia through the Transcaribeño Antonio Ri-caurte pipeline. During 2013, Venezuela received from Colombia on average 203 million cubic feet per day of gas, resulting in a total supply for internal consumption of 7,598 million cubic feet of gas per day (MMCFD).
Of the total natural gas available in 2013, 26.68 % was for the domestic market to meet the needs of the electricity, steel, cement, aluminum, household, marketing and petrochemicals.
PDVSA Gas production
Gas availability by source
Fuente: Informe de Gestión Anual de PDVSA 2013.
4%
22%
2%
11
%
52%ANACO
SANTOMÉ
SIPORORO
LICENCIAS
GAS GUÁRICO
QUIRIQUIRE GAS
YPERGAS
7%
10%
3%
75%PDVSA GAS
JOINT VENTURES
PDVSA PETRÓLEO
CHEVRON & ECOPETROLPURCHASES
12%
47
Venezuela: Energy in Figures 2013
The Venezuelan distribution system for methane gas comprehends a 5,031 kilometers pipeline net-work with width variances. The main systems are listed below:• Anaco – Barquisimeto• Anaco – Jose / Anaco - Puerto La Cruz• Anaco – Puerto Ordaz• Ulé – Amuay• Interconnection Coast – West• Interconnection Center East - West• Transcaribeño Antonio Ricaurte Pipeline
These facilities met the demand of more than 282,579 commercial and residential users in 2013, 91 % of which located in La Gran Caracas.
According to PDVSA Gas Comunal’s statements, 95 % of Venezuelan families use liquefied petro-leum gas (LPG) as an energy source. In December 2007 PDVSA Gas Communal was created from the merger of TROPIGAS and Vengas, the two largest gas distributors in the country that were previously acquired by PDVSA.
According to PDVSA’s last report, PDVSA Gas Communal owns 63 of the 89 LPG filling plants nationwide and supplied a total of 43.52 tbd, a 3.6 % growth compared with 2012. That amount is distributed in 32.83 tbd corresponding to PDVSA Gas Communal and 610.69 tbd by the private sector.
TRANSPORT AND DISTRIBUTION DOMESTIC GAS

48
Venezuela: Energy in Figures 2013
INVESTMENT
Venezuela’s gas development is part of the Plan de la Patria 2013-2019. Two of its main axes are the development of offshore gas to satisfy do-mestic market demand and to guarantee Ven-ezuela’s absolute sovereignty over its oil and gas resources. According to the Plan, the targets set for 2019 with regards to gas production are 11,947 MMCFD of natural gas and 255 tbd of LNG.
In 2010, 1.305 billion USD were invested in Main-land Gas Development, 16 % less than what PDV-SA had planned for in 2009. In 2011, the actual in-
On-shore Proyected Dissimbursement Investments 2011-2018
vestment was 1,601 million USD, 6 % higher than in the 2010 plan investment for the development of mainland Gas. Beginning 2010, offshore gas development investment has not been reported.
Total disbursements for gas investment in the Ground projected for the period 2014-2019 was of 23,207 million USD. In 2013, the total invested amount was USD 2,868 million; the total 2013-2019 projections are 9% lower than the original Plan Siembra Petrolera’s original course of action for 2012-2018
Source: Informe de Gestión PDVSA 2010 y 2011.
6,000
5,000
4,000
3,000
2,000
1,000
02011 2012 2013 2014 2015 2016 2017 2018
INFORME DE GESTIÓN DE PDVSA 2014
Mill
ion
USD
INFORME DE GESTIÓN DE PDVSA 2011

49
Venezuela: Energy in Figures 2013
PROJECT OBJECTIVE CURRENT SITUATION
Mariscal Sucre
To incorporate into internal markets, gas produced off-shore in the Eastern
part of the country.To develop 70 % of non-associated gas
and condensed liquids reserves from the Dragón, Patao, Mejillones and Río Caribe
camp in order to produce 1,250 mmpced of gas and 28 tbd of condensed liquids.
This Project involves the construction of 34 perforating Wells, installation of 2 production platforms, submarine
production systems, collection lines and an export system that includes 563km of submarine pipelines.-
Additionally urban planning for the platform, a construction dock, Vehicle viability plans
and services for the Complejo Industrial Gran Mariscal de Ayacucho (CIGMA), adecuation and PAGMI
gas processing plants.The project began its execution in 2007 and is divided
in two phases (I & II). Phase I has two stages, first a scheme of accelerated
production of 300 mmpcd by the end of 2014 and then another 300 mmpcd at the end of 2017.
The project is planned to be executed by 2022 with an estimated investment of 13,471 million USD.
In a previous Informe de Gestión -2002- PDVSA had estimated the project’s conclusion to be in 2020.
Rafael Urdaneta
As a first phase of the Project, to explore, quantify and exploit free gas basins
in order to satisfy energy demand in the northwestern part of Venezuela – particu-
larly the Paraguaná Refining Center. Its goals are to increase the amount of reserves
of non-associated natural gas by 23 tcf and liquid hydrocarbons by 7 billion cubic feet
Natural Gas Liquids Project
To provide associated installations with GNL conditioning, liquefaction, storage and boarding for exports of 4.7 million
annual tons.These exports products will be obtained
through 800 million CFED that come from the Eastern Region production areas
(Plataforma Deltana Bloque 2 and Marical Sucre – Dragón – Patao.
The potential markets for its products are Europe, Argentina, Cuba, Brazil and Asia.

50
Venezuela: Energy in Figures 2013
PROJECT OBJECTIVE CURRENT SITUATION
Deltan Platfform Project
A part of the Delta Caribe Oriental Project, it is based on the exploration and production
of non-associated offshore gas in an area of 9,441 square kilometers, through the
Venezuelan and Trinidad & Tobago’s border
Anaco Gas Project
Construction of five operative centers with the capacity to collect, compress
and transfer a production of 2,559 million pcnd and 34.55 tbd of light crude with the
purpose of handling with safety and reliability the production of gas and crude oil in the San Joaquin, Santa Rosa, Zapato/Mata R fields as a part of Phase I and the
Santa Ana and Aguasay, as a part of Phase II, Construction of infrastructure to intercon-
nect the project’s operative centers with the Gas Anaco’s production control room, with the purpose of monitoring, handling of the alarms, measuring each variable historic trends, production simulations, testing
of wells and asset management.
San Joaquin Camp:reached a progress of 90.19%.
Its achievements were: Total compression start at the San Joaquin Operative Center with a capacity of 525 million cubic feet at low
pressure and 780 mmpced at high pressureSanta Rosa Camp:
reached a cumulated physical progress of 73.75 %. The Project “Completion
of Construction of theSanta Rosa Field Collecting System and Operative Center” is currently taking place.
Wapato/Mata R Camp:reached a cumulated physical progress of 70.94%.
Principle achievements:Culmination of the turbocompresor uninstalling contract from the Zapato/Mata R camp to the
Musipán compressor plant, in order to raisecompressing capacity by 152 mmpced at 60
lpca of pressure
San Tomé Gas Project
Execution of visualization, definition, implementation and commissioning phases
of infrastructure for:Collection and centralization of production, which includes the construction and prepa-
ration of 38 flow stations, 5 charging sta-tions, 6 water treatment and injection plants
by centralizing operations in the Chimire
– Boca, Nipa and Elotes- Isla blocks. Construction of 150 km of a low pressure gas
collection system. Construction of 200 km of pipelines.
Compression: Construction of 8 compressor plants (Güere, Boca, Chimire, Elotes - Isla,
Nipa, Esquina - Trico,nardo, Güico), with a capacity of 550
mmpcd/125 Hp Transmission for processing: Construction
of a 150 km gas collection system at low pressure, flow lines, 200 km
of pipelines and 180 km of a high pressure transmission system.
Reached an cumulative physical progress of 16.62 % (contrasting with 15 % in 2012).
Its achievements were: Partial start for the Guere Project, with the delivery
of 20 mmpcd of gas for the internal market. Construction of flow station, collection systems,
transmission systems, flow lines and operative path-ways-Beginning of construction of the Chimire-Soto transmission system, physical advance of 15.88 %.
Construction of terrace for the Boca II compressor plant.
Beginning of international procurement for the Boca compressor plant. Detailed engineering execution
for the Nipa Block production facilities.
Basic engineering executions for the Chimire block production facilities.

51
Venezuela: Energy in Figures 2013
PROJECT OBJECTIVE CURRENT SITUATION
IV San Joaquín Train Project
To allow to raise NGL processing capacity in Anaco by 1,000 mmpced with a 98%
recovery factor of propane gas, thus generating 50 tbd of NGL and890 mmpced for the gas transport systems
on the internal market.
Accumulated a physical execution of 39.83% (has not changed sin 2012) with the execution of the
following activities: Construction of Phase II of Access viality at the San Joaquin Extraction Plant Installation and commissioning of the 19.6 MW turbo generators
for the national electric grid.
Pirital I
To add, via the NGL Pirital I extraction plant, 1,000 mmpced to the Northern Monagas
area, in order to take advantage of gas that is reinjected to oil production Wells. The plant will have a 99 % recovery factor for propane
and generate over 42 tbd of NLG.
Presents a physical advancement of 8.47 % (constant since 2012), related to procedures necessary
to obtain external financing from Gs Engineering and Construction. Currently on the recruitment phase
for the detailed engineering infrastructure.
Enhanment of Fractionation
Capacity on Jose
To execute engineering, procurement, construction and commissioning of a new
fractioning GNL train of 50 tbd in the fractioning plant and Jose dispatch.
Beyond industrial services, it will include transport facilities, GNL entry, reception,
storage and dispatch.
Showed 29.08 % advancement. Its main achievement was the replacement and commissioning of the
8th loading arm of the 9th platform of the Jose Fractionation Plant.
Soto Deep Extraction Plant
To build a liquid extraction module to comply with the required supply of raw materials required for the petrochemical industrial
park and to process 200 mpced of natural gas from Anaco and San Tomé, thereby raising NGL production by 15 tbd. This
production will be transported by a 35 km pipeline from Soto to San Joaquin for it to
be later fractured in the Jose Cryogenically Complex. Additionally, this project includes the development of electrical infrastructure
of 45 MW to supply the national electrical grid.
Accumulated physical execution of 45.22 % (has not changed sin 2012)
Its main achievement at the December 2013 was the execution of civil and mechanical works of the Soto
Norte electric infrastructure, with a 77.38 % progress.
Handling and Disposal
of CO2 Emissions
Through this project, new plants dedicated to conditioning and injecting
gases into qualifying oil fields will be commissioned. The project’s goals include raising production of liquid hydrocarbons
through enhanced recovery.Phase I of the project will handle a 32
mmpced CO2 capacity, taking by the Soto deep extraction plant.
Phase II will build a CO2 handling capacity of 210 mmpced, based on the Calidad
de Gas al Mercado Interno
Accumulated physical execution of 8.83% (changed from 4.45 % in 2012)
Activities that leveraged its progress are:Execution of Phase III on 2 special studies oriented to
determine the feasibility of injecting CO2 to the Zapato Mata R field with the goal of hydrocarbon
enhancement. Basic engineering progress, 60.53 %.

52
Venezuela: Energy in Figures 2013
PROJECT OBJECTIVE CURRENT SITUATION
José Francisco Bermúdez
North-western Pipeline
Comprehends the execution of visualization, conceptualization, definition, implementa-tion and commissioning of infrastructure that allows to transport the natural gas
volumes produced in the Eastern off shore area, from Guiria to the Sucre, northern
Anzoátegui, Monagas and Nueva Esparta’s consumption centers in order to satisfy industrial, domestic needs as well as the
demand of the refining sector.
Accumulated physical execution of 92.94% (from 51% 2012) Among the principal aspects and
achievement for 2013 for this project are:• Completion of a 68 km-long, 36 inch pipeline
for the Provisor-Cumaná section, from the bm-11 valve station to the bm-14 valve station (Cumana)
between the Sucre and Anzoátegui states. •• Completion of a 155 km-long, 16-36 inch pipeline
for the Cumana-Cariaco-Araya-Coche-Margarita section, from the bm-14 valve station to the bm-30
valve station in Isla Margarita, with a capacity of 180 mmpcd.
• Construction of the primary regulation and district stations. at the Coche and Margarita valve stations.
• Installation of a 158 km-long 36 inch pipeline for the n°7 Güiria - El Pilar – Cariaco
construction package
Extension of the Ulé-Amuay Bajo
Grande Transport System
Increase gas transport capacity from 220 mmpced to 620 mmpced, therefore
leveraging compliance with national and international gas contracts such as:
Receiving natural gas from the Cardón IV block and complying with the Eni, Repsol and
PDVSA’s agreement to supply PDVSA Gas S.A. with natural gas from Cardon IV.
Complying with contractual commitments to export gas to Colombia.
Cover the electrical sector’s gas demand (from the Josefa Camejo, Termozulia I & II plants) and satisfy the commercial,
residential, industrial and transport natural gas needs.
Accumulated physical execution of 37.5% (changed from 33% in 2012)
Activities and achievements for this project were:
Culmination of engineering for the Project.Partial enhancement of the km 217 terminal’s station.
Enhancement of the km 215 sectioning station and construction of the 26 inch pipeline from the 215 km
station to the 217 km station.
• Progress on the Bajo Grande terminal stationof 75% and the 217 km terminal station of 9.77%.

53
Venezuela: Energy in Figures 2013
PROJECT OBJECTIVE CURRENT SITUATION
Centran Wester Linkage
Interconnect the Anaco-Barquisimeto sys-tem with the Ule-Amuay system in order to pass over 520 mmpced of natural gas from Eastern Venezuela to western Venezuela,
therefore supplying Centro Refinador Para-guaná’s gas demand, releasing gas liquid for export and supplying western Venezuela’s
gas needs in the electric, petrochemical and industrial sectors.
Currently on implementation, shows a cumulative physical execution of 90.60 % (it was 88 % in 2012)
Activities and achievements for this project were: Culmination of detailed engineering.
• Contract signed for the completion of the Morros Compressing Plant.
• Start of new compression train 1 from the Altagracia compressor plant, adding 400 mmpced to the Anaco Barquisimeto system. at an 885 psi charge in order to
raise the operational flexibility of the compressor plant.
National Gasification
To ensure gas supply to Venezuela’s rural areas through the installation of distribution networks of methane gas, in order to satisfy commercial and domestic demand, in order
to increase LPG exports, to improve local development and to raise lower-income
communities’ quality of life.
Cumulative physical execution of 53.94 % (it was 46 % in 2012)and gasification of 102,109 homes throughout the national surface. Contract signed between PDVSA Gas and a Portuguese consortium, for the execution of basic engineering for the principal ring that will provide
methane gas to the city of Cumana.• The Great Caracas region currently carries out pro-
jects with Russian, Belarusian and Chinese delegations as well as a relocation of the Caracas-Litoral pipeline in order to provide natural gas for 23,000 homes that
belong to the social program Gran Misión Vivienda Venezuela.
Rehabilitation of Pipelines
The Project has as an objective the construc-tion and replacement of new transport in-
frastructure of methane gas (12 to 36 inches pipelines) for a total of 768 km located
between the eastern, central and western parts of the country in order to increase op-erational flexibility, to raise transport capac-ity and supply, as well as to leverage national social development within the nearby areas where the Project will take place. To avoid transport and supply shortages during the course of the project there are provisions
for new pipelines for gas, replacements and interconnection stations on a national scale.
Accumulated physical execution of 10.56 % Activities that leveraged the project’s progress were the following:Construction started for the subproject “tramos cortos”
30 inch Nurgas.• Contracts signed for the replacement of the
gas pipeline for the Anaco - Barquisimeto / Subsistema Epa - N50 transmission system.(NurGas pipeline
30 inches).• Start of basic and detailed engineering for these
subprojects: Arichuna - Figueroa 26 inches pipelines–;replacement of short sections for 26 inch
pipelines Arichuna - Caiza, replacement of short sections for 26inch pipelines La Encrucijada - Los
Morros y replacement of short sections for 20 inch pipelines Tejerías - Guacara.
Extension of the Anaco-PLC Transport System Phases I & II
To provide the necessary methane gas infra-structure to satisfy future gas demand in the Anaco – Puerto Ordaz system. This project has the goal to leverage the development of the industrial, electrical, oil and pretro
chemical sectors within the Siembra Petrol-era Plan for that area of the country
Accumulated physical execution of 96.82 (has not changed sin 2012 due to the rebooting of 2 recruitment processes: electromechanical Works for the Barbacoas
II sectioning station and the complementary works needed for the construction of the Barbacoas II
sectioning station under the new recruitment policies.

54
Venezuela: Energy in Figures 2013
PROJECT OBJECTIVE CURRENT SITUATION
Extension of the Anaco-Puerto
Ordaz Epa Soto Pipeline
To provide the necessary methane gas infrastructure to satisfy future gas demand in the Anaco – Puerto Ordaz system. This
project has the goal to leverage the develop-ment of the industrial, electrical, oil and
pretrochemitry sectors within the Siembra Petrolera Plan for that area of the country. To transport over 200 mmpced methane gas from northern Monagas to satisfy the
electric sector demand.
Accumulated physical execution of 99.82 % (from 91 % in 2012) ). Its principal achievements are:
•Operations began for the 29 km-long 36 inch gas pipeline
• Completion of construction for the Asapo 36, Epa - Soto section station.
• Hydrostatic test for the pipeline, alienation, welding, gammographing, perforation below surface, banking at
ground level, installation of support for the pipelines. Additionally, hydrostatic tests for the Epa & Soto
stations, commissioning for the gas pipelines, installation of spools and valves at the Epa station
and fabrication of PUNTOS DE EMPALME by armored JUNTASin the Soto and Epa stations
• Completion of construction of complementary works
Extension of the Anaco-Puerto
Ordaz Transport System
Pipeline West Lejos – Morichal – Mamo
sections
To provide the necessary methane gas infrastructure to satisfy future gas demand
in the Anaco – Puerto Ordaz system. This project has the goal to leverage
the development of the industrial, electrical, oil and pretrochemitry sectors within the
Siembra Petrolera Plan for that area of the country.
Cumulative physical execution of 95% (has not changed sin 2012). Operations began
for the West-Lejos section
Extension of the Anaco-Barquisimeto
Transport System
To increase transport capacity and to improve the trustworthiness and operational
flexibility necessary to supply actual and future natural gas demand in Great Caracas,
Central Litoral, Carabobennian Litoral and the Barquisimetan axis. It will be achieved
through the substitution of systems affected by mechanic integrity problems and the
addition of new systems that allow for the growth of current capacity.
Physical evolution of 45.65 % (from 32 % in 2012). Its principal achievements have been:
• 55 km of pipelines installed for Phase I othe Moron-Barquisimeto Project and 24 km of 20 inch
pipelines for Phase II • Mechanics activities at the 13 km of pipelines were
culminated for the Restitución de Capacidad Altagracia - Arichuna (Altagracia – Guatopo branch)
project. N10 and n 50 station are currently in executionConstruction and commissioning of a total 88 km
pipeline Epa – N30 (section n12-n30).
La Raisa Thermoelectric
Temporary Supply
El Sitio Electric Temporary Supply
Ezequiel Zamora Electric Temporary
Supply
La Cabrera Electric Temporary Supply
To guarantee the execution of necessary infrastructure in order to ensure gas supply
to the new and already existing electric generation plants
Culminated 20 km of 20 inch pipelines, from the PDVSA Gas valve in Arichuna to the El Sitio electric
plant with a branch to the La Raisa plant (5 km long). Construction of this facility has been assumed
temporary. Supplied volume is 40 mmpcd.
Culminated 1.7 km of 10 inch pipelines, a regulation station and a measuring station. Supplied volume
is 40 mmpcd.
Culminated 2.6 km of 16 inch pipelines, a primary regulation station and a measuring and regulation
station. Supplied volume is 40 mmpcd.
Culminated 3.5 km of 16 inch pipelines, a regulation sta-tion and a measuring station. Supplied volume
is 103.4 mmpcd.

55
Venezuela: Energy in Figures 2013
All the gas produced in Venezuela is consumed domestically; therefore national prices are used in Venezuela’s natural gas analysis.
According to current regulations, the State sets the prices and tariffs through the Ministry of Popular Power for Energy and Petroleum, with the collaboration of Ministry of Popular Power for Production and Commerce, counting with recom-mendations from Enagas.
In 2006, the regulatory body determined that for the year 2007, prices should reach approximately Bs. 26.86 per cubic meter. A new goal of Bs. 45.42 per cubic meter was set for 2015
GAS PRICES
Source: Venezuelan prices: Gaceta Oficial 38.401; World prices: Bloomberg* Domestic Gas *** Prices in December 31st**** Mean monthly price in January
National and international Gas prices(Dollars by millions of BTU)
VENEZUELAN*(FIXED 2011)
WORLD(JANUARY 2011)***
VENEZUELAN(JANUARY 2012)***
WORLD(JANUARY 2012)***
VENEZUELAN*(FIXED 2013)
WORLD(JANUARY 2013)
Amoco LagoHenryHub
NYCGate ****
Amoco LagoHenryHub
NYCGate ****
Amoco LagoHenryHub
NYCGate ****
Dispatch Center at Anaco 0,31 0,62 2,97 5,06 0,33 0,66 2,67 4,85 0,35 0,7 3,3 4,52
Mean 0,47 4,02 0,5 3,76 0,53 3,91

56
Venezuela: Energy in Figures 2013
PDVSA’s performance
compared with other Latin-American State controlled companies
The importance of oil as an industrial strategic commodity and an economic engine of trade locally as well as internationally, has driven governments to intervene directly in their petro-leum producing sectors by the creation of State-run companies, also called National Oil Compa-nies (NOC’s).These NOCs design a variety of strategies that reflect, to some extent, each government’s politi-cal, economic and social objective and their his-torical, institutional and geological contexts.
In Latin America, the most important NOCs are the Petrobras from Brazil, PEMEX from Mé-xico and PDVSA from Venezuela. Even though they share similar characteristics, their level of performance in rcent years and their strategies differ greatly. This section will show a comparison of the three companies measuring the following indicators: production per employee, level of debt to leverage and profit margins.
Regarding production per employee, all three of the companies experienced downward trends from 2001-2013. PDVSA was the most affected. The company, during that period, created non oil subsidiaries and started to directly participate in certain activities that it previously outsourced. As a consequence, its total number of employees grew from 39,000 in 2001 to 113,369 in 2013. In the meantime, total production of oil stayed flat. Mares & Tamiano (2007) argued that the the drastic reduction of hig-skilled labor that took place in 2002-2003 following a series of protests, still affects the company’s general productivity.
In the case of Pemex, the exhaustion of some of its most important fields like Cantarell and a lack of new investments have resulted in a produc-tion fall from 3.4 million barrels a day in 2004 to 2.5 million barrels a day in 2013. Additionally, the low number of production agreements with foreign companies has hindered the transfer of knowledge, lowering the level of human capital and therefore having negative effect on produc-
PRODUCTION PER EMPLOYEE
tion. The influence of its unions and low labor flexibility in Mexico has made Pemex keep on payroll an excessive number of employees. In it main activities it needs 5 times more employees per refined barrel than comparable oil compa-nies. (Victor, Hults & Thurber, 2012).
Petrobras, on the other hand, has seen its number of employees growing from 46,000 workers in 2002 to 86,111 in 2013. In the production growth context of Brasil, the production per employee indicator has mildly decreased. Nonetheless, in this period Petrobras has managed to establish itself as one of the world deep water technology leaders, contributing to a significant production increase from 200 thousand barrels a day in 1975 to 2,120 thousand barrels a day in 2013.

57
Venezuela: Energy in Figures 2013
Taking into account total earnings before taxes, royalties and financial expenses as a proportion of income, Pemex is the leader. Recently, the com-pany’s strategies focus on maximizing operative margins and raising production in existing fields while keeping exploration investments low.
Petrobras shows the lowest number of revenues amongst the three companies. Its production costs are significantly higher at USD 17.22 per bar-rel as a consequence of off-shore drilling – costs compare with USD 11.40 per barrel in PDVSA and USD 7.87 per barrel in Pemex –. However, taking into account net earnings as a proportion of total revenues, Petrobras comes in first place.
Both PDVSA and Pemex pay a significant amount of taxes. In the case of the later, at least 60 % of its revenues are paid in taxes or obligations. In PDVSA, its fiscal payments, transfers to parafis-cal funds and contributions to social programs represent more than 70 % of its revenues. Fis-cal payments for Petrobras barely reach a 30 % threshold.
For this indicator (the ratio obtained dividing the level of debts by total assets), Pemex had the highest value. Pemex’s high level of debt relates with the difficulties it faces in using its own funds to finance investment projects as a consequence of the high number of taxes and royalties the company has to pay to the Mexican State.
PDVSA shows a relatively lesser number of fi-nancial debts related to its assets. However, the constitution of energetic agreements that set a proportion of oil production below market prices thehigh fiscal impact on its revenues and the fos-sil fuel subsidies set by the State have resulted in cash flow problems for the company, making it increase its financial debts while maintaining growing commercial debts to suppliers. The sum of these two kinds of liabilities divided by total as-sets represents a ratio of 27.8.
Petrobras has increased its debt levels by 252 % between 2006 and 2013. In 2007, the company began an ambitious 200 billion USD investment plan. On the other hand, its debt/assets ratio has not been radical given its entrance to the capital markets and its growing earnings
PROFITS LEVERAGE

58
Venezuela: Energy in Figures 2013
In countries like Mexico and Venezuela, highly productive oil fields created possibilities for the efficient and quick extraction of crude oil as well. However, these conditions favored rent-seeking behavior.
Some of the differences between Pemex and PD-VSA can be explained by the implementation of their nationalization process. In Brazil, where oil extraction potential was more limited, Petrobras’ objectives were oriented towards a different di-rection and the management model by which it was created -- taking into account the institution-al context during it creation - gave the company more autonomy over its decisions, promotingthe development of skills and technical capacity, technological innovation and an integrated op-eration.
There are positive and negative elements in each company’s management related to their coun-tries development. A high number of governmen-tal interventions hider productivity even when the State’s and the company’s objectives are aligned.
PERFORMANCE AND AUTONOMY
On the other hands, a context that provides more autonomy can favor development and efficiency in each of the companies but creates the risk of asymmetrical information that turns the compa-ny into a “State within the State”, thereby increas-ing the risks for diverging and often confronting interests. An agenda to introduce sector reforms needs to understand the context by which these com-panies operate and how that context expands of limits the scope of the proposed reforms.
PDVSA PETROBRAS PEMEX
2002 2013 2002 2013 2002 2013
Financial Debt/Assets (%) 15,0 18,77 22,77 35,5 32,6 41
Rairg/Income (%) 21,7 16 30,0 12 59,1 45
Earnings (net losses) /income (%) 6,1 13,9 10,2 11,5 -5,0 -10,6
Source: Informe de Gestión Anual PDVSA 2013, Informe Anual Pemex 2013, Anuario Estadístico Pemex 2013, Financial Statements Petrobras (20-F)
Note: Rairg: Result before taxes, royalties and net financial expenses

59
Venezuela: Energy in Figures 2013
2012–2035PROJECTIONS
The following is a set of projections estimated by the International Energy Agency for the period 2012 - 2035 and in its New Policies scenario.

60
Venezuela: Energy in Figures 2013
Oil
The International Energy Agency projects a significant increase in production beginning in 2020-2025. Below is a visual comparison between Venezuelan production prospects and other important producers’, both regionally and among members of OPEC.
By 2015 production in Brazil, Venezuela and Mexico will be similar, given a continued increase in production in Brazil and a continued decrease in Mexico. From 2025, Brazilian production will reduce its growth rate. In the case of Canada, strong growth is projected, as a result of its non-conventional crude production in the Athabasca Oil Sands.
Expected Production Venezuela-Americas
6,5
6
5,5
5
4,5
4
3,5
3
2,5
22012 2020 2025 2030 2035
Mill
ion
barr
ells
dai
ly
VENEZUELA MEXICO BRAZIL CANADA
Source: International Energy Agency World Energy Outlook 2013, New Policies Scenario y Cálculos Propios

61
Venezuela: Energy in Figures 2013
Forecasts for the majority of OPEC’s countries expect production increases, with the only exceptions being Iraq and Kuwait -annual -0.15 % decreases for each of them-. According to OPEC, Qatar will be the producer that grows the most, at an annual rate of 1.15 %.
To meet OPEC’s projections, Venezuela must have an annual growth of production equivalent to 0.88 %.
Expected production Venezuela-OPEC
Unconventional crudes expected production
14
12
10
8
6
4
2
02012 2020 2025 2030 2035
Mill
ions
bar
rels
dai
ly
VENEZUELA SAUDI ARABIA IRAN IRAQ UNITED ARAB EMIRATES
5
4
3
2
1
02012 2020 2025 2030 2035
Mill
ions
bar
rels
dai
ly
VENEZUELA CANADA
Source: International Energy Agency World Energy Outlook 2013, New Policies Scenario y Cálculos Propios

62
Venezuela: Energy in Figures 2013
The annual growth rate of production of unconventional oil in Venezuela will be much higher than the overall growth rate of oil production, reaching an equivalent of 7 % annual increase. This trend will have an expected effect that, by the year 2035, approximately 63 % of Venezuelan production will be of this type of oil.
In the matter of global oil demand, the IEA estimates a compound annual growth of 0.60 percent, caused mainly by the growth of Asian developing countries (2.11 %) and Latin America (1.06 %) compared to reductions of demand in the United States (-0.8%) and European (-1.09 %).
Within the BRIC (Brazil, Russia, China and India, expected demand shows much higher growth in China and India relative with the rest of the group.
Projected Demand by Region
Expected demand BRIC countries
35
30
25
20
15
10
5
02012 2020 2025 2030 2035
Mill
ion
barr
els
daily USA
EUROPE
ASIA
LATIN AMERICA
18
16
14
12
10
8
6
4
2
02012 2020 2025 2030 2035
Mill
ions
bar
rels
dai
ly CHINA
INDIA
BRAZIL
RUSSIA
Source: International Energy Agency World Energy Outlook 2013, New Policies Scenario y Cálculos

63
Venezuela: Energy in Figures 2013
Regarding natural gas production, the International Energy Agency projects a steadily growing trend for Venezuela, with compound annual growth of 3.88 %, showing a considerable acceleration from the year 2030.
Despite the positive forecasts for Venezuelan production, Brazil’s case stands out for its sharp rise beginning 2020, where it is expected to reach a constant compound annual rate of 6.7 % on a throughout the estimated timeframe. In contrast, Argentina shows a less favorable forecast, with an annual rate of 4.21%.
At the continental level, there is a growing trend of 0.61 % in U.S. natural gas production due to shale gas developments. Meanwhile, Latin America shows higher growth (2.33 %), but starting from lower levels. Canada, despite starting with production levels similar to those in Latin America, shows a lower growth rate of 0.35% compounded annually.
Expected production Venezuela-the Americas
Gas
100
80
60
40
20
02011 2020 2025 2030 2035
Bill
ions
of c
ubic
met
ers
VENEZUELA
BRAZIL
ARGENTINA

64
Venezuela: Energy in Figures 2013
900
800
700
600
500
400
300
200
100
02011 2020 2025 2030 2035
USA
EUROPE
JAPAN
CHINA
INDIA
BRAZIL
Bill
ion
cubi
c M
eter
s
In the matter of projected demand for natural gas, there is again proportionately greater growth in China (5.95 %), but also a positive trend in the growth of demand in the U.S. (0.69 %) and Europe (2.62 %). Brazil shows a growing trend in natural gas consumption (5.14 %), similar to India’s (4.41 %). Japan, on the other hand, appears to stagnate (0.14 %).
Continental projected production (2010=100)
Projected natural Gas demand
600
500
400
300
200
100
02011 2020 2025 2030 2035
VENEZUELA
BRAZIL
USA
CANADA
ARGENTINA
LATIN AMERICA
Source: International Energy Agency World Energy Outlook 2013, New Policies Scenario and own calculations.

65
Venezuela: Energy in Figures 2013
Fuente: Energy Agency World Energy Outlook 2013, New Policies Scenario y CálculosFuente: Energy Agency World Energy Outlook 2013, New Policies Scenario y Cálculos
The International Centre for Energyand Environment ( CIEA )It was created in 2005 to place the IESAas the institution of reference in the national and regional levels , trainingmanagers with leadership skillsin the energy sector as a centerexcellence in reflection, generationand dissemination of knowledge on issuesenergy and environment, with national scopeand international.
THE TEAM OF THE INTERNATIONAL CENTREENERGY AND ENVIRONMENT IS MADE UP :
DirectorFrancisco MonaldiPh.D. Political Economy, Stanford. M.A. Economy, YaleCoordinator Igor HernándezEconomist, UCAB. MA. Economy, DukeTeachersPedro RodríguezPh.D.(c) NYU., M.Phil. Cambridge Richard ObuchiPh.D. (c), Tulane. M.P.P. ChicagoAttachments Plant teachers and members of the CIEAAsdrúbal Baptista - M.A. KentOsmel Manzano - Ph.D. MITJosé Manuel Puente - Ph.D. OxfordRicardo Villasmil - Ph.D. Texas A&MGuests teachersRamón Espinasa - Ph.D. CambridgeLuisa Palacios - Ph.D. SAIS Johns HopkinsLuis Pacheco - Ph.D. Imperial CollegeLuis Roberto Rodríguez - Ph.D. Oxford ResearchersMaría Gabriela Salazar - Economist, UCABJean Paul Leidenz - Economist, UCABAlfredo Vetencourt - Economist, UCAB
IESA , headquarters in Caracas - VenezuelaTel: (+58 212) 555 4260