Embed Size (px)
Citation preview
8/11/2019 IESA FS Report Indian ESDM Market
http://slidepdf.com/reader/full/iesa-fs-report-indian-esdm-market 1/172
F R O S T & S U L L I VA N
INDIAN ESDM MARKET - ANALYSIS OF
OPPORTUNITY AND GROWTH PLANAn IESA - Frost & Sullivan Report
Supported by the Department of Electronics & Information Technology,
Ministry of Communications & Information Technology
Government of India
8/11/2019 IESA FS Report Indian ESDM Market
http://slidepdf.com/reader/full/iesa-fs-report-indian-esdm-market 2/172
IESA - Frost & Sullivan : Indian ESDM Market CONFIDENTIAL IESA COPYRIGHT
Copyright © 2014, India Electronics & Semiconductor Association
8/11/2019 IESA FS Report Indian ESDM Market
http://slidepdf.com/reader/full/iesa-fs-report-indian-esdm-market 3/172
2014INDIAN ESDM MARKET - ANALYSIS OF
OPPORTUNITY AND GROWTH PLAN
IESA - Frost & Sullivan : Indian ESDM MarketCONFIDENTIAL IESA COPYRIGHT
Report released by
Shri J. Satyanarayana, IAS
Secretary
Department of Electronics & Information Technology
Ministry of Communications & Information Technology
Government of India
8/11/2019 IESA FS Report Indian ESDM Market
http://slidepdf.com/reader/full/iesa-fs-report-indian-esdm-market 4/172
COPYRIGHT
All content included in this study, such as text, graphics, logos, images, data compilations, etc. is the property of India Electronics & Semiconductor
Association (“IESA”). The study is for customers’ internal use and not for general publication or disclosure to third parties. No part of this study may
be given, lent, resold, or disclosed to non-customers or exploited for any commercial purposes. Furthermore, the Study in its entirety or any part
cannot be reproduced, stored in a retrieval system, or transmitted in any form or by any means, electronic, mechanical, photocopying, recording,
or otherwise, without the prior written consent of IESA.
DISCLAIMER OF WARRANTIES AND LIMITATION OF LIABILITY
This study is provided by IESA on an “as is” and “as available” basis. IESA has provided information that is provided by market par ticipants, survey
respondents and secondary research of publicly available information. IESA takes no responsibility for any incorrect information supplied to us
by market participants (manufacturers or users). Quantitative market information is based primarily on interviews and therefore is subject to
fluctuation. No claims are made for the accuracy or applicability of the information to any specific situation.
IESA makes no representations or warranties of any kind, express or implied, as to the information, content, materials, etc., included in this study.
The user of the study shall do so at the user’s sole risk. In the event the user intends taking any steps that could have an adverse effect on the users
business, IESA expressly states that the user should consult its legal, tax or other advisors, in order to protect the interests of the user, which maybe
specific from case to case. It is emphasized that IESA has participated in preparation of this study in an independent manner and should not be
construed as necessarily being reflective of the views or position of any individual member company of the IESA or of the representatives of such
member companies that may serve on the IESA’s executive council or other member forums.
To the full extent permissible by applicable law, IESA disclaims all warranties, express or implied, including, but not limited to, implied warranties of
merchantability and fitness for a particular p urpose. IESA will not be liab le for any damages of any kind arising from the use of this study, including,
but not limited to direct, indirect, incidental, punitive, and consequential damages.
Copyright © 2014, India Electronics & Semiconductor Association
India Electronics & Semiconductor Association
Prestige Terminus II, Unit-G-02, 901, Ground Floor,
Civil Aviation Road, (HAL Old Airport Exit Road),Konena Agrahara, Bangalore - 560017
Phone: +91 80 4147 3250
Facsimile: +91 80 4122 1866
Email: [email protected]: www.iesaonline.org
IESA is the premier trade body representing the Indian Electronic System Design and Manufacturing ESDM industry and has represented it since
2005. It has over 200 members - both domestic and multinational enterprises. IESA is committed towards building global awareness for the Indian
ESDM industry and supporting its growth through focused initiatives in developing the ecosystem. This is through publishing credible data,
networking events and alliances with other international associations IESA works closely with the Government as a knowledge partner on the
sector, both at the centre and at the state level.
www.iesaonline.org
The material in this publication is copyrighted. No part of this book can be reproduced either on paper or on electronic media without permissionin writing from the publisher. Requests for permission to reproduce portions of it should be sent to the IESA at the above address.
First print: January 2014
Published by:
India Electronics & Semiconductor Association, Bangalore
Edited by:
Debanjan Sinha, IESA
Designed by:
Cocoon Creative Concepts, Bangalore
8/11/2019 IESA FS Report Indian ESDM Market
http://slidepdf.com/reader/full/iesa-fs-report-indian-esdm-market 5/172
Indian ESDM Market
ANALYSIS OF OPPORTUNITY AND GROWTH PLANAn IESA - Frost & Sullivan Report
Assessment of challenges and identification of steps to develop ecosystem and
increase indigenous value addition for top 25 high priority electronic products
and corresponding components market
Supported by the Department of Electronics & Information Technology,
Ministry of Communications & Information Technology
Government of India
8/11/2019 IESA FS Report Indian ESDM Market
http://slidepdf.com/reader/full/iesa-fs-report-indian-esdm-market 6/172
Acknowledgements
The research report on the Indian ESDM industry will be incomplete without acknowledging the contribution of all the
individuals associated with this exercise. These individuals have been untiring in their efforts to bring in their wealth of
experience and knowledge base to add value to the exercise. The research exercise could leverage their acumen and count on
their unwavering support till the stage of its completion.
India Electronics & Semiconductor Association and Frost & Sullivan would wish to thank them wholeheartedly for their valuable
time and guidance whenever we needed them.
8/11/2019 IESA FS Report Indian ESDM Market
http://slidepdf.com/reader/full/iesa-fs-report-indian-esdm-market 7/172
Room No : 105, Sanchar Bhawan, 20 Ashoka Road, New Delhi - 110001
Phone: 91-11-23739191, 23372177 Fax: 91-11-23723330
MESSAGE
The India ESDM industry presents a huge opportunity and is expected to
emerge as a vital contributor to the nation’s economy. While we continue to dominate
the high-end semiconductor design space, we are also seeing a major shift in focus
from just design to end-to-end product conception and manufacturing to truly
dominate the global ESDM industry.
The Department of Electronics and Information Technology (DeitY),
Government of India has been actively working towards reviving indigenous
manufacturing in a big way. IESA has also played a prominent role in supporting the
Government in its initiatives.
In order to realize the vision of the ESDM industry, we would need to promote
the opportunities presented by the ESDM industry to attract investments in the sector.
As the electronic products have a pervasive role in all industry verticals, it is desirablethat the industry reports on the market opportunities in key products are carried out,
which would serve as useful reference to the various stakeholders, and, thereby, help
them in taking informed decisions on their plans of investing in India.
The IESA - Frost & Sullivan Report 2014 on the ‘ Indian ESDM Market-
Analysis of Opportunity and Growth Plan’ is a right step in this direction. This report
includes an extensive study and analysis of the top 25 high priority electronic
products and their related components in the Indian ESDM industry. This report also
gives insightful information on resolving the current challenges and the
recommendations to move ahead.
I congratulate DeitY and IESA for putting together this important and timely
report for the benefit of all the stakeholders of the Indian ESDM industry. I am sure it
will help us in achieving our vision of taking India to global leadership in the ESDM
industry.
(KAPIL SIBAL)

8/11/2019 IESA FS Report Indian ESDM Market
http://slidepdf.com/reader/full/iesa-fs-report-indian-esdm-market 8/172
8/11/2019 IESA FS Report Indian ESDM Market
http://slidepdf.com/reader/full/iesa-fs-report-indian-esdm-market 9/172
Message
With the Indian ESDM industry is expected to touch the USD 400 billion
mark in the coming decade, the Government of India has identied the
electronics hardware manufacturing sector as a major thrust area for the
country. IESA has done a commendable job of catalysing the growth of thedomestic ESDM industry and is relentlessly working towards this objective.
Taking cognizance of the demands of the economy and the industry, the
Government of India has taken a number of steps to promote the Indian
ESDM industry.
The Department of Electronics & Information Technology (DeitY) and IESA,
as the Knowledge Partner to the Government, have brought out the report on
‘Indian ESDM Market – Analysis of Opportunity and Growth Plan’. This report
identies the top 25 electronics product markets with large opportunities anddraws a roadmap for their growth. It also identies the major components
used in these products and evaluates strategies to promote their ecosystem
in India.
I am sure that this credible report would be extremely valuable for decision
makers both in the government and the industry. I congratulate DeitY and
IESA for their excellent work in putting together this informative and timely
report.
(J. Satyanarayana)
New Delhi
January 02, 2014

8/11/2019 IESA FS Report Indian ESDM Market
http://slidepdf.com/reader/full/iesa-fs-report-indian-esdm-market 10/172
8/11/2019 IESA FS Report Indian ESDM Market
http://slidepdf.com/reader/full/iesa-fs-report-indian-esdm-market 11/172
Message
The Indian ESDM industry is poised for exponential growth. India, as oneof the biggest markets for electronics products, is at a crucial juncture
today. With companies from the world over vying for their share of the pie,
Indian companies today have the opportunity to dominate the global ESDM
landscape by catering to this enormous local demand. Product innovation
and manufacturing are the keys to capturing the market and establishing
market leadership.
In this regard, the IESA-Frost & Sullivan Report on ‘Indian ESDM Market –
Analysis of Opportunity and Growth Plan’ could not have come at a bettertime. With awareness about domestic manufacturing at a new high, Indian
decision makers and the investors are looking for credible data on various
products and components that make up the ecosystem. The IESA-F&S
Report conducts an extensive study and SWOT analysis of the top 25 high
priority electronic products and their related components.
This Data is also invaluable for the industry and the investors looking to
capitalize on the opportunities available in the Indian ESDM industry. The
recommendations in the report will also help us to leapfrog the challenges
and quickly respond to market dynamics.
It is indeed heartening to note the single-minded focus that IESA brings
to promote the growth of the Indian ESDM industry through its variousinitiatives.
I complement IESA in bringing out this timely report.
New Delhi
January 06, 2014
Your’s Sincerely
(Dr. Ajay Kumar)
W-11/68/2013-IPHW
January 06, 2014

8/11/2019 IESA FS Report Indian ESDM Market
http://slidepdf.com/reader/full/iesa-fs-report-indian-esdm-market 12/172
8/11/2019 IESA FS Report Indian ESDM Market
http://slidepdf.com/reader/full/iesa-fs-report-indian-esdm-market 13/172
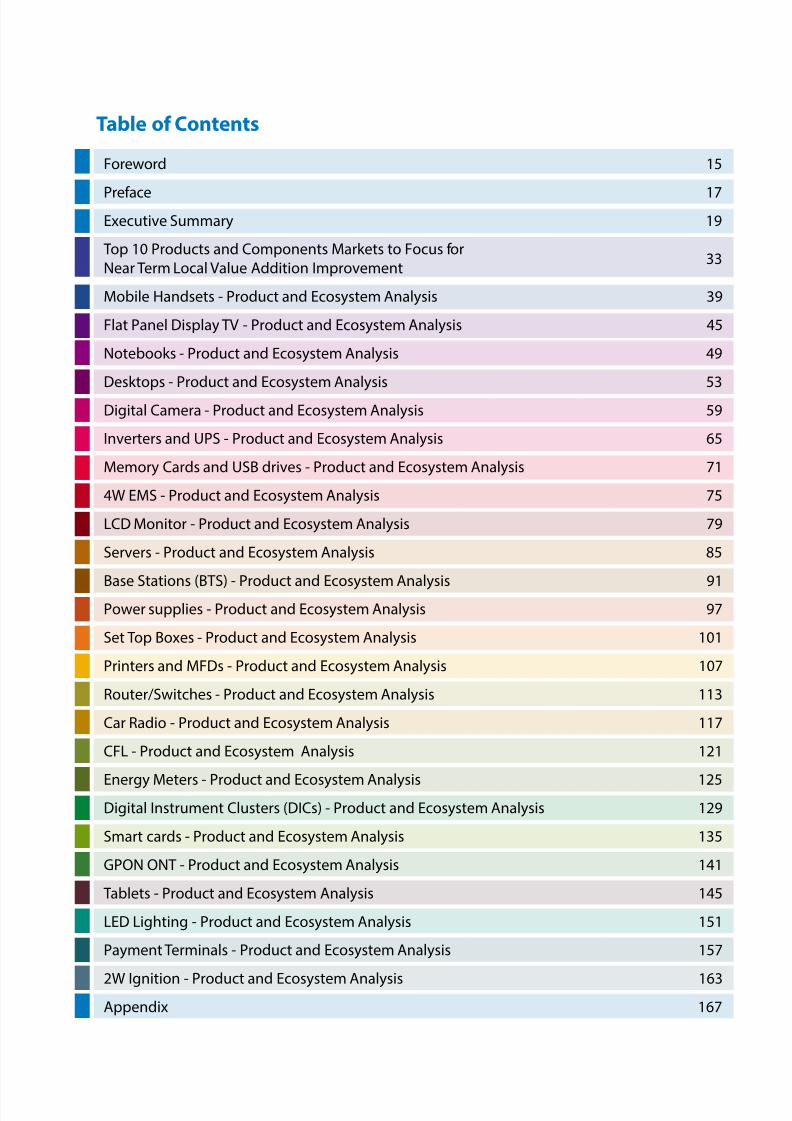
Table of Contents
Foreword 15
Preface 17Executive Summary 19
Top 10 Products and Components Markets to Focus for
Near Term Local Value Addition Improvement33
Mobile Handsets - Product and Ecosystem Analysis 39
Flat Panel Display TV - Product and Ecosystem Analysis 45
Notebooks - Product and Ecosystem Analysis 49
Desktops - Product and Ecosystem Analysis 53
Digital Camera - Product and Ecosystem Analysis 59
Inverters and UPS - Product and Ecosystem Analysis 65
Memory Cards and USB drives - Product and Ecosystem Analysis 71
4W EMS - Product and Ecosystem Analysis 75
LCD Monitor - Product and Ecosystem Analysis 79
Servers - Product and Ecosystem Analysis 85
Base Stations (BTS) - Product and Ecosystem Analysis 91Power supplies - Product and Ecosystem Analysis 97
Set Top Boxes - Product and Ecosystem Analysis 101
Printers and MFDs - Product and Ecosystem Analysis 107
Router/Switches - Product and Ecosystem Analysis 113
Car Radio - Product and Ecosystem Analysis 117
CFL - Product and Ecosystem Analysis 121
Energy Meters - Product and Ecosystem Analysis 125Digital Instrument Clusters (DICs) - Product and Ecosystem Analysis 129
Smart cards - Product and Ecosystem Analysis 135
GPON ONT - Product and Ecosystem Analysis 141
Tablets - Product and Ecosystem Analysis 145
LED Lighting - Product and Ecosystem Analysis 151
Payment Terminals - Product and Ecosystem Analysis 157
2W Ignition - Product and Ecosystem Analysis 163Appendix 167

8/11/2019 IESA FS Report Indian ESDM Market
http://slidepdf.com/reader/full/iesa-fs-report-indian-esdm-market 14/172
8/11/2019 IESA FS Report Indian ESDM Market
http://slidepdf.com/reader/full/iesa-fs-report-indian-esdm-market 15/172
Foreword
The Indian electronics system design and manufacturing (ESDM) industry is at a huge inflection point.
From being predominantly consumption driven, the Indian ESDM industry has a major potential to
become a design led manufacturing industry. Concerted efforts from both the Government and the
industry are required to propel the Indian ESDM industry into one of the critical GDP contributors
in the near future.
The Indian Electronics and Semiconductor Association (IESA), a premier representative body for the
ESDM industry in India commissioned a full-fledged research in its efforts to map the current status
and future opportunities in the industry. The objective of the report was to establish the current
status of all the value chain components in the ESDM industry and identify the growth trends. This
exhaustive report developed by IESA’s consulting partner, Frost & Sullivan, and released in early
2013 is the only authentic detailed report on the overall ESDM industry in India. As a next step, there
was the pertinent need to identify the high growth product markets within the overall electronics
industry and do a deep dive evaluation of the existing ecosystem for these products. This study
would help identify the appropriate initiatives needed for further developing the ecosystem for
these high priority products.
The Department of Electronics and Information Technology (DeitY) has been very active in
formulating and announcing various policy measures aimed at developing the ESDM industry in
India. To ensure the effective implementation of these policies and for directing the focus in the right
direction, this extended analysis of the top 25 high priority electronic products was commissioned
by IESA.
The report on the ecosystem SWOT analysis of the top 25 high priority products covers the following
product markets:
1. Mobile Phones
2. Flat Panel Display (FPD) TV
3. Notebooks
4. Desktops
5. Digital Cameras
6. Inverters and UPS
7. Memory Cards and USB Drives
8. 4W EMS
9. LCD Monitors
10. Servers
11. Base Stations
12. Power Supplies
13. Set Top Box
14. Printers and MFD
15. Routers and Switches
16. Car Radio
17. CFL
18. Energy Meters
19. Digital Instrument Clusters
20. Smart Cards
21. PON, GPON ONT
22. Tablets
23. LED Lighting
24. Payment Terminals
25. 2W Ignition

8/11/2019 IESA FS Report Indian ESDM Market
http://slidepdf.com/reader/full/iesa-fs-report-indian-esdm-market 16/172
8/11/2019 IESA FS Report Indian ESDM Market
http://slidepdf.com/reader/full/iesa-fs-report-indian-esdm-market 17/172
Preface
IESA is today recognized as the most credible voice of the Indian ESDM industry. As
the knowledge partner to the Government of India and the foremost trade body
representing the interests of over 200 member companies in the Indian ESDM
landscape, IESA regularly undertakes research and publication activities. The IESA-Frost & Sullivan annual report on the Indian ESDM industry is one such report that
is much awaited and widely referred by decision makers in the government as well
as the industry.
The IESA- Frost & Sullivan report 2014 is the seventh publication since its inception
in 2005. This year we have conducted an extensive study and SWOT analysis on
the Top 25 high priority electronic products and their related components in the
Indian ESDM industry. As we aggressively promote indigenous manufacturing
and reduction of our dependence on imports, this report aims to uncover the
challenges associated with manufacturing these top 25 electronic products and
associated components domestically.
The findings of the report are interesting. And as always, we have proposed a range
of measures to overcome these challenges and kick-start high-value addition
manufacturing activities in a big way in India.
We sincerely hope that you will find these facts and statistics beneficial for strategic
decision making and join us in taking the right steps to further enrich the Indian
ESDM industry.
Mr. Sanjeev Keskar
Chairman
Mr. PVG Menon
President

8/11/2019 IESA FS Report Indian ESDM Market
http://slidepdf.com/reader/full/iesa-fs-report-indian-esdm-market 18/172
8/11/2019 IESA FS Report Indian ESDM Market
http://slidepdf.com/reader/full/iesa-fs-report-indian-esdm-market 19/172
2014INDIAN ESDM MARKET - ANALYSIS OF
OPPORTUNITY AND GROWTH PLAN
IESA - Frost & Sullivan : Indian ESDM MarketCONFIDENTIAL IESA COPYRIGHT
Executive Summary
The Indian electronics system design and manufacturing (ESDM) industry is one of the fastest growing sectors in the country.
Witnessing uninterrupted growth, the ESDM industry in India is globally renowned for its consumption potential. Changing
global landscapes in electronics design and manufacturing capabilities, and cost structures have turned the attention of global
companies towards India. Companies from around the world are looking to build local capabilities in India not just to serve the
resident market but also to cater to overseas markets.
This has resulted in the development of indigenous capabilities across the ESDM value chain in India. The different segments
within the ESDM industry are at varying stages of development. Similarly, various electronics applications markets such as
telecom electronics, automotive electronics, consumer electronics and industrial electronics, are at different stages of ecosystem
development. The focus is currently on providing the necessary impetus to take advantage of the dormant capabilities across the
various electronics markets and developing the missing links so as to make the local ESDM sector globally competitive.
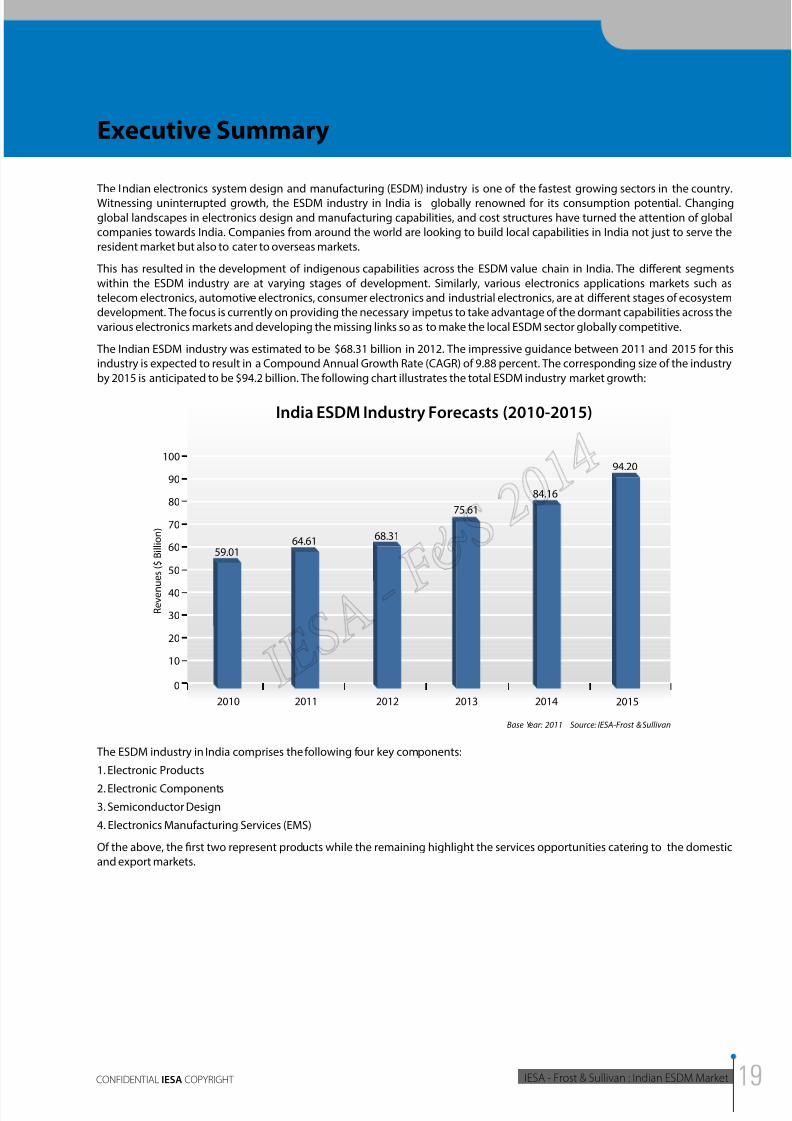
The Indian ESDM industry was estimated to be $68.31 billion in 2012. The impressive guidance between 2011 and 2015 for this
industry is expected to result in a Compound Annual Growth Rate (CAGR) of 9.88 percent. The corresponding size of the industry
by 2015 is anticipated to be $94.2 billion. The following chart illustrates the total ESDM industry market growth:
94.20
0
10
20
30
40
50
70
80
90
100
60
20112010 2012 2013 2014 2015
India ESDM Industry Forecasts (2010-2015)
Base Year: 2011 Source: IESA-Frost & Sullivan
R e v e n
u e s ( $
B i l l i o n )
84.16
75.61
68.3164.61
59.01
The ESDM industry in India comprises the following four key components:
1. Electronic Products
2. Electronic Components
3. Semiconductor Design
4. Electronics Manufacturing Services (EMS)
Of the above, the first two represent products while the remaining highlight the services opportunities catering to the domestic
and export markets.
8/11/2019 IESA FS Report Indian ESDM Market
http://slidepdf.com/reader/full/iesa-fs-report-indian-esdm-market 20/172
IESA - Frost & Sullivan : Indian ESDM Market CONFIDENTIAL IESA COPYRIGHT
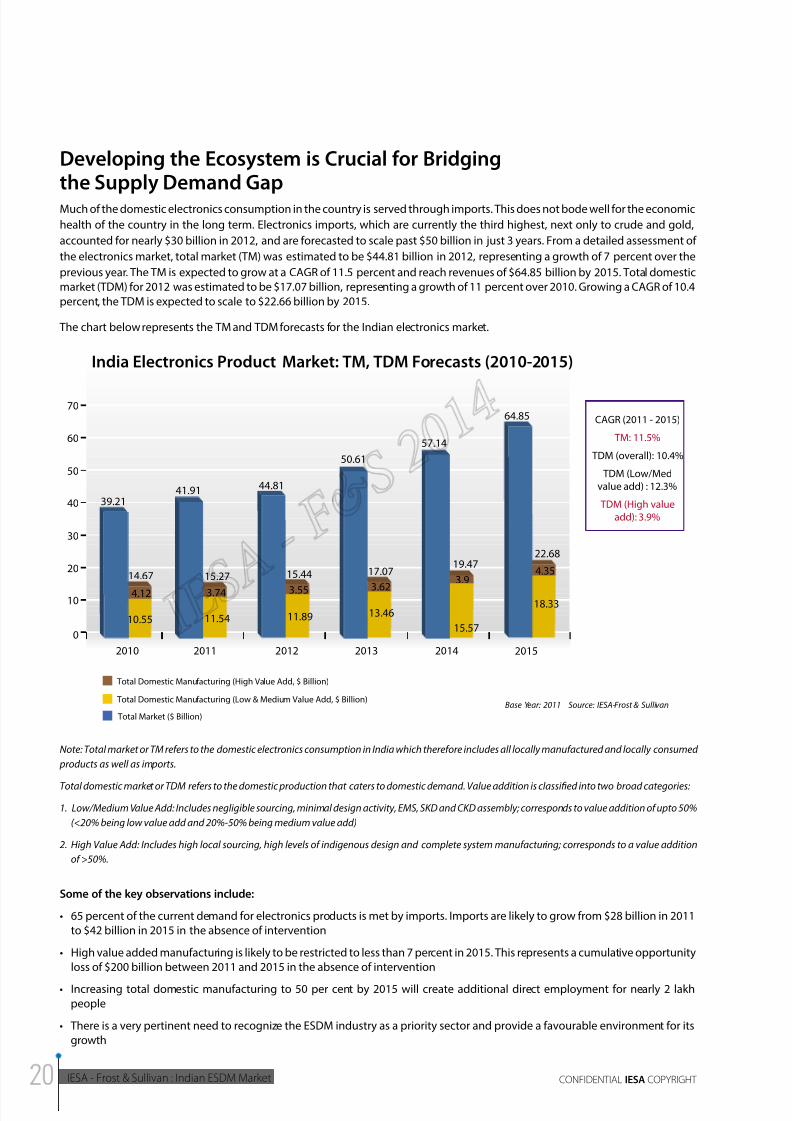
Developing the Ecosystem is Crucial for Bridgingthe Supply Demand GapMuch of the domestic electronics consumption in the country is served through imports. This does not bode well for the economic
health of the country in the long term. Electronics imports, which are currently the third highest, next only to crude and gold,
accounted for nearly $30 billion in 2012, and are forecasted to scale past $50 billion in just 3 years. From a detailed assessment of
the electronics market, total market (TM) was estimated to be $44.81 billion in 2012, representing a growth of 7 percent over the
previous year. The TM is expected to grow at a CAGR of 11.5 percent and reach revenues of $64.85 billion by 2015. Total domestic
market (TDM) for 2012 was estimated to be $17.07 billion, representing a growth of 11 percent over 2010. Growing a CAGR of 10.4
percent, the TDM is expected to scale to $22.66 billion by 2015.
The chart below represents the TM and TDM forecasts for the Indian electronics market.
64.85
22.68
0
10
20
30
40
50
70
60
20112010 2012 2013 2014 2015
India Electronics Product Market: TM, TDM Forecasts (2010-2015)
Total Market ($ Billion)
Total Domestic Manufacturing (High Value Add, $ Billion)
Total Domestic Manufacturing (Low & Medium Value Add, $ Billion)Base Year: 2011 Source: IESA-Frost & Sullivan
CAGR (2011 - 2015)
TM: 11.5%
TDM (overall): 10.4%
TDM (Low/Med
value add) : 12.3%
TDM (High value
add): 3.9%
18.33
15.57
19.47
57.14
50.61
17.07
13.46
44.81
15.44
11.8911.54
15.27
41.91
14.67
39.21
10.55
4.12 3.74 3.55 3.62
3.94.35
Note: Total market or TM refers to the domestic electronics consumption in India which therefore includes all locally manufactured and locally consumed
products as well as imports.
Total domestic market or TDM refers to the domestic production that caters to domestic demand. Value addition is classified into two broad categories:
1. Low/Medium Value Add: Includes negligible sourcing, minimal design activity, EMS, SKD and CKD assembly; corresponds to value addition of upto 50%
(<20% being low value add and 20%-50% being medium value add)
2. High Value Add: Includes high local sourcing, high levels of indigenous design and complete system manufacturing; corresponds to a value addition
of >50%.
Some of the key observations include:
• 65 percent of the current demand for electronics products is met by imports. Imports are likely to grow from $28 billion in 2011
to $42 billion in 2015 in the absence of intervention
• High value added manufacturing is likely to be restricted to less than 7 percent in 2015. This represents a cumulative opportunity
loss of $200 billion between 2011 and 2015 in the absence of intervention
• Increasing total domestic manufacturing to 50 per cent by 2015 will create additional direct employment for nearly 2 lakh
people
• There is a very pertinent need to recognize the ESDM industry as a priority sector and provide a favourable environment for its
growth
8/11/2019 IESA FS Report Indian ESDM Market
http://slidepdf.com/reader/full/iesa-fs-report-indian-esdm-market 21/172
2014INDIAN ESDM MARKET - ANALYSIS OF
OPPORTUNITY AND GROWTH PLAN
IESA - Frost & Sullivan : Indian ESDM MarketCONFIDENTIAL IESA COPYRIGHT
Government as an Enabler for the ESDM Sector The Indian Government, through the Department of Electronics and Information Technology (DeitY), has instituted a number of
forward-looking policies to foster the growth of the Indian electronics ecosystem. These policies are aimed at holistic development
of the ESDM industry by offering specific incentives for the development of each element in the value chain. These forward looking
policy measures include:
National Policy on Electronics (NPE): The objective of the NPE is to create an ecosystem for a globally competitive
ESDM sector in the country by attracting investment of about USD 100 billion and generating employment for around 28 million
people at various levels. The ultimate aim of the policy is for the Indian ESDM sector to develop core competencies in strategic and
core infrastructure sectors like telecommunications, automobile, avionics, industrial, medical, solar, information and broadcasting,
railways, intelligent transport systems, etc.
National Manufacturing Policy (NMP): The government has brought out the NMP to increase the growth of the
manufacturing sector to 12 to 14 percent over the medium term and enable manufacturing to contribute at least 25 percent to
the National GDP by 2022.
Modified Special Incentive Package Scheme (MSIPS): The MSIPS aims to offset cost disabilities and attract
investments in the India ESDM sector through an INR 10,000 crore corpus. Subject to certain investment thresholds, subsidies to the
tune of 20 per cent for SEZ units and 25 per cent for non-SEZ units will be given on capital expenditure along with reimbursement
of excise/CVD.
Setting up semiconductor fabrication units: The Government of India has received the applications of two
consortia (IBM, Jaypee Group, TowerJazz; STMicroelectronics, HSMC) to establish 2 semiconductor wafer fabrication units in Gujarat
and Noida with the aim of operating at 20 nm process node within two years of initial operations and reaching a capacity of at least
40,000 WSPM of at least 300 mm size. Various incentives are being offered by the government to this effect: 25 per cent subsidy
on capital expenditure and growth capital expenditure, reimbursement of CVD and excise duty, exemption from basic customs
duties and 200 per cent deduction on R&D activities, among other incentives such as reimbursement of training costs, deductionfor income tax and various forms of viability gap funding.
Electronic Manufacturing Clusters (EMCs): The government is offering financial support for the development
of EMCs. For greenfield EMCs, assistance will be given up to 50 per cent of the project cost subject to a ceiling of INR 50 crore for
every 100 acres of land. For brownfield EMCs, assistance will be given up to 75 percent of the project cost subject to a ceiling of
INR 50 crore.
Electronics Development Fund (EDF): The EDF aims to create an ecosystem of R&D in electronics in India which
will promote IP generation and large scale manufacturing, while simultaneously fostering the growth of the ESDM ecosystem. The
focus of EDF will largely revolve around small and medium enterprises (SME) in line with the goal of promoting innovation and job
creation.
8/11/2019 IESA FS Report Indian ESDM Market
http://slidepdf.com/reader/full/iesa-fs-report-indian-esdm-market 22/172
IESA - Frost & Sullivan : Indian ESDM Market CONFIDENTIAL IESA COPYRIGHT
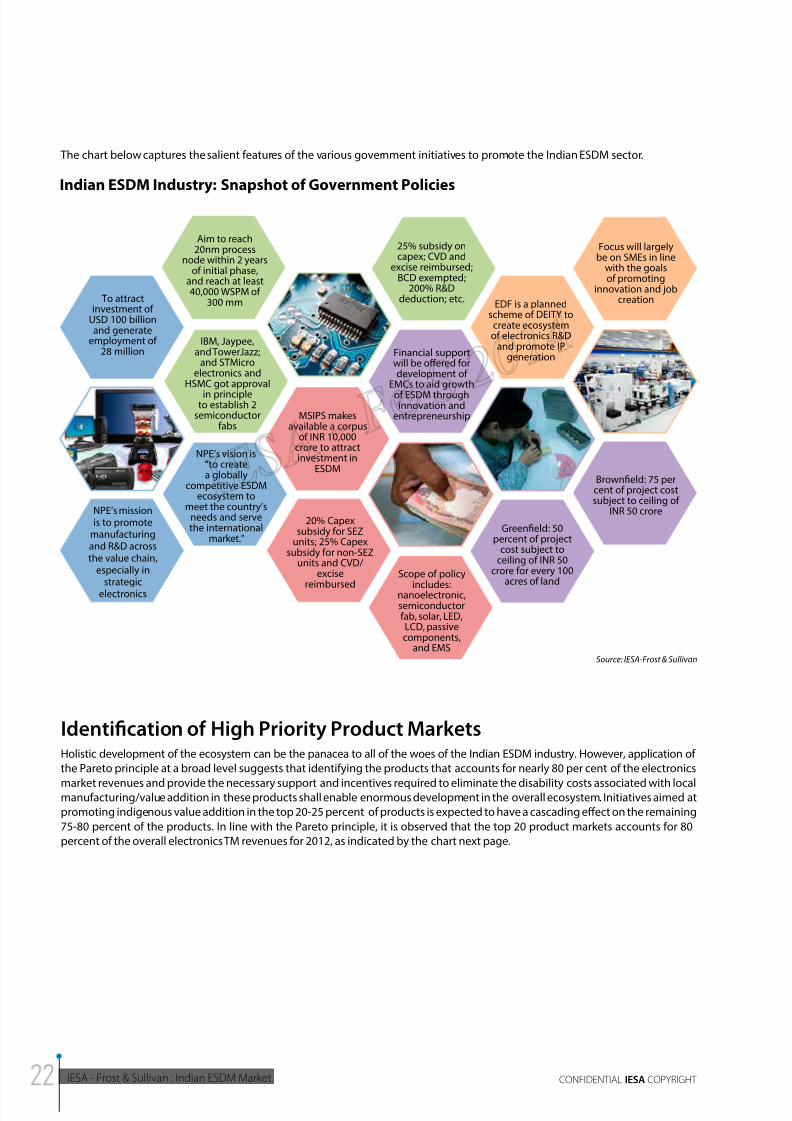
The chart below captures the salient features of the various government initiatives to promote the Indian ESDM sector.
To attractinvestment of
USD 100 billionand generate
employment of28 million
Aim to reach20nm process
node within 2 yearsof initial phase,
and reach at least40,000 WSPM of
300 mm
IBM, Jaypee,and TowerJazz;
and STMicroelectronics and
HSMC got approval
in principleto establish 2
semiconductorfabs
MSIPS makesavailable a corpus
of INR 10,000crore to attractinvestment in
ESDM
25% subsidy oncapex; CVD and
excise reimbursed;BCD exempted;
200% R&Ddeduction; etc.
EDF is a plannedscheme of DEITY to
create ecosystemof electronics R&D
and promote IPgeneration
Focus will largelybe on SMEs in line
with the goalsof promoting
innovation and jobcreation
Brownfield: 75 percent of project costsubject to ceiling of
INR 50 crore
Greenfield: 50percent of project
cost subject toceiling of INR 50
crore for every 100acres of land
Financial supportwill be offered fordevelopment of
EMCs to aid growth
of ESDM throughinnovation and
entrepreneurship
Scope of policy
includes:nanoelectronic,semiconductorfab, solar, LED,LCD, passivecomponents,
and EMS
20% Capexsubsidy for SEZ
units; 25% Capexsubsidy for non-SEZ
units and CVD/excise
reimbursed
NPE’s vision is“to createa globally
competitive ESDMecosystem to
meet the country’sneeds and servethe international
market.”
NPE’s missionis to promote
manufacturingand R&D acrossthe value chain,
especially instrategic
electronics
Source: IESA-Frost & Sullivan
Indian ESDM Industry: Snapshot of Government Policies
Identification of High Priority Product MarketsHolistic development of the ecosystem can be the panacea to all of the woes of the Indian ESDM industry. However, application of
the Pareto principle at a broad level suggests that identifying the products that accounts for nearly 80 per cent of the electronics
market revenues and provide the necessary support and incentives required to eliminate the disability costs associated with localmanufacturing/value addition in these products shall enable enormous development in the overall ecosystem. Initiatives aimed at
promoting indigenous value addition in the top 20-25 percent of products is expected to have a cascading effect on the remaining
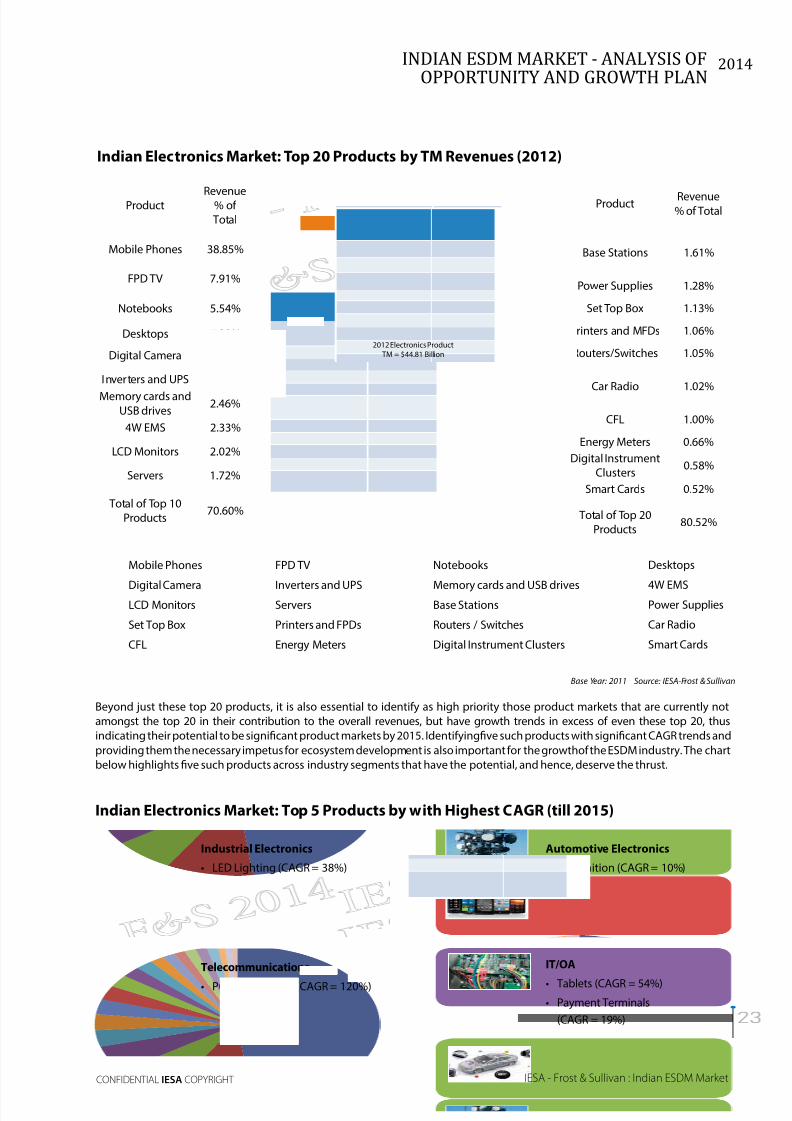
75-80 percent of the products. In line with the Pareto principle, it is observed that the top 20 product markets accounts for 80
percent of the overall electronics TM revenues for 2012, as indicated by the chart next page.
8/11/2019 IESA FS Report Indian ESDM Market
http://slidepdf.com/reader/full/iesa-fs-report-indian-esdm-market 23/172
2014INDIAN ESDM MARKET - ANALYSIS OF
OPPORTUNITY AND GROWTH PLAN
IESA - Frost & Sullivan : Indian ESDM MarketCONFIDENTIAL IESA COPYRIGHT
Mobile Phones
Digital CameraLCD Monitors
Set Top Box
CFL
FPD TV
Inverters and UPSServers
Printers and FPDs
Energy Meters
Notebooks
Memory cards and USB drivesBase Stations
Routers / Switches
Digital Instrument Clusters
Desktops
4W EMSPower Supplies
Car Radio
Smart Cards
Product Revenue% of Total
Mobile Phones 38.85%
FPD TV 7.91%
Notebooks 5.54%
Desktops 4.39%
Digital Camera 2.73%
Inverters and UPS 2.65%
Memory cards andUSB drives
2.46%
4W EMS 2.33%
LCD Monitors 2.02%
Servers 1.72%
Total of Top 10Products
70.60%
Product Revenue% of Total
Base Stations 1.61%
Power Supplies 1.28%
Set Top Box 1.13%
Printers and MFDs 1.06%
Routers/Switches 1.05%
Car Radio 1.02%
CFL 1.00%
Energy Meters 0.66%
Digital InstrumentClusters
0.58%
Smart Cards 0.52%
Total of Top 20Products
80.52%
Indian Electronics Market: Top 20 Products by TM Revenues (2012)
Base Year: 2011 Source: IESA-Frost & Sullivan
Beyond just these top 20 products, it is also essential to identify as high priority those product markets that are currently not
amongst the top 20 in their contribution to the overall revenues, but have growth trends in excess of even these top 20, thus
indicating their potential to be significant product markets by 2015. Identifyingfive such products with significant CAGR trends and
providing them the necessary impetus for ecosystem development is also important for the growthof the ESDM industry. The chart
below highlights five such products across industry segments that have the potential, and hence, deserve the thrust.
Indian Electronics Market: Top 5 Products by with Highest CAGR (till 2015)
Industrial Electronics
• LED Lighting (CAGR = 38%)
Automotive Electronics
• 2W Ignition (CAGR = 10%)
IT/OA
• Tablets (CAGR = 54%)
• Payment Terminals
(CAGR = 19%)
Telecommunications
• PON, GPON ONT (CAGR = 120%)
2012 Electronics Product TM = $44.81 Billion
8/11/2019 IESA FS Report Indian ESDM Market
http://slidepdf.com/reader/full/iesa-fs-report-indian-esdm-market 24/172
IESA - Frost & Sullivan : Indian ESDM Market CONFIDENTIAL IESA COPYRIGHT
SWOT Analysis of the 25 High Priority Product Markets
The characteristics of these product markets with regard to the Indian electronics ecosystem vary very widely. Hence, they need to
be evaluated thoroughly with regard to their strengths, weaknesses and growth prospects among other factors in order to gain athorough understanding of their unique market dynamics. This report contains detailed evaluation of the market dynamics, current
ecosystem availability, disability factors restricting local value addition and future potential for these 25 high priority products. The
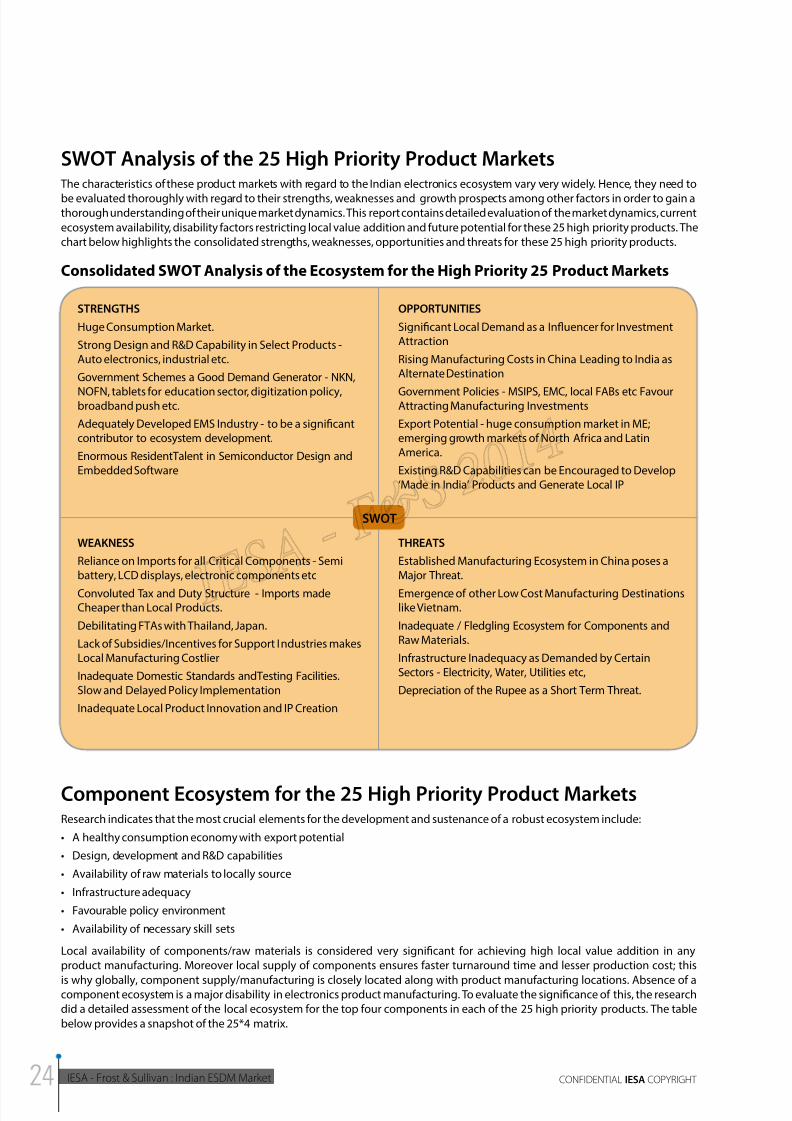
chart below highlights the consolidated strengths, weaknesses, opportunities and threats for these 25 high priority products.
Consolidated SWOT Analysis of the Ecosystem for the High Priority 25 Product Markets
SWOT
STRENGTHS
Huge Consumption Market.
Strong Design and R&D Capability in Select Products -Auto electronics, industrial etc.
Government Schemes a Good Demand Generator - NKN,
NOFN, tablets for education sector, digitization policy,broadband push etc.
Adequately Developed EMS Industry - to be a significantcontributor to ecosystem development.
Enormous ResidentTalent in Semiconductor Design andEmbedded Software
OPPORTUNITIES
Significant Local Demand as a Influencer for InvestmentAttraction
Rising Manufacturing Costs in China Leading to India asAlternate Destination
Government Policies - MSIPS, EMC, local FABs etc FavourAttracting Manufacturing Investments
Export Potential - huge consumption market in ME;emerging growth markets of North Africa and LatinAmerica.
Existing R&D Capabilities can be Encouraged to Develop‘Made in India’ Products and Generate Local IP
WEAKNESS
Reliance on Imports for all Critical Components - Semibattery, LCD displays, electronic components etc
Convoluted Tax and Duty Structure - Imports madeCheaper than Local Products.
Debilitating FTAs with Thailand, Japan.
Lack of Subsidies/Incentives for Support Industries makesLocal Manufacturing Costlier
Inadequate Domestic Standards andTesting Facilities.Slow and Delayed Policy Implementation
Inadequate Local Product Innovation and IP Creation
THREATS
Established Manufacturing Ecosystem in China poses aMajor Threat.
Emergence of other Low Cost Manufacturing Destinationslike Vietnam.
Inadequate / Fledgling Ecosystem for Components andRaw Materials.
Infrastructure Inadequacy as Demanded by CertainSectors - Electricity, Water, Utilities etc,
Depreciation of the Rupee as a Short Term Threat.
Component Ecosystem for the 25 High Priority Product MarketsResearch indicates that the most crucial elements for the development and sustenance of a robust ecosystem include:
• A healthy consumption economy with export potential
• Design, development and R&D capabilities
• Availability of raw materials to locally source
• Infrastructure adequacy
• Favourable policy environment
• Availability of necessary skill sets
Local availability of components/raw materials is considered very significant for achieving high local value addition in any
product manufacturing. Moreover local supply of components ensures faster turnaround time and lesser production cost; this
is why globally, component supply/manufacturing is closely located along with product manufacturing locations. Absence of acomponent ecosystem is a major disability in electronics product manufacturing. To evaluate the significance of this, the research
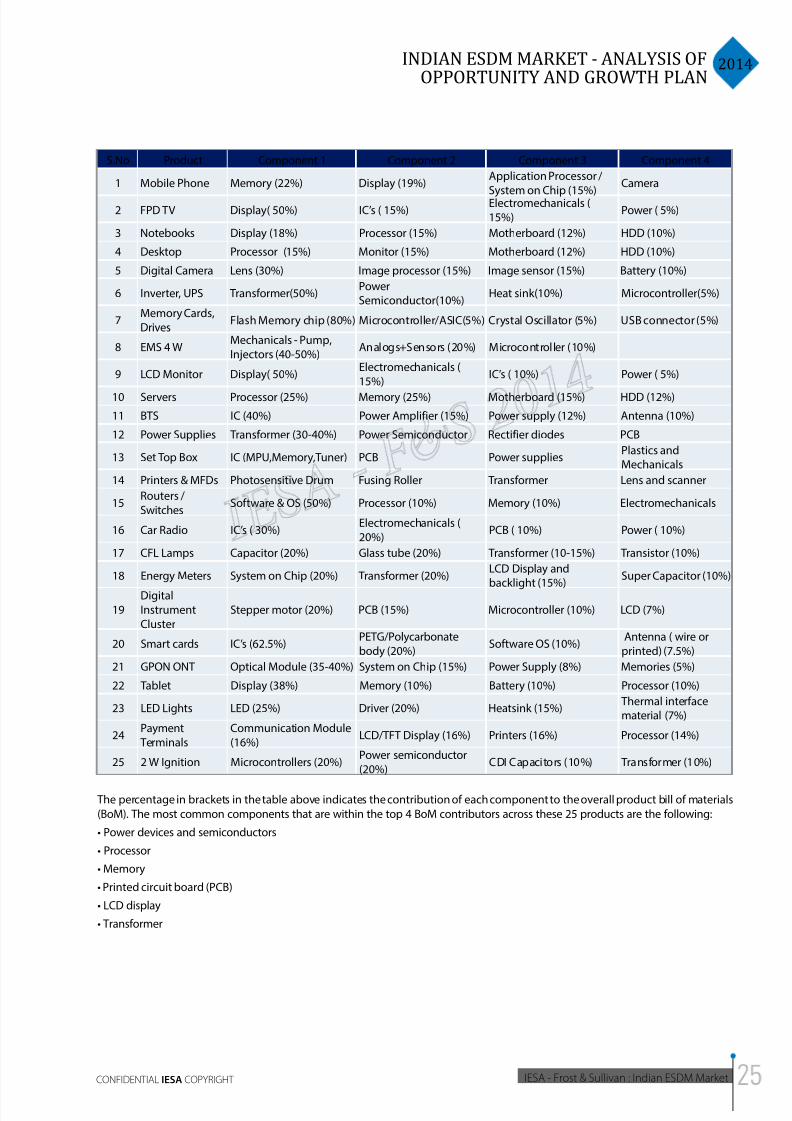
did a detailed assessment of the local ecosystem for the top four components in each of the 25 high priority products. The table
below provides a snapshot of the 25*4 matrix.
8/11/2019 IESA FS Report Indian ESDM Market
http://slidepdf.com/reader/full/iesa-fs-report-indian-esdm-market 25/172
2014INDIAN ESDM MARKET - ANALYSIS OF
OPPORTUNITY AND GROWTH PLAN
IESA - Frost & Sullivan : Indian ESDM MarketCONFIDENTIAL IESA COPYRIGHT
S.No Product Component 1 Component 2 Component 3 Component 4
1 Mobile Phone Memory (22%) Display (19%)Application Processor /
System on Chip (15%)
Camera
2 FPD TV Display( 50%) IC’s ( 15%)Electromechanicals (15%)
Power ( 5%)
3 Notebooks Display (18%) Processor (15%) Motherboard (12%) HDD (10%)
4 Desktop Processor (15%) Monitor (15%) Motherboard (12%) HDD (10%)
5 Digital Camera Lens (30%) Image processor (15%) Image sensor (15%) Battery (10%)
6 Inverter, UPS Transformer(50%)PowerSemiconductor(10%)
Heat sink(10%) Microcontroller(5%)
7Memory Cards,Drives
Flash Memory chip (80%) Microcontroller/ASIC(5%) Crystal Oscillator (5%) USB connector (5%)
8 EMS 4 WMechanicals - Pump,Injectors (40-50%)
Analogs+Sensors (20%) Microcontroller (10%)
9 LCD Monitor Display( 50%)Electromechanicals (15%)
IC’s ( 10%) Power ( 5%)
10 Servers Processor (25%) Memory (25%) Motherboard (15%) HDD (12%)
11 BTS IC (40%) Power Amplifier (15%) Power supply (12%) Antenna (10%)
12 Power Supplies Transformer (30-40%) Power Semiconductor Rectifier diodes PCB
13 Set Top Box IC (MPU,Memory,Tuner) PCB Power suppliesPlastics andMechanicals
14 Printers & MFDs Photosensitive Drum Fusing Roller Transformer Lens and scanner
15Routers /Switches
Software & OS (50%) Processor (10%) Memory (10%) Electromechanicals
16 Car Radio IC’s ( 30%)Electromechanicals (20%)
PCB ( 10%) Power ( 10%)
17 CFL Lamps Capacitor (20%) Glass tube (20%) Transformer (10-15%) Transistor (10%)
18 Energy Meters System on Chip (20%) Transformer (20%)LCD Display andbacklight (15%)
Super Capacitor (10%)
19DigitalInstrumentCluster
Stepper motor (20%) PCB (15%) Microcontroller (10%) LCD (7%)
20 Smart cards IC’s (62.5%)PETG/Polycarbonatebody (20%)
Software OS (10%) Antenna ( wire orprinted) (7.5%)
21 GPON ONT Optical Module (35-40%) System on Chip (15%) Power Supply (8%) Memories (5%)
22 Tablet Display (38%) Memory (10%) Battery (10%) Processor (10%)
23 LED Lights LED (25%) Driver (20%) Heatsink (15%) Thermal interfacematerial (7%)
24Payment
TerminalsCommunication Module(16%)
LCD/TFT Display (16%) Printers (16%) Processor (14%)
25 2 W Ignition Microcontrollers (20%)Power semiconductor(20%)
CDI Capacitors (10%) Transformer (10%)
The percentage in brackets in the table above indicates the contribution of each component to the overall product bill of materials
(BoM). The most common components that are within the top 4 BoM contributors across these 25 products are the following:
• Power devices and semiconductors
• Processor
• Memory
• Printed circuit board (PCB)
• LCD display
• Transformer
8/11/2019 IESA FS Report Indian ESDM Market
http://slidepdf.com/reader/full/iesa-fs-report-indian-esdm-market 26/172
IESA - Frost & Sullivan : Indian ESDM Market CONFIDENTIAL IESA COPYRIGHT
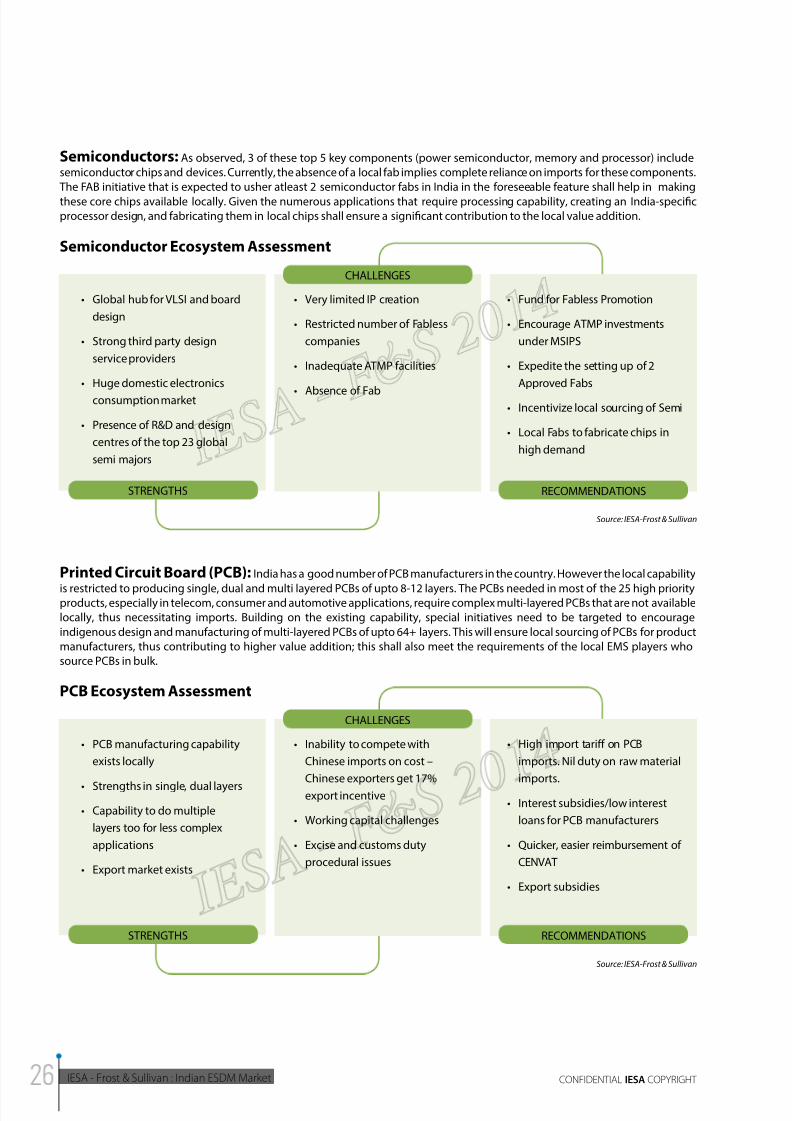
Semiconductor Ecosystem Assessment
• Global hub for VLSI and board
design
• Strong third party design
service providers
• Huge domestic electronics
consumption market
• Presence of R&D and design
centres of the top 23 global
semi majors
• Very limited IP creation
• Restricted number of Fabless
companies
• Inadequate ATMP facilities
• Absence of Fab
• Fund for Fabless Promotion
• Encourage ATMP investments
under MSIPS
• Expedite the setting up of 2
Approved Fabs
• Incentivize local sourcing of Semi
• Local Fabs to fabricate chips in
high demand
CHALLENGES
Source: IESA-Frost & Sullivan
STRENGTHS RECOMMENDATIONS
Semiconductors: As observed, 3 of these top 5 key components (power semiconductor, memory and processor) include
semiconductor chips and devices. Currently, the absence of a local fab implies complete reliance on imports for these components.
The FAB initiative that is expected to usher atleast 2 semiconductor fabs in India in the foreseeable feature shall help in making
these core chips available locally. Given the numerous applications that require processing capability, creating an India-specific
processor design, and fabricating them in local chips shall ensure a significant contribution to the local value addition.
Printed Circuit Board (PCB): India has a good number of PCB manufacturers in the country. However the local capability
is restricted to producing single, dual and multi layered PCBs of upto 8-12 layers. The PCBs needed in most of the 25 high priorityproducts, especially in telecom, consumer and automotive applications, require complex multi-layered PCBs that are not available
locally, thus necessitating imports. Building on the existing capability, special initiatives need to be targeted to encourage
indigenous design and manufacturing of multi-layered PCBs of upto 64+ layers. This will ensure local sourcing of PCBs for product
manufacturers, thus contributing to higher value addition; this shall also meet the requirements of the local EMS players who
source PCBs in bulk.
PCB Ecosystem Assessment
• PCB manufacturing capability
exists locally
• Strengths in single, dual layers
• Capability to do multiple
layers too for less complex
applications
• Export market exists
• Inability to compete with
Chinese imports on cost –
Chinese exporters get 17%
export incentive
• Working capital challenges
• Excise and customs duty
procedural issues
• High import tari on PCB
imports. Nil duty on raw material
imports.
• Interest subsidies/low interest
loans for PCB manufacturers
• Quicker, easier reimbursement of
CENVAT
• Export subsidies
CHALLENGES
Source: IESA-Frost & Sullivan
STRENGTHS RECOMMENDATIONS
8/11/2019 IESA FS Report Indian ESDM Market
http://slidepdf.com/reader/full/iesa-fs-report-indian-esdm-market 27/172
2014INDIAN ESDM MARKET - ANALYSIS OF
OPPORTUNITY AND GROWTH PLAN
IESA - Frost & Sullivan : Indian ESDM MarketCONFIDENTIAL IESA COPYRIGHT
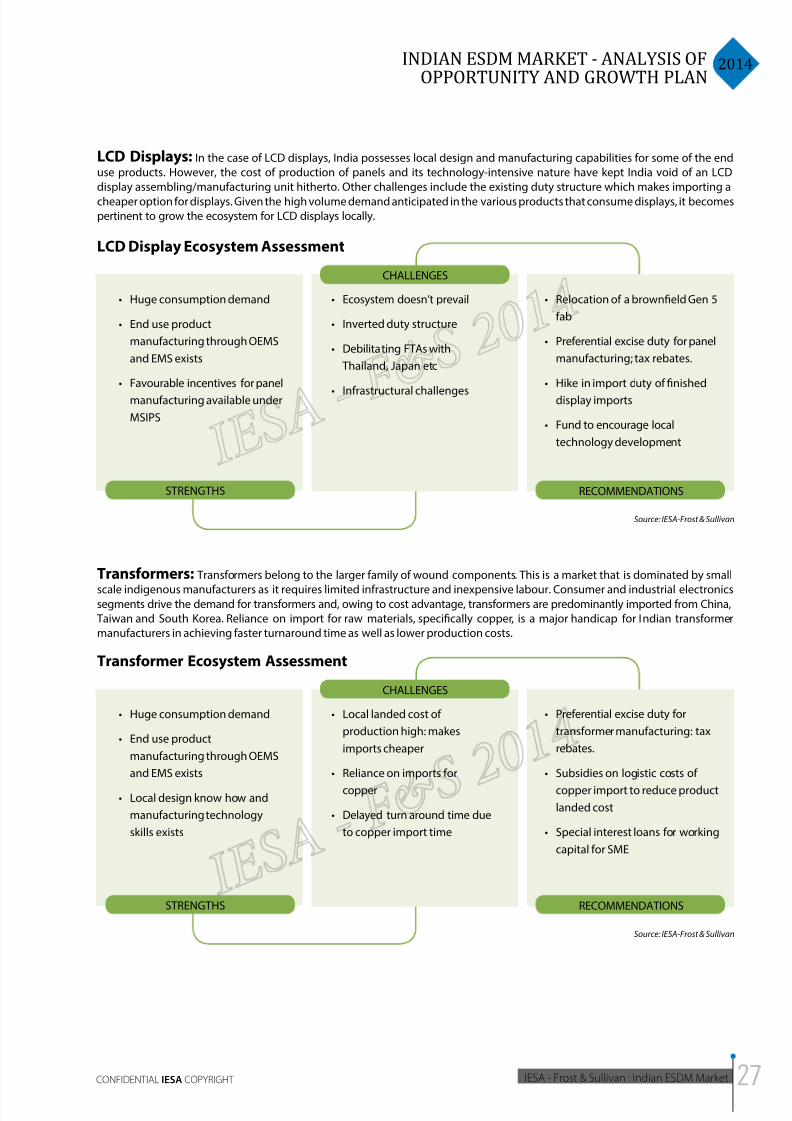
LCD Displays: In the case of LCD displays, India possesses local design and manufacturing capabilities for some of the end
use products. However, the cost of production of panels and its technology-intensive nature have kept India void of an LCD
display assembling/manufacturing unit hitherto. Other challenges include the existing duty structure which makes importing a
cheaper option for displays. Given the high volume demand anticipated in the various products that consume displays, it becomes
pertinent to grow the ecosystem for LCD displays locally.
LCD Display Ecosystem Assessment
• Huge consumption demand
• End use product
manufacturing through OEMS
and EMS exists
• Favourable incentives for panel
manufacturing available under
MSIPS
• Ecosystem doesn’t prevail
• Inverted duty structure
• Debilitating FTAs with
Thailand, Japan etc
• Infrastructural challenges
• Relocation of a browneld Gen 5
fab
• Preferential excise duty for panel
manufacturing; tax rebates.
• Hike in import duty of nished
display imports
• Fund to encourage local
technology development
CHALLENGES
Source: IESA-Frost & Sullivan
STRENGTHS RECOMMENDATIONS
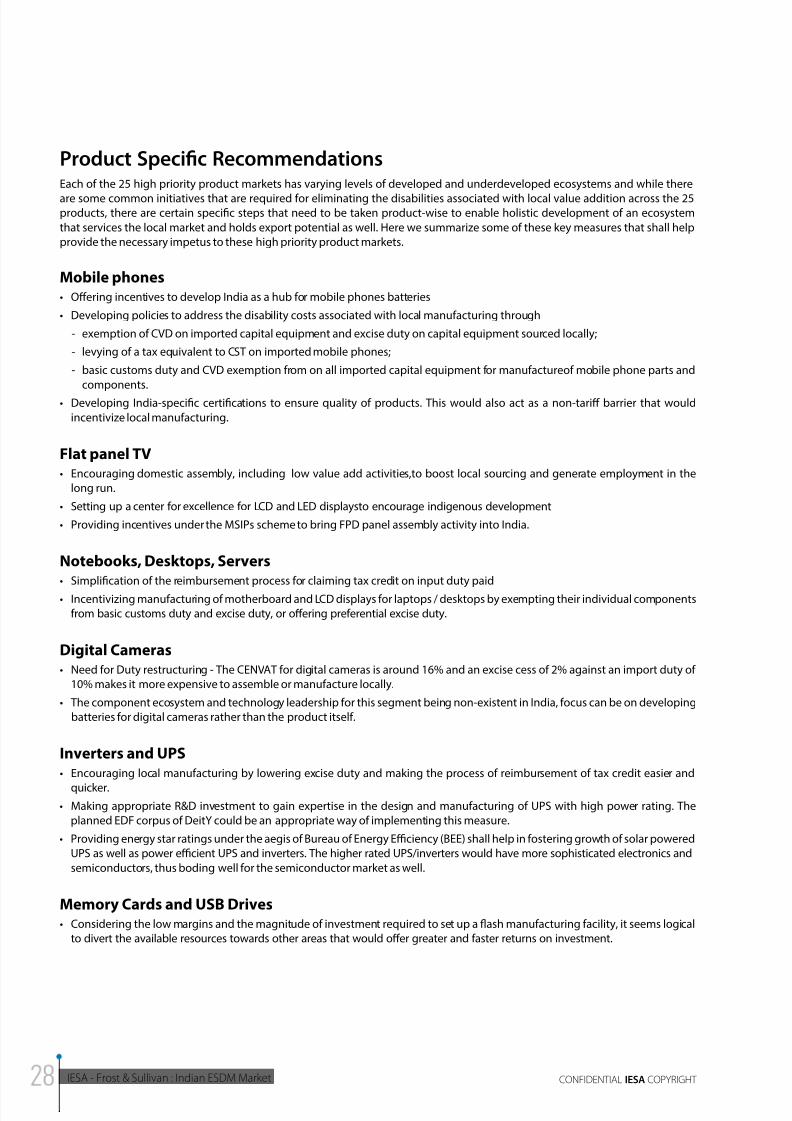
Transformer Ecosystem Assessment
• Huge consumption demand
• End use product
manufacturing through OEMS
and EMS exists
• Local design know how and
manufacturing technology
skills exists
• Local landed cost of
production high: makes
imports cheaper
• Reliance on imports for
copper
• Delayed turn around time due
to copper import time
• Preferential excise duty for
transformer manufacturing: tax
rebates.
• Subsidies on logistic costs of
copper import to reduce product
landed cost
• Special interest loans for working
capital for SME
CHALLENGES
Source: IESA-Frost & Sullivan
STRENGTHS RECOMMENDATIONS
Transformers: Transformers belong to the larger family of wound components. This is a market that is dominated by small
scale indigenous manufacturers as it requires limited infrastructure and inexpensive labour. Consumer and industrial electronicssegments drive the demand for transformers and, owing to cost advantage, transformers are predominantly imported from China,
Taiwan and South Korea. Reliance on import for raw materials, specifically copper, is a major handicap for Indian transformer
manufacturers in achieving faster turnaround time as well as lower production costs.
8/11/2019 IESA FS Report Indian ESDM Market
http://slidepdf.com/reader/full/iesa-fs-report-indian-esdm-market 28/172
IESA - Frost & Sullivan : Indian ESDM Market CONFIDENTIAL IESA COPYRIGHT
Product Specific RecommendationsEach of the 25 high priority product markets has varying levels of developed and underdeveloped ecosystems and while there
are some common initiatives that are required for eliminating the disabilities associated with local value addition across the 25products, there are certain specific steps that need to be taken product-wise to enable holistic development of an ecosystem
that services the local market and holds export potential as well. Here we summarize some of these key measures that shall help
provide the necessary impetus to these high priority product markets.
Mobile phones• Oering incentives to develop India as a hub for mobile phones batteries
• Developing policies to address the disability costs associated with local manufacturing through
- exemption of CVD on imported capital equipment and excise duty on capital equipment sourced locally;
- levying of a tax equivalent to CST on imported mobile phones;
- basic customs duty and CVD exemption from on all imported capital equipment for manufactureof mobile phone parts and
components.
• Developing India-specic certications to ensure quality of products. This would also act as a non-tari barrier that would
incentivize local manufacturing.
Flat panel TV• Encouraging domestic assembly, including low value add activities,to boost local sourcing and generate employment in the
long run.
• Setting up a center for excellence for LCD and LED displaysto encourage indigenous development
• Providing incentives under the MSIPs scheme to bring FPD panel assembly activity into India.
Notebooks, Desktops, Servers• Simplication of the reimbursement process for claiming tax credit on input duty paid
• Incentivizing manufacturing of motherboard and LCD displays for laptops / desktops by exempting their individual components
from basic customs duty and excise duty, or offering preferential excise duty.
Digital Cameras• Need for Duty restructuring - The CENVAT for digital cameras is around 16% and an excise cess of 2% against an import duty of
10% makes it more expensive to assemble or manufacture locally.
• The component ecosystem and technology leadership for this segment being non-existent in India, focus can be on developing
batteries for digital cameras rather than the product itself.
Inverters and UPS• Encouraging local manufacturing by lowering excise duty and making the process of reimbursement of tax credit easier and
quicker.
• Making appropriate R&D investment to gain expertise in the design and manufacturing of UPS with high power rating. The
planned EDF corpus of DeitY could be an appropriate way of implementing this measure.
• Providing energy star ratings under the aegis of Bureau of Energy Eciency (BEE) shall help in fostering growth of solar powered
UPS as well as power ecient UPS and inverters. The higher rated UPS/inverters would have more sophisticated electronics and
semiconductors, thus boding well for the semiconductor market as well.
Memory Cards and USB Drives• Considering the low margins and the magnitude of investment required to set up a ash manufacturing facility, it seems logical
to divert the available resources towards other areas that would offer greater and faster returns on investment.
8/11/2019 IESA FS Report Indian ESDM Market
http://slidepdf.com/reader/full/iesa-fs-report-indian-esdm-market 29/172
2014INDIAN ESDM MARKET - ANALYSIS OF
OPPORTUNITY AND GROWTH PLAN
IESA - Frost & Sullivan : Indian ESDM MarketCONFIDENTIAL IESA COPYRIGHT
Automotive sub systems (CDI, Digital Instrument Clusters, 4W EMS, Car Radio)• Setting up of an automotive EMC possibly near Chennai or in the NCR to completely indigenize the manufacturing of 2W ignition
units.• Incentivizing the manufacturing of PCBs and LCD displays by oering preferential excise duties or greater rates of CENVAT credit.
• Leveraging the MSIPS and EMC policies to set up an automotive EMC near the Bangalore-Chennai area to indigenize the
manufacturing of instrument clusters.
• Attracting investment through the MSIPS policy, preferential excise duties or greater rates of CENVAT to provide impetus for
manufacturemicrocontrollers in the country; the setting up of the two semiconductor fabs in the country would prove to be a
great enabler in this regard.
• Setting up a center of excellence for car infotainment needs within an auto electronics EMC to encourage indigenous design
through frugal innovation.
• Setting up of auto electronics cluster under EMC either in Chennai or Pune with facilities such as incubation center to promote
innovation research, testing laboratories and all other essential infrastructure.
LCD Monitor• Encouraging LCD manufacturing by oering preferential excise duty rates and facilitating easier reimbursement of tax credit.
• Investing in R&D for new display technologies to hedge against any investment made in TFT LCD display fabrication.
• Encouraging local sourcing of electromechanical components, SMPS transformers and the plastic enclosures used in the
assembly of LCD monitors by offering tax credits for vendors who source these components locally.
• Encouraging competencies in the manufacture of LCD displays, especially for tablet and laptop applications. This would require
investment in generation 5 fabs, which are mostly being used for these end user applications. Also, generation 5 fabs are
growing at only 3 percent a year while higher generation fabs are clocking almost 26 percent annual growth. This could mean
that relocationof a generation 5 fab to a brownfield location could be done at an affordable level of investment.
Base stations (BTS)• Incentivizing indigenous IP with preference in government procurement.
• Exploring India-specic standardsfrom a security standpoint.
• Decreasing the in-land freight costs from 17 percent to about 4 percent through subsidies to reduce costs for indigenous
manufacturing and encourage local value addition.
• Encouraging domestic manufacturers to build their capabilities to design and develop power supplies and antennae used in the
BTS.
Power supplies• The component duty currently ranges between 12.36 to 16.85 percent which is considered high for the industry especially since
the Indian market is a price sensitive market. Offering subsidies for manufacturers who manufacture in bulk volumes.
• Ensuring continual availability of copper through the year at subsidized prices to reduce the overall cost of the components.
• Setting up regional level testing labs for testing imported goods.
Set top boxes• Indigenous manufacturers need pay a sales tax in addition to local VAT (~12.5 percent) that makes locally manufactured products
more expensive than imported STBs. Issuance of Form C to alleviate the payment of sales tax in addition to local VAT.
• Increasing the import duty for STBs would help create a level playing eld between global suppliers and indigenous
manufacturers; it has been observed that the hike in the same during 2012-13 budget was not sucient for this purpose.
• Export subsidies to create mini clusters for remote manufacturing of the various components that go into a set top box including
RCA cables, remote control and passive components.
• Optimizing the tax structure being levied on the DTH industry and cable operators to alleviate the operational challenges being
faced by them.
• Oering special low interest loans would help sustain growth and increase the amount of domestic value addition.
8/11/2019 IESA FS Report Indian ESDM Market
http://slidepdf.com/reader/full/iesa-fs-report-indian-esdm-market 30/172
IESA - Frost & Sullivan : Indian ESDM Market CONFIDENTIAL IESA COPYRIGHT
Printers and MFDs• Oering tax credits on R&D activity in high-end laser printing and MFDs. The government could also facilitate the formation of
joint ventures between indigenous players and global OEMs to take advantage of latent manufacturing capabilities; there couldbe export opportunities to the Middle East, Sri Lanka, and Africa due to India’s geographical location.
• Incentivizing local value addition for components such as transformers, PCBs and cabling, that are currently being manufactured
in India, by offering preferential excise duties and greater CENVAT credit for suppliers.
Routers/switches• Creation of funds for local technology know-how development and incentivizing local IP generation
• Focusingon promoting local manufacturing of components such as complex PCBs for routers by either oering preferential
excise duty rates for the manufacturing of complex PCB designs or offering greater rates of CENVAT.
• Prioritizing /inviting investment in PCBs manufacturing under the MSIPS scheme and oer associated benets to those investors.
CFL• Reducing VAT for CFL manufacturing to zero per cent across all states
• Developing ISI certications to standardise manufacturing of CFLs in the country.
Energy meters• Development of standards for manufacturing of smart meters, create a R&D fund for innovations in smart meters, and also create
opportunities for manufacturing of key individual components such as communication modules and transceivers.
• Incentivizing export duty and establishing India as an export hub by encouraging product modications suiting international
requirements
• Setting up an R&D fund for smart meters to encourage SME manufacturers to invest in innovation
• Incentivize manufacturing of communication modules and transceivers
• Global marketing support for cash-strapped SME suppliers
Smart cards• Incentivizing software development and customization services
• Creation of indigenous standards that are application specic with the aim to ensure higher security in the smart cards consumed
in the country.
• Setting up of subsidized testing facilities for EMV compliance
• The Indian ecosystem has enormous skillset availability in the software and integration part of smart cards which could be
incentivized through offering appropriate R&D deductions.
• Encouraging local sourcing of plastic (PETG) by oering preferential excise rates when raw materials are locally sourced.
GPON ONT• Creating supportive policies like reduced excise duties to encourage domestic manufacturing.
Tablets• Repealing the levy of SAD individual electronic components or individual components of LCD monitors and motherboards.
• Incentivizing the manufacture of motherboard and LCD monitors by exempting their individual components from basic customs
duty and excise duty, or offering preferential excise duty.
• Simplifying the reimbursement process for claiming tax credit on input duty paid
• Creating a centre of excellence for tablets to consolidate the dierent design eorts in the private and public sectorsto develop
world-class commercial ‘Made in India’ tablets.
LED Lighting• Restrictive tax structure with a high VAT of 14.5 percent obstructs LED lighting penetration. Reduction in the VAT and a uniform
VAT structure across all states will increase penetration.
• Mandating BIS technical specications to standardize manufacturing processes and products. Imported LED lamps should also
be tested rigorously to prevent dumping of goods in the local market.
8/11/2019 IESA FS Report Indian ESDM Market
http://slidepdf.com/reader/full/iesa-fs-report-indian-esdm-market 31/172
8/11/2019 IESA FS Report Indian ESDM Market
http://slidepdf.com/reader/full/iesa-fs-report-indian-esdm-market 32/172
IESA - Frost & Sullivan : Indian ESDM Market CONFIDENTIAL IESA COPYRIGHT
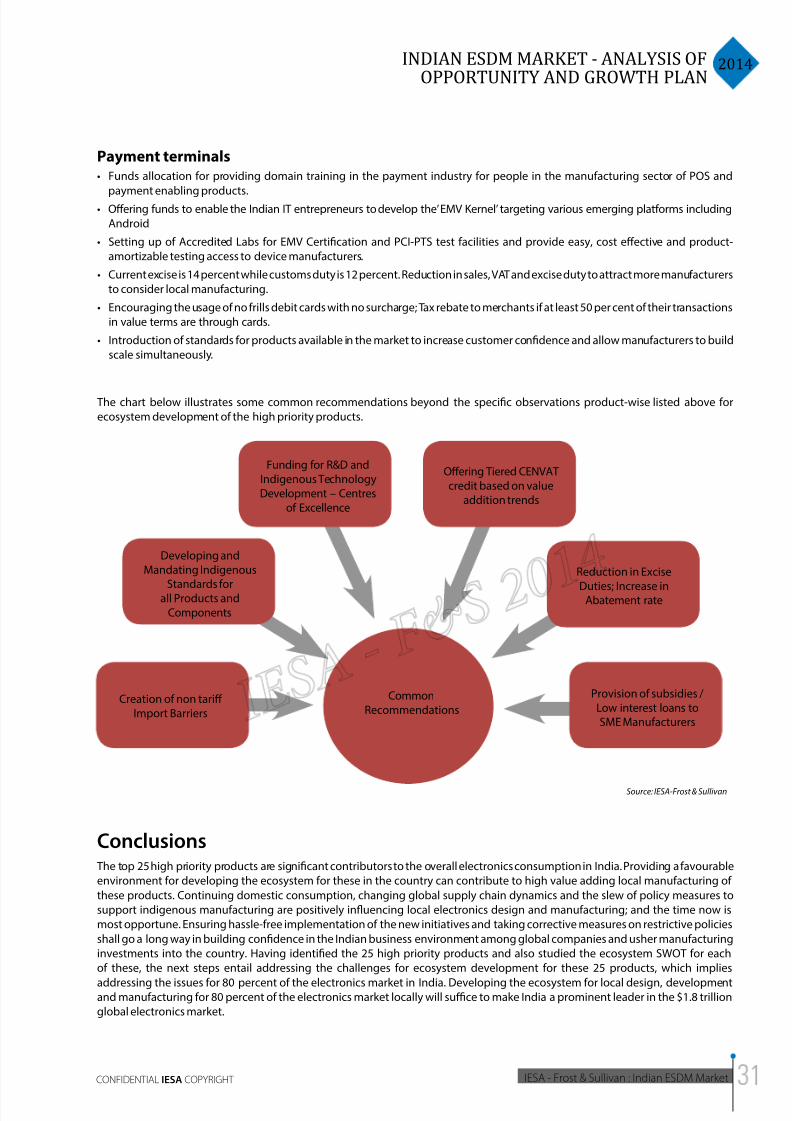
The chart below captures the key messages from the research on the ecosystem SWOT of the high priority 25 products:
Key Messages: 25 High Priority Products Ecosystem SWOT
Top 25 high priority products account for 82% of overall electronics consumption in India.
The top 5 alone account for 60% of the overall electronics consumption.
69% of local consumption of the top 25 priority products currently met through imports.
Local production to cater to the same 31% local demand in 2015 too in the absence of intervention.
Inadequate components/raw materials ecosystem, convoluted tax and duty structure, debilitating FTAs, inadequatedomestic product standards, lack of local IP, procedural hurdles in availing policy benefits are the challenges
to the ecosystem development for the priority products.
Power electronics/supply, Processor, LCD Display, Memory and PCB feature among the top 4 components
contributing to the product BoM across majority of the top 25 high priority products. Initiatives are neededto build ecosystem for these components locally.
Effective and speedy policy implementations, incentivizing component ecosystem, restructuring tax/duty structures,imposing non tariff trade barriers, developing indigenous standards are some of the measures identified to promote
ecosystem development for the high priority 25 products.
Strategic Recommendations• Aim to meet 50 percent of demand for 25 high priority products by local high value added manufacturing by 2018
• Address >20 percent of the disability cost in producing the high priority products locally by normalizing duty structure and cost of
working capital
• Provide subsidies / low interest loans to address working capital issues for SME manufacturers.
• Focus on Energy meters, 2W EMS, LED lighting, payment terminals, inverters/UPS, CFL and smart cards for the short term. Existing
moderate value addition, high demand potential,and existing indigenous IP/design capability make them viable targets.
• Focus on developing key components rather than the product itself for the following products - Mobile phones (battery/adaptor), FPD
TV (LCD panels), laptops (battery) and digital camera (battery)– products where feasibility to develop a key component is more viable
and recommended than the product itself.
• Focus on developing ecosystem for key components – PCB, Memory, Processor, LCD Displays, Power Devices and Transformers.
• Provide a single window system for quick clearance of applications under the MSIPS and EMC policies.
• Skill Development Council to focus on developing skill sets needed in the ecosystem for the 25 high priority products.
8/11/2019 IESA FS Report Indian ESDM Market
http://slidepdf.com/reader/full/iesa-fs-report-indian-esdm-market 33/172
2014INDIAN ESDM MARKET - ANALYSIS OF
OPPORTUNITY AND GROWTH PLAN
IESA - Frost & Sullivan : Indian ESDM MarketCONFIDENTIAL IESA COPYRIGHT
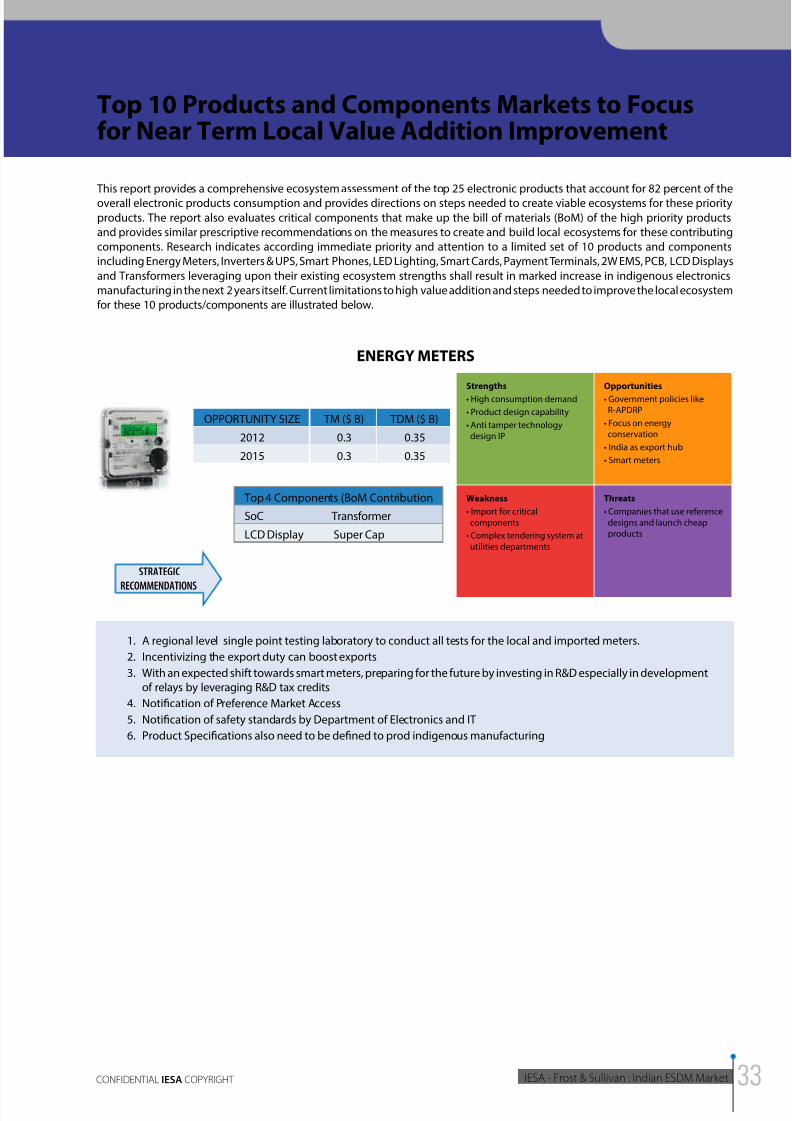
Top 10 Products and Components Markets to Focusfor Near Term Local Value Addition Improvement
This report provides a comprehensive ecosystem assessment of the top 25 electronic products that account for 82 percent of the
overall electronic products consumption and provides directions on steps needed to create viable ecosystems for these priority
products. The report also evaluates critical components that make up the bill of materials (BoM) of the high priority products
and provides similar prescriptive recommendations on the measures to create and build local ecosystems for these contributing
components. Research indicates according immediate priority and attention to a limited set of 10 products and components
including Energy Meters, Inverters & UPS, Smart Phones, LED Lighting, Smart Cards, Payment Terminals, 2W EMS, PCB, LCD Displays
and Transformers leveraging upon their existing ecosystem strengths shall result in marked increase in indigenous electronics
manufacturing in the next 2 years itself. Current limitations to high value addition and steps needed to improve the local ecosystem
for these 10 products/components are illustrated below.
1. A regional level single point testing laboratory to conduct all tests for the local and imported meters.
2. Incentivizing the export duty can boost exports
3. With an expected shift towards smart meters, preparing for the future by investing in R&D especially in developmentof relays by leveraging R&D tax credits
4. Notification of Preference Market Access
5. Notification of safety standards by Department of Electronics and IT
6. Product Specifications also need to be defined to prod indigenous manufacturing
STRATEGIC
RECOMMENDATIONS
OPPORTUNITY SIZE TM ($ B) TDM ($ B)
2012 0.3 0.35
2015 0.3 0.35
Top 4 Components (BoM Contribution
SoC Transformer
LCD Display Super Cap
ENERGY METERS
Strengths
• High consumption demand
• Product design capability
• Anti tamper technology design IP
Opportunities
• Government policies like R-APDRP
• Focus on energy conservation
• India as export hub
• Smart meters
Weakness
• Import for critical
components
• Complex tendering system at
utilities departments
Threats
• Companies that use reference
designs and launch cheapproducts
8/11/2019 IESA FS Report Indian ESDM Market
http://slidepdf.com/reader/full/iesa-fs-report-indian-esdm-market 34/172
IESA - Frost & Sullivan : Indian ESDM Market CONFIDENTIAL IESA COPYRIGHT
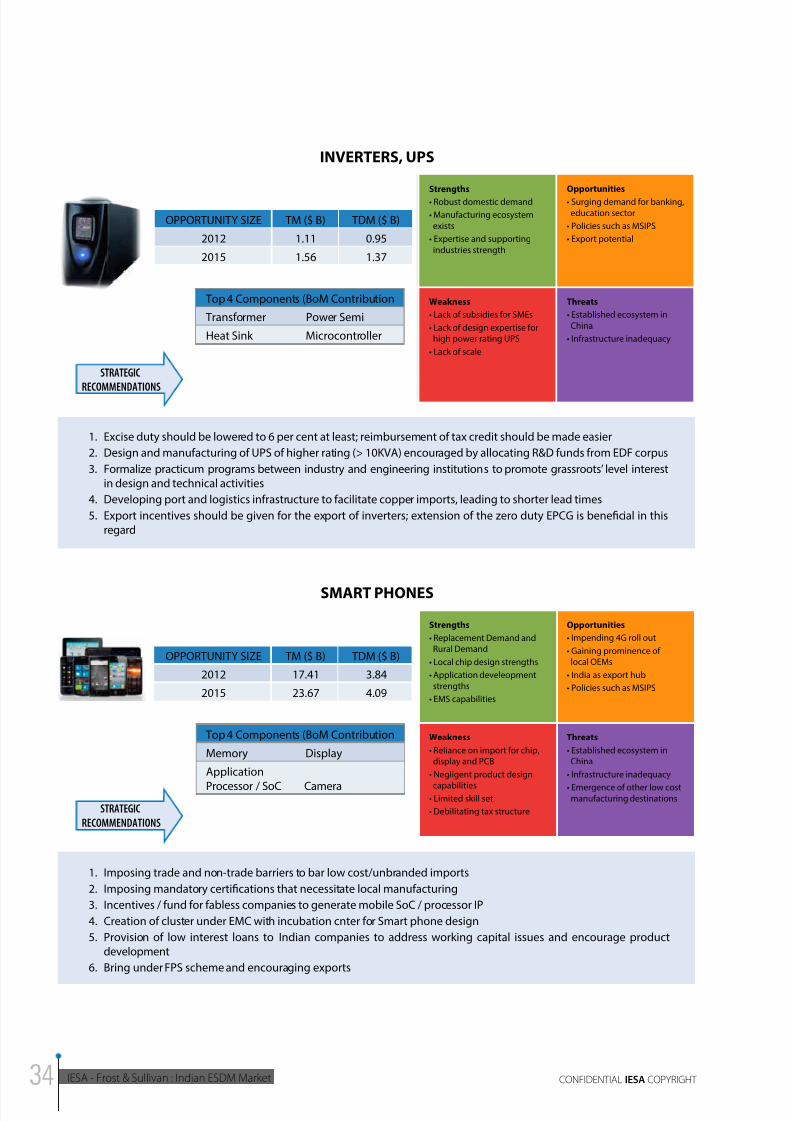
1. Excise duty should be lowered to 6 per cent at least; reimbursement of tax credit should be made easier
2. Design and manufacturing of UPS of higher rating (> 10KVA) encouraged by allocating R&D funds from EDF corpus
3. Formalize practicum programs between industry and engineering institutions to promote grassroots’ level interestin design and technical activities
4. Developing port and logistics infrastructure to facilitate copper imports, leading to shorter lead times
5. Export incentives should be given for the export of inverters; extension of the zero duty EPCG is beneficial in thisregard
1. Imposing trade and non-trade barriers to bar low cost/unbranded imports
2. Imposing mandatory certifications that necessitate local manufacturing
3. Incentives / fund for fabless companies to generate mobile SoC / processor IP
4. Creation of cluster under EMC with incubation cnter for Smart phone design
5. Provision of low interest loans to Indian companies to address working capital issues and encourage productdevelopment
6. Bring under FPS scheme and encouraging exports
STRATEGIC
RECOMMENDATIONS
STRATEGIC
RECOMMENDATIONS
OPPORTUNITY SIZE TM ($ B) TDM ($ B)
2012 1.11 0.95
2015 1.56 1.37
OPPORTUNITY SIZE TM ($ B) TDM ($ B)
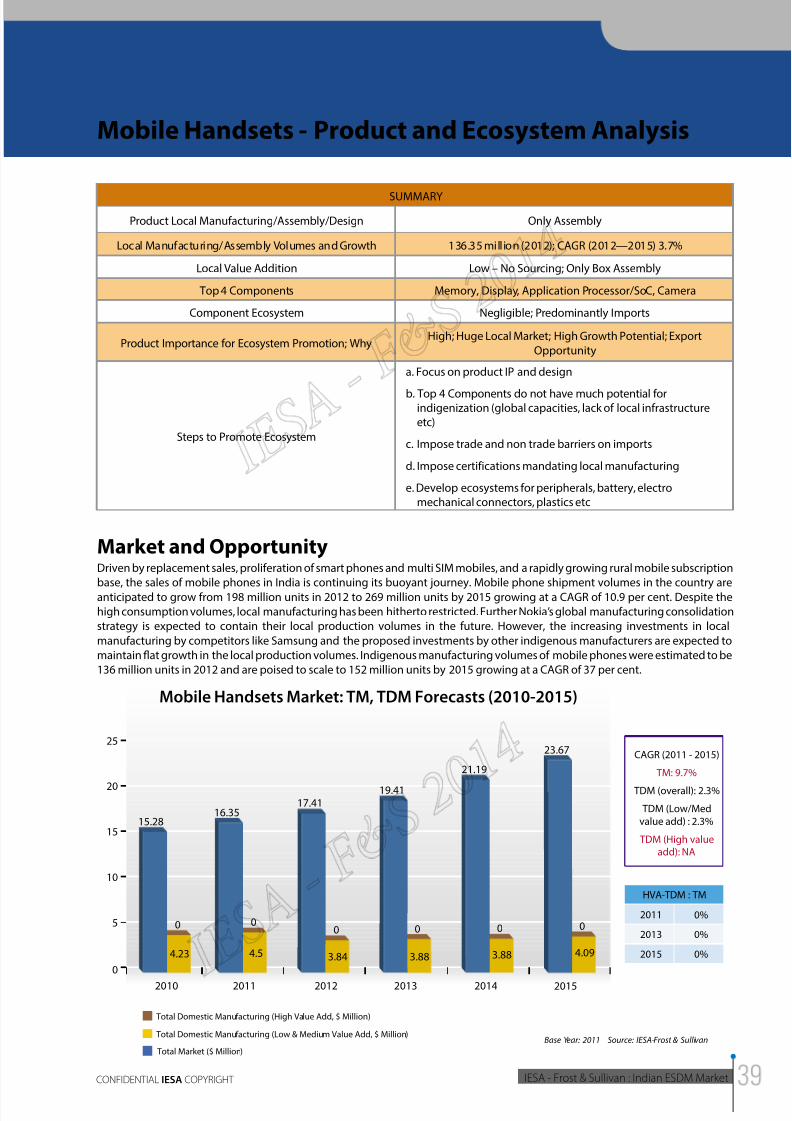
2012 17.41 3.84
2015 23.67 4.09
Top 4 Components (BoM Contribution
Transformer Power Semi
Heat Sink Microcontroller
Top 4 Components (BoM Contribution
Memory Display
Application
Processor / SoC Camera
INVERTERS, UPS
SMART PHONES
Strengths
• Robust domestic demand
• Manufacturing ecosystem
exists
• Expertise and supporting
industries strength
Opportunities
• Surging demand for banking,
education sector
• Policies such as MSIPS
• Export potential
Weakness
• Lack of subsidies for SMEs
• Lack of design expertise for high power rating UPS
• Lack of scale
Threats
• Established ecosystem in
China
• Infrastructure inadequacy
Strengths
• Replacement Demand and Rural Demand
• Local chip design strengths
• Application develeopment
strengths
• EMS capabilities
Opportunities
• Impending 4G roll out
• Gaining prominence oflocal OEMs
• India as export hub
• Policies such as MSIPS
Weakness
• Reliance on import for chip, display and PCB
• Negligent product design
capabilities• Limited skill set
• Debilitating tax structure
Threats
• Established ecosystem in China
• Infrastructure inadequacy
• Emergence of other low cost manufacturing destinations
8/11/2019 IESA FS Report Indian ESDM Market
http://slidepdf.com/reader/full/iesa-fs-report-indian-esdm-market 35/172
2014INDIAN ESDM MARKET - ANALYSIS OF
OPPORTUNITY AND GROWTH PLAN
IESA - Frost & Sullivan : Indian ESDM MarketCONFIDENTIAL IESA COPYRIGHT
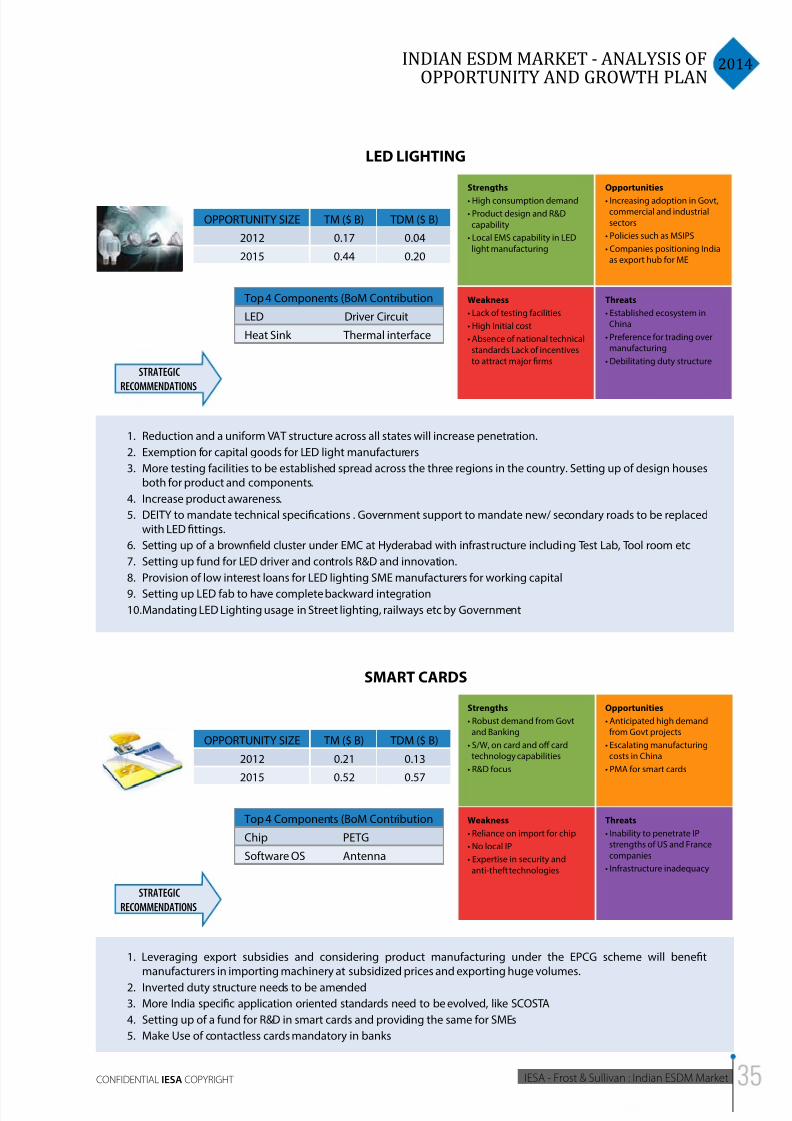
1. Reduction and a uniform VAT structure across all states will increase penetration.
2. Exemption for capital goods for LED light manufacturers
3. More testing facilities to be established spread across the three regions in the country. Setting up of design housesboth for product and components.
4. Increase product awareness.
5. DEITY to mandate technical specifications . Government support to mandate new/ secondary roads to be replacedwith LED fittings.
6. Setting up of a brownfield cluster under EMC at Hyderabad with infrastructure including Test Lab, Tool room etc
7. Setting up fund for LED driver and controls R&D and innovation.
8. Provision of low interest loans for LED lighting SME manufacturers for working capital
9. Setting up LED fab to have complete backward integration
10. Mandating LED Lighting usage in Street lighting, railways etc by Government
STRATEGIC
RECOMMENDATIONS
OPPORTUNITY SIZE TM ($ B) TDM ($ B)
2012 0.17 0.04
2015 0.44 0.20
Top 4 Components (BoM Contribution
LED Driver Circuit
Heat Sink Thermal interface
LED LIGHTING
Strengths
• High consumption demand
• Product design and R&D
capability
• Local EMS capability in LED
light manufacturing
Opportunities
• Increasing adoption in Govt, commercial and industrial
sectors
• Policies such as MSIPS
• Companies positioning India as export hub for ME
Weakness
• Lack of testing facilities
• High Initial cost
• Absence of national technical
standards Lack of incentives
to attract major firms
Threats
• Established ecosystem in China
• Preference for trading over manufacturing
• Debilitating duty structure
1. Leveraging export subsidies and considering product manufacturing under the EPCG scheme will benefitmanufacturers in importing machinery at subsidized prices and exporting huge volumes.
2. Inverted duty structure needs to be amended
3. More India specific application oriented standards need to be evolved, like SCOSTA
4. Setting up of a fund for R&D in smart cards and providing the same for SMEs
5. Make Use of contactless cards mandatory in banks
STRATEGIC
RECOMMENDATIONS
OPPORTUNITY SIZE TM ($ B) TDM ($ B)
2012 0.21 0.13
2015 0.52 0.57
Top 4 Components (BoM Contribution
Chip PETG
Software OS Antenna
SMART CARDS
Strengths
• Robust demand from Govt and Banking
• S/W, on card and o card technology capabilities
• R&D focus
Opportunities
• Anticipated high demand from Govt projects
• Escalating manufacturing costs in China
• PMA for smart cards
Weakness
• Reliance on import for chip
• No local IP
• Expertise in security and
anti-theft technologies
Threats
• Inability to penetrate IP strengths of US and France
companies
• Infrastructure inadequacy
8/11/2019 IESA FS Report Indian ESDM Market
http://slidepdf.com/reader/full/iesa-fs-report-indian-esdm-market 36/172
IESA - Frost & Sullivan : Indian ESDM Market CONFIDENTIAL IESA COPYRIGHT
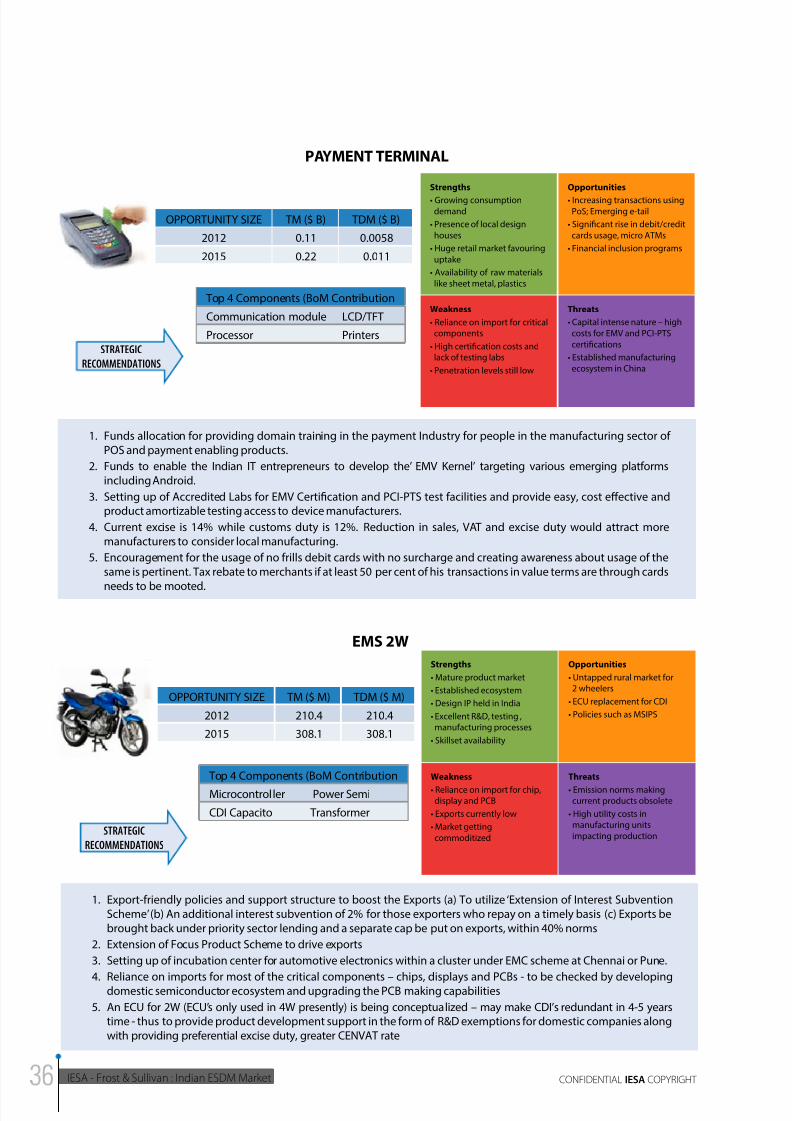
1. Funds allocation for providing domain training in the payment Industry for people in the manufacturing sector ofPOS and payment enabling products.
2. Funds to enable the Indian IT entrepreneurs to develop the’ EMV Kernel’ targeting various emerging platformsincluding Android.
3. Setting up of Accredited Labs for EMV Certification and PCI-PTS test facilities and provide easy, cost effective andproduct amortizable testing access to device manufacturers.
4. Current excise is 14% while customs duty is 12%. Reduction in sales, VAT and excise duty would attract moremanufacturers to consider local manufacturing.
5. Encouragement for the usage of no frills debit cards with no surcharge and creating awareness about usage of thesame is pertinent. Tax rebate to merchants if at least 50 per cent of his transactions in value terms are through cards
needs to be mooted.
STRATEGIC
RECOMMENDATIONS
OPPORTUNITY SIZE TM ($ B) TDM ($ B)
2012 0.11 0.0058
2015 0.22 0.011
Top 4 Components (BoM Contribution
Communication module LCD/TFT
Processor Printers
PAYMENT TERMINAL
Strengths
• Growing consumption
demand
• Presence of local design
houses
• Huge retail market favouring
uptake
• Availability of raw materials
like sheet metal, plastics
Opportunities
• Increasing transactions using
PoS; Emerging e-tail
• Signicant rise in debit/credit
cards usage, micro ATMs
• Financial inclusion programs
Weakness
• Reliance on import for critical components
• High certication costs and lack of testing labs
• Penetration levels still low
Threats
• Capital intense nature – high
costs for EMV and PCI-PTS
certifications
• Established manufacturing
ecosystem in China
1. Export-friendly policies and support structure to boost the Exports (a) To utilize ‘Extension of Interest SubventionScheme’ (b) An additional interest subvention of 2% for those exporters who repay on a timely basis (c) Exports bebrought back under priority sector lending and a separate cap be put on exports, within 40% norms
2. Extension of Focus Product Scheme to drive exports
3. Setting up of incubation center for automotive electronics within a cluster under EMC scheme at Chennai or Pune.
4. Reliance on imports for most of the critical components – chips, displays and PCBs - to be checked by developingdomestic semiconductor ecosystem and upgrading the PCB making capabilities
5. An ECU for 2W (ECU’s only used in 4W presently) is being conceptualized – may make CDI’s redundant in 4-5 yearstime - thus to provide product development support in the form of R&D exemptions for domestic companies alongwith providing preferential excise duty, greater CENVAT rate
STRATEGIC
RECOMMENDATIONS
OPPORTUNITY SIZE TM ($ M) TDM ($ M)
2012 210.4 210.4
2015 308.1 308.1
Top 4 Components (BoM Contribution
Microcontroller Power Semi
CDI Capacito Transformer
EMS 2W
Strengths
• Mature product market
• Established ecosystem
• Design IP held in India
• Excellent R&D, testing ,manufacturing processes
• Skillset availability
Opportunities
• Untapped rural market for2 wheelers
• ECU replacement for CDI
• Policies such as MSIPS
Weakness
• Reliance on import for chip, display and PCB
• Exports currently low
• Market getting
commoditized
Threats
• Emission norms making current products obsolete
• High utility costs in manufacturing units
impacting production
8/11/2019 IESA FS Report Indian ESDM Market
http://slidepdf.com/reader/full/iesa-fs-report-indian-esdm-market 37/172
8/11/2019 IESA FS Report Indian ESDM Market
http://slidepdf.com/reader/full/iesa-fs-report-indian-esdm-market 38/172
IESA - Frost & Sullivan : Indian ESDM Market CONFIDENTIAL IESA COPYRIGHT
Common Conclusions for the Near Term Focus Products/Components
Indian electronics industry has over the years grown in stature for its inherent strengths in fundamental R&D and consumption. The
missing link to the industry triangle is manufacturing. India’s electronics manufacturing has remained in obscurity due to multiple
reasons including scale impediments, infrastructural inadequacy, absence of large scale manufacturing ecosystems, proactive IP
orientation as well as debilitating tax and duty regimes. Recent policy initiatives to offset these disabilities clearly indicate the
identification of electronics manufacturing as a priority sector. Electronics manufacturing gains significance in that it can help
bridge a rapidly burgeoning trade imbalance while also create enormous employment opportunities for the skilled, semi-skilled
and unskilled labourers. From a strategic lens, it thus becomes prudent to evaluate Indian electronics manufacturing deficiencies
and develop capabilities that address the shortcomings as also strategize the short, medium and long term development plan for
promoting local electronics manufacturing ecosystem.
Key drivers for making India a globally attractive electronics manufacturing destination include competent costs, talent abundance,
quality focus, world-class infrastructure and business friendly environment. Of these, efforts have already been taken to improve
the country’s infrastructure apart from moderate initiatives in quality enhancement and skill set development that needs continued
acceleration. It becomes pertinent for newer policy measures to address/offer:
• Subsidies and/or tax and duty restructuring to alleviate the cost dierential arising from higher logistics cost and highertransformation cost
• Inclusion of Focus Product Scheme for select priority products in eorts to promote exports and extension of the scheme to all
EHTPs/SEZs
• Encouragement for R&D and IP generation through fund allocation and setting up of incubation centres within the EMC scheme
clusters with sector focus
• Setting up of Incubation Centres for Industry Verticals; priority products like Smart Energy Meters, Inverters & UPS, CFL, LED
Lighting and Energy Ecient products to be the areas of focus for these centres
• Provision of viability gap funding (VGF) for the priority products and components to be explored and implemented.
• Resolution of working capital issue through provision of low interest/special loans; Encouragement to nancial institutions to
offer the same by declaring electronics as a priority sector
• Simplication of processes involved in availing policy benets as well as processes involved in setting up and functioning of
businesses – creation of business friendly socio-political environment
8/11/2019 IESA FS Report Indian ESDM Market
http://slidepdf.com/reader/full/iesa-fs-report-indian-esdm-market 39/172
2014INDIAN ESDM MARKET - ANALYSIS OF
OPPORTUNITY AND GROWTH PLAN
IESA - Frost & Sullivan : Indian ESDM MarketCONFIDENTIAL IESA COPYRIGHT
SUMMARY
Product Local Manufacturing/Assembly/Design Only Assembly
Local Manufacturing/Assembly Volumes and Growth 136.35 million (2012); CAGR (2012—2015) 3.7%
Local Value Addition Low – No Sourcing; Only Box Assembly
Top 4 Components Memory, Display, Application Processor/SoC, Camera
Component Ecosystem Negligible; Predominantly Imports
Product Importance for Ecosystem Promotion; WhyHigh; Huge Local Market; High Growth Potential; Export
Opportunity
Steps to Promote Ecosystem
a. Focus on product IP and design
b. Top 4 Components do not have much potential forindigenization (global capacities, lack of local infrastructureetc)
c. Impose trade and non trade barriers on imports
d. Impose certifications mandating local manufacturing
e. Develop ecosystems for peripherals, battery, electromechanical connectors, plastics etc
Mobile Handsets - Product and Ecosystem Analysis
Market and OpportunityDriven by replacement sales, proliferation of smart phones and multi SIM mobiles, and a rapidly growing rural mobile subscription
base, the sales of mobile phones in India is continuing its buoyant journey. Mobile phone shipment volumes in the country are
anticipated to grow from 198 million units in 2012 to 269 million units by 2015 growing at a CAGR of 10.9 per cent. Despite the
high consumption volumes, local manufacturing has been hitherto restricted. Further Nokia’s global manufacturing consolidation
strategy is expected to contain their local production volumes in the future. However, the increasing investments in local
manufacturing by competitors like Samsung and the proposed investments by other indigenous manufacturers are expected to
maintain flat growth in the local production volumes. Indigenous manufacturing volumes of mobile phones were estimated to be
136 million units in 2012 and are poised to scale to 152 million units by 2015 growing at a CAGR of 37 per cent.
23.67
0
0
5
10
15
20
25
20112010 2012 2013 2014 2015
Mobile Handsets Market: TM, TDM Forecasts (2010-2015)
HVA-TDM : TM
2011
2013
2015
0%
0%
0%
Total Market ($ Million)
Total Domestic Manufacturing (High Value Add, $ Million)
Total Domestic Manufacturing (Low & Medium Value Add, $ Million)Base Year: 2011 Source: IESA-Frost & Sullivan
CAGR (2011 - 2015)
TM: 9.7%
TDM (overall): 2.3%
TDM (Low/Med
value add) : 2.3%
TDM (High valueadd): NA
4.09
0
21.19
19.41
0
3.88
17.41
00
16.35
0
15.28
4.23 4.5 3.84 3.88
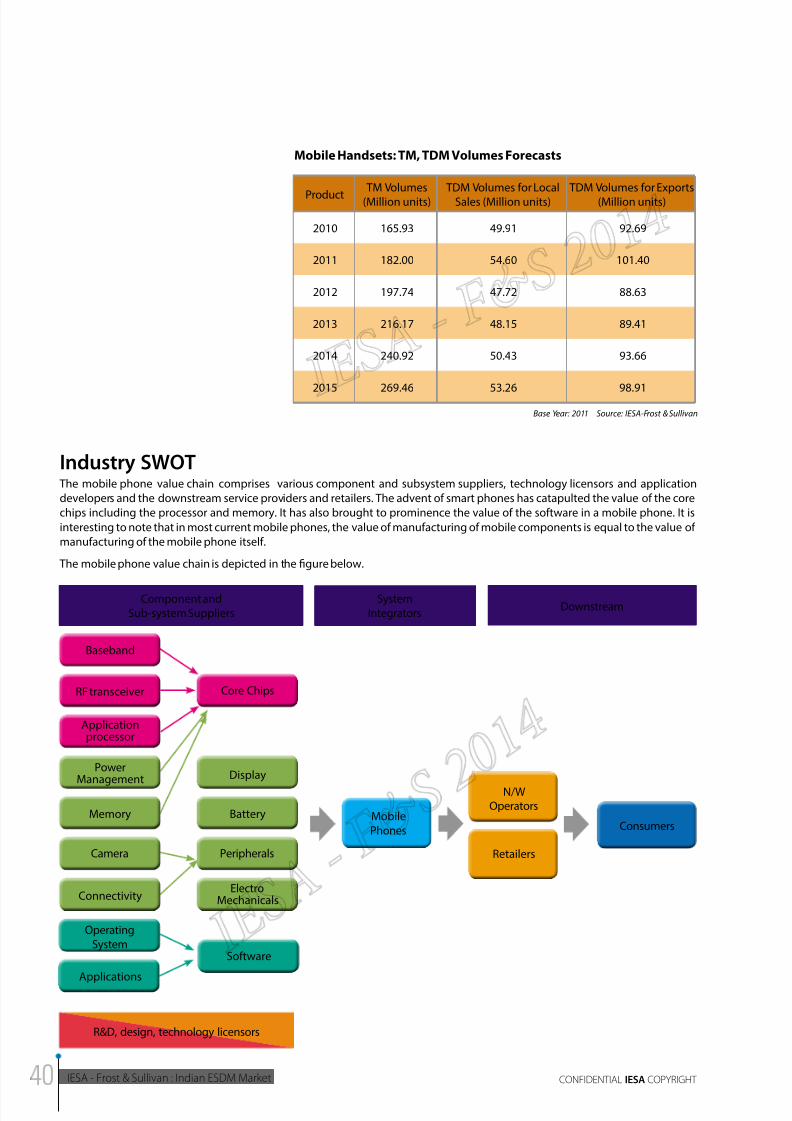
8/11/2019 IESA FS Report Indian ESDM Market
http://slidepdf.com/reader/full/iesa-fs-report-indian-esdm-market 40/172
IESA - Frost & Sullivan : Indian ESDM Market CONFIDENTIAL IESA COPYRIGHT
Mobile Handsets: TM, TDM Volumes Forecasts
Product TM Volumes(Million units)
TDM Volumes for LocalSales (Million units)
TDM Volumes for Exports(Million units)
2010 165.93 49.91 92.69
2011 182.00 54.60 101.40
2012 197.74 47.72 88.63
2013 216.17 48.15 89.41
2014 240.92 50.43 93.66
2015 269.46 53.26 98.91
Base Year: 2011 Source: IESA-Frost & Sullivan
Industry SWOT The mobile phone value chain comprises various component and subsystem suppliers, technology licensors and application
developers and the downstream service providers and retailers. The advent of smart phones has catapulted the value of the core
chips including the processor and memory. It has also brought to prominence the value of the software in a mobile phone. It is
interesting to note that in most current mobile phones, the value of manufacturing of mobile components is equal to the value of
manufacturing of the mobile phone itself.
The mobile phone value chain is depicted in the figure below.
Component andSub-system Suppliers
Baseband
RF transceiver Core Chips
N/WOperators
Consumers
Retailers
Software
Applicationprocessor
PowerManagement
Memory
Camera
Connectivity
Display
Battery
Peripherals
ElectroMechanicals
OperatingSystem
Applications
SystemIntegrators
Downstream
R&D, design, technology licensors
MobilePhones
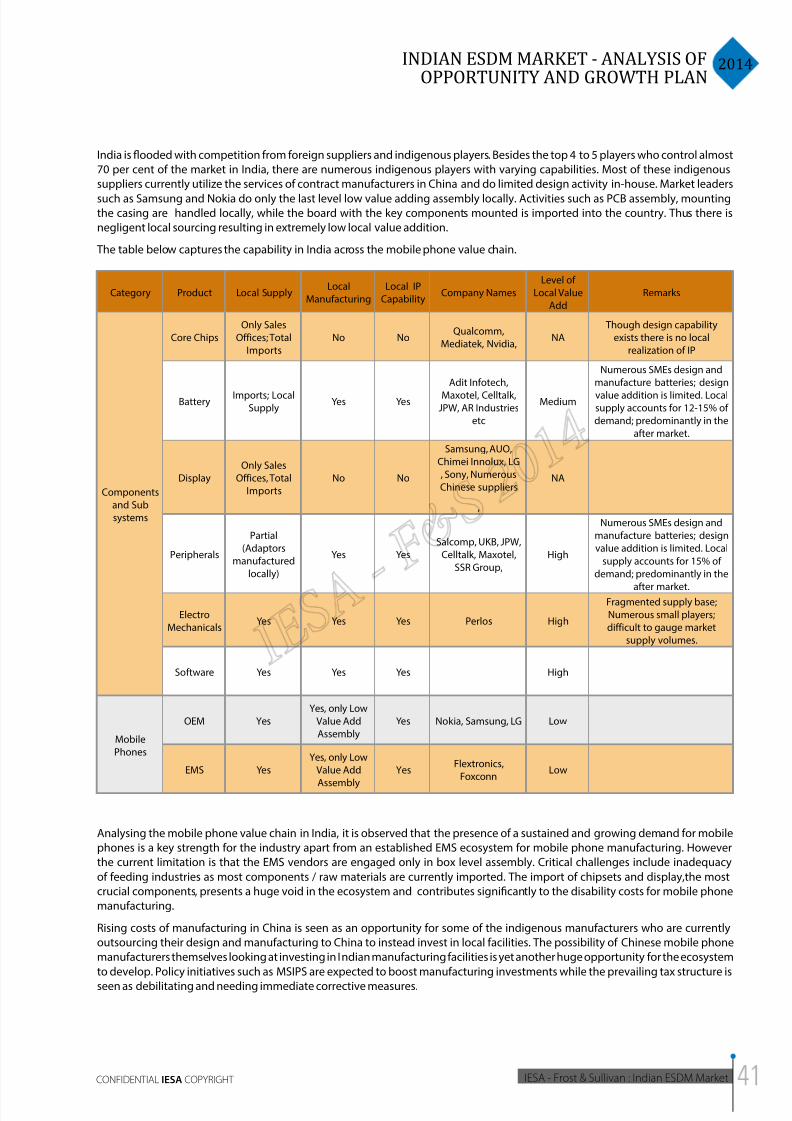
8/11/2019 IESA FS Report Indian ESDM Market
http://slidepdf.com/reader/full/iesa-fs-report-indian-esdm-market 41/172
2014INDIAN ESDM MARKET - ANALYSIS OF
OPPORTUNITY AND GROWTH PLAN
IESA - Frost & Sullivan : Indian ESDM MarketCONFIDENTIAL IESA COPYRIGHT
India is flooded with competition from foreign suppliers and indigenous players. Besides the top 4 to 5 players who control almost
70 per cent of the market in India, there are numerous indigenous players with varying capabilities. Most of these indigenous
suppliers currently utilize the services of contract manufacturers in China and do limited design activity in-house. Market leaders
such as Samsung and Nokia do only the last level low value adding assembly locally. Activities such as PCB assembly, mountingthe casing are handled locally, while the board with the key components mounted is imported into the country. Thus there is
negligent local sourcing resulting in extremely low local value addition.
The table below captures the capability in India across the mobile phone value chain.
Category Product Local SupplyLocal
Manufacturing
Local IP
CapabilityCompany Names
Level of
Local Value
Add
Remarks
Components
and Sub
systems
Core Chips
Only Sales
Offices; Total
Imports
No NoQualcomm,
Mediatek, Nvidia,NA
Though design capability
exists there is no local
realization of IP
Battery Imports; LocalSupply
Yes Yes
Adit Infotech,
Maxotel, Celltalk,JPW, AR Industries
etc
Medium
Numerous SMEs design and
manufacture batteries; design
value addition is limited. Localsupply accounts for 12-15% of
demand; predominantly in the
after market.
Display
Only Sales
Offices, Total
Imports
No No
Samsung, AUO,
Chimei Innolux, LG
, Sony, Numerous
Chinese suppliers
,
NA
Peripherals
Partial
(Adaptors
manufactured
locally)
Yes Yes
Salcomp, UKB, JPW,
Celltalk, Maxotel,
SSR Group,
High
Numerous SMEs design and
manufacture batteries; design
value addition is limited. Local
supply accounts for 15% of
demand; predominantly in the
after market.
Electro
MechanicalsYes Yes Yes Perlos High
Fragmented supply base;
Numerous small players;
difficult to gauge market
supply volumes.
Software Yes Yes Yes High
Mobile
Phones
OEM Yes
Yes, only Low
Value Add
Assembly
Yes Nokia, Samsung, LG Low
EMS Yes
Yes, only Low
Value Add
Assembly
YesFlextronics,
FoxconnLow
Analysing the mobile phone value chain in India, it is observed that the presence of a sustained and growing demand for mobile
phones is a key strength for the industry apart from an established EMS ecosystem for mobile phone manufacturing. However
the current limitation is that the EMS vendors are engaged only in box level assembly. Critical challenges include inadequacy
of feeding industries as most components / raw materials are currently imported. The import of chipsets and display,the most
crucial components, presents a huge void in the ecosystem and contributes significantly to the disability costs for mobile phone
manufacturing.
Rising costs of manufacturing in China is seen as an opportunity for some of the indigenous manufacturers who are currently
outsourcing their design and manufacturing to China to instead invest in local facilities. The possibility of Chinese mobile phone
manufacturers themselves looking at investing in Indian manufacturing facilities is yet another huge opportunity for the ecosystem
to develop. Policy initiatives such as MSIPS are expected to boost manufacturing investments while the prevailing tax structure is
seen as debilitating and needing immediate corrective measures.
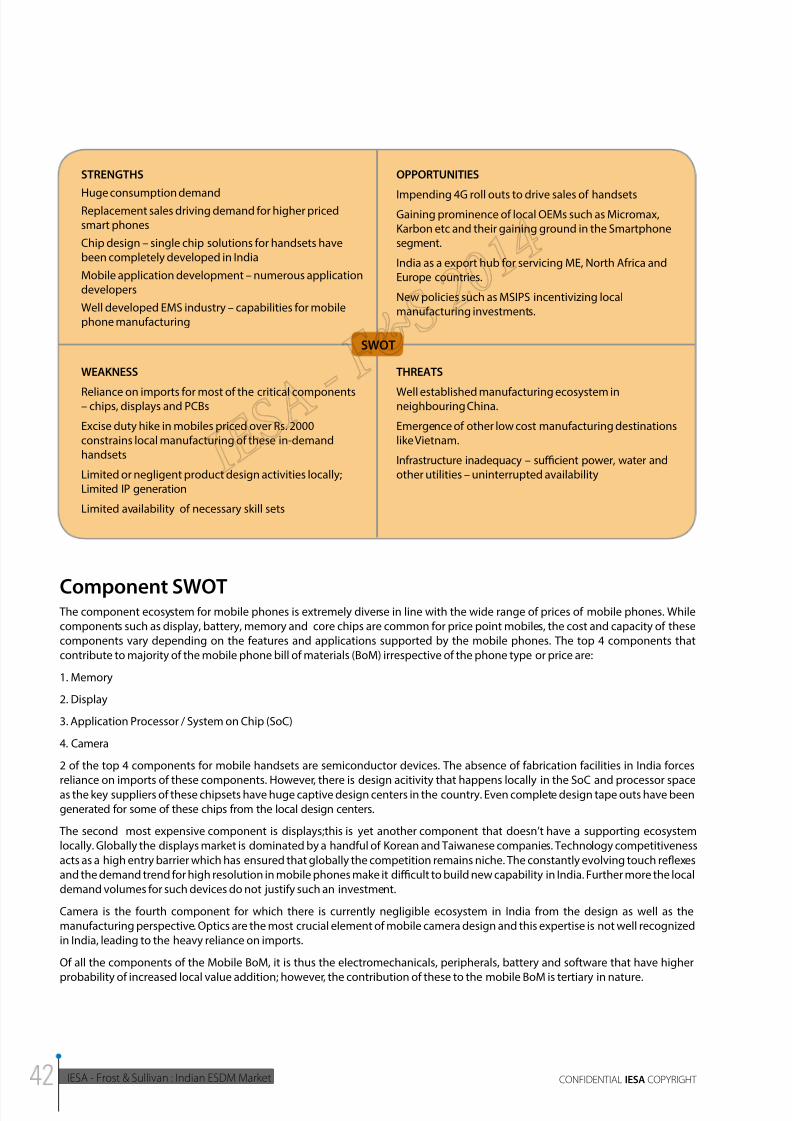
8/11/2019 IESA FS Report Indian ESDM Market
http://slidepdf.com/reader/full/iesa-fs-report-indian-esdm-market 42/172
IESA - Frost & Sullivan : Indian ESDM Market CONFIDENTIAL IESA COPYRIGHT
STRENGTHS
Huge consumption demandReplacement sales driving demand for higher pricedsmart phones
Chip design – single chip solutions for handsets havebeen completely developed in India
Mobile application development – numerous applicationdevelopers
Well developed EMS industry – capabilities for mobilephone manufacturing
OPPORTUNITIES
Impending 4G roll outs to drive sales of handsetsGaining prominence of local OEMs such as Micromax,Karbon etc and their gaining ground in the Smartphonesegment.
India as a export hub for servicing ME, North Africa andEurope countries.
New policies such as MSIPS incentivizing localmanufacturing investments.
WEAKNESS
Reliance on imports for most of the critical components– chips, displays and PCBs
Excise duty hike in mobiles priced over Rs. 2000constrains local manufacturing of these in-demandhandsets
Limited or negligent product design activities locally;Limited IP generation
Limited availability of necessary skill sets
THREATS
Well established manufacturing ecosystem inneighbouring China.
Emergence of other low cost manufacturing destinationslike Vietnam.
Infrastructure inadequacy – sucient power, water andother utilities – uninterrupted availability
SWOT
Component SWOT The component ecosystem for mobile phones is extremely diverse in line with the wide range of prices of mobile phones. While
components such as display, battery, memory and core chips are common for price point mobiles, the cost and capacity of these
components vary depending on the features and applications supported by the mobile phones. The top 4 components that
contribute to majority of the mobile phone bill of materials (BoM) irrespective of the phone type or price are:
1. Memory
2. Display
3. Application Processor / System on Chip (SoC)
4. Camera
2 of the top 4 components for mobile handsets are semiconductor devices. The absence of fabrication facilities in India forces
reliance on imports of these components. However, there is design acitivity that happens locally in the SoC and processor spaceas the key suppliers of these chipsets have huge captive design centers in the country. Even complete design tape outs have been
generated for some of these chips from the local design centers.
The second most expensive component is displays;this is yet another component that doesn’t have a supporting ecosystem
locally. Globally the displays market is dominated by a handful of Korean and Taiwanese companies. Technology competitiveness
acts as a high entry barrier which has ensured that globally the competition remains niche. The constantly evolving touch reflexes
and the demand trend for high resolution in mobile phones make it dicult to build new capability in India. Further more the local
demand volumes for such devices do not justify such an investment.
Camera is the fourth component for which there is currently negligible ecosystem in India from the design as well as the
manufacturing perspective. Optics are the most crucial element of mobile camera design and this expertise is not well recognized
in India, leading to the heavy reliance on imports.
Of all the components of the Mobile BoM, it is thus the electromechanicals, peripherals, battery and software that have higher
probability of increased local value addition; however, the contribution of these to the mobile BoM is tertiary in nature.
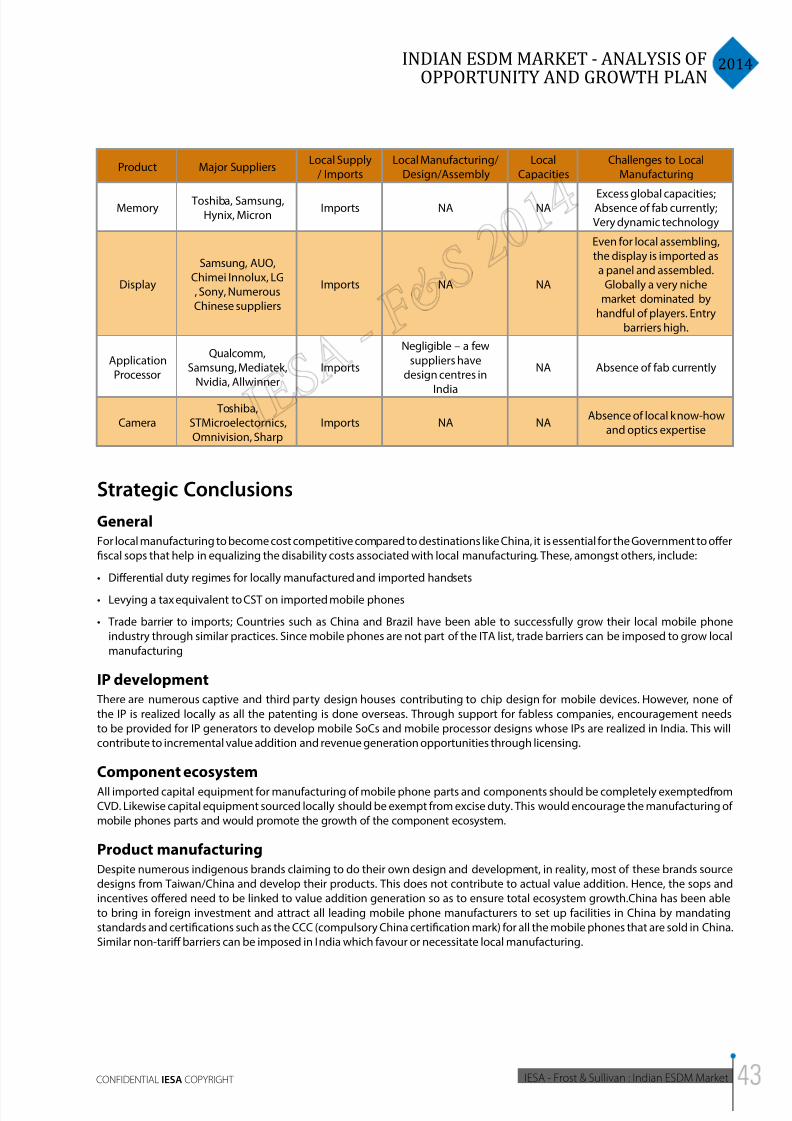
8/11/2019 IESA FS Report Indian ESDM Market
http://slidepdf.com/reader/full/iesa-fs-report-indian-esdm-market 43/172
2014INDIAN ESDM MARKET - ANALYSIS OF
OPPORTUNITY AND GROWTH PLAN
IESA - Frost & Sullivan : Indian ESDM MarketCONFIDENTIAL IESA COPYRIGHT
Product Major SuppliersLocal Supply
/ ImportsLocal Manufacturing/
Design/AssemblyLocal
CapacitiesChallenges to Local
Manufacturing
Memory Toshiba, Samsung,
Hynix, MicronImports NA NA
Excess global capacities;Absence of fab currently;Very dynamic technology
Display
Samsung, AUO,Chimei Innolux, LG, Sony, NumerousChinese suppliers
Imports NA NA
Even for local assembling,the display is imported as
a panel and assembled.Globally a very niche
market dominated by
handful of players. Entrybarriers high.
ApplicationProcessor
Qualcomm,Samsung, Mediatek,
Nvidia, AllwinnerImports
Negligible – a few
suppliers havedesign centres in
India
NA Absence of fab currently
Camera Toshiba,
STMicroelectornics,Omnivision, Sharp
Imports NA NAAbsence of local know-how
and optics expertise
Strategic Conclusions
GeneralFor local manufacturing to become cost competitive compared to destinations like China, it is essential for the Government to offer
fiscal sops that help in equalizing the disability costs associated with local manufacturing. These, amongst others, include:
• Dierential duty regimes for locally manufactured and imported handsets
• Levying a tax equivalent to CST on imported mobile phones
• Trade barrier to imports; Countries such as China and Brazil have been able to successfully grow their local mobile phone
industry through similar practices. Since mobile phones are not part of the ITA list, trade barriers can be imposed to grow local
manufacturing
IP development There are numerous captive and third party design houses contributing to chip design for mobile devices. However, none of
the IP is realized locally as all the patenting is done overseas. Through support for fabless companies, encouragement needs
to be provided for IP generators to develop mobile SoCs and mobile processor designs whose IPs are realized in India. This will
contribute to incremental value addition and revenue generation opportunities through licensing.
Component ecosystemAll imported capital equipment for manufacturing of mobile phone parts and components should be completely exemptedfrom
CVD. Likewise capital equipment sourced locally should be exempt from excise duty. This would encourage the manufacturing of
mobile phones parts and would promote the growth of the component ecosystem.
Product manufacturingDespite numerous indigenous brands claiming to do their own design and development, in reality, most of these brands source
designs from Taiwan/China and develop their products. This does not contribute to actual value addition. Hence, the sops and
incentives offered need to be linked to value addition generation so as to ensure total ecosystem growth.China has been able
to bring in foreign investment and attract all leading mobile phone manufacturers to set up facilities in China by mandating
standards and certifications such as the CCC (compulsory China certification mark) for all the mobile phones that are sold in China.
Similar non-tariff barriers can be imposed in India which favour or necessitate local manufacturing.
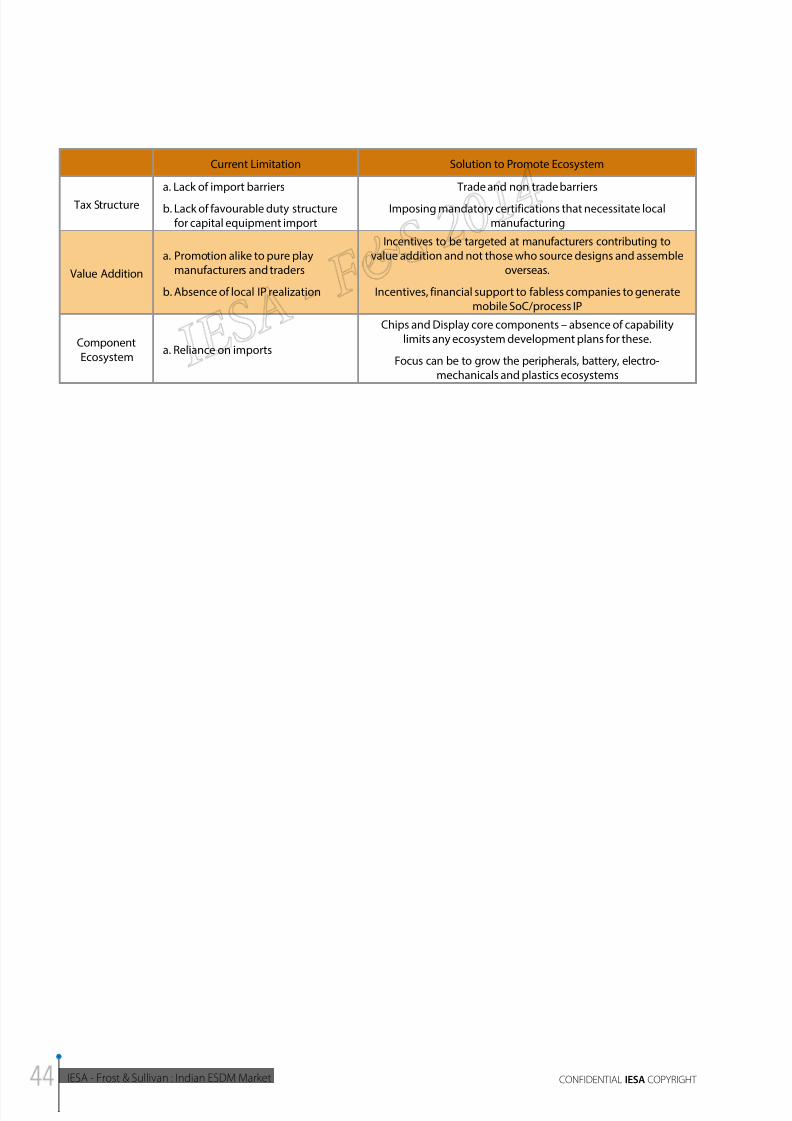
8/11/2019 IESA FS Report Indian ESDM Market
http://slidepdf.com/reader/full/iesa-fs-report-indian-esdm-market 44/172
IESA - Frost & Sullivan : Indian ESDM Market CONFIDENTIAL IESA COPYRIGHT
Current Limitation Solution to Promote Ecosystem
Tax Structure
a. Lack of import barriers
b. Lack of favourable duty structurefor capital equipment import
Trade and non trade barriers
Imposing mandatory certifications that necessitate localmanufacturing
Value Addition
a. Promotion alike to pure playmanufacturers and traders
b. Absence of local IP realization
Incentives to be targeted at manufacturers contributing tovalue addition and not those who source designs and assemble
overseas.
Incentives, financial support to fabless companies to generatemobile SoC/process IP
Component
Ecosystema. Reliance on imports
Chips and Display core components – absence of capabilitylimits any ecosystem development plans for these.
Focus can be to grow the peripherals, battery, electro-mechanicals and plastics ecosystems
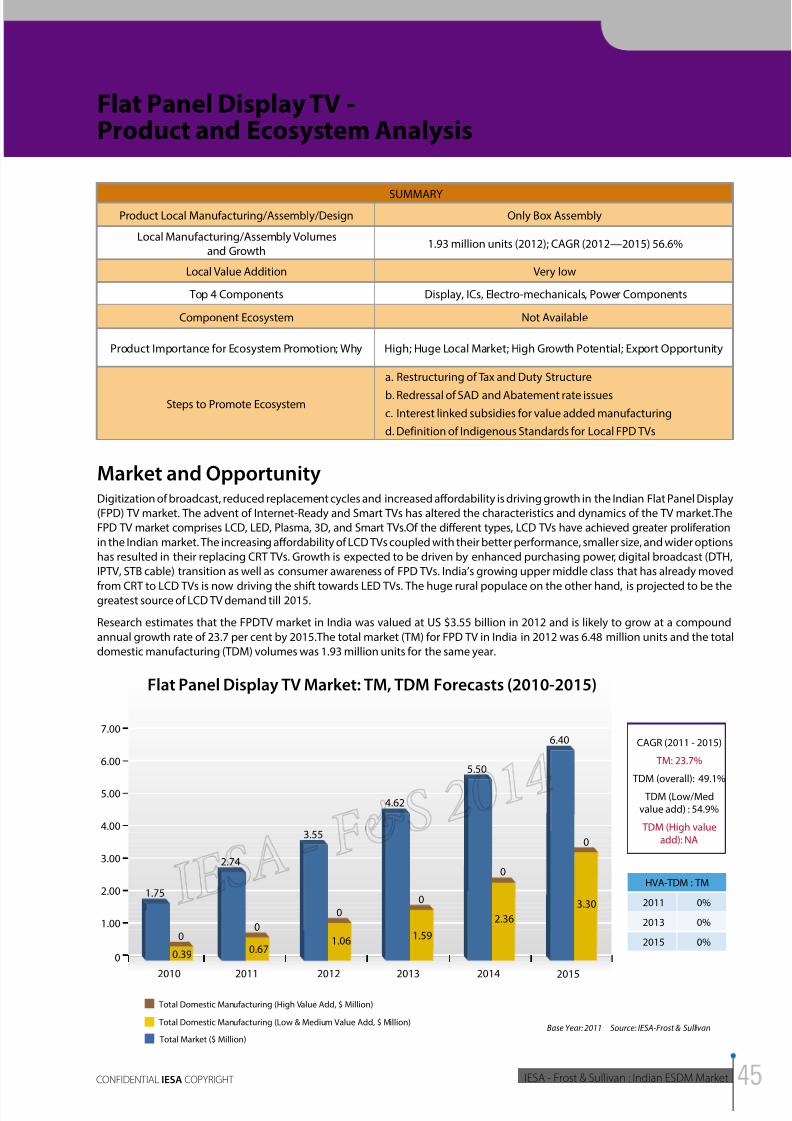
8/11/2019 IESA FS Report Indian ESDM Market
http://slidepdf.com/reader/full/iesa-fs-report-indian-esdm-market 45/172
2014INDIAN ESDM MARKET - ANALYSIS OF
OPPORTUNITY AND GROWTH PLAN
IESA - Frost & Sullivan : Indian ESDM MarketCONFIDENTIAL IESA COPYRIGHT
Flat Panel Display TV -Product and Ecosystem Analysis
SUMMARYProduct Local Manufacturing/Assembly/Design Only Box Assembly
Local Manufacturing/Assembly Volumesand Growth
1.93 million units (2012); CAGR (2012—2015) 56.6%
Local Value Addition Very low
Top 4 Components Display, ICs, Electro-mechanicals, Power Components
Component Ecosystem Not Available
Product Importance for Ecosystem Promotion; Why High; Huge Local Market; High Growth Potential; Export Opportunity
Steps to Promote Ecosystem
a. Restructuring of Tax and Duty Structure
b. Redressal of SAD and Abatement rate issues
c. Interest linked subsidies for value added manufacturing
d. Definition of Indigenous Standards for Local FPD TVs
Market and OpportunityDigitization of broadcast, reduced replacement cycles and increased affordability is driving growth in the Indian Flat Panel Display
(FPD) TV market. The advent of Internet-Ready and Smart TVs has altered the characteristics and dynamics of the TV market.The
FPD TV market comprises LCD, LED, Plasma, 3D, and Smart TVs.Of the different types, LCD TVs have achieved greater proliferation
in the Indian market. The increasing affordability of LCD TVs coupled with their better performance, smaller size, and wider options
has resulted in their replacing CRT TVs. Growth is expected to be driven by enhanced purchasing power, digital broadcast (DTH,
IPTV, STB cable) transition as well as consumer awareness of FPD TVs. India’s growing upper middle class that has already moved
from CRT to LCD TVs is now driving the shift towards LED TVs. The huge rural populace on the other hand, is projected to be thegreatest source of LCD TV demand till 2015.
Research estimates that the FPDTV market in India was valued at US $3.55 billion in 2012 and is likely to grow at a compound
annual growth rate of 23.7 per cent by 2015.The total market (TM) for FPD TV in India in 2012 was 6.48 million units and the total
domestic manufacturing (TDM) volumes was 1.93 million units for the same year.
6.40
0
0
1.00
3.00
2.00
5.00
4.00
7.00
6.00
20112010 2012 2013 2014 2015
Flat Panel Display TV Market: TM, TDM Forecasts (2010-2015)
HVA-TDM : TM
2011
2013
2015
0%
0%
0%
Total Market ($ Million)
Total Domestic Manufacturing (High Value Add, $ Million)
Total Domestic Manufacturing (Low & Medium Value Add, $ Million)Base Year: 2011 Source: IESA-Frost & Sullivan
CAGR (2011 - 2015)
TM: 23.7%
TDM (overall): 49.1%
TDM (Low/Medvalue add) : 54.9%
TDM (High value
add): NA
3.30
0
5.50
4.62
0
1.59
3.55
0
0
2.74
0
1.75
0.39 0.671.06
2.36
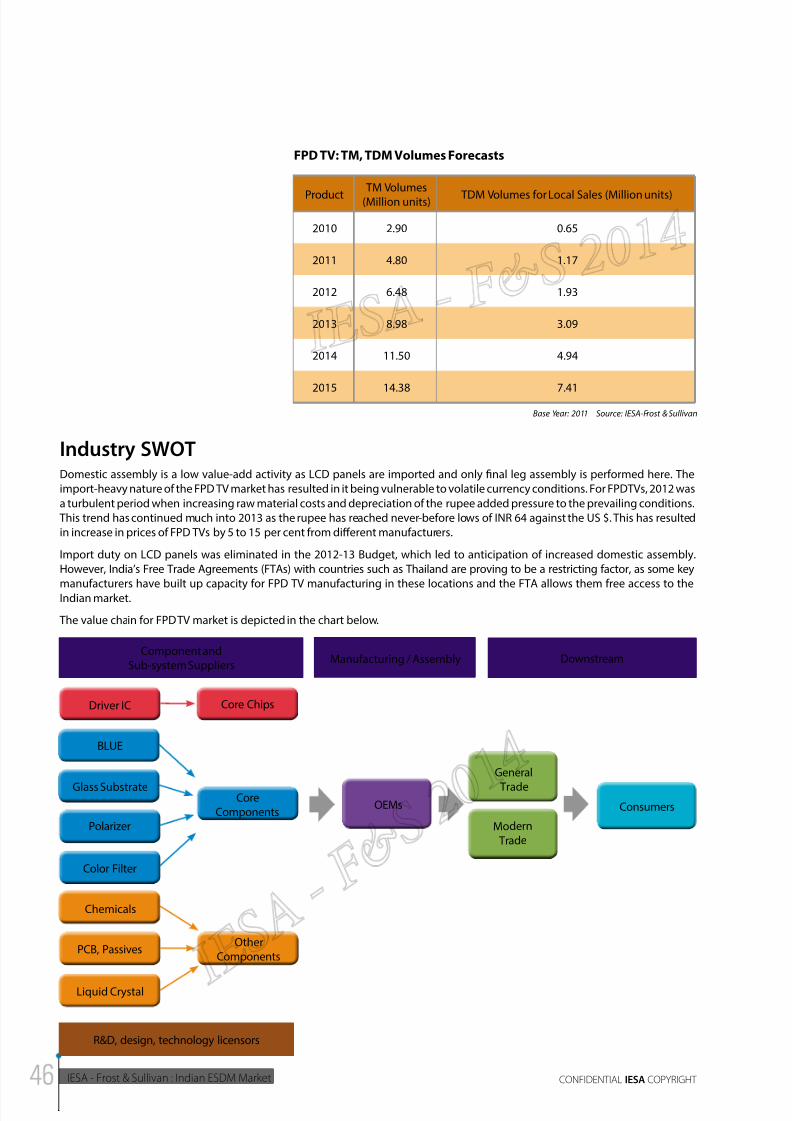
8/11/2019 IESA FS Report Indian ESDM Market
http://slidepdf.com/reader/full/iesa-fs-report-indian-esdm-market 46/172
IESA - Frost & Sullivan : Indian ESDM Market CONFIDENTIAL IESA COPYRIGHT
FPD TV: TM, TDM Volumes Forecasts
Product TM Volumes(Million units) TDM Volumes for Local Sales (Million units)
2010 2.90 0.65
2011 4.80 1.17
2012 6.48 1.93
2013 8.98 3.09
2014 11.50 4.94
2015 14.38 7.41
Base Year: 2011 Source: IESA-Frost & Sullivan
Industry SWOTDomestic assembly is a low value-add activity as LCD panels are imported and only final leg assembly is performed here. The
import-heavy nature of the FPD TV market has resulted in it being vulnerable to volatile currency conditions. For FPDTVs, 2012 was
a turbulent period when increasing raw material costs and depreciation of the rupee added pressure to the prevailing conditions.
This trend has continued much into 2013 as the rupee has reached never-before lows of INR 64 against the US $. This has resulted
in increase in prices of FPD TVs by 5 to 15 per cent from different manufacturers.
Import duty on LCD panels was eliminated in the 2012-13 Budget, which led to anticipation of increased domestic assembly.
However, India’s Free Trade Agreements (FTAs) with countries such as Thailand are proving to be a restricting factor, as some key
manufacturers have built up capacity for FPD TV manufacturing in these locations and the FTA allows them free access to theIndian market.
The value chain for FPD TV market is depicted in the chart below.
Component andSub-system Suppliers
Driver IC Core Chips
CoreComponents
OEMs
General
Trade
Consumers
Modern
Trade
OtherComponents
BLUE
Glass Substrate
Polarizer
Color Filter
Chemicals
PCB, Passives
Liquid Crystal
Manufacturing / Assembly Downstream
R&D, design, technology licensors
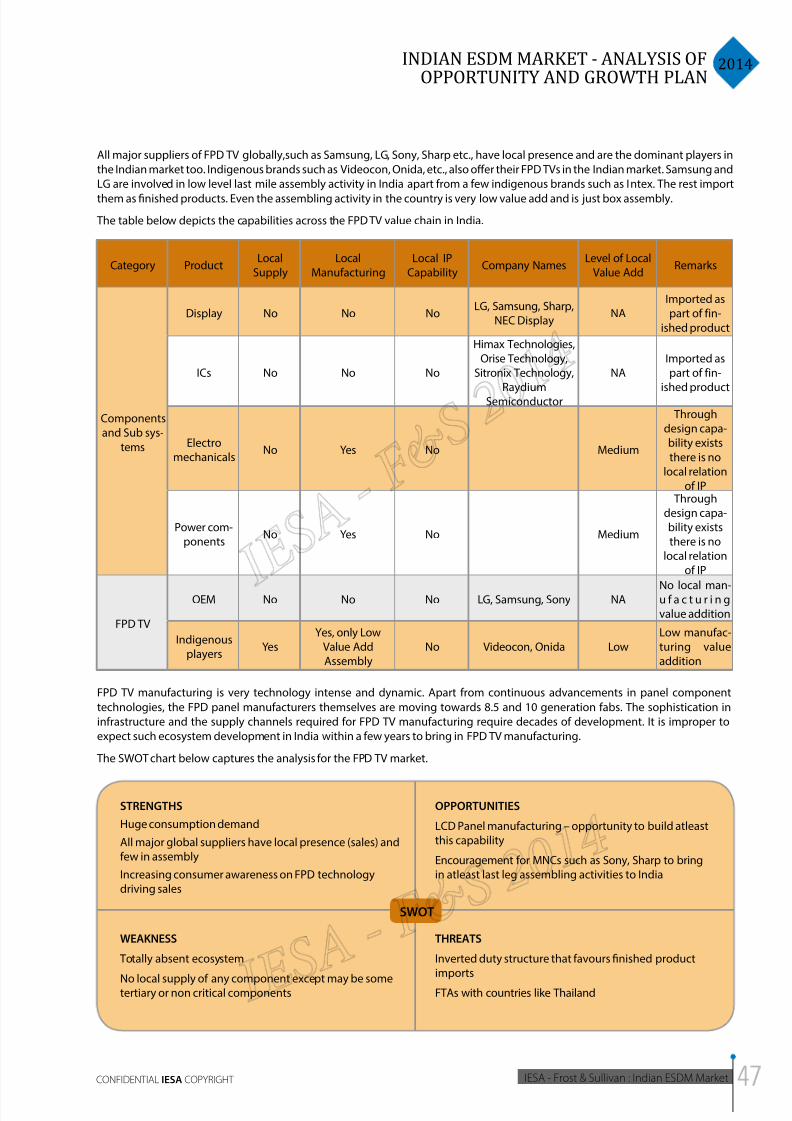
8/11/2019 IESA FS Report Indian ESDM Market
http://slidepdf.com/reader/full/iesa-fs-report-indian-esdm-market 47/172
2014INDIAN ESDM MARKET - ANALYSIS OF
OPPORTUNITY AND GROWTH PLAN
IESA - Frost & Sullivan : Indian ESDM MarketCONFIDENTIAL IESA COPYRIGHT
All major suppliers of FPD TV globally,such as Samsung, LG, Sony, Sharp etc., have local presence and are the dominant players in
the Indian market too. Indigenous brands such as Videocon, Onida, etc., also offer their FPD TVs in the Indian market. Samsung and
LG are involved in low level last mile assembly activity in India apart from a few indigenous brands such as Intex. The rest import
them as finished products. Even the assembling activity in the country is very low value add and is just box assembly.
The table below depicts the capabilities across the FPD TV value chain in India.
Category ProductLocal
SupplyLocal
ManufacturingLocal IP
CapabilityCompany Names
Level of LocalValue Add
Remarks
Componentsand Sub sys-
tems
Display No No NoLG, Samsung, Sharp,
NEC DisplayNA
Imported aspart of fin-
ished product
ICs No No No
Himax Technologies,Orise Technology,
Sitronix Technology,
RaydiumSemiconductor
NAImported aspart of fin-
ished product
Electromechanicals
No Yes No Medium
Throughdesign capa-bility exists
there is nolocal relation
of IP
Power com-ponents
No Yes No Medium
Throughdesign capa-bility existsthere is no
local relationof IP
FPD TV
OEM No No No LG, Samsung, Sony NA No local man-u f a c t u r i n gvalue addition
Indigenousplayers
YesYes, only Low
Value AddAssembly
No Videocon, Onida LowLow manufac-turing valueaddition
FPD TV manufacturing is very technology intense and dynamic. Apart from continuous advancements in panel component
technologies, the FPD panel manufacturers themselves are moving towards 8.5 and 10 generation fabs. The sophistication in
infrastructure and the supply channels required for FPD TV manufacturing require decades of development. It is improper to
expect such ecosystem development in India within a few years to bring in FPD TV manufacturing.
The SWOT chart below captures the analysis for the FPD TV market.
STRENGTHS
Huge consumption demand
All major global suppliers have local presence (sales) andfew in assembly
Increasing consumer awareness on FPD technologydriving sales
OPPORTUNITIES
LCD Panel manufacturing – opportunity to build atleastthis capability
Encouragement for MNCs such as Sony, Sharp to bringin atleast last leg assembling activities to India
WEAKNESS
Totally absent ecosystem
No local supply of any component except may be sometertiary or non critical components
THREATS
Inverted duty structure that favours finished productimports
FTAs with countries like Thailand
SWOT
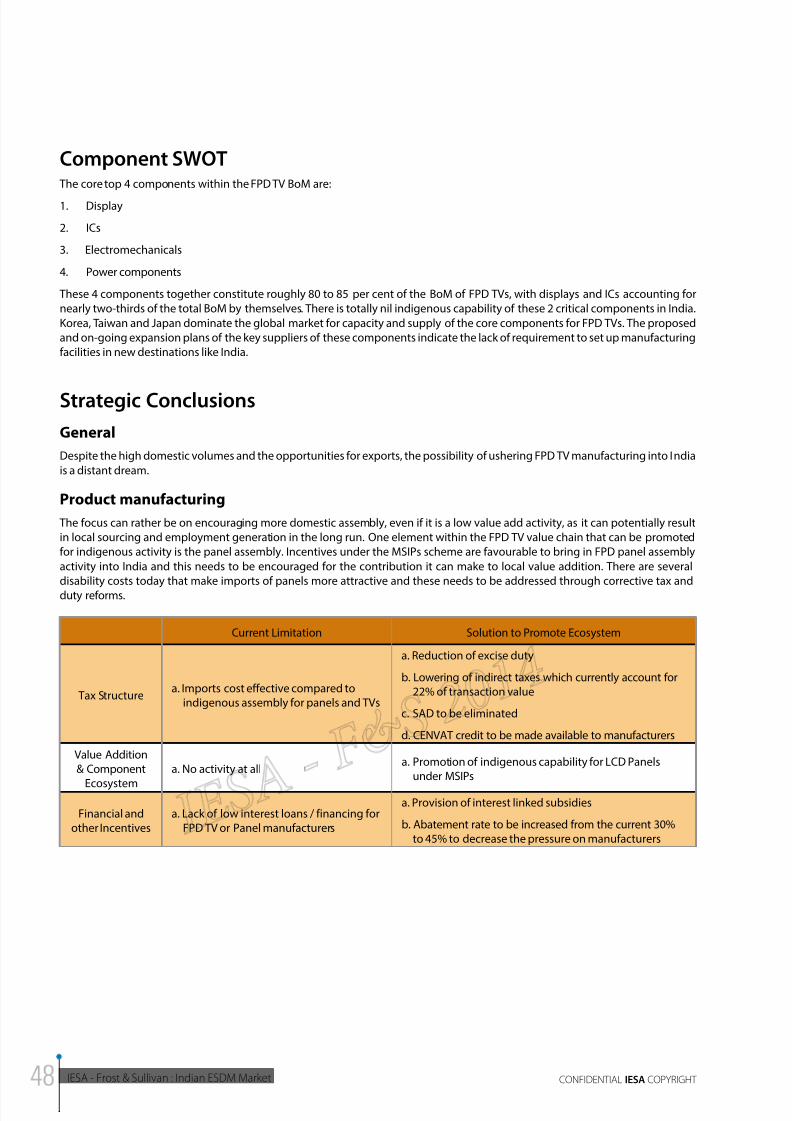
8/11/2019 IESA FS Report Indian ESDM Market
http://slidepdf.com/reader/full/iesa-fs-report-indian-esdm-market 48/172
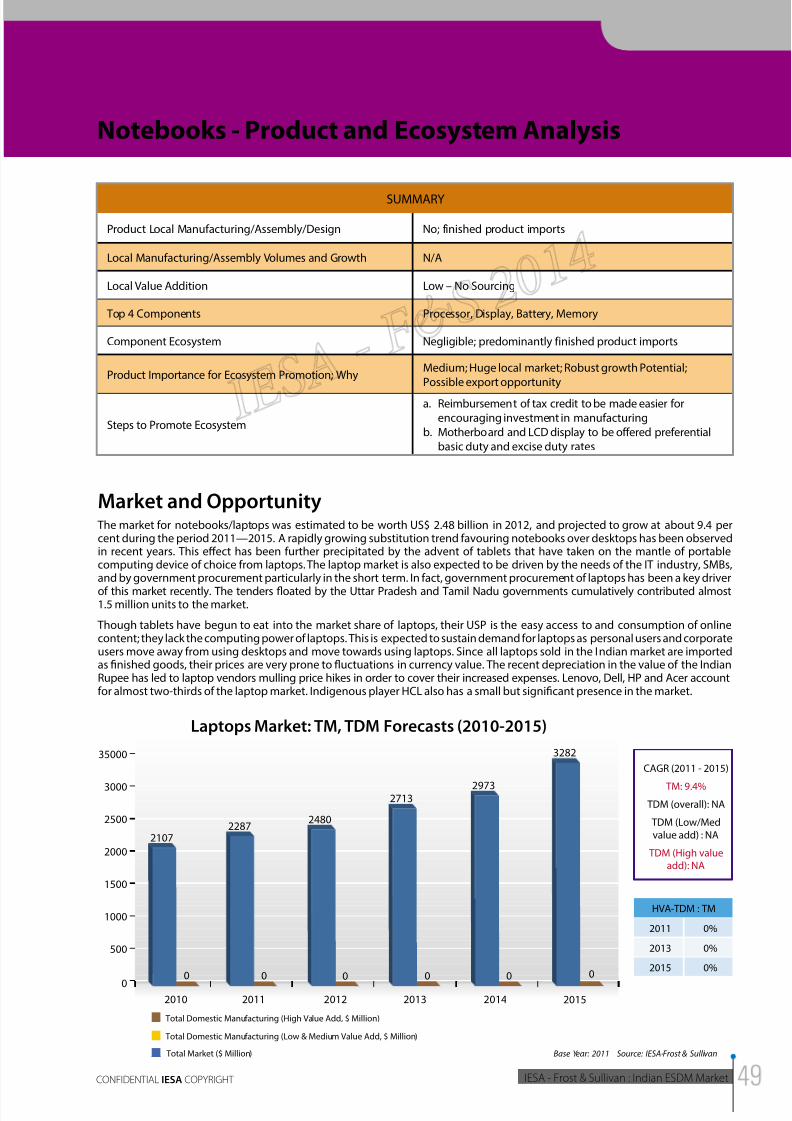
8/11/2019 IESA FS Report Indian ESDM Market
http://slidepdf.com/reader/full/iesa-fs-report-indian-esdm-market 49/172
2014INDIAN ESDM MARKET - ANALYSIS OF
OPPORTUNITY AND GROWTH PLAN
IESA - Frost & Sullivan : Indian ESDM MarketCONFIDENTIAL IESA COPYRIGHT
Notebooks - Product and Ecosystem Analysis
SUMMARY
Product Local Manufacturing/Assembly/Design No; finished product imports
Local Manufacturing/Assembly Volumes and Growth N/A
Local Value Addition Low – No Sourcing
Top 4 Components Processor, Display, Battery, Memory
Component Ecosystem Negligible; predominantly finished product imports
Product Importance for Ecosystem Promotion; WhyMedium; Huge local market; Robust growth Potential;Possible export opportunity
Steps to Promote Ecosystem
a. Reimbursement of tax credit to be made easier forencouraging investment in manufacturing
b. Motherboard and LCD display to be offered preferentialbasic duty and excise duty rates
Market and Opportunity The market for notebooks/laptops was estimated to be worth US$ 2.48 billion in 2012, and projected to grow at about 9.4 percent during the period 2011—2015. A rapidly growing substitution trend favouring notebooks over desktops has been observedin recent years. This effect has been further precipitated by the advent of tablets that have taken on the mantle of portablecomputing device of choice from laptops. The laptop market is also expected to be driven by the needs of the IT industry, SMBs,and by government procurement particularly in the short term. In fact, government procurement of laptops has been a key driver
of this market recently. The tenders floated by the Uttar Pradesh and Tamil Nadu governments cumulatively contributed almost1.5 million units to the market.
Though tablets have begun to eat into the market share of laptops, their USP is the easy access to and consumption of onlinecontent; they lack the computing power of laptops. This is expected to sustain demand for laptops as personal users and corporateusers move away from using desktops and move towards using laptops. Since all laptops sold in the Indian market are importedas finished goods, their prices are very prone to fluctuations in currency value. The recent depreciation in the value of the IndianRupee has led to laptop vendors mulling price hikes in order to cover their increased expenses. Lenovo, Dell, HP and Acer accountfor almost two-thirds of the laptop market. Indigenous player HCL also has a small but significant presence in the market.
0 0 0 0 0 00
500
1000
1500
2000
21072287
27132973
3282
2500
3000
35000
20112010 2012 2013 2014 2015
Laptops Market: TM, TDM Forecasts (2010-2015)
HVA-TDM : TM
2011
2013
2015
0%
0%
0%
Total Market ($ Million)
Total Domestic Manufacturing (High Value Add, $ Million)
Total Domestic Manufacturing (Low & Medium Value Add, $ Million)
Base Year: 2011 Source: IESA-Frost & Sullivan
CAGR (2011 - 2015)
TM: 9.4%
TDM (overall): NA
TDM (Low/Med
value add) : NA
TDM (High valueadd): NA
2480
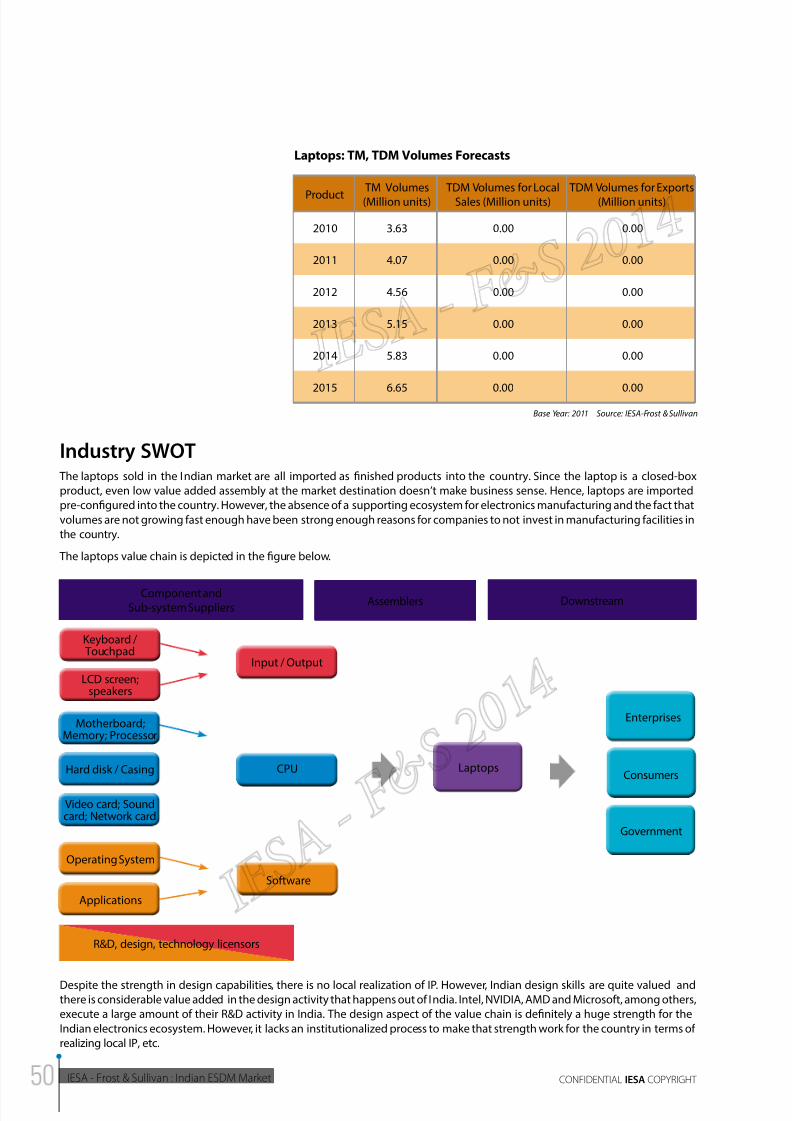
8/11/2019 IESA FS Report Indian ESDM Market
http://slidepdf.com/reader/full/iesa-fs-report-indian-esdm-market 50/172
IESA - Frost & Sullivan : Indian ESDM Market CONFIDENTIAL IESA COPYRIGHT
Industry SWOT The laptops sold in the Indian market are all imported as finished products into the country. Since the laptop is a closed-box
product, even low value added assembly at the market destination doesn’t make business sense. Hence, laptops are imported
pre-configured into the country. However, the absence of a supporting ecosystem for electronics manufacturing and the fact that
volumes are not growing fast enough have been strong enough reasons for companies to not invest in manufacturing facilities in
the country.
The laptops value chain is depicted in the figure below.
Component andSub-system Suppliers
Keyboard / Touchpad
LCD screen;speakers
Input / Output
CPU
Software
Motherboard;Memory; Processor
Operating System
Applications
Assemblers Downstream
Laptops
Enterprises
Consumers
Government
R&D, design, technology licensors
Hard disk / Casing
Video card; Soundcard; Network card
Despite the strength in design capabilities, there is no local realization of IP. However, Indian design skills are quite valued andthere is considerable value added in the design activity that happens out of India. Intel, NVIDIA, AMD and Microsoft, among others,
execute a large amount of their R&D activity in India. The design aspect of the value chain is definitely a huge strength for the
Indian electronics ecosystem. However, it lacks an institutionalized process to make that strength work for the country in terms of
realizing local IP, etc.
Laptops: TM, TDM Volumes Forecasts
Product TM Volumes(Million units)
TDM Volumes for LocalSales (Million units)
TDM Volumes for Exports(Million units)
2010 3.63 0.00 0.00
2011 4.07 0.00 0.00
2012 4.56 0.00 0.00
2013 5.15 0.00 0.00
2014 5.83 0.00 0.00
2015 6.65 0.00 0.00
Base Year: 2011 Source: IESA-Frost & Sullivan
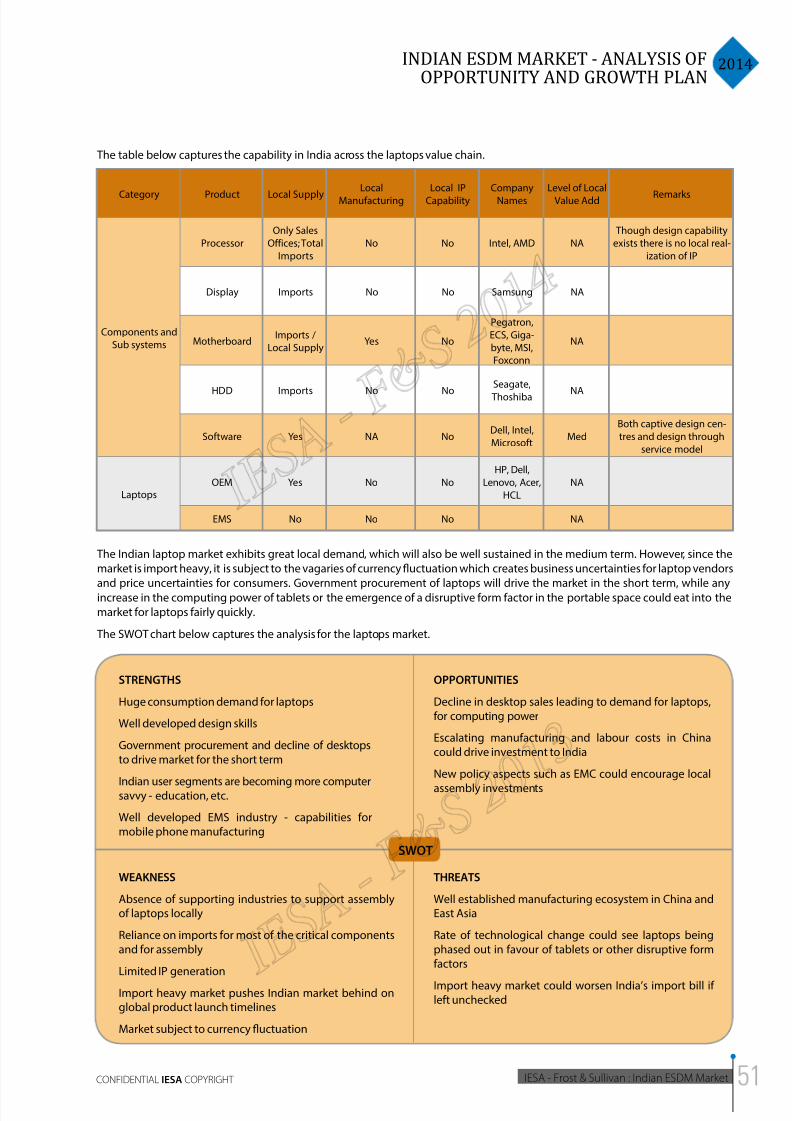
8/11/2019 IESA FS Report Indian ESDM Market
http://slidepdf.com/reader/full/iesa-fs-report-indian-esdm-market 51/172
2014INDIAN ESDM MARKET - ANALYSIS OF
OPPORTUNITY AND GROWTH PLAN
IESA - Frost & Sullivan : Indian ESDM MarketCONFIDENTIAL IESA COPYRIGHT
Category Product Local Supply
Local
Manufacturing
Local IP
Capability
Company
Names
Level of Local
Value Add Remarks
Components and
Sub systems
Processor
Only Sales
Offices; Total
Imports
No No Intel, AMD NA
Though design capability
exists there is no local real-
ization of IP
Display Imports No No Samsung NA
MotherboardImports /
Local SupplyYes No
Pegatron,
ECS, Giga-
byte, MSI,Foxconn
NA
HDD Imports No No
Seagate,
Thoshiba NA
Software Yes NA NoDell, Intel,
MicrosoftMed
Both captive design cen-
tres and design through
service model
LaptopsOEM Yes No No
HP, Dell,
Lenovo, Acer,
HCL
NA
EMS No No No NA
The table below captures the capability in India across the laptops value chain.
The Indian laptop market exhibits great local demand, which will also be well sustained in the medium term. However, since the
market is import heavy, it is subject to the vagaries of currency fluctuation which creates business uncertainties for laptop vendors
and price uncertainties for consumers. Government procurement of laptops will drive the market in the short term, while anyincrease in the computing power of tablets or the emergence of a disruptive form factor in the portable space could eat into the
market for laptops fairly quickly.
The SWOT chart below captures the analysis for the laptops market.
STRENGTHS
Huge consumption demand for laptops
Well developed design skills
Government procurement and decline of desktopsto drive market for the short term
Indian user segments are becoming more computersavvy - education, etc.
Well developed EMS industry - capabilities formobile phone manufacturing
OPPORTUNITIES
Decline in desktop sales leading to demand for laptops,for computing power
Escalating manufacturing and labour costs in Chinacould drive investment to India
New policy aspects such as EMC could encourage local
assembly investments
WEAKNESS
Absence of supporting industries to support assemblyof laptops locally
Reliance on imports for most of the critical componentsand for assembly
Limited IP generation
Import heavy market pushes Indian market behind onglobal product launch timelines
Market subject to currency fluctuation
THREATS
Well established manufacturing ecosystem in China andEast Asia
Rate of technological change could see laptops beingphased out in favour of tablets or other disruptive formfactors
Import heavy market could worsen India’s import bill ifleft unchecked
SWOT
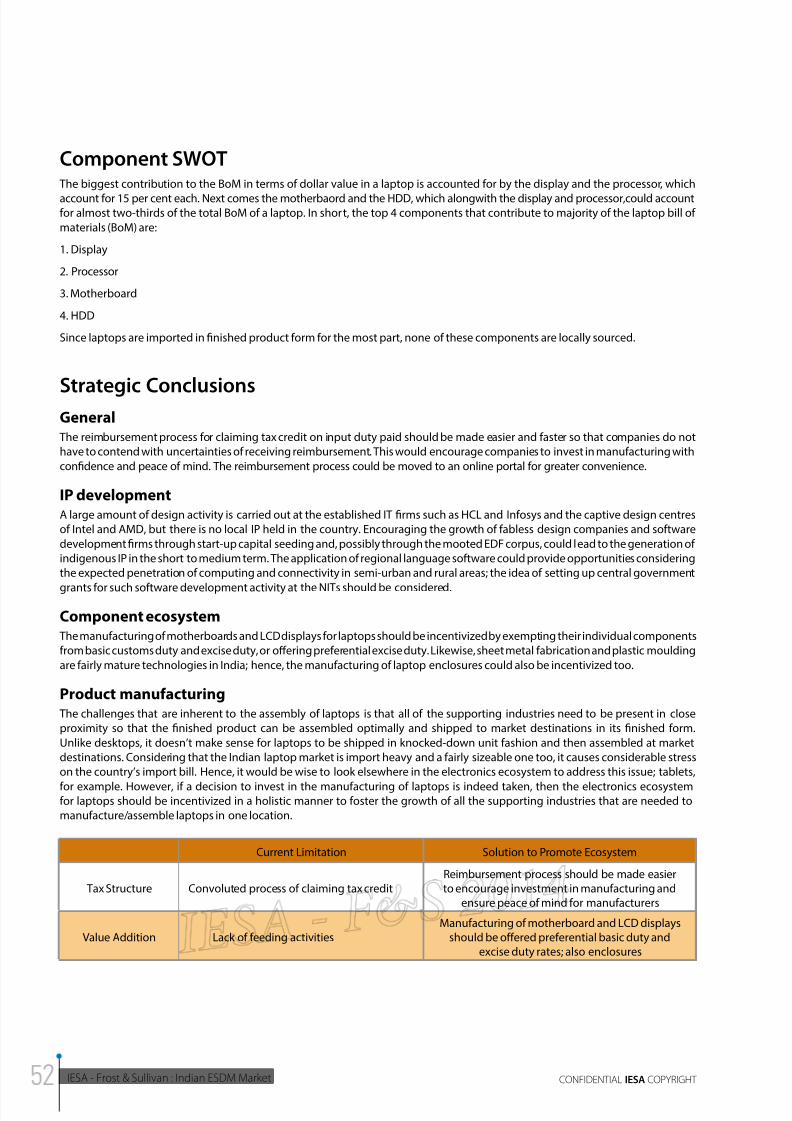
8/11/2019 IESA FS Report Indian ESDM Market
http://slidepdf.com/reader/full/iesa-fs-report-indian-esdm-market 52/172
IESA - Frost & Sullivan : Indian ESDM Market CONFIDENTIAL IESA COPYRIGHT
Component SWOT The biggest contribution to the BoM in terms of dollar value in a laptop is accounted for by the display and the processor, which
account for 15 per cent each. Next comes the motherbaord and the HDD, which alongwith the display and processor,could accountfor almost two-thirds of the total BoM of a laptop. In short, the top 4 components that contribute to majority of the laptop bill of
materials (BoM) are:
1. Display
2. Processor
3. Motherboard
4. HDD
Since laptops are imported in finished product form for the most part, none of these components are locally sourced.
Strategic ConclusionsGeneral
The reimbursement process for claiming tax credit on input duty paid should be made easier and faster so that companies do not
have to contend with uncertainties of receiving reimbursement. This would encourage companies to invest in manufacturing with
confidence and peace of mind. The reimbursement process could be moved to an online portal for greater convenience.
IP developmentA large amount of design activity is carried out at the established IT firms such as HCL and Infosys and the captive design centres
of Intel and AMD, but there is no local IP held in the country. Encouraging the growth of fabless design companies and software
development firms through start-up capital seeding and, possibly through the mooted EDF corpus, could lead to the generation of
indigenous IP in the short to medium term. The application of regional language software could provide opportunities considering
the expected penetration of computing and connectivity in semi-urban and rural areas; the idea of setting up central government
grants for such software development activity at the NITs should be considered.
Component ecosystem The manufacturing of motherboards and LCD displays for laptops should be incentivized by exempting their individual components
from basic customs duty and excise duty, or offering preferential excise duty. Likewise, sheet metal fabrication and plastic moulding
are fairly mature technologies in India; hence, the manufacturing of laptop enclosures could also be incentivized too.
Product manufacturing The challenges that are inherent to the assembly of laptops is that all of the supporting industries need to be present in close
proximity so that the finished product can be assembled optimally and shipped to market destinations in its finished form.
Unlike desktops, it doesn’t make sense for laptops to be shipped in knocked-down unit fashion and then assembled at market
destinations. Considering that the Indian laptop market is import heavy and a fairly sizeable one too, it causes considerable stress
on the country’s import bill. Hence, it would be wise to look elsewhere in the electronics ecosystem to address this issue; tablets,
for example. However, if a decision to invest in the manufacturing of laptops is indeed taken, then the electronics ecosystemfor laptops should be incentivized in a holistic manner to foster the growth of all the supporting industries that are needed to
manufacture/assemble laptops in one location.
Current Limitation Solution to Promote Ecosystem
Tax Structure Convoluted process of claiming tax creditReimbursement process should be made easierto encourage investment in manufacturing and
ensure peace of mind for manufacturers
Value Addition Lack of feeding activitiesManufacturing of motherboard and LCD displays
should be offered preferential basic duty andexcise duty rates; also enclosures
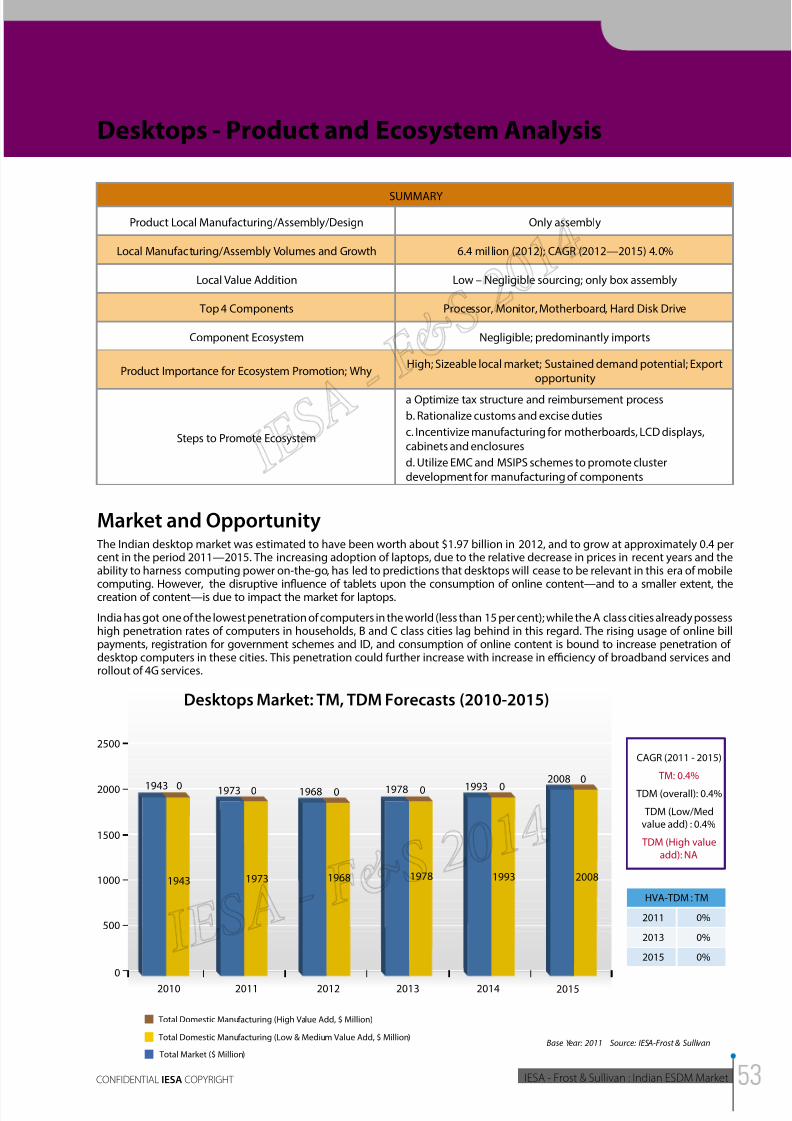
8/11/2019 IESA FS Report Indian ESDM Market
http://slidepdf.com/reader/full/iesa-fs-report-indian-esdm-market 53/172
2014INDIAN ESDM MARKET - ANALYSIS OF
OPPORTUNITY AND GROWTH PLAN
IESA - Frost & Sullivan : Indian ESDM MarketCONFIDENTIAL IESA COPYRIGHT
Desktops - Product and Ecosystem Analysis
SUMMARY
Product Local Manufacturing/Assembly/Design Only assembly
Local Manufacturing/Assembly Volumes and Growth 6.4 mil lion (2012); CAGR (2012—2015) 4.0%
Local Value Addition Low – Negligible sourcing; only box assembly
Top 4 Components Processor, Monitor, Motherboard, Hard Disk Drive
Component Ecosystem Negligible; predominantly imports
Product Importance for Ecosystem Promotion; WhyHigh; Sizeable local market; Sustained demand potential; Export
opportunity
Steps to Promote Ecosystem
a Optimize tax structure and reimbursement process
b. Rationalize customs and excise duties
c. Incentivize manufacturing for motherboards, LCD displays,cabinets and enclosures
d. Utilize EMC and MSIPS schemes to promote clusterdevelopment for manufacturing of components
Market and Opportunity The Indian desktop market was estimated to have been worth about $1.97 billion in 2012, and to grow at approximately 0.4 percent in the period 2011—2015. The increasing adoption of laptops, due to the relative decrease in prices in recent years and theability to harness computing power on-the-go, has led to predictions that desktops will cease to be relevant in this era of mobile
computing. However, the disruptive influence of tablets upon the consumption of online content—and to a smaller extent, thecreation of content—is due to impact the market for laptops.
India has got one of the lowest penetration of computers in the world (less than 15 per cent); while the A class cities already possesshigh penetration rates of computers in households, B and C class cities lag behind in this regard. The rising usage of online billpayments, registration for government schemes and ID, and consumption of online content is bound to increase penetration ofdesktop computers in these cities. This penetration could further increase with increase in eciency of broadband services androllout of 4G services.
0
500
1000
1500
2000 1943
2500
20112010 2012 2013 2014 2015
Desktops Market: TM, TDM Forecasts (2010-2015)
HVA-TDM : TM
2011
2013
2015
0%
0%
0%
Total Market ($ Million)
Total Domestic Manufacturing (High Value Add, $ Million)
Total Domestic Manufacturing (Low & Medium Value Add, $ Million)Base Year: 2011 Source: IESA-Frost & Sullivan
CAGR (2011 - 2015)
TM: 0.4%
TDM (overall): 0.4%
TDM (Low/Medvalue add) : 0.4%
TDM (High value
add): NA
0
1943
1973 0
1973
1968
1968
0 1978 1993
19931978
0 02008
2008
0
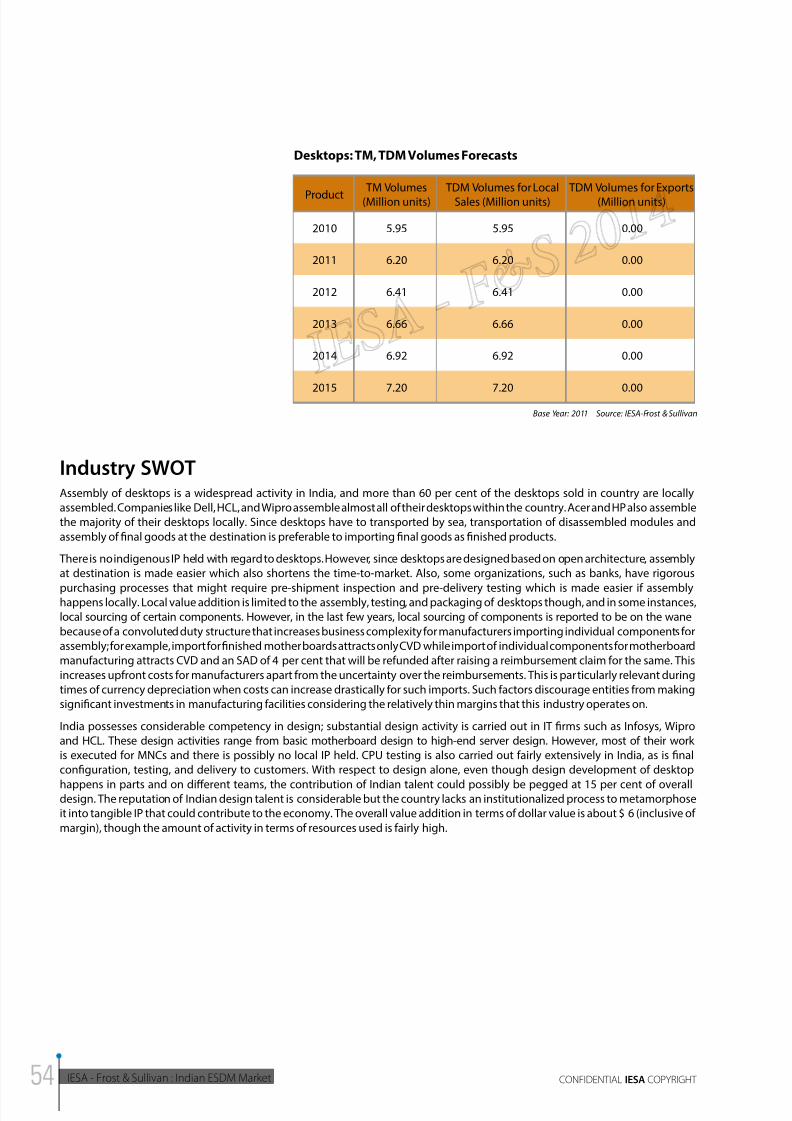
8/11/2019 IESA FS Report Indian ESDM Market
http://slidepdf.com/reader/full/iesa-fs-report-indian-esdm-market 54/172
IESA - Frost & Sullivan : Indian ESDM Market CONFIDENTIAL IESA COPYRIGHT
Desktops: TM, TDM Volumes Forecasts
Product TM Volumes(Million units)
TDM Volumes for LocalSales (Million units)
TDM Volumes for Exports(Million units)
2010 5.95 5.95 0.00
2011 6.20 6.20 0.00
2012 6.41 6.41 0.00
2013 6.66 6.66 0.00
2014 6.92 6.92 0.00
2015 7.20 7.20 0.00
Base Year: 2011 Source: IESA-Frost & Sullivan
Industry SWOTAssembly of desktops is a widespread activity in India, and more than 60 per cent of the desktops sold in country are locally
assembled. Companies like Dell, HCL, and Wipro assemble almost all of their desktops within the country. Acer and HP also assemble
the majority of their desktops locally. Since desktops have to transported by sea, transportation of disassembled modules and
assembly of final goods at the destination is preferable to importing final goods as finished products.
There is no indigenous IP held with regard to desktops. However, since desktops are designed based on open architecture, assembly
at destination is made easier which also shortens the time-to-market. Also, some organizations, such as banks, have rigorous
purchasing processes that might require pre-shipment inspection and pre-delivery testing which is made easier if assemblyhappens locally. Local value addition is limited to the assembly, testing, and packaging of desktops though, and in some instances,
local sourcing of certain components. However, in the last few years, local sourcing of components is reported to be on the wane
because of a convoluted duty structure that increases business complexity for manufacturers importing individual components for
assembly; for example, import for finished mother boards attracts only CVD while import of individual components for motherboard
manufacturing attracts CVD and an SAD of 4 per cent that will be refunded after raising a reimbursement claim for the same. This
increases upfront costs for manufacturers apart from the uncertainty over the reimbursements. This is particularly relevant during
times of currency depreciation when costs can increase drastically for such imports. Such factors discourage entities from making
significant investments in manufacturing facilities considering the relatively thin margins that this industry operates on.
India possesses considerable competency in design; substantial design activity is carried out in IT firms such as Infosys, Wipro
and HCL. These design activities range from basic motherboard design to high-end server design. However, most of their work
is executed for MNCs and there is possibly no local IP held. CPU testing is also carried out fairly extensively in India, as is final
configuration, testing, and delivery to customers. With respect to design alone, even though design development of desktop
happens in parts and on different teams, the contribution of Indian talent could possibly be pegged at 15 per cent of overalldesign. The reputation of Indian design talent is considerable but the country lacks an institutionalized process to metamorphose
it into tangible IP that could contribute to the economy. The overall value addition in terms of dollar value is about $ 6 (inclusive of
margin), though the amount of activity in terms of resources used is fairly high.
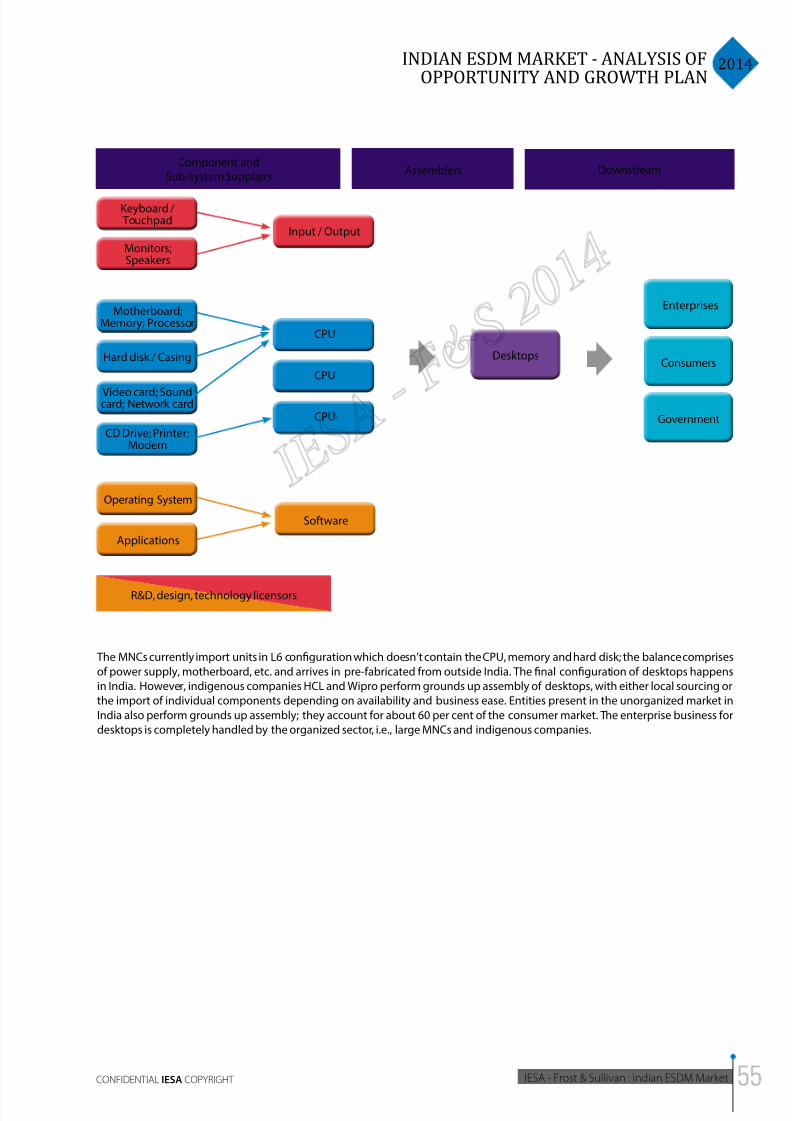
8/11/2019 IESA FS Report Indian ESDM Market
http://slidepdf.com/reader/full/iesa-fs-report-indian-esdm-market 55/172
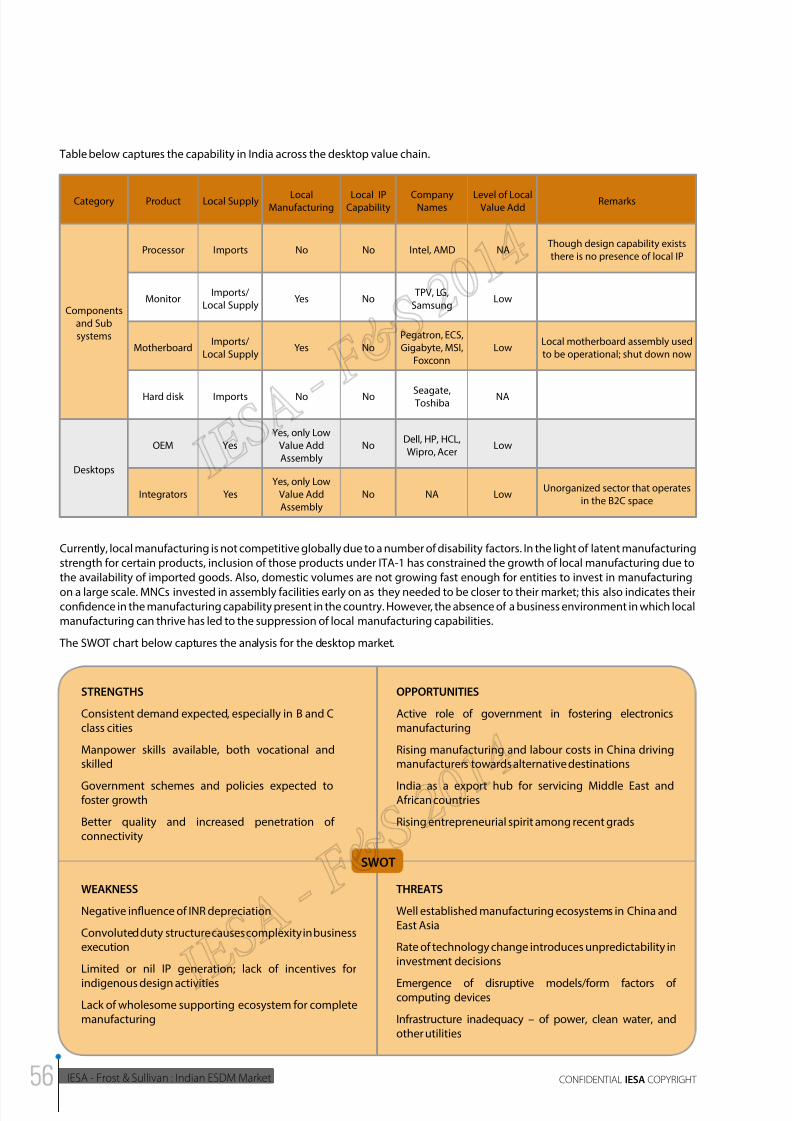
8/11/2019 IESA FS Report Indian ESDM Market
http://slidepdf.com/reader/full/iesa-fs-report-indian-esdm-market 56/172
IESA - Frost & Sullivan : Indian ESDM Market CONFIDENTIAL IESA COPYRIGHT
Category Product Local Supply LocalManufacturing
Local IPCapability
CompanyNames
Level of LocalValue Add
Remarks
Components
and Sub
systems
Processor Imports No No Intel, AMD NA Though design capability exists
there is no presence of local IP
MonitorImports/
Local SupplyYes No
TPV, LG,
SamsungLow
MotherboardImports/
Local SupplyYes No
Pegatron, ECS,
Gigabyte, MSI,
Foxconn
LowLocal motherboard assembly used
to be operational; shut down now
Hard disk Imports No No Seagate, Toshiba
NA
Desktops
OEM Yes
Yes, only Low
Value Add
Assembly
NoDell, HP, HCL,
Wipro, AcerLow
Integrators Yes
Yes, only Low
Value Add
Assembly
No NA LowUnorganized sector that operates
in the B2C space
Table below captures the capability in India across the desktop value chain.
Currently, local manufacturing is not competitive globally due to a number of disability factors. In the light of latent manufacturing
strength for certain products, inclusion of those products under ITA-1 has constrained the growth of local manufacturing due to
the availability of imported goods. Also, domestic volumes are not growing fast enough for entities to invest in manufacturing
on a large scale. MNCs invested in assembly facilities early on as they needed to be closer to their market; this also indicates theirconfidence in the manufacturing capability present in the country. However, the absence of a business environment in which local
manufacturing can thrive has led to the suppression of local manufacturing capabilities.
The SWOT chart below captures the analysis for the desktop market.
STRENGTHS
Consistent demand expected, especially in B and Cclass cities
Manpower skills available, both vocational andskilled
Government schemes and policies expected tofoster growth
Better quality and increased penetration ofconnectivity
OPPORTUNITIES
Active role of government in fostering electronicsmanufacturing
Rising manufacturing and labour costs in China drivingmanufacturers towards alternative destinations
India as a export hub for servicing Middle East andAfrican countries
Rising entrepreneurial spirit among recent grads
WEAKNESS
Negative influence of INR depreciation
Convoluted duty structure causes complexity in businessexecution
Limited or nil IP generation; lack of incentives for
indigenous design activities
Lack of wholesome supporting ecosystem for completemanufacturing
THREATS
Well established manufacturing ecosystems in China andEast Asia
Rate of technology change introduces unpredictability ininvestment decisions
Emergence of disruptive models/form factors ofcomputing devices
Infrastructure inadequacy – of power, clean water, andother utilities
SWOT
8/11/2019 IESA FS Report Indian ESDM Market
http://slidepdf.com/reader/full/iesa-fs-report-indian-esdm-market 57/172
2014INDIAN ESDM MARKET - ANALYSIS OF
OPPORTUNITY AND GROWTH PLAN
IESA - Frost & Sullivan : Indian ESDM MarketCONFIDENTIAL IESA COPYRIGHT
Component SWOT The biggest contribution to the BoM in terms of dollar value in a dektop is accounted for by the monitor which costs US$80
approximately (excluding software costs). Next comes the processor which costs anywhere between US$60 and 110, followed bythe hard disk and the motherboard that both cost in the range of US$40. On the motherboard, the semiconductor components
and the PCB are most critical. Considering a BoM of US$40 for the motherboard, it can be estimated that the chipset costs about
US$12, the PCB costs about US$6.5, and that the overall semiconductor cost is about US$20 including the peripheral chips.
In short, the top 4 components that contribute to majority of the desktop bill of materials (BoM) are:
1. Processor
2. Monitor
3. Motherboard
4. Hard disk
The motherboard is being manufactured in India, and indigenous players in particular source about 20 to 25 per cent of their
requirements locally. Monitors are being made by LG and Samsung; HCL also manufactures monitors locally. Of course, processors
for desktops are sourced from either Intel or AMD. The top suppliers for hard disks are Seagate and Toshiba. However, the situationwith regard to hard disk is slightly on the balance currently due the shift in technology and enterprise business models, i.e., the
shift towards cloud computing and centralized servers, and the movement in technology towards solid state drives. Hence, entities
are presently thinking twice before investing in manufacturing facilities for mechanical hard drives and there are also questions
about consumer adoption of mechanical hard drives in the future, given the advantages of using solid state drives.
With regard to value addition, the major activities that happen are either soldering or testing of components and the financial
value of these activities is quite less. Over all, the manufacturing value added is about 10 per cent, including margins.
Strategic Conclusions
General
The levying of SAD should be repealed at the very least on individual components of LCD monitors and motherboards. Also,the reimbursement process should be made easier and faster so that companies do not have to contend with uncertainties of
receiving reimbursement. The reimbursement process should be moved to an online portal and there should be no restrictions
on the number of times reimbursements can be claimed. Also, reimbursements should be directly transferred to merchants’ bank
accounts. The increased liquidity and trust factor arising from these measures could help companies transact more or make greater
investments. The present rate of abatement should also be raised from 25 per cent to reflect the rise in costs of doing business.
SAD could be levied on finished product imports of motherboard and LCD monitors, for which a nascent manufacturing ecosystem
exists in India.
IP developmentA large amount of design activity is carried out at the established IT firms such as HCL and Infosys and the captive design centres
of Intel and AMD, but there is no local IP held in the country. Encouraging the growth of fabless design companies and software
development firms through start-up capital seeding and possibly through the mooted EDF corpus could lead to the generation of
indigenous IP in the short to medium term. The application of regional language software could provide opportunities consideringthe expected penetration of computing and connectivity in semi-urban and rural areas; the idea of setting up central government
grants for such software development activity at the NITs should be considered.
Component ecosystem The manufacturing of motherboards and LCD monitors should be incentivized by exempting their individual components from
basic customs duty and excise duty, or offering preferential excise duty. Decrease in tax revenues could be offset a little through
smaller hikes in sales tax or through offering greater rates of CENVAT credit on excise duties.The Indian manufacturing ecosystem
possesses competencies in the manufacturing of these products, which incidentally also are the top two BoM contributors
to desktops in terms of dollar value. These products also have applications in almost every electronics product. Once local
manufacturing of these products is encouraged by exempting them from/ granting them preferential excise duties, it is very
possible that investment will flow in and spur organic growth of the value chain. Likewise, sheet metal fabrication and plastic
moulding are fairly mature technologies in India; hence, the manufacturing of cabinets and enclosures for use in desktops could
also be incentivized through preferential excise duties and exemption from additional duties.
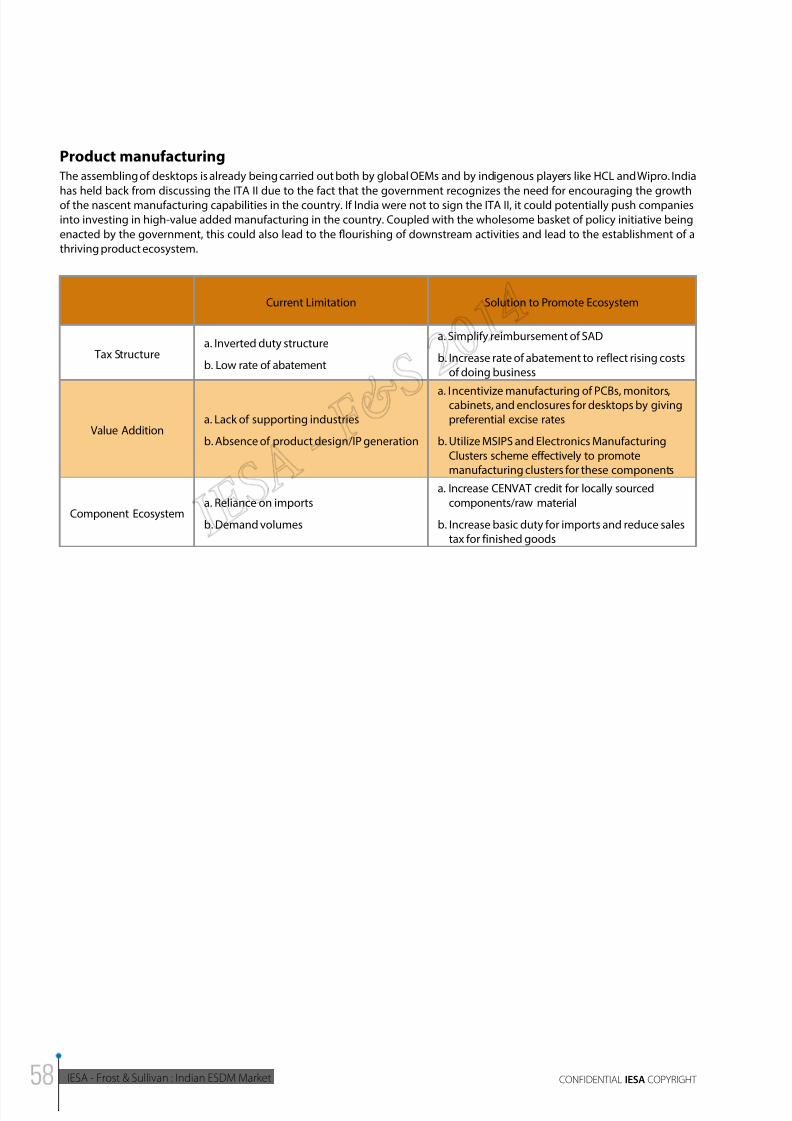
8/11/2019 IESA FS Report Indian ESDM Market
http://slidepdf.com/reader/full/iesa-fs-report-indian-esdm-market 58/172
IESA - Frost & Sullivan : Indian ESDM Market CONFIDENTIAL IESA COPYRIGHT
Product manufacturing The assembling of desktops is already being carried out both by global OEMs and by indigenous players like HCL and Wipro. India
has held back from discussing the ITA II due to the fact that the government recognizes the need for encouraging the growthof the nascent manufacturing capabilities in the country. If India were not to sign the ITA II, it could potentially push companies
into investing in high-value added manufacturing in the country. Coupled with the wholesome basket of policy initiative being
enacted by the government, this could also lead to the flourishing of downstream activities and lead to the establishment of a
thriving product ecosystem.
Current Limitation Solution to Promote Ecosystem
Tax Structurea. Inverted duty structure
b. Low rate of abatement
a. Simplify reimbursement of SAD
b. Increase rate of abatement to reflect rising costsof doing business
Value Additiona. Lack of supporting industries
b. Absence of product design/IP generation
a. Incentivize manufacturing of PCBs, monitors,cabinets, and enclosures for desktops by givingpreferential excise rates
b. Utilize MSIPS and Electronics Manufacturing
Clusters scheme effectively to promotemanufacturing clusters for these components
Component Ecosystema. Reliance on imports
b. Demand volumes
a. Increase CENVAT credit for locally sourced
components/raw material
b. Increase basic duty for imports and reduce salestax for finished goods
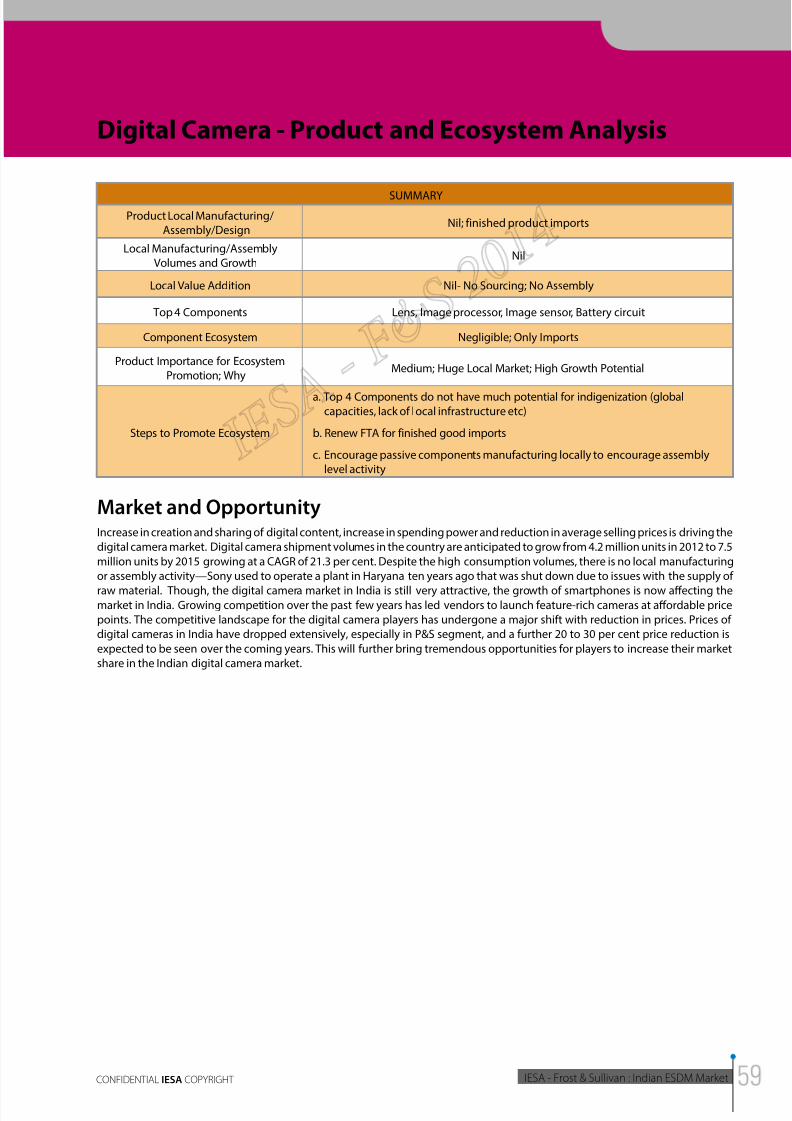
8/11/2019 IESA FS Report Indian ESDM Market
http://slidepdf.com/reader/full/iesa-fs-report-indian-esdm-market 59/172
2014INDIAN ESDM MARKET - ANALYSIS OF
OPPORTUNITY AND GROWTH PLAN
IESA - Frost & Sullivan : Indian ESDM MarketCONFIDENTIAL IESA COPYRIGHT
Digital Camera - Product and Ecosystem Analysis
SUMMARY
Product Local Manufacturing/Assembly/Design
Nil; finished product imports
Local Manufacturing/AssemblyVolumes and Growth
Nil
Local Value Addition Nil- No Sourcing; No Assembly
Top 4 Components Lens, Image processor, Image sensor, Battery circuit
Component Ecosystem Negligible; Only Imports
Product Importance for EcosystemPromotion; Why
Medium; Huge Local Market; High Growth Potential
Steps to Promote Ecosystem
a. Top 4 Components do not have much potential for indigenization (globalcapacities, lack of local infrastructure etc)
b. Renew FTA for finished good imports
c. Encourage passive components manufacturing locally to encourage assemblylevel activity
Market and OpportunityIncrease in creation and sharing of digital content, increase in spending power and reduction in average selling prices is driving the
digital camera market. Digital camera shipment volumes in the country are anticipated to grow from 4.2 million units in 2012 to 7.5
million units by 2015 growing at a CAGR of 21.3 per cent. Despite the high consumption volumes, there is no local manufacturing
or assembly activity—Sony used to operate a plant in Haryana ten years ago that was shut down due to issues with the supply of
raw material. Though, the digital camera market in India is still very attractive, the growth of smartphones is now affecting themarket in India. Growing competition over the past few years has led vendors to launch feature-rich cameras at affordable price
points. The competitive landscape for the digital camera players has undergone a major shift with reduction in prices. Prices of
digital cameras in India have dropped extensively, especially in P&S segment, and a further 20 to 30 per cent price reduction is
expected to be seen over the coming years. This will further bring tremendous opportunities for players to increase their market
share in the Indian digital camera market.
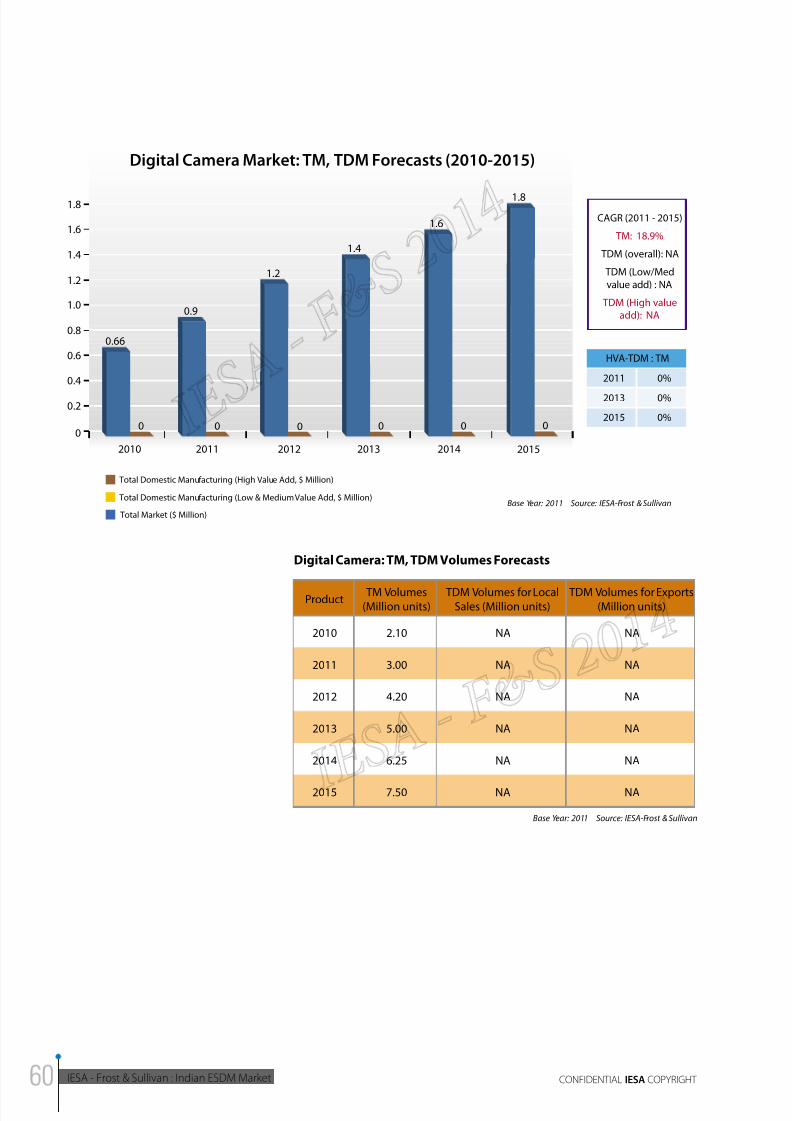
8/11/2019 IESA FS Report Indian ESDM Market
http://slidepdf.com/reader/full/iesa-fs-report-indian-esdm-market 60/172
IESA - Frost & Sullivan : Indian ESDM Market CONFIDENTIAL IESA COPYRIGHT
Digital Camera: TM, TDM Volumes Forecasts
Product TM Volumes(Million units)
TDM Volumes for LocalSales (Million units)
TDM Volumes for Exports(Million units)
2010 2.10 NA NA
2011 3.00 NA NA
2012 4.20 NA NA
2013 5.00 NA NA
2014 6.25 NA NA
2015 7.50 NA NA
Base Year: 2011 Source: IESA-Frost & Sullivan
1.8
00
0.2
0.6
0.4
1.0
0.8
1.8
1.2
1.4
1.6
20112010 2012 2013 2014 2015
Digital Camera Market: TM, TDM Forecasts (2010-2015)
HVA-TDM : TM
2011
2013
2015
0%
0%
0%
Total Market ($ Million)
Total Domestic Manufacturing (High Value Add, $ Million)
Total Domestic Manufacturing (Low & Medium Value Add, $ Million)Base Year: 2011 Source: IESA-Frost & Sullivan
CAGR (2011 - 2015)
TM: 18.9%
TDM (overall): NA
TDM (Low/Med
value add) : NA
TDM (High valueadd): NA
0
1.6
1.4
0
1.2
00
0.9
0
0.66
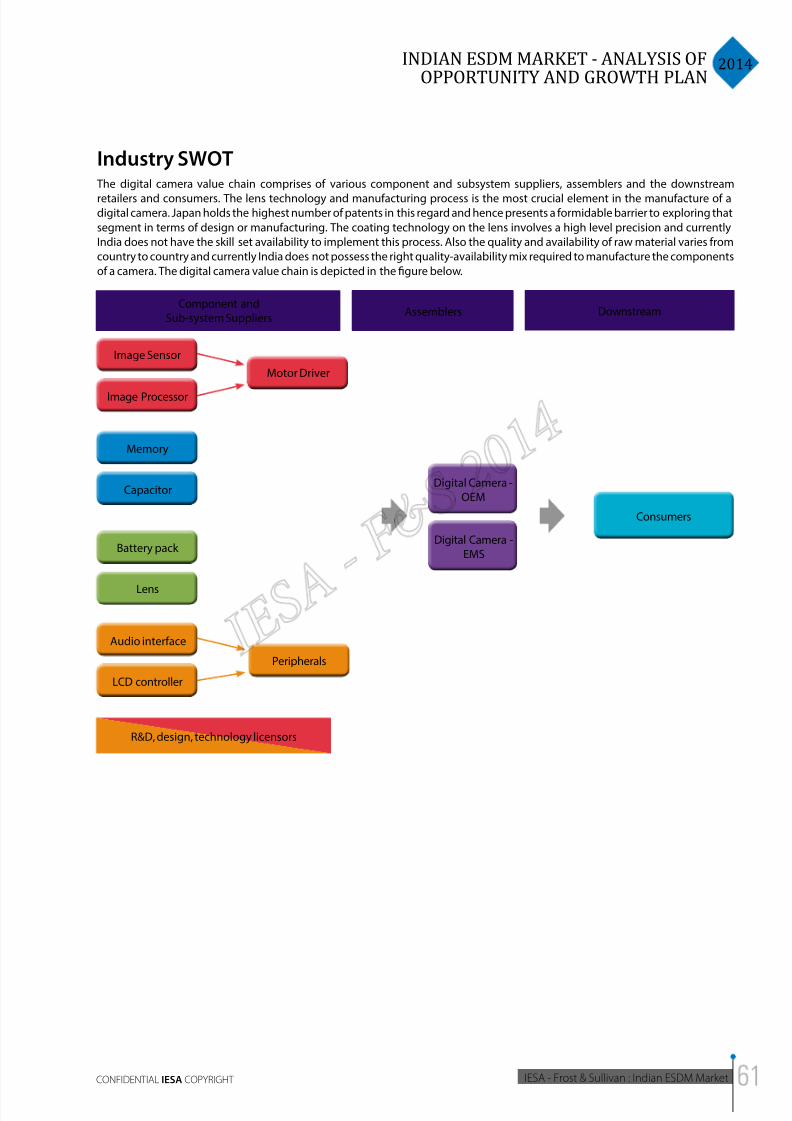
8/11/2019 IESA FS Report Indian ESDM Market
http://slidepdf.com/reader/full/iesa-fs-report-indian-esdm-market 61/172
2014INDIAN ESDM MARKET - ANALYSIS OF
OPPORTUNITY AND GROWTH PLAN
IESA - Frost & Sullivan : Indian ESDM MarketCONFIDENTIAL IESA COPYRIGHT
Industry SWOT The digital camera value chain comprises of various component and subsystem suppliers, assemblers and the downstream
retailers and consumers. The lens technology and manufacturing process is the most crucial element in the manufacture of adigital camera. Japan holds the highest number of patents in this regard and hence presents a formidable barrier to exploring that
segment in terms of design or manufacturing. The coating technology on the lens involves a high level precision and currently
India does not have the skill set availability to implement this process. Also the quality and availability of raw material varies from
country to country and currently India does not possess the right quality-availability mix required to manufacture the components
of a camera. The digital camera value chain is depicted in the figure below.
Component andSub-system Suppliers
Image Sensor
Image Processor
Motor Driver
Digital Camera -OEM
Digital Camera -EMS
Consumers
Peripherals
Memory
Capacitor
Battery pack
Lens
Audio interface
LCD controller
Assemblers Downstream
R&D, design, technology licensors
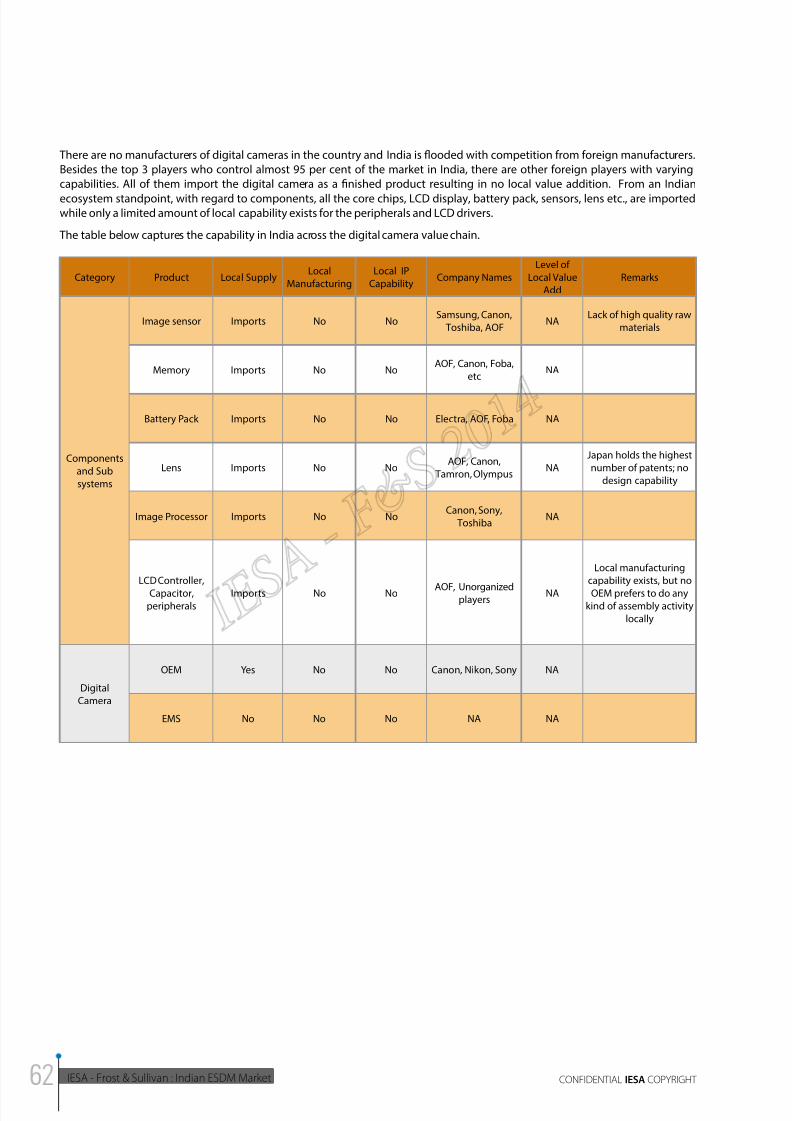
8/11/2019 IESA FS Report Indian ESDM Market
http://slidepdf.com/reader/full/iesa-fs-report-indian-esdm-market 62/172
IESA - Frost & Sullivan : Indian ESDM Market CONFIDENTIAL IESA COPYRIGHT
There are no manufacturers of digital cameras in the country and India is flooded with competition from foreign manufacturers.
Besides the top 3 players who control almost 95 per cent of the market in India, there are other foreign players with varying
capabilities. All of them import the digital camera as a finished product resulting in no local value addition. From an Indian
ecosystem standpoint, with regard to components, all the core chips, LCD display, battery pack, sensors, lens etc., are importedwhile only a limited amount of local capability exists for the peripherals and LCD drivers.
The table below captures the capability in India across the digital camera value chain.
Category Product Local SupplyLocal
Manufacturing
Local IP
CapabilityCompany Names
Level of
Local Value
Add
Remarks
Components
and Sub
systems
Image sensor Imports No NoSamsung, Canon,
Toshiba, AOFNA
Lack of high quality raw
materials
Memory Imports No NoAOF, Canon, Foba,
etcNA
Battery Pack Imports No No Electra, AOF, Foba NA
Lens Imports No NoAOF, Canon,
Tamron, OlympusNA
Japan holds the highest
number of patents; no
design capability
Image Processor Imports No NoCanon, Sony,
ToshibaNA
LCD Controller,
Capacitor,peripherals
Imports No No AOF, Unorganizedplayers
NA
Local manufacturing
capability exists, but no
OEM prefers to do anykind of assembly activity
locally
Digital
Camera
OEM Yes No No Canon, Nikon, Sony NA
EMS No No No NA NA
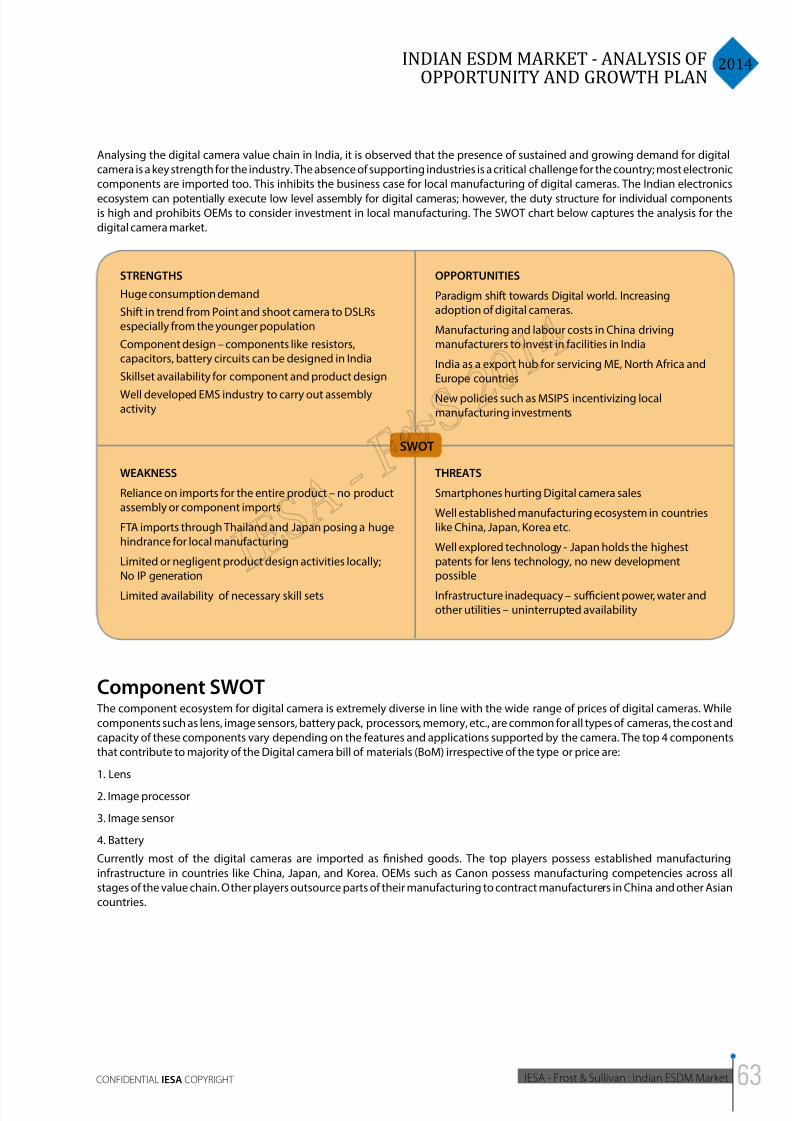
8/11/2019 IESA FS Report Indian ESDM Market
http://slidepdf.com/reader/full/iesa-fs-report-indian-esdm-market 63/172
2014INDIAN ESDM MARKET - ANALYSIS OF
OPPORTUNITY AND GROWTH PLAN
IESA - Frost & Sullivan : Indian ESDM MarketCONFIDENTIAL IESA COPYRIGHT
Analysing the digital camera value chain in India, it is observed that the presence of sustained and growing demand for digital
camera is a key strength for the industry. The absence of supporting industries is a critical challenge for the country; most electronic
components are imported too. This inhibits the business case for local manufacturing of digital cameras. The Indian electronics
ecosystem can potentially execute low level assembly for digital cameras; however, the duty structure for individual componentsis high and prohibits OEMs to consider investment in local manufacturing. The SWOT chart below captures the analysis for the
digital camera market.
STRENGTHS
Huge consumption demand
Shift in trend from Point and shoot camera to DSLRsespecially from the younger population
Component design – components like resistors,capacitors, battery circuits can be designed in India
Skillset availability for component and product design
Well developed EMS industry to carry out assemblyactivity
OPPORTUNITIES
Paradigm shift towards Digital world. Increasingadoption of digital cameras.
Manufacturing and labour costs in China drivingmanufacturers to invest in facilities in India
India as a export hub for servicing ME, North Africa andEurope countries
New policies such as MSIPS incentivizing localmanufacturing investments
WEAKNESS
Reliance on imports for the entire product – no productassembly or component imports
FTA imports through Thailand and Japan posing a hugehindrance for local manufacturing
Limited or negligent product design activities locally;No IP generation
Limited availability of necessary skill sets
THREATS
Smartphones hurting Digital camera sales
Well established manufacturing ecosystem in countrieslike China, Japan, Korea etc.
Well explored technology - Japan holds the highestpatents for lens technology, no new developmentpossible
Infrastructure inadequacy – sucient power, water andother utilities – uninterrupted availability
SWOT
Component SWOT The component ecosystem for digital camera is extremely diverse in line with the wide range of prices of digital cameras. While
components such as lens, image sensors, battery pack, processors, memory, etc., are common for all types of cameras, the cost and
capacity of these components vary depending on the features and applications supported by the camera. The top 4 components
that contribute to majority of the Digital camera bill of materials (BoM) irrespective of the type or price are:
1. Lens
2. Image processor
3. Image sensor
4. Battery
Currently most of the digital cameras are imported as finished goods. The top players possess established manufacturing
infrastructure in countries like China, Japan, and Korea. OEMs such as Canon possess manufacturing competencies across all
stages of the value chain. Other players outsource parts of their manufacturing to contract manufacturers in China and other Asian
countries.
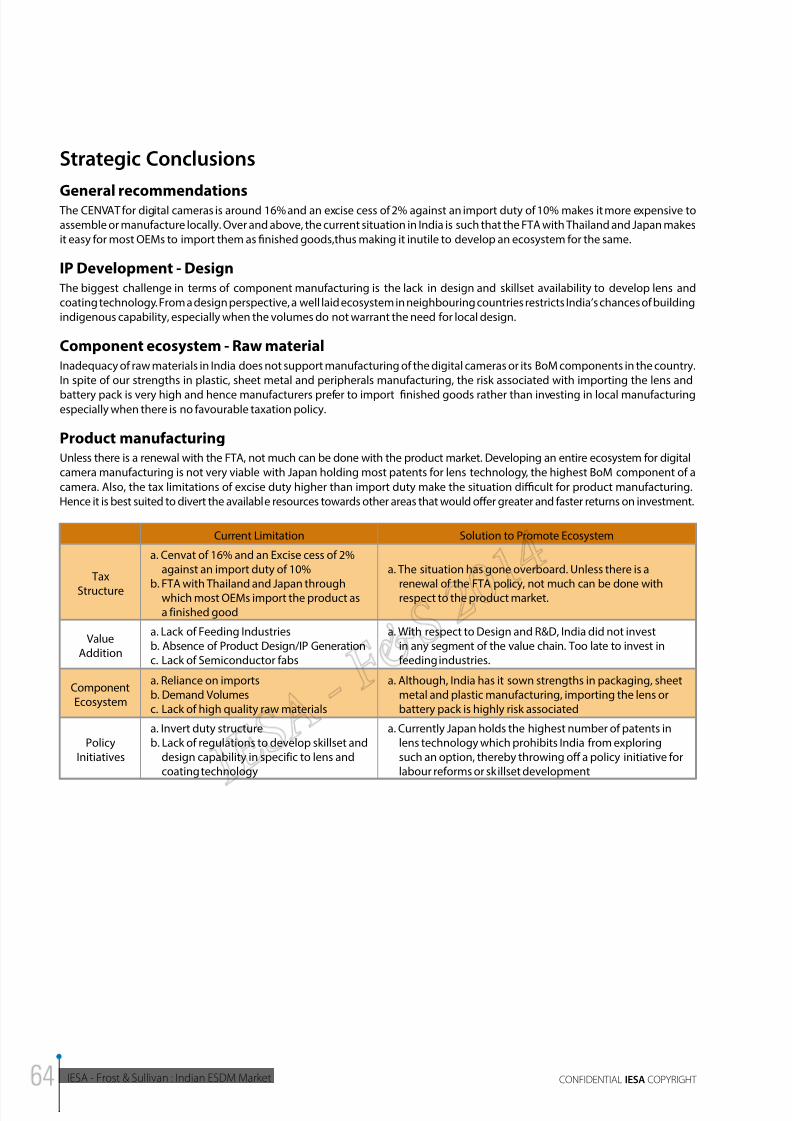
8/11/2019 IESA FS Report Indian ESDM Market
http://slidepdf.com/reader/full/iesa-fs-report-indian-esdm-market 64/172
IESA - Frost & Sullivan : Indian ESDM Market CONFIDENTIAL IESA COPYRIGHT
Strategic Conclusions
General recommendations The CENVAT for digital cameras is around 16% and an excise cess of 2% against an import duty of 10% makes it more expensive to
assemble or manufacture locally. Over and above, the current situation in India is such that the FTA with Thailand and Japan makes
it easy for most OEMs to import them as finished goods,thus making it inutile to develop an ecosystem for the same.
IP Development - Design The biggest challenge in terms of component manufacturing is the lack in design and skillset availability to develop lens and
coating technology. From a design perspective, a well laid ecosystem in neighbouring countries restricts India’s chances of building
indigenous capability, especially when the volumes do not warrant the need for local design.
Component ecosystem - Raw materialInadequacy of raw materials in India does not support manufacturing of the digital cameras or its BoM components in the country.
In spite of our strengths in plastic, sheet metal and peripherals manufacturing, the risk associated with importing the lens and
battery pack is very high and hence manufacturers prefer to import finished goods rather than investing in local manufacturingespecially when there is no favourable taxation policy.
Product manufacturingUnless there is a renewal with the FTA, not much can be done with the product market. Developing an entire ecosystem for digital
camera manufacturing is not very viable with Japan holding most patents for lens technology, the highest BoM component of a
camera. Also, the tax limitations of excise duty higher than import duty make the situation dicult for product manufacturing.
Hence it is best suited to divert the available resources towards other areas that would offer greater and faster returns on investment.
Current Limitation Solution to Promote Ecosystem
Tax
Structure
a. Cenvat of 16% and an Excise cess of 2%against an import duty of 10%
b. FTA with Thailand and Japan throughwhich most OEMs import the product asa finished good
a. The situation has gone overboard. Unless there is a
renewal of the FTA policy, not much can be done withrespect to the product market.
ValueAddition
a. Lack of Feeding Industriesb. Absence of Product Design/IP Generationc. Lack of Semiconductor fabs
a. With respect to Design and R&D, India did not investin any segment of the value chain. Too late to invest infeeding industries.
ComponentEcosystem
a. Reliance on importsb. Demand Volumesc. Lack of high quality raw materials
a. Although, India has it sown strengths in packaging, sheetmetal and plastic manufacturing, importing the lens orbattery pack is highly risk associated
PolicyInitiatives
a. Invert duty structureb. Lack of regulations to develop skillset and
design capability in specific to lens andcoating technology
a. Currently Japan holds the highest number of patents inlens technology which prohibits India from exploringsuch an option, thereby throwing off a policy initiative forlabour reforms or skillset development
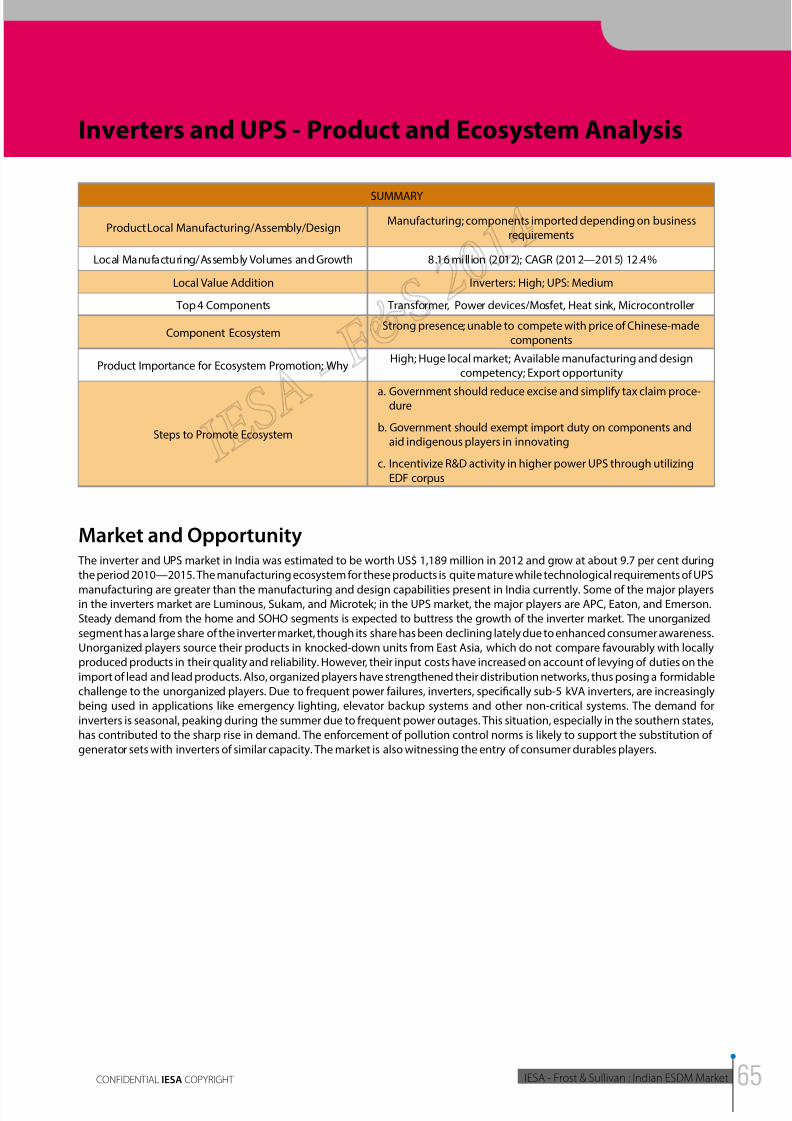
8/11/2019 IESA FS Report Indian ESDM Market
http://slidepdf.com/reader/full/iesa-fs-report-indian-esdm-market 65/172
2014INDIAN ESDM MARKET - ANALYSIS OF
OPPORTUNITY AND GROWTH PLAN
IESA - Frost & Sullivan : Indian ESDM MarketCONFIDENTIAL IESA COPYRIGHT
Inverters and UPS - Product and Ecosystem Analysis
SUMMARY
Product Local Manufacturing/Assembly/DesignManufacturing; components imported depending on business
requirements
Local Manufacturing/Assembly Volumes and Growth 8.16 million (2012); CAGR (2012—2015) 12.4%
Local Value Addition Inverters: High; UPS: Medium
Top 4 Components Transformer, Power devices/Mosfet, Heat sink, Microcontroller
Component EcosystemStrong presence; unable to compete with price of Chinese-made
components
Product Importance for Ecosystem Promotion; WhyHigh; Huge local market; Available manufacturing and design
competency; Export opportunity
Steps to Promote Ecosystem
a. Government should reduce excise and simplify tax claim proce-dure
b. Government should exempt import duty on components andaid indigenous players in innovating
c. Incentivize R&D activity in higher power UPS through utilizing
EDF corpus
Market and Opportunity The inverter and UPS market in India was estimated to be worth US$ 1,189 million in 2012 and grow at about 9.7 per cent during
the period 2010—2015. The manufacturing ecosystem for these products is quite mature while technological requirements of UPS
manufacturing are greater than the manufacturing and design capabilities present in India currently. Some of the major playersin the inverters market are Luminous, Sukam, and Microtek; in the UPS market, the major players are APC, Eaton, and Emerson.
Steady demand from the home and SOHO segments is expected to buttress the growth of the inverter market. The unorganized
segment has a large share of the inverter market, though its share has been declining lately due to enhanced consumer awareness.
Unorganized players source their products in knocked-down units from East Asia, which do not compare favourably with locally
produced products in their quality and reliability. However, their input costs have increased on account of levying of duties on the
import of lead and lead products. Also, organized players have strengthened their distribution networks, thus posing a formidable
challenge to the unorganized players. Due to frequent power failures, inverters, specifically sub-5 kVA inverters, are increasingly
being used in applications like emergency lighting, elevator backup systems and other non-critical systems. The demand for
inverters is seasonal, peaking during the summer due to frequent power outages. This situation, especially in the southern states,
has contributed to the sharp rise in demand. The enforcement of pollution control norms is likely to support the substitution of
generator sets with inverters of similar capacity. The market is also witnessing the entry of consumer durables players.
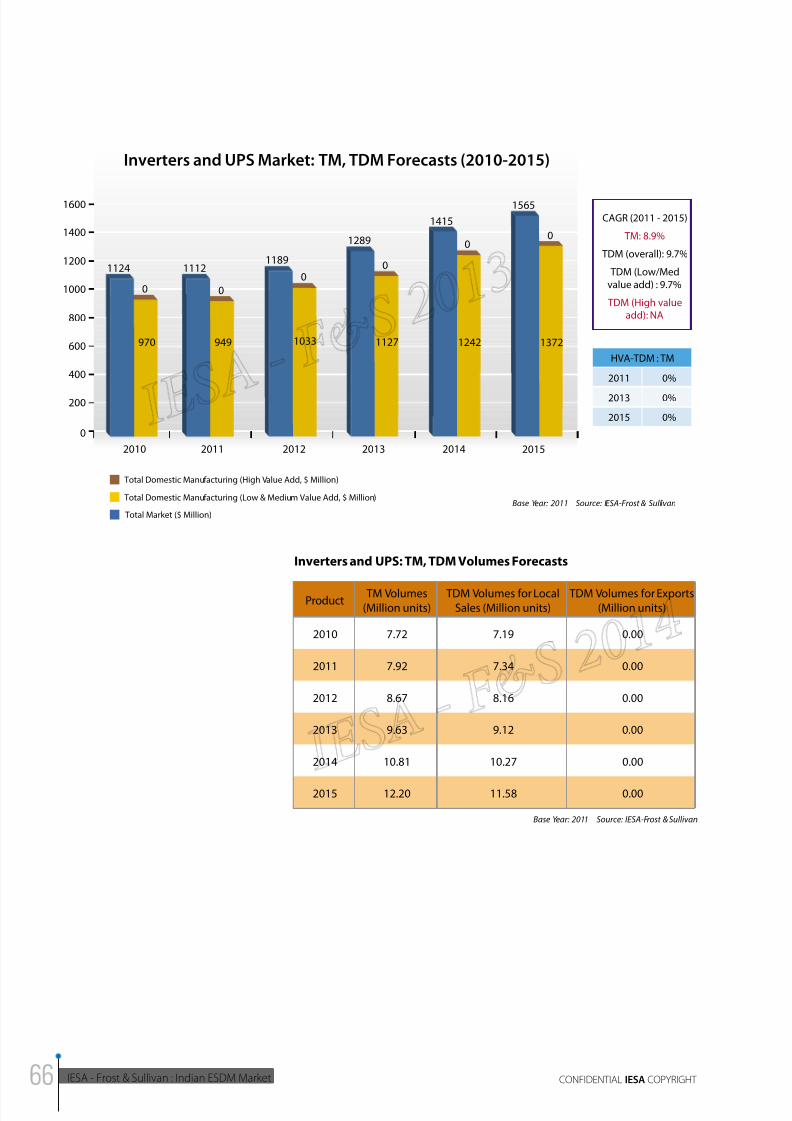
8/11/2019 IESA FS Report Indian ESDM Market
http://slidepdf.com/reader/full/iesa-fs-report-indian-esdm-market 66/172
IESA - Frost & Sullivan : Indian ESDM Market CONFIDENTIAL IESA COPYRIGHT
Inverters and UPS: TM, TDM Volumes Forecasts
Product TM Volumes(Million units)
TDM Volumes for LocalSales (Million units)
TDM Volumes for Exports(Million units)
2010 7.72 7.19 0.00
2011 7.92 7.34 0.00
2012 8.67 8.16 0.00
2013 9.63 9.12 0.00
2014 10.81 10.27 0.00
2015 12.20 11.58 0.00
Base Year: 2011 Source: IESA-Frost & Sullivan
1565
0
0
200
400
600
800
1000
1200
1600
1400
20112010 2012 2013 2014 2015
Inverters and UPS Market: TM, TDM Forecasts (2010-2015)
HVA-TDM : TM
2011
2013
2015
0%
0%
0%
Total Market ($ Million)
Total Domestic Manufacturing (High Value Add, $ Million)
Total Domestic Manufacturing (Low & Medium Value Add, $ Million)Base Year: 2011 Source: IESA-Frost & Sullivan
CAGR (2011 - 2015)
TM: 8.9%
TDM (overall): 9.7%
TDM (Low/Med
value add) : 9.7%
TDM (High valueadd): NA
13721242
0
1415
1289
0
1127
1189
0
1033949
0
1112
0
1124
970
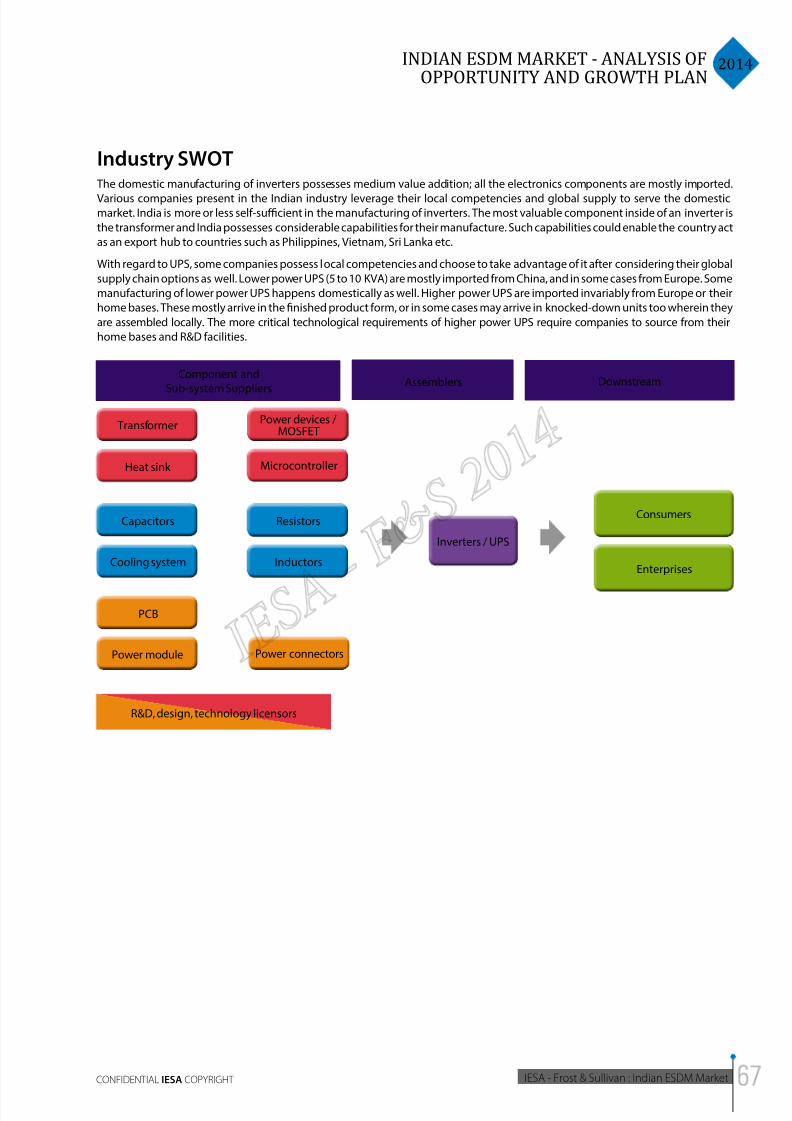
8/11/2019 IESA FS Report Indian ESDM Market
http://slidepdf.com/reader/full/iesa-fs-report-indian-esdm-market 67/172
2014INDIAN ESDM MARKET - ANALYSIS OF
OPPORTUNITY AND GROWTH PLAN
IESA - Frost & Sullivan : Indian ESDM MarketCONFIDENTIAL IESA COPYRIGHT
Industry SWOT The domestic manufacturing of inverters possesses medium value addition; all the electronics components are mostly imported.
Various companies present in the Indian industry leverage their local competencies and global supply to serve the domesticmarket. India is more or less self-sucient in the manufacturing of inverters. The most valuable component inside of an inverter is
the transformer and India possesses considerable capabilities for their manufacture. Such capabilities could enable the country act
as an export hub to countries such as Philippines, Vietnam, Sri Lanka etc.
With regard to UPS, some companies possess local competencies and choose to take advantage of it after considering their global
supply chain options as well. Lower power UPS (5 to 10 KVA) are mostly imported from China, and in some cases from Europe. Some
manufacturing of lower power UPS happens domestically as well. Higher power UPS are imported invariably from Europe or their
home bases. These mostly arrive in the finished product form, or in some cases may arrive in knocked-down units too wherein they
are assembled locally. The more critical technological requirements of higher power UPS require companies to source from their
home bases and R&D facilities.
Component and
Sub-system Suppliers
Transformer
Heat sink
Power devices /MOSFET
Microcontroller
Enterprises
Consumers
Power connectors
Capacitors
Cooling system
Inverters / UPS
Resistors
Inductors
PCB
Power module
Assemblers Downstream
R&D, design, technology licensors
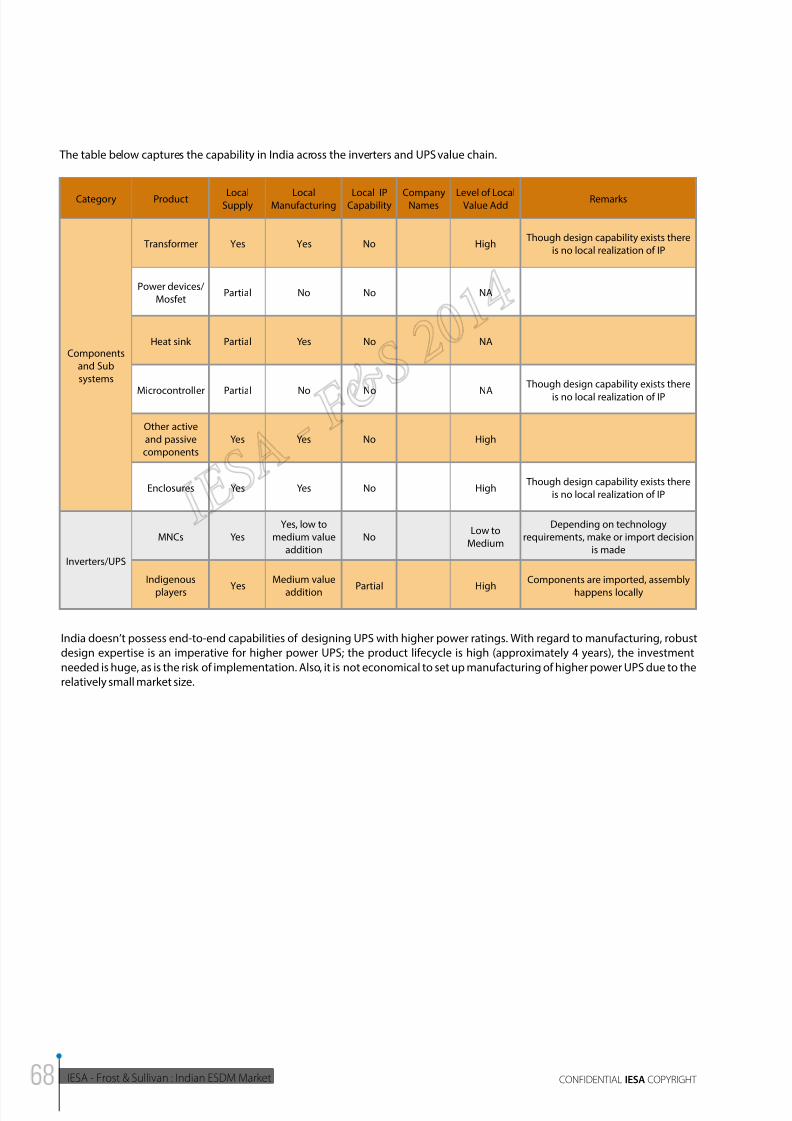
8/11/2019 IESA FS Report Indian ESDM Market
http://slidepdf.com/reader/full/iesa-fs-report-indian-esdm-market 68/172
IESA - Frost & Sullivan : Indian ESDM Market CONFIDENTIAL IESA COPYRIGHT
India doesn’t possess end-to-end capabilities of designing UPS with higher power ratings. With regard to manufacturing, robust
design expertise is an imperative for higher power UPS; the product lifecycle is high (approximately 4 years), the investment
needed is huge, as is the risk of implementation. Also, it is not economical to set up manufacturing of higher power UPS due to the
relatively small market size.
The table below captures the capability in India across the inverters and UPS value chain.
Category Product LocalSupply LocalManufacturing Local IPCapability CompanyNames Level of LocalValue Add Remarks
Components
and Sub
systems
Transformer Yes Yes No High Though design capability exists there
is no local realization of IP
Power devices/
MosfetPartial No No NA
Heat sink Partial Yes No NA
Microcontroller Partial No No NA
Though design capability exists there
is no local realization of IP
Other active
and passive
components
Yes Yes No High
Enclosures Yes Yes No High Though design capability exists there
is no local realization of IP
Inverters/UPS
MNCs Yes
Yes, low to
medium value
addition
NoLow to
Medium
Depending on technology
requirements, make or import decision
is made
Indigenous
players Yes
Medium value
addition Partial High
Components are imported, assembly
happens locally
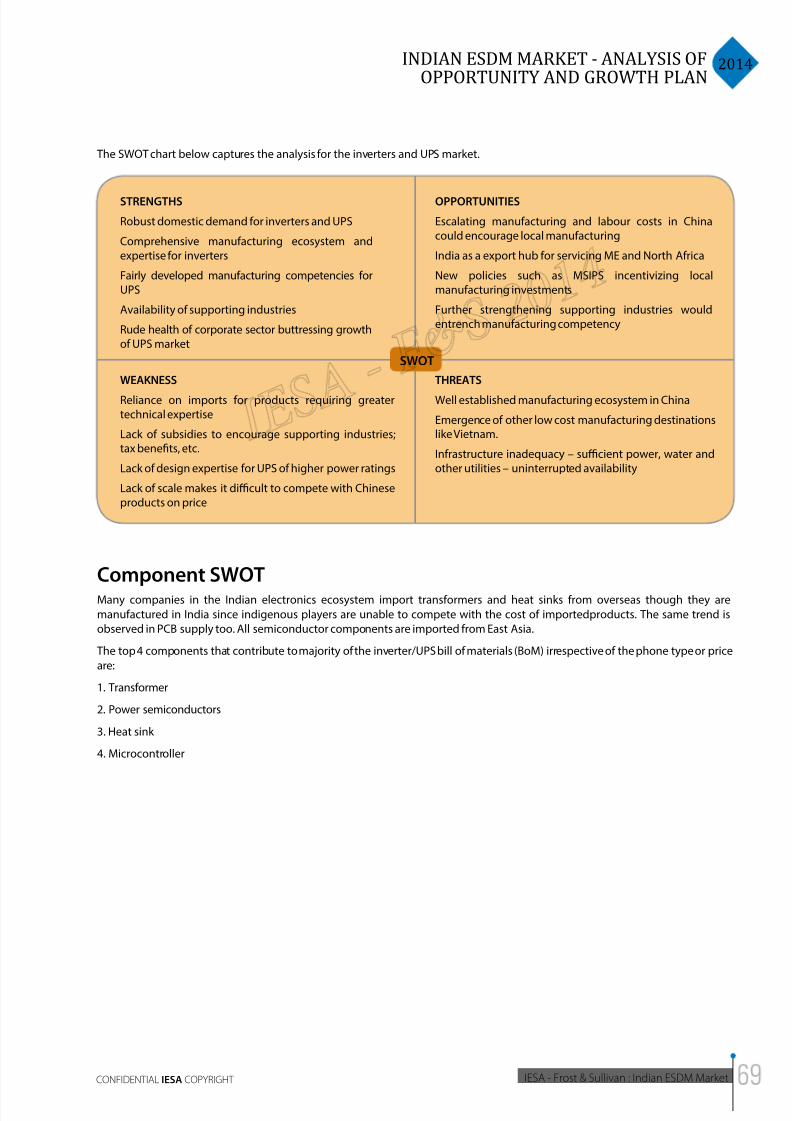
8/11/2019 IESA FS Report Indian ESDM Market
http://slidepdf.com/reader/full/iesa-fs-report-indian-esdm-market 69/172
2014INDIAN ESDM MARKET - ANALYSIS OF
OPPORTUNITY AND GROWTH PLAN
IESA - Frost & Sullivan : Indian ESDM MarketCONFIDENTIAL IESA COPYRIGHT
STRENGTHS
Robust domestic demand for inverters and UPS
Comprehensive manufacturing ecosystem andexpertise for inverters
Fairly developed manufacturing competencies forUPS
Availability of supporting industries
Rude health of corporate sector buttressing growthof UPS market
OPPORTUNITIES
Escalating manufacturing and labour costs in Chinacould encourage local manufacturing
India as a export hub for servicing ME and North Africa
New policies such as MSIPS incentivizing localmanufacturing investments
Further strengthening supporting industries wouldentrench manufacturing competency
WEAKNESS
Reliance on imports for products requiring greatertechnical expertise
Lack of subsidies to encourage supporting industries;tax benefits, etc.
Lack of design expertise for UPS of higher power ratings
Lack of scale makes it dicult to compete with Chineseproducts on price
THREATS
Well established manufacturing ecosystem in China
Emergence of other low cost manufacturing destinationslike Vietnam.
Infrastructure inadequacy – sucient power, water andother utilities – uninterrupted availability
SWOT
Component SWOTMany companies in the Indian electronics ecosystem import transformers and heat sinks from overseas though they are
manufactured in India since indigenous players are unable to compete with the cost of importedproducts. The same trend is
observed in PCB supply too. All semiconductor components are imported from East Asia.
The top 4 components that contribute to majority of the inverter/UPS bill of materials (BoM) irrespective of the phone type or price
are:
1. Transformer
2. Power semiconductors
3. Heat sink
4. Microcontroller
The SWOT chart below captures the analysis for the inverters and UPS market.
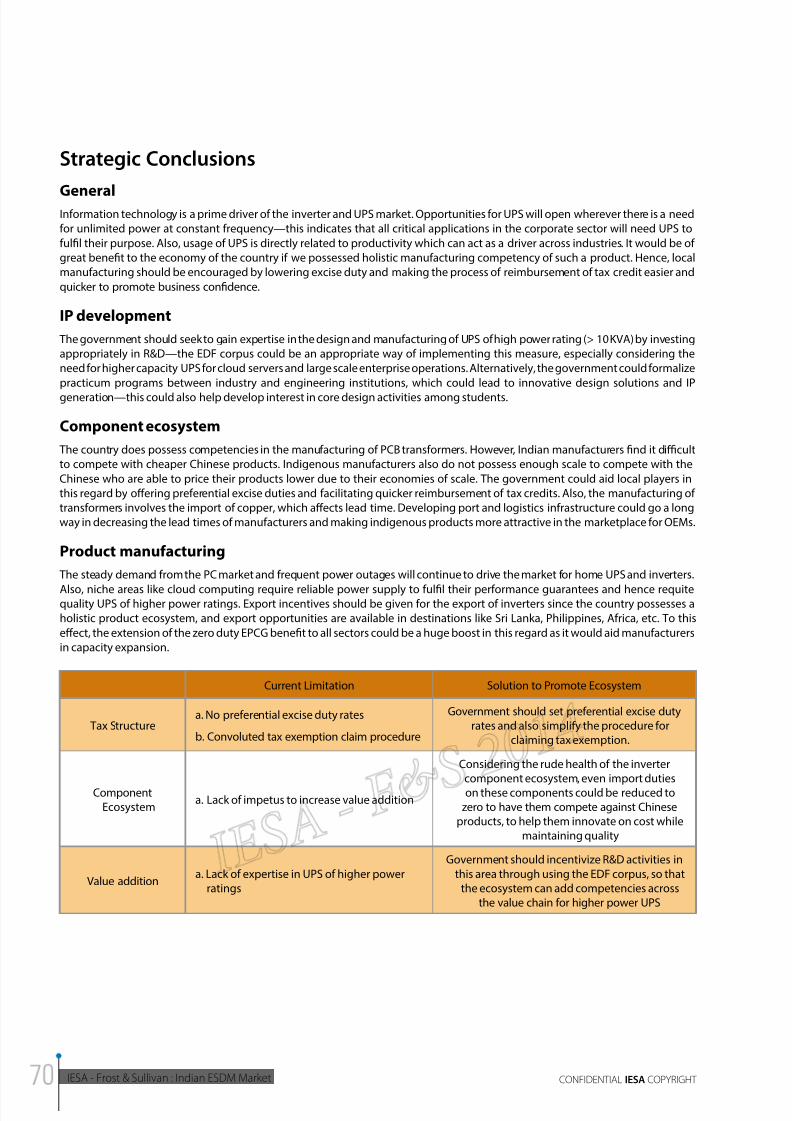
8/11/2019 IESA FS Report Indian ESDM Market
http://slidepdf.com/reader/full/iesa-fs-report-indian-esdm-market 70/172
IESA - Frost & Sullivan : Indian ESDM Market CONFIDENTIAL IESA COPYRIGHT
Current Limitation Solution to Promote Ecosystem
Tax Structurea. No preferential excise duty rates
b. Convoluted tax exemption claim procedure
Government should set preferential excise dutyrates and also simplify the procedure for
claiming tax exemption.
ComponentEcosystem
a. Lack of impetus to increase value addition
Considering the rude health of the invertercomponent ecosystem, even import dutieson these components could be reduced to
zero to have them compete against Chineseproducts, to help them innovate on cost while
maintaining quality
Value additiona. Lack of expertise in UPS of higher power
ratings
Government should incentivize R&D activities in
this area through using the EDF corpus, so thatthe ecosystem can add competencies across
the value chain for higher power UPS
Strategic Conclusions
GeneralInformation technology is a prime driver of the inverter and UPS market. Opportunities for UPS will open wherever there is a need
for unlimited power at constant frequency—this indicates that all critical applications in the corporate sector will need UPS to
fulfil their purpose. Also, usage of UPS is directly related to productivity which can act as a driver across industries. It would be of
great benefit to the economy of the country if we possessed holistic manufacturing competency of such a product. Hence, local
manufacturing should be encouraged by lowering excise duty and making the process of reimbursement of tax credit easier and
quicker to promote business confidence.
IP development
The government should seek to gain expertise in the design and manufacturing of UPS of high power rating (> 10 KVA) by investing
appropriately in R&D—the EDF corpus could be an appropriate way of implementing this measure, especially considering the
need for higher capacity UPS for cloud servers and large scale enterprise operations. Alternatively, the government could formalize
practicum programs between industry and engineering institutions, which could lead to innovative design solutions and IP
generation—this could also help develop interest in core design activities among students.
Component ecosystem
The country does possess competencies in the manufacturing of PCB transformers. However, Indian manufacturers nd it dicult
to compete with cheaper Chinese products. Indigenous manufacturers also do not possess enough scale to compete with the
Chinese who are able to price their products lower due to their economies of scale. The government could aid local players in
this regard by offering preferential excise duties and facilitating quicker reimbursement of tax credits. Also, the manufacturing of
transformers involves the import of copper, which affects lead time. Developing port and logistics infrastructure could go a long
way in decreasing the lead times of manufacturers and making indigenous products more attractive in the marketplace for OEMs.
Product manufacturing
The steady demand from the PC market and frequent power outages will continue to drive the market for home UPS and inverters.
Also, niche areas like cloud computing require reliable power supply to fulfil their performance guarantees and hence requitequality UPS of higher power ratings. Export incentives should be given for the export of inverters since the country possesses a
holistic product ecosystem, and export opportunities are available in destinations like Sri Lanka, Philippines, Africa, etc. To this
effect, the extension of the zero duty EPCG benefit to all sectors could be a huge boost in this regard as it would aid manufacturers
in capacity expansion.
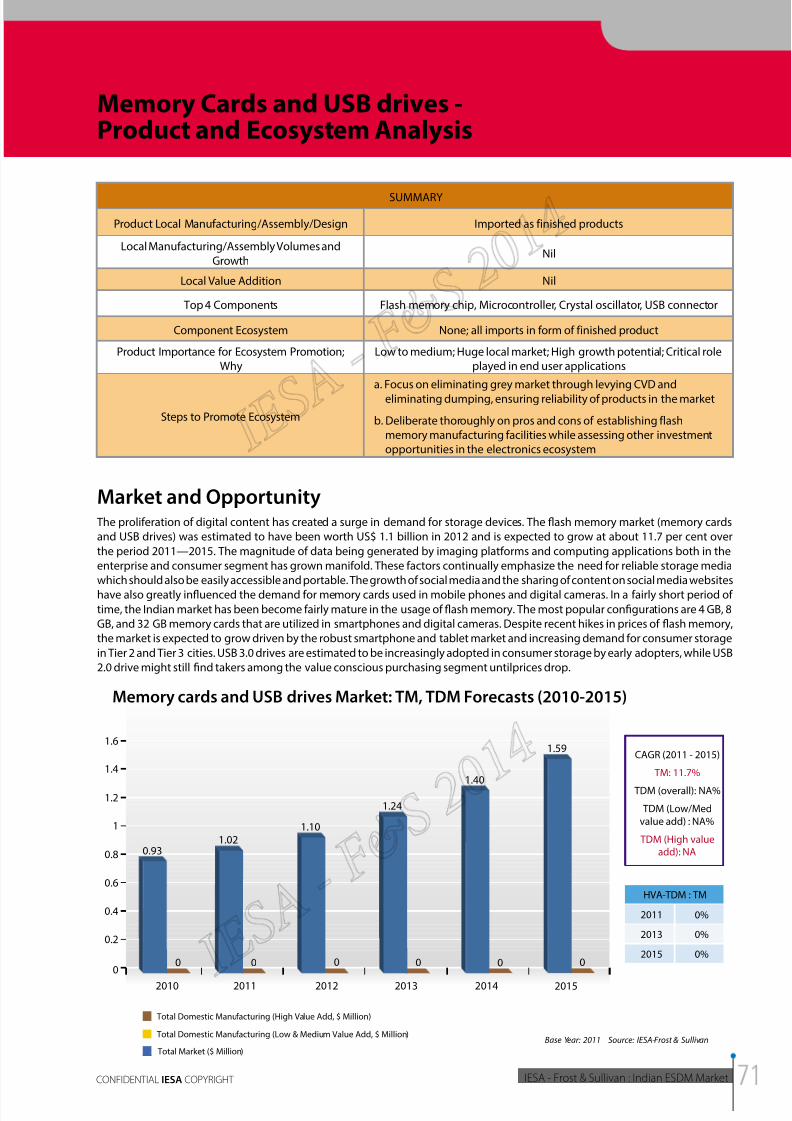
8/11/2019 IESA FS Report Indian ESDM Market
http://slidepdf.com/reader/full/iesa-fs-report-indian-esdm-market 71/172
2014INDIAN ESDM MARKET - ANALYSIS OF
OPPORTUNITY AND GROWTH PLAN
IESA - Frost & Sullivan : Indian ESDM MarketCONFIDENTIAL IESA COPYRIGHT
Memory Cards and USB drives -Product and Ecosystem Analysis
SUMMARY
Product Local Manufacturing/Assembly/Design Imported as finished products
Local Manufacturing/Assembly Volumes and
GrowthNil
Local Value Addition Nil
Top 4 Components Flash memory chip, Microcontroller, Crystal oscillator, USB connector
Component Ecosystem None; all imports in form of finished product
Product Importance for Ecosystem Promotion;Why
Low to medium; Huge local market; High growth potential; Critical roleplayed in end user applications
Steps to Promote Ecosystem
a. Focus on eliminating grey market through levying CVD and
eliminating dumping, ensuring reliability of products in the market
b. Deliberate thoroughly on pros and cons of establishing flashmemory manufacturing facilities while assessing other investmentopportunities in the electronics ecosystem
Market and Opportunity The proliferation of digital content has created a surge in demand for storage devices. The flash memory market (memory cards
and USB drives) was estimated to have been worth US$ 1.1 billion in 2012 and is expected to grow at about 11.7 per cent over
the period 2011—2015. The magnitude of data being generated by imaging platforms and computing applications both in the
enterprise and consumer segment has grown manifold. These factors continually emphasize the need for reliable storage media
which should also be easily accessible and portable. The growth of social media and the sharing of content on social media websites
have also greatly influenced the demand for memory cards used in mobile phones and digital cameras. In a fairly short period of
time, the Indian market has been become fairly mature in the usage of flash memory. The most popular configurations are 4 GB, 8
GB, and 32 GB memory cards that are utilized in smartphones and digital cameras. Despite recent hikes in prices of flash memory,
the market is expected to grow driven by the robust smartphone and tablet market and increasing demand for consumer storage
in Tier 2 and Tier 3 cities. USB 3.0 drives are estimated to be increasingly adopted in consumer storage by early adopters, while USB
2.0 drive might still find takers among the value conscious purchasing segment untilprices drop.
1.59
0
0.2
0.4
0.6
0.8
1
1.2
1.6
1.4
20112010 2012 2013 2014 2015
Memory cards and USB drives Market: TM, TDM Forecasts (2010-2015)
HVA-TDM : TM
2011
2013
2015
0%
0%
0%
Total Market ($ Million)
Total Domestic Manufacturing (High Value Add, $ Million)
Total Domestic Manufacturing (Low & Medium Value Add, $ Million)Base Year: 2011 Source: IESA-Frost & Sullivan
CAGR (2011 - 2015)
TM: 11.7%
TDM (overall): NA%
TDM (Low/Med
value add) : NA%
TDM (High valueadd): NA
1.40
1.24
0 0 0
1.10
00
1.02
0
0.93
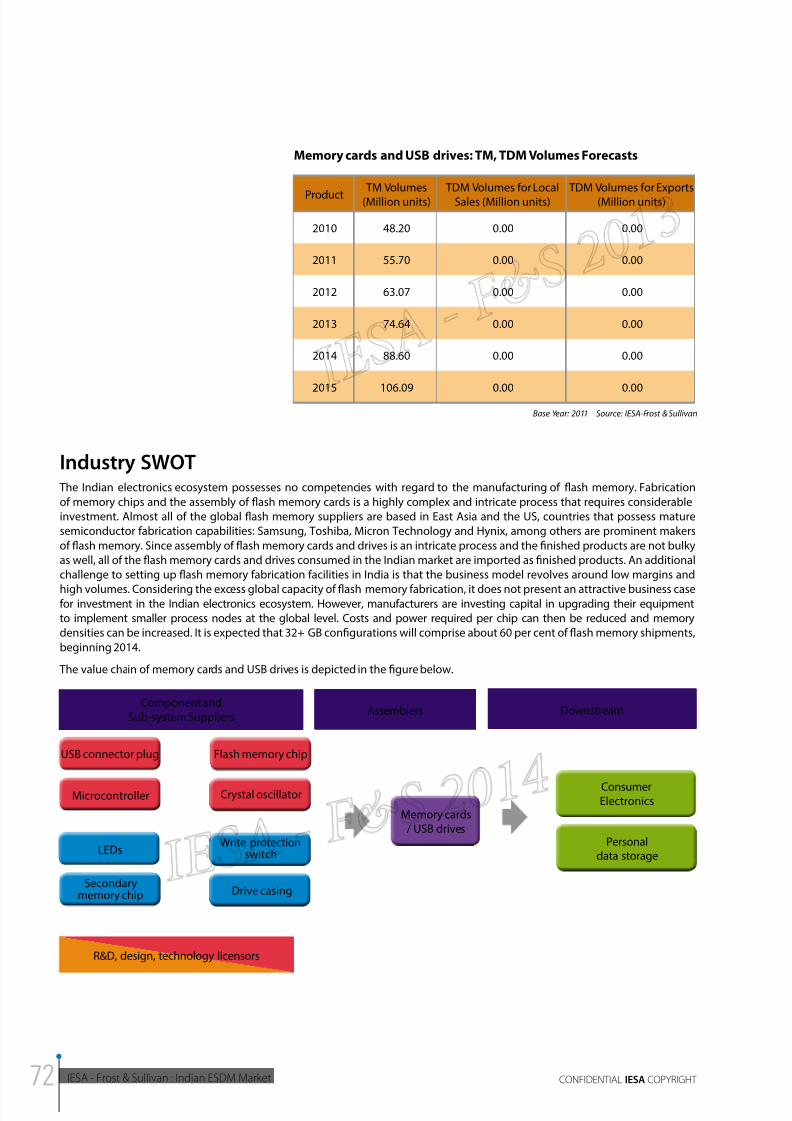
8/11/2019 IESA FS Report Indian ESDM Market
http://slidepdf.com/reader/full/iesa-fs-report-indian-esdm-market 72/172
IESA - Frost & Sullivan : Indian ESDM Market CONFIDENTIAL IESA COPYRIGHT
Memory cards and USB drives: TM, TDM Volumes Forecasts
Product TM Volumes(Million units)
TDM Volumes for LocalSales (Million units)
TDM Volumes for Exports(Million units)
2010 48.20 0.00 0.00
2011 55.70 0.00 0.00
2012 63.07 0.00 0.00
2013 74.64 0.00 0.00
2014 88.60 0.00 0.00
2015 106.09 0.00 0.00
Base Year: 2011 Source: IESA-Frost & Sullivan
Industry SWOT The Indian electronics ecosystem possesses no competencies with regard to the manufacturing of flash memory. Fabrication
of memory chips and the assembly of flash memory cards is a highly complex and intricate process that requires considerable
investment. Almost all of the global flash memory suppliers are based in East Asia and the US, countries that possess mature
semiconductor fabrication capabilities: Samsung, Toshiba, Micron Technology and Hynix, among others are prominent makers
of flash memory. Since assembly of flash memory cards and drives is an intricate process and the finished products are not bulky
as well, all of the flash memory cards and drives consumed in the Indian market are imported as finished products. An additional
challenge to setting up flash memory fabrication facilities in India is that the business model revolves around low margins and
high volumes. Considering the excess global capacity of flash memory fabrication, it does not present an attractive business casefor investment in the Indian electronics ecosystem. However, manufacturers are investing capital in upgrading their equipment
to implement smaller process nodes at the global level. Costs and power required per chip can then be reduced and memory
densities can be increased. It is expected that 32+ GB configurations will comprise about 60 per cent of flash memory shipments,
beginning 2014.
The value chain of memory cards and USB drives is depicted in the figure below.
Component andSub-system Suppliers
USB connector plug
Microcontroller
Flash memory chip
Crystal oscillator
Personaldata storage
ConsumerElectronics
LEDs
Secondarymemory chip
Memory cards / USB drives
Drive casing
Assemblers Downstream
R&D, design, technology licensors
Write protectionswitch
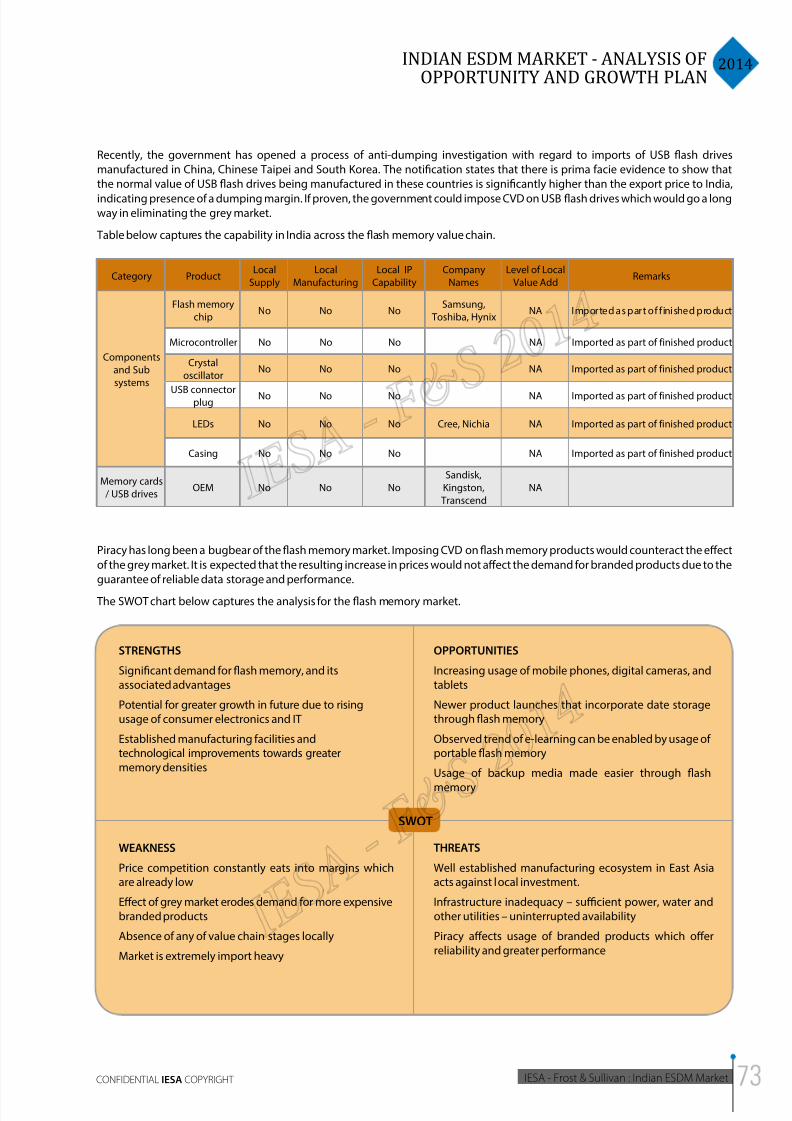
8/11/2019 IESA FS Report Indian ESDM Market
http://slidepdf.com/reader/full/iesa-fs-report-indian-esdm-market 73/172
2014INDIAN ESDM MARKET - ANALYSIS OF
OPPORTUNITY AND GROWTH PLAN
IESA - Frost & Sullivan : Indian ESDM MarketCONFIDENTIAL IESA COPYRIGHT
Recently, the government has opened a process of anti-dumping investigation with regard to imports of USB flash drives
manufactured in China, Chinese Taipei and South Korea. The notification states that there is prima facie evidence to show that
the normal value of USB flash drives being manufactured in these countries is significantly higher than the export price to India,
indicating presence of a dumping margin. If proven, the government could impose CVD on USB flash drives which would go a longway in eliminating the grey market.
Table below captures the capability in India across the flash memory value chain.
Category ProductLocal
Supply
Local
Manufacturing
Local IP
Capability
Company
Names
Level of Local
Value AddRemarks
Components
and Sub
systems
Flash memory
chipNo No No
Samsung,
Toshiba, HynixNA Imported as part of f inished product
Microcontroller No No No NA Imported as part of finished product
Crystal
oscillatorNo No No NA Imported as part of finished product
USB connectorplug
No No No NA Imported as part of finished product
LEDs No No No Cree, Nichia NA Imported as part of finished product
Casing No No No NA Imported as part of finished product
Memory cards
/ USB drivesOEM No No No
Sandisk,
Kingston,
Transcend
NA
Piracy has long been a bugbear of the flash memory market. Imposing CVD on flash memory products would counteract the effect
of the grey market. It is expected that the resulting increase in prices would not affect the demand for branded products due to the
guarantee of reliable data storage and performance.
The SWOT chart below captures the analysis for the flash memory market.
STRENGTHS
Significant demand for flash memory, and itsassociated advantages
Potential for greater growth in future due to risingusage of consumer electronics and IT
Established manufacturing facilities andtechnological improvements towards greatermemory densities
OPPORTUNITIES
Increasing usage of mobile phones, digital cameras, andtablets
Newer product launches that incorporate date storagethrough flash memory
Observed trend of e-learning can be enabled by usage ofportable flash memory
Usage of backup media made easier through flash
memory
WEAKNESS
Price competition constantly eats into margins whichare already low
Effect of grey market erodes demand for more expensivebranded products
Absence of any of value chain stages locally
Market is extremely import heavy
THREATS
Well established manufacturing ecosystem in East Asiaacts against local investment.
Infrastructure inadequacy – sucient power, water andother utilities – uninterrupted availability
Piracy affects usage of branded products which offerreliability and greater performance
SWOT
8/11/2019 IESA FS Report Indian ESDM Market
http://slidepdf.com/reader/full/iesa-fs-report-indian-esdm-market 74/172
IESA - Frost & Sullivan : Indian ESDM Market CONFIDENTIAL IESA COPYRIGHT
Component SWOT The components that make up a memory card or a USB drive are all mounted on the circuitry or the PCB itself due to the small size
of the products. The cost of manufacturing a memory card or a USB drive is quite low due to the scale achieved by flash memorysuppliers and advances in technology. All of these capabilities are present in East Asia on a large scale which acts against any
potential decisions to invest in local manfacturing capabilities. Also, due to the small size of these products and the complexity of
assembly, it is prudent to assemble memory cards and USB drives at the location of flash memory manufacturing and transport
them as finished products to market destinations. The flash memory chip accounts for nearly 80 per cent of the BoM.
In short, the top 4 components that contribute to majority of the bill of materials (BoM) are:
1. Flash memory chip
2. Microcontroller/ASIC
3. Crystal oscillator
4. USB connector
Strategic Conclusions
General
The government should impose CVD on memory cards and drives to discourage the import of unbranded products and ensure
safety of customer data.
IP development
Considering the semiconductor design strength of the country and the critical nature of memory storage, the government should
utilize the mooted EDF corpus to encourage design activity in this field. This would give the country a foothold in a valuable stage
of a ubiquitous electronics product globally. The licensing of such IP would seed a great amount of design activity and overall
economic activity. This could also be achieved on a smaller scale through a formalized practicum program wherein fabless designcompanies tie with nearby engineering colleges.
Component ecosystem
East Asian countries have already achieved scale in the manufacturing of flash memory chips and they also possess the necessary
capabilities to assembly memory cards and USB drives. Advances in memory technology and the scale achieved by flash memory
manufacturers have led to very affordable prices for these products.
Product manufacturing
Considering the low margins and the magnitude of investment required to set up a flash manufacturing facility, it seems logical to
divert the available resources towards other areas that would offer greater and faster returns on investment.However, due to the
critical nature of memory storage and the fact that it would add vital functionality to the products it is incorporated in, it would
be prudent to deliberate on the merits of attracting investment in a flash memory fabrication facility, while assessing the other
available opportunities for investment in the electronics ecosystem.
Current Limitation Solution to Promote Ecosystem
Tax Structurea. No measures present to
counteract grey market inflash memory
a. If presence of dumping margins are proved, CVD must belevied to create confidence among white market players andcreate access to reliable products for consumers
Value Additiona. Absence of flash
manufacturing facilities andassociated assembly activities
a. Considering both the low margin-high volume businessmodel of flash memory and the critical role it plays in enduser applications, considerable thought should be given toattracting investment in flash memory manufacturing in thefuture, possibly through M-SIPS or through a separate and
dedicated initiative
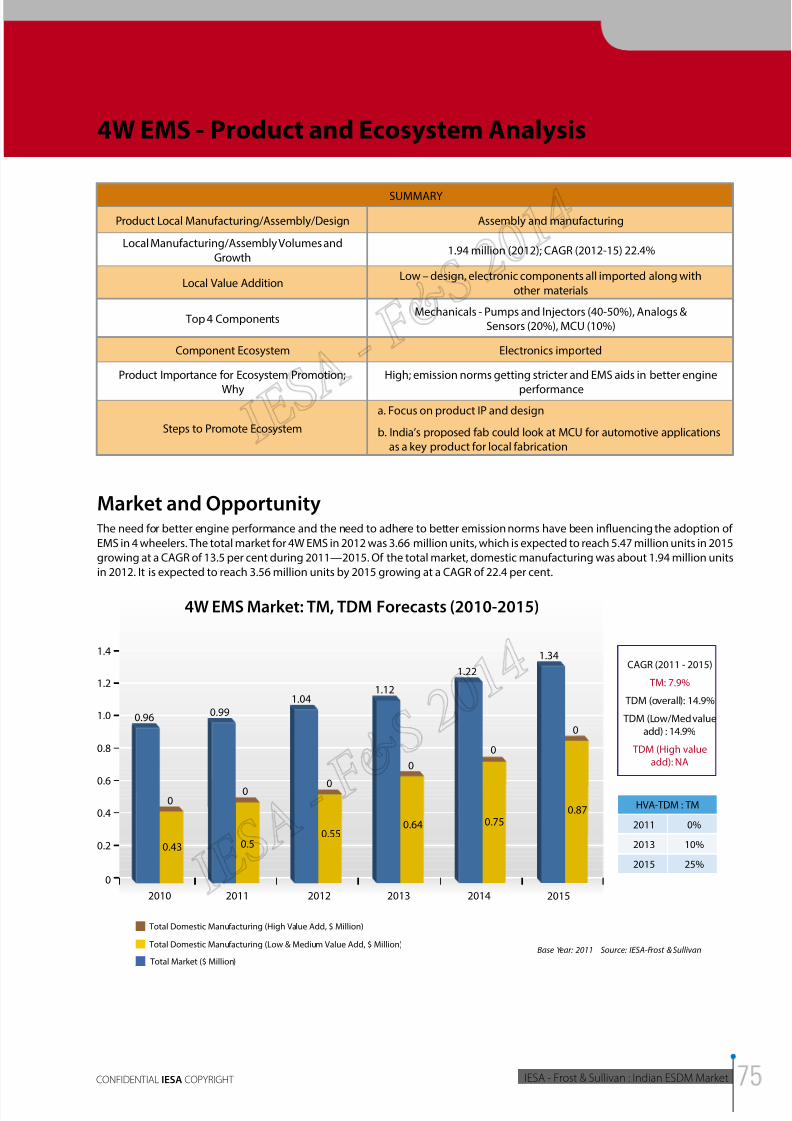
8/11/2019 IESA FS Report Indian ESDM Market
http://slidepdf.com/reader/full/iesa-fs-report-indian-esdm-market 75/172
2014INDIAN ESDM MARKET - ANALYSIS OF
OPPORTUNITY AND GROWTH PLAN
IESA - Frost & Sullivan : Indian ESDM MarketCONFIDENTIAL IESA COPYRIGHT
4W EMS - Product and Ecosystem Analysis
SUMMARY
Product Local Manufacturing/Assembly/Design Assembly and manufacturing
Local Manufacturing/Assembly Volumes and
Growth1.94 million (2012); CAGR (2012-15) 22.4%
Local Value AdditionLow – design, electronic components all imported along with
other materials
Top 4 ComponentsMechanicals - Pumps and Injectors (40-50%), Analogs &
Sensors (20%), MCU (10%)
Component Ecosystem Electronics imported
Product Importance for Ecosystem Promotion;
Why
High; emission norms getting stricter and EMS aids in better engine
performance
Steps to Promote Ecosystem
a. Focus on product IP and design
b. India’s proposed fab could look at MCU for automotive applicationsas a key product for local fabrication
Market and Opportunity The need for better engine performance and the need to adhere to better emission norms have been influencing the adoption of
EMS in 4 wheelers. The total market for 4W EMS in 2012 was 3.66 million units, which is expected to reach 5.47 million units in 2015
growing at a CAGR of 13.5 per cent during 2011—2015. Of the total market, domestic manufacturing was about 1.94 million units
in 2012. It is expected to reach 3.56 million units by 2015 growing at a CAGR of 22.4 per cent.
1.34
0
0
0.4
0.2
0.6
0.8
1.0
1.2
1.4
20112010 2012 2013 2014 2015
4W EMS Market: TM, TDM Forecasts (2010-2015)
HVA-TDM : TM
2011
2013
2015
0%
10%
25%
Total Market ($ Million)
Total Domestic Manufacturing (High Value Add, $ Million)
Total Domestic Manufacturing (Low & Medium Value Add, $ Million)Base Year: 2011 Source: IESA-Frost & Sullivan
CAGR (2011 - 2015)
TM: 7.9%
TDM (overall): 14.9%
TDM (Low/Med value
add) : 14.9%
TDM (High value
add): NA
0.87
0
1.22
1.12
0
0.64
1.04
00
0.99
0
0.96
0.43 0.50.55
0.75
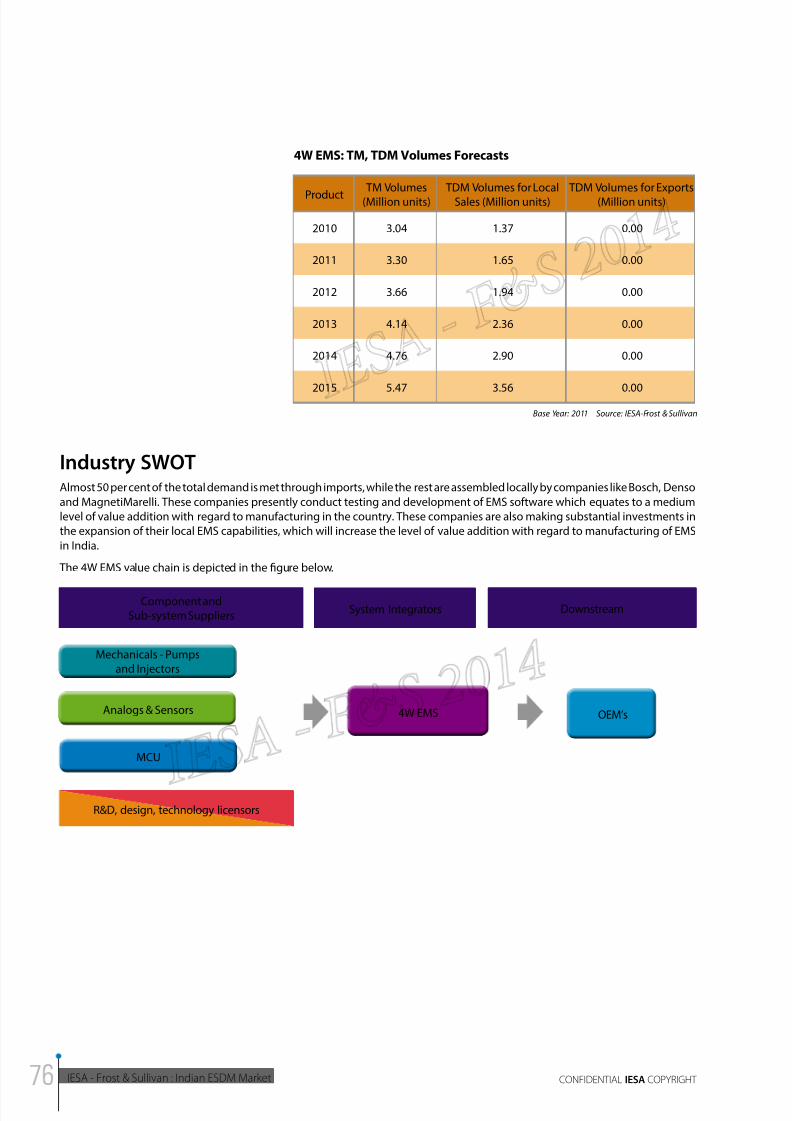
8/11/2019 IESA FS Report Indian ESDM Market
http://slidepdf.com/reader/full/iesa-fs-report-indian-esdm-market 76/172
IESA - Frost & Sullivan : Indian ESDM Market CONFIDENTIAL IESA COPYRIGHT
Industry SWOTAlmost 50 per cent of the total demand is met through imports, while the rest are assembled locally by companies like Bosch, Denso
and MagnetiMarelli. These companies presently conduct testing and development of EMS software which equates to a medium
level of value addition with regard to manufacturing in the country. These companies are also making substantial investments in
the expansion of their local EMS capabilities, which will increase the level of value addition with regard to manufacturing of EMS
in India.
The 4W EMS value chain is depicted in the figure below.
Component andSub-system Suppliers
System Integrators Downstream
Mechanicals - Pumpsand Injectors
MCU
Analogs & Sensors 4W EMS OEM’s
R&D, design, technology licensors
4W EMS: TM, TDM Volumes Forecasts
Product TM Volumes(Million units)
TDM Volumes for LocalSales (Million units)
TDM Volumes for Exports(Million units)
2010 3.04 1.37 0.00
2011 3.30 1.65 0.00
2012 3.66 1.94 0.00
2013 4.14 2.36 0.00
2014 4.76 2.90 0.00
2015 5.47 3.56 0.00
Base Year: 2011 Source: IESA-Frost & Sullivan
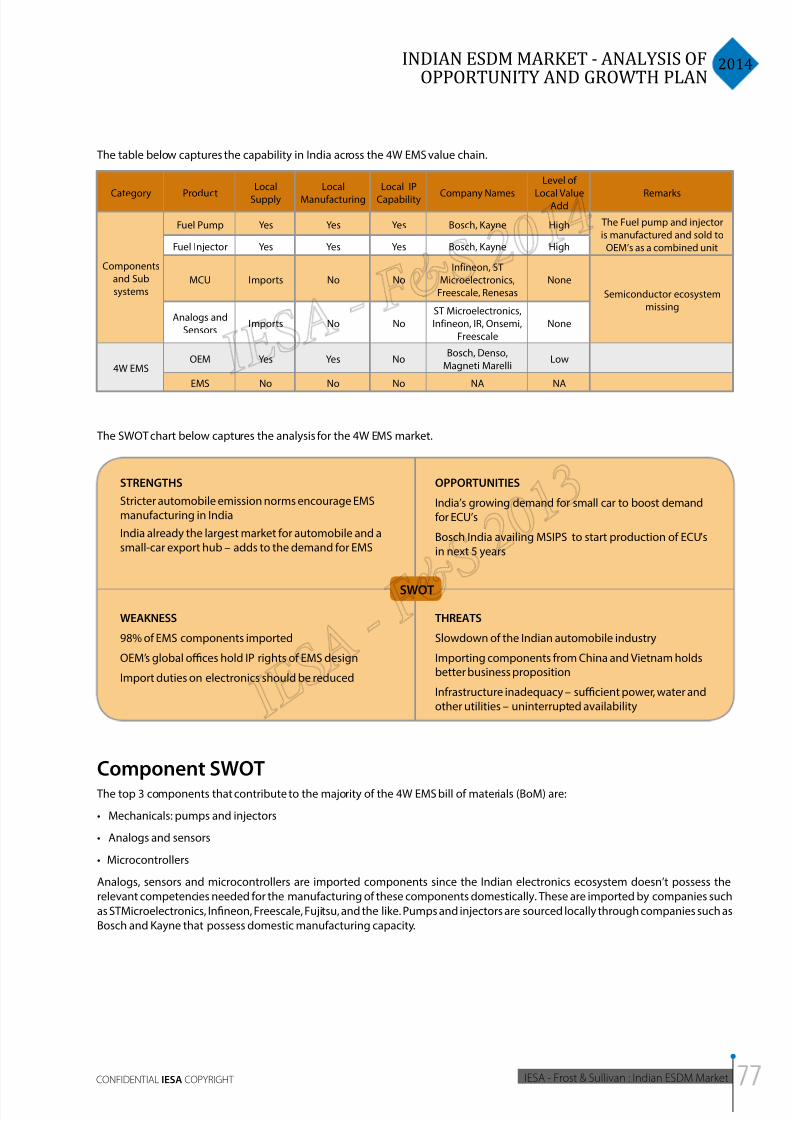
8/11/2019 IESA FS Report Indian ESDM Market
http://slidepdf.com/reader/full/iesa-fs-report-indian-esdm-market 77/172
2014INDIAN ESDM MARKET - ANALYSIS OF
OPPORTUNITY AND GROWTH PLAN
IESA - Frost & Sullivan : Indian ESDM MarketCONFIDENTIAL IESA COPYRIGHT
The table below captures the capability in India across the 4W EMS value chain.
Category Product
Local
Supply
Local
Manufacturing
Local IP
Capability Company Names
Level of
Local ValueAdd
Remarks
Components
and Sub
systems
Fuel Pump Yes Yes Yes Bosch, Kayne High The Fuel pump and injector
is manufactured and sold to
OEM’s as a combined unitFuel Injector Yes Yes Yes Bosch, Kayne High
MCU Imports No No
Infineon, ST
Microelectronics,
Freescale, Renesas
None
Semiconductor ecosystem
missingAnalogs and
SensorsImports No No
ST Microelectronics,
Infineon, IR, Onsemi,
Freescale
None
4W EMSOEM Yes Yes No
Bosch, Denso,
Magneti MarelliLow
EMS No No No NA NA
The SWOT chart below captures the analysis for the 4W EMS market.
STRENGTHS
Stricter automobile emission norms encourage EMSmanufacturing in India
India already the largest market for automobile and asmall-car export hub – adds to the demand for EMS
OPPORTUNITIES
India’s growing demand for small car to boost demandfor ECU’s
Bosch India availing MSIPS to start production of ECU’sin next 5 years
WEAKNESS
98% of EMS components imported
OEM’s global oces hold IP rights of EMS design
Import duties on electronics should be reduced
THREATS
Slowdown of the Indian automobile industry
Importing components from China and Vietnam holdsbetter business proposition
Infrastructure inadequacy – sucient power, water andother utilities – uninterrupted availability
SWOT
Component SWOT The top 3 components that contribute to the majority of the 4W EMS bill of materials (BoM) are:
• Mechanicals: pumps and injectors
• Analogs and sensors
• Microcontrollers
Analogs, sensors and microcontrollers are imported components since the Indian electronics ecosystem doesn’t possess the
relevant competencies needed for the manufacturing of these components domestically. These are imported by companies such
as STMicroelectronics, Infineon, Freescale, Fujitsu, and the like. Pumps and injectors are sourced locally through companies such as
Bosch and Kayne that possess domestic manufacturing capacity.
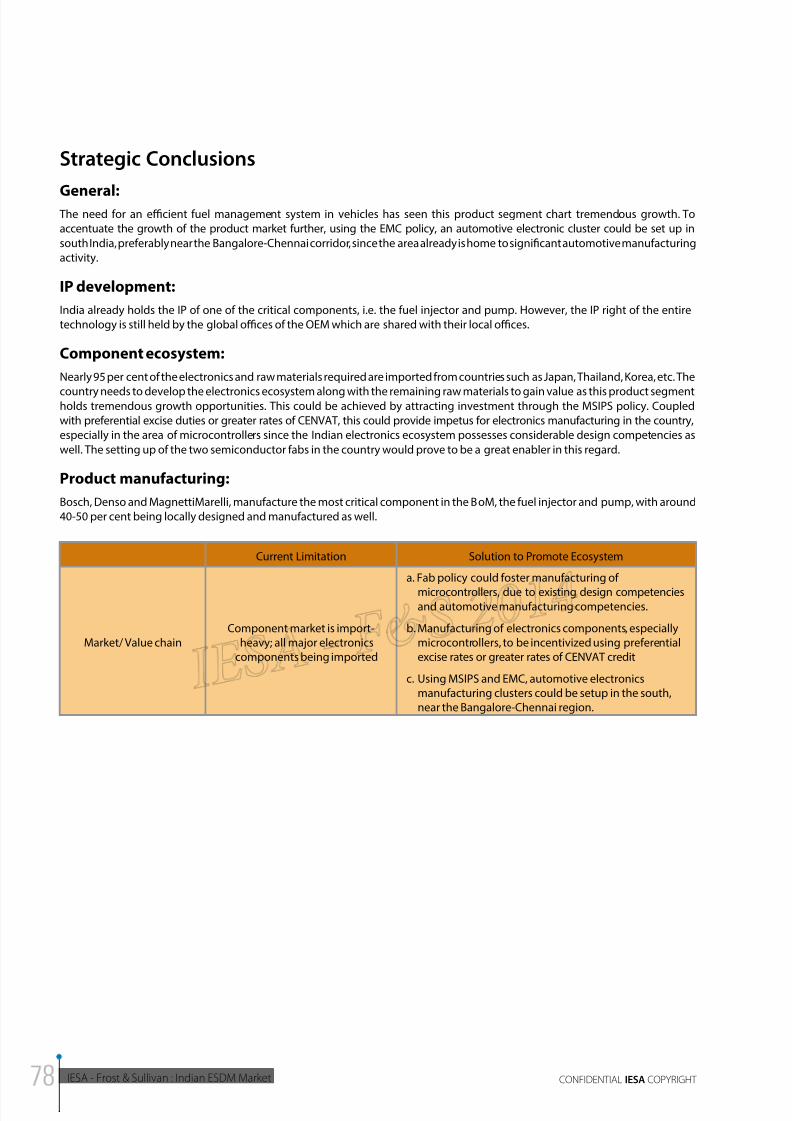
8/11/2019 IESA FS Report Indian ESDM Market
http://slidepdf.com/reader/full/iesa-fs-report-indian-esdm-market 78/172
IESA - Frost & Sullivan : Indian ESDM Market CONFIDENTIAL IESA COPYRIGHT
Strategic Conclusions
General: The need for an ecient fuel management system in vehicles has seen this product segment chart tremendous growth. To
accentuate the growth of the product market further, using the EMC policy, an automotive electronic cluster could be set up in
south India, preferably near the Bangalore-Chennai corridor, since the area already is home to significant automotive manufacturing
activity.
IP development:
India already holds the IP of one of the critical components, i.e. the fuel injector and pump. However, the IP right of the entire
technology is still held by the global oces of the OEM which are shared with their local oces.
Component ecosystem:
Nearly 95 per cent of the electronics and raw materials required are imported from countries such as Japan, Thailand, Korea, etc. The
country needs to develop the electronics ecosystem along with the remaining raw materials to gain value as this product segmentholds tremendous growth opportunities. This could be achieved by attracting investment through the MSIPS policy. Coupled
with preferential excise duties or greater rates of CENVAT, this could provide impetus for electronics manufacturing in the country,
especially in the area of microcontrollers since the Indian electronics ecosystem possesses considerable design competencies as
well. The setting up of the two semiconductor fabs in the country would prove to be a great enabler in this regard.
Product manufacturing:
Bosch, Denso and MagnettiMarelli, manufacture the most critical component in the BoM, the fuel injector and pump, with around
40-50 per cent being locally designed and manufactured as well.
Current Limitation Solution to Promote Ecosystem
Market/ Value chainComponent market is import-
heavy; all major electronicscomponents being imported
a. Fab policy could foster manufacturing of
microcontrollers, due to existing design competenciesand automotive manufacturing competencies.
b. Manufacturing of electronics components, especiallymicrocontrollers, to be incentivized using preferentialexcise rates or greater rates of CENVAT credit
c. Using MSIPS and EMC, automotive electronicsmanufacturing clusters could be setup in the south,near the Bangalore-Chennai region.
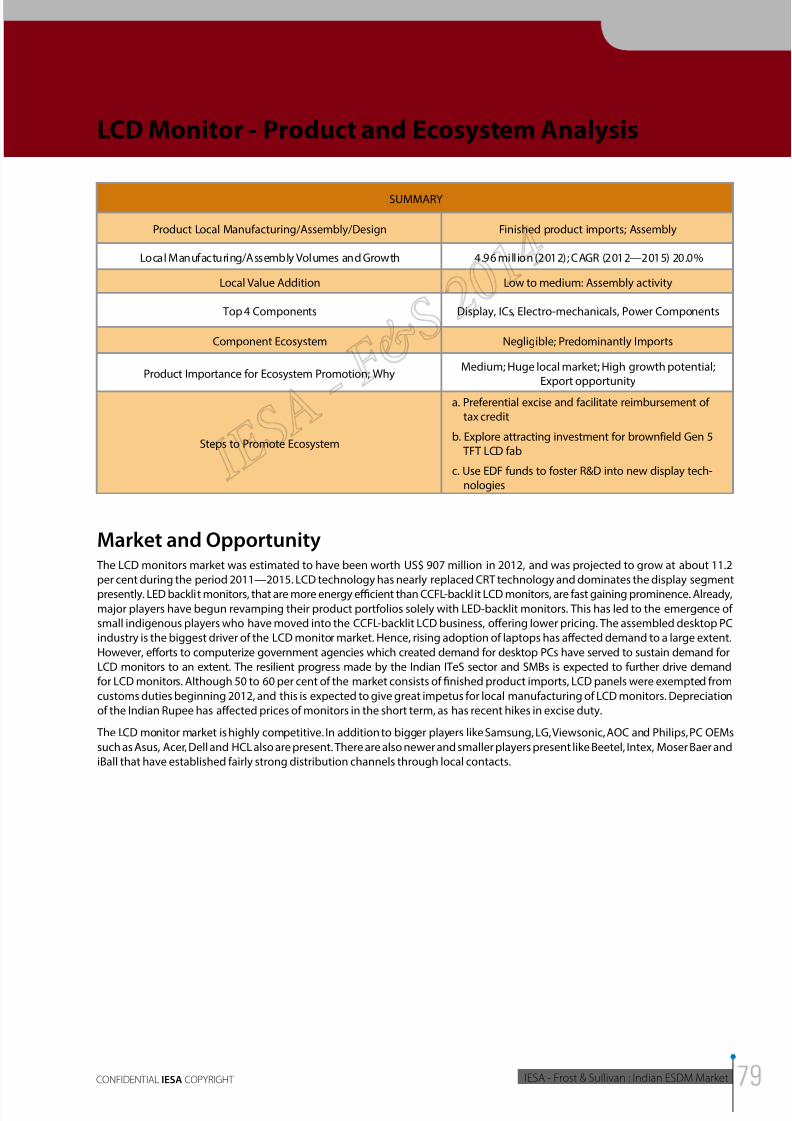
8/11/2019 IESA FS Report Indian ESDM Market
http://slidepdf.com/reader/full/iesa-fs-report-indian-esdm-market 79/172
2014INDIAN ESDM MARKET - ANALYSIS OF
OPPORTUNITY AND GROWTH PLAN
IESA - Frost & Sullivan : Indian ESDM MarketCONFIDENTIAL IESA COPYRIGHT
LCD Monitor - Product and Ecosystem Analysis
SUMMARY
Product Local Manufacturing/Assembly/Design Finished product imports; Assembly
Local Manufacturing/Assembly Volumes and Growth 4.96 million (2012); CAGR (2012—2015) 20.0%
Local Value Addition Low to medium: Assembly activity
Top 4 Components Display, ICs, Electro-mechanicals, Power Components
Component Ecosystem Negligible; Predominantly Imports
Product Importance for Ecosystem Promotion; WhyMedium; Huge local market; High growth potential;
Export opportunity
Steps to Promote Ecosystem
a. Preferential excise and facilitate reimbursement oftax credit
b. Explore attracting investment for brownfield Gen 5 TFT LCD fab
c. Use EDF funds to foster R&D into new display tech-nologies
Market and Opportunity The LCD monitors market was estimated to have been worth US$ 907 million in 2012, and was projected to grow at about 11.2
per cent during the period 2011—2015. LCD technology has nearly replaced CRT technology and dominates the display segment
presently. LED backlit monitors, that are more energy ecient than CCFL-backlit LCD monitors, are fast gaining prominence. Already,
major players have begun revamping their product portfolios solely with LED-backlit monitors. This has led to the emergence of
small indigenous players who have moved into the CCFL-backlit LCD business, offering lower pricing. The assembled desktop PC
industry is the biggest driver of the LCD monitor market. Hence, rising adoption of laptops has affected demand to a large extent.
However, efforts to computerize government agencies which created demand for desktop PCs have served to sustain demand for
LCD monitors to an extent. The resilient progress made by the Indian ITeS sector and SMBs is expected to further drive demand
for LCD monitors. Although 50 to 60 per cent of the market consists of finished product imports, LCD panels were exempted from
customs duties beginning 2012, and this is expected to give great impetus for local manufacturing of LCD monitors. Depreciation
of the Indian Rupee has affected prices of monitors in the short term, as has recent hikes in excise duty.
The LCD monitor market is highly competitive. In addition to bigger players like Samsung, LG, Viewsonic, AOC and Philips, PC OEMs
such as Asus, Acer, Dell and HCL also are present. There are also newer and smaller players present like Beetel, Intex, Moser Baer and
iBall that have established fairly strong distribution channels through local contacts.
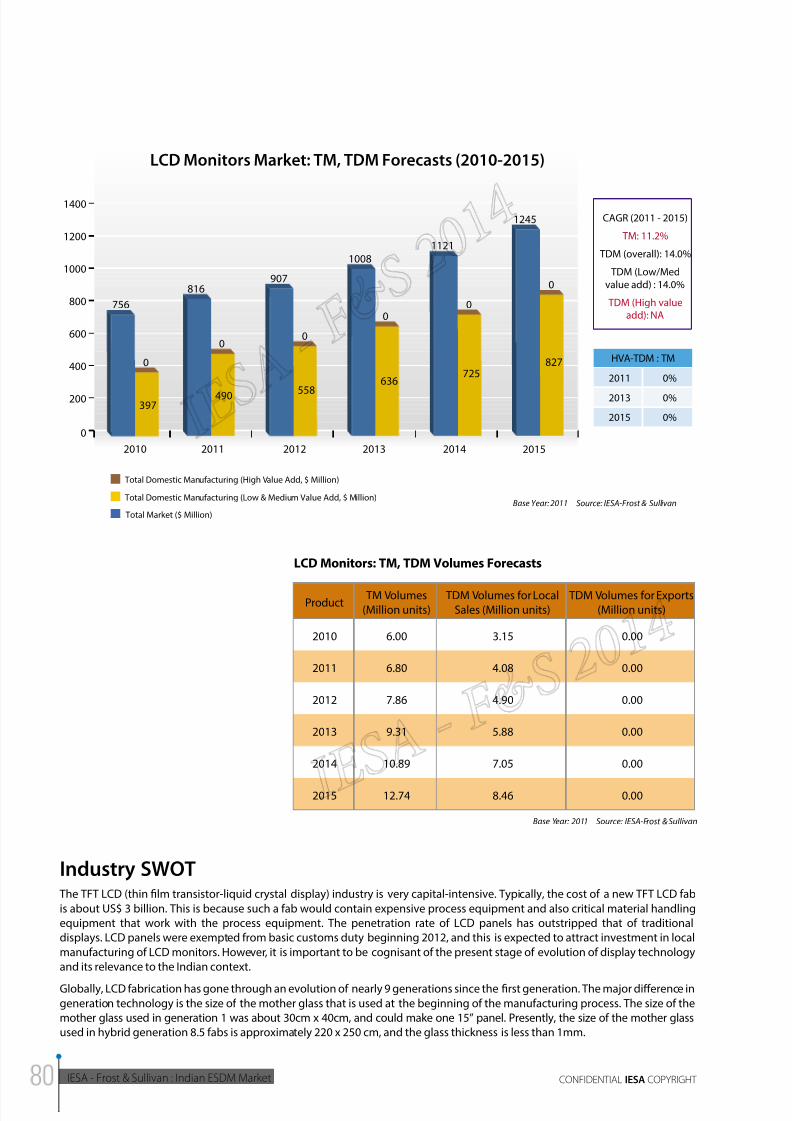
8/11/2019 IESA FS Report Indian ESDM Market
http://slidepdf.com/reader/full/iesa-fs-report-indian-esdm-market 80/172
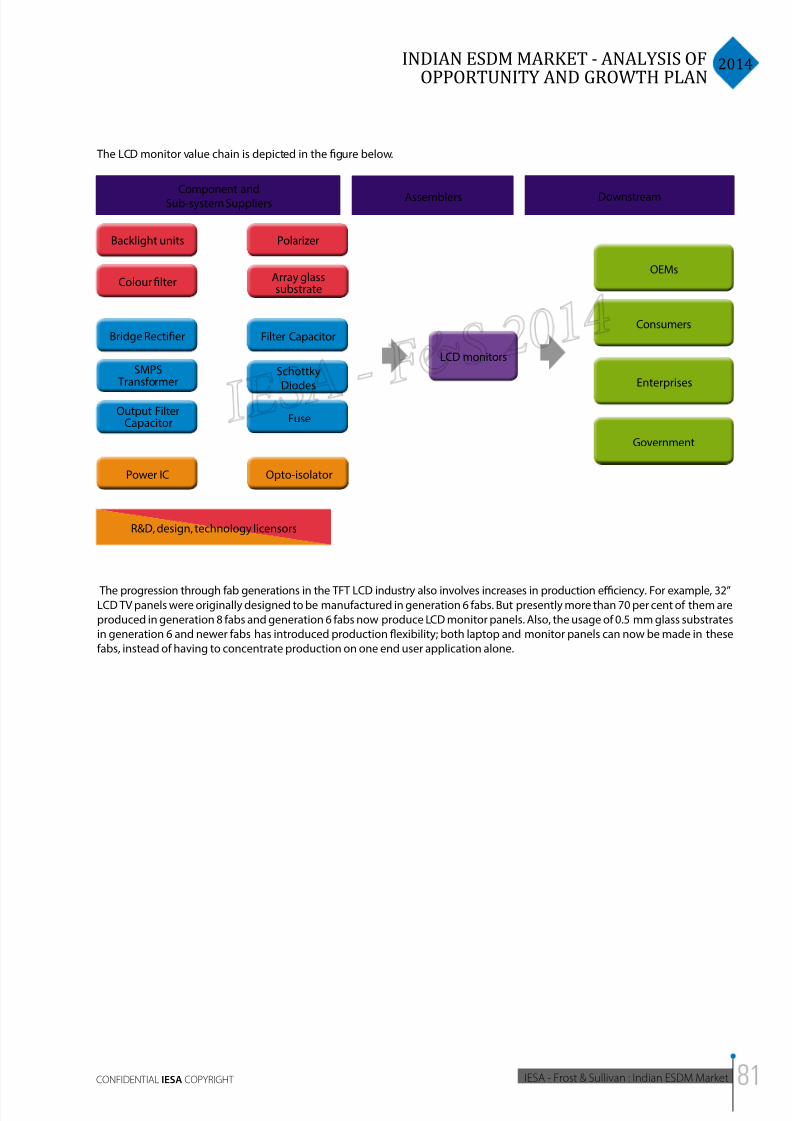
8/11/2019 IESA FS Report Indian ESDM Market
http://slidepdf.com/reader/full/iesa-fs-report-indian-esdm-market 81/172
2014INDIAN ESDM MARKET - ANALYSIS OF
OPPORTUNITY AND GROWTH PLAN
IESA - Frost & Sullivan : Indian ESDM MarketCONFIDENTIAL IESA COPYRIGHT
The LCD monitor value chain is depicted in the figure below.
Component andSub-system Suppliers
Backlight units
Colour filter
Polarizer
Array glasssubstrate
Consumers
Enterprises
Government
OEMs
Bridge Rectifier
SMPS Transformer
Output FilterCapacitor
Power IC
SchottkyDiodes
Fuse
Opto-isolator
Assemblers Downstream
LCD monitors
R&D, design, technology licensors
Filter Capacitor
The progression through fab generations in the TFT LCD industry also involves increases in production eciency. For example, 32”LCD TV panels were originally designed to be manufactured in generation 6 fabs. But presently more than 70 per cent of them are
produced in generation 8 fabs and generation 6 fabs now produce LCD monitor panels. Also, the usage of 0.5 mm glass substrates
in generation 6 and newer fabs has introduced production flexibility; both laptop and monitor panels can now be made in these
fabs, instead of having to concentrate production on one end user application alone.
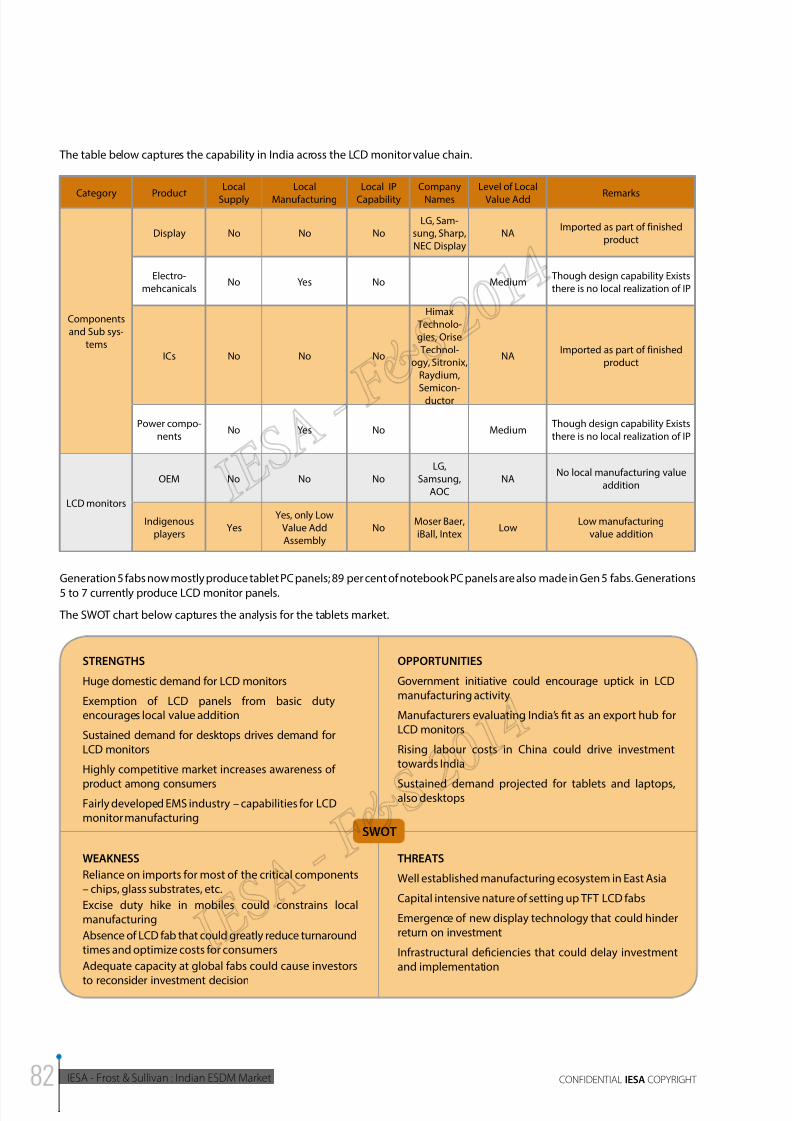
8/11/2019 IESA FS Report Indian ESDM Market
http://slidepdf.com/reader/full/iesa-fs-report-indian-esdm-market 82/172
IESA - Frost & Sullivan : Indian ESDM Market CONFIDENTIAL IESA COPYRIGHT
Category Product
Local
Supply
Local
Manufacturing
Local IP
Capability
Company
Names
Level of Local
Value Add Remarks
Components
and Sub sys-
tems
Display No No NoLG, Sam-
sung, Sharp,
NEC Display
NAImported as part of finished
product
Electro-
mehcanicalsNo Yes No Medium
Though design capability Exists
there is no local realization of IP
ICs No No No
Himax
Technolo-
gies, Orise
Technol-ogy, Sitronix,
Raydium,
Semicon-ductor
NAImported as part of finished
product
Power compo-
nentsNo Yes No Medium
Though design capability Exists
there is no local realization of IP
LCD monitors
OEM No No No
LG,
Samsung,
AOC
NANo local manufacturing value
addition
Indigenous
playersYes
Yes, only Low
Value Add
Assembly
NoMoser Baer,
iBall, IntexLow
Low manufacturing
value addition
The table below captures the capability in India across the LCD monitor value chain.
Generation 5 fabs now mostly produce tablet PC panels; 89 per cent of notebook PC panels are also made in Gen 5 fabs. Generations
5 to 7 currently produce LCD monitor panels.
The SWOT chart below captures the analysis for the tablets market.
STRENGTHS
Huge domestic demand for LCD monitors
Exemption of LCD panels from basic dutyencourages local value addition
Sustained demand for desktops drives demand forLCD monitors
Highly competitive market increases awareness of
product among consumersFairly developed EMS industry – capabilities for LCDmonitor manufacturing
OPPORTUNITIES
Government initiative could encourage uptick in LCDmanufacturing activity
Manufacturers evaluating India’s fit as an export hub forLCD monitors
Rising labour costs in China could drive investmenttowards India
Sustained demand projected for tablets and laptops,also desktops
WEAKNESS
Reliance on imports for most of the critical components– chips, glass substrates, etc.
Excise duty hike in mobiles could constrains localmanufacturing
Absence of LCD fab that could greatly reduce turnaroundtimes and optimize costs for consumers
Adequate capacity at global fabs could cause investors
to reconsider investment decision
THREATS
Well established manufacturing ecosystem in East Asia
Capital intensive nature of setting up TFT LCD fabs
Emergence of new display technology that could hinderreturn on investment
Infrastructural deficiencies that could delay investmentand implementation
SWOT
8/11/2019 IESA FS Report Indian ESDM Market
http://slidepdf.com/reader/full/iesa-fs-report-indian-esdm-market 83/172
2014INDIAN ESDM MARKET - ANALYSIS OF
OPPORTUNITY AND GROWTH PLAN
IESA - Frost & Sullivan : Indian ESDM MarketCONFIDENTIAL IESA COPYRIGHT
Component SWOT The biggest contribution to the BoM in terms of dollar value in an LCD monitor is accounted for by the display panel which could
cost up to 50 per cent of the total BoM approximately. Next come the electromechanical components,that could cost 15 per centof the BoM, and then the ICs and power components that account for the remaining 15 per cent.In short, the top 4 components
that contributes to majority of the LCD monitor bill of materials BoM are:
1. Display
2. Electromechanicals
3. IC’s
4. Power
The bigger players in the market mostly import LCD monitors as finished products and do not need to source locally as the basic
duty on these are exempt as well.
Strategic Conclusions
General
Tax structures should be amended to encourage LCD manufacturing through preferential excise duty rates and easier
reimbursement of tax credit. Since finished product imports are also exempt from basic customs duty due to trade agreements,
the government should explore the option of bringing local sourcing of LCDs under the Preferential Market Access Scheme.
IP developmentInvesting in R&D for new display technologies should also be considered to hedge against investment made in TFT LCD display
fabrication. Samsung has already been pulling out investments in new TFT LCD generations and has begun investing in R&D for
implementing new AMOLED display technology. This would lead to indigenous IP being created in the country, which could make
India a world leader in those technologies, much like how Japan and Korea have a monopoly on cutting-edge display technologycurrently.
Component ecosystem
The Indian ecosystem does possess competencies in the manufacturing of electromechanical components, SMPS transformers
and the plastic enclosures used in the assembly of LCD monitors. The manufacturing of these components should be incentivized,
especially since they are relevant to the product ecosystems of other electronics products as well. Local sourcing of these
components should be encouraged through tax credits for vendors who source these components locally. Simultaneously, the
government could encourage local manufacturers to tie up with engineering colleges and institutes in the vicinity through a
formalized practicum program, so that engineering students could contribute to design of these components.
Product manufacturing
Competencies in the manufacturing of LCD displays,especially for tablet and laptop applications (assuming the supporting
ecosystem for these products are incentivized as well, so that LCD manufacturing can feed into them), could be encouraged. This
would require investment in generation 5 fabs, which are mostly being used for these end user applications—79 per cent of tablet
displays and 89 per cent of laptop displays are manufactured in generation 5 fabs. Also, generation 5 fabs are growing at only
3 per cent a year while higher generation fabs are clocking almost 26 per cent annual growth. This could mean that relocating
a generation 5 fab to a brownfield location could be done at an affordable level of investment, instead of the typical $ 3 billion
needed for a new fab.
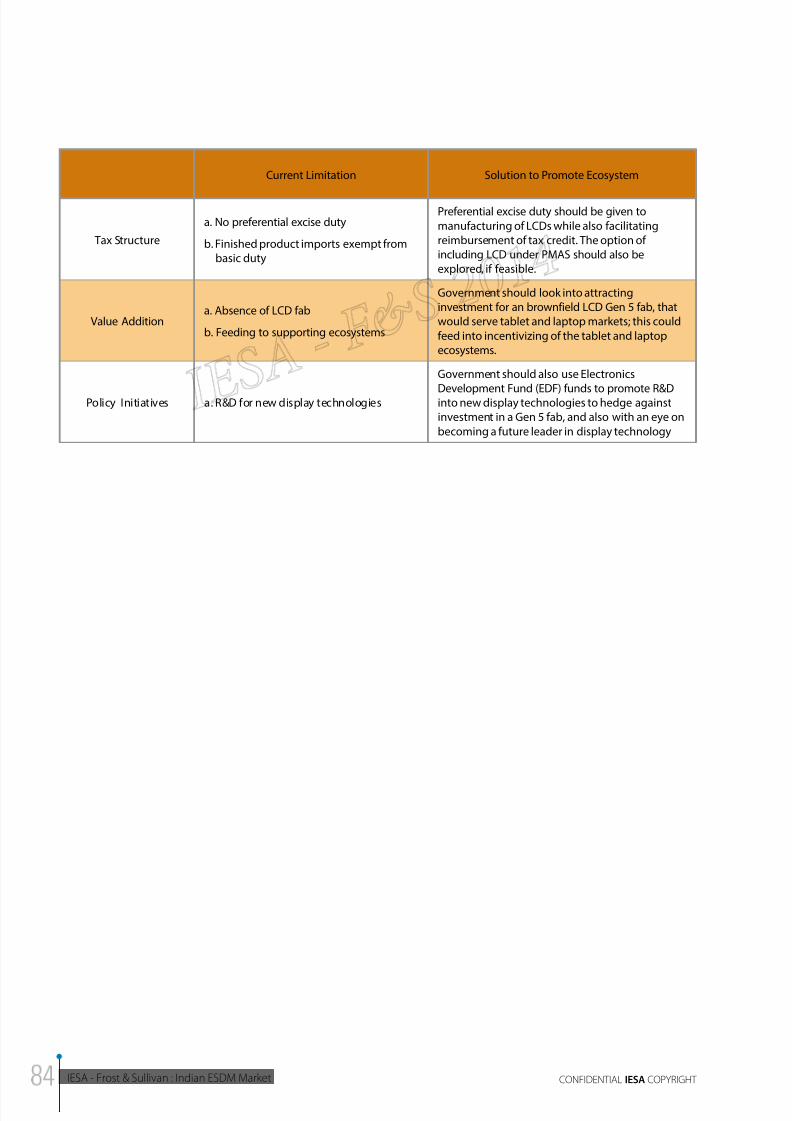
8/11/2019 IESA FS Report Indian ESDM Market
http://slidepdf.com/reader/full/iesa-fs-report-indian-esdm-market 84/172
IESA - Frost & Sullivan : Indian ESDM Market CONFIDENTIAL IESA COPYRIGHT
Current Limitation Solution to Promote Ecosystem
Tax Structure
a. No preferential excise duty
b. Finished product imports exempt frombasic duty
Preferential excise duty should be given to
manufacturing of LCDs while also facilitatingreimbursement of tax credit. The option ofincluding LCD under PMAS should also beexplored, if feasible.
Value Additiona. Absence of LCD fab
b. Feeding to supporting ecosystems
Government should look into attractinginvestment for an brownfield LCD Gen 5 fab, thatwould serve tablet and laptop markets; this could
feed into incentivizing of the tablet and laptopecosystems.
Policy Initiatives a. R&D for new display technologies
Government should also use Electronics
Development Fund (EDF) funds to promote R&Dinto new display technologies to hedge againstinvestment in a Gen 5 fab, and also with an eye on
becoming a future leader in display technology
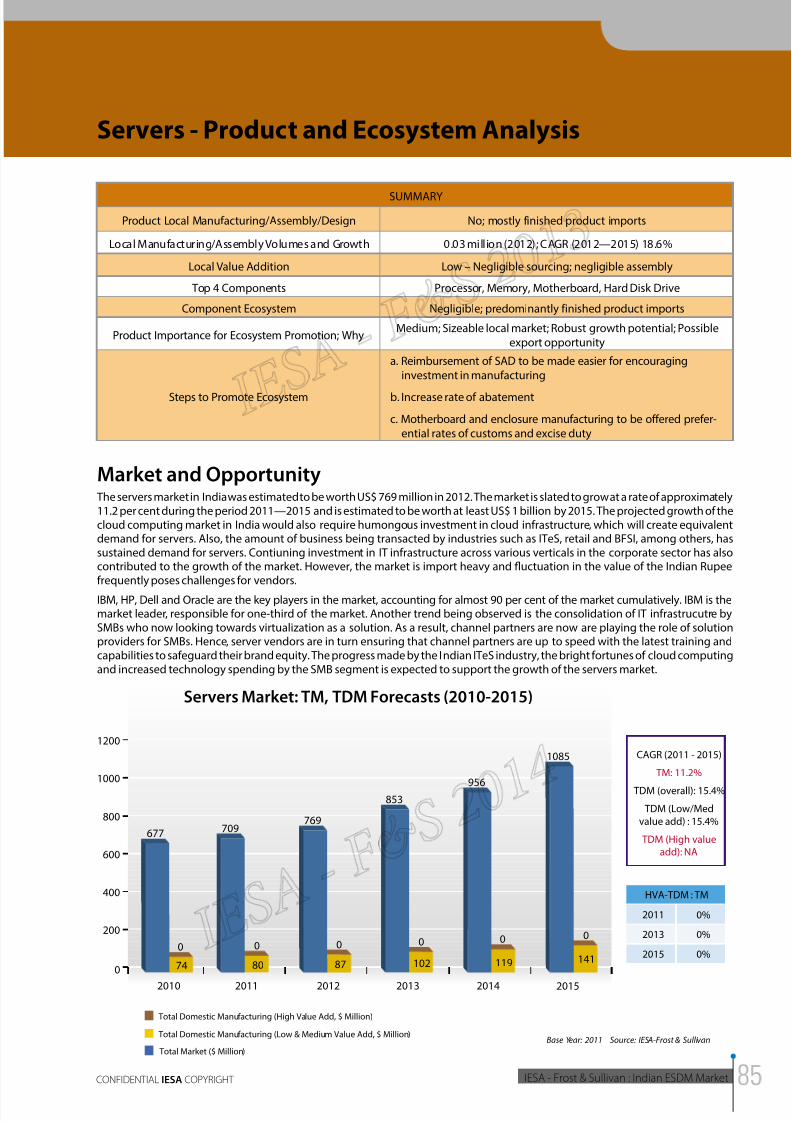
8/11/2019 IESA FS Report Indian ESDM Market
http://slidepdf.com/reader/full/iesa-fs-report-indian-esdm-market 85/172
2014INDIAN ESDM MARKET - ANALYSIS OF
OPPORTUNITY AND GROWTH PLAN
IESA - Frost & Sullivan : Indian ESDM MarketCONFIDENTIAL IESA COPYRIGHT
SUMMARY
Product Local Manufacturing/Assembly/Design No; mostly finished product imports
Local Manufacturing/Assembly Volumes and Growth 0.03 million (2012); CAGR (2012—2015) 18.6%
Local Value Addition Low – Negligible sourcing; negligible assembly
Top 4 Components Processor, Memory, Motherboard, Hard Disk Drive
Component Ecosystem Negligible; predominantly finished product imports
Product Importance for Ecosystem Promotion; WhyMedium; Sizeable local market; Robust growth potential; Possible
export opportunity
Steps to Promote Ecosystem
a. Reimbursement of SAD to be made easier for encouraginginvestment in manufacturing
b. Increase rate of abatement
c. Motherboard and enclosure manufacturing to be offered prefer-ential rates of customs and excise duty
Servers - Product and Ecosystem Analysis
Market and Opportunity The servers market in India was estimated to be worth US$ 769 million in 2012. The market is slated to grow at a rate of approximately11.2 per cent during the period 2011—2015 and is estimated to be worth at least US$ 1 billion by 2015. The projected growth of thecloud computing market in India would also require humongous investment in cloud infrastructure, which will create equivalentdemand for servers. Also, the amount of business being transacted by industries such as ITeS, retail and BFSI, among others, hassustained demand for servers. Contiuning investment in IT infrastructure across various verticals in the corporate sector has alsocontributed to the growth of the market. However, the market is import heavy and fluctuation in the value of the Indian Rupeefrequently poses challenges for vendors.
IBM, HP, Dell and Oracle are the key players in the market, accounting for almost 90 per cent of the market cumulatively. IBM is themarket leader, responsible for one-third of the market. Another trend being observed is the consolidation of IT infrastrucutre bySMBs who now looking towards virtualization as a solution. As a result, channel partners are now are playing the role of solutionproviders for SMBs. Hence, server vendors are in turn ensuring that channel partners are up to speed with the latest training andcapabilities to safeguard their brand equity. The progress made by the Indian ITeS industry, the bright fortunes of cloud computingand increased technology spending by the SMB segment is expected to support the growth of the servers market.
1085
0
0
200
400
600
800
1000
1200
20112010 2012 2013 2014 2015
Servers Market: TM, TDM Forecasts (2010-2015)
HVA-TDM : TM
2011
2013
2015
0%
0%
0%
Total Market ($ Million)
Total Domestic Manufacturing (High Value Add, $ Million)
Total Domestic Manufacturing (Low & Medium Value Add, $ Million)Base Year: 2011 Source: IESA-Frost & Sullivan
CAGR (2011 - 2015)
TM: 11.2%
TDM (overall): 15.4%
TDM (Low/Med
value add) : 15.4%
TDM (High valueadd): NA
141119
0
956853
0
102
769
0
8780
0
709
0
677
74
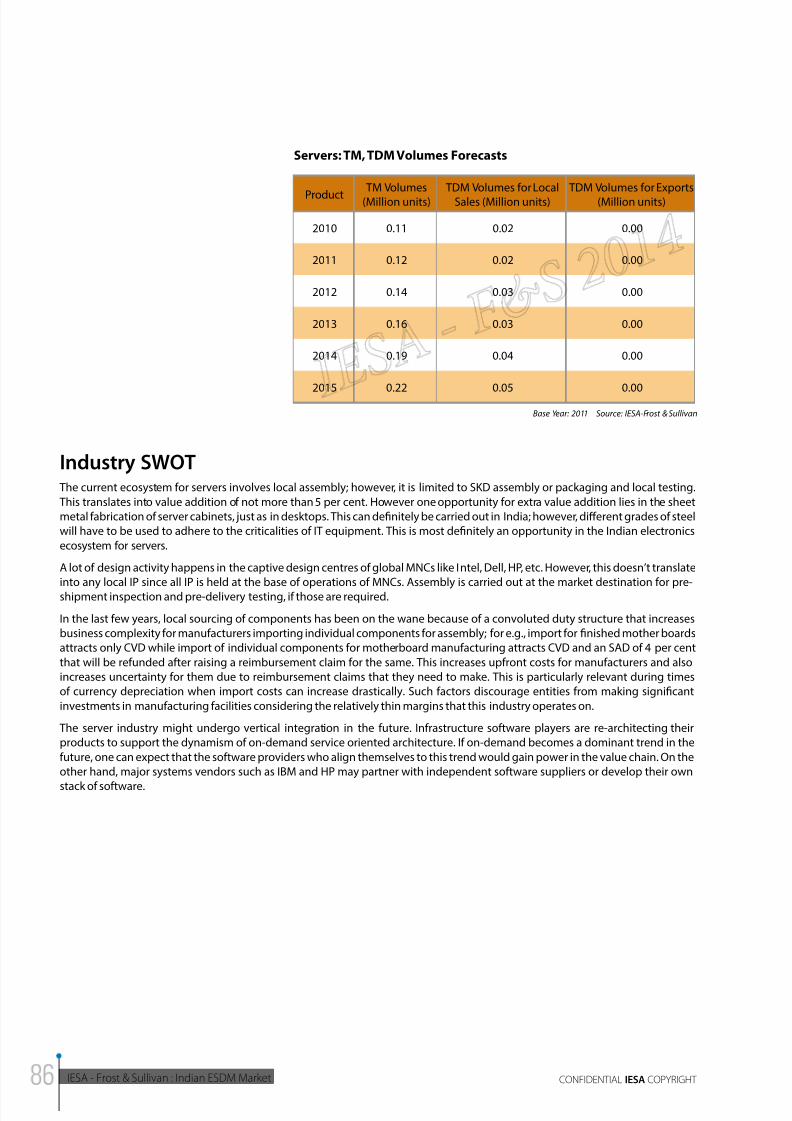
8/11/2019 IESA FS Report Indian ESDM Market
http://slidepdf.com/reader/full/iesa-fs-report-indian-esdm-market 86/172
IESA - Frost & Sullivan : Indian ESDM Market CONFIDENTIAL IESA COPYRIGHT
Servers: TM, TDM Volumes Forecasts
Product TM Volumes(Million units)
TDM Volumes for LocalSales (Million units)
TDM Volumes for Exports(Million units)
2010 0.11 0.02 0.00
2011 0.12 0.02 0.00
2012 0.14 0.03 0.00
2013 0.16 0.03 0.00
2014 0.19 0.04 0.00
2015 0.22 0.05 0.00
Base Year: 2011 Source: IESA-Frost & Sullivan
Industry SWOT The current ecosystem for servers involves local assembly; however, it is limited to SKD assembly or packaging and local testing.
This translates into value addition of not more than 5 per cent. However one opportunity for extra value addition lies in the sheet
metal fabrication of server cabinets, just as in desktops. This can definitely be carried out in India; however, different grades of steel
will have to be used to adhere to the criticalities of IT equipment. This is most definitely an opportunity in the Indian electronics
ecosystem for servers.
A lot of design activity happens in the captive design centres of global MNCs like Intel, Dell, HP, etc. However, this doesn’t translate
into any local IP since all IP is held at the base of operations of MNCs. Assembly is carried out at the market destination for pre-
shipment inspection and pre-delivery testing, if those are required.
In the last few years, local sourcing of components has been on the wane because of a convoluted duty structure that increases
business complexity for manufacturers importing individual components for assembly; for e.g., import for finished mother boards
attracts only CVD while import of individual components for motherboard manufacturing attracts CVD and an SAD of 4 per cent
that will be refunded after raising a reimbursement claim for the same. This increases upfront costs for manufacturers and also
increases uncertainty for them due to reimbursement claims that they need to make. This is particularly relevant during times
of currency depreciation when import costs can increase drastically. Such factors discourage entities from making significant
investments in manufacturing facilities considering the relatively thin margins that this industry operates on.
The server industry might undergo vertical integration in the future. Infrastructure software players are re-architecting their
products to support the dynamism of on-demand service oriented architecture. If on-demand becomes a dominant trend in the
future, one can expect that the software providers who align themselves to this trend would gain power in the value chain. On the
other hand, major systems vendors such as IBM and HP may partner with independent software suppliers or develop their own
stack of software.
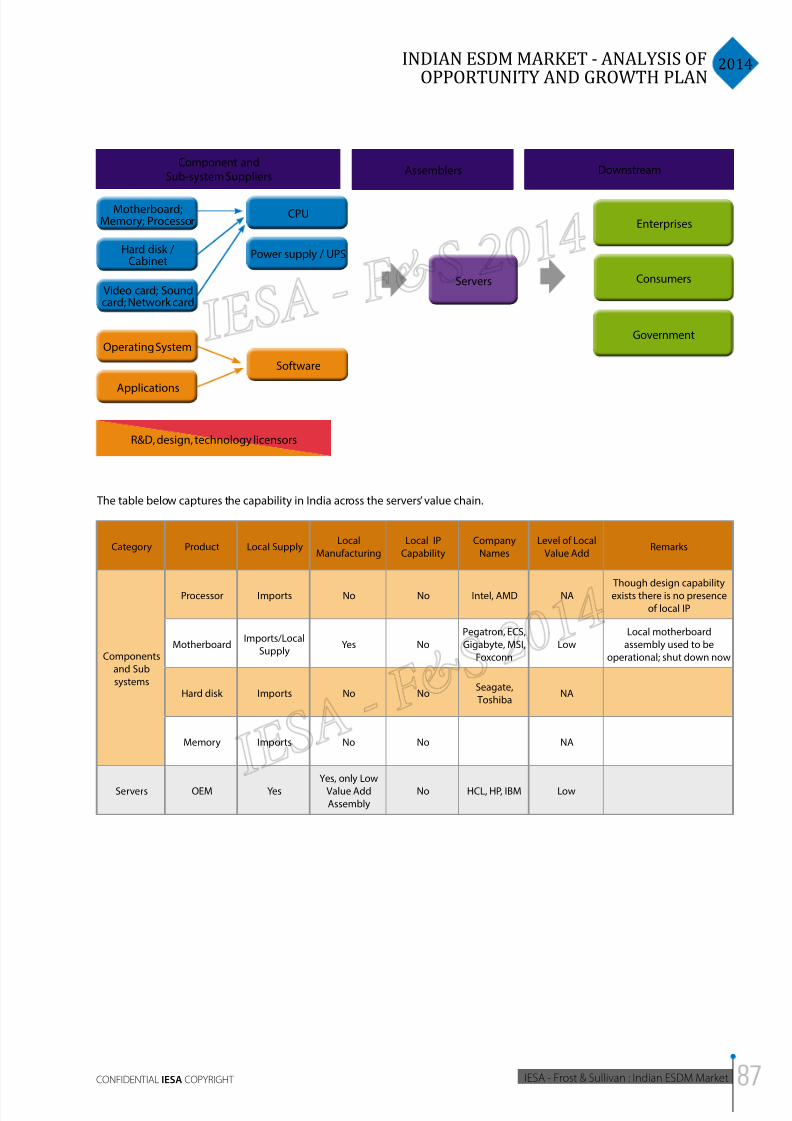
8/11/2019 IESA FS Report Indian ESDM Market
http://slidepdf.com/reader/full/iesa-fs-report-indian-esdm-market 87/172
2014INDIAN ESDM MARKET - ANALYSIS OF
OPPORTUNITY AND GROWTH PLAN
IESA - Frost & Sullivan : Indian ESDM MarketCONFIDENTIAL IESA COPYRIGHT
Component andSub-system Suppliers
CPU
Power supply / UPS
Consumers
Government
Enterprises
Servers
Assemblers Downstream
R&D, design, technology licensors
Software
Operating System
Applications
Motherboard;Memory; Processor
Hard disk /Cabinet
Video card; Soundcard; Network card
The table below captures the capability in India across the servers’ value chain.
Category Product Local SupplyLocal
Manufacturing
Local IP
Capability
Company
Names
Level of Local
Value AddRemarks
Components
and Sub
systems
Processor Imports No No Intel, AMD NA
Though design capability
exists there is no presence
of local IP
MotherboardImports/Local
SupplyYes No
Pegatron, ECS,
Gigabyte, MSI,
Foxconn
Low
Local motherboard
assembly used to be
operational; shut down now
Hard disk Imports No NoSeagate,
ToshibaNA
Memory Imports No No NA
Servers OEM Yes
Yes, only Low
Value Add
Assembly
No HCL, HP, IBM Low
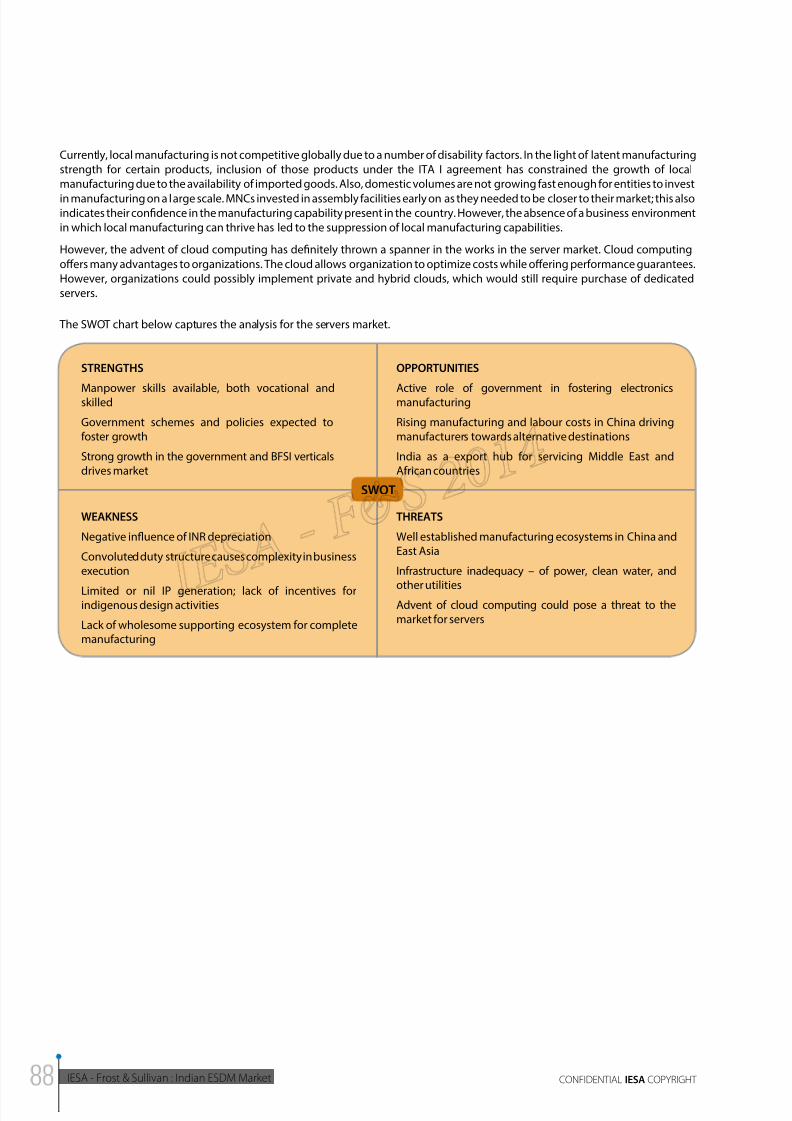
8/11/2019 IESA FS Report Indian ESDM Market
http://slidepdf.com/reader/full/iesa-fs-report-indian-esdm-market 88/172
IESA - Frost & Sullivan : Indian ESDM Market CONFIDENTIAL IESA COPYRIGHT
The SWOT chart below captures the analysis for the servers market.
STRENGTHS
Manpower skills available, both vocational andskilled
Government schemes and policies expected tofoster growth
Strong growth in the government and BFSI verticalsdrives market
OPPORTUNITIES
Active role of government in fostering electronicsmanufacturing
Rising manufacturing and labour costs in China drivingmanufacturers towards alternative destinations
India as a export hub for servicing Middle East andAfrican countries
WEAKNESS
Negative influence of INR depreciation
Convoluted duty structure causes complexity in businessexecution
Limited or nil IP generation; lack of incentives forindigenous design activities
Lack of wholesome supporting ecosystem for completemanufacturing
THREATS
Well established manufacturing ecosystems in China andEast Asia
Infrastructure inadequacy – of power, clean water, and
other utilitiesAdvent of cloud computing could pose a threat to themarket for servers
SWOT
Currently, local manufacturing is not competitive globally due to a number of disability factors. In the light of latent manufacturing
strength for certain products, inclusion of those products under the ITA I agreement has constrained the growth of local
manufacturing due to the availability of imported goods. Also, domestic volumes are not growing fast enough for entities to invest
in manufacturing on a large scale. MNCs invested in assembly facilities early on as they needed to be closer to their market; this alsoindicates their confidence in the manufacturing capability present in the country. However, the absence of a business environment
in which local manufacturing can thrive has led to the suppression of local manufacturing capabilities.
However, the advent of cloud computing has definitely thrown a spanner in the works in the server market. Cloud computing
offers many advantages to organizations. The cloud allows organization to optimize costs while offering performance guarantees.
However, organizations could possibly implement private and hybrid clouds, which would still require purchase of dedicated
servers.
8/11/2019 IESA FS Report Indian ESDM Market
http://slidepdf.com/reader/full/iesa-fs-report-indian-esdm-market 89/172
2014INDIAN ESDM MARKET - ANALYSIS OF
OPPORTUNITY AND GROWTH PLAN
IESA - Frost & Sullivan : Indian ESDM MarketCONFIDENTIAL IESA COPYRIGHT
Component SWOT The biggest contribution to the BoM in terms of dollar value in a server is accounted for by the processor which costs anywhere
between $ 60 to 110 approximately. Next comes the motherboard and the hard disk which cost about $ 40 each, followed bythe memory module that costs around $ 30. On the motherboard, the semicondcutor components and the PCB are most critical.
Considering a BoM of $ 40 for the motherboard, it can be estimated that the chipset costs about $ 12, the PCB costs about 6.5, and
that the overall semiconductor cost is about $ 20 including the peripheral chips.
In short, the top 4 components that contribute to majority of the server bill of materials (BoM) are:
1. Processor
2. Memory
3. Motherboard
4. HDD
Processors are sourced from either Intel or AMD. The top suppliers for hard disks are Seagate and Toshiba. However, the situation
with regard to hard disk is slightly in the balance currently due the shift in technology and enterprise business models, i.e., the shifttowards cloud computing and centralized servers, and the movement in technology towards solid state drives.
Strategic Conclusions
General
The levying of SAD should be repealed on individual electronic components, or at the very least, individual components of
motherboards. Also, the reimbursement process should be made easier and faster so that companies do not have to contend with
uncertainties of receiving reimbursement. The present rate of abatement should also be raised from 25 per cent to reflect the rise
in costs of doing business. SAD could be levied on finished product imports of motherboard for which a nascent manufacturing
ecosystem exists in India.
IP development
A large amount of design activity is carried out at the established IT firms such as HCL and Infosys and the captive design centres
of Intel and AMD, but there is no local IP held in the country. Encouraging the growth of fabless design companies and software
development firms through start-up capital seeding, and possibly through the mooted EDF corpus, could lead to the generation of
indigenous IP in the short to medium term. The application of regional language software could provide opportunities considering
the expected penetration of computing and connectivity in semi-urban and rural areas; the idea of setting up central government
grants for such software development activity at the NITs should be considered.
Component ecosystem
The manufacturing of motherboards should be incentivized by exempting individual components from basic customs duty and
excise duty, or offering preferential excise duty. Decrease in tax revenues could be offset a little through smaller hikes in sales tax
or through offering greater rates of CENVAT credit on excise duties.The Indian manufacturing ecosystem possesses competencies
in the manufacturing of motherboards, which is a top BoM contributor in terms of dollar value. It also has applications in almostevery electronics product. Once local manufacturing is encouraged by exempting from/ granting preferential excise duties, it is
very possible that investment will flow in and spur organic growth of the value chain. Likewise, sheet metal fabrication and plastic
moulding are fairly mature technologies in India; hence, the manufacturing of cabinets and enclosures could also be incentivized
through preferential excise duties and exempting them from additional duties, for use in servers.
Product manufacturing
The assembling of servers is already being carried out by global OEMs and indigenous players like HCL and Wipro. India has held
back from discussing the ITA II due to the fact that the government recognizes the need for encouraging the growth of the nascent
manufacturing capabilities in the country. If India were to sign the ITA II, it could potentially push companies into investing in
high-value added manufacturing in the country. Coupled with the wholesome basket of policy initiative being enacted by the
government, this could also lead to the establishment of a thriving product ecosystem.
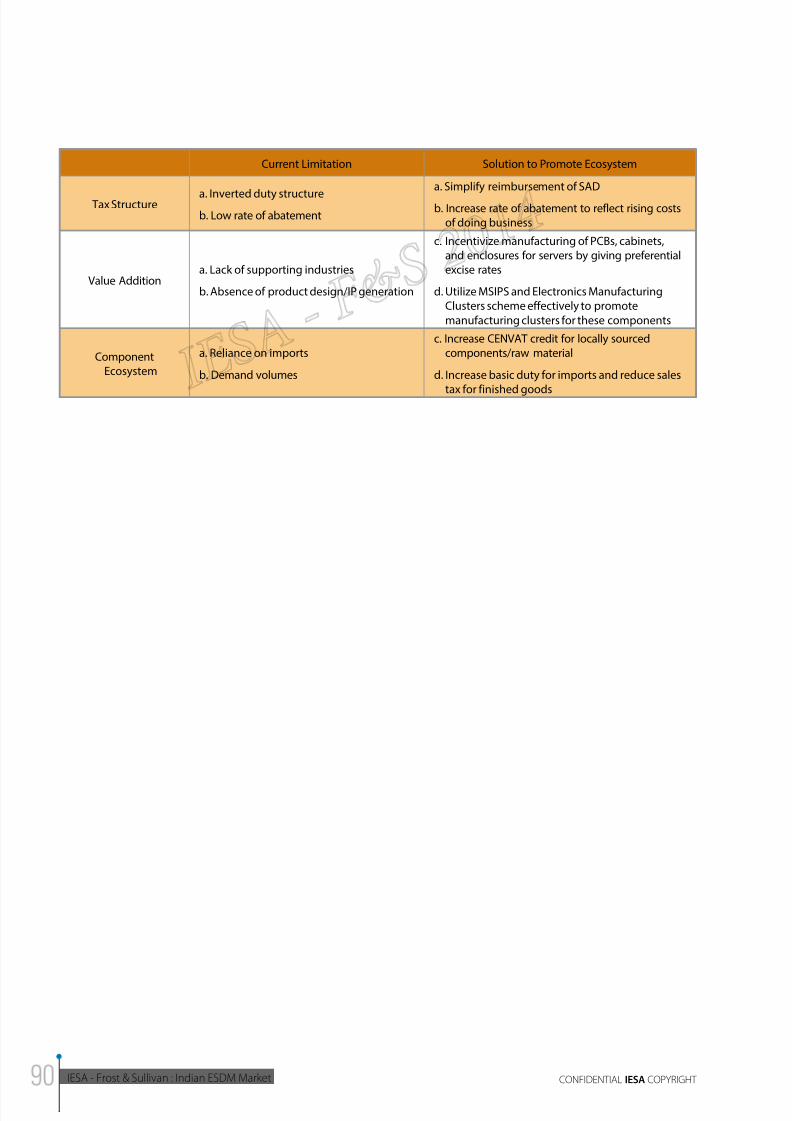
8/11/2019 IESA FS Report Indian ESDM Market
http://slidepdf.com/reader/full/iesa-fs-report-indian-esdm-market 90/172
IESA - Frost & Sullivan : Indian ESDM Market CONFIDENTIAL IESA COPYRIGHT
Current Limitation Solution to Promote Ecosystem
Tax Structure a. Inverted duty structureb. Low rate of abatement
a. Simplify reimbursement of SAD
b. Increase rate of abatement to reflect rising costsof doing business
Value Additiona. Lack of supporting industries
b. Absence of product design/IP generation
c. Incentivize manufacturing of PCBs, cabinets,and enclosures for servers by giving preferentialexcise rates
d. Utilize MSIPS and Electronics ManufacturingClusters scheme effectively to promote
manufacturing clusters for these components
ComponentEcosystem
a. Reliance on imports
b. Demand volumes
c. Increase CENVAT credit for locally sourcedcomponents/raw material
d. Increase basic duty for imports and reduce sales
tax for finished goods
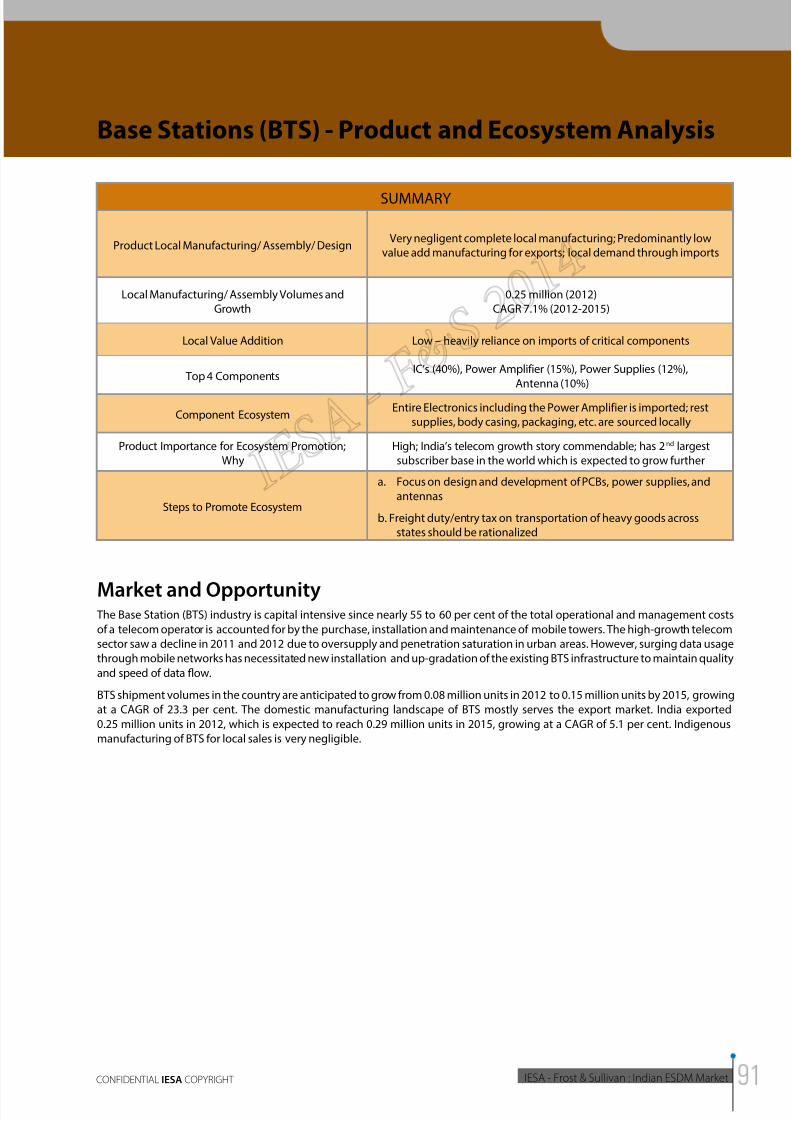
8/11/2019 IESA FS Report Indian ESDM Market
http://slidepdf.com/reader/full/iesa-fs-report-indian-esdm-market 91/172
2014INDIAN ESDM MARKET - ANALYSIS OF
OPPORTUNITY AND GROWTH PLAN
IESA - Frost & Sullivan : Indian ESDM MarketCONFIDENTIAL IESA COPYRIGHT
Base Stations (BTS) - Product and Ecosystem Analysis
SUMMARY
Product Local Manufacturing/ Assembly/ DesignVery negligent complete local manufacturing; Predominantly low
value add manufacturing for exports; local demand through imports
Local Manufacturing/ Assembly Volumes andGrowth
0.25 million (2012)CAGR 7.1% (2012-2015)
Local Value Addition Low – heavily reliance on imports of critical components
Top 4 ComponentsIC’s (40%), Power Amplifier (15%), Power Supplies (12%),
Antenna (10%)
Component EcosystemEntire Electronics including the Power Amplifier is imported; rest
supplies, body casing, packaging, etc. are sourced locally
Product Importance for Ecosystem Promotion;Why
High; India’s telecom growth story commendable; has 2nd largestsubscriber base in the world which is expected to grow further
Steps to Promote Ecosystem
a. Focus on design and development of PCBs, power supplies, and
antennas
b. Freight duty/entry tax on transportation of heavy goods acrossstates should be rationalized
Market and Opportunity The Base Station (BTS) industry is capital intensive since nearly 55 to 60 per cent of the total operational and management costs
of a telecom operator is accounted for by the purchase, installation and maintenance of mobile towers. The high-growth telecom
sector saw a decline in 2011 and 2012 due to oversupply and penetration saturation in urban areas. However, surging data usage
through mobile networks has necessitated new installation and up-gradation of the existing BTS infrastructure to maintain quality
and speed of data flow.
BTS shipment volumes in the country are anticipated to grow from 0.08 million units in 2012 to 0.15 million units by 2015, growing
at a CAGR of 23.3 per cent. The domestic manufacturing landscape of BTS mostly serves the export market. India exported
0.25 million units in 2012, which is expected to reach 0.29 million units in 2015, growing at a CAGR of 5.1 per cent. Indigenous
manufacturing of BTS for local sales is very negligible.
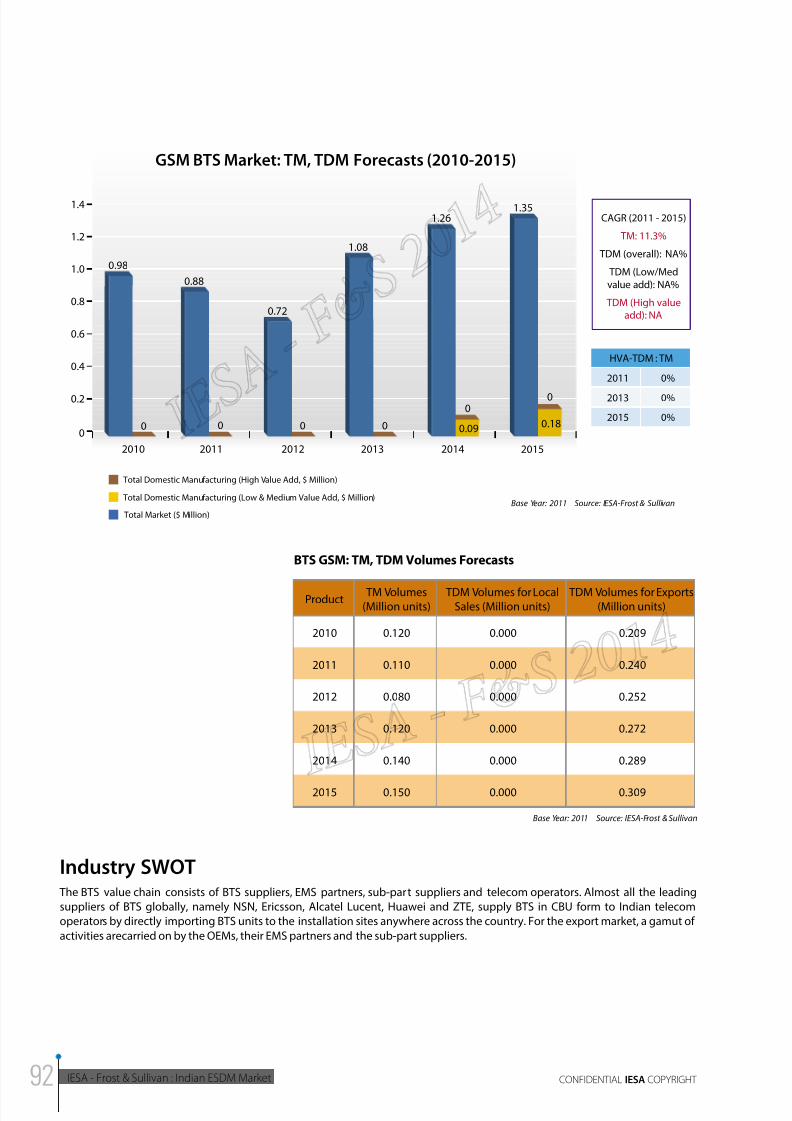
8/11/2019 IESA FS Report Indian ESDM Market
http://slidepdf.com/reader/full/iesa-fs-report-indian-esdm-market 92/172
IESA - Frost & Sullivan : Indian ESDM Market CONFIDENTIAL IESA COPYRIGHT
1.35
0
0
0.2
0.6
0.4
1.0
0.8
1.4
1.2
20112010 2012 2013 2014 2015
GSM BTS Market: TM, TDM Forecasts (2010-2015)
HVA-TDM : TM
2011
2013
2015
0%
0%
0%
Total Market ($ Million)
Total Domestic Manufacturing (High Value Add, $ Million)
Total Domestic Manufacturing (Low & Medium Value Add, $ Million)Base Year: 2011 Source: IESA-Frost & Sullivan
CAGR (2011 - 2015)
TM: 11.3%
TDM (overall): NA%
TDM (Low/Med
value add): NA%
TDM (High valueadd): NA
0.18
0
1.26
1.08
0
0.72
00
0.88
0
0.98
0.09
BTS GSM: TM, TDM Volumes Forecasts
Product TM Volumes(Million units)
TDM Volumes for LocalSales (Million units)
TDM Volumes for Exports(Million units)
2010 0.120 0.000 0.209
2011 0.110 0.000 0.240
2012 0.080 0.000 0.252
2013 0.120 0.000 0.272
2014 0.140 0.000 0.289
2015 0.150 0.000 0.309
Base Year: 2011 Source: IESA-Frost & Sullivan
Industry SWOT The BTS value chain consists of BTS suppliers, EMS partners, sub-part suppliers and telecom operators. Almost all the leading
suppliers of BTS globally, namely NSN, Ericsson, Alcatel Lucent, Huawei and ZTE, supply BTS in CBU form to Indian telecom
operators by directly importing BTS units to the installation sites anywhere across the country. For the export market, a gamut of
activities arecarried on by the OEMs, their EMS partners and the sub-part suppliers.
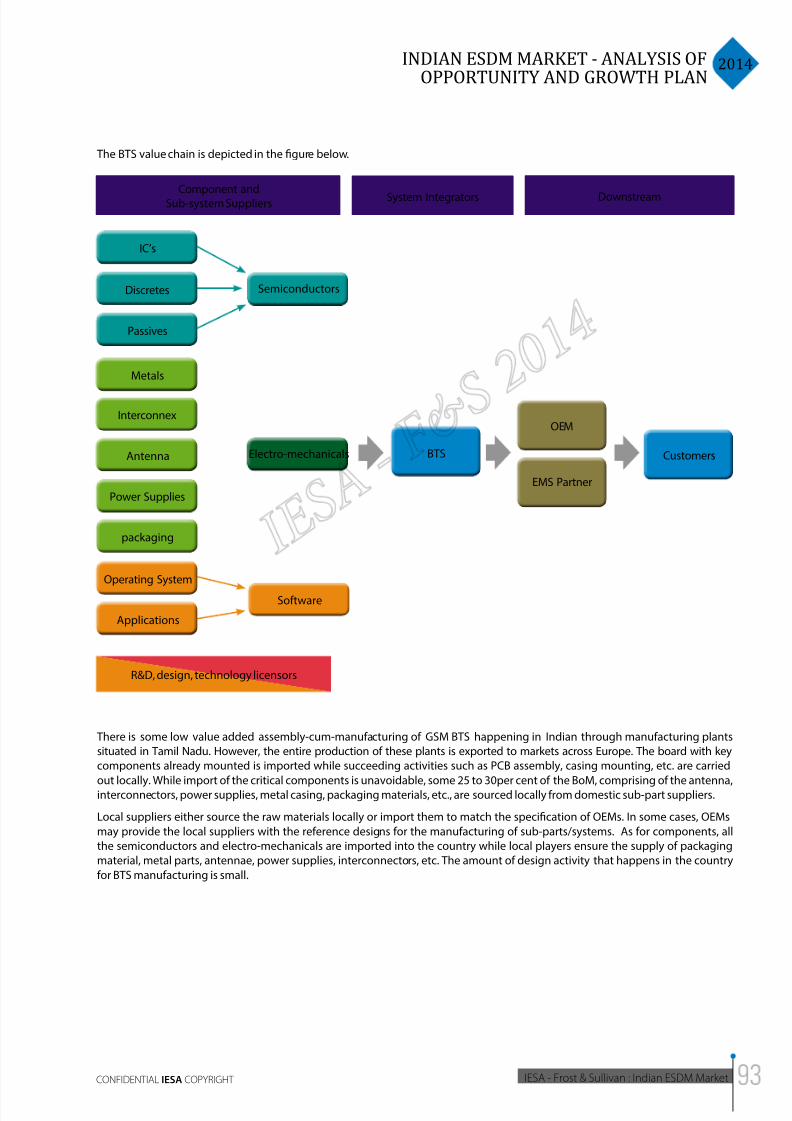
8/11/2019 IESA FS Report Indian ESDM Market
http://slidepdf.com/reader/full/iesa-fs-report-indian-esdm-market 93/172
2014INDIAN ESDM MARKET - ANALYSIS OF
OPPORTUNITY AND GROWTH PLAN
IESA - Frost & Sullivan : Indian ESDM MarketCONFIDENTIAL IESA COPYRIGHT
The BTS value chain is depicted in the figure below.
Component andSub-system Suppliers
IC’s
Discretes
Passives
Semiconductors
Software
Operating System
Applications
System Integrators Downstream
Electro-mechanicals
Interconnex
Metals
packaging
Power Supplies
Antenna BTS
OEM
Customers
EMS Partner
R&D, design, technology licensors
There is some low value added assembly-cum-manufacturing of GSM BTS happening in Indian through manufacturing plants
situated in Tamil Nadu. However, the entire production of these plants is exported to markets across Europe. The board with key
components already mounted is imported while succeeding activities such as PCB assembly, casing mounting, etc. are carried
out locally. While import of the critical components is unavoidable, some 25 to 30per cent of the BoM, comprising of the antenna,interconnectors, power supplies, metal casing, packaging materials, etc., are sourced locally from domestic sub-part suppliers.
Local suppliers either source the raw materials locally or import them to match the specification of OEMs. In some cases, OEMs
may provide the local suppliers with the reference designs for the manufacturing of sub-parts/systems. As for components, all
the semiconductors and electro-mechanicals are imported into the country while local players ensure the supply of packaging
material, metal parts, antennae, power supplies, interconnectors, etc. The amount of design activity that happens in the country
for BTS manufacturing is small.
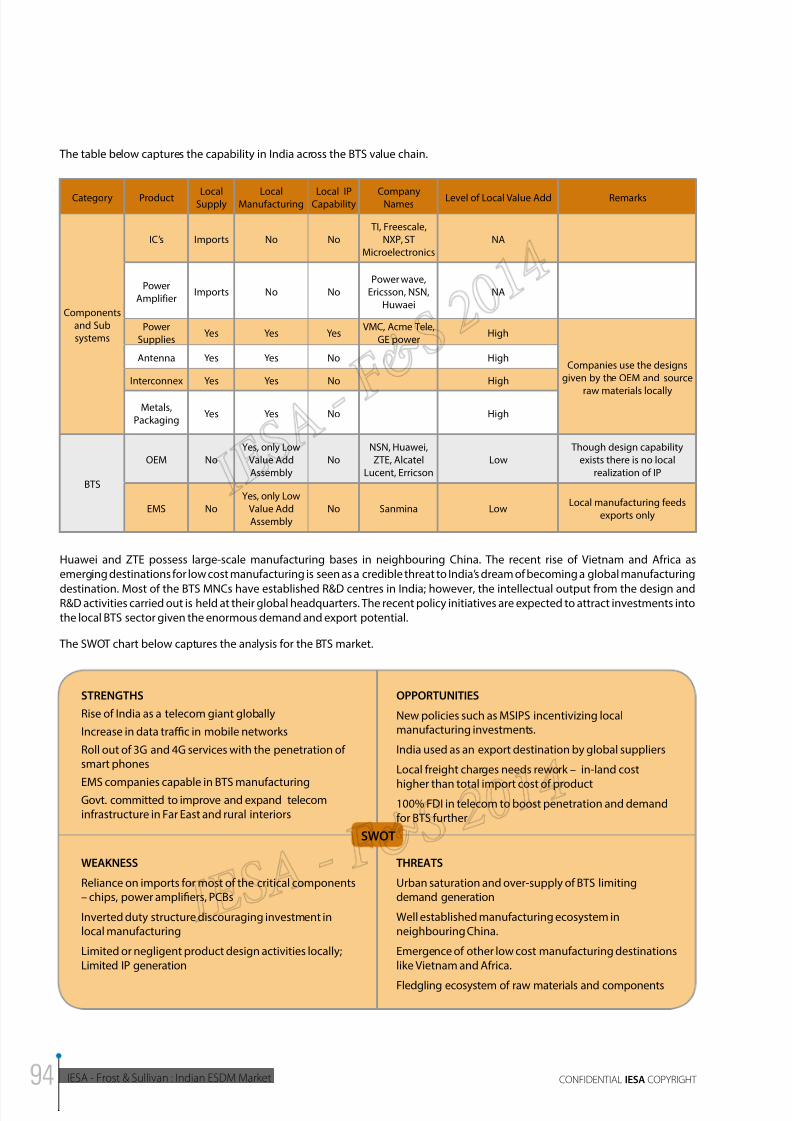
8/11/2019 IESA FS Report Indian ESDM Market
http://slidepdf.com/reader/full/iesa-fs-report-indian-esdm-market 94/172
IESA - Frost & Sullivan : Indian ESDM Market CONFIDENTIAL IESA COPYRIGHT
The table below captures the capability in India across the BTS value chain.
Category Product LocalSupply LocalManufacturing Local IPCapability CompanyNames Level of Local Value Add Remarks
Components
and Sub
systems
IC’s Imports No No
TI, Freescale,
NXP, ST
Microelectronics
NA
Power
AmplifierImports No No
Power wave,
Ericsson, NSN,
Huwaei
NA
Power
SuppliesYes Yes Yes
VMC, Acme Tele,
GE powerHigh
Companies use the designs
given by the OEM and source
raw materials locally
Antenna Yes Yes No High
Interconnex Yes Yes No High
Metals,
PackagingYes Yes No High
BTS
OEM No
Yes, only Low
Value Add
Assembly
No
NSN, Huawei,
ZTE, Alcatel
Lucent, Erricson
Low
Though design capability
exists there is no local
realization of IP
EMS No
Yes, only Low
Value Add
Assembly
No Sanmina LowLocal manufacturing feeds
exports only
Huawei and ZTE possess large-scale manufacturing bases in neighbouring China. The recent rise of Vietnam and Africa as
emerging destinations for low cost manufacturing is seen as a credible threat to India’s dream of becoming a global manufacturing
destination. Most of the BTS MNCs have established R&D centres in India; however, the intellectual output from the design andR&D activities carried out is held at their global headquarters. The recent policy initiatives are expected to attract investments into
the local BTS sector given the enormous demand and export potential.
The SWOT chart below captures the analysis for the BTS market.
STRENGTHS
Rise of India as a telecom giant globally
Increase in data trac in mobile networks
Roll out of 3G and 4G services with the penetration ofsmart phones
EMS companies capable in BTS manufacturingGovt. committed to improve and expand telecominfrastructure in Far East and rural interiors
OPPORTUNITIES
New policies such as MSIPS incentivizing localmanufacturing investments.
India used as an export destination by global suppliers
Local freight charges needs rework – in-land cost
higher than total import cost of product100% FDI in telecom to boost penetration and demandfor BTS further
WEAKNESS
Reliance on imports for most of the critical components– chips, power amplifiers, PCBs
Inverted duty structure discouraging investment inlocal manufacturing
Limited or negligent product design activities locally;Limited IP generation
THREATS
Urban saturation and over-supply of BTS limitingdemand generation
Well established manufacturing ecosystem inneighbouring China.
Emergence of other low cost manufacturing destinationslike Vietnam and Africa.
Fledgling ecosystem of raw materials and components
SWOT
8/11/2019 IESA FS Report Indian ESDM Market
http://slidepdf.com/reader/full/iesa-fs-report-indian-esdm-market 95/172
2014INDIAN ESDM MARKET - ANALYSIS OF
OPPORTUNITY AND GROWTH PLAN
IESA - Frost & Sullivan : Indian ESDM MarketCONFIDENTIAL IESA COPYRIGHT
Component SWOT The BTS consists of thousands of components and almost half of the product cost is contributed by electronics used in the BTS. The
top 4 components that contribute to majority of the BTS bill of materials (BoM) are:
1. ICs
2. Power Amplifier
3. Power Supplies
4. Antenna
The BTS value chain in India lacks the presence of a well-endowed ecosystem for manufacturing of both components and the
end product. The electronic components of BTS are exempt from import duty (under ITA-1) which could act as a restraint against
investment in the Indian component ecosystem.
Strategic ConclusionsGeneral:
BTS are exempt from customs duty for import of electronic components used in its manufacturing anywhere in the world, being
part of the ITA- 1 list of products. Also, suppliers have raised concerns about the high in-land freight charges in India, which accounts
for about 15 to 17 per cent at present, which is exceptionally high compared to the freight charges of importing BTS globally.
Decreasing the in-land freight costs from 17 per cent to about 3 to 4 per cent would reduce costs for indigenous manufacturing
and encourage local value addition.
IP development:
Irrespective of the presence of numerous captive and third party design houses in the country, along with individual design
centres of the global BTS OEM’s, none of the IP is realized locally as all the patenting is done overseas. Although a good percentage
of design related work is carried out here, probable lack of Governmental support and encouragement has led India to lose outon patent filing.
Component ecosystem:
In the domestic BTS manufacturing ecosystem, parts and sub-parts such as the antennas, interconnectors, power supplies, metal
casing, packaging materials, etc., are sourced from local suppliers, and these contribute around 25 to 30 per cent of the total BTS
BoM. A closer look at the component composition of BTS indicates that only the electronic components are imported into the
country, besides a few electro-mechanical parts. However, the setting up of semiconductor fabs in the country is a positive step
towards becoming self-sucient with regard to semiconductor manufacturing. This factor could incentivize manufacturing of
electronic components and other downstream activities that feed into the manufacturing of BTS.
Product manufacturing:
The local PCB industry not only serves the domestic market but also serves the export market; around 24 per cent of the total PCBs
manufactured annually is exported. Indian PCB manufacturers have also enhanced their capabilities from single 2-layered PCB’sto 16-24 multiple-layered PCB’s. However, local sourcing of PCBs is not considerable because the PCBs needed are too complex
for Indian PCB manufacturers. Competency should be built so that local sourcing of the required PCBs can be done. Domestic
manufacturers should also be encouraged to build their capabilities to design and develop power supplies and antennas used in
the BTS from scratch to the final product indigenously. The MSIPS, EMC and NMP policies serve as a holistic guideline for suppliers
to take cognizance of, and apply for appropriate subsidies.
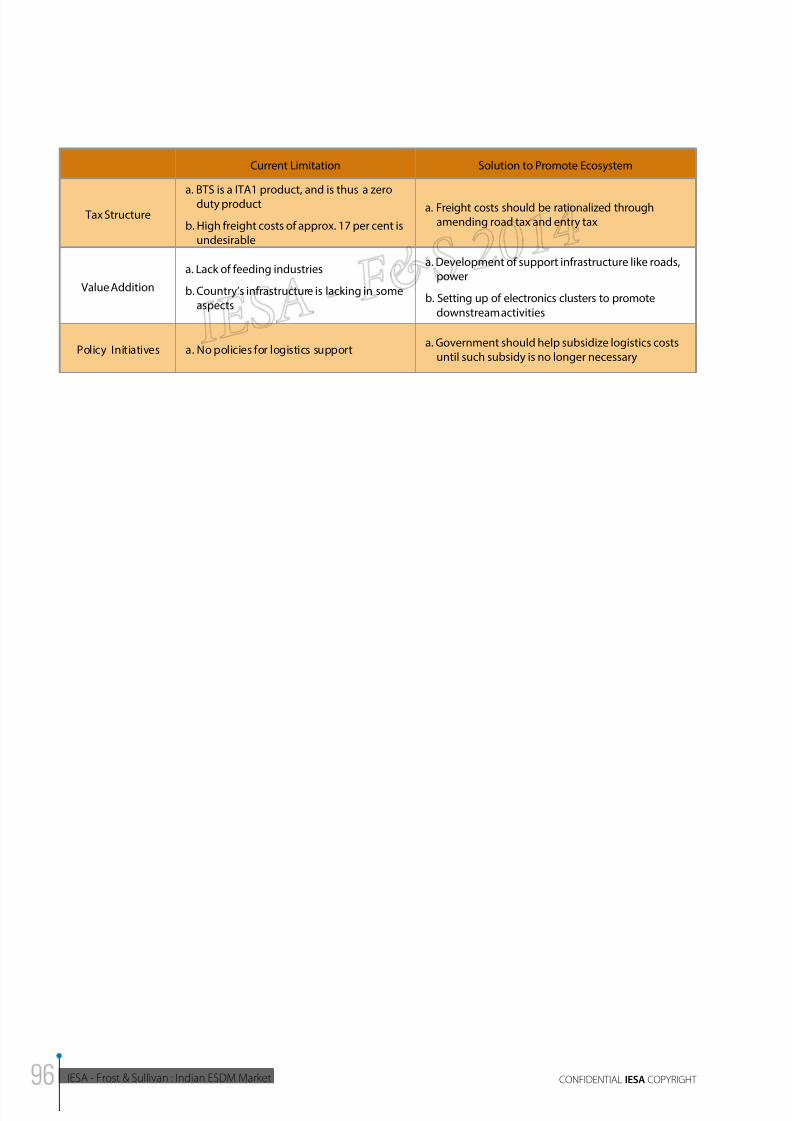
8/11/2019 IESA FS Report Indian ESDM Market
http://slidepdf.com/reader/full/iesa-fs-report-indian-esdm-market 96/172
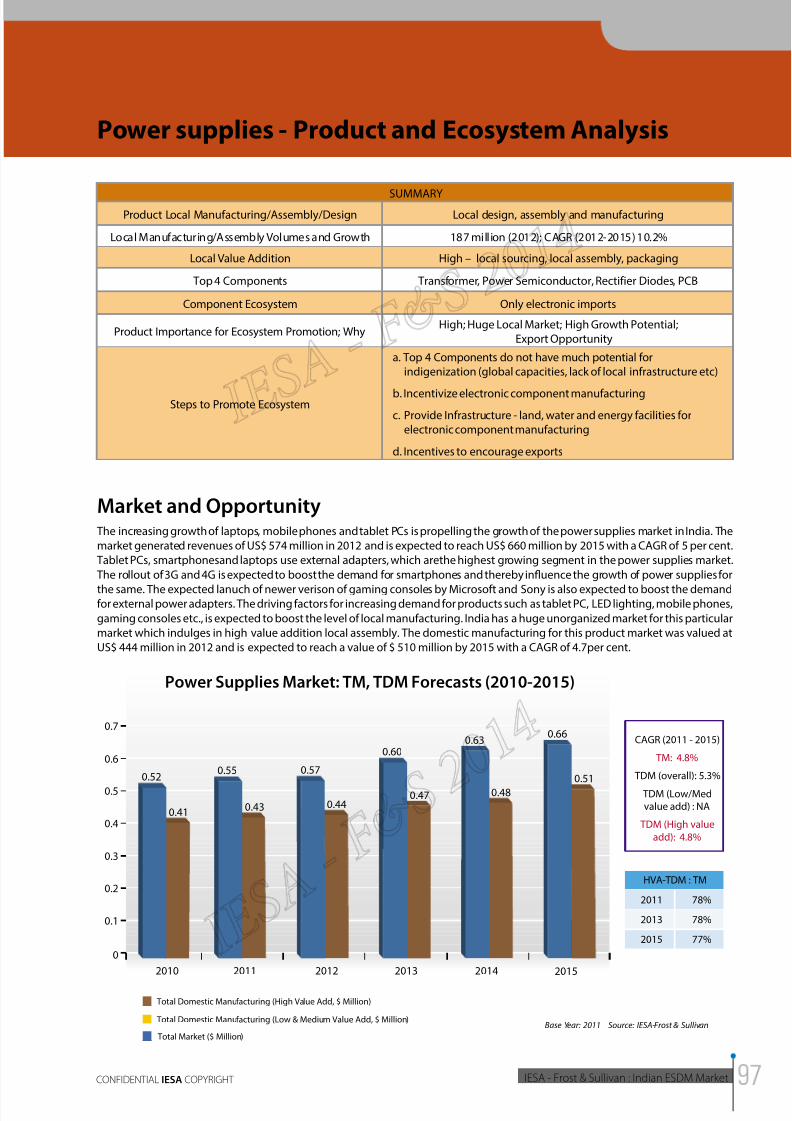
8/11/2019 IESA FS Report Indian ESDM Market
http://slidepdf.com/reader/full/iesa-fs-report-indian-esdm-market 97/172
2014INDIAN ESDM MARKET - ANALYSIS OF
OPPORTUNITY AND GROWTH PLAN
IESA - Frost & Sullivan : Indian ESDM MarketCONFIDENTIAL IESA COPYRIGHT
Power supplies - Product and Ecosystem Analysis
SUMMARYProduct Local Manufacturing/Assembly/Design Local design, assembly and manufacturing
Local Manufacturing/Assembly Volumes and Growth 187 million (2012); CAGR (2012-2015) 10.2%
Local Value Addition High – local sourcing, local assembly, packaging
Top 4 Components Transformer, Power Semiconductor, Rectifier Diodes, PCB
Component Ecosystem Only electronic imports
Product Importance for Ecosystem Promotion; WhyHigh; Huge Local Market; High Growth Potential;
Export Opportunity
Steps to Promote Ecosystem
a. Top 4 Components do not have much potential forindigenization (global capacities, lack of local infrastructure etc)
b. Incentivize electronic component manufacturing
c. Provide Infrastructure - land, water and energy facilities forelectronic component manufacturing
d. Incentives to encourage exports
Market and Opportunity The increasing growth of laptops, mobile phones and tablet PCs is propelling the growth of the power supplies market in India. The
market generated revenues of US$ 574 million in 2012 and is expected to reach US$ 660 million by 2015 with a CAGR of 5 per cent.
Tablet PCs, smartphonesand laptops use external adapters, which arethe highest growing segment in the power supplies market.
The rollout of 3G and 4G is expected to boost the demand for smartphones and thereby influence the growth of power supplies for
the same. The expected lanuch of newer verison of gaming consoles by Microsoft and Sony is also expected to boost the demandfor external power adapters. The driving factors for increasing demand for products such as tablet PC, LED lighting, mobile phones,
gaming consoles etc., is expected to boost the level of local manufacturing. India has a huge unorganized market for this particular
market which indulges in high value addition local assembly. The domestic manufacturing for this product market was valued at
US$ 444 million in 2012 and is expected to reach a value of $ 510 million by 2015 with a CAGR of 4.7per cent.
0.66
0.51
0
0.1
0.3
0.2
0.5
0.4
0.7
0.6
20112010 2012 2013 2014 2015
Power Supplies Market: TM, TDM Forecasts (2010-2015)
HVA-TDM : TM
2011
2013
2015
78%
78%
77%
Total Market ($ Million)
Total Domestic Manufacturing (High Value Add, $ Million)
Total Domestic Manufacturing (Low & Medium Value Add, $ Million)Base Year: 2011 Source: IESA-Frost & Sullivan
CAGR (2011 - 2015)
TM: 4.8%
TDM (overall): 5.3%
TDM (Low/Medvalue add) : NA
TDM (High value
add): 4.8%
0.63
0.48
0.60
0.47
0.55
0.43
0.52
0.410.44
0.57
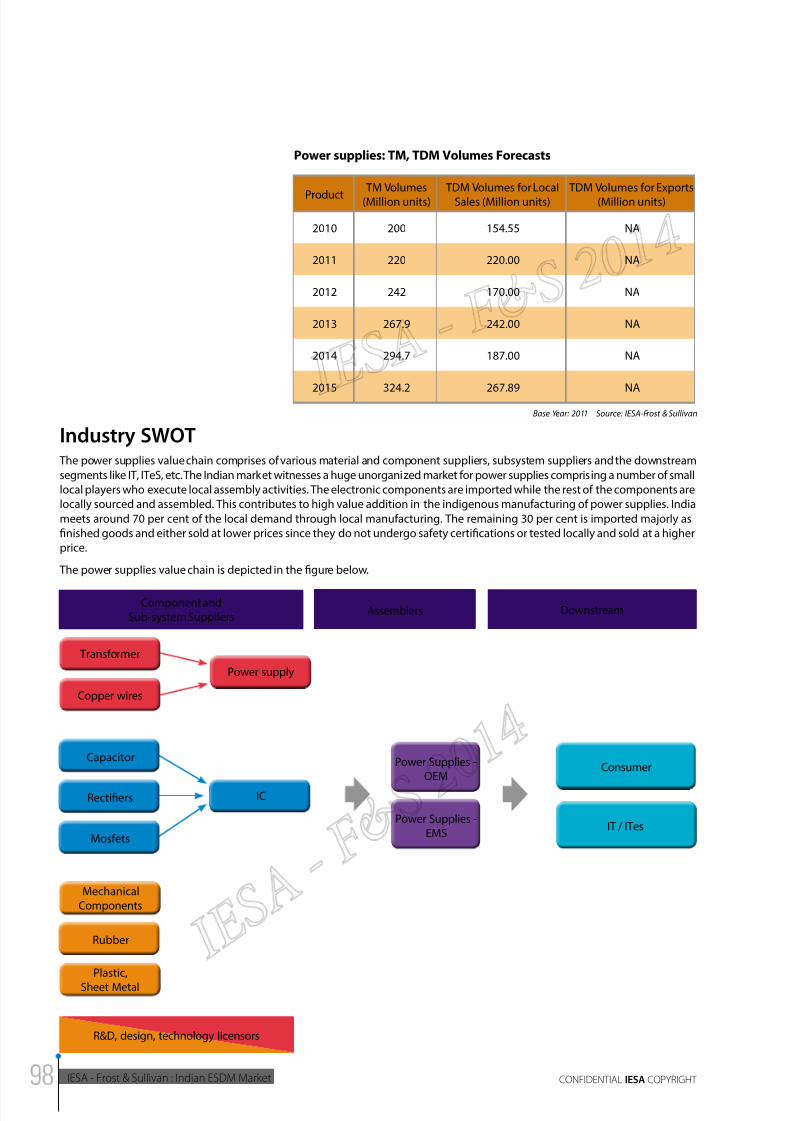
8/11/2019 IESA FS Report Indian ESDM Market
http://slidepdf.com/reader/full/iesa-fs-report-indian-esdm-market 98/172
IESA - Frost & Sullivan : Indian ESDM Market CONFIDENTIAL IESA COPYRIGHT
Power supplies: TM, TDM Volumes Forecasts
Product TM Volumes(Million units)
TDM Volumes for LocalSales (Million units)
TDM Volumes for Exports(Million units)
2010 200 154.55 NA
2011 220 220.00 NA
2012 242 170.00 NA
2013 267.9 242.00 NA
2014 294.7 187.00 NA
2015 324.2 267.89 NA
Base Year: 2011 Source: IESA-Frost & Sullivan
Industry SWOT The power supplies value chain comprises of various material and component suppliers, subsystem suppliers and the downstream
segments like IT, ITeS, etc. The Indian market witnesses a huge unorganized market for power supplies comprising a number of small
local players who execute local assembly activities. The electronic components are imported while the rest of the components are
locally sourced and assembled. This contributes to high value addition in the indigenous manufacturing of power supplies. India
meets around 70 per cent of the local demand through local manufacturing. The remaining 30 per cent is imported majorly as
finished goods and either sold at lower prices since they do not undergo safety certifications or tested locally and sold at a higher
price.
The power supplies value chain is depicted in the figure below.
Component andSub-system Suppliers
Transformer
Copper wires
Power supply
IC
Power Supplies -OEM
Power Supplies -EMS
Consumer
IT / ITesMosfets
Rectifiers
Capacitor
MechanicalComponents
Rubber
Plastic,
Sheet Metal
Assemblers Downstream
R&D, design, technology licensors
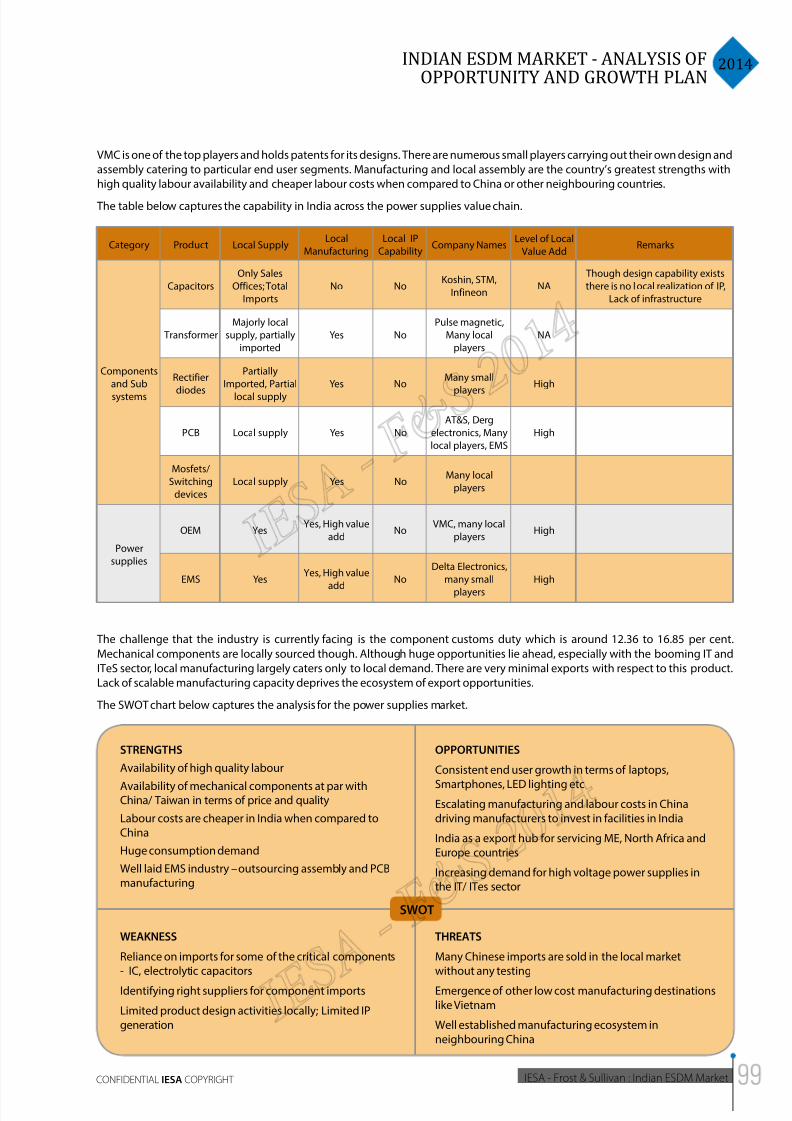
8/11/2019 IESA FS Report Indian ESDM Market
http://slidepdf.com/reader/full/iesa-fs-report-indian-esdm-market 99/172
2014INDIAN ESDM MARKET - ANALYSIS OF
OPPORTUNITY AND GROWTH PLAN
IESA - Frost & Sullivan : Indian ESDM MarketCONFIDENTIAL IESA COPYRIGHT
VMC is one of the top players and holds patents for its designs. There are numerous small players carrying out their own design and
assembly catering to particular end user segments. Manufacturing and local assembly are the country’s greatest strengths with
high quality labour availability and cheaper labour costs when compared to China or other neighbouring countries.
The table below captures the capability in India across the power supplies value chain.
Category Product Local SupplyLocal
Manufacturing
Local IP
CapabilityCompany Names
Level of Local
Value AddRemarks
Components
and Sub
systems
Capacitors
Only Sales
Offices; Total
Imports
No NoKoshin, STM,
InfineonNA
Though design capability exists
there is no local realization of IP,
Lack of infrastructure
Transformer
Majorly local
supply, partially
imported
Yes No
Pulse magnetic,
Many local
players
NA
Rectifier
diodes
Partially
Imported, Partial
local supply
Yes NoMany small
players
High
PCB Local supply Yes No
AT&S, Derg
electronics, Many
local players, EMS
High
Mosfets/
Switching
devices
Local supply Yes NoMany local
players
Power
supplies
OEM YesYes, High value
addNo
VMC, many local
playersHigh
EMS YesYes, High value
add
No
Delta Electronics,
many small
players
High
The challenge that the industry is currently facing is the component customs duty which is around 12.36 to 16.85 per cent.
Mechanical components are locally sourced though. Although huge opportunities lie ahead, especially with the booming IT and
ITeS sector, local manufacturing largely caters only to local demand. There are very minimal exports with respect to this product.
Lack of scalable manufacturing capacity deprives the ecosystem of export opportunities.
The SWOT chart below captures the analysis for the power supplies market.
STRENGTHS
Availability of high quality labour
Availability of mechanical components at par withChina/ Taiwan in terms of price and quality
Labour costs are cheaper in India when compared toChina
Huge consumption demand
Well laid EMS industry –outsourcing assembly and PCBmanufacturing
OPPORTUNITIES
Consistent end user growth in terms of laptops,
Smartphones, LED lighting etcEscalating manufacturing and labour costs in Chinadriving manufacturers to invest in facilities in India
India as a export hub for servicing ME, North Africa andEurope countries
Increasing demand for high voltage power supplies inthe IT/ ITes sector
WEAKNESS
Reliance on imports for some of the critical components- IC, electrolytic capacitors
Identifying right suppliers for component imports
Limited product design activities locally; Limited IPgeneration
THREATS
Many Chinese imports are sold in the local marketwithout any testing
Emergence of other low cost manufacturing destinationslike Vietnam
Well established manufacturing ecosystem inneighbouring China
SWOT
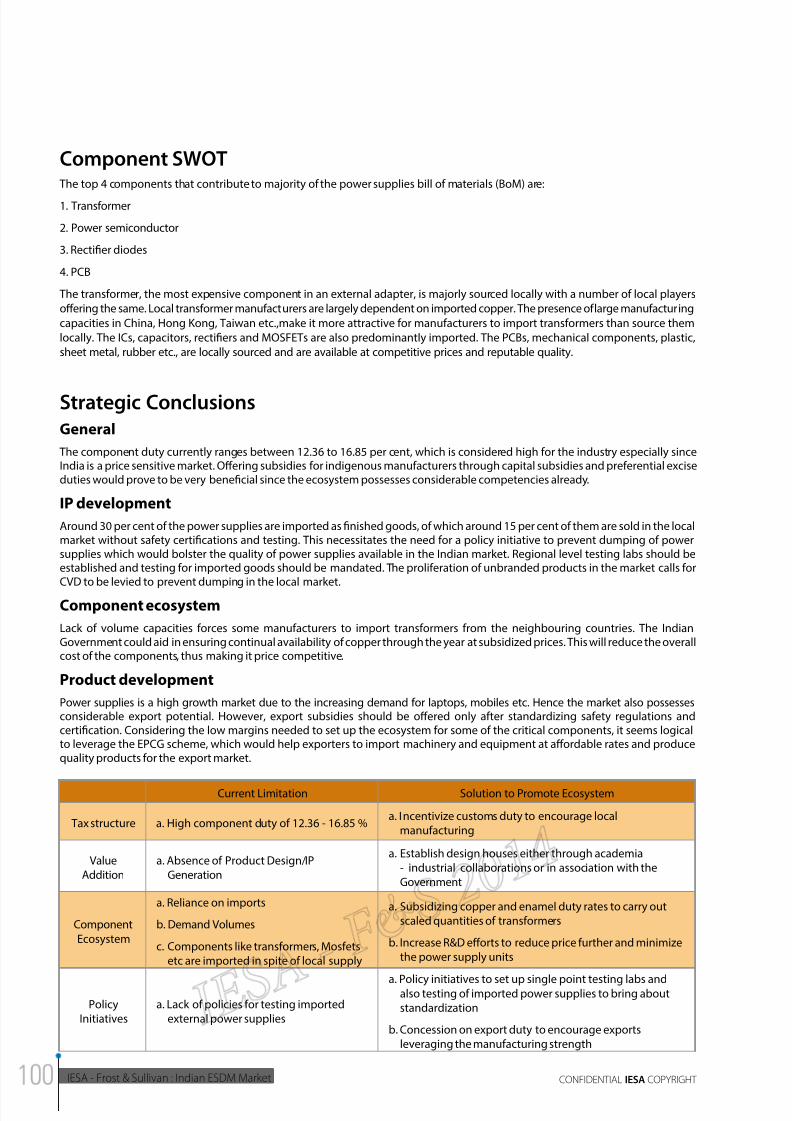
8/11/2019 IESA FS Report Indian ESDM Market
http://slidepdf.com/reader/full/iesa-fs-report-indian-esdm-market 100/172
IESA - Frost & Sullivan : Indian ESDM Market CONFIDENTIAL IESA COPYRIGHT
Component SWOT The top 4 components that contribute to majority of the power supplies bill of materials (BoM) are:
1. Transformer
2. Power semiconductor
3. Rectifier diodes
4. PCB
The transformer, the most expensive component in an external adapter, is majorly sourced locally with a number of local players
offering the same. Local transformer manufacturers are largely dependent on imported copper. The presence of large manufacturing
capacities in China, Hong Kong, Taiwan etc.,make it more attractive for manufacturers to import transformers than source them
locally. The ICs, capacitors, rectifiers and MOSFETs are also predominantly imported. The PCBs, mechanical components, plastic,
sheet metal, rubber etc., are locally sourced and are available at competitive prices and reputable quality.
Strategic Conclusions
General
The component duty currently ranges between 12.36 to 16.85 per cent, which is considered high for the industry especially sinceIndia is a price sensitive market. Offering subsidies for indigenous manufacturers through capital subsidies and preferential exciseduties would prove to be very beneficial since the ecosystem possesses considerable competencies already.
IP development
Around 30 per cent of the power supplies are imported as finished goods, of which around 15 per cent of them are sold in the localmarket without safety certifications and testing. This necessitates the need for a policy initiative to prevent dumping of powersupplies which would bolster the quality of power supplies available in the Indian market. Regional level testing labs should beestablished and testing for imported goods should be mandated. The proliferation of unbranded products in the market calls forCVD to be levied to prevent dumping in the local market.
Component ecosystem
Lack of volume capacities forces some manufacturers to import transformers from the neighbouring countries. The IndianGovernment could aid in ensuring continual availability of copper through the year at subsidized prices. This will reduce the overallcost of the components, thus making it price competitive.
Product development
Power supplies is a high growth market due to the increasing demand for laptops, mobiles etc. Hence the market also possessesconsiderable export potential. However, export subsidies should be offered only after standardizing safety regulations andcertification. Considering the low margins needed to set up the ecosystem for some of the critical components, it seems logicalto leverage the EPCG scheme, which would help exporters to import machinery and equipment at affordable rates and producequality products for the export market.
Current Limitation Solution to Promote Ecosystem
Tax structure a. High component duty of 12.36 - 16.85 %a. Incentivize customs duty to encourage local
manufacturing
ValueAddition
a. Absence of Product Design/IPGeneration
a. Establish design houses either through academia- industrial collaborations or in association with theGovernment
Component
Ecosystem
a. Reliance on imports
b. Demand Volumes
c. Components like transformers, Mosfetsetc are imported in spite of local supply
a. Subsidizing copper and enamel duty rates to carry outscaled quantities of transformers
b. Increase R&D efforts to reduce price further and minimizethe power supply units
PolicyInitiatives
a. Lack of policies for testing importedexternal power supplies
a. Policy initiatives to set up single point testing labs andalso testing of imported power supplies to bring aboutstandardization
b. Concession on export duty to encourage exportsleveraging the manufacturing strength
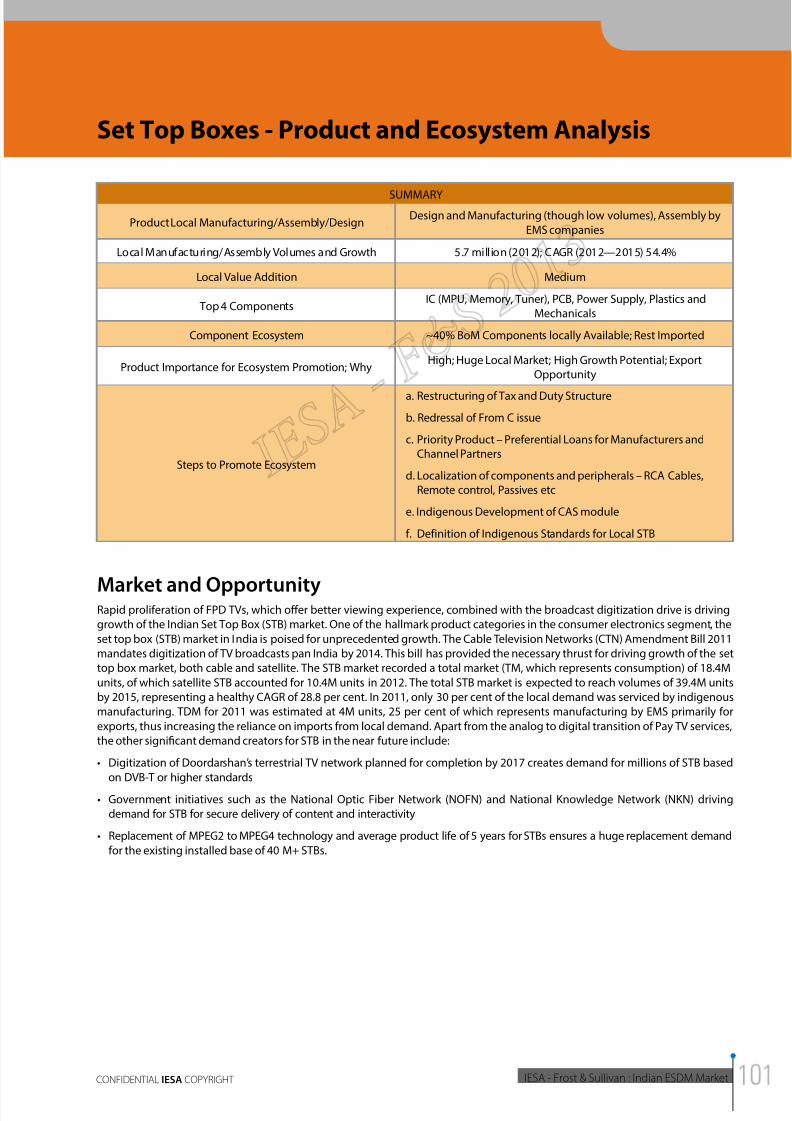
8/11/2019 IESA FS Report Indian ESDM Market
http://slidepdf.com/reader/full/iesa-fs-report-indian-esdm-market 101/172
2014INDIAN ESDM MARKET - ANALYSIS OF
OPPORTUNITY AND GROWTH PLAN
IESA - Frost & Sullivan : Indian ESDM MarketCONFIDENTIAL IESA COPYRIGHT
Set Top Boxes - Product and Ecosystem Analysis
SUMMARY
Product Local Manufacturing/Assembly/DesignDesign and Manufacturing (though low volumes), Assembly by
EMS companies
Local Manufacturing/Assembly Volumes and Growth 5.7 million (2012); CAGR (2012—2015) 54.4%
Local Value Addition Medium
Top 4 Components IC (MPU, Memory, Tuner), PCB, Power Supply, Plastics and
Mechanicals
Component Ecosystem ~40% BoM Components locally Available; Rest Imported
Product Importance for Ecosystem Promotion; WhyHigh; Huge Local Market; High Growth Potential; Export
Opportunity
Steps to Promote Ecosystem
a. Restructuring of Tax and Duty Structure
b. Redressal of From C issue
c. Priority Product – Preferential Loans for Manufacturers andChannel Partners
d. Localization of components and peripherals – RCA Cables,Remote control, Passives etc
e. Indigenous Development of CAS module
f. Definition of Indigenous Standards for Local STB
Market and OpportunityRapid proliferation of FPD TVs, which offer better viewing experience, combined with the broadcast digitization drive is driving
growth of the Indian Set Top Box (STB) market. One of the hallmark product categories in the consumer electronics segment, the
set top box (STB) market in India is poised for unprecedented growth. The Cable Television Networks (CTN) Amendment Bill 2011
mandates digitization of TV broadcasts pan India by 2014. This bill has provided the necessary thrust for driving growth of the set
top box market, both cable and satellite. The STB market recorded a total market (TM, which represents consumption) of 18.4M
units, of which satellite STB accounted for 10.4M units in 2012. The total STB market is expected to reach volumes of 39.4M units
by 2015, representing a healthy CAGR of 28.8 per cent. In 2011, only 30 per cent of the local demand was serviced by indigenous
manufacturing. TDM for 2011 was estimated at 4M units, 25 per cent of which represents manufacturing by EMS primarily for
exports, thus increasing the reliance on imports from local demand. Apart from the analog to digital transition of Pay TV services,
the other significant demand creators for STB in the near future include:
• Digitization of Doordarshan’s terrestrial TV network planned for completion by 2017 creates demand for millions of STB based
on DVB-T or higher standards
• Government initiatives such as the National Optic Fiber Network (NOFN) and National Knowledge Network (NKN) driving
demand for STB for secure delivery of content and interactivity
• Replacement of MPEG2 to MPEG4 technology and average product life of 5 years for STBs ensures a huge replacement demand
for the existing installed base of 40 M+ STBs.
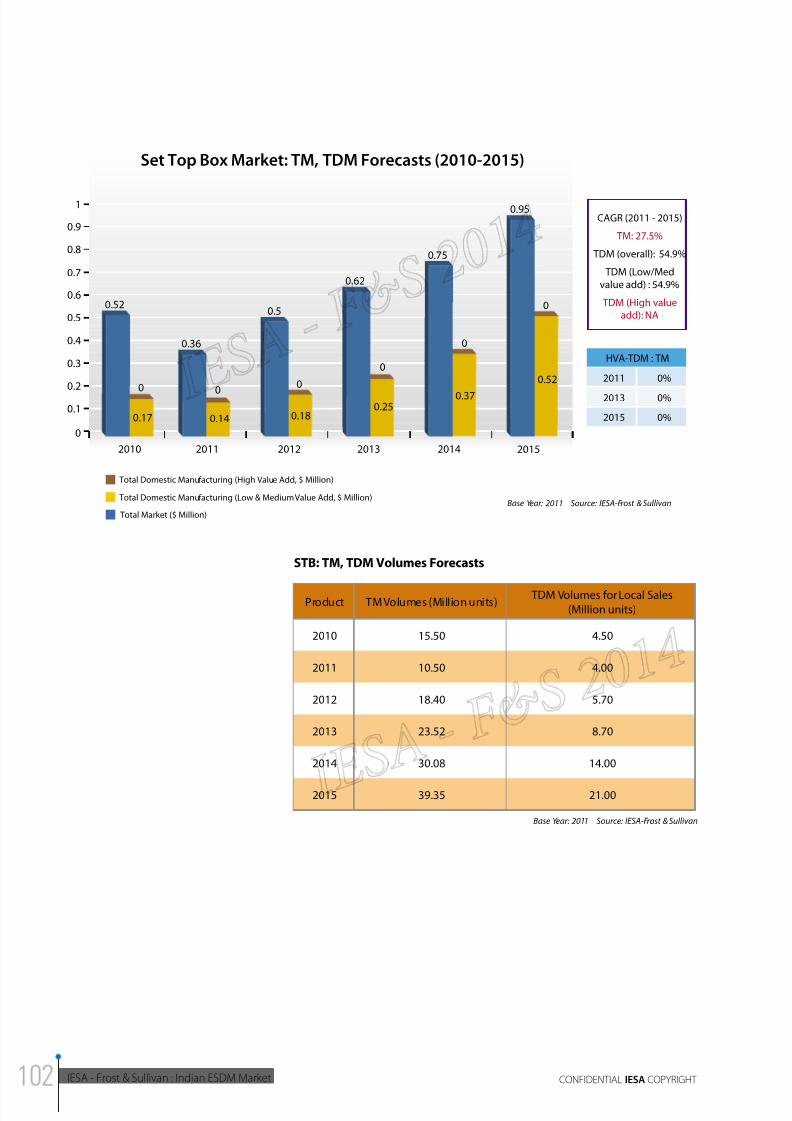
8/11/2019 IESA FS Report Indian ESDM Market
http://slidepdf.com/reader/full/iesa-fs-report-indian-esdm-market 102/172
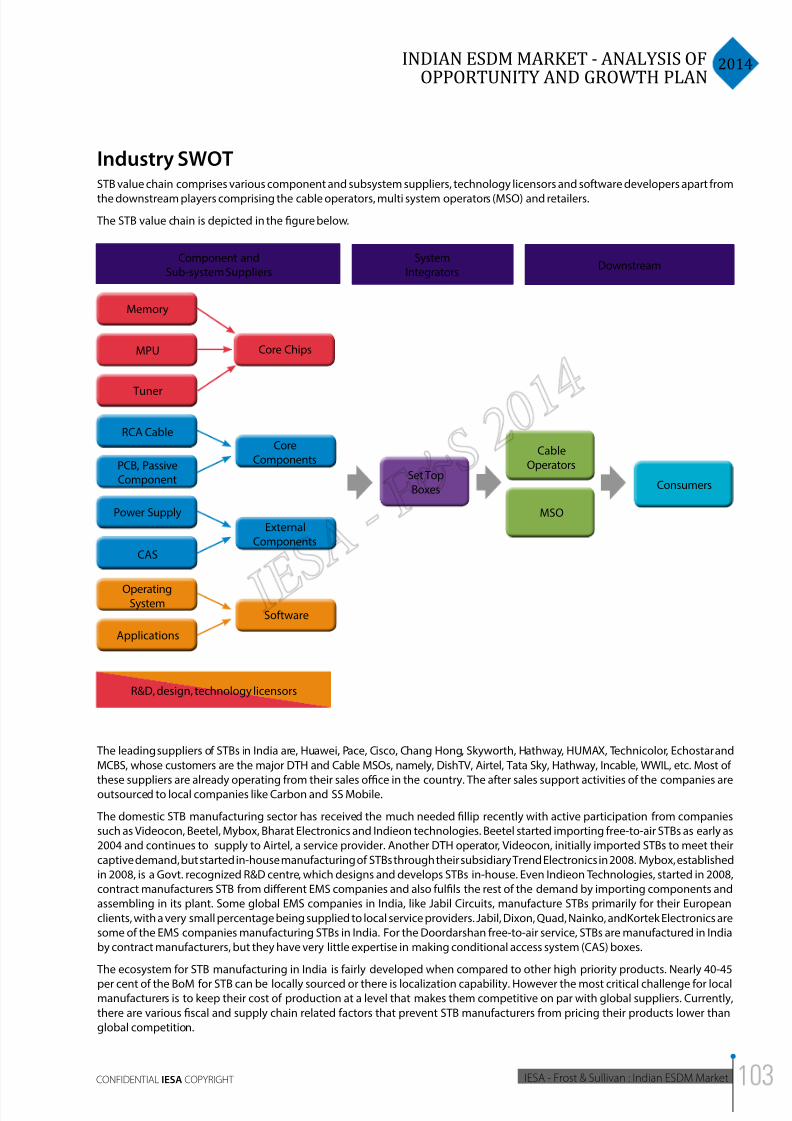
8/11/2019 IESA FS Report Indian ESDM Market
http://slidepdf.com/reader/full/iesa-fs-report-indian-esdm-market 103/172
2014INDIAN ESDM MARKET - ANALYSIS OF
OPPORTUNITY AND GROWTH PLAN
IESA - Frost & Sullivan : Indian ESDM MarketCONFIDENTIAL IESA COPYRIGHT
Industry SWOTSTB value chain comprises various component and subsystem suppliers, technology licensors and software developers apart from
the downstream players comprising the cable operators, multi system operators (MSO) and retailers.
The STB value chain is depicted in the figure below.
Component andSub-system Suppliers
Memory
MPU Core Chips
CoreComponents
ExternalComponents
Set TopBoxes
CableOperators
Consumers
MSO
Software
Tuner
RCA Cable
PCB, PassiveComponent
Power Supply
CAS
OperatingSystem
Applications
SystemIntegrators
Downstream
R&D, design, technology licensors
The leading suppliers of STBs in India are, Huawei, Pace, Cisco, Chang Hong, Skyworth, Hathway, HUMAX, Technicolor, Echostar and
MCBS, whose customers are the major DTH and Cable MSOs, namely, DishTV, Airtel, Tata Sky, Hathway, Incable, WWIL, etc. Most of
these suppliers are already operating from their sales oce in the country. The after sales support activities of the companies areoutsourced to local companies like Carbon and SS Mobile.
The domestic STB manufacturing sector has received the much needed fillip recently with active participation from companies
such as Videocon, Beetel, Mybox, Bharat Electronics and Indieon technologies. Beetel started importing free-to-air STBs as early as
2004 and continues to supply to Airtel, a service provider. Another DTH operator, Videocon, initially imported STBs to meet their
captive demand, but started in-house manufacturing of STBs through their subsidiary Trend Electronics in 2008. Mybox, established
in 2008, is a Govt. recognized R&D centre, which designs and develops STBs in-house. Even Indieon Technologies, started in 2008,
contract manufacturers STB from different EMS companies and also fulfils the rest of the demand by importing components and
assembling in its plant. Some global EMS companies in India, like Jabil Circuits, manufacture STBs primarily for their European
clients, with a very small percentage being supplied to local service providers. Jabil, Dixon, Quad, Nainko, andKortek Electronics are
some of the EMS companies manufacturing STBs in India. For the Doordarshan free-to-air service, STBs are manufactured in India
by contract manufacturers, but they have very little expertise in making conditional access system (CAS) boxes.
The ecosystem for STB manufacturing in India is fairly developed when compared to other high priority products. Nearly 40-45
per cent of the BoM for STB can be locally sourced or there is localization capability. However the most critical challenge for localmanufacturers is to keep their cost of production at a level that makes them competitive on par with global suppliers. Currently,
there are various fiscal and supply chain related factors that prevent STB manufacturers from pricing their products lower than
global competition.
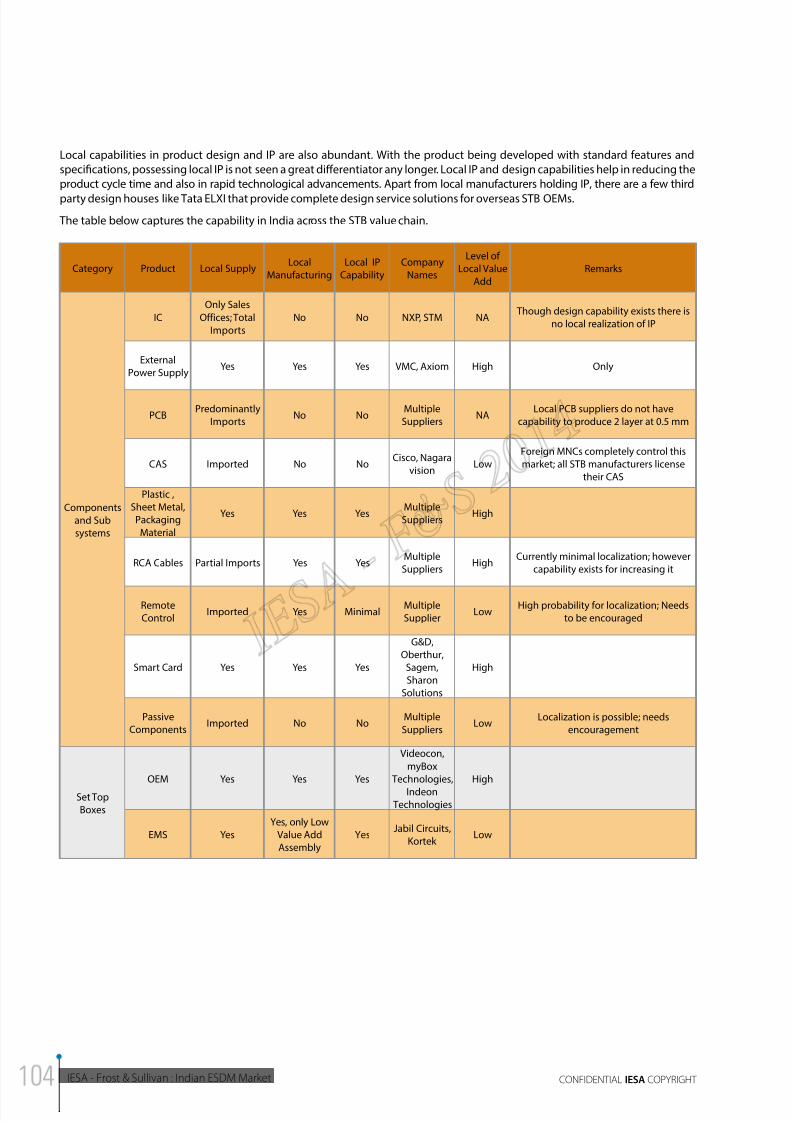
8/11/2019 IESA FS Report Indian ESDM Market
http://slidepdf.com/reader/full/iesa-fs-report-indian-esdm-market 104/172
IESA - Frost & Sullivan : Indian ESDM Market CONFIDENTIAL IESA COPYRIGHT
Local capabilities in product design and IP are also abundant. With the product being developed with standard features and
specifications, possessing local IP is not seen a great differentiator any longer. Local IP and design capabilities help in reducing the
product cycle time and also in rapid technological advancements. Apart from local manufacturers holding IP, there are a few third
party design houses like Tata ELXI that provide complete design service solutions for overseas STB OEMs.
The table below captures the capability in India across the STB value chain.
Category Product Local SupplyLocal
Manufacturing
Local IP
Capability
Company
Names
Level of
Local Value
Add
Remarks
Components
and Sub
systems
IC
Only Sales
Offices; Total
Imports
No No NXP, STM NA Though design capability exists there is
no local realization of IP
External
Power SupplyYes Yes Yes VMC, Axiom High Only
PCBPredominantly
ImportsNo No
Multiple
SuppliersNA
Local PCB suppliers do not have
capability to produce 2 layer at 0.5 mm
CAS Imported No NoCisco, Nagara
visionLow
Foreign MNCs completely control this
market; all STB manufacturers license
their CAS
Plastic ,
Sheet Metal,
Packaging
Material
Yes Yes YesMultiple
SuppliersHigh
RCA Cables Partial Imports Yes YesMultiple
SuppliersHigh
Currently minimal localization; however
capability exists for increasing it
Remote
ControlImported Yes Minimal
Multiple
SupplierLow
High probability for localization; Needs
to be encouraged
Smart Card Yes Yes Yes
G&D,
Oberthur,
Sagem,
Sharon
Solutions
High
Passive
ComponentsImported No No
Multiple
SuppliersLow
Localization is possible; needs
encouragement
Set Top
Boxes
OEM Yes Yes Yes
Videocon,
myBox
Technologies,
Indeon
Technologies
High
EMS Yes
Yes, only Low
Value Add
Assembly
YesJabil Circuits,
Kortek Low
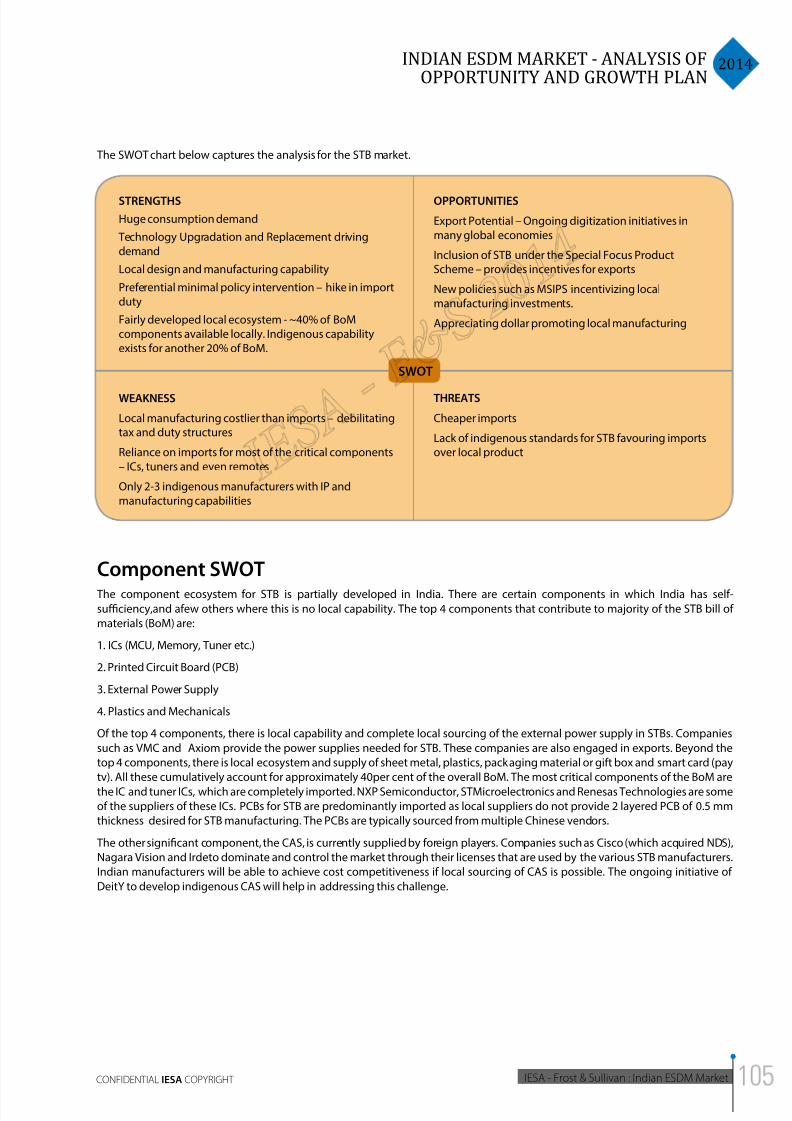
8/11/2019 IESA FS Report Indian ESDM Market
http://slidepdf.com/reader/full/iesa-fs-report-indian-esdm-market 105/172
2014INDIAN ESDM MARKET - ANALYSIS OF
OPPORTUNITY AND GROWTH PLAN
IESA - Frost & Sullivan : Indian ESDM MarketCONFIDENTIAL IESA COPYRIGHT
The SWOT chart below captures the analysis for the STB market.
STRENGTHS
Huge consumption demand
Technology Upgradation and Replacement drivingdemand
Local design and manufacturing capability
Preferential minimal policy intervention – hike in importduty
Fairly developed local ecosystem - ~40% of BoMcomponents available locally. Indigenous capabilityexists for another 20% of BoM.
OPPORTUNITIES
Export Potential – Ongoing digitization initiatives inmany global economies
Inclusion of STB under the Special Focus ProductScheme – provides incentives for exports
New policies such as MSIPS incentivizing localmanufacturing investments.
Appreciating dollar promoting local manufacturing
WEAKNESS
Local manufacturing costlier than imports – debilitatingtax and duty structures
Reliance on imports for most of the critical components– ICs, tuners and even remotes
Only 2-3 indigenous manufacturers with IP andmanufacturing capabilities
THREATS
Cheaper imports
Lack of indigenous standards for STB favouring importsover local product
SWOT
Component SWOT The component ecosystem for STB is partially developed in India. There are certain components in which India has self-
suciency,and afew others where this is no local capability. The top 4 components that contribute to majority of the STB bill of
materials (BoM) are:
1. ICs (MCU, Memory, Tuner etc.)
2. Printed Circuit Board (PCB)
3. External Power Supply
4. Plastics and Mechanicals
Of the top 4 components, there is local capability and complete local sourcing of the external power supply in STBs. Companies
such as VMC and Axiom provide the power supplies needed for STB. These companies are also engaged in exports. Beyond the
top 4 components, there is local ecosystem and supply of sheet metal, plastics, packaging material or gift box and smart card (pay
tv). All these cumulatively account for approximately 40per cent of the overall BoM. The most critical components of the BoM are
the IC and tuner ICs, which are completely imported. NXP Semiconductor, STMicroelectronics and Renesas Technologies are some
of the suppliers of these ICs. PCBs for STB are predominantly imported as local suppliers do not provide 2 layered PCB of 0.5 mm
thickness desired for STB manufacturing. The PCBs are typically sourced from multiple Chinese vendors.
The other significant component, the CAS, is currently supplied by foreign players. Companies such as Cisco (which acquired NDS),
Nagara Vision and Irdeto dominate and control the market through their licenses that are used by the various STB manufacturers.
Indian manufacturers will be able to achieve cost competitiveness if local sourcing of CAS is possible. The ongoing initiative of
DeitY to develop indigenous CAS will help in addressing this challenge.
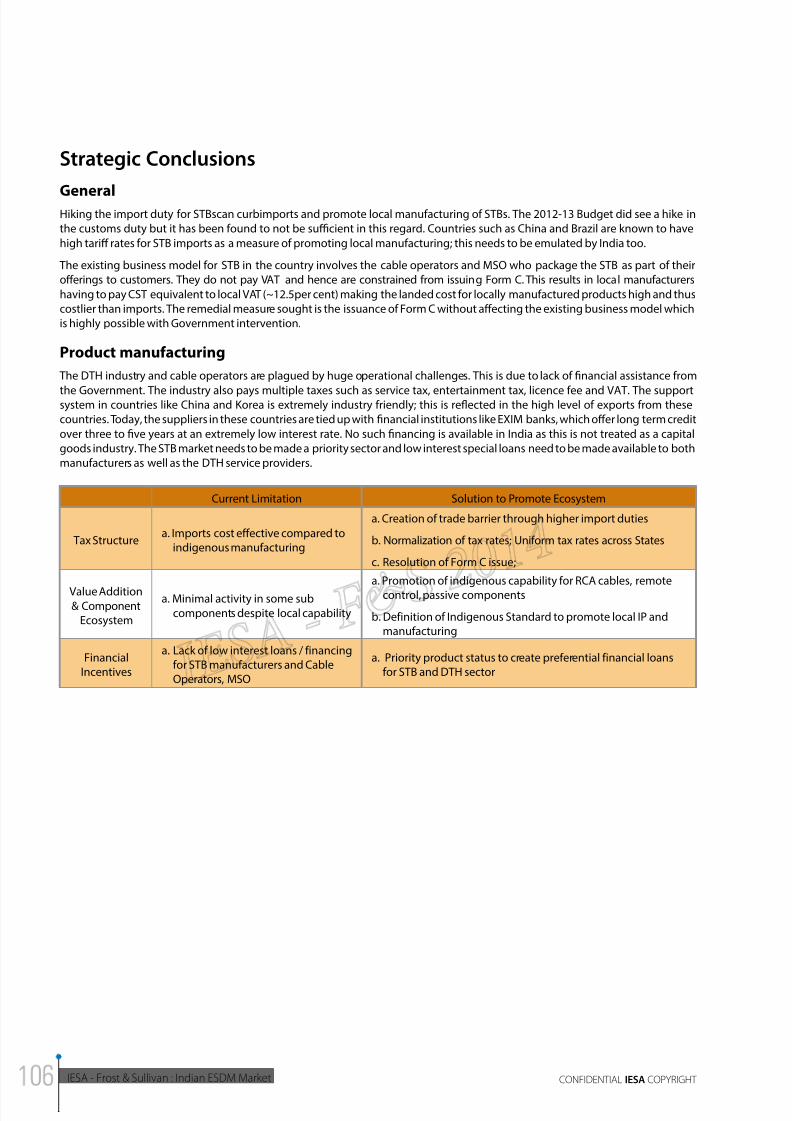
8/11/2019 IESA FS Report Indian ESDM Market
http://slidepdf.com/reader/full/iesa-fs-report-indian-esdm-market 106/172
IESA - Frost & Sullivan : Indian ESDM Market CONFIDENTIAL IESA COPYRIGHT
Strategic Conclusions
GeneralHiking the import duty for STBscan curbimports and promote local manufacturing of STBs. The 2012-13 Budget did see a hike in
the customs duty but it has been found to not be sucient in this regard. Countries such as China and Brazil are known to have
high tariff rates for STB imports as a measure of promoting local manufacturing; this needs to be emulated by India too.
The existing business model for STB in the country involves the cable operators and MSO who package the STB as part of their
offerings to customers. They do not pay VAT and hence are constrained from issuing Form C. This results in local manufacturers
having to pay CST equivalent to local VAT (~12.5per cent) making the landed cost for locally manufactured products high and thus
costlier than imports. The remedial measure sought is the issuance of Form C without affecting the existing business model which
is highly possible with Government intervention.
Product manufacturing
The DTH industry and cable operators are plagued by huge operational challenges. This is due to lack of financial assistance from
the Government. The industry also pays multiple taxes such as service tax, entertainment tax, licence fee and VAT. The supportsystem in countries like China and Korea is extremely industry friendly; this is reflected in the high level of exports from these
countries. Today, the suppliers in these countries are tied up with financial institutions like EXIM banks, which offer long term credit
over three to five years at an extremely low interest rate. No such financing is available in India as this is not treated as a capital
goods industry. The STB market needs to be made a priority sector and low interest special loans need to be made available to both
manufacturers as well as the DTH service providers.
Current Limitation Solution to Promote Ecosystem
Tax Structurea. Imports cost effective compared to
indigenous manufacturing
a. Creation of trade barrier through higher import duties
b. Normalization of tax rates; Uniform tax rates across States
c. Resolution of Form C issue;
Value Addition& Component
Ecosystem
a. Minimal activity in some sub
components despite local capability
a. Promotion of indigenous capability for RCA cables, remotecontrol, passive components
b. Definition of Indigenous Standard to promote local IP andmanufacturing
FinancialIncentives
a. Lack of low interest loans / financingfor STB manufacturers and CableOperators, MSO
a. Priority product status to create preferential financial loansfor STB and DTH sector
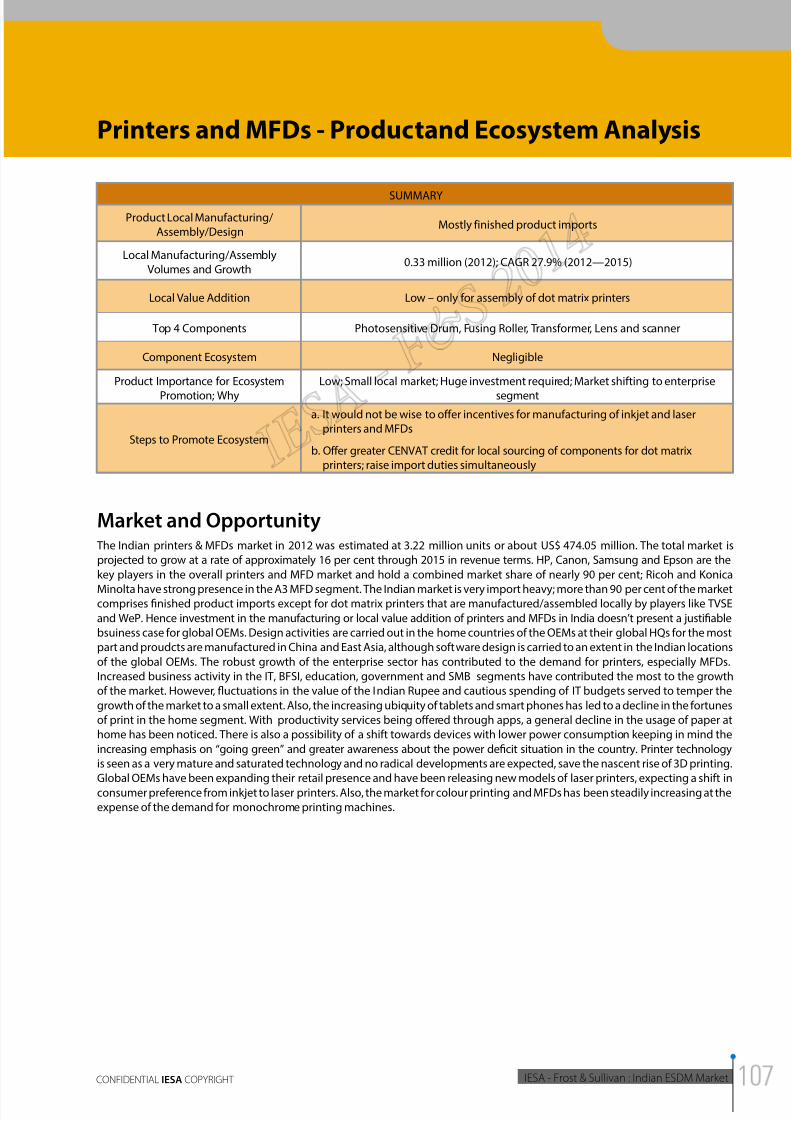
8/11/2019 IESA FS Report Indian ESDM Market
http://slidepdf.com/reader/full/iesa-fs-report-indian-esdm-market 107/172
2014INDIAN ESDM MARKET - ANALYSIS OF
OPPORTUNITY AND GROWTH PLAN
IESA - Frost & Sullivan : Indian ESDM MarketCONFIDENTIAL IESA COPYRIGHT
Printers and MFDs - Productand Ecosystem Analysis
SUMMARY
Product Local Manufacturing/Assembly/Design
Mostly finished product imports
Local Manufacturing/AssemblyVolumes and Growth
0.33 million (2012); CAGR 27.9% (2012—2015)
Local Value Addition Low – only for assembly of dot matrix printers
Top 4 Components Photosensitive Drum, Fusing Roller, Transformer, Lens and scanner
Component Ecosystem Negligible
Product Importance for Ecosystem
Promotion; Why
Low; Small local market; Huge investment required; Market shifting to enterprise
segment
Steps to Promote Ecosystem
a. It would not be wise to offer incentives for manufacturing of inkjet and laserprinters and MFDs
b. Offer greater CENVAT credit for local sourcing of components for dot matrixprinters; raise import duties simultaneously
Market and Opportunity The Indian printers & MFDs market in 2012 was estimated at 3.22 million units or about US$ 474.05 million. The total market is
projected to grow at a rate of approximately 16 per cent through 2015 in revenue terms. HP, Canon, Samsung and Epson are the
key players in the overall printers and MFD market and hold a combined market share of nearly 90 per cent; Ricoh and Konica
Minolta have strong presence in the A3 MFD segment. The Indian market is very import heavy; more than 90 per cent of the marketcomprises finished product imports except for dot matrix printers that are manufactured/assembled locally by players like TVSE
and WeP. Hence investment in the manufacturing or local value addition of printers and MFDs in India doesn’t present a justifiable
bsuiness case for global OEMs. Design activities are carried out in the home countries of the OEMs at their global HQs for the most
part and proudcts are manufactured in China and East Asia, although software design is carried to an extent in the Indian locations
of the global OEMs. The robust growth of the enterprise sector has contributed to the demand for printers, especially MFDs.
Increased business activity in the IT, BFSI, education, government and SMB segments have contributed the most to the growth
of the market. However, fluctuations in the value of the Indian Rupee and cautious spending of IT budgets served to temper the
growth of the market to a small extent. Also, the increasing ubiquity of tablets and smart phones has led to a decline in the fortunes
of print in the home segment. With productivity services being offered through apps, a general decline in the usage of paper at
home has been noticed. There is also a possibility of a shift towards devices with lower power consumption keeping in mind the
increasing emphasis on “going green” and greater awareness about the power deficit situation in the country. Printer technology
is seen as a very mature and saturated technology and no radical developments are expected, save the nascent rise of 3D printing.
Global OEMs have been expanding their retail presence and have been releasing new models of laser printers, expecting a shift in
consumer preference from inkjet to laser printers. Also, the market for colour printing and MFDs has been steadily increasing at the
expense of the demand for monochrome printing machines.
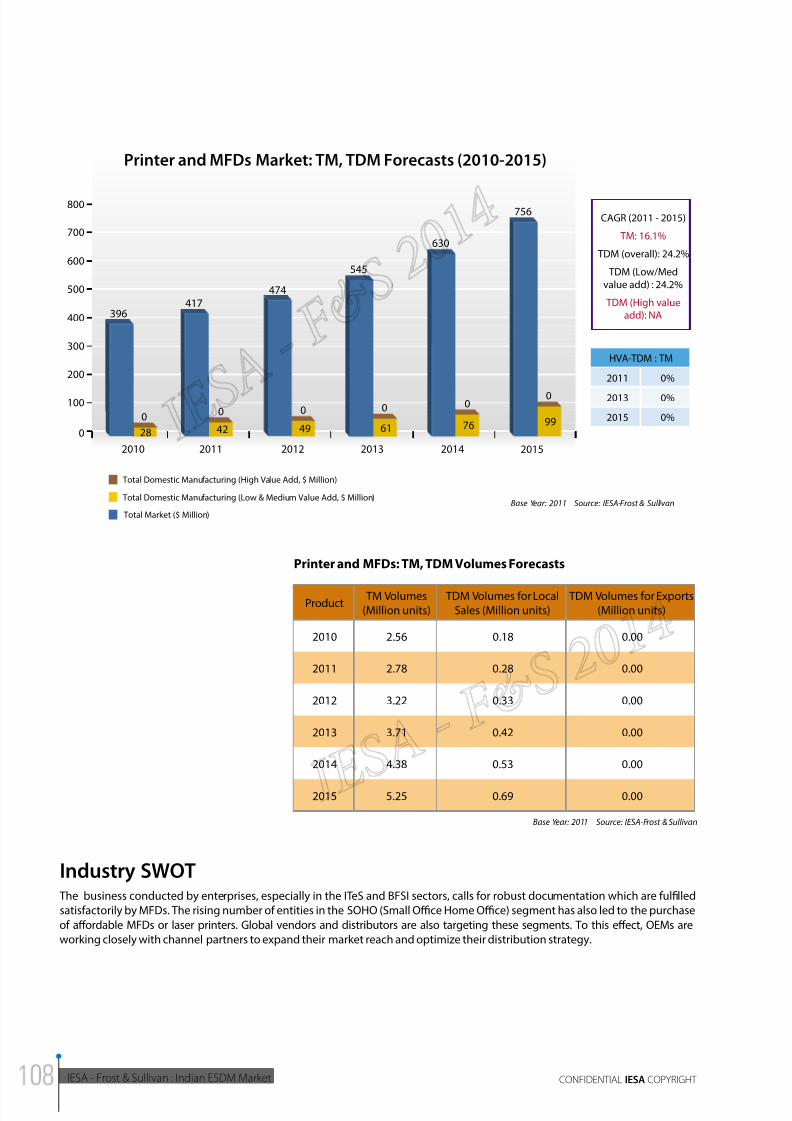
8/11/2019 IESA FS Report Indian ESDM Market
http://slidepdf.com/reader/full/iesa-fs-report-indian-esdm-market 108/172
IESA - Frost & Sullivan : Indian ESDM Market CONFIDENTIAL IESA COPYRIGHT
756
0
0
100
200
300
400
500
600
800
700
20112010 2012 2013 2014 2015
Printer and MFDs Market: TM, TDM Forecasts (2010-2015)
HVA-TDM : TM
2011
2013
2015
0%
0%
0%
Total Market ($ Million)
Total Domestic Manufacturing (High Value Add, $ Million)
Total Domestic Manufacturing (Low & Medium Value Add, $ Million)Base Year: 2011 Source: IESA-Frost & Sullivan
CAGR (2011 - 2015)
TM: 16.1%
TDM (overall): 24.2%
TDM (Low/Med
value add) : 24.2%
TDM (High valueadd): NA
99
0
630
545
0
61
474
00
417
0
396
28 42 49 76
Printer and MFDs: TM, TDM Volumes Forecasts
Product TM Volumes(Million units)
TDM Volumes for LocalSales (Million units)
TDM Volumes for Exports(Million units)
2010 2.56 0.18 0.00
2011 2.78 0.28 0.00
2012 3.22 0.33 0.00
2013 3.71 0.42 0.00
2014 4.38 0.53 0.00
2015 5.25 0.69 0.00
Base Year: 2011 Source: IESA-Frost & Sullivan
Industry SWOT The business conducted by enterprises, especially in the ITeS and BFSI sectors, calls for robust documentation which are fulfilled
satisfactorily by MFDs. The rising number of entities in the SOHO (Small Oce Home Oce) segment has also led to the purchase
of affordable MFDs or laser printers. Global vendors and distributors are also targeting these segments. To this effect, OEMs are
working closely with channel partners to expand their market reach and optimize their distribution strategy.
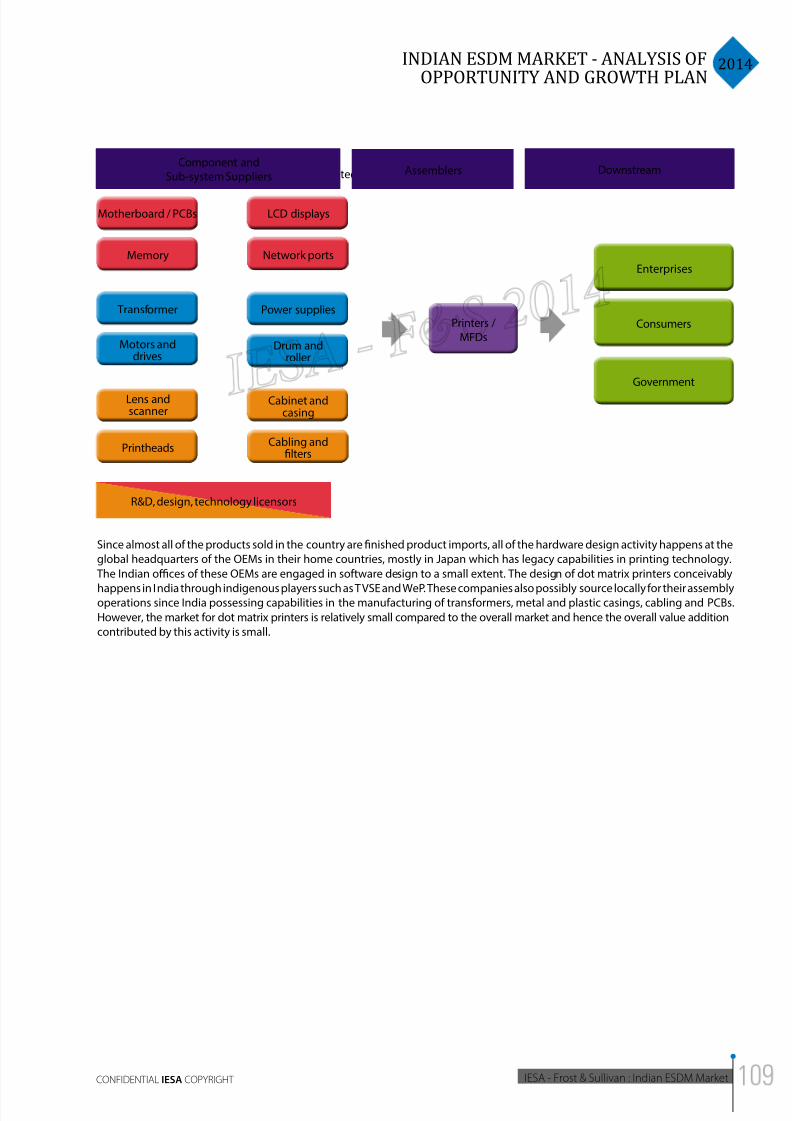
8/11/2019 IESA FS Report Indian ESDM Market
http://slidepdf.com/reader/full/iesa-fs-report-indian-esdm-market 109/172
2014INDIAN ESDM MARKET - ANALYSIS OF
OPPORTUNITY AND GROWTH PLAN
IESA - Frost & Sullivan : Indian ESDM MarketCONFIDENTIAL IESA COPYRIGHT
The printers and MFDs value chain is depicted in the figure below.Component and
Sub-system Suppliers
Motherboard / PCBs
Memory
LCD displays
Network ports
Consumers
Government
Enterprises
Transformer
Motors anddrives
Lens andscanner
Printheads
Cabinet andcasing
Cabling andfilters
Assemblers Downstream
R&D, design, technology licensors
Power supplies
Drum androller
Printers /MFDs
Since almost all of the products sold in the country are finished product imports, all of the hardware design activity happens at the
global headquarters of the OEMs in their home countries, mostly in Japan which has legacy capabilities in printing technology.
The Indian oces of these OEMs are engaged in software design to a small extent. The design of dot matrix printers conceivably
happens in India through indigenous players such as TVSE and WeP. These companies also possibly source locally for their assemblyoperations since India possessing capabilities in the manufacturing of transformers, metal and plastic casings, cabling and PCBs.
However, the market for dot matrix printers is relatively small compared to the overall market and hence the overall value addition
contributed by this activity is small.
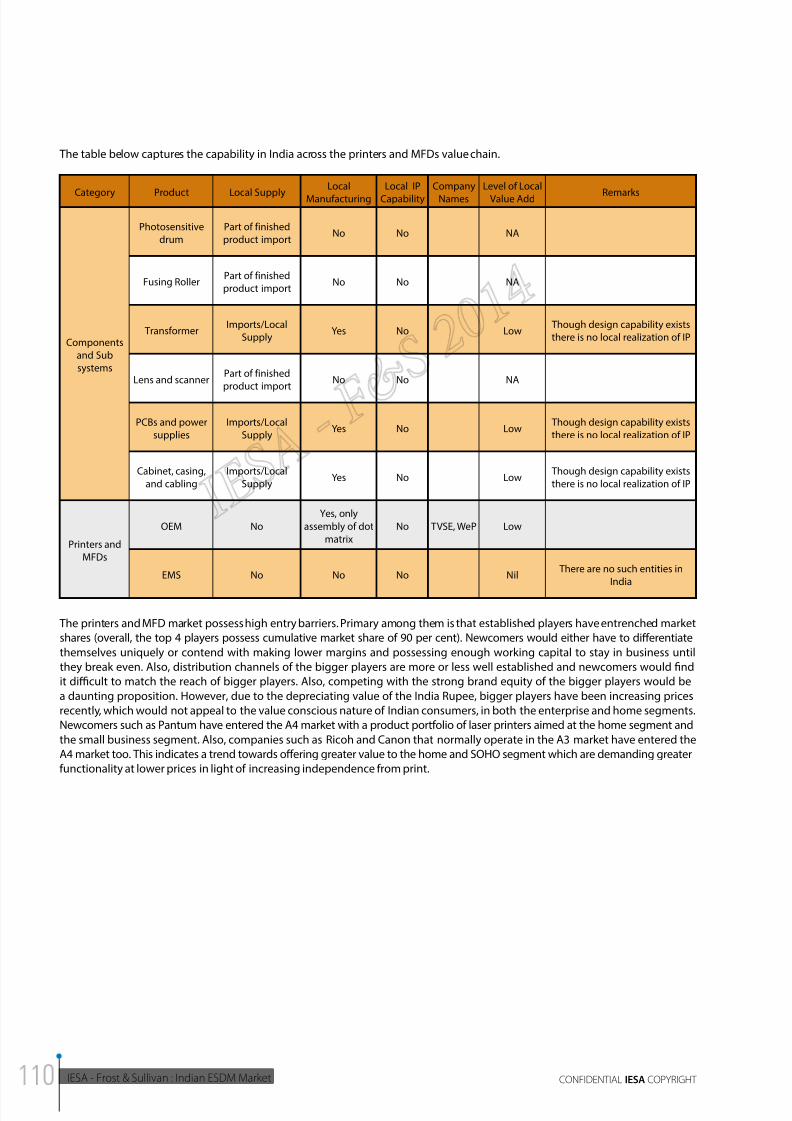
8/11/2019 IESA FS Report Indian ESDM Market
http://slidepdf.com/reader/full/iesa-fs-report-indian-esdm-market 110/172
IESA - Frost & Sullivan : Indian ESDM Market CONFIDENTIAL IESA COPYRIGHT
Category Product Local Supply
Local
Manufacturing
Local IP
Capability
Company
Names
Level of Local
Value Add Remarks
Components
and Sub
systems
Photosensitive
drum
Part of finished
product importNo No NA
Fusing RollerPart of finished
product importNo No NA
TransformerImports/Local
SupplyYes No Low
Though design capability exists
there is no local realization of IP
Lens and scannerPart of finished
product importNo No NA
PCBs and power
supplies
Imports/Local
SupplyYes No Low
Though design capability exists
there is no local realization of IP
Cabinet, casing,
and cabling
Imports/Local
SupplyYes No Low
Though design capability exists
there is no local realization of IP
Printers and
MFDs
OEM No
Yes, only
assembly of dot
matrix
No TVSE, WeP Low
EMS No No No Nil There are no such entities in
India
The table below captures the capability in India across the printers and MFDs value chain.
The printers and MFD market possess high entry barriers. Primary among them is that established players have entrenched market
shares (overall, the top 4 players possess cumulative market share of 90 per cent). Newcomers would either have to differentiate
themselves uniquely or contend with making lower margins and possessing enough working capital to stay in business until
they break even. Also, distribution channels of the bigger players are more or less well established and newcomers would find
it dicult to match the reach of bigger players. Also, competing with the strong brand equity of the bigger players would be
a daunting proposition. However, due to the depreciating value of the India Rupee, bigger players have been increasing prices
recently, which would not appeal to the value conscious nature of Indian consumers, in both the enterprise and home segments.
Newcomers such as Pantum have entered the A4 market with a product portfolio of laser printers aimed at the home segment and
the small business segment. Also, companies such as Ricoh and Canon that normally operate in the A3 market have entered the
A4 market too. This indicates a trend towards offering greater value to the home and SOHO segment which are demanding greater
functionality at lower prices in light of increasing independence from print.
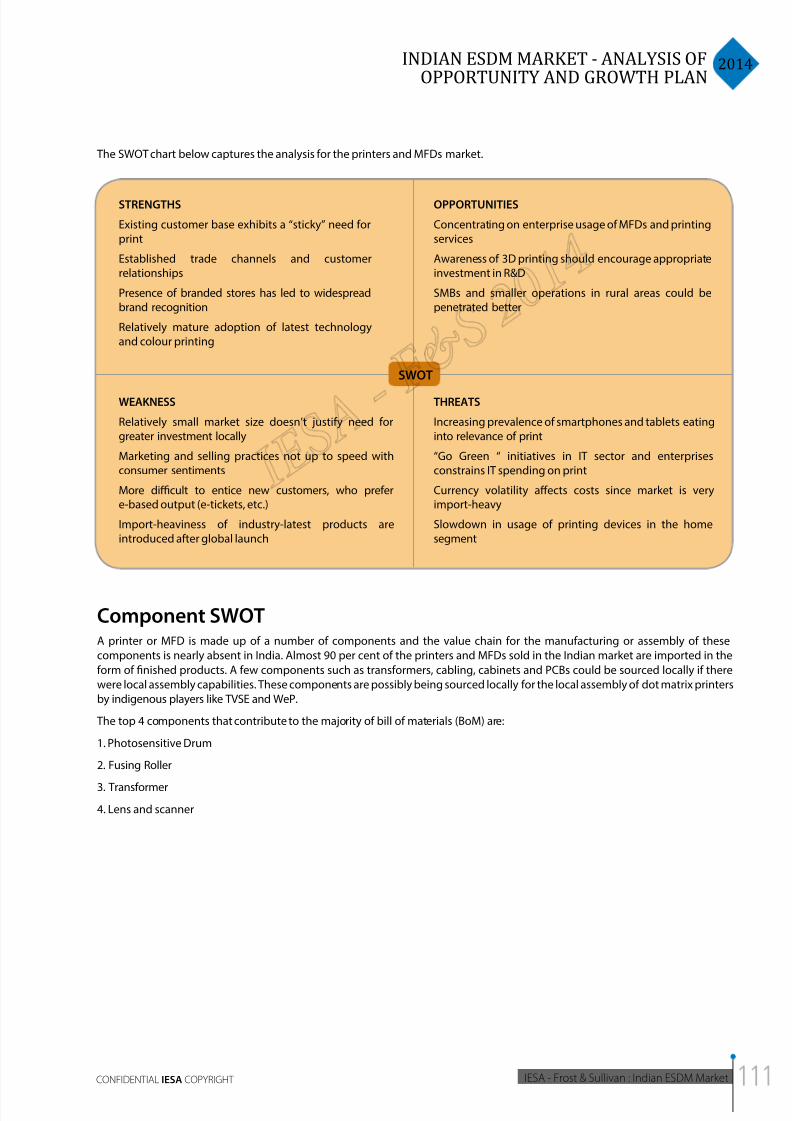
8/11/2019 IESA FS Report Indian ESDM Market
http://slidepdf.com/reader/full/iesa-fs-report-indian-esdm-market 111/172
2014INDIAN ESDM MARKET - ANALYSIS OF
OPPORTUNITY AND GROWTH PLAN
IESA - Frost & Sullivan : Indian ESDM MarketCONFIDENTIAL IESA COPYRIGHT
STRENGTHS
Existing customer base exhibits a “sticky” need forprint
Established trade channels and customerrelationships
Presence of branded stores has led to widespreadbrand recognition
Relatively mature adoption of latest technologyand colour printing
OPPORTUNITIES
Concentrating on enterprise usage of MFDs and printingservices
Awareness of 3D printing should encourage appropriateinvestment in R&D
SMBs and smaller operations in rural areas could bepenetrated better
WEAKNESS
Relatively small market size doesn’t justify need forgreater investment locally
Marketing and selling practices not up to speed withconsumer sentiments
More dicult to entice new customers, who prefere-based output (e-tickets, etc.)
Import-heaviness of industry-latest products areintroduced after global launch
THREATS
Increasing prevalence of smartphones and tablets eatinginto relevance of print
“Go Green “ initiatives in IT sector and enterprisesconstrains IT spending on print
Currency volatility affects costs since market is veryimport-heavy
Slowdown in usage of printing devices in the homesegment
SWOT
The SWOT chart below captures the analysis for the printers and MFDs market.
Component SWOTA printer or MFD is made up of a number of components and the value chain for the manufacturing or assembly of these
components is nearly absent in India. Almost 90 per cent of the printers and MFDs sold in the Indian market are imported in the
form of finished products. A few components such as transformers, cabling, cabinets and PCBs could be sourced locally if there
were local assembly capabilities. These components are possibly being sourced locally for the local assembly of dot matrix printers
by indigenous players like TVSE and WeP.
The top 4 components that contribute to the majority of bill of materials (BoM) are:
1. Photosensitive Drum
2. Fusing Roller
3. Transformer
4. Lens and scanner
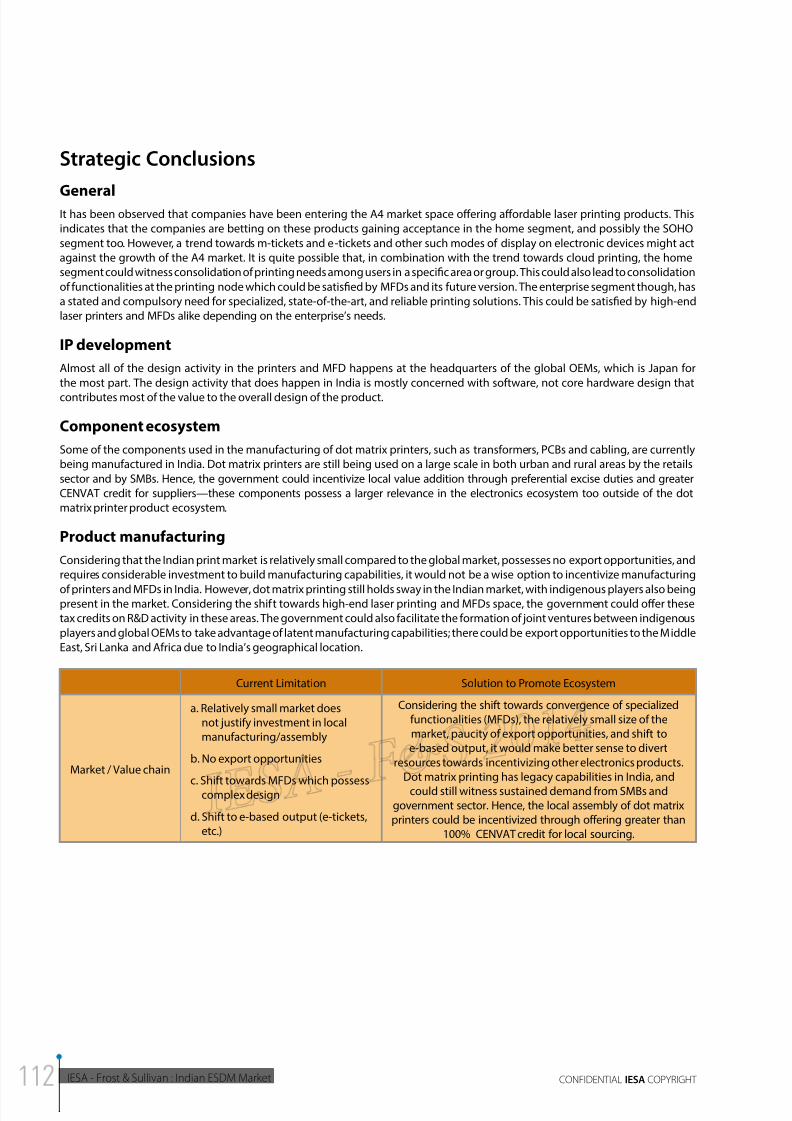
8/11/2019 IESA FS Report Indian ESDM Market
http://slidepdf.com/reader/full/iesa-fs-report-indian-esdm-market 112/172
IESA - Frost & Sullivan : Indian ESDM Market CONFIDENTIAL IESA COPYRIGHT
Strategic Conclusions
GeneralIt has been observed that companies have been entering the A4 market space offering affordable laser printing products. This
indicates that the companies are betting on these products gaining acceptance in the home segment, and possibly the SOHO
segment too. However, a trend towards m-tickets and e-tickets and other such modes of display on electronic devices might act
against the growth of the A4 market. It is quite possible that, in combination with the trend towards cloud printing, the home
segment could witness consolidation of printing needs among users in a specific area or group. This could also lead to consolidation
of functionalities at the printing node which could be satisfied by MFDs and its future version. The enterprise segment though, has
a stated and compulsory need for specialized, state-of-the-art, and reliable printing solutions. This could be satisfied by high-end
laser printers and MFDs alike depending on the enterprise’s needs.
IP development
Almost all of the design activity in the printers and MFD happens at the headquarters of the global OEMs, which is Japan for
the most part. The design activity that does happen in India is mostly concerned with software, not core hardware design that
contributes most of the value to the overall design of the product.
Component ecosystem
Some of the components used in the manufacturing of dot matrix printers, such as transformers, PCBs and cabling, are currently
being manufactured in India. Dot matrix printers are still being used on a large scale in both urban and rural areas by the retails
sector and by SMBs. Hence, the government could incentivize local value addition through preferential excise duties and greater
CENVAT credit for suppliers—these components possess a larger relevance in the electronics ecosystem too outside of the dot
matrix printer product ecosystem.
Product manufacturing
Considering that the Indian print market is relatively small compared to the global market, possesses no export opportunities, and
requires considerable investment to build manufacturing capabilities, it would not be a wise option to incentivize manufacturing
of printers and MFDs in India. However, dot matrix printing still holds sway in the Indian market, with indigenous players also beingpresent in the market. Considering the shift towards high-end laser printing and MFDs space, the government could offer these
tax credits on R&D activity in these areas. The government could also facilitate the formation of joint ventures between indigenous
players and global OEMs to take advantage of latent manufacturing capabilities; there could be export opportunities to the Middle
East, Sri Lanka and Africa due to India’s geographical location.
Current Limitation Solution to Promote Ecosystem
Market / Value chain
a. Relatively small market doesnot justify investment in localmanufacturing/assembly
b. No export opportunities
c. Shift towards MFDs which possesscomplex design
d. Shift to e-based output (e-tickets,etc.)
Considering the shift towards convergence of specializedfunctionalities (MFDs), the relatively small size of themarket, paucity of export opportunities, and shift toe-based output, it would make better sense to divert
resources towards incentivizing other electronics products.Dot matrix printing has legacy capabilities in India, and
could still witness sustained demand from SMBs andgovernment sector. Hence, the local assembly of dot matrixprinters could be incentivized through offering greater than
100% CENVAT credit for local sourcing.
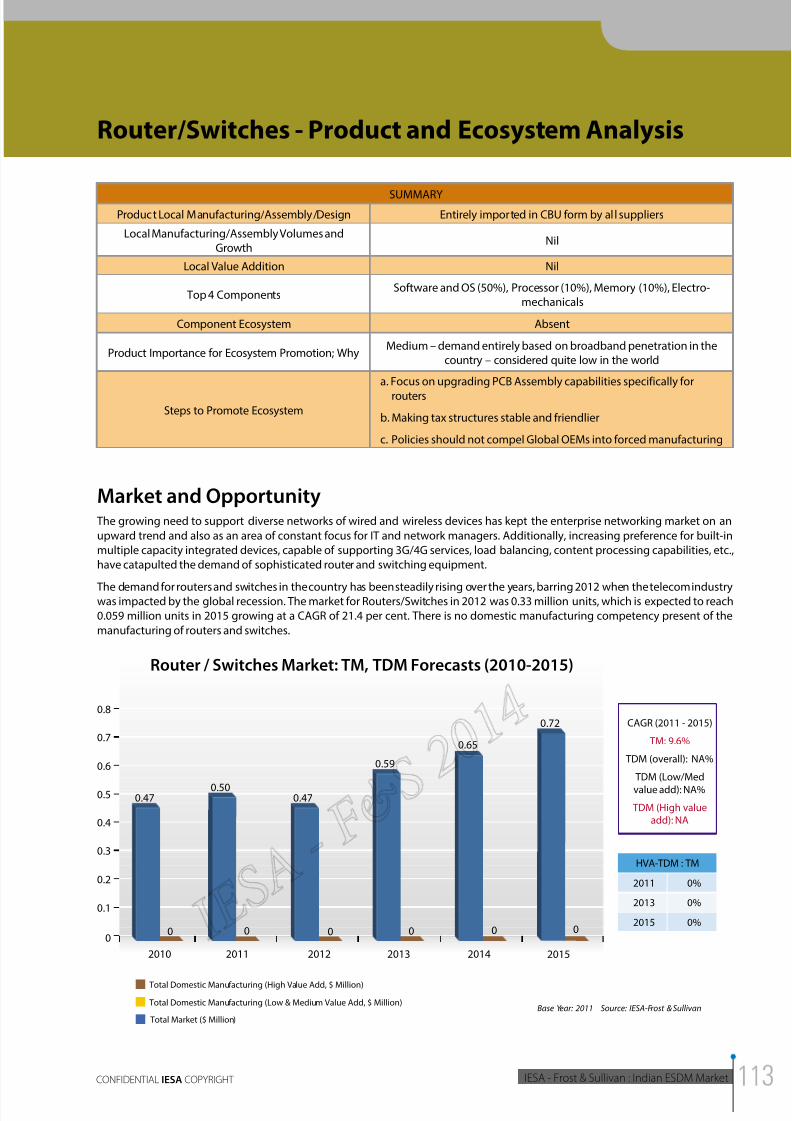
8/11/2019 IESA FS Report Indian ESDM Market
http://slidepdf.com/reader/full/iesa-fs-report-indian-esdm-market 113/172
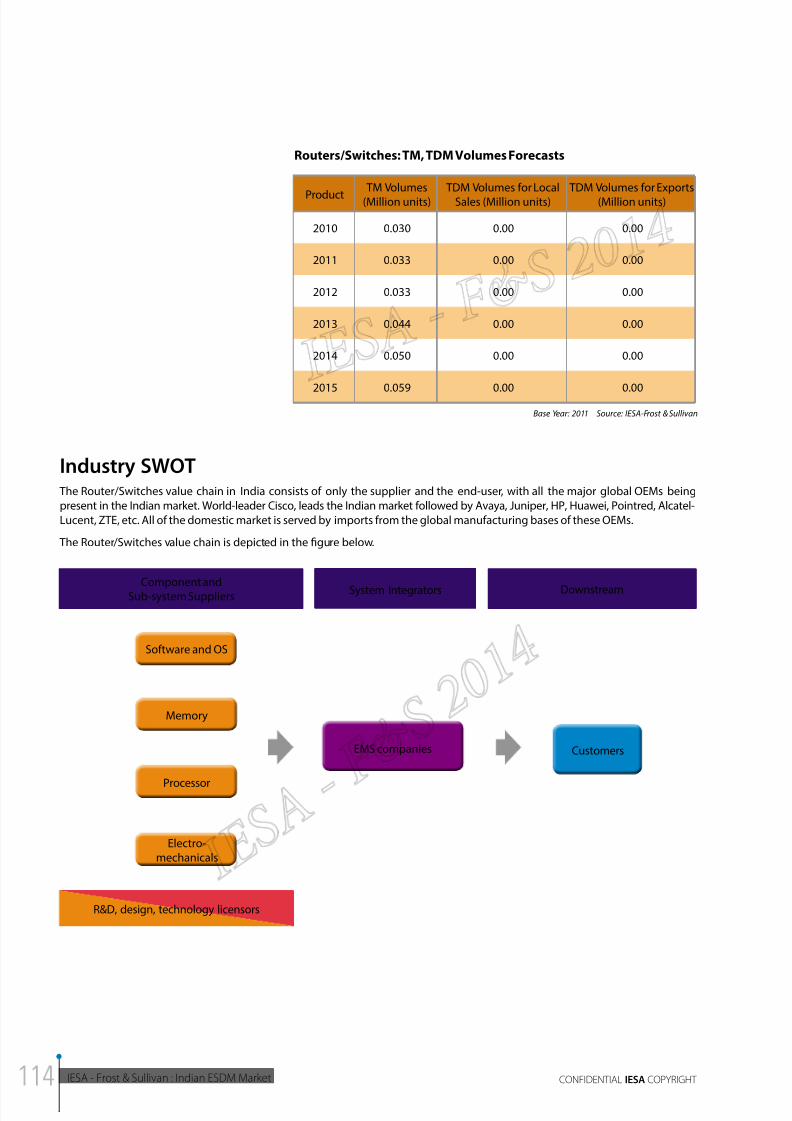
8/11/2019 IESA FS Report Indian ESDM Market
http://slidepdf.com/reader/full/iesa-fs-report-indian-esdm-market 114/172
IESA - Frost & Sullivan : Indian ESDM Market CONFIDENTIAL IESA COPYRIGHT
Routers/Switches: TM, TDM Volumes Forecasts
Product TM Volumes(Million units)
TDM Volumes for LocalSales (Million units)
TDM Volumes for Exports(Million units)
2010 0.030 0.00 0.00
2011 0.033 0.00 0.00
2012 0.033 0.00 0.00
2013 0.044 0.00 0.00
2014 0.050 0.00 0.00
2015 0.059 0.00 0.00
Base Year: 2011 Source: IESA-Frost & Sullivan
Industry SWOT The Router/Switches value chain in India consists of only the supplier and the end-user, with all the major global OEMs being
present in the Indian market. World-leader Cisco, leads the Indian market followed by Avaya, Juniper, HP, Huawei, Pointred, Alcatel-
Lucent, ZTE, etc. All of the domestic market is served by imports from the global manufacturing bases of these OEMs.
The Router/Switches value chain is depicted in the figure below.
Component andSub-system Suppliers System Integrators Downstream
Memory
Software and OS
Electro-mechanicals
Processor
EMS companies Customers
R&D, design, technology licensors
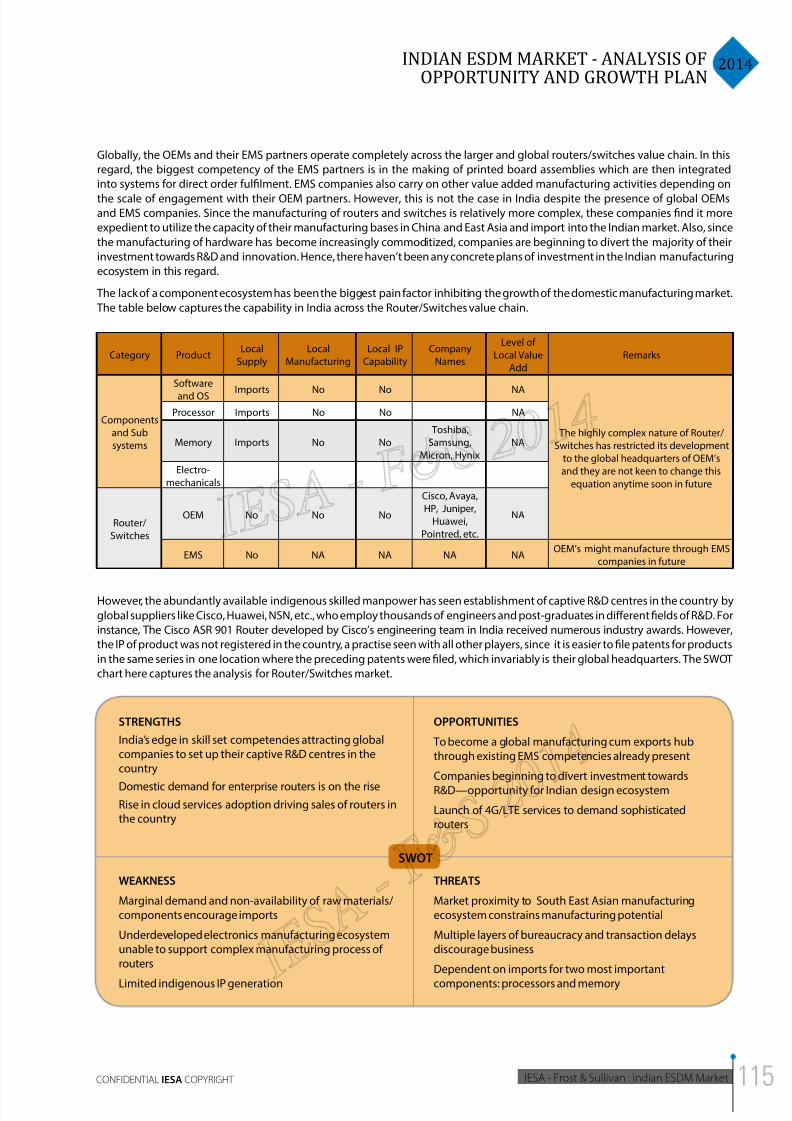
8/11/2019 IESA FS Report Indian ESDM Market
http://slidepdf.com/reader/full/iesa-fs-report-indian-esdm-market 115/172
2014INDIAN ESDM MARKET - ANALYSIS OF
OPPORTUNITY AND GROWTH PLAN
IESA - Frost & Sullivan : Indian ESDM MarketCONFIDENTIAL IESA COPYRIGHT
Globally, the OEMs and their EMS partners operate completely across the larger and global routers/switches value chain. In this
regard, the biggest competency of the EMS partners is in the making of printed board assemblies which are then integrated
into systems for direct order fulfilment. EMS companies also carry on other value added manufacturing activities depending on
the scale of engagement with their OEM partners. However, this is not the case in India despite the presence of global OEMsand EMS companies. Since the manufacturing of routers and switches is relatively more complex, these companies find it more
expedient to utilize the capacity of their manufacturing bases in China and East Asia and import into the Indian market. Also, since
the manufacturing of hardware has become increasingly commoditized, companies are beginning to divert the majority of their
investment towards R&D and innovation. Hence, there haven’t been any concrete plans of investment in the Indian manufacturing
ecosystem in this regard.
The lack of a component ecosystem has been the biggest pain factor inhibiting the growth of the domestic manufacturing market.
The table below captures the capability in India across the Router/Switches value chain.
Category ProductLocal
Supply
Local
Manufacturing
Local IP
Capability
Company
Names
Level of
Local Value
Add
Remarks
Components
and Sub
systems
Software
and OS Imports No No NA
The highly complex nature of Router/
Switches has restricted its development
to the global headquarters of OEM’s
and they are not keen to change this
equation anytime soon in future
Processor Imports No No NA
Memory Imports No No
Toshiba,
Samsung,
Micron, Hynix
NA
Electro-
mechanicals
Router/
Switches
OEM No No No
Cisco, Avaya,
HP, Juniper,
Huawei,
Pointred, etc.
NA
EMS No NA NA NA NAOEM’s might manufacture through EMS
companies in future
However, the abundantly available indigenous skilled manpower has seen establishment of captive R&D centres in the country by
global suppliers like Cisco, Huawei, NSN, etc., who employ thousands of engineers and post-graduates in different fields of R&D. For
instance, The Cisco ASR 901 Router developed by Cisco’s engineering team in India received numerous industry awards. However,
the IP of product was not registered in the country, a practise seen with all other players, since it is easier to file patents for products
in the same series in one location where the preceding patents were filed, which invariably is their global headquarters. The SWOT
chart here captures the analysis for Router/Switches market.
STRENGTHS
India’s edge in skill set competencies attracting globalcompanies to set up their captive R&D centres in thecountry
Domestic demand for enterprise routers is on the riseRise in cloud services adoption driving sales of routers inthe country
OPPORTUNITIES
To become a global manufacturing cum exports hubthrough existing EMS competencies already present
Companies beginning to divert investment towards
R&D—opportunity for Indian design ecosystem
Launch of 4G/LTE services to demand sophisticatedrouters
WEAKNESS
Marginal demand and non-availability of raw materials/components encourage imports
Underdeveloped electronics manufacturing ecosystemunable to support complex manufacturing process ofrouters
Limited indigenous IP generation
THREATS
Market proximity to South East Asian manufacturingecosystem constrains manufacturing potential
Multiple layers of bureaucracy and transaction delaysdiscourage business
Dependent on imports for two most important
components: processors and memory
SWOT
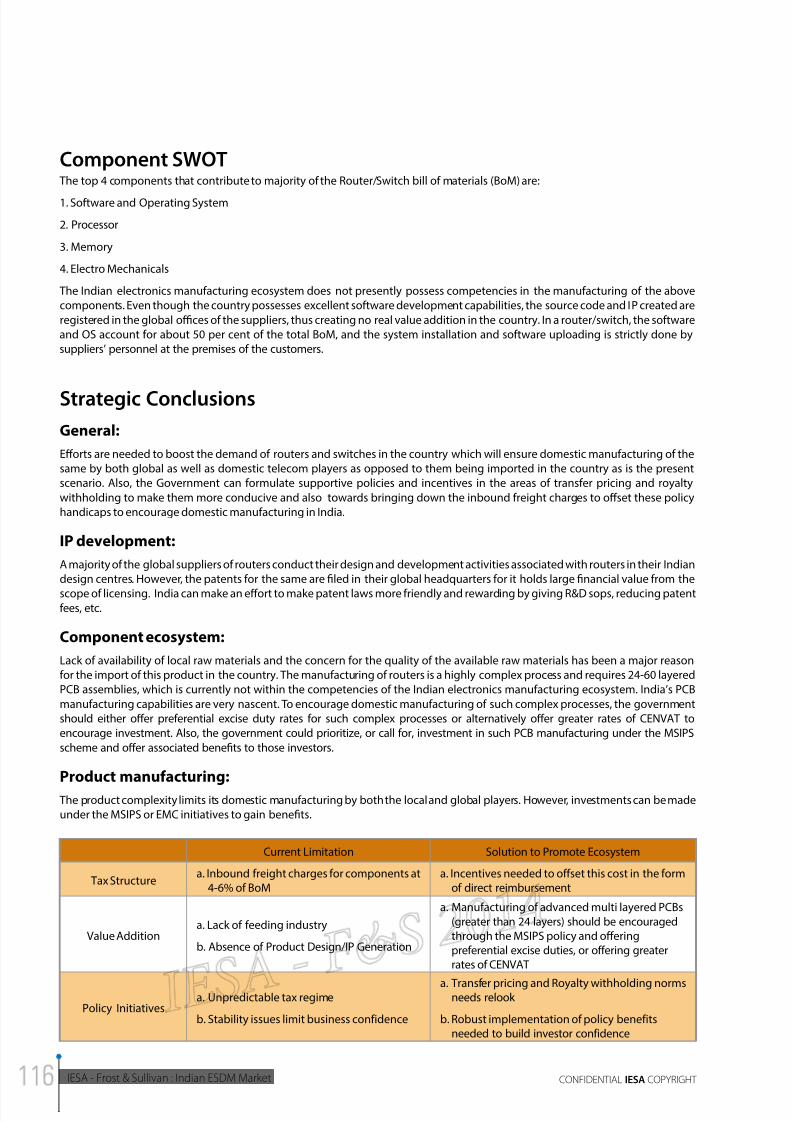
8/11/2019 IESA FS Report Indian ESDM Market
http://slidepdf.com/reader/full/iesa-fs-report-indian-esdm-market 116/172
IESA - Frost & Sullivan : Indian ESDM Market CONFIDENTIAL IESA COPYRIGHT
Component SWOT The top 4 components that contribute to majority of the Router/Switch bill of materials (BoM) are:
1. Software and Operating System
2. Processor
3. Memory
4. Electro Mechanicals
The Indian electronics manufacturing ecosystem does not presently possess competencies in the manufacturing of the above
components. Even though the country possesses excellent software development capabilities, the source code and IP created are
registered in the global oces of the suppliers, thus creating no real value addition in the country. In a router/switch, the software
and OS account for about 50 per cent of the total BoM, and the system installation and software uploading is strictly done by
suppliers’ personnel at the premises of the customers.
Strategic Conclusions
General:
Efforts are needed to boost the demand of routers and switches in the country which will ensure domestic manufacturing of the
same by both global as well as domestic telecom players as opposed to them being imported in the country as is the present
scenario. Also, the Government can formulate supportive policies and incentives in the areas of transfer pricing and royalty
withholding to make them more conducive and also towards bringing down the inbound freight charges to offset these policy
handicaps to encourage domestic manufacturing in India.
IP development:
A majority of the global suppliers of routers conduct their design and development activities associated with routers in their Indian
design centres. However, the patents for the same are filed in their global headquarters for it holds large financial value from the
scope of licensing. India can make an effort to make patent laws more friendly and rewarding by giving R&D sops, reducing patentfees, etc.
Component ecosystem:
Lack of availability of local raw materials and the concern for the quality of the available raw materials has been a major reason
for the import of this product in the country. The manufacturing of routers is a highly complex process and requires 24-60 layered
PCB assemblies, which is currently not within the competencies of the Indian electronics manufacturing ecosystem. India’s PCB
manufacturing capabilities are very nascent. To encourage domestic manufacturing of such complex processes, the government
should either offer preferential excise duty rates for such complex processes or alternatively offer greater rates of CENVAT to
encourage investment. Also, the government could prioritize, or call for, investment in such PCB manufacturing under the MSIPS
scheme and offer associated benefits to those investors.
Product manufacturing:
The product complexity limits its domestic manufacturing by both the local and global players. However, investments can be made
under the MSIPS or EMC initiatives to gain benefits.
Current Limitation Solution to Promote Ecosystem
Tax Structurea. Inbound freight charges for components at
4-6% of BoMa. Incentives needed to offset this cost in the form
of direct reimbursement
Value Additiona. Lack of feeding industry
b. Absence of Product Design/IP Generation
a. Manufacturing of advanced multi layered PCBs
(greater than 24 layers) should be encouragedthrough the MSIPS policy and offeringpreferential excise duties, or offering greaterrates of CENVAT
Policy Initiativesa. Unpredictable tax regime
b. Stability issues limit business confidence
a. Transfer pricing and Royalty withholding normsneeds relook
b. Robust implementation of policy benefitsneeded to build investor confidence
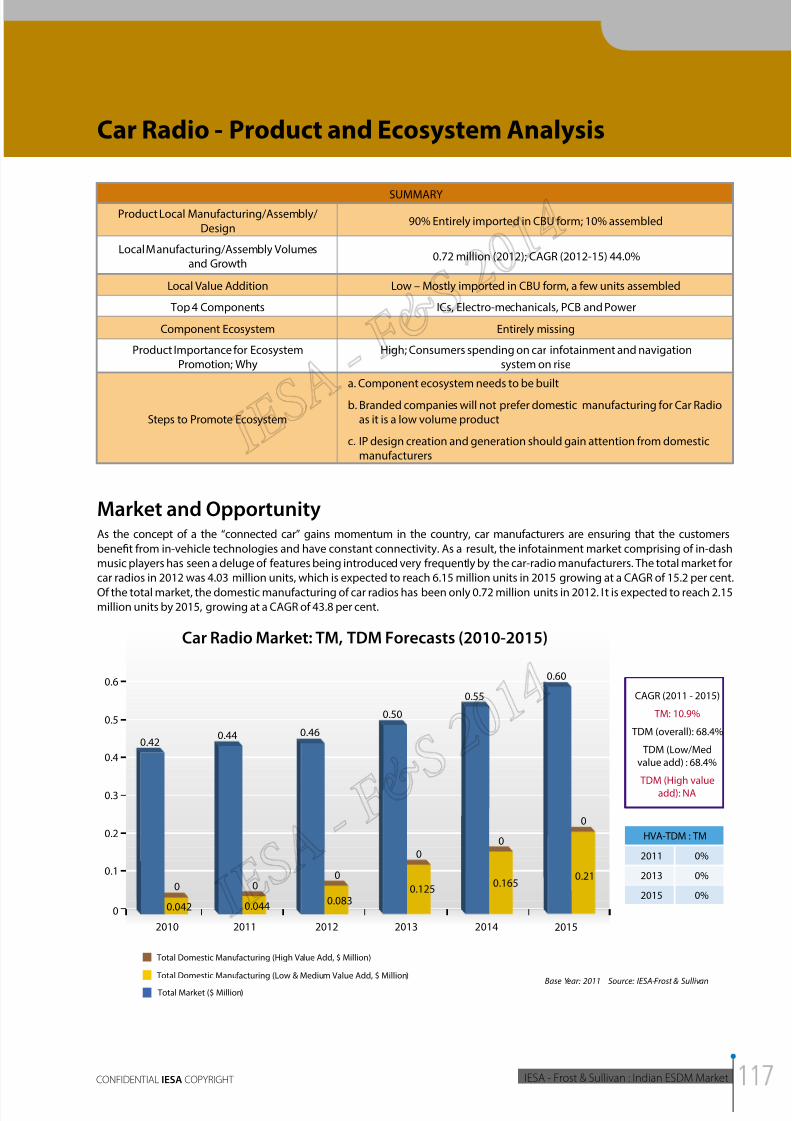
8/11/2019 IESA FS Report Indian ESDM Market
http://slidepdf.com/reader/full/iesa-fs-report-indian-esdm-market 117/172
2014INDIAN ESDM MARKET - ANALYSIS OF
OPPORTUNITY AND GROWTH PLAN
IESA - Frost & Sullivan : Indian ESDM MarketCONFIDENTIAL IESA COPYRIGHT
Car Radio - Product and Ecosystem Analysis
SUMMARYProduct Local Manufacturing/Assembly/
Design90% Entirely imported in CBU form; 10% assembled
Local Manufacturing/Assembly Volumesand Growth
0.72 million (2012); CAGR (2012-15) 44.0%
Local Value Addition Low – Mostly imported in CBU form, a few units assembled
Top 4 Components ICs, Electro-mechanicals, PCB and Power
Component Ecosystem Entirely missing
Product Importance for EcosystemPromotion; Why
High; Consumers spending on car infotainment and navigationsystem on rise
Steps to Promote Ecosystem
a. Component ecosystem needs to be built
b. Branded companies will not prefer domestic manufacturing for Car Radioas it is a low volume product
c. IP design creation and generation should gain attention from domesticmanufacturers
Market and OpportunityAs the concept of a the “connected car” gains momentum in the country, car manufacturers are ensuring that the customers
benefit from in-vehicle technologies and have constant connectivity. As a result, the infotainment market comprising of in-dash
music players has seen a deluge of features being introduced very frequently by the car-radio manufacturers. The total market for
car radios in 2012 was 4.03 million units, which is expected to reach 6.15 million units in 2015 growing at a CAGR of 15.2 per cent.
Of the total market, the domestic manufacturing of car radios has been only 0.72 million units in 2012. I t is expected to reach 2.15million units by 2015, growing at a CAGR of 43.8 per cent.
0
0.1
0.2
0.3
0.4
0.42
0.6
0.5
20112010 2012 2013 2014 2015
Car Radio Market: TM, TDM Forecasts (2010-2015)
HVA-TDM : TM
2011
2013
2015
0%
0%
0%
Total Market ($ Million)
Total Domestic Manufacturing (High Value Add, $ Million)
Total Domestic Manufacturing (Low & Medium Value Add, $ Million)Base Year: 2011 Source: IESA-Frost & Sullivan
CAGR (2011 - 2015)
TM: 10.9%
TDM (overall): 68.4%
TDM (Low/Med
value add) : 68.4%
TDM (High valueadd): NA
0
0.44
0
0.044
0.46
0.083
0
0.50
0.55
00
0.60
0.21
0
0.042
0.1250.165
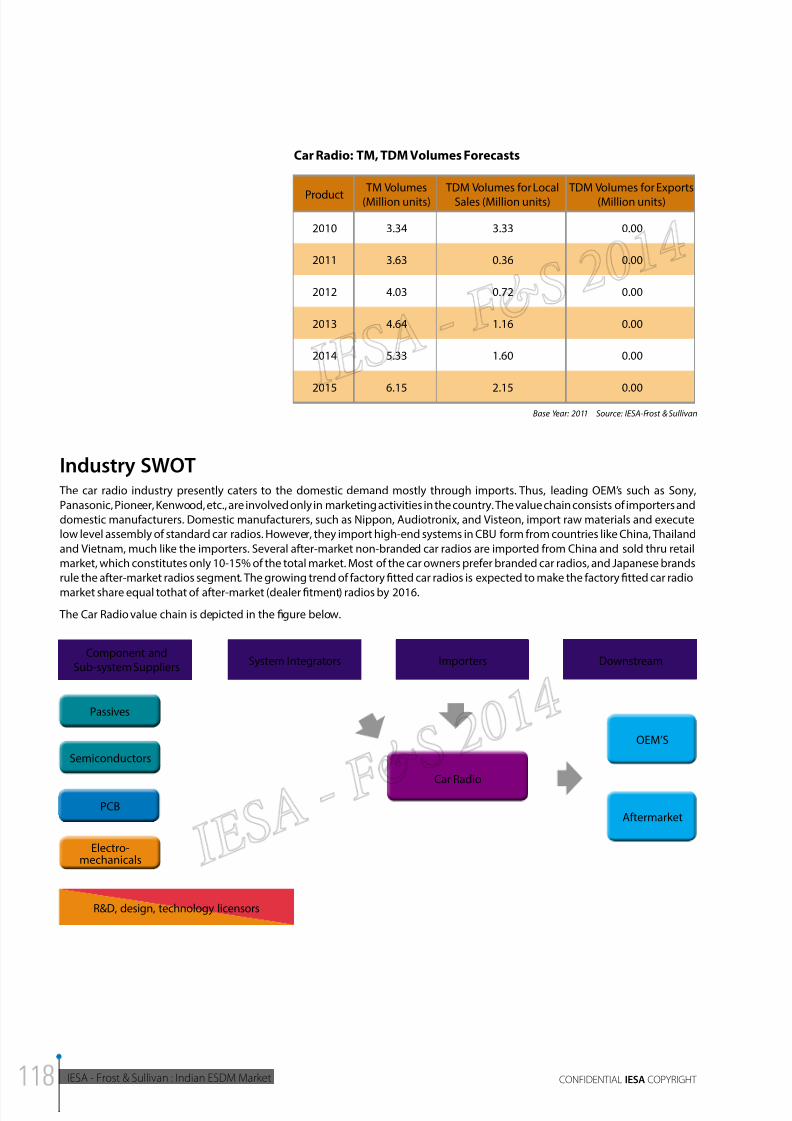
8/11/2019 IESA FS Report Indian ESDM Market
http://slidepdf.com/reader/full/iesa-fs-report-indian-esdm-market 118/172
IESA - Frost & Sullivan : Indian ESDM Market CONFIDENTIAL IESA COPYRIGHT
Car Radio: TM, TDM Volumes Forecasts
Product TM Volumes(Million units)
TDM Volumes for LocalSales (Million units)
TDM Volumes for Exports(Million units)
2010 3.34 3.33 0.00
2011 3.63 0.36 0.00
2012 4.03 0.72 0.00
2013 4.64 1.16 0.00
2014 5.33 1.60 0.00
2015 6.15 2.15 0.00
Base Year: 2011 Source: IESA-Frost & Sullivan
Industry SWOT The car radio industry presently caters to the domestic demand mostly through imports. Thus, leading OEM’s such as Sony,
Panasonic, Pioneer, Kenwood, etc., are involved only in marketing activities in the country. The value chain consists of importers and
domestic manufacturers. Domestic manufacturers, such as Nippon, Audiotronix, and Visteon, import raw materials and execute
low level assembly of standard car radios. However, they import high-end systems in CBU form from countries like China, Thailand
and Vietnam, much like the importers. Several after-market non-branded car radios are imported from China and sold thru retail
market, which constitutes only 10-15% of the total market. Most of the car owners prefer branded car radios, and Japanese brands
rule the after-market radios segment. The growing trend of factory fitted car radios is expected to make the factory fitted car radio
market share equal tothat of after-market (dealer fitment) radios by 2016.
The Car Radio value chain is depicted in the figure below.
Component andSub-system Suppliers
System Integrators Importers Downstream
PCB
Semiconductors
Passives
Electro-mechanicals
Car Radio
OEM’S
Aftermarket
R&D, design, technology licensors
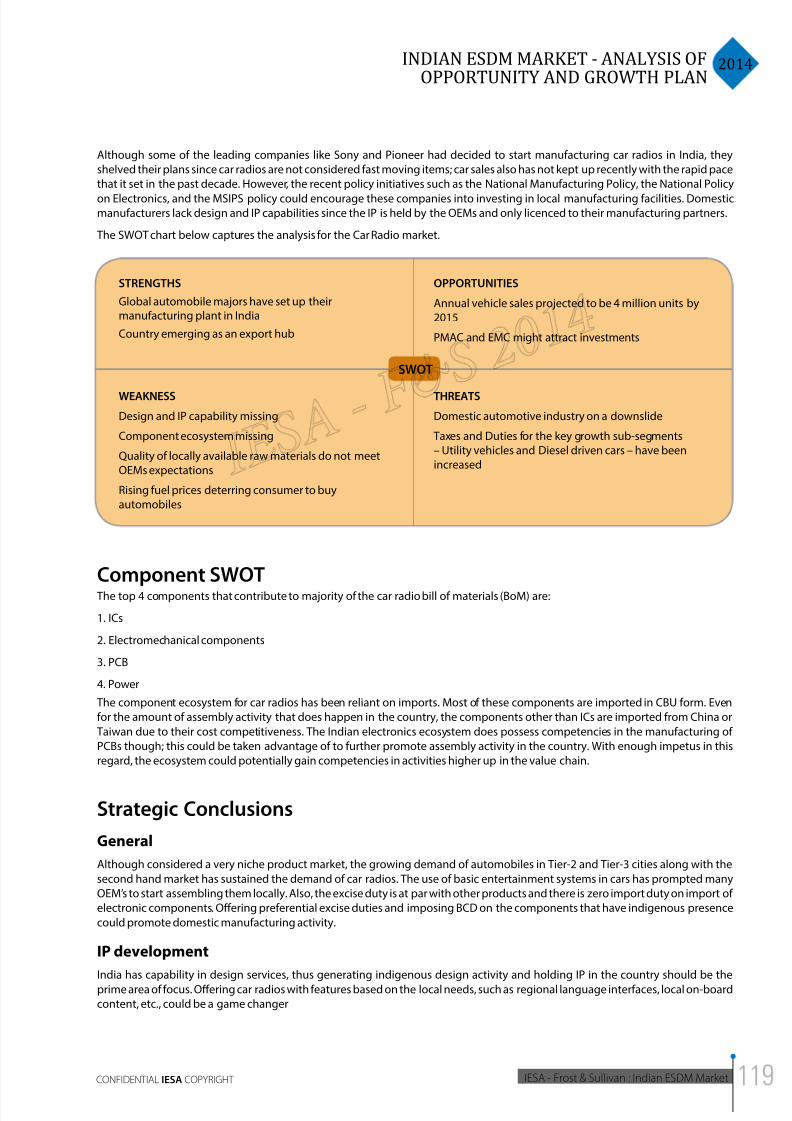
8/11/2019 IESA FS Report Indian ESDM Market
http://slidepdf.com/reader/full/iesa-fs-report-indian-esdm-market 119/172
2014INDIAN ESDM MARKET - ANALYSIS OF
OPPORTUNITY AND GROWTH PLAN
IESA - Frost & Sullivan : Indian ESDM MarketCONFIDENTIAL IESA COPYRIGHT
Although some of the leading companies like Sony and Pioneer had decided to start manufacturing car radios in India, they
shelved their plans since car radios are not considered fast moving items; car sales also has not kept up recently with the rapid pace
that it set in the past decade. However, the recent policy initiatives such as the National Manufacturing Policy, the National Policy
on Electronics, and the MSIPS policy could encourage these companies into investing in local manufacturing facilities. Domesticmanufacturers lack design and IP capabilities since the IP is held by the OEMs and only licenced to their manufacturing partners.
The SWOT chart below captures the analysis for the Car Radio market.
STRENGTHS
Global automobile majors have set up theirmanufacturing plant in India
Country emerging as an export hub
OPPORTUNITIES
Annual vehicle sales projected to be 4 million units by2015
PMAC and EMC might attract investments
WEAKNESS
Design and IP capability missing
Component ecosystem missing
Quality of locally available raw materials do not meetOEMs expectations
Rising fuel prices deterring consumer to buyautomobiles
THREATS
Domestic automotive industry on a downslide
Taxes and Duties for the key growth sub-segments– Utility vehicles and Diesel driven cars – have beenincreased
SWOT
Component SWOT The top 4 components that contribute to majority of the car radio bill of materials (BoM) are:
1. ICs
2. Electromechanical components
3. PCB
4. Power
The component ecosystem for car radios has been reliant on imports. Most of these components are imported in CBU form. Even
for the amount of assembly activity that does happen in the country, the components other than ICs are imported from China or
Taiwan due to their cost competitiveness. The Indian electronics ecosystem does possess competencies in the manufacturing of
PCBs though; this could be taken advantage of to further promote assembly activity in the country. With enough impetus in this
regard, the ecosystem could potentially gain competencies in activities higher up in the value chain.
Strategic Conclusions
General
Although considered a very niche product market, the growing demand of automobiles in Tier-2 and Tier-3 cities along with the
second hand market has sustained the demand of car radios. The use of basic entertainment systems in cars has prompted many
OEM’s to start assembling them locally. Also, the excise duty is at par with other products and there is zero import duty on import of
electronic components. Offering preferential excise duties and imposing BCD on the components that have indigenous presence
could promote domestic manufacturing activity.
IP development
India has capability in design services, thus generating indigenous design activity and holding IP in the country should be the
prime area of focus. Offering car radios with features based on the local needs, such as regional language interfaces, local on-board
content, etc., could be a game changer
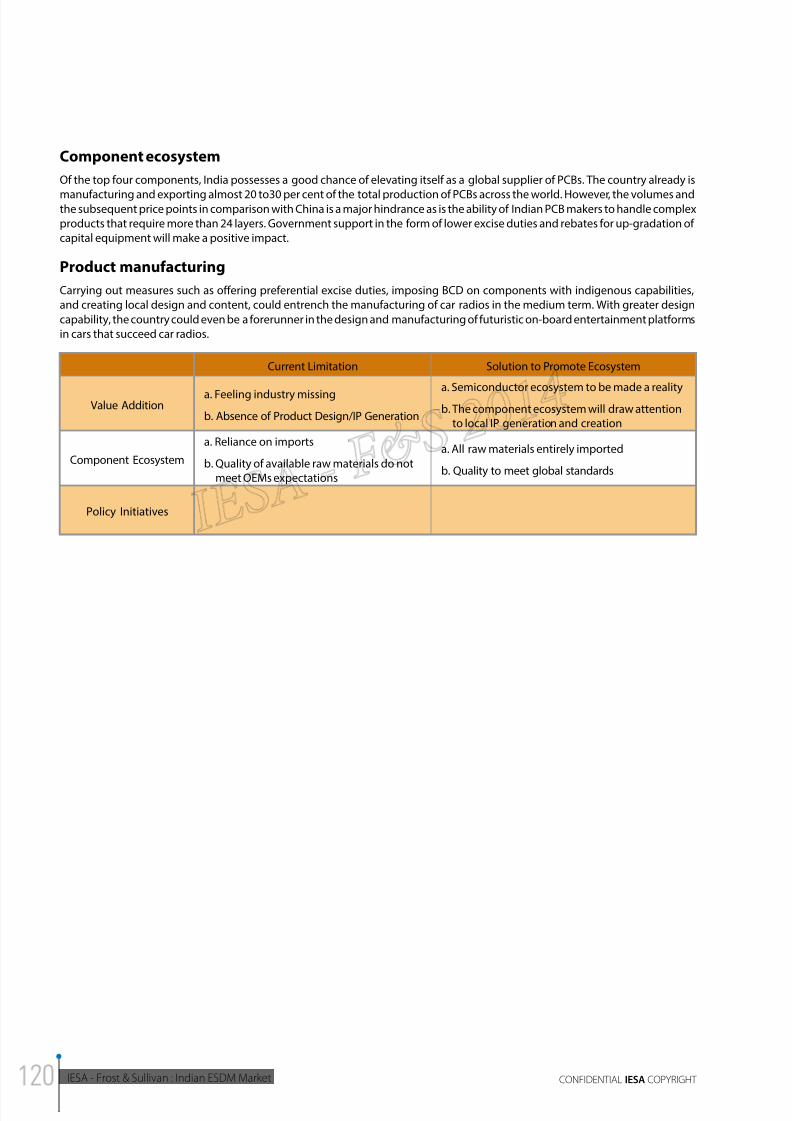
8/11/2019 IESA FS Report Indian ESDM Market
http://slidepdf.com/reader/full/iesa-fs-report-indian-esdm-market 120/172
IESA - Frost & Sullivan : Indian ESDM Market CONFIDENTIAL IESA COPYRIGHT
Component ecosystem
Of the top four components, India possesses a good chance of elevating itself as a global supplier of PCBs. The country already is
manufacturing and exporting almost 20 to30 per cent of the total production of PCBs across the world. However, the volumes andthe subsequent price points in comparison with China is a major hindrance as is the ability of Indian PCB makers to handle complex
products that require more than 24 layers. Government support in the form of lower excise duties and rebates for up-gradation of
capital equipment will make a positive impact.
Product manufacturing
Carrying out measures such as offering preferential excise duties, imposing BCD on components with indigenous capabilities,
and creating local design and content, could entrench the manufacturing of car radios in the medium term. With greater design
capability, the country could even be a forerunner in the design and manufacturing of futuristic on-board entertainment platforms
in cars that succeed car radios.
Current Limitation Solution to Promote Ecosystem
Value Additiona. Feeling industry missing
b. Absence of Product Design/IP Generation
a. Semiconductor ecosystem to be made a realityb. The component ecosystem will draw attention
to local IP generation and creation
Component Ecosystem
a. Reliance on imports
b. Quality of available raw materials do notmeet OEMs expectations
a. All raw materials entirely imported
b. Quality to meet global standards
Policy Initiatives
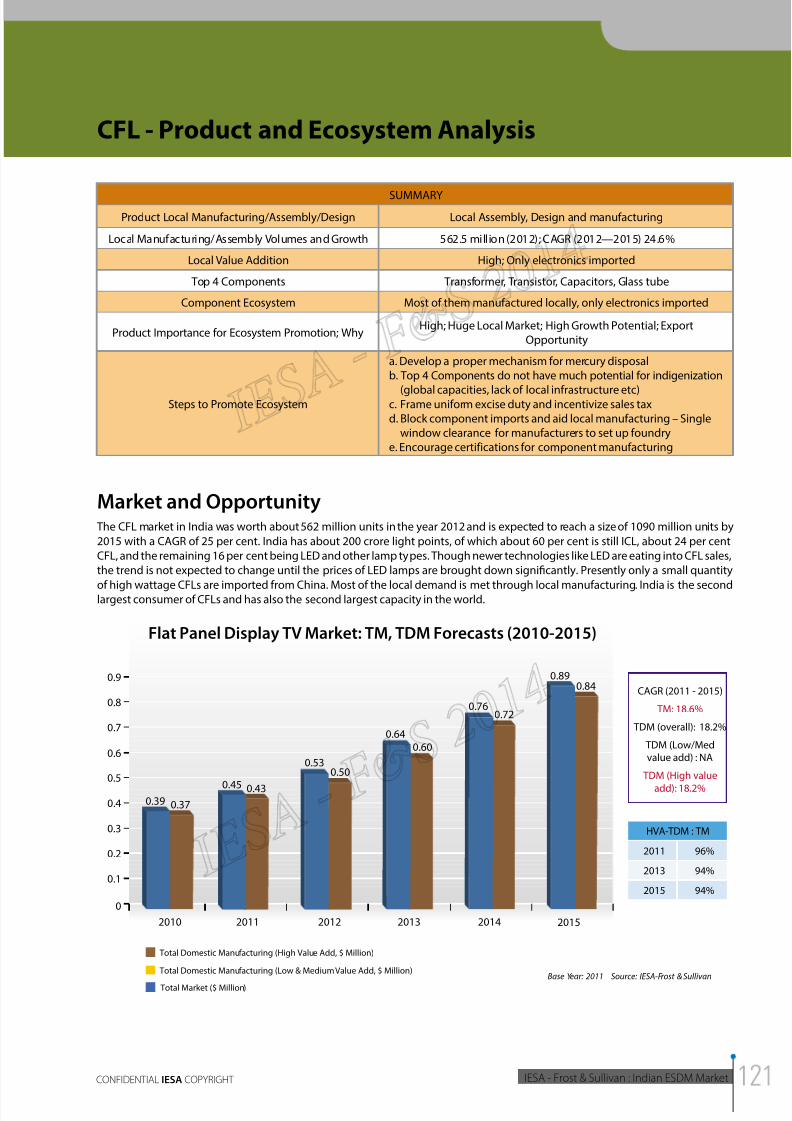
8/11/2019 IESA FS Report Indian ESDM Market
http://slidepdf.com/reader/full/iesa-fs-report-indian-esdm-market 121/172
2014INDIAN ESDM MARKET - ANALYSIS OF
OPPORTUNITY AND GROWTH PLAN
IESA - Frost & Sullivan : Indian ESDM MarketCONFIDENTIAL IESA COPYRIGHT
CFL - Product and Ecosystem Analysis
SUMMARY
Product Local Manufacturing/Assembly/Design Local Assembly, Design and manufacturing
Local Manufacturing/Assembly Volumes and Growth 562.5 million (2012); CAGR (2012—2015) 24.6%
Local Value Addition High; Only electronics imported
Top 4 Components Transformer, Transistor, Capacitors, Glass tube
Component Ecosystem Most of them manufactured locally, only electronics imported
Product Importance for Ecosystem Promotion; WhyHigh; Huge Local Market; High Growth Potential; Export
Opportunity
Steps to Promote Ecosystem
a. Develop a proper mechanism for mercury disposalb. Top 4 Components do not have much potential for indigenization
(global capacities, lack of local infrastructure etc)c. Frame uniform excise duty and incentivize sales taxd. Block component imports and aid local manufacturing – Single
window clearance for manufacturers to set up foundrye. Encourage certifications for component manufacturing
Market and Opportunity The CFL market in India was worth about 562 million units in the year 2012 and is expected to reach a size of 1090 million units by
2015 with a CAGR of 25 per cent. India has about 200 crore light points, of which about 60 per cent is still ICL, about 24 per cent
CFL, and the remaining 16 per cent being LED and other lamp types. Though newer technologies like LED are eating into CFL sales,
the trend is not expected to change until the prices of LED lamps are brought down significantly. Presently only a small quantity
of high wattage CFLs are imported from China. Most of the local demand is met through local manufacturing. India is the secondlargest consumer of CFLs and has also the second largest capacity in the world.
0.89
0
0.1
0.3
0.2
0.5
0.4
0.9
0.6
0.7
0.8
20112010 2012 2013 2014 2015
Flat Panel Display TV Market: TM, TDM Forecasts (2010-2015)
HVA-TDM : TM
2011
2013
2015
96%
94%
94%
Total Market ($ Million)
Total Domestic Manufacturing (High Value Add, $ Million)
Total Domestic Manufacturing (Low & Medium Value Add, $ Million)Base Year: 2011 Source: IESA-Frost & Sullivan
CAGR (2011 - 2015)
TM: 18.6%
TDM (overall): 18.2%
TDM (Low/Medvalue add) : NA
TDM (High value
add): 18.2%
0.84
0.76
0.640.60
0.53
0.450.39 0.37
0.43
0.50
0.72
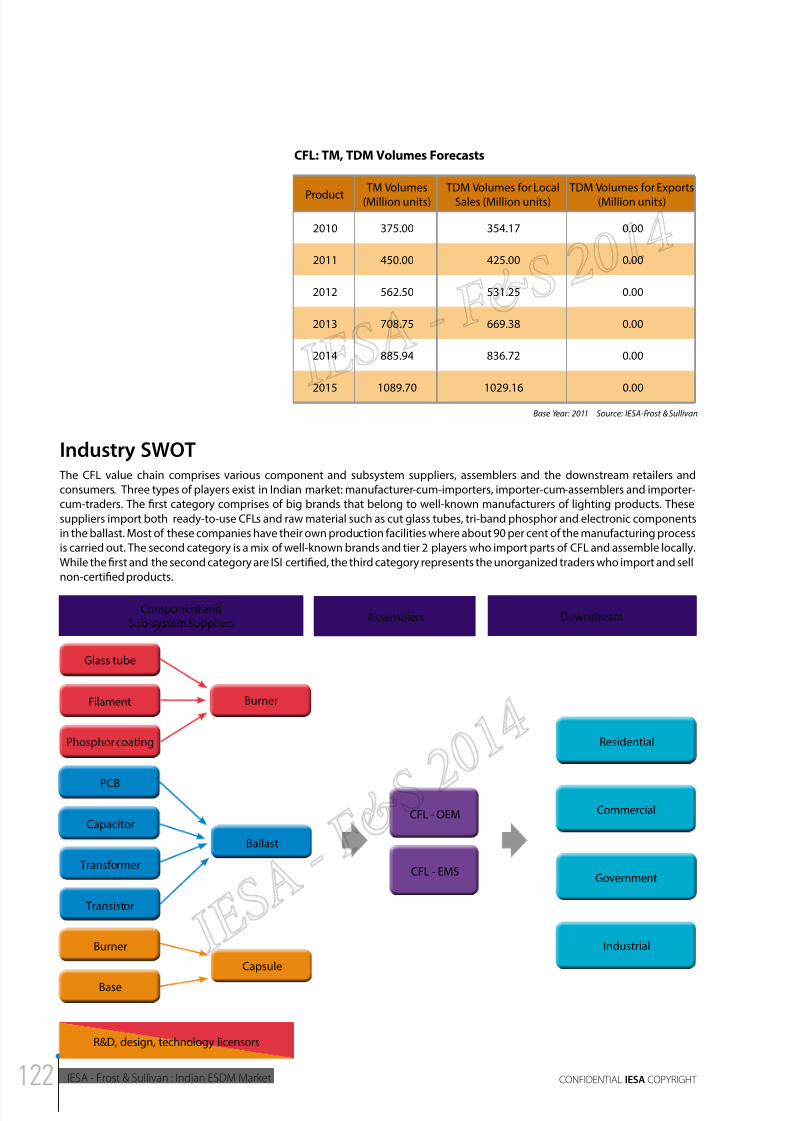
8/11/2019 IESA FS Report Indian ESDM Market
http://slidepdf.com/reader/full/iesa-fs-report-indian-esdm-market 122/172
IESA - Frost & Sullivan : Indian ESDM Market CONFIDENTIAL IESA COPYRIGHT
CFL: TM, TDM Volumes Forecasts
Product TM Volumes(Million units)
TDM Volumes for LocalSales (Million units)
TDM Volumes for Exports(Million units)
2010 375.00 354.17 0.00
2011 450.00 425.00 0.00
2012 562.50 531.25 0.00
2013 708.75 669.38 0.00
2014 885.94 836.72 0.00
2015 1089.70 1029.16 0.00
Base Year: 2011 Source: IESA-Frost & Sullivan
Industry SWOT The CFL value chain comprises various component and subsystem suppliers, assemblers and the downstream retailers and
consumers. Three types of players exist in Indian market: manufacturer-cum-importers, importer-cum-assemblers and importer-
cum-traders. The first category comprises of big brands that belong to well-known manufacturers of lighting products. These
suppliers import both ready-to-use CFLs and raw material such as cut glass tubes, tri-band phosphor and electronic components
in the ballast. Most of these companies have their own production facilities where about 90 per cent of the manufacturing process
is carried out. The second category is a mix of well-known brands and tier 2 players who import parts of CFL and assemble locally.
While the first and the second category are ISI certified, the third category represents the unorganized traders who import and sell
non-certified products.
Component andSub-system Suppliers
Glass tube
Filament Burner
Ballast
CFL - OEM
CFL - EMS
Commercial
Residential
Government
Industrial
Capsule
Phosphor coating
PCB
Capacitor
Transformer
Transistor
Burner
Base
Assemblers Downstream
R&D, design, technology licensors
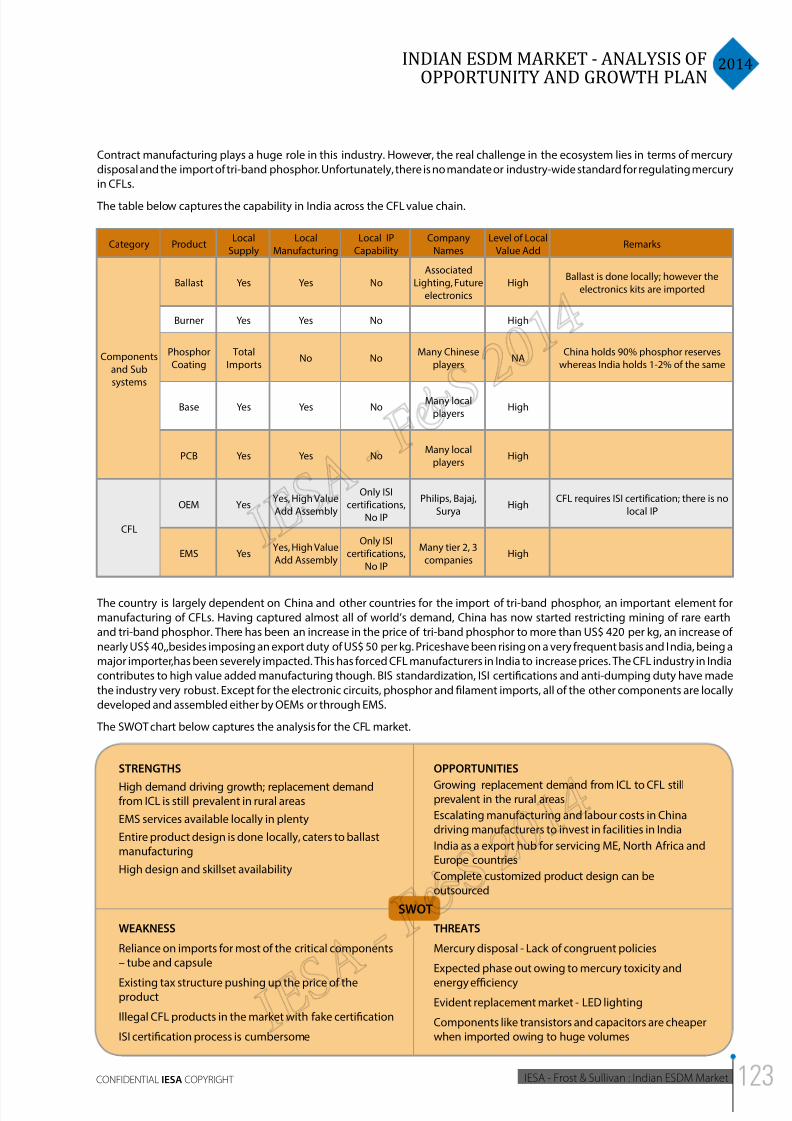
8/11/2019 IESA FS Report Indian ESDM Market
http://slidepdf.com/reader/full/iesa-fs-report-indian-esdm-market 123/172
2014INDIAN ESDM MARKET - ANALYSIS OF
OPPORTUNITY AND GROWTH PLAN
IESA - Frost & Sullivan : Indian ESDM MarketCONFIDENTIAL IESA COPYRIGHT
Contract manufacturing plays a huge role in this industry. However, the real challenge in the ecosystem lies in terms of mercury
disposal and the import of tri-band phosphor. Unfortunately, there is no mandate or industry-wide standard for regulating mercury
in CFLs.
The table below captures the capability in India across the CFL value chain.
Category ProductLocal
Supply
Local
Manufacturing
Local IP
Capability
Company
Names
Level of Local
Value AddRemarks
Components
and Sub
systems
Ballast Yes Yes No
Associated
Lighting, Future
electronics
HighBallast is done locally; however the
electronics kits are imported
Burner Yes Yes No High
Phosphor
Coating
Total
ImportsNo No
Many Chinese
playersNA
China holds 90% phosphor reserves
whereas India holds 1-2% of the same
Base Yes Yes NoMany local
playersHigh
PCB Yes Yes NoMany local
playersHigh
CFL
OEM YesYes, High Value
Add Assembly
Only ISI
certifications,
No IP
Philips, Bajaj,
SuryaHigh
CFL requires ISI certification; there is no
local IP
EMS YesYes, High Value
Add Assembly
Only ISI
certifications,
No IP
Many tier 2, 3
companiesHigh
The country is largely dependent on China and other countries for the import of tri-band phosphor, an important element for
manufacturing of CFLs. Having captured almost all of world’s demand, China has now started restricting mining of rare earth
and tri-band phosphor. There has been an increase in the price of tri-band phosphor to more than US$ 420 per kg, an increase of
nearly US$ 40,,besides imposing an export duty of US$ 50 per kg. Priceshave been rising on a very frequent basis and India, being a
major importer,has been severely impacted. This has forced CFL manufacturers in India to increase prices. The CFL industry in India
contributes to high value added manufacturing though. BIS standardization, ISI certifications and anti-dumping duty have made
the industry very robust. Except for the electronic circuits, phosphor and filament imports, all of the other components are locally
developed and assembled either by OEMs or through EMS.
The SWOT chart below captures the analysis for the CFL market.
STRENGTHS
High demand driving growth; replacement demandfrom ICL is still prevalent in rural areas
EMS services available locally in plenty
Entire product design is done locally, caters to ballastmanufacturing
High design and skillset availability
OPPORTUNITIES
Growing replacement demand from ICL to CFL stillprevalent in the rural areas
Escalating manufacturing and labour costs in Chinadriving manufacturers to invest in facilities in India
India as a export hub for servicing ME, North Africa andEurope countries
Complete customized product design can beoutsourced
WEAKNESS
Reliance on imports for most of the critical components– tube and capsule
Existing tax structure pushing up the price of theproduct
Illegal CFL products in the market with fake certification
ISI certification process is cumbersome
THREATS
Mercury disposal - Lack of congruent policies
Expected phase out owing to mercury toxicity and
energy eciency
Evident replacement market - LED lighting
Components like transistors and capacitors are cheaperwhen imported owing to huge volumes
SWOT
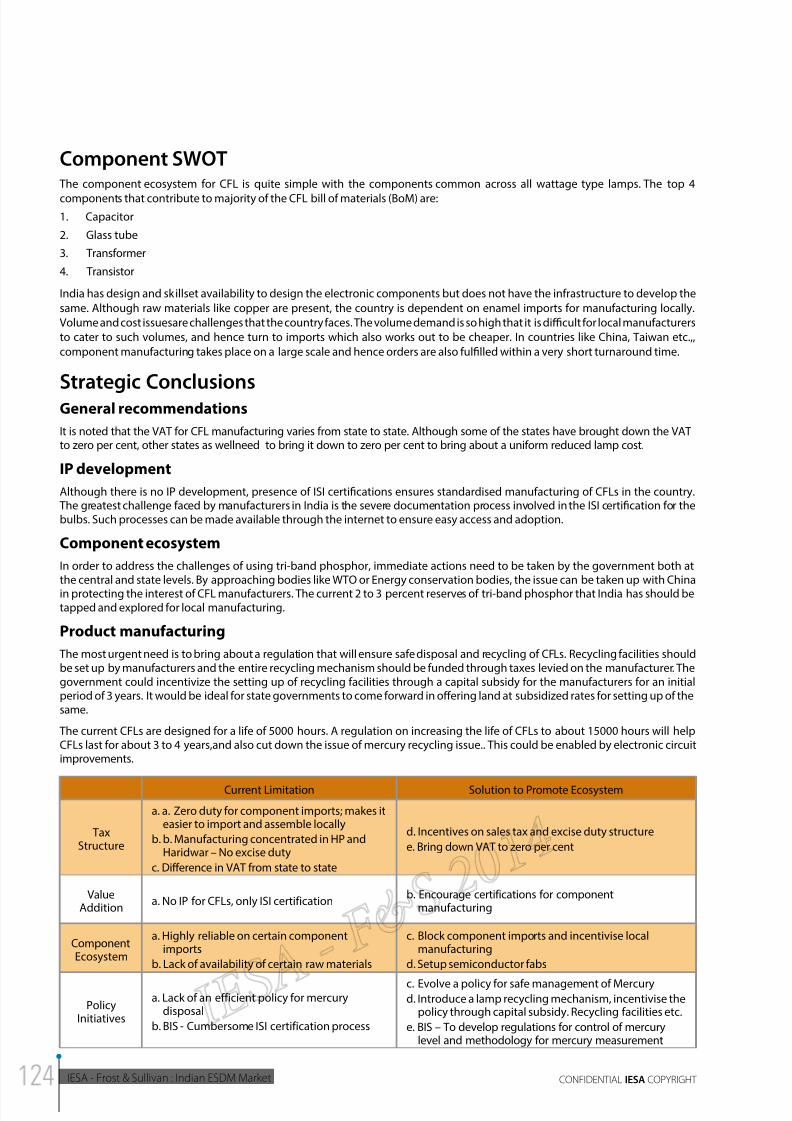
8/11/2019 IESA FS Report Indian ESDM Market
http://slidepdf.com/reader/full/iesa-fs-report-indian-esdm-market 124/172
IESA - Frost & Sullivan : Indian ESDM Market CONFIDENTIAL IESA COPYRIGHT
Component SWOT The component ecosystem for CFL is quite simple with the components common across all wattage type lamps. The top 4
components that contribute to majority of the CFL bill of materials (BoM) are:
1. Capacitor
2. Glass tube
3. Transformer
4. Transistor
India has design and skillset availability to design the electronic components but does not have the infrastructure to develop the
same. Although raw materials like copper are present, the country is dependent on enamel imports for manufacturing locally.
Volume and cost issuesare challenges that the country faces. The volume demand is so high that it is dicult for local manufacturers
to cater to such volumes, and hence turn to imports which also works out to be cheaper. In countries like China, Taiwan etc.,,
component manufacturing takes place on a large scale and hence orders are also fulfilled within a very short turnaround time.
Strategic ConclusionsGeneral recommendations
It is noted that the VAT for CFL manufacturing varies from state to state. Although some of the states have brought down the VATto zero per cent, other states as wellneed to bring it down to zero per cent to bring about a uniform reduced lamp cost.
IP development
Although there is no IP development, presence of ISI certifications ensures standardised manufacturing of CFLs in the country. The greatest challenge faced by manufacturers in India is the severe documentation process involved in the ISI certification for thebulbs. Such processes can be made available through the internet to ensure easy access and adoption.
Component ecosystem
In order to address the challenges of using tri-band phosphor, immediate actions need to be taken by the government both atthe central and state levels. By approaching bodies like WTO or Energy conservation bodies, the issue can be taken up with China
in protecting the interest of CFL manufacturers. The current 2 to 3 percent reserves of tri-band phosphor that India has should betapped and explored for local manufacturing.
Product manufacturing
The most urgent need is to bring about a regulation that will ensure safe disposal and recycling of CFLs. Recycling facilities shouldbe set up by manufacturers and the entire recycling mechanism should be funded through taxes levied on the manufacturer. Thegovernment could incentivize the setting up of recycling facilities through a capital subsidy for the manufacturers for an initialperiod of 3 years. It would be ideal for state governments to come forward in offering land at subsidized rates for setting up of thesame.
The current CFLs are designed for a life of 5000 hours. A regulation on increasing the life of CFLs to about 15000 hours will helpCFLs last for about 3 to 4 years,and also cut down the issue of mercury recycling issue.. This could be enabled by electronic circuitimprovements.
Current Limitation Solution to Promote Ecosystem
TaxStructure
a. a. Zero duty for component imports; makes iteasier to import and assemble locally
b. b. Manufacturing concentrated in HP andHaridwar – No excise duty
c. Difference in VAT from state to state
d. Incentives on sales tax and excise duty structure
e. Bring down VAT to zero per cent
ValueAddition
a. No IP for CFLs, only ISI certificationb. Encourage certifications for component
manufacturing
ComponentEcosystem
a. Highly reliable on certain componentimports
b. Lack of availability of certain raw materials
c. Block component imports and incentivise localmanufacturing
d. Setup semiconductor fabs
PolicyInitiatives
a. Lack of an efficient policy for mercurydisposal
b. BIS - Cumbersome ISI certification process
c. Evolve a policy for safe management of Mercuryd. Introduce a lamp recycling mechanism, incentivise the
policy through capital subsidy. Recycling facilities etc.
e. BIS – To develop regulations for control of mercurylevel and methodology for mercury measurement
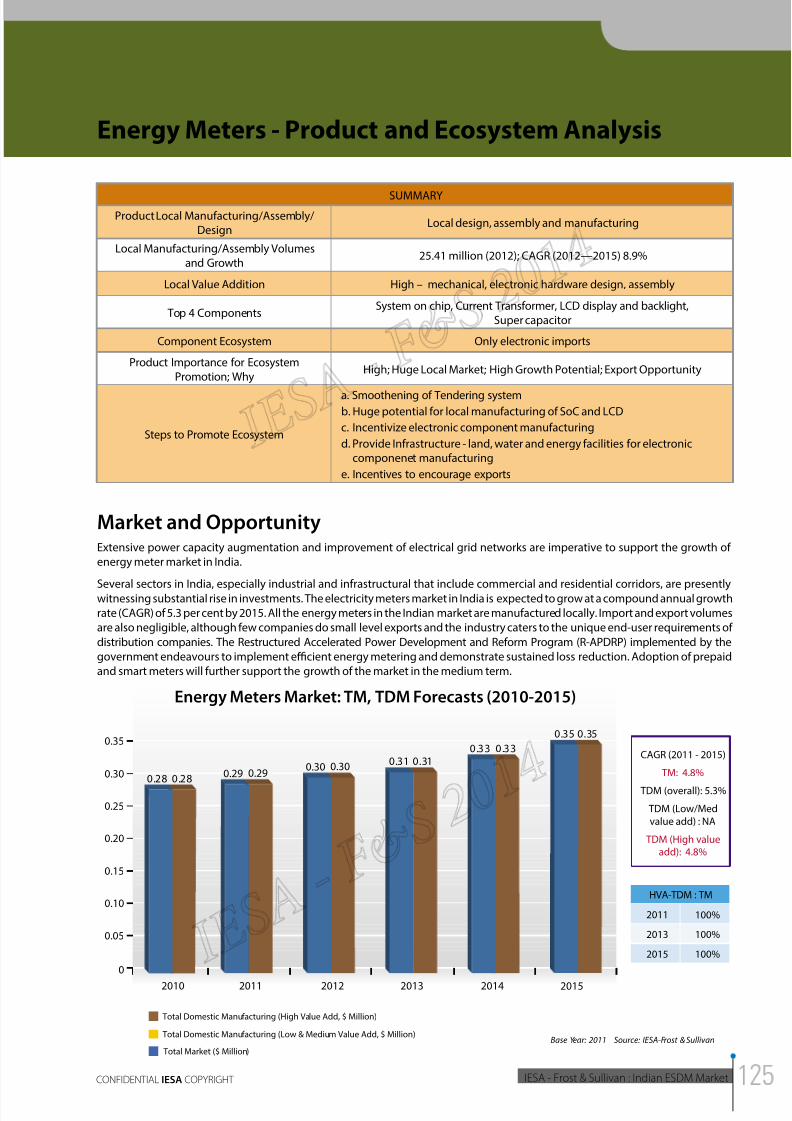
8/11/2019 IESA FS Report Indian ESDM Market
http://slidepdf.com/reader/full/iesa-fs-report-indian-esdm-market 125/172
2014INDIAN ESDM MARKET - ANALYSIS OF
OPPORTUNITY AND GROWTH PLAN
IESA - Frost & Sullivan : Indian ESDM MarketCONFIDENTIAL IESA COPYRIGHT
Energy Meters - Product and Ecosystem Analysis
SUMMARY
Product Local Manufacturing/Assembly/Design
Local design, assembly and manufacturing
Local Manufacturing/Assembly Volumesand Growth
25.41 million (2012); CAGR (2012—2015) 8.9%
Local Value Addition High – mechanical, electronic hardware design, assembly
Top 4 ComponentsSystem on chip, Current Transformer, LCD display and backlight,
Super capacitor
Component Ecosystem Only electronic imports
Product Importance for EcosystemPromotion; Why
High; Huge Local Market; High Growth Potential; Export Opportunity
Steps to Promote Ecosystem
a. Smoothening of Tendering systemb. Huge potential for local manufacturing of SoC and LCD
c. Incentivize electronic component manufacturing
d. Provide Infrastructure - land, water and energy facilities for electroniccomponenet manufacturing
e. Incentives to encourage exports
Market and OpportunityExtensive power capacity augmentation and improvement of electrical grid networks are imperative to support the growth of
energy meter market in India.
Several sectors in India, especially industrial and infrastructural that include commercial and residential corridors, are presentlywitnessing substantial rise in investments. The electricity meters market in India is expected to grow at a compound annual growth
rate (CAGR) of 5.3 per cent by 2015. All the energy meters in the Indian market are manufactured locally. Import and export volumes
are also negligible, although few companies do small level exports and the industry caters to the unique end-user requirements of
distribution companies. The Restructured Accelerated Power Development and Reform Program (R-APDRP) implemented by the
government endeavours to implement ecient energy metering and demonstrate sustained loss reduction. Adoption of prepaid
and smart meters will further support the growth of the market in the medium term.
0.35 0.35
0
0.05
0.15
0.10
0.25
0.20
0.35
0.30
20112010 2012 2013 2014 2015
Energy Meters Market: TM, TDM Forecasts (2010-2015)
HVA-TDM : TM
2011
2013
2015
100%
100%
100%
Total Market ($ Million)
Total Domestic Manufacturing (High Value Add, $ Million)
Total Domestic Manufacturing (Low & Medium Value Add, $ Million)Base Year: 2011 Source: IESA-Frost & Sullivan
CAGR (2011 - 2015)
TM: 4.8%
TDM (overall): 5.3%
TDM (Low/Med
value add) : NA
TDM (High valueadd): 4.8%
0.33 0.330.31 0.31
0.29 0.290.28 0.28
0.300.30
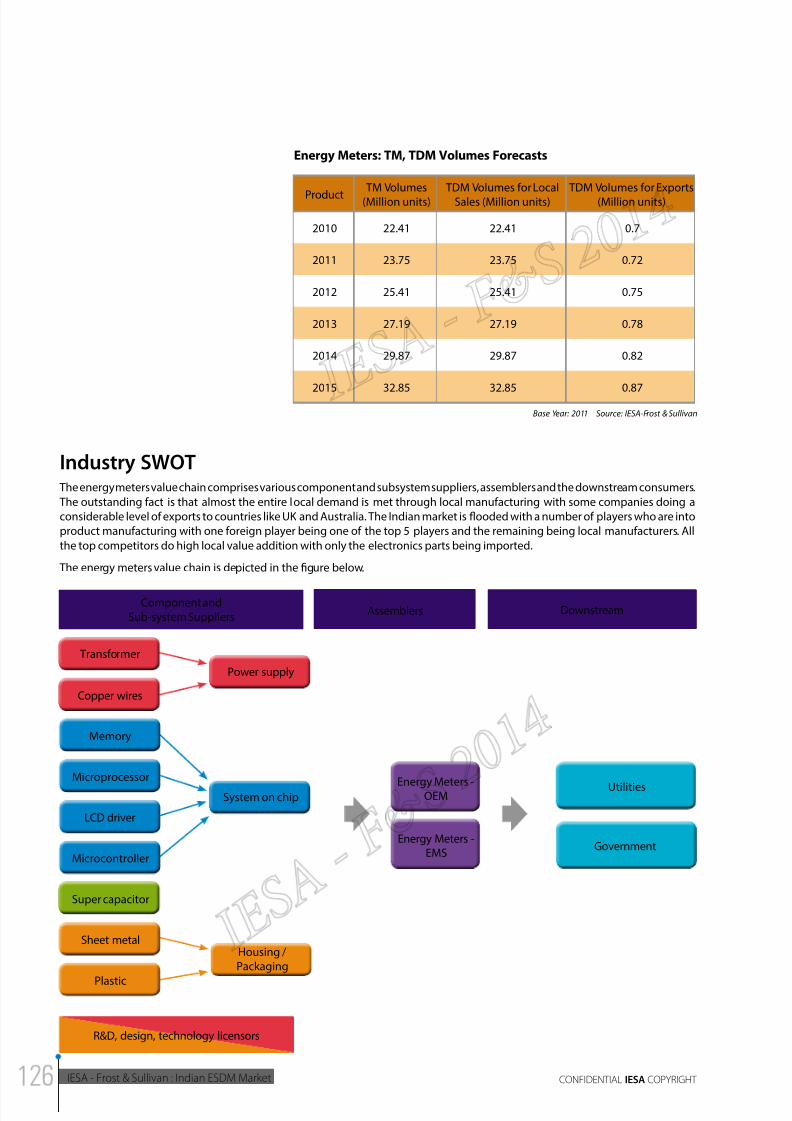
8/11/2019 IESA FS Report Indian ESDM Market
http://slidepdf.com/reader/full/iesa-fs-report-indian-esdm-market 126/172
IESA - Frost & Sullivan : Indian ESDM Market CONFIDENTIAL IESA COPYRIGHT
Energy Meters: TM, TDM Volumes Forecasts
Product TM Volumes(Million units)
TDM Volumes for LocalSales (Million units)
TDM Volumes for Exports(Million units)
2010 22.41 22.41 0.7
2011 23.75 23.75 0.72
2012 25.41 25.41 0.75
2013 27.19 27.19 0.78
2014 29.87 29.87 0.82
2015 32.85 32.85 0.87
Base Year: 2011 Source: IESA-Frost & Sullivan
Industry SWOT The energy meters value chain comprises various component and subsystem suppliers, assemblers and the downstream consumers.
The outstanding fact is that almost the entire local demand is met through local manufacturing with some companies doing a
considerable level of exports to countries like UK and Australia. The Indian market is flooded with a number of players who are into
product manufacturing with one foreign player being one of the top 5 players and the remaining being local manufacturers. All
the top competitors do high local value addition with only the electronics parts being imported.
The energy meters value chain is depicted in the figure below.
Component andSub-system Suppliers
Transformer
Copper wires
Power supply
System on chipEnergy Meters -OEM
Energy Meters -EMS
Utilities
Government
Housing /Packaging
Memory
Microcontroller
LCD driver
Microprocessor
Super capacitor
Sheet metal
Plastic
Assemblers Downstream
R&D, design, technology licensors
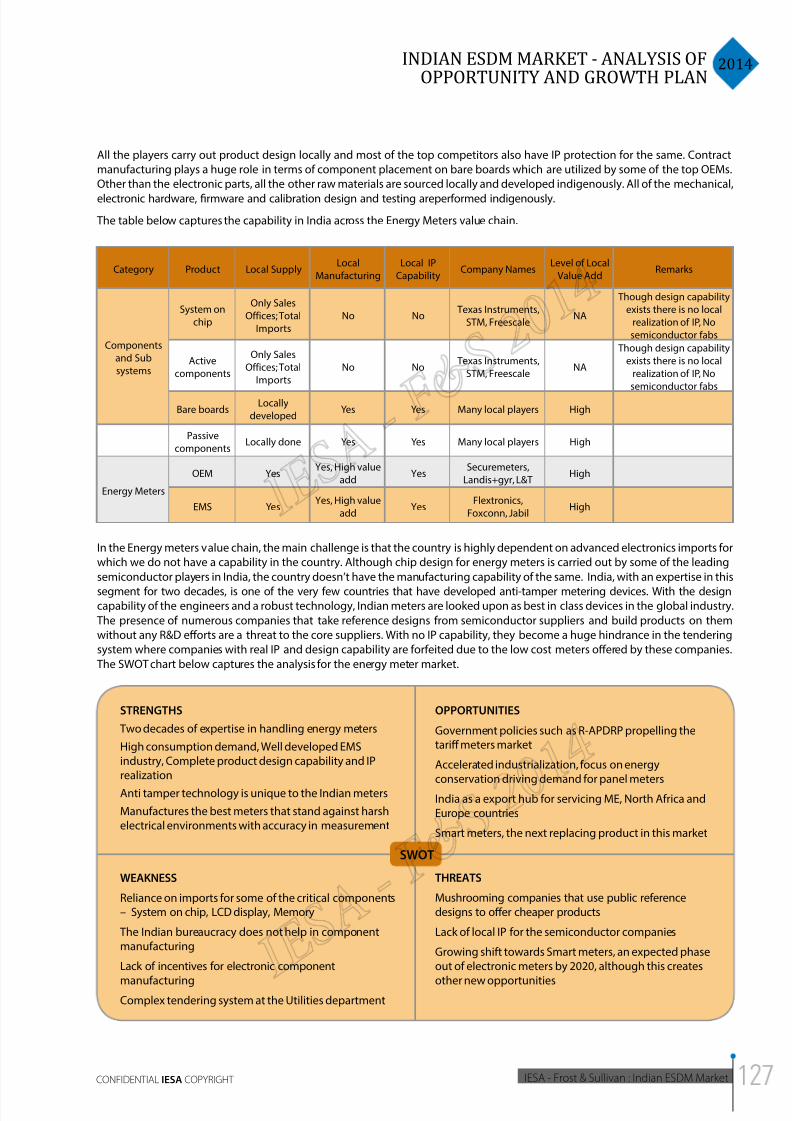
8/11/2019 IESA FS Report Indian ESDM Market
http://slidepdf.com/reader/full/iesa-fs-report-indian-esdm-market 127/172
2014INDIAN ESDM MARKET - ANALYSIS OF
OPPORTUNITY AND GROWTH PLAN
IESA - Frost & Sullivan : Indian ESDM MarketCONFIDENTIAL IESA COPYRIGHT
All the players carry out product design locally and most of the top competitors also have IP protection for the same. Contract
manufacturing plays a huge role in terms of component placement on bare boards which are utilized by some of the top OEMs.
Other than the electronic parts, all the other raw materials are sourced locally and developed indigenously. All of the mechanical,
electronic hardware, firmware and calibration design and testing areperformed indigenously.
The table below captures the capability in India across the Energy Meters value chain.
Category Product Local SupplyLocal
Manufacturing
Local IP
CapabilityCompany Names
Level of Local
Value AddRemarks
Components
and Sub
systems
System on
chip
Only Sales
Offices; Total
Imports
No No Texas Instruments,
STM, FreescaleNA
Though design capability
exists there is no local
realization of IP, No
semiconductor fabs
Active
components
Only Sales
Offices; Total
Imports
No No Texas Instruments,
STM, FreescaleNA
Though design capability
exists there is no local
realization of IP, No
semiconductor fabs
Bare boardsLocally
developedYes Yes Many local players High
Passive
componentsLocally done Yes Yes Many local players High
Energy Meters
OEM YesYes, High value
addYes
Securemeters,
Landis+gyr, L&THigh
EMS YesYes, High value
addYes
Flextronics,
Foxconn, JabilHigh
In the Energy meters value chain, the main challenge is that the country is highly dependent on advanced electronics imports for
which we do not have a capability in the country. Although chip design for energy meters is carried out by some of the leading
semiconductor players in India, the country doesn’t have the manufacturing capability of the same. India, with an expertise in this
segment for two decades, is one of the very few countries that have developed anti-tamper metering devices. With the designcapability of the engineers and a robust technology, Indian meters are looked upon as best in class devices in the global industry.
The presence of numerous companies that take reference designs from semiconductor suppliers and build products on them
without any R&D efforts are a threat to the core suppliers. With no IP capability, they become a huge hindrance in the tendering
system where companies with real IP and design capability are forfeited due to the low cost meters offered by these companies.
The SWOT chart below captures the analysis for the energy meter market.
STRENGTHS
Two decades of expertise in handling energy meters
High consumption demand, Well developed EMSindustry, Complete product design capability and IPrealization
Anti tamper technology is unique to the Indian meters
Manufactures the best meters that stand against harshelectrical environments with accuracy in measurement
OPPORTUNITIES
Government policies such as R-APDRP propelling thetariff meters market
Accelerated industrialization, focus on energyconservation driving demand for panel meters
India as a export hub for servicing ME, North Africa andEurope countries
Smart meters, the next replacing product in this market
WEAKNESS
Reliance on imports for some of the critical components– System on chip, LCD display, Memory
The Indian bureaucracy does not help in componentmanufacturing
Lack of incentives for electronic component
manufacturingComplex tendering system at the Utilities department
THREATS
Mushrooming companies that use public referencedesigns to offer cheaper products
Lack of local IP for the semiconductor companies
Growing shift towards Smart meters, an expected phaseout of electronic meters by 2020, although this creates
other new opportunities
SWOT
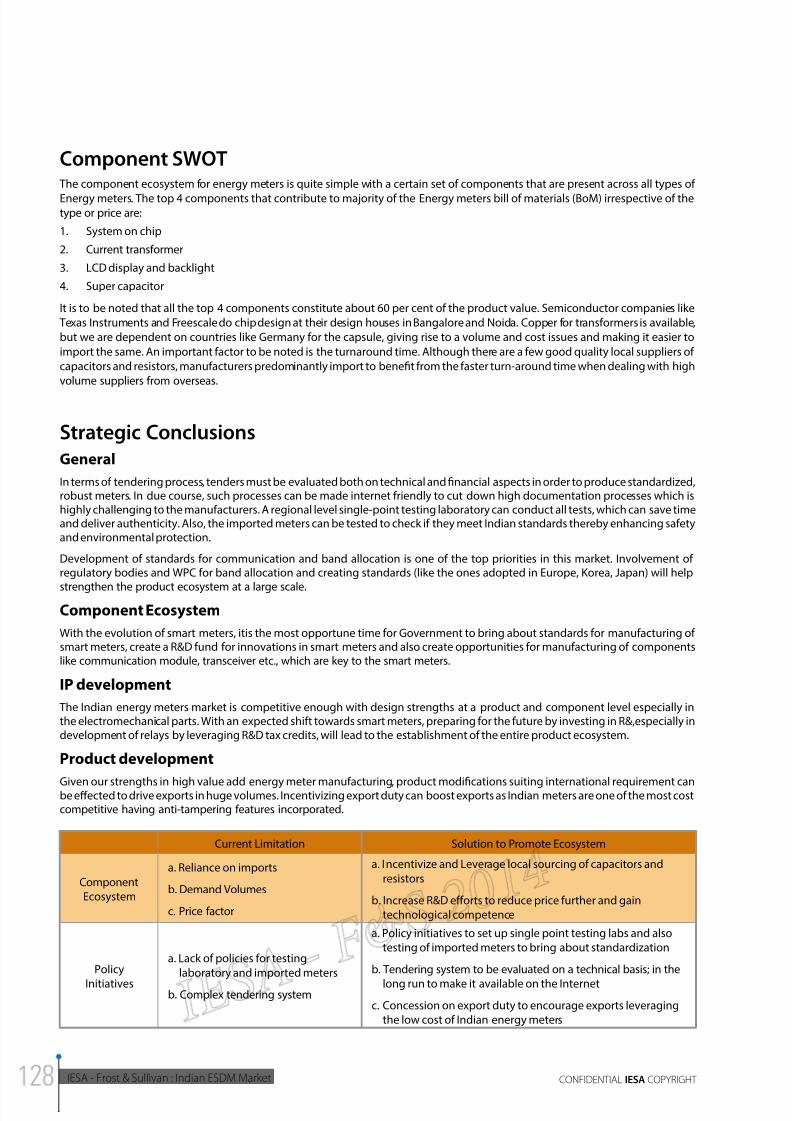
8/11/2019 IESA FS Report Indian ESDM Market
http://slidepdf.com/reader/full/iesa-fs-report-indian-esdm-market 128/172
IESA - Frost & Sullivan : Indian ESDM Market CONFIDENTIAL IESA COPYRIGHT
Component SWOT The component ecosystem for energy meters is quite simple with a certain set of components that are present across all types of
Energy meters. The top 4 components that contribute to majority of the Energy meters bill of materials (BoM) irrespective of thetype or price are:
1. System on chip
2. Current transformer
3. LCD display and backlight
4. Super capacitor
It is to be noted that all the top 4 components constitute about 60 per cent of the product value. Semiconductor companies like
Texas Instruments and Freescale do chip design at their design houses in Bangalore and Noida. Copper for transformers is available,
but we are dependent on countries like Germany for the capsule, giving rise to a volume and cost issues and making it easier to
import the same. An important factor to be noted is the turnaround time. Although there are a few good quality local suppliers of
capacitors and resistors, manufacturers predominantly import to benefit from the faster turn-around time when dealing with high
volume suppliers from overseas.
Strategic Conclusions
General
In terms of tendering process, tenders must be evaluated both on technical and financial aspects in order to produce standardized,robust meters. In due course, such processes can be made internet friendly to cut down high documentation processes which ishighly challenging to the manufacturers. A regional level single-point testing laboratory can conduct all tests, which can save timeand deliver authenticity. Also, the imported meters can be tested to check if they meet Indian standards thereby enhancing safetyand environmental protection.
Development of standards for communication and band allocation is one of the top priorities in this market. Involvement ofregulatory bodies and WPC for band allocation and creating standards (like the ones adopted in Europe, Korea, Japan) will help
strengthen the product ecosystem at a large scale.
Component Ecosystem
With the evolution of smart meters, itis the most opportune time for Government to bring about standards for manufacturing ofsmart meters, create a R&D fund for innovations in smart meters and also create opportunities for manufacturing of componentslike communication module, transceiver etc., which are key to the smart meters.
IP development
The Indian energy meters market is competitive enough with design strengths at a product and component level especially inthe electromechanical parts. With an expected shift towards smart meters, preparing for the future by investing in R&,especially indevelopment of relays by leveraging R&D tax credits, will lead to the establishment of the entire product ecosystem.
Product development
Given our strengths in high value add energy meter manufacturing, product modifications suiting international requirement canbe effected to drive exports in huge volumes. Incentivizing export duty can boost exports as Indian meters are one of the most costcompetitive having anti-tampering features incorporated.
Current Limitation Solution to Promote Ecosystem
ComponentEcosystem
a. Reliance on imports
b. Demand Volumes
c. Price factor
a. Incentivize and Leverage local sourcing of capacitors and
resistors
b. Increase R&D efforts to reduce price further and gaintechnological competence
Policy
Initiatives
a. Lack of policies for testing
laboratory and imported meters
b. Complex tendering system
a. Policy initiatives to set up single point testing labs and alsotesting of imported meters to bring about standardization
b. Tendering system to be evaluated on a technical basis; in the
long run to make it available on the Internet
c. Concession on export duty to encourage exports leveragingthe low cost of Indian energy meters
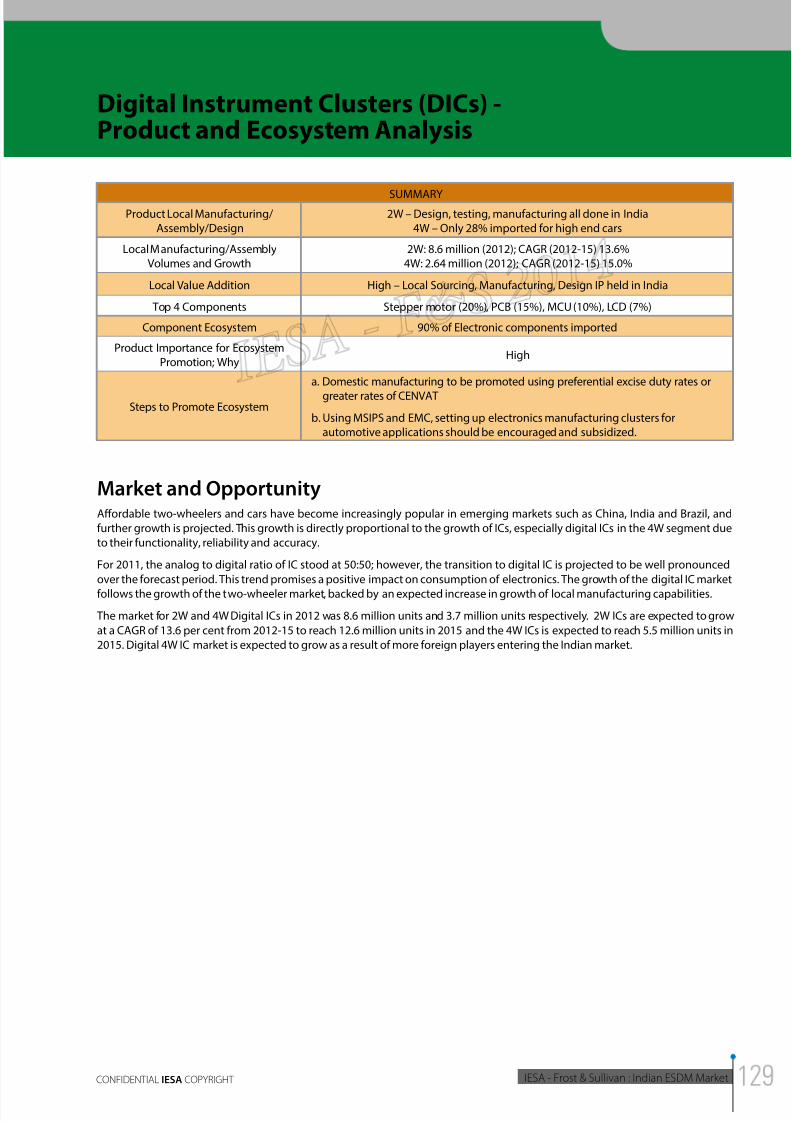
8/11/2019 IESA FS Report Indian ESDM Market
http://slidepdf.com/reader/full/iesa-fs-report-indian-esdm-market 129/172
2014INDIAN ESDM MARKET - ANALYSIS OF
OPPORTUNITY AND GROWTH PLAN
IESA - Frost & Sullivan : Indian ESDM MarketCONFIDENTIAL IESA COPYRIGHT
Digital Instrument Clusters (DICs) -Product and Ecosystem Analysis
SUMMARYProduct Local Manufacturing/
Assembly/Design2W – Design, testing, manufacturing all done in India
4W – Only 28% imported for high end cars
Local Manufacturing/AssemblyVolumes and Growth
2W: 8.6 million (2012); CAGR (2012-15) 13.6%4W: 2.64 million (2012); CAGR (2012-15) 15.0%
Local Value Addition High – Local Sourcing, Manufacturing, Design IP held in India
Top 4 Components Stepper motor (20%), PCB (15%), MCU (10%), LCD (7%)
Component Ecosystem 90% of Electronic components imported
Product Importance for EcosystemPromotion; Why
High
Steps to Promote Ecosystem
a. Domestic manufacturing to be promoted using preferential excise duty rates or
greater rates of CENVAT
b. Using MSIPS and EMC, setting up electronics manufacturing clusters forautomotive applications should be encouraged and subsidized.
Market and OpportunityAffordable two-wheelers and cars have become increasingly popular in emerging markets such as China, India and Brazil, and
further growth is projected. This growth is directly proportional to the growth of ICs, especially digital ICs in the 4W segment due
to their functionality, reliability and accuracy.
For 2011, the analog to digital ratio of IC stood at 50:50; however, the transition to digital IC is projected to be well pronounced
over the forecast period. This trend promises a positive impact on consumption of electronics. The growth of the digital IC market
follows the growth of the two-wheeler market, backed by an expected increase in growth of local manufacturing capabilities.
The market for 2W and 4W Digital ICs in 2012 was 8.6 million units and 3.7 million units respectively. 2W ICs are expected to grow
at a CAGR of 13.6 per cent from 2012-15 to reach 12.6 million units in 2015 and the 4W ICs is expected to reach 5.5 million units in
2015. Digital 4W IC market is expected to grow as a result of more foreign players entering the Indian market.
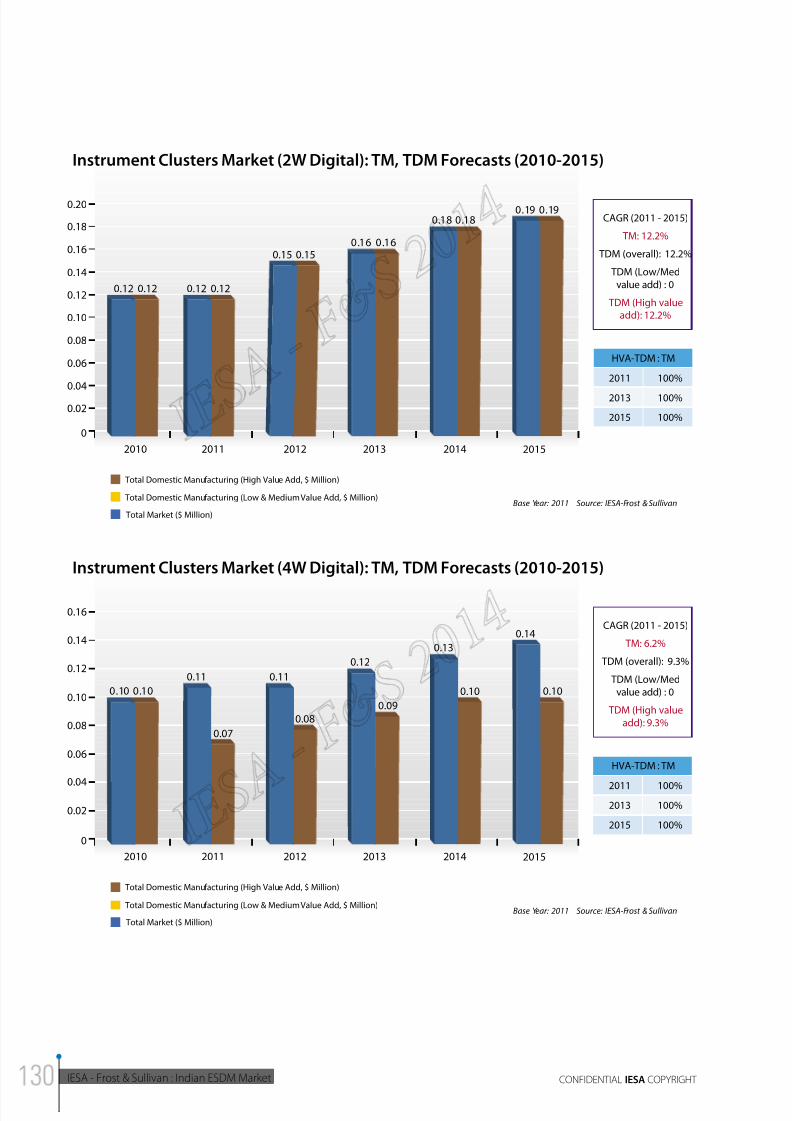
8/11/2019 IESA FS Report Indian ESDM Market
http://slidepdf.com/reader/full/iesa-fs-report-indian-esdm-market 130/172
IESA - Frost & Sullivan : Indian ESDM Market CONFIDENTIAL IESA COPYRIGHT
0.14
0.10
0
0.04
0.02
0.08
0.06
0.12
0.10
0.16
0.14
20112010 2012 2013 2014 2015
Instrument Clusters Market (4W Digital): TM, TDM Forecasts (2010-2015)
HVA-TDM : TM
2011
2013
2015
100%
100%
100%
Total Market ($ Million)
Total Domestic Manufacturing (High Value Add, $ Million)
Total Domestic Manufacturing (Low & Medium Value Add, $ Million)Base Year: 2011 Source: IESA-Frost & Sullivan
CAGR (2011 - 2015)
TM: 6.2%
TDM (overall): 9.3%
TDM (Low/Med
value add) : 0
TDM (High value
add): 9.3%
0.13
0.10
0.11
0.12
0.090.08
0.10 0.10
0.11
0.07
0.19 0.19
0
0.02
0.06
0.04
0.10
0.08
0.20
0.12
0.14
0.18
0.16
20112010 2012 2013 2014 2015
Instrument Clusters Market (2W Digital): TM, TDM Forecasts (2010-2015)
HVA-TDM : TM
2011
2013
2015
100%
100%
100%
Total Market ($ Million)
Total Domestic Manufacturing (High Value Add, $ Million)
Total Domestic Manufacturing (Low & Medium Value Add, $ Million)Base Year: 2011 Source: IESA-Frost & Sullivan
CAGR (2011 - 2015)
TM: 12.2%
TDM (overall): 12.2%
TDM (Low/Med
value add) : 0
TDM (High valueadd): 12.2%
0.18 0.18
0.150.16 0.16
0.15
0.12 0.12 0.12 0.12
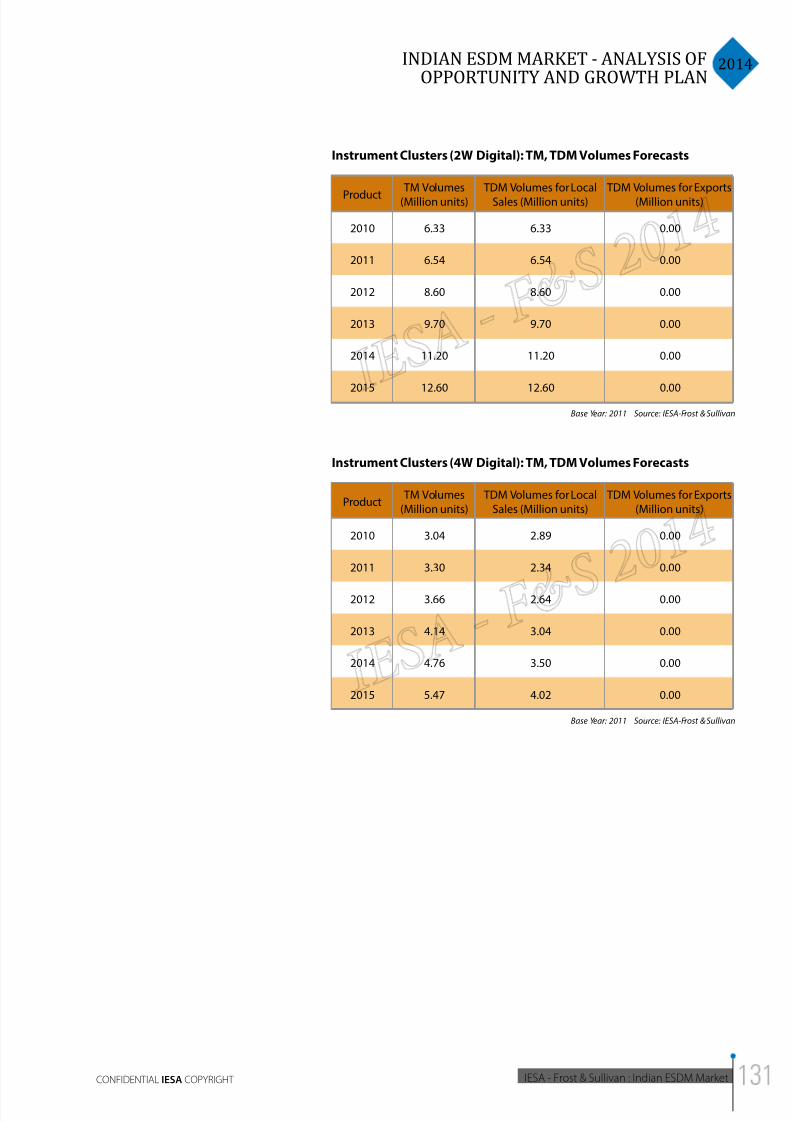
8/11/2019 IESA FS Report Indian ESDM Market
http://slidepdf.com/reader/full/iesa-fs-report-indian-esdm-market 131/172
2014INDIAN ESDM MARKET - ANALYSIS OF
OPPORTUNITY AND GROWTH PLAN
IESA - Frost & Sullivan : Indian ESDM MarketCONFIDENTIAL IESA COPYRIGHT
Instrument Clusters (2W Digital): TM, TDM Volumes Forecasts
Product TM Volumes(Million units)
TDM Volumes for LocalSales (Million units)
TDM Volumes for Exports(Million units)
2010 6.33 6.33 0.00
2011 6.54 6.54 0.00
2012 8.60 8.60 0.00
2013 9.70 9.70 0.00
2014 11.20 11.20 0.00
2015 12.60 12.60 0.00
Base Year: 2011 Source: IESA-Frost & Sullivan
Instrument Clusters (4W Digital): TM, TDM Volumes Forecasts
Product TM Volumes(Million units)
TDM Volumes for LocalSales (Million units)
TDM Volumes for Exports(Million units)
2010 3.04 2.89 0.00
2011 3.30 2.34 0.00
2012 3.66 2.64 0.00
2013 4.14 3.04 0.00
2014 4.76 3.50 0.00
2015 5.47 4.02 0.00
Base Year: 2011 Source: IESA-Frost & Sullivan
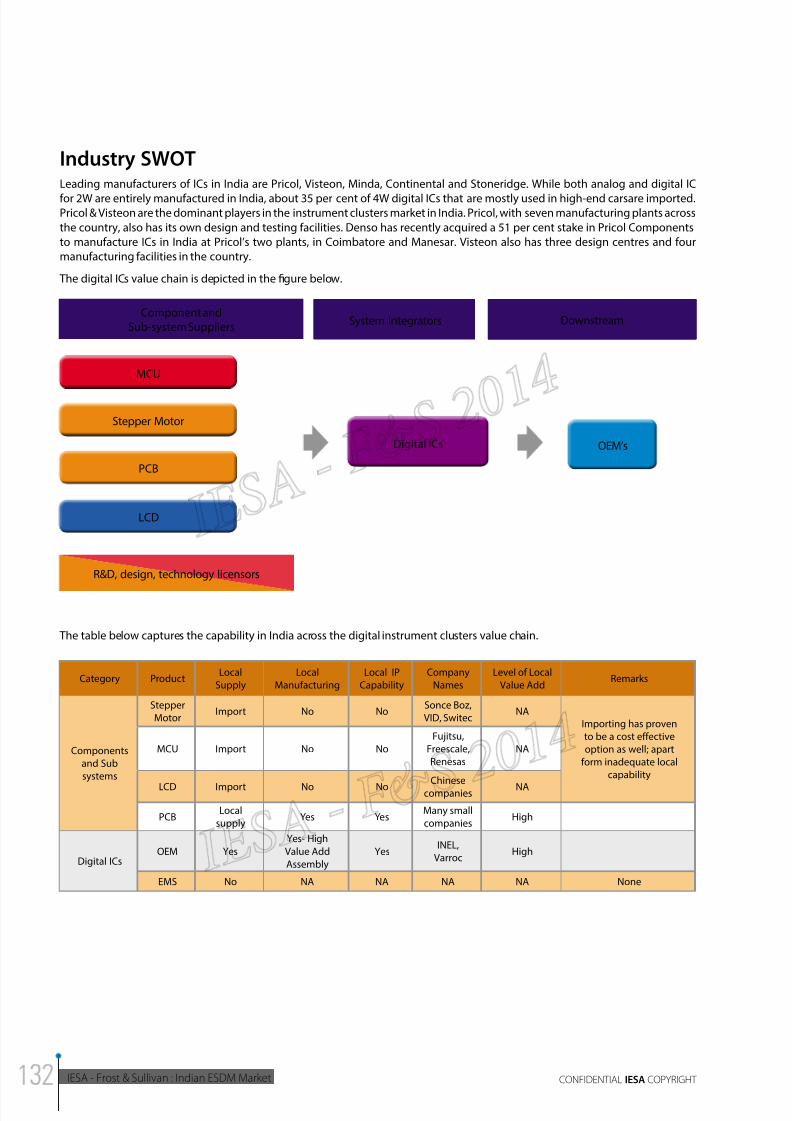
8/11/2019 IESA FS Report Indian ESDM Market
http://slidepdf.com/reader/full/iesa-fs-report-indian-esdm-market 132/172
IESA - Frost & Sullivan : Indian ESDM Market CONFIDENTIAL IESA COPYRIGHT
The table below captures the capability in India across the digital instrument clusters value chain.
Category ProductLocal
Supply
Local
Manufacturing
Local IP
Capability
Company
Names
Level of Local
Value AddRemarks
Components
and Sub
systems
Stepper
MotorImport No No
Sonce Boz,
VID, SwitecNA
Importing has proven
to be a cost effective
option as well; apart
form inadequate local
capability
MCU Import No No
Fujitsu,
Freescale,
Renesas
NA
LCD Import No No Chinesecompanies NA
PCBLocal
supplyYes Yes
Many small
companiesHigh
Digital ICsOEM Yes
Yes- High
Value Add
Assembly
YesINEL,
VarrocHigh
EMS No NA NA NA NA None
Industry SWOTLeading manufacturers of ICs in India are Pricol, Visteon, Minda, Continental and Stoneridge. While both analog and digital IC
for 2W are entirely manufactured in India, about 35 per cent of 4W digital ICs that are mostly used in high-end carsare imported.Pricol & Visteon are the dominant players in the instrument clusters market in India. Pricol, with seven manufacturing plants across
the country, also has its own design and testing facilities. Denso has recently acquired a 51 per cent stake in Pricol Components
to manufacture ICs in India at Pricol’s two plants, in Coimbatore and Manesar. Visteon also has three design centres and four
manufacturing facilities in the country.
The digital ICs value chain is depicted in the figure below.
Component andSub-system Suppliers
System Integrators Downstream
MCU
PCB
LCD
Stepper Motor
Digital ICs OEM’s
R&D, design, technology licensors
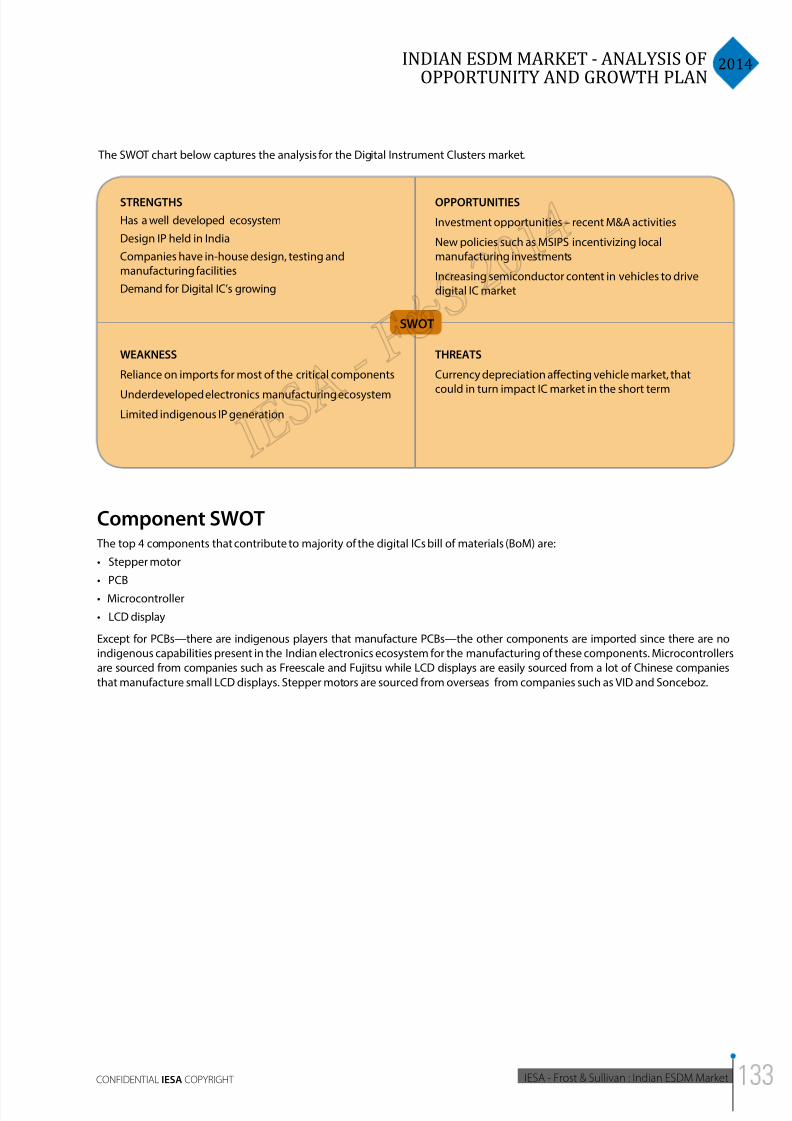
8/11/2019 IESA FS Report Indian ESDM Market
http://slidepdf.com/reader/full/iesa-fs-report-indian-esdm-market 133/172
2014INDIAN ESDM MARKET - ANALYSIS OF
OPPORTUNITY AND GROWTH PLAN
IESA - Frost & Sullivan : Indian ESDM MarketCONFIDENTIAL IESA COPYRIGHT
The SWOT chart below captures the analysis for the Digital Instrument Clusters market.
STRENGTHS
Has a well developed ecosystem
Design IP held in India
Companies have in-house design, testing andmanufacturing facilities
Demand for Digital IC’s growing
OPPORTUNITIES
Investment opportunities – recent M&A activities
New policies such as MSIPS incentivizing localmanufacturing investments
Increasing semiconductor content in vehicles to drivedigital IC market
WEAKNESS
Reliance on imports for most of the critical components
Underdeveloped electronics manufacturing ecosystem
Limited indigenous IP generation
THREATS
Currency depreciation affecting vehicle market, that
could in turn impact IC market in the short term
SWOT
Component SWOT The top 4 components that contribute to majority of the digital ICs bill of materials (BoM) are:
• Stepper motor
• PCB
• Microcontroller
• LCD display
Except for PCBs—there are indigenous players that manufacture PCBs—the other components are imported since there are no
indigenous capabilities present in the Indian electronics ecosystem for the manufacturing of these components. Microcontrollers
are sourced from companies such as Freescale and Fujitsu while LCD displays are easily sourced from a lot of Chinese companies
that manufacture small LCD displays. Stepper motors are sourced from overseas from companies such as VID and Sonceboz.
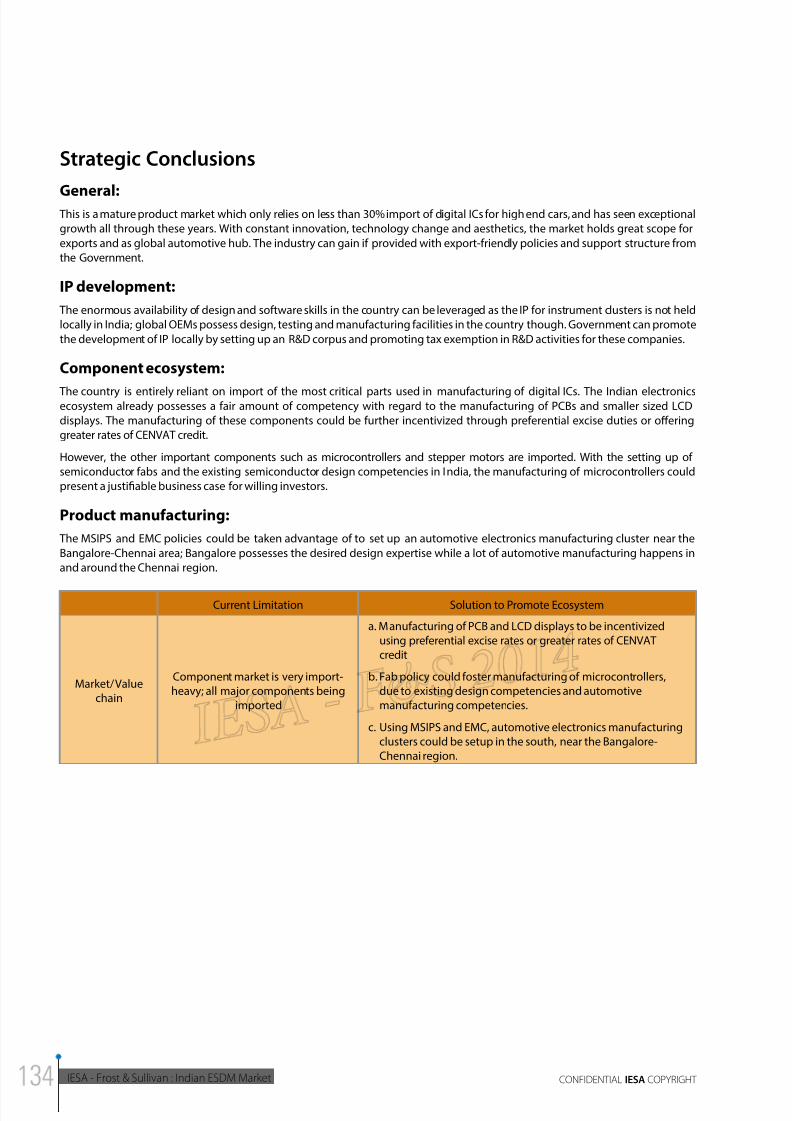
8/11/2019 IESA FS Report Indian ESDM Market
http://slidepdf.com/reader/full/iesa-fs-report-indian-esdm-market 134/172
IESA - Frost & Sullivan : Indian ESDM Market CONFIDENTIAL IESA COPYRIGHT
Current Limitation Solution to Promote Ecosystem
Market/ Valuechain
Component market is very import-heavy; all major components being
imported
a. Manufacturing of PCB and LCD displays to be incentivizedusing preferential excise rates or greater rates of CENVATcredit
b. Fab policy could foster manufacturing of microcontrollers,due to existing design competencies and automotivemanufacturing competencies.
c. Using MSIPS and EMC, automotive electronics manufacturingclusters could be setup in the south, near the Bangalore-Chennai region.
Strategic Conclusions
General: This is a mature product market which only relies on less than 30% import of digital ICs for high end cars, and has seen exceptional
growth all through these years. With constant innovation, technology change and aesthetics, the market holds great scope for
exports and as global automotive hub. The industry can gain if provided with export-friendly policies and support structure from
the Government.
IP development:
The enormous availability of design and software skills in the country can be leveraged as the IP for instrument clusters is not held
locally in India; global OEMs possess design, testing and manufacturing facilities in the country though. Government can promote
the development of IP locally by setting up an R&D corpus and promoting tax exemption in R&D activities for these companies.
Component ecosystem:
The country is entirely reliant on import of the most critical parts used in manufacturing of digital ICs. The Indian electronicsecosystem already possesses a fair amount of competency with regard to the manufacturing of PCBs and smaller sized LCD
displays. The manufacturing of these components could be further incentivized through preferential excise duties or offering
greater rates of CENVAT credit.
However, the other important components such as microcontrollers and stepper motors are imported. With the setting up of
semiconductor fabs and the existing semiconductor design competencies in India, the manufacturing of microcontrollers could
present a justifiable business case for willing investors.
Product manufacturing:
The MSIPS and EMC policies could be taken advantage of to set up an automotive electronics manufacturing cluster near the
Bangalore-Chennai area; Bangalore possesses the desired design expertise while a lot of automotive manufacturing happens in
and around the Chennai region.
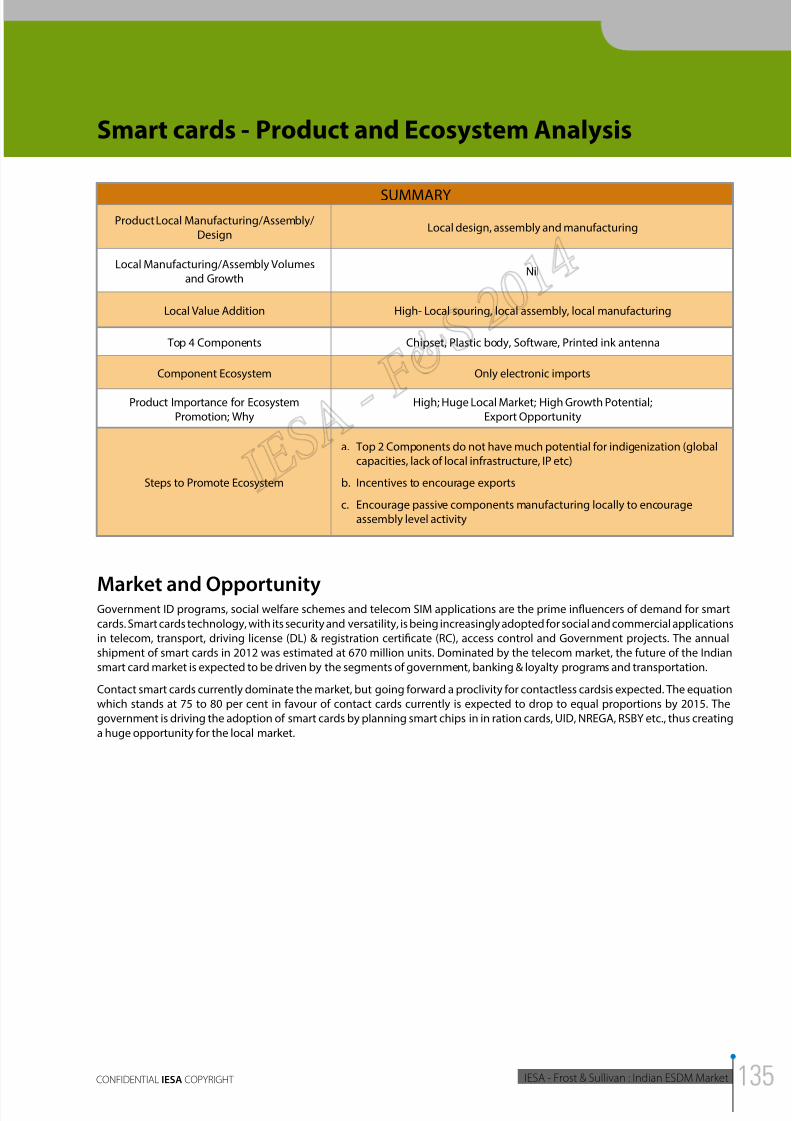
8/11/2019 IESA FS Report Indian ESDM Market
http://slidepdf.com/reader/full/iesa-fs-report-indian-esdm-market 135/172
2014INDIAN ESDM MARKET - ANALYSIS OF
OPPORTUNITY AND GROWTH PLAN
IESA - Frost & Sullivan : Indian ESDM MarketCONFIDENTIAL IESA COPYRIGHT
Smart cards - Product and Ecosystem Analysis
SUMMARYProduct Local Manufacturing/Assembly/
DesignLocal design, assembly and manufacturing
Local Manufacturing/Assembly Volumesand Growth
Nil
Local Value Addition High- Local souring, local assembly, local manufacturing
Top 4 Components Chipset, Plastic body, Software, Printed ink antenna
Component Ecosystem Only electronic imports
Product Importance for EcosystemPromotion; Why
High; Huge Local Market; High Growth Potential;Export Opportunity
Steps to Promote Ecosystem
a. Top 2 Components do not have much potential for indigenization (globalcapacities, lack of local infrastructure, IP etc)
b. Incentives to encourage exports
c. Encourage passive components manufacturing locally to encourageassembly level activity
Market and OpportunityGovernment ID programs, social welfare schemes and telecom SIM applications are the prime influencers of demand for smart
cards. Smart cards technology, with its security and versatility, is being increasingly adopted for social and commercial applications
in telecom, transport, driving license (DL) & registration certificate (RC), access control and Government projects. The annual
shipment of smart cards in 2012 was estimated at 670 million units. Dominated by the telecom market, the future of the Indian
smart card market is expected to be driven by the segments of government, banking & loyalty programs and transportation.
Contact smart cards currently dominate the market, but going forward a proclivity for contactless cardsis expected. The equation
which stands at 75 to 80 per cent in favour of contact cards currently is expected to drop to equal proportions by 2015. The
government is driving the adoption of smart cards by planning smart chips in in ration cards, UID, NREGA, RSBY etc., thus creating
a huge opportunity for the local market.
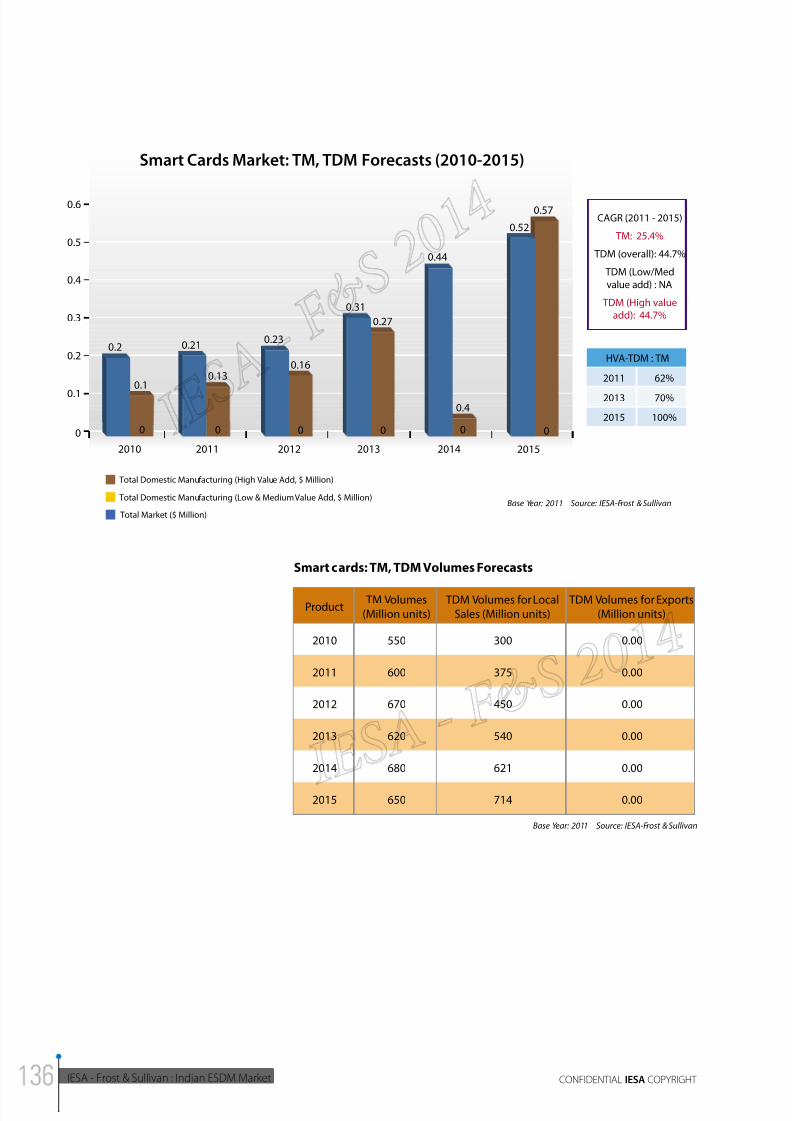
8/11/2019 IESA FS Report Indian ESDM Market
http://slidepdf.com/reader/full/iesa-fs-report-indian-esdm-market 136/172
IESA - Frost & Sullivan : Indian ESDM Market CONFIDENTIAL IESA COPYRIGHT
0.52
0.57
0
0.1
0.3
0.2
0.5
0.4
0.6
20112010 2012 2013 2014 2015
Smart Cards Market: TM, TDM Forecasts (2010-2015)
HVA-TDM : TM
2011
2013
2015
62%
70%
100%
Total Market ($ Million)
Total Domestic Manufacturing (High Value Add, $ Million)
Total Domestic Manufacturing (Low & Medium Value Add, $ Million)Base Year: 2011 Source: IESA-Frost & Sullivan
CAGR (2011 - 2015)
TM: 25.4%
TDM (overall): 44.7%
TDM (Low/Med
value add) : NA
TDM (High valueadd): 44.7%
0.44
0.4
0.31
0.27
0.21
0.13
0.2
0.1
0.16
0.23
0 0 0 0 0 0
Smart cards: TM, TDM Volumes Forecasts
Product TM Volumes(Million units)
TDM Volumes for LocalSales (Million units)
TDM Volumes for Exports(Million units)
2010 550 300 0.00
2011 600 375 0.00
2012 670 450 0.00
2013 620 540 0.00
2014 680 621 0.00
2015 650 714 0.00
Base Year: 2011 Source: IESA-Frost & Sullivan
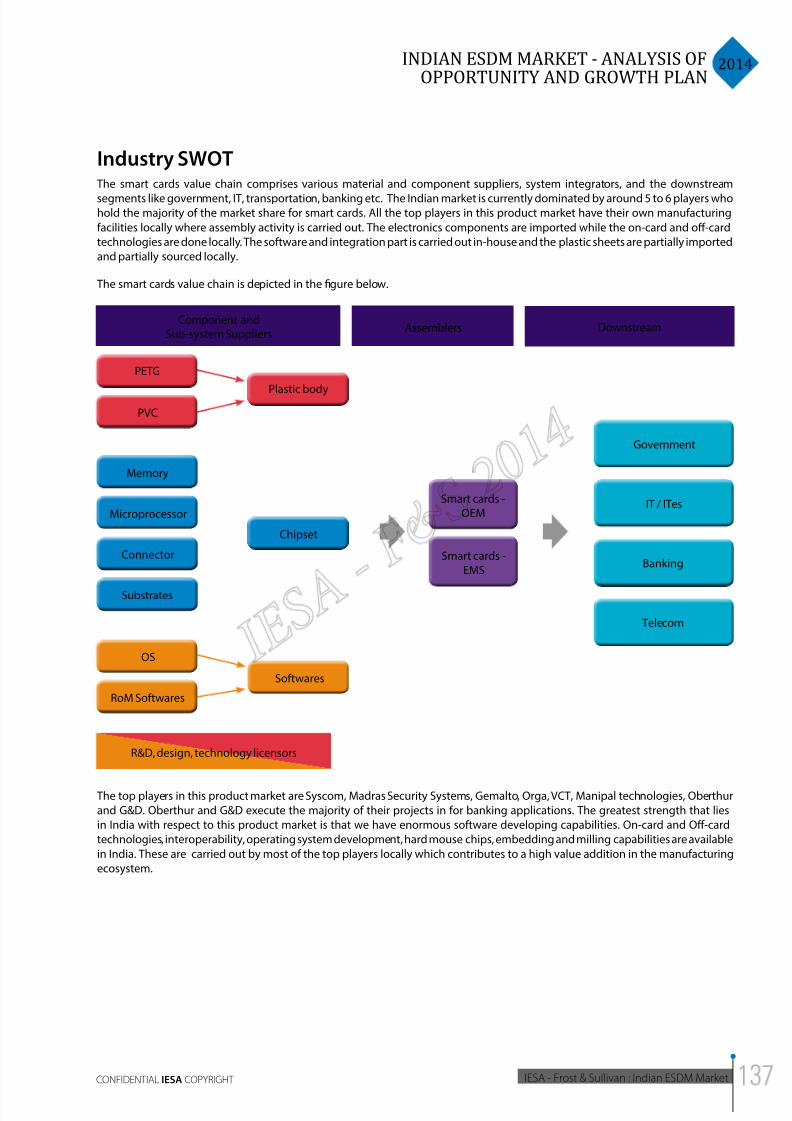
8/11/2019 IESA FS Report Indian ESDM Market
http://slidepdf.com/reader/full/iesa-fs-report-indian-esdm-market 137/172
2014INDIAN ESDM MARKET - ANALYSIS OF
OPPORTUNITY AND GROWTH PLAN
IESA - Frost & Sullivan : Indian ESDM MarketCONFIDENTIAL IESA COPYRIGHT
Industry SWOT The smart cards value chain comprises various material and component suppliers, system integrators, and the downstream
segments like government, IT, transportation, banking etc. The Indian market is currently dominated by around 5 to 6 players whohold the majority of the market share for smart cards. All the top players in this product market have their own manufacturing
facilities locally where assembly activity is carried out. The electronics components are imported while the on-card and off-card
technologies are done locally. The software and integration part is carried out in-house and the plastic sheets are partially imported
and partially sourced locally.
The smart cards value chain is depicted in the figure below.
Component andSub-system Suppliers
PETG
PVC
Plastic body
Chipset
Smart cards -OEM
Smart cards -EMS
IT / ITes
Government
Banking
Telecom
Softwares
Memory
Substrates
Connector
Microprocessor
OS
RoM Softwares
Assemblers Downstream
R&D, design, technology licensors
The top players in this product market are Syscom, Madras Security Systems, Gemalto, Orga, VCT, Manipal technologies, Oberthur
and G&D. Oberthur and G&D execute the majority of their projects in for banking applications. The greatest strength that lies
in India with respect to this product market is that we have enormous software developing capabilities. On-card and Off-card
technologies, interoperability, operating system development, hard mouse chips, embedding and milling capabilities are available
in India. These are carried out by most of the top players locally which contributes to a high value addition in the manufacturing
ecosystem.
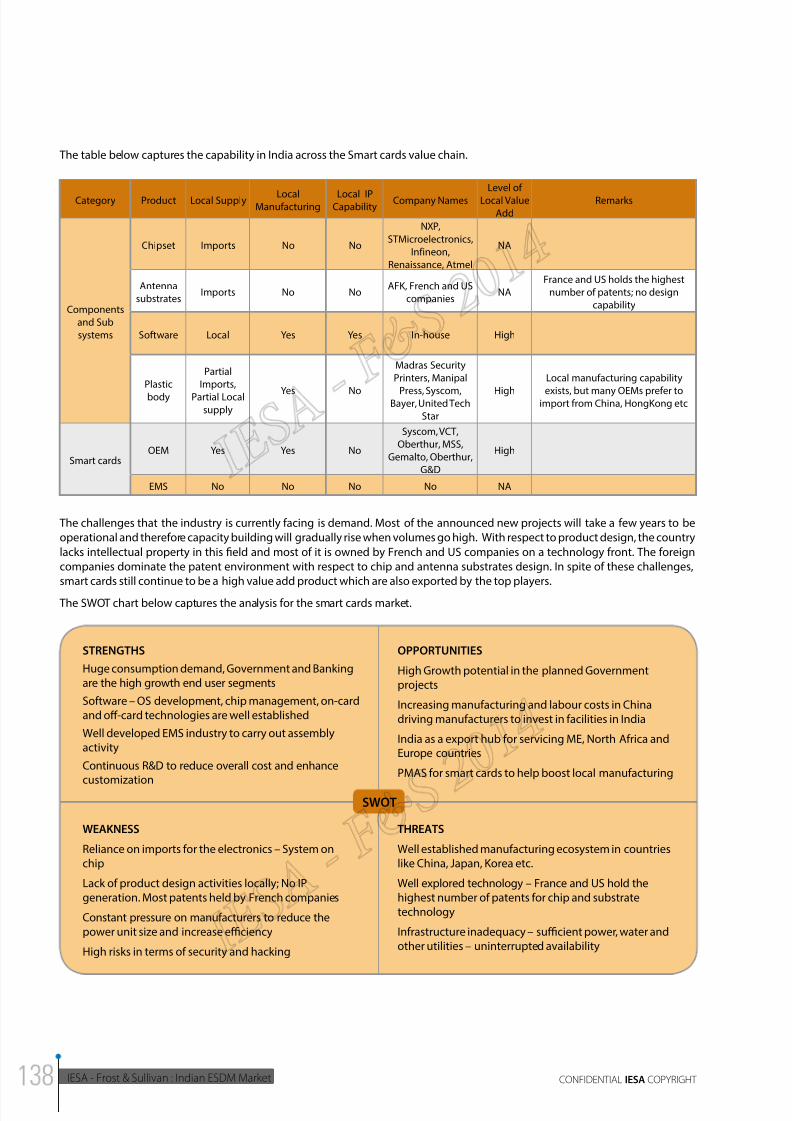
8/11/2019 IESA FS Report Indian ESDM Market
http://slidepdf.com/reader/full/iesa-fs-report-indian-esdm-market 138/172
IESA - Frost & Sullivan : Indian ESDM Market CONFIDENTIAL IESA COPYRIGHT
Category Product Local Supply LocalManufacturing
Local IPCapability
Company Names
Level of
Local ValueAdd
Remarks
Components
and Sub
systems
Chipset Imports No No
NXP,
STMicroelectronics,
Infineon,
Renaissance, Atmel
NA
Antenna
substratesImports No No
AFK, French and US
companiesNA
France and US holds the highest
number of patents; no design
capability
Software Local Yes Yes In-house High
Plastic
body
Partial
Imports,
Partial Local
supply
Yes No
Madras Security
Printers, Manipal
Press, Syscom,Bayer, United Tech
Star
High
Local manufacturing capability
exists, but many OEMs prefer toimport from China, HongKong etc
Smart cardsOEM Yes Yes No
Syscom, VCT,
Oberthur, MSS,
Gemalto, Oberthur,
G&D
High
EMS No No No No NA
The table below captures the capability in India across the Smart cards value chain.
The challenges that the industry is currently facing is demand. Most of the announced new projects will take a few years to be
operational and therefore capacity building will gradually rise when volumes go high. With respect to product design, the country
lacks intellectual property in this field and most of it is owned by French and US companies on a technology front. The foreign
companies dominate the patent environment with respect to chip and antenna substrates design. In spite of these challenges,
smart cards still continue to be a high value add product which are also exported by the top players.
The SWOT chart below captures the analysis for the smart cards market.
STRENGTHS
Huge consumption demand, Government and Bankingare the high growth end user segments
Software – OS development, chip management, on-cardand off-card technologies are well established
Well developed EMS industry to carry out assemblyactivity
Continuous R&D to reduce overall cost and enhance
customization
OPPORTUNITIES
High Growth potential in the planned Governmentprojects
Increasing manufacturing and labour costs in Chinadriving manufacturers to invest in facilities in India
India as a export hub for servicing ME, North Africa andEurope countries
PMAS for smart cards to help boost local manufacturing
WEAKNESS
Reliance on imports for the electronics – System onchip
Lack of product design activities locally; No IPgeneration. Most patents held by French companies
Constant pressure on manufacturers to reduce thepower unit size and increase eciency
High risks in terms of security and hacking
THREATS
Well established manufacturing ecosystem in countrieslike China, Japan, Korea etc.
Well explored technology – France and US hold thehighest number of patents for chip and substratetechnology
Infrastructure inadequacy – sucient power, water andother utilities – uninterrupted availability
SWOT
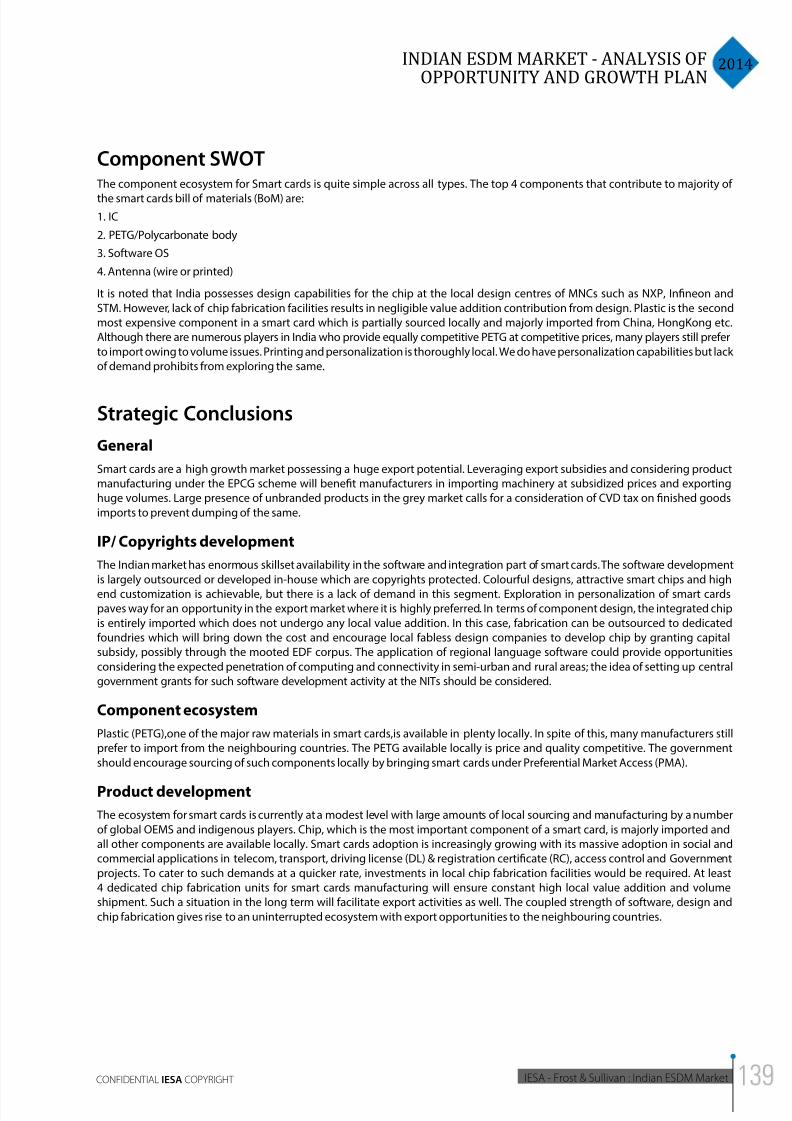
8/11/2019 IESA FS Report Indian ESDM Market
http://slidepdf.com/reader/full/iesa-fs-report-indian-esdm-market 139/172
2014INDIAN ESDM MARKET - ANALYSIS OF
OPPORTUNITY AND GROWTH PLAN
IESA - Frost & Sullivan : Indian ESDM MarketCONFIDENTIAL IESA COPYRIGHT
Component SWOT The component ecosystem for Smart cards is quite simple across all types. The top 4 components that contribute to majority of
the smart cards bill of materials (BoM) are:
1. IC
2. PETG/Polycarbonate body
3. Software OS
4. Antenna (wire or printed)
It is noted that India possesses design capabilities for the chip at the local design centres of MNCs such as NXP, Infineon and
STM. However, lack of chip fabrication facilities results in negligible value addition contribution from design. Plastic is the second
most expensive component in a smart card which is partially sourced locally and majorly imported from China, HongKong etc.
Although there are numerous players in India who provide equally competitive PETG at competitive prices, many players still prefer
to import owing to volume issues. Printing and personalization is thoroughly local. We do have personalization capabilities but lack
of demand prohibits from exploring the same.
Strategic Conclusions
General
Smart cards are a high growth market possessing a huge export potential. Leveraging export subsidies and considering product
manufacturing under the EPCG scheme will benefit manufacturers in importing machinery at subsidized prices and exporting
huge volumes. Large presence of unbranded products in the grey market calls for a consideration of CVD tax on finished goods
imports to prevent dumping of the same.
IP/ Copyrights development
The Indian market has enormous skillset availability in the software and integration part of smart cards. The software development
is largely outsourced or developed in-house which are copyrights protected. Colourful designs, attractive smart chips and high
end customization is achievable, but there is a lack of demand in this segment. Exploration in personalization of smart cardspaves way for an opportunity in the export market where it is highly preferred. In terms of component design, the integrated chip
is entirely imported which does not undergo any local value addition. In this case, fabrication can be outsourced to dedicated
foundries which will bring down the cost and encourage local fabless design companies to develop chip by granting capital
subsidy, possibly through the mooted EDF corpus. The application of regional language software could provide opportunities
considering the expected penetration of computing and connectivity in semi-urban and rural areas; the idea of setting up central
government grants for such software development activity at the NITs should be considered.
Component ecosystem
Plastic (PETG),one of the major raw materials in smart cards,is available in plenty locally. In spite of this, many manufacturers still
prefer to import from the neighbouring countries. The PETG available locally is price and quality competitive. The government
should encourage sourcing of such components locally by bringing smart cards under Preferential Market Access (PMA).
Product development
The ecosystem for smart cards is currently at a modest level with large amounts of local sourcing and manufacturing by a number
of global OEMS and indigenous players. Chip, which is the most important component of a smart card, is majorly imported and
all other components are available locally. Smart cards adoption is increasingly growing with its massive adoption in social and
commercial applications in telecom, transport, driving license (DL) & registration certificate (RC), access control and Government
projects. To cater to such demands at a quicker rate, investments in local chip fabrication facilities would be required. At least
4 dedicated chip fabrication units for smart cards manufacturing will ensure constant high local value addition and volume
shipment. Such a situation in the long term will facilitate export activities as well. The coupled strength of software, design and
chip fabrication gives rise to an uninterrupted ecosystem with export opportunities to the neighbouring countries.
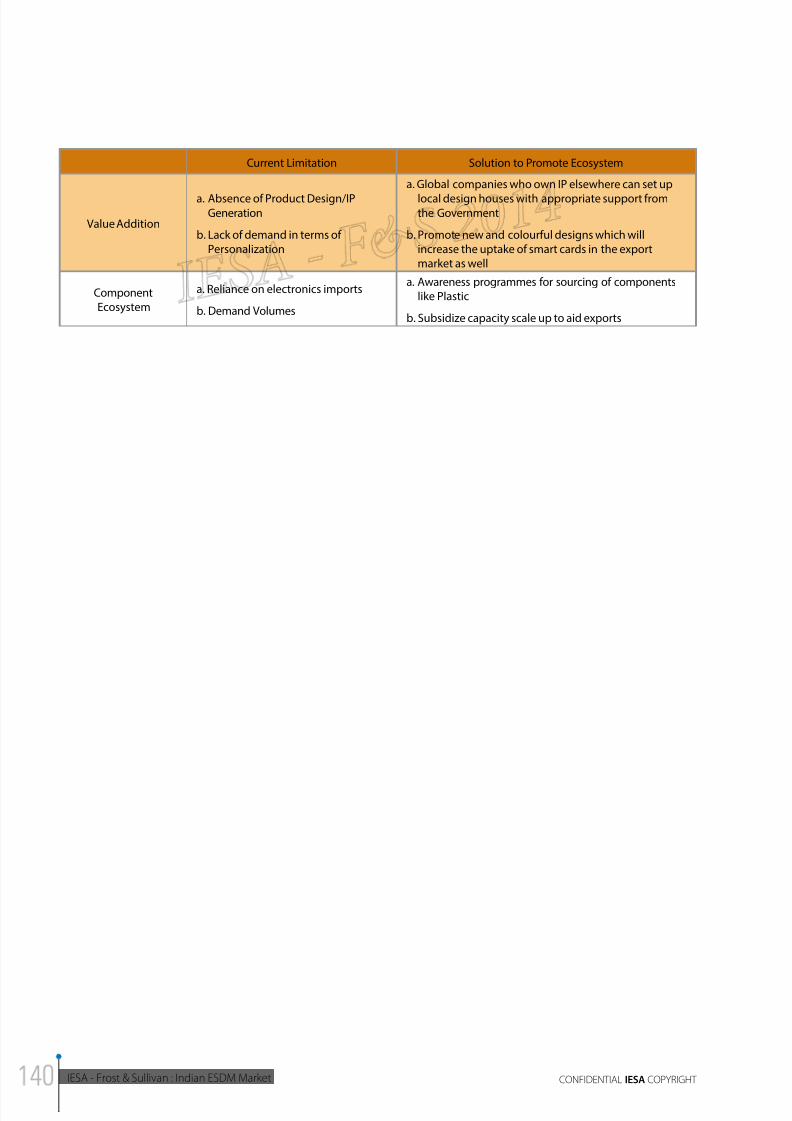
8/11/2019 IESA FS Report Indian ESDM Market
http://slidepdf.com/reader/full/iesa-fs-report-indian-esdm-market 140/172
IESA - Frost & Sullivan : Indian ESDM Market CONFIDENTIAL IESA COPYRIGHT
Current Limitation Solution to Promote Ecosystem
Value Addition
a. Absence of Product Design/IPGeneration
b. Lack of demand in terms ofPersonalization
a. Global companies who own IP elsewhere can set up
local design houses with appropriate support fromthe Government
b. Promote new and colourful designs which willincrease the uptake of smart cards in the exportmarket as well
ComponentEcosystem
a. Reliance on electronics imports
b. Demand Volumes
a. Awareness programmes for sourcing of componentslike Plastic
b. Subsidize capacity scale up to aid exports
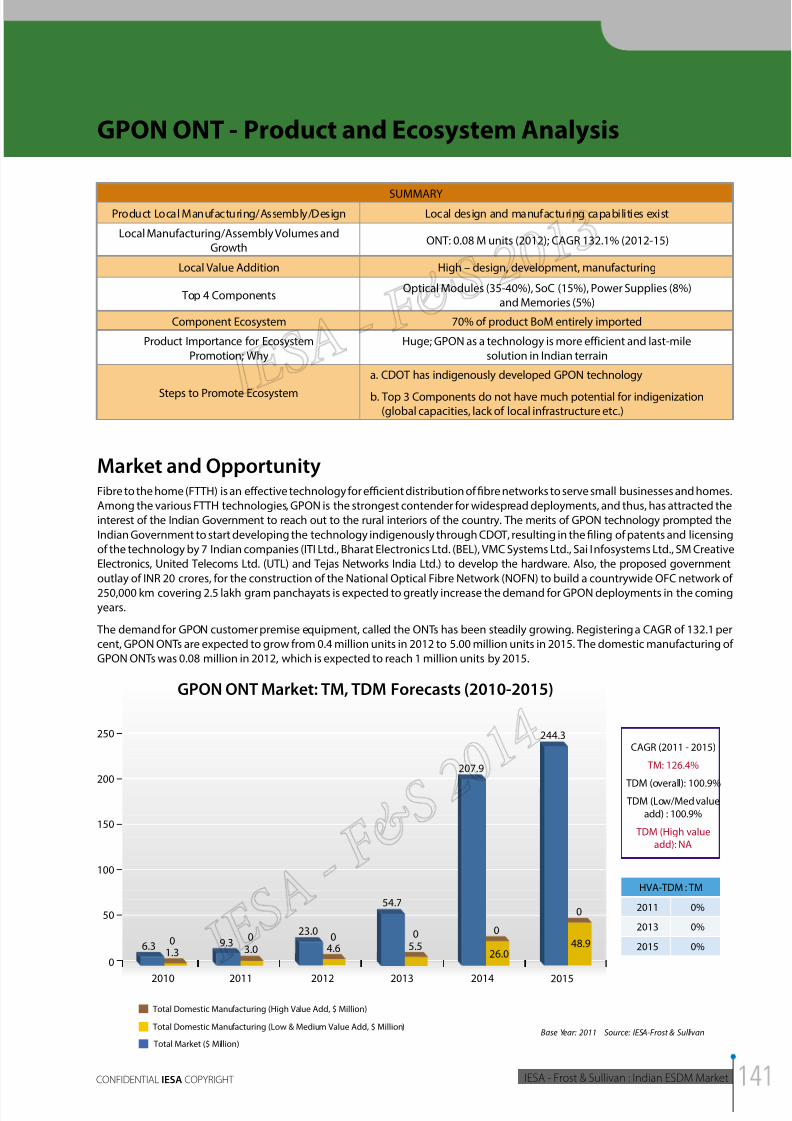
8/11/2019 IESA FS Report Indian ESDM Market
http://slidepdf.com/reader/full/iesa-fs-report-indian-esdm-market 141/172
2014INDIAN ESDM MARKET - ANALYSIS OF
OPPORTUNITY AND GROWTH PLAN
IESA - Frost & Sullivan : Indian ESDM MarketCONFIDENTIAL IESA COPYRIGHT
GPON ONT - Product and Ecosystem Analysis
SUMMARYProduct Local Manufacturing/Assembly/Design Local design and manufacturing capabilities exist
Local Manufacturing/Assembly Volumes andGrowth
ONT: 0.08 M units (2012); CAGR 132.1% (2012-15)
Local Value Addition High – design, development, manufacturing
Top 4 ComponentsOptical Modules (35-40%), SoC (15%), Power Supplies (8%)
and Memories (5%)
Component Ecosystem 70% of product BoM entirely imported
Product Importance for Ecosystem
Promotion; Why
Huge; GPON as a technology is more efficient and last-mile
solution in Indian terrain
Steps to Promote Ecosystem
a. CDOT has indigenously developed GPON technology
b. Top 3 Components do not have much potential for indigenization(global capacities, lack of local infrastructure etc.)
Market and OpportunityFibre to the home (FTTH) is an eective technology for ecient distribution of bre networks to serve small businesses and homes.
Among the various FTTH technologies, GPON is the strongest contender for widespread deployments, and thus, has attracted the
interest of the Indian Government to reach out to the rural interiors of the country. The merits of GPON technology prompted the
Indian Government to start developing the technology indigenously through CDOT, resulting in the filing of patents and licensing
of the technology by 7 Indian companies (ITI Ltd., Bharat Electronics Ltd. (BEL), VMC Systems Ltd., Sai Infosystems Ltd., SM Creative
Electronics, United Telecoms Ltd. (UTL) and Tejas Networks India Ltd.) to develop the hardware. Also, the proposed government
outlay of INR 20 crores, for the construction of the National Optical Fibre Network (NOFN) to build a countrywide OFC network of
250,000 km covering 2.5 lakh gram panchayats is expected to greatly increase the demand for GPON deployments in the comingyears.
The demand for GPON customer premise equipment, called the ONTs has been steadily growing . Registering a CAGR of 132.1 per
cent, GPON ONTs are expected to grow from 0.4 million units in 2012 to 5.00 million units in 2015. The domestic manufacturing of
GPON ONTs was 0.08 million in 2012, which is expected to reach 1 million units by 2015.
244.3
0
0
50
100
150
200
250
20112010 2012 2013 2014 2015
GPON ONT Market: TM, TDM Forecasts (2010-2015)
HVA-TDM : TM
2011
2013
2015
0%
0%
0%
Total Market ($ Million)
Total Domestic Manufacturing (High Value Add, $ Million)
Total Domestic Manufacturing (Low & Medium Value Add, $ Million)Base Year: 2011 Source: IESA-Frost & Sullivan
CAGR (2011 - 2015)
TM: 126.4%
TDM (overall): 100.9% TDM (Low/Med value
add) : 100.9%
TDM (High valueadd): NA
48.90
207.9
54.7
05.5
23.000
9.306.31.3 3.0 4.6
26.0
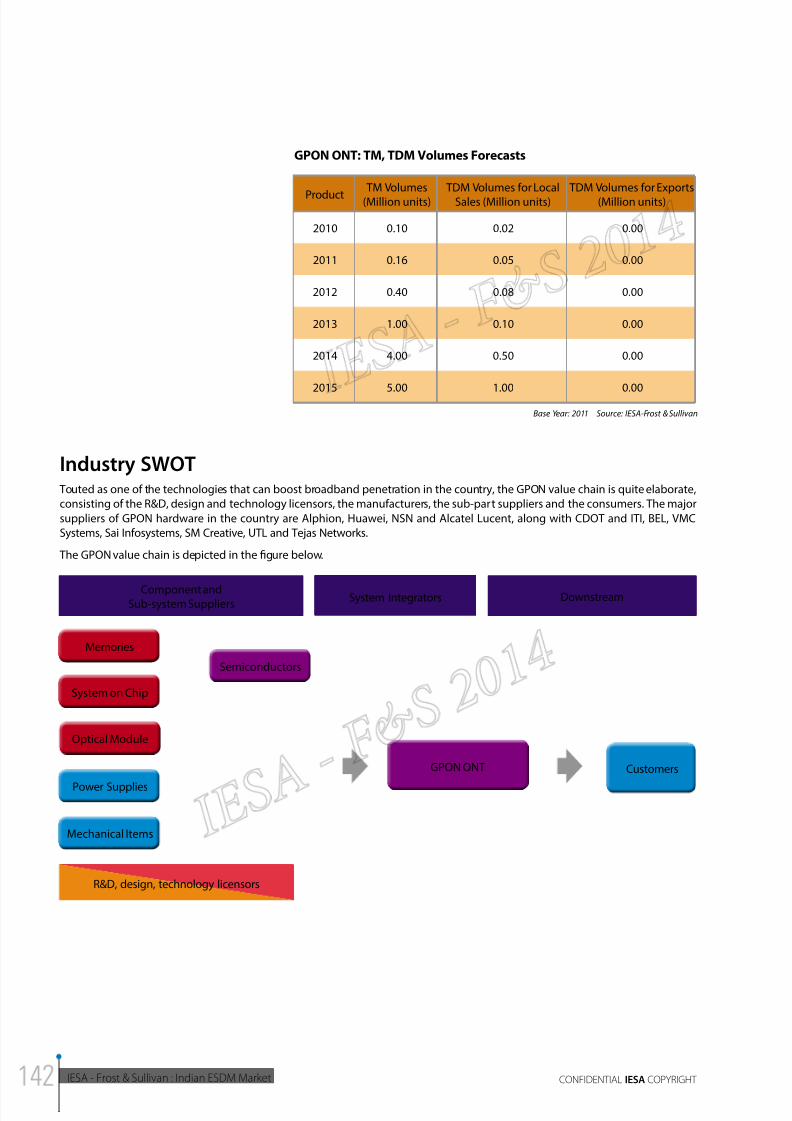
8/11/2019 IESA FS Report Indian ESDM Market
http://slidepdf.com/reader/full/iesa-fs-report-indian-esdm-market 142/172
IESA - Frost & Sullivan : Indian ESDM Market CONFIDENTIAL IESA COPYRIGHT
GPON ONT: TM, TDM Volumes Forecasts
Product TM Volumes(Million units)
TDM Volumes for LocalSales (Million units)
TDM Volumes for Exports(Million units)
2010 0.10 0.02 0.00
2011 0.16 0.05 0.00
2012 0.40 0.08 0.00
2013 1.00 0.10 0.00
2014 4.00 0.50 0.00
2015 5.00 1.00 0.00
Base Year: 2011 Source: IESA-Frost & Sullivan
Industry SWOT Touted as one of the technologies that can boost broadband penetration in the country, the GPON value chain is quite elaborate,
consisting of the R&D, design and technology licensors, the manufacturers, the sub-part suppliers and the consumers. The major
suppliers of GPON hardware in the country are Alphion, Huawei, NSN and Alcatel Lucent, along with CDOT and ITI, BEL, VMC
Systems, Sai Infosystems, SM Creative, UTL and Tejas Networks.
The GPON value chain is depicted in the figure below.
Component andSub-system Suppliers
System Integrators Downstream
Optical Module
System on Chip
Memories
Semiconductors
Mechanical Items
Power Supplies
GPON ONT Customers
R&D, design, technology licensors
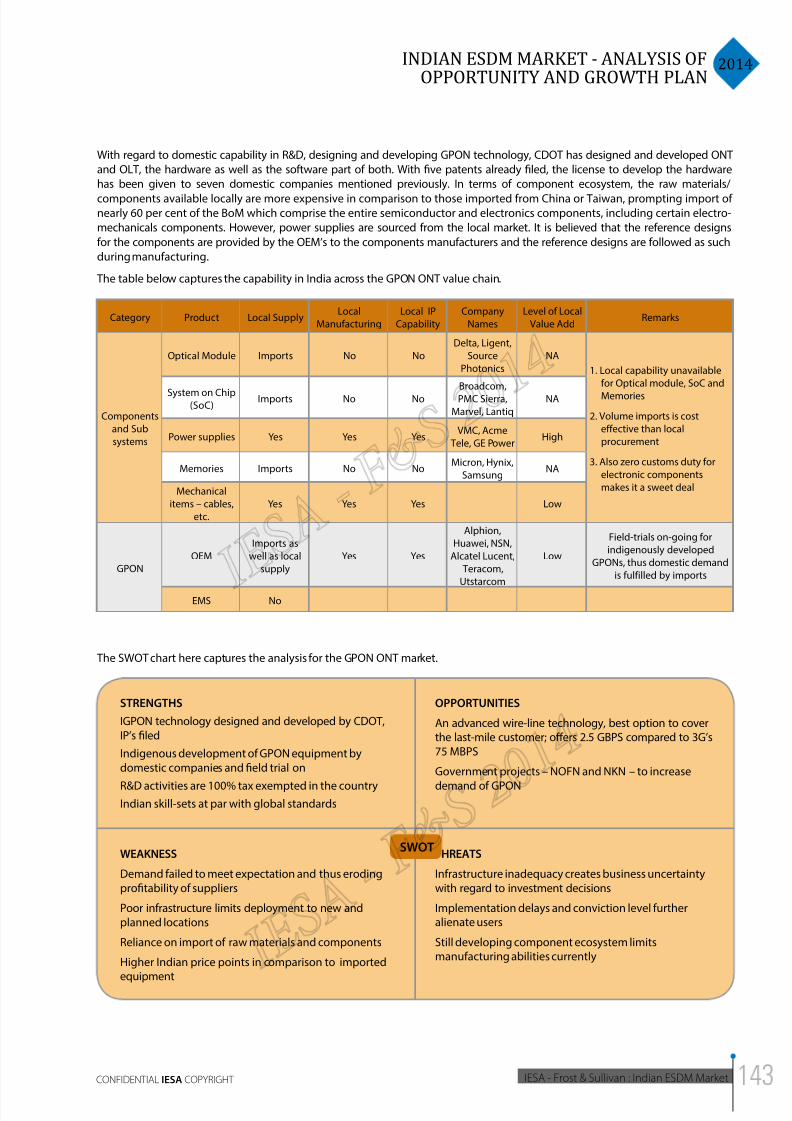
8/11/2019 IESA FS Report Indian ESDM Market
http://slidepdf.com/reader/full/iesa-fs-report-indian-esdm-market 143/172
2014INDIAN ESDM MARKET - ANALYSIS OF
OPPORTUNITY AND GROWTH PLAN
IESA - Frost & Sullivan : Indian ESDM MarketCONFIDENTIAL IESA COPYRIGHT
With regard to domestic capability in R&D, designing and developing GPON technology, CDOT has designed and developed ONT
and OLT, the hardware as well as the software part of both. With five patents already filed, the license to develop the hardware
has been given to seven domestic companies mentioned previously. In terms of component ecosystem, the raw materials/
components available locally are more expensive in comparison to those imported from China or Taiwan, prompting import ofnearly 60 per cent of the BoM which comprise the entire semiconductor and electronics components, including certain electro-
mechanicals components. However, power supplies are sourced from the local market. It is believed that the reference designs
for the components are provided by the OEM’s to the components manufacturers and the reference designs are followed as such
during manufacturing.
The table below captures the capability in India across the GPON ONT value chain.
Category Product Local SupplyLocal
Manufacturing
Local IP
Capability
Company
Names
Level of Local
Value AddRemarks
Components
and Sub
systems
Optical Module Imports No No
Delta, Ligent,
Source
Photonics
NA
1. Local capability unavailable
for Optical module, SoC and
Memories
2. Volume imports is cost
effective than local
procurement
3. Also zero customs duty for
electronic components
makes it a sweet deal
System on Chip(SoC)
Imports No No
Broadcom,
PMC Sierra,
Marvel, Lantiq
NA
Power supplies Yes Yes YesVMC, Acme
Tele, GE PowerHigh
Memories Imports No NoMicron, Hynix,
SamsungNA
Mechanical
items – cables,
etc.
Yes Yes Yes Low
GPONOEM
Imports as
well as local
supply
Yes Yes
Alphion,
Huawei, NSN,
Alcatel Lucent,
Teracom,
Utstarcom
Low
Field-trials on-going for
indigenously developed
GPONs, thus domestic demand
is fulfilled by imports
EMS No
The SWOT chart here captures the analysis for the GPON ONT market.
STRENGTHS
IGPON technology designed and developed by CDOT,IP’s filed
Indigenous development of GPON equipment bydomestic companies and field trial on
R&D activities are 100% tax exempted in the countryIndian skill-sets at par with global standards
OPPORTUNITIES
An advanced wire-line technology, best option to coverthe last-mile customer; offers 2.5 GBPS compared to 3G’s75 MBPS
Government projects – NOFN and NKN – to increase
demand of GPON
WEAKNESS
Demand failed to meet expectation and thus erodingprofitability of suppliers
Poor infrastructure limits deployment to new andplanned locations
Reliance on import of raw materials and components
Higher Indian price points in comparison to imported
equipment
THREATS
Infrastructure inadequacy creates business uncertaintywith regard to investment decisions
Implementation delays and conviction level furtheralienate users
Still developing component ecosystem limitsmanufacturing abilities currently
SWOT
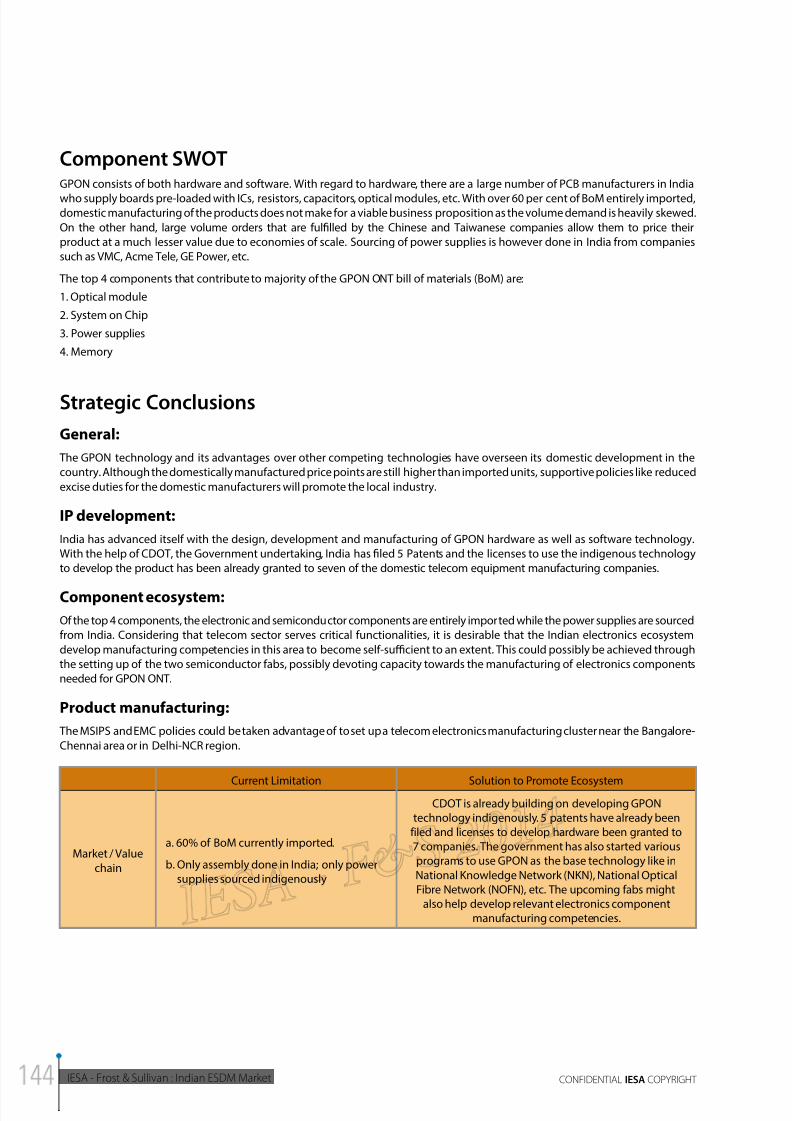
8/11/2019 IESA FS Report Indian ESDM Market
http://slidepdf.com/reader/full/iesa-fs-report-indian-esdm-market 144/172
IESA - Frost & Sullivan : Indian ESDM Market CONFIDENTIAL IESA COPYRIGHT
Component SWOTGPON consists of both hardware and software. With regard to hardware, there are a large number of PCB manufacturers in India
who supply boards pre-loaded with ICs, resistors, capacitors, optical modules, etc. With over 60 per cent of BoM entirely imported,domestic manufacturing of the products does not make for a viable business proposition as the volume demand is heavily skewed.
On the other hand, large volume orders that are fulfilled by the Chinese and Taiwanese companies allow them to price their
product at a much lesser value due to economies of scale. Sourcing of power supplies is however done in India from companies
such as VMC, Acme Tele, GE Power, etc.
The top 4 components that contribute to majority of the GPON ONT bill of materials (BoM) are:
1. Optical module
2. System on Chip
3. Power supplies
4. Memory
Strategic Conclusions
General:
The GPON technology and its advantages over other competing technologies have overseen its domestic development in the
country. Although the domestically manufactured price points are still higher than imported units, supportive policies like reduced
excise duties for the domestic manufacturers will promote the local industry.
IP development:
India has advanced itself with the design, development and manufacturing of GPON hardware as well as software technology.
With the help of CDOT, the Government undertaking, India has filed 5 Patents and the licenses to use the indigenous technology
to develop the product has been already granted to seven of the domestic telecom equipment manufacturing companies.
Component ecosystem:
Of the top 4 components, the electronic and semiconductor components are entirely imported while the power supplies are sourced
from India. Considering that telecom sector serves critical functionalities, it is desirable that the Indian electronics ecosystem
develop manufacturing competencies in this area to become self-sucient to an extent. This could possibly be achieved through
the setting up of the two semiconductor fabs, possibly devoting capacity towards the manufacturing of electronics components
needed for GPON ONT.
Product manufacturing:
The MSIPS and EMC policies could be taken advantage of to set up a telecom electronics manufacturing cluster near the Bangalore-
Chennai area or in Delhi-NCR region.
Current Limitation Solution to Promote Ecosystem
Market / Value
chain
a. 60% of BoM currently imported.
b. Only assembly done in India; only powersupplies sourced indigenously
CDOT is already building on developing GPONtechnology indigenously. 5 patents have already been
filed and licenses to develop hardware been granted to7 companies. The government has also started variousprograms to use GPON as the base technology like in
National Knowledge Network (NKN), National OpticalFibre Network (NOFN), etc. The upcoming fabs might
also help develop relevant electronics componentmanufacturing competencies.
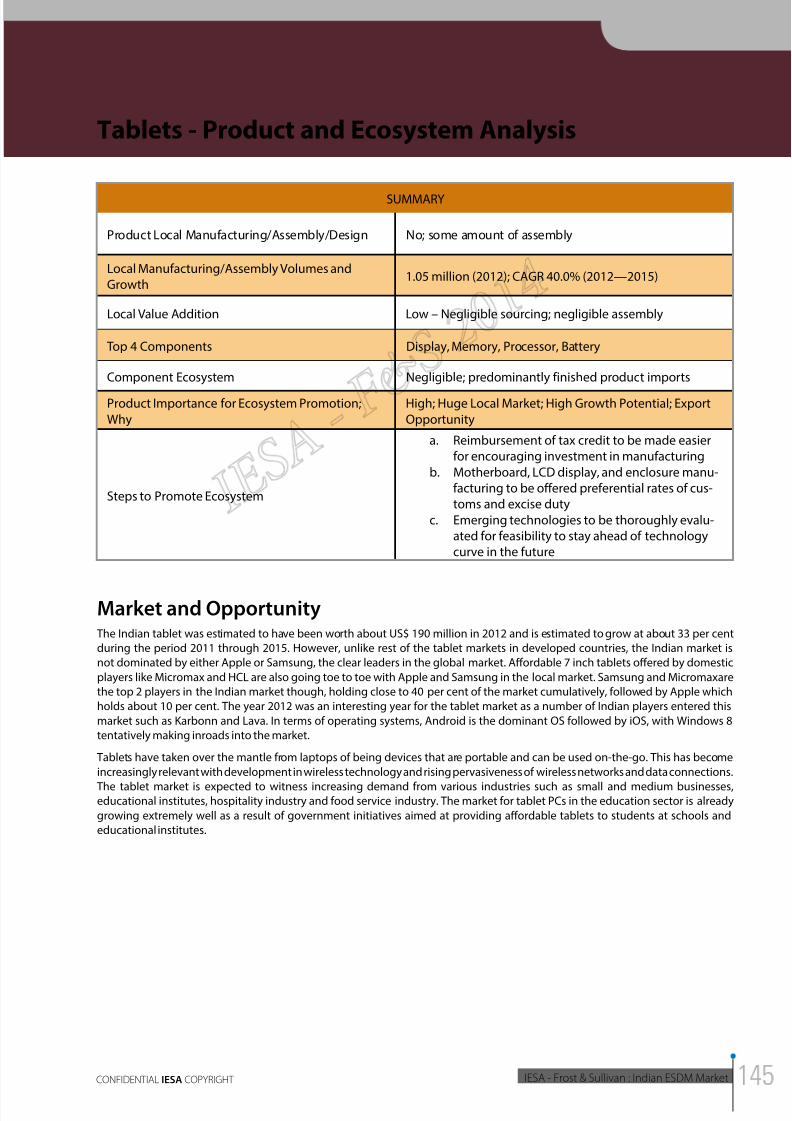
8/11/2019 IESA FS Report Indian ESDM Market
http://slidepdf.com/reader/full/iesa-fs-report-indian-esdm-market 145/172
2014INDIAN ESDM MARKET - ANALYSIS OF
OPPORTUNITY AND GROWTH PLAN
IESA - Frost & Sullivan : Indian ESDM MarketCONFIDENTIAL IESA COPYRIGHT
Tablets - Product and Ecosystem Analysis
SUMMARY
Product Local Manufacturing/Assembly/Design No; some amount of assembly
Local Manufacturing/Assembly Volumes andGrowth
1.05 million (2012); CAGR 40.0% (2012—2015)
Local Value Addition Low – Negligible sourcing; negligible assembly
Top 4 Components Display, Memory, Processor, Battery
Component Ecosystem Negligible; predominantly finished product imports
Product Importance for Ecosystem Promotion;
Why
High; Huge Local Market; High Growth Potential; Export
Opportunity
Steps to Promote Ecosystem
a. Reimbursement of tax credit to be made easierfor encouraging investment in manufacturing
b. Motherboard, LCD display, and enclosure manu-facturing to be offered preferential rates of cus-toms and excise duty
c. Emerging technologies to be thoroughly evalu-ated for feasibility to stay ahead of technologycurve in the future
Market and Opportunity The Indian tablet was estimated to have been worth about US$ 190 million in 2012 and is estimated to grow at about 33 per cent
during the period 2011 through 2015. However, unlike rest of the tablet markets in developed countries, the Indian market is
not dominated by either Apple or Samsung, the clear leaders in the global market. Affordable 7 inch tablets offered by domestic
players like Micromax and HCL are also going toe to toe with Apple and Samsung in the local market. Samsung and Micromaxare
the top 2 players in the Indian market though, holding close to 40 per cent of the market cumulatively, followed by Apple which
holds about 10 per cent. The year 2012 was an interesting year for the tablet market as a number of Indian players entered this
market such as Karbonn and Lava. In terms of operating systems, Android is the dominant OS followed by iOS, with Windows 8
tentatively making inroads into the market.
Tablets have taken over the mantle from laptops of being devices that are portable and can be used on-the-go. This has become
increasingly relevant with development in wireless technology and rising pervasiveness of wireless networks and data connections.
The tablet market is expected to witness increasing demand from various industries such as small and medium businesses,educational institutes, hospitality industry and food service industry. The market for tablet PCs in the education sector is already
growing extremely well as a result of government initiatives aimed at providing affordable tablets to students at schools and
educational institutes.
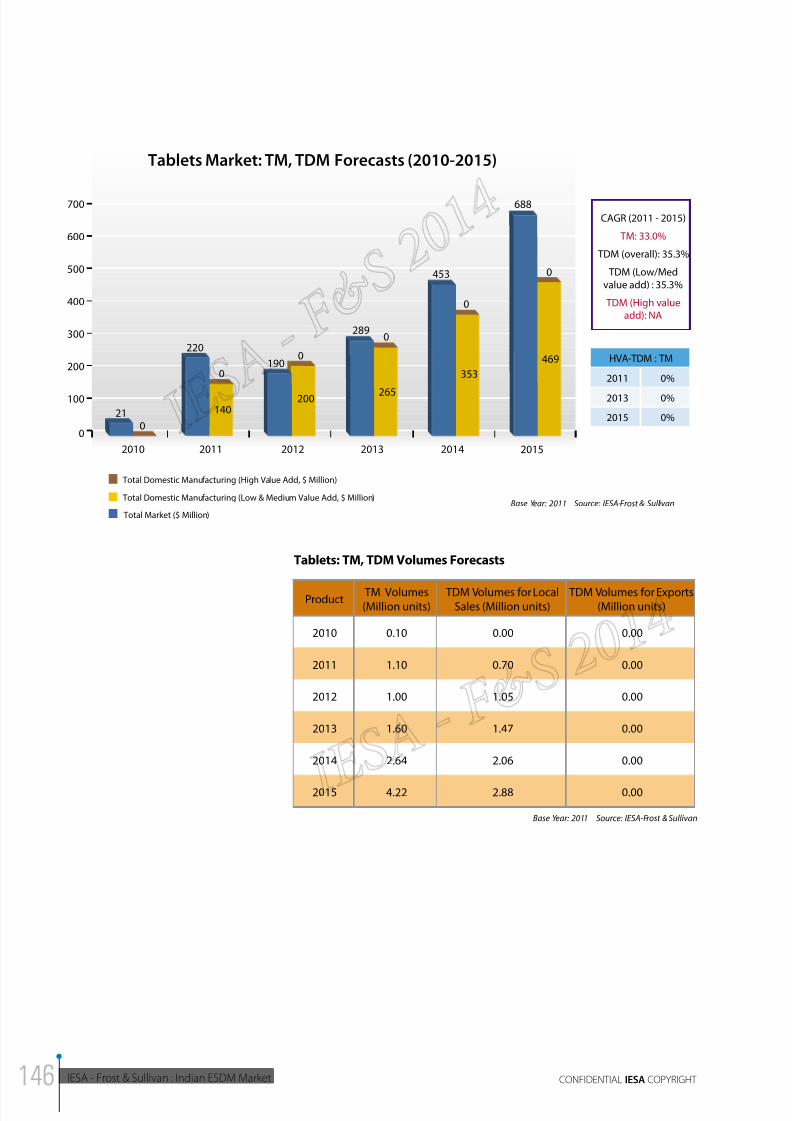
8/11/2019 IESA FS Report Indian ESDM Market
http://slidepdf.com/reader/full/iesa-fs-report-indian-esdm-market 146/172
IESA - Frost & Sullivan : Indian ESDM Market CONFIDENTIAL IESA COPYRIGHT
688
0
0
100
200
300
400
500
600
700
20112010 2012 2013 2014 2015
Tablets Market: TM, TDM Forecasts (2010-2015)
HVA-TDM : TM
2011
2013
2015
0%
0%
0%
Total Market ($ Million)
Total Domestic Manufacturing (High Value Add, $ Million)
Total Domestic Manufacturing (Low & Medium Value Add, $ Million)Base Year: 2011 Source: IESA-Frost & Sullivan
CAGR (2011 - 2015)
TM: 33.0%
TDM (overall): 35.3%
TDM (Low/Med
value add) : 35.3%
TDM (High valueadd): NA
469
353
0
453
2890
265
1900
200140
0
220
021
Tablets: TM, TDM Volumes Forecasts
Product TM Volumes(Million units)
TDM Volumes for LocalSales (Million units)
TDM Volumes for Exports(Million units)
2010 0.10 0.00 0.00
2011 1.10 0.70 0.00
2012 1.00 1.05 0.00
2013 1.60 1.47 0.00
2014 2.64 2.06 0.00
2015 4.22 2.88 0.00
Base Year: 2011 Source: IESA-Frost & Sullivan
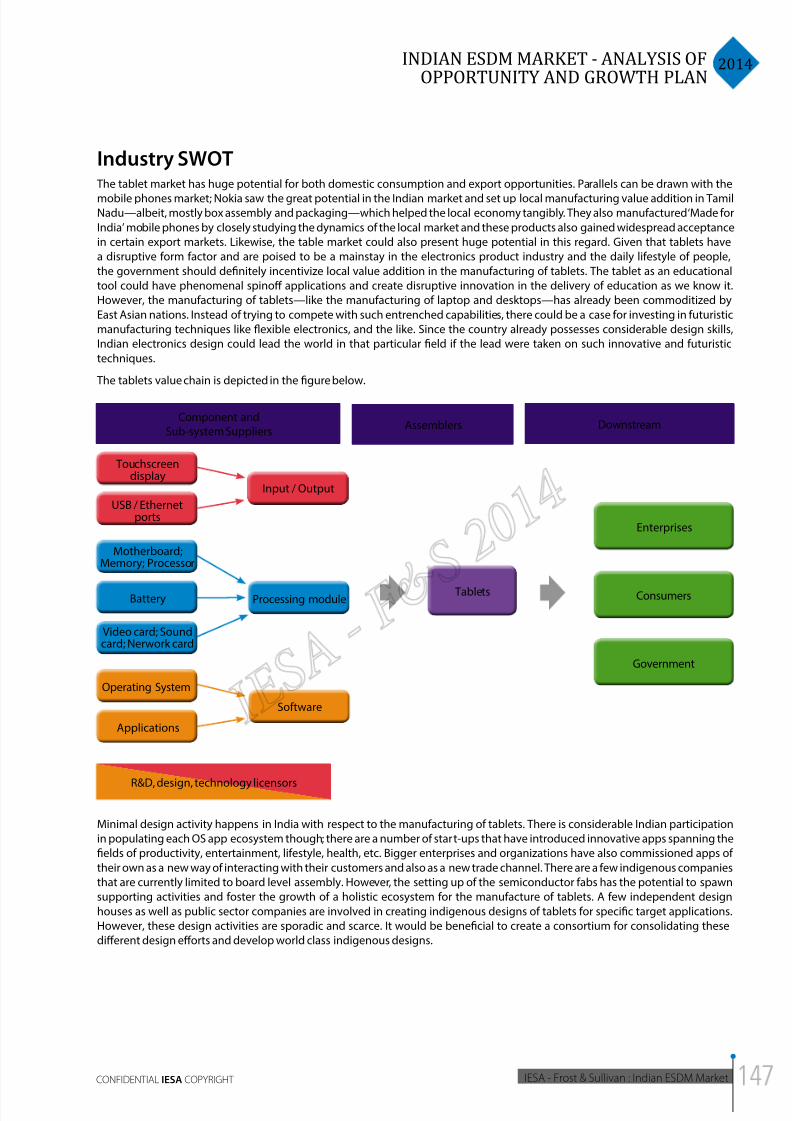
8/11/2019 IESA FS Report Indian ESDM Market
http://slidepdf.com/reader/full/iesa-fs-report-indian-esdm-market 147/172
2014INDIAN ESDM MARKET - ANALYSIS OF
OPPORTUNITY AND GROWTH PLAN
IESA - Frost & Sullivan : Indian ESDM MarketCONFIDENTIAL IESA COPYRIGHT
Industry SWOT The tablet market has huge potential for both domestic consumption and export opportunities. Parallels can be drawn with the
mobile phones market; Nokia saw the great potential in the Indian market and set up local manufacturing value addition in TamilNadu—albeit, mostly box assembly and packaging—which helped the local economy tangibly. They also manufactured ‘Made for
India’ mobile phones by closely studying the dynamics of the local market and these products also gained widespread acceptance
in certain export markets. Likewise, the table market could also present huge potential in this regard. Given that tablets have
a disruptive form factor and are poised to be a mainstay in the electronics product industry and the daily lifestyle of people,
the government should definitely incentivize local value addition in the manufacturing of tablets. The tablet as an educational
tool could have phenomenal spinoff applications and create disruptive innovation in the delivery of education as we know it.
However, the manufacturing of tablets—like the manufacturing of laptop and desktops—has already been commoditized by
East Asian nations. Instead of trying to compete with such entrenched capabilities, there could be a case for investing in futuristic
manufacturing techniques like flexible electronics, and the like. Since the country already possesses considerable design skills,
Indian electronics design could lead the world in that particular field if the lead were taken on such innovative and futuristic
techniques.
The tablets value chain is depicted in the figure below.
Component andSub-system Suppliers
Touchscreendisplay
USB / Ethernetports
Input / Output
Processing module Tablets Consumers
Enterprises
Government
Software
Motherboard;Memory; Processor
Battery
Video card; Soundcard; Nerwork card
Operating System
Applications
Assemblers Downstream
R&D, design, technology licensors
Minimal design activity happens in India with respect to the manufacturing of tablets. There is considerable Indian participation
in populating each OS app ecosystem though; there are a number of start-ups that have introduced innovative apps spanning the
fields of productivity, entertainment, lifestyle, health, etc. Bigger enterprises and organizations have also commissioned apps of
their own as a new way of interacting with their customers and also as a new trade channel. There are a few indigenous companies
that are currently limited to board level assembly. However, the setting up of the semiconductor fabs has the potential to spawn
supporting activities and foster the growth of a holistic ecosystem for the manufacture of tablets. A few independent design
houses as well as public sector companies are involved in creating indigenous designs of tablets for specific target applications.
However, these design activities are sporadic and scarce. It would be beneficial to create a consortium for consolidating these
different design efforts and develop world class indigenous designs.
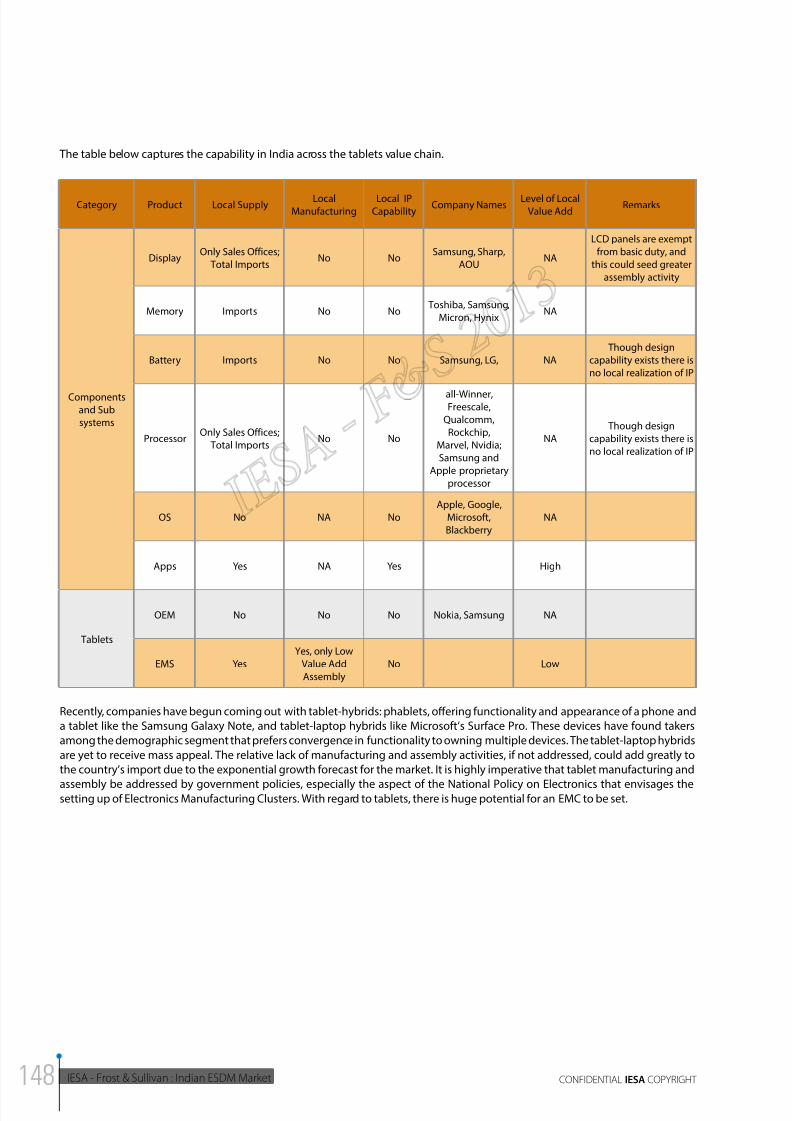
8/11/2019 IESA FS Report Indian ESDM Market
http://slidepdf.com/reader/full/iesa-fs-report-indian-esdm-market 148/172
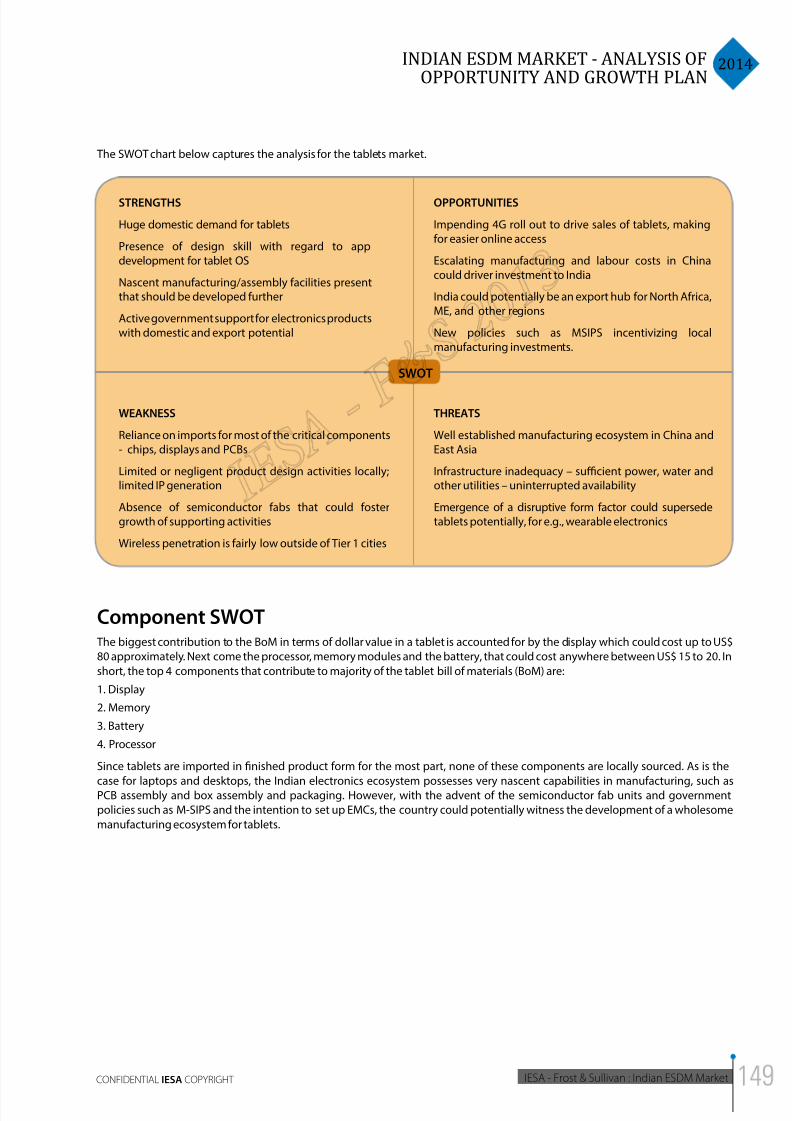
8/11/2019 IESA FS Report Indian ESDM Market
http://slidepdf.com/reader/full/iesa-fs-report-indian-esdm-market 149/172
2014INDIAN ESDM MARKET - ANALYSIS OF
OPPORTUNITY AND GROWTH PLAN
IESA - Frost & Sullivan : Indian ESDM MarketCONFIDENTIAL IESA COPYRIGHT
The SWOT chart below captures the analysis for the tablets market.
STRENGTHS
Huge domestic demand for tablets
Presence of design skill with regard to appdevelopment for tablet OS
Nascent manufacturing/assembly facilities presentthat should be developed further
Active government support for electronics productswith domestic and export potential
OPPORTUNITIES
Impending 4G roll out to drive sales of tablets, makingfor easier online access
Escalating manufacturing and labour costs in Chinacould driver investment to India
India could potentially be an export hub for North Africa,ME, and other regions
New policies such as MSIPS incentivizing localmanufacturing investments.
WEAKNESS
Reliance on imports for most of the critical components- chips, displays and PCBs
Limited or negligent product design activities locally;limited IP generation
Absence of semiconductor fabs that could fostergrowth of supporting activities
Wireless penetration is fairly low outside of Tier 1 cities
THREATS
Well established manufacturing ecosystem in China andEast Asia
Infrastructure inadequacy – sucient power, water andother utilities – uninterrupted availability
Emergence of a disruptive form factor could supersedetablets potentially, for e.g., wearable electronics
SWOT
Component SWOT The biggest contribution to the BoM in terms of dollar value in a tablet is accounted for by the display which could cost up to US$
80 approximately. Next come the processor, memory modules and the battery, that could cost anywhere between US$ 15 to 20. In
short, the top 4 components that contribute to majority of the tablet bill of materials (BoM) are:
1. Display
2. Memory
3. Battery
4. Processor
Since tablets are imported in finished product form for the most part, none of these components are locally sourced. As is the
case for laptops and desktops, the Indian electronics ecosystem possesses very nascent capabilities in manufacturing, such asPCB assembly and box assembly and packaging. However, with the advent of the semiconductor fab units and government
policies such as M-SIPS and the intention to set up EMCs, the country could potentially witness the development of a wholesome
manufacturing ecosystem for tablets.
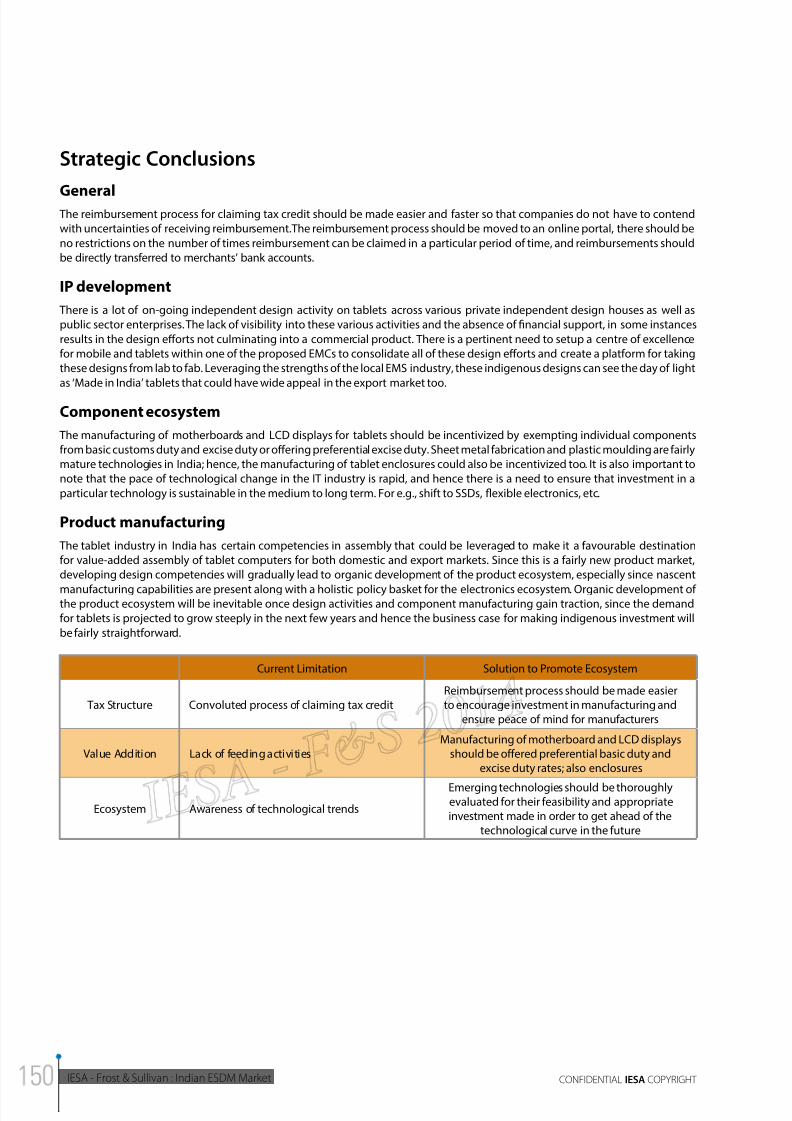
8/11/2019 IESA FS Report Indian ESDM Market
http://slidepdf.com/reader/full/iesa-fs-report-indian-esdm-market 150/172
IESA - Frost & Sullivan : Indian ESDM Market CONFIDENTIAL IESA COPYRIGHT
Strategic Conclusions
General The reimbursement process for claiming tax credit should be made easier and faster so that companies do not have to contend
with uncertainties of receiving reimbursement.The reimbursement process should be moved to an online portal, there should be
no restrictions on the number of times reimbursement can be claimed in a particular period of time, and reimbursements should
be directly transferred to merchants’ bank accounts.
IP development
There is a lot of on-going independent design activity on tablets across various private independent design houses as well as
public sector enterprises. The lack of visibility into these various activities and the absence of financial support, in some instances
results in the design efforts not culminating into a commercial product. There is a pertinent need to setup a centre of excellence
for mobile and tablets within one of the proposed EMCs to consolidate all of these design efforts and create a platform for taking
these designs from lab to fab. Leveraging the strengths of the local EMS industry, these indigenous designs can see the day of light
as ‘Made in India’ tablets that could have wide appeal in the export market too.
Component ecosystem
The manufacturing of motherboards and LCD displays for tablets should be incentivized by exempting individual components
from basic customs duty and excise duty or offering preferential excise duty. Sheet metal fabrication and plastic moulding are fairly
mature technologies in India; hence, the manufacturing of tablet enclosures could also be incentivized too. It is also important to
note that the pace of technological change in the IT industry is rapid, and hence there is a need to ensure that investment in a
particular technology is sustainable in the medium to long term. For e.g., shift to SSDs, flexible electronics, etc.
Product manufacturing
The tablet industry in India has certain competencies in assembly that could be leveraged to make it a favourable destination
for value-added assembly of tablet computers for both domestic and export markets. Since this is a fairly new product market,
developing design competencies will gradually lead to organic development of the product ecosystem, especially since nascent
manufacturing capabilities are present along with a holistic policy basket for the electronics ecosystem. Organic development ofthe product ecosystem will be inevitable once design activities and component manufacturing gain traction, since the demand
for tablets is projected to grow steeply in the next few years and hence the business case for making indigenous investment will
be fairly straightforward.
Current Limitation Solution to Promote Ecosystem
Tax Structure Convoluted process of claiming tax creditReimbursement process should be made easierto encourage investment in manufacturing and
ensure peace of mind for manufacturers
Value Addition Lack of feeding activitiesManufacturing of motherboard and LCD displays
should be offered preferential basic duty andexcise duty rates; also enclosures
Ecosystem Awareness of technological trends
Emerging technologies should be thoroughlyevaluated for their feasibility and appropriateinvestment made in order to get ahead of the
technological curve in the future
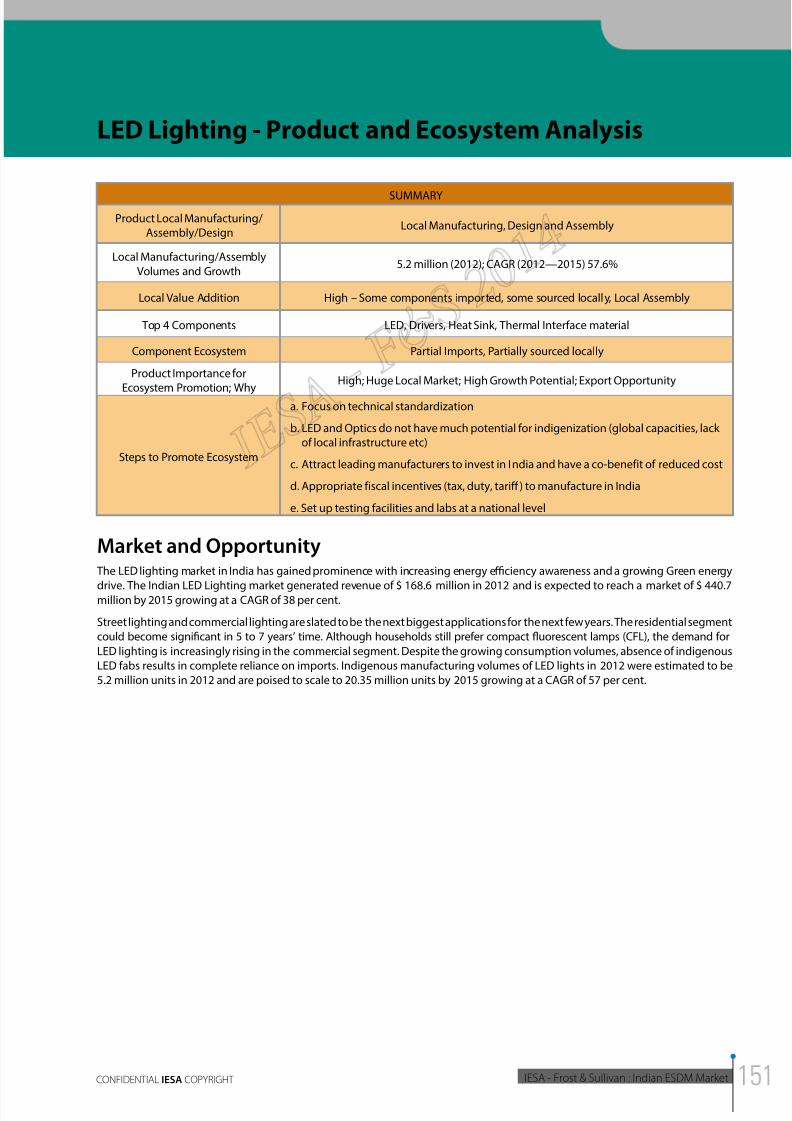
8/11/2019 IESA FS Report Indian ESDM Market
http://slidepdf.com/reader/full/iesa-fs-report-indian-esdm-market 151/172
2014INDIAN ESDM MARKET - ANALYSIS OF
OPPORTUNITY AND GROWTH PLAN
IESA - Frost & Sullivan : Indian ESDM MarketCONFIDENTIAL IESA COPYRIGHT
SUMMARY
Product Local Manufacturing/Assembly/Design
Local Manufacturing, Design and Assembly
Local Manufacturing/Assembly
Volumes and Growth5.2 million (2012); CAGR (2012—2015) 57.6%
Local Value Addition High – Some components imported, some sourced locally, Local Assembly
Top 4 Components LED, Drivers, Heat Sink, Thermal Interface material
Component Ecosystem Partial Imports, Partially sourced locally
Product Importance for
Ecosystem Promotion; Why
High; Huge Local Market; High Growth Potential; Export Opportunity
Steps to Promote Ecosystem
a. Focus on technical standardization
b. LED and Optics do not have much potential for indigenization (global capacities, lackof local infrastructure etc)
c. Attract leading manufacturers to invest in India and have a co-benefit of reduced cost
d. Appropriate fiscal incentives (tax, duty, tariff ) to manufacture in India
e. Set up testing facilities and labs at a national level
LED Lighting - Product and Ecosystem Analysis
Market and Opportunity The LED lighting market in India has gained prominence with increasing energy eciency awareness and a growing Green energy
drive. The Indian LED Lighting market generated revenue of $ 168.6 million in 2012 and is expected to reach a market of $ 440.7million by 2015 growing at a CAGR of 38 per cent.
Street lighting and commercial lighting are slated to be the next biggest applications for the next few years. The residential segment
could become significant in 5 to 7 years’ time. Although households still prefer compact fluorescent lamps (CFL), the demand for
LED lighting is increasingly rising in the commercial segment. Despite the growing consumption volumes, absence of indigenous
LED fabs results in complete reliance on imports. Indigenous manufacturing volumes of LED lights in 2012 were estimated to be
5.2 million units in 2012 and are poised to scale to 20.35 million units by 2015 growing at a CAGR of 57 per cent.
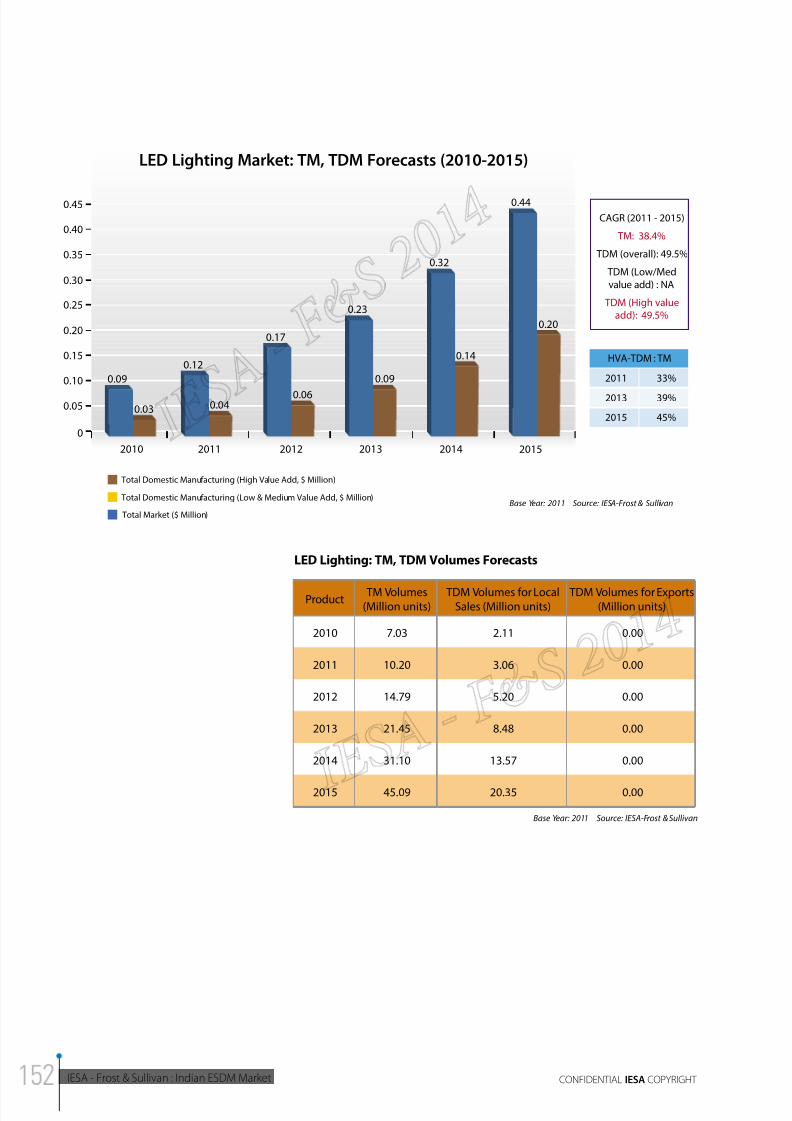
8/11/2019 IESA FS Report Indian ESDM Market
http://slidepdf.com/reader/full/iesa-fs-report-indian-esdm-market 152/172
IESA - Frost & Sullivan : Indian ESDM Market CONFIDENTIAL IESA COPYRIGHT
0.44
0
0.05
0.15
0.10
0.25
0.20
0.45
0.30
0.35
0.40
20112010 2012 2013 2014 2015
LED Lighting Market: TM, TDM Forecasts (2010-2015)
HVA-TDM : TM
2011
2013
2015
33%
39%
45%
Total Market ($ Million)
Total Domestic Manufacturing (High Value Add, $ Million)
Total Domestic Manufacturing (Low & Medium Value Add, $ Million)Base Year: 2011 Source: IESA-Frost & Sullivan
CAGR (2011 - 2015)
TM: 38.4%
TDM (overall): 49.5%
TDM (Low/Med
value add) : NA
TDM (High valueadd): 49.5%
0.20
0.32
0.23
0.09
0.17
0.12
0.09
0.03 0.040.06
0.14
LED Lighting: TM, TDM Volumes Forecasts
Product TM Volumes(Million units)
TDM Volumes for LocalSales (Million units)
TDM Volumes for Exports(Million units)
2010 7.03 2.11 0.00
2011 10.20 3.06 0.00
2012 14.79 5.20 0.00
2013 21.45 8.48 0.00
2014 31.10 13.57 0.00
2015 45.09 20.35 0.00
Base Year: 2011 Source: IESA-Frost & Sullivan
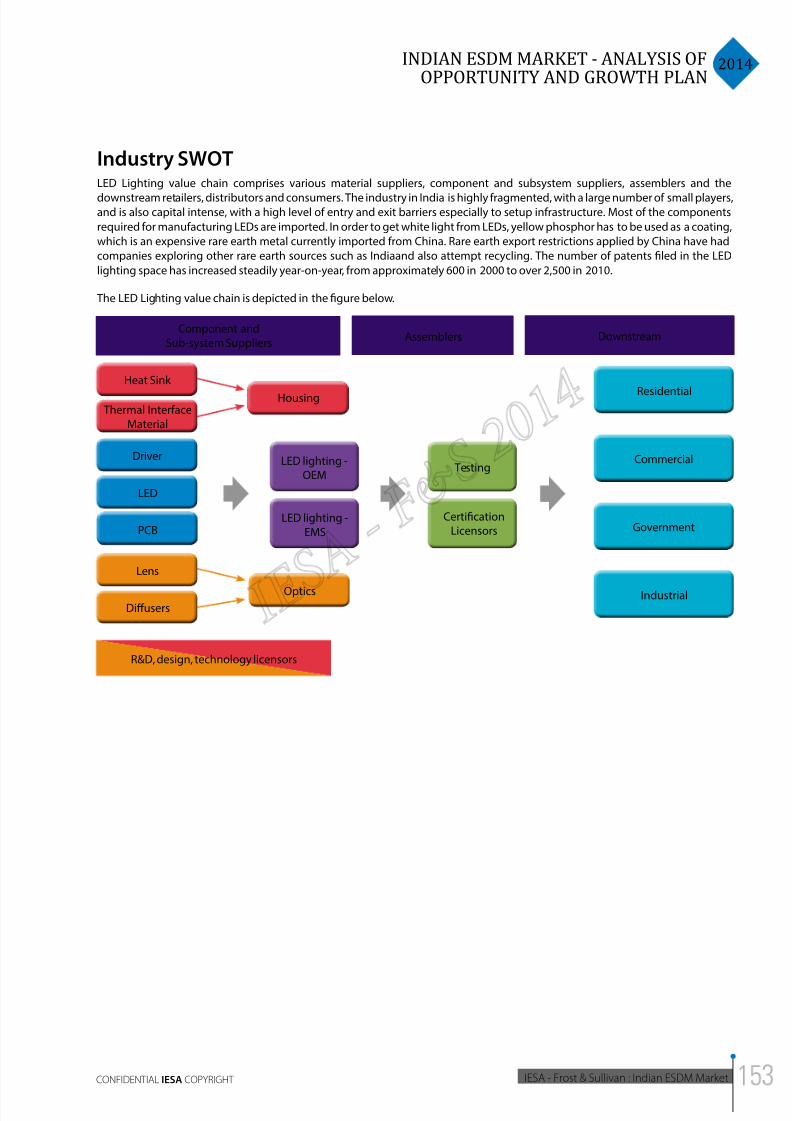
8/11/2019 IESA FS Report Indian ESDM Market
http://slidepdf.com/reader/full/iesa-fs-report-indian-esdm-market 153/172
2014INDIAN ESDM MARKET - ANALYSIS OF
OPPORTUNITY AND GROWTH PLAN
IESA - Frost & Sullivan : Indian ESDM MarketCONFIDENTIAL IESA COPYRIGHT
Industry SWOTLED Lighting value chain comprises various material suppliers, component and subsystem suppliers, assemblers and the
downstream retailers, distributors and consumers. The industry in India is highly fragmented, with a large number of small players,and is also capital intense, with a high level of entry and exit barriers especially to setup infrastructure. Most of the components
required for manufacturing LEDs are imported. In order to get white light from LEDs, yellow phosphor has to be used as a coating,
which is an expensive rare earth metal currently imported from China. Rare earth export restrictions applied by China have had
companies exploring other rare earth sources such as Indiaand also attempt recycling. The number of patents filed in the LED
lighting space has increased steadily year-on-year, from approximately 600 in 2000 to over 2,500 in 2010.
Component andSub-system Suppliers
Heat Sink
Thermal InterfaceMaterial
Housing
TestingLED lighting -
OEM
CertificationLicensors
LED lighting -EMS
Commercial
Residential
Government
IndustrialOptics
Driver
LED
PCB
Lens
Diffusers
Assemblers Downstream
R&D, design, technology licensors
The LED Lighting value chain is depicted in the figure below.
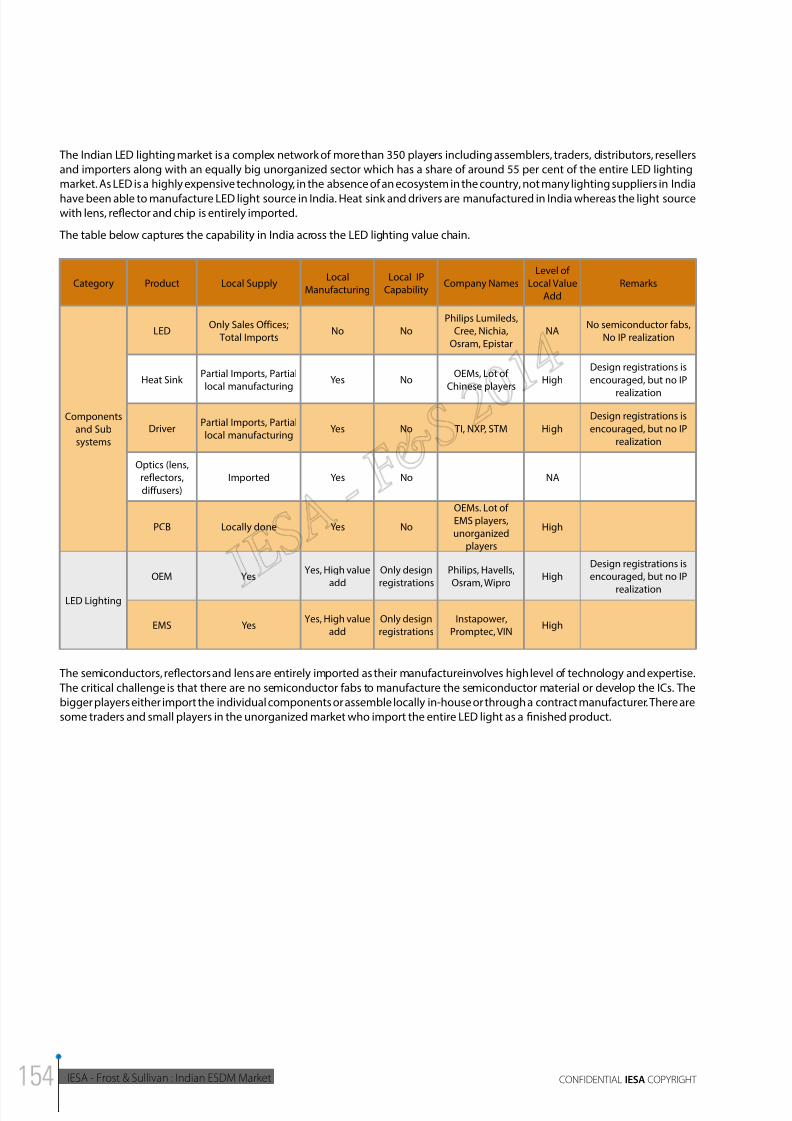
8/11/2019 IESA FS Report Indian ESDM Market
http://slidepdf.com/reader/full/iesa-fs-report-indian-esdm-market 154/172
IESA - Frost & Sullivan : Indian ESDM Market CONFIDENTIAL IESA COPYRIGHT
The Indian LED lighting market is a complex network of more than 350 players including assemblers, traders, distributors, resellers
and importers along with an equally big unorganized sector which has a share of around 55 per cent of the entire LED lighting
market. As LED is a highly expensive technology, in the absence of an ecosystem in the country, not many lighting suppliers in India
have been able to manufacture LED light source in India. Heat sink and drivers are manufactured in India whereas the light sourcewith lens, reflector and chip is entirely imported.
The table below captures the capability in India across the LED lighting value chain.
Category Product Local SupplyLocal
Manufacturing
Local IP
CapabilityCompany Names
Level of
Local Value
Add
Remarks
Components
and Sub
systems
LEDOnly Sales Offices;
Total ImportsNo No
Philips Lumileds,
Cree, Nichia,
Osram, Epistar
NANo semiconductor fabs,
No IP realization
Heat Sink Partial Imports, Partial
local manufacturingYes No
OEMs, Lot of
Chinese playersHigh
Design registrations is
encouraged, but no IP
realization
DriverPartial Imports, Partial
local manufacturingYes No TI, NXP, STM High
Design registrations is
encouraged, but no IP
realization
Optics (lens,
reflectors,
diffusers)
Imported Yes No NA
PCB Locally done Yes No
OEMs. Lot of
EMS players,
unorganized
players
High
LED Lighting
OEM YesYes, High value
add
Only design
registrations
Philips, Havells,
Osram, WiproHigh
Design registrations is
encouraged, but no IP
realization
EMS YesYes, High value
add
Only design
registrations
Instapower,
Promptec, VINHigh
The semiconductors, reflectors and lens are entirely imported as their manufactureinvolves high level of technology and expertise.
The critical challenge is that there are no semiconductor fabs to manufacture the semiconductor material or develop the ICs. The
bigger players either import the individual components or assemble locally in-house or through a contract manufacturer. There are
some traders and small players in the unorganized market who import the entire LED light as a finished product.
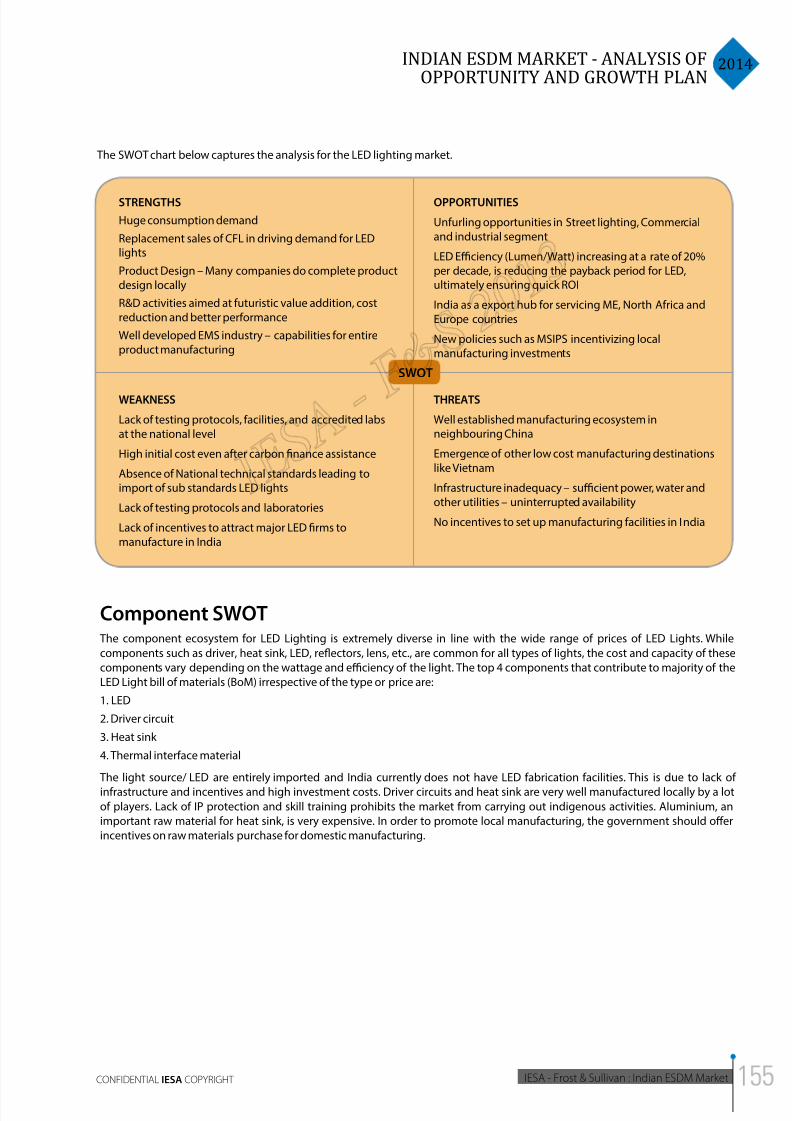
8/11/2019 IESA FS Report Indian ESDM Market
http://slidepdf.com/reader/full/iesa-fs-report-indian-esdm-market 155/172
2014INDIAN ESDM MARKET - ANALYSIS OF
OPPORTUNITY AND GROWTH PLAN
IESA - Frost & Sullivan : Indian ESDM MarketCONFIDENTIAL IESA COPYRIGHT
STRENGTHS
Huge consumption demand
Replacement sales of CFL in driving demand for LEDlights
Product Design – Many companies do complete productdesign locally
R&D activities aimed at futuristic value addition, costreduction and better performance
Well developed EMS industry – capabilities for entireproduct manufacturing
OPPORTUNITIES
Unfurling opportunities in Street lighting, Commercialand industrial segment
LED Eciency (Lumen/Watt) increasing at a rate of 20%per decade, is reducing the payback period for LED,ultimately ensuring quick ROI
India as a export hub for servicing ME, North Africa andEurope countries
New policies such as MSIPS incentivizing localmanufacturing investments
WEAKNESS
Lack of testing protocols, facilities, and accredited labsat the national level
High initial cost even after carbon finance assistance
Absence of National technical standards leading toimport of sub standards LED lights
Lack of testing protocols and laboratories
Lack of incentives to attract major LED firms tomanufacture in India
THREATS
Well established manufacturing ecosystem inneighbouring China
Emergence of other low cost manufacturing destinationslike Vietnam
Infrastructure inadequacy – sucient power, water andother utilities – uninterrupted availability
No incentives to set up manufacturing facilities in India
SWOT
The SWOT chart below captures the analysis for the LED lighting market.
Component SWOT The component ecosystem for LED Lighting is extremely diverse in line with the wide range of prices of LED Lights. While
components such as driver, heat sink, LED, reflectors, lens, etc., are common for all types of lights, the cost and capacity of these
components vary depending on the wattage and eciency of the light. The top 4 components that contribute to majority of the
LED Light bill of materials (BoM) irrespective of the type or price are:
1. LED
2. Driver circuit
3. Heat sink
4. Thermal interface material
The light source/ LED are entirely imported and India currently does not have LED fabrication facilities. This is due to lack of
infrastructure and incentives and high investment costs. Driver circuits and heat sink are very well manufactured locally by a lot
of players. Lack of IP protection and skill training prohibits the market from carrying out indigenous activities. Aluminium, an
important raw material for heat sink, is very expensive. In order to promote local manufacturing, the government should offer
incentives on raw materials purchase for domestic manufacturing.
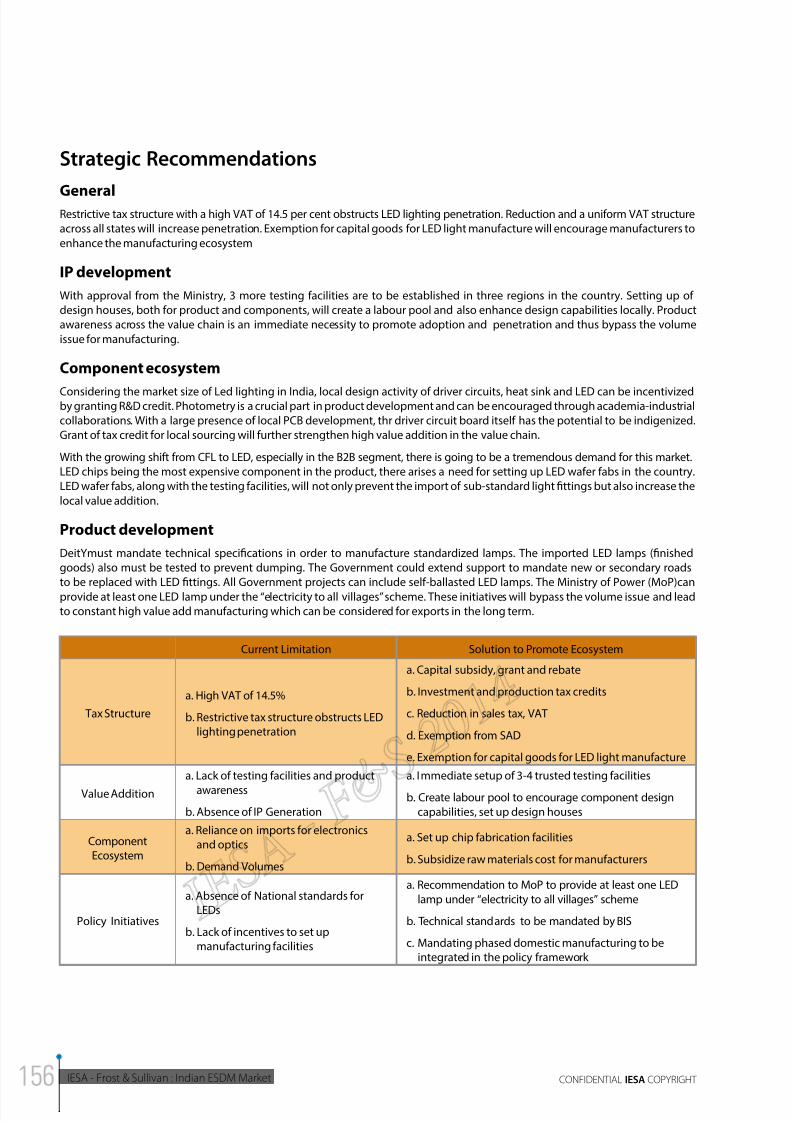
8/11/2019 IESA FS Report Indian ESDM Market
http://slidepdf.com/reader/full/iesa-fs-report-indian-esdm-market 156/172
IESA - Frost & Sullivan : Indian ESDM Market CONFIDENTIAL IESA COPYRIGHT
Strategic Recommendations
GeneralRestrictive tax structure with a high VAT of 14.5 per cent obstructs LED lighting penetration. Reduction and a uniform VAT structure
across all states will increase penetration. Exemption for capital goods for LED light manufacture will encourage manufacturers to
enhance the manufacturing ecosystem
IP development
With approval from the Ministry, 3 more testing facilities are to be established in three regions in the country. Setting up of
design houses, both for product and components, will create a labour pool and also enhance design capabilities locally. Product
awareness across the value chain is an immediate necessity to promote adoption and penetration and thus bypass the volume
issue for manufacturing.
Component ecosystem
Considering the market size of Led lighting in India, local design activity of driver circuits, heat sink and LED can be incentivizedby granting R&D credit. Photometry is a crucial part in product development and can be encouraged through academia-industrial
collaborations. With a large presence of local PCB development, thr driver circuit board itself has the potential to be indigenized.
Grant of tax credit for local sourcing will further strengthen high value addition in the value chain.
With the growing shift from CFL to LED, especially in the B2B segment, there is going to be a tremendous demand for this market.
LED chips being the most expensive component in the product, there arises a need for setting up LED wafer fabs in the country.
LED wafer fabs, along with the testing facilities, will not only prevent the import of sub-standard light fittings but also increase the
local value addition.
Product development
DeitYmust mandate technical specifications in order to manufacture standardized lamps. The imported LED lamps (finished
goods) also must be tested to prevent dumping. The Government could extend support to mandate new or secondary roads
to be replaced with LED fittings. All Government projects can include self-ballasted LED lamps. The Ministry of Power (MoP)can
provide at least one LED lamp under the “electricity to all villages” scheme. These initiatives will bypass the volume issue and lead
to constant high value add manufacturing which can be considered for exports in the long term.
Current Limitation Solution to Promote Ecosystem
Tax Structure
a. High VAT of 14.5%
b. Restrictive tax structure obstructs LEDlighting penetration
a. Capital subsidy, grant and rebate
b. Investment and production tax credits
c. Reduction in sales tax, VAT
d. Exemption from SAD
e. Exemption for capital goods for LED light manufacture
Value Addition
a. Lack of testing facilities and product
awareness
b. Absence of IP Generation
a. Immediate setup of 3-4 trusted testing facilities
b. Create labour pool to encourage component design
capabilities, set up design houses
ComponentEcosystem
a. Reliance on imports for electronicsand optics
b. Demand Volumes
a. Set up chip fabrication facilities
b. Subsidize raw materials cost for manufacturers
Policy Initiatives
a. Absence of National standards forLEDs
b. Lack of incentives to set upmanufacturing facilities
a. Recommendation to MoP to provide at least one LED
lamp under “electricity to all villages” scheme
b. Technical standards to be mandated by BIS
c. Mandating phased domestic manufacturing to beintegrated in the policy framework
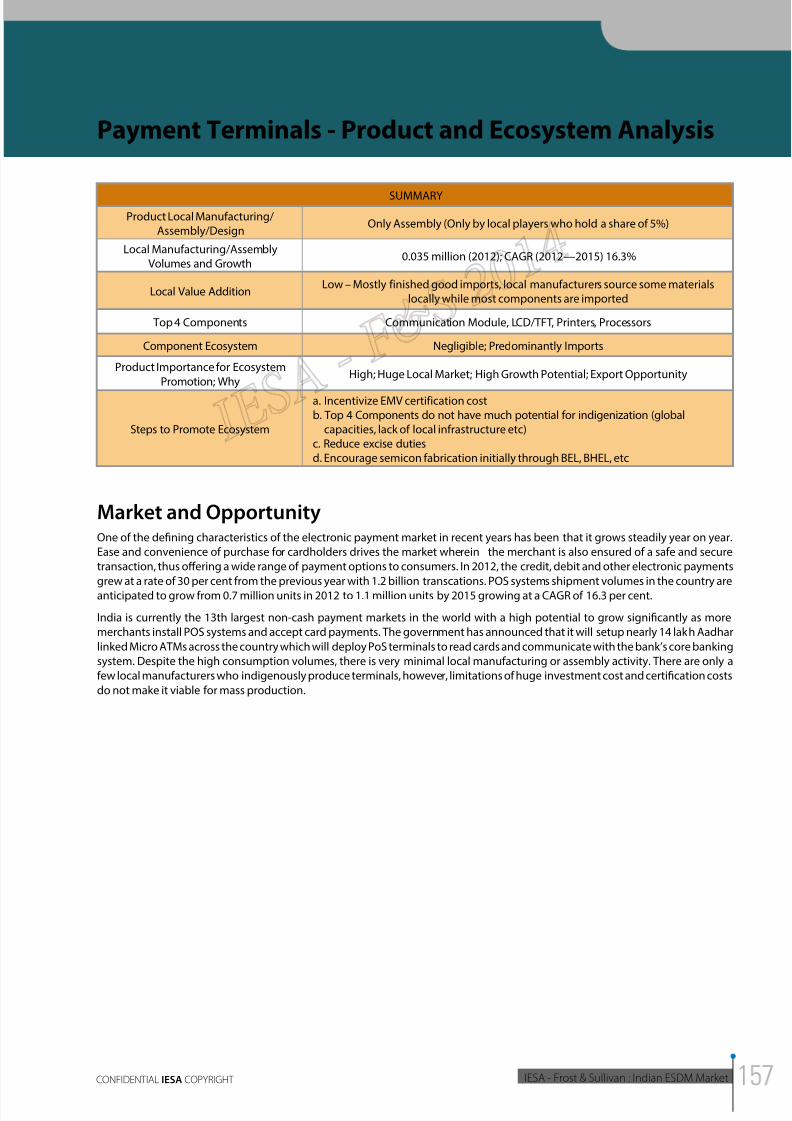
8/11/2019 IESA FS Report Indian ESDM Market
http://slidepdf.com/reader/full/iesa-fs-report-indian-esdm-market 157/172
2014INDIAN ESDM MARKET - ANALYSIS OF
OPPORTUNITY AND GROWTH PLAN
IESA - Frost & Sullivan : Indian ESDM MarketCONFIDENTIAL IESA COPYRIGHT
Payment Terminals - Product and Ecosystem Analysis
SUMMARY
Product Local Manufacturing/Assembly/Design
Only Assembly (Only by local players who hold a share of 5%)
Local Manufacturing/AssemblyVolumes and Growth
0.035 million (2012); CAGR (2012—2015) 16.3%
Local Value AdditionLow – Mostly finished good imports, local manufacturers source some materials
locally while most components are imported
Top 4 Components Communication Module, LCD/TFT, Printers, Processors
Component Ecosystem Negligible; Predominantly Imports
Product Importance for Ecosystem
Promotion; WhyHigh; Huge Local Market; High Growth Potential; Export Opportunity
Steps to Promote Ecosystem
a. Incentivize EMV certification costb. Top 4 Components do not have much potential for indigenization (global
capacities, lack of local infrastructure etc)c. Reduce excise dutiesd. Encourage semicon fabrication initially through BEL, BHEL, etc
Market and OpportunityOne of the defining characteristics of the electronic payment market in recent years has been that it grows steadily year on year.
Ease and convenience of purchase for cardholders drives the market wherein the merchant is also ensured of a safe and secure
transaction, thus offering a wide range of payment options to consumers. In 2012, the credit, debit and other electronic payments
grew at a rate of 30 per cent from the previous year with 1.2 billion transcations. POS systems shipment volumes in the country are
anticipated to grow from 0.7 million units in 2012 to 1.1 million units by 2015 growing at a CAGR of 16.3 per cent.
India is currently the 13th largest non-cash payment markets in the world with a high potential to grow significantly as more
merchants install POS systems and accept card payments. The government has announced that it will setup nearly 14 lakh Aadhar
linked Micro ATMs across the country which will deploy PoS terminals to read cards and communicate with the bank’s core banking
system. Despite the high consumption volumes, there is very minimal local manufacturing or assembly activity. There are only a
few local manufacturers who indigenously produce terminals, however, limitations of huge investment cost and certification costs
do not make it viable for mass production.
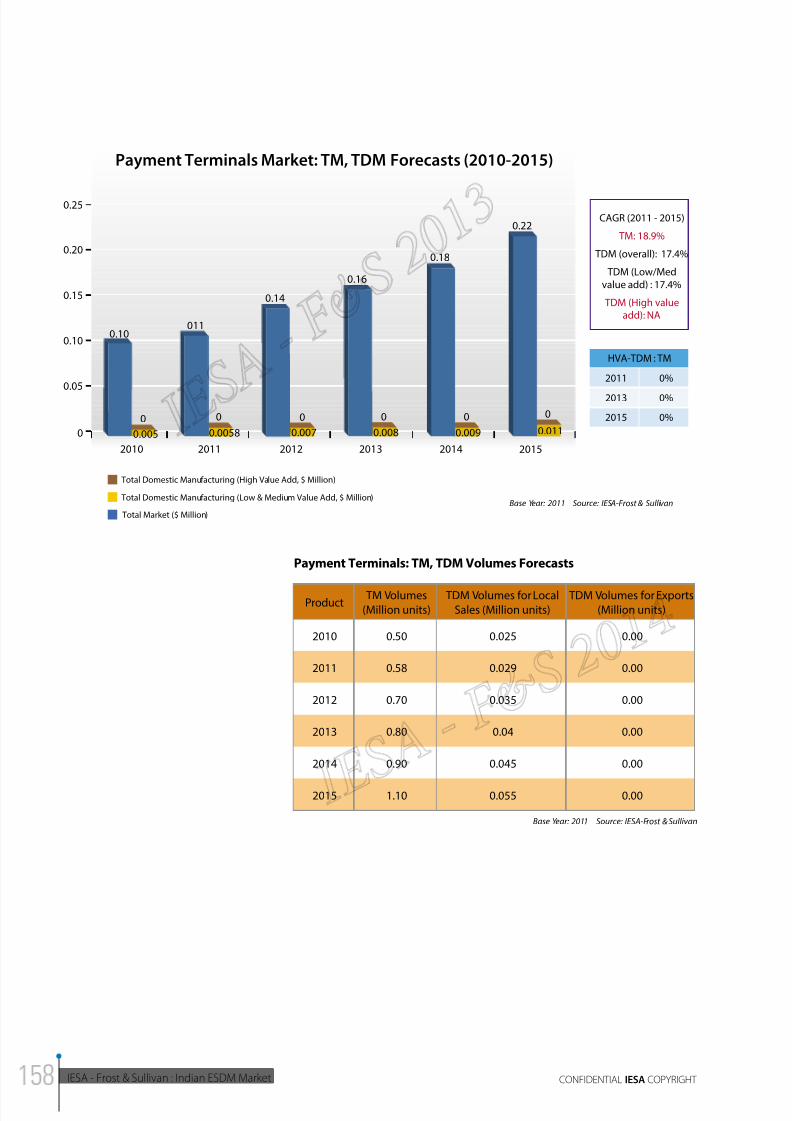
8/11/2019 IESA FS Report Indian ESDM Market
http://slidepdf.com/reader/full/iesa-fs-report-indian-esdm-market 158/172
IESA - Frost & Sullivan : Indian ESDM Market CONFIDENTIAL IESA COPYRIGHT
0.22
0
0
0.05
0.15
0.10
0.25
0.20
20112010 2012 2013 2014 2015
Payment Terminals Market: TM, TDM Forecasts (2010-2015)
HVA-TDM : TM
2011
2013
2015
0%
0%
0%
Total Market ($ Million)
Total Domestic Manufacturing (High Value Add, $ Million)
Total Domestic Manufacturing (Low & Medium Value Add, $ Million)Base Year: 2011 Source: IESA-Frost & Sullivan
CAGR (2011 - 2015)
TM: 18.9%
TDM (overall): 17.4%
TDM (Low/Med
value add) : 17.4%
TDM (High valueadd): NA
0.011
0
0.18
0.16
0
0.008
0.14
00
011
0
0.10
0.0058 0.007 0.0090.005
Payment Terminals: TM, TDM Volumes Forecasts
Product TM Volumes
(Million units)
TDM Volumes for Local
Sales (Million units)
TDM Volumes for Exports
(Million units)
2010 0.50 0.025 0.00
2011 0.58 0.029 0.00
2012 0.70 0.035 0.00
2013 0.80 0.04 0.00
2014 0.90 0.045 0.00
2015 1.10 0.055 0.00
Base Year: 2011 Source: IESA-Frost & Sullivan
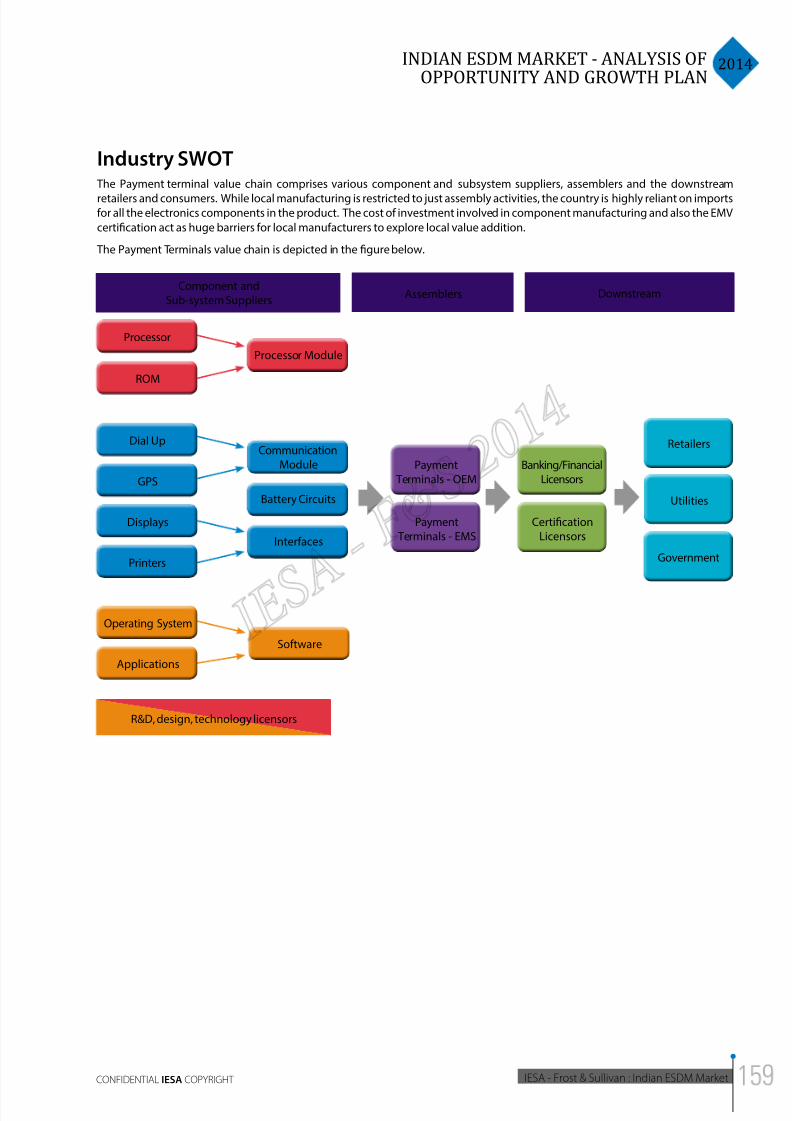
8/11/2019 IESA FS Report Indian ESDM Market
http://slidepdf.com/reader/full/iesa-fs-report-indian-esdm-market 159/172
2014INDIAN ESDM MARKET - ANALYSIS OF
OPPORTUNITY AND GROWTH PLAN
IESA - Frost & Sullivan : Indian ESDM MarketCONFIDENTIAL IESA COPYRIGHT
Industry SWOT The Payment terminal value chain comprises various component and subsystem suppliers, assemblers and the downstream
retailers and consumers. While local manufacturing is restricted to just assembly activities, the country is highly reliant on importsfor all the electronics components in the product. The cost of investment involved in component manufacturing and also the EMV
certification act as huge barriers for local manufacturers to explore local value addition.
The Payment Terminals value chain is depicted in the figure below.
Component andSub-system Suppliers
Processor
ROM
Processor Module
Battery Circuits
Interfaces
CommunicationModule
Software
Dial Up
Printers
Displays
GPS
Operating System
Applications
Assemblers Downstream
Payment Terminals - OEM
Banking/FinancialLicensors
Utilities
Retailers
Payment Terminals - EMS
CertificationLicensors
Government
R&D, design, technology licensors
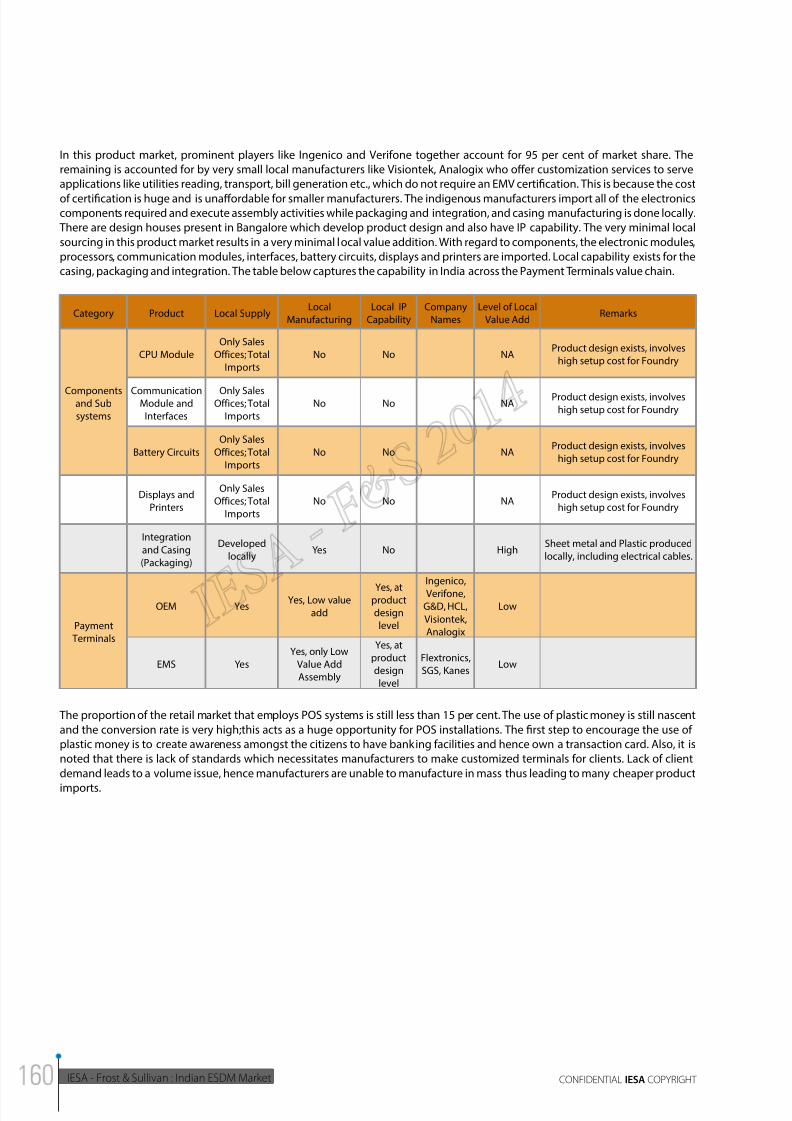
8/11/2019 IESA FS Report Indian ESDM Market
http://slidepdf.com/reader/full/iesa-fs-report-indian-esdm-market 160/172
IESA - Frost & Sullivan : Indian ESDM Market CONFIDENTIAL IESA COPYRIGHT
In this product market, prominent players like Ingenico and Verifone together account for 95 per cent of market share. The
remaining is accounted for by very small local manufacturers like Visiontek, Analogix who offer customization services to serve
applications like utilities reading, transport, bill generation etc., which do not require an EMV certification. This is because the cost
of certification is huge and is unaffordable for smaller manufacturers. The indigenous manufacturers import all of the electronicscomponents required and execute assembly activities while packaging and integration, and casing manufacturing is done locally.
There are design houses present in Bangalore which develop product design and also have IP capability. The very minimal local
sourcing in this product market results in a very minimal local value addition. With regard to components, the electronic modules,
processors, communication modules, interfaces, battery circuits, displays and printers are imported. Local capability exists for the
casing, packaging and integration. The table below captures the capability in India across the Payment Terminals value chain.
Category Product Local SupplyLocal
Manufacturing
Local IP
Capability
Company
Names
Level of Local
Value AddRemarks
Componentsand Sub
systems
CPU Module
Only Sales
Offices; Total
Imports
No No NAProduct design exists, involves
high setup cost for Foundry
CommunicationModule and
Interfaces
Only SalesOffices; Total
Imports
No No NAProduct design exists, involves
high setup cost for Foundry
Battery Circuits
Only Sales
Offices; Total
Imports
No No NAProduct design exists, involves
high setup cost for Foundry
Displays and
Printers
Only Sales
Offices; Total
Imports
No No NAProduct design exists, involves
high setup cost for Foundry
Integration
and Casing
(Packaging)
Developed
locallyYes No High
Sheet metal and Plastic produced
locally, including electrical cables.
Payment
Terminals
OEM YesYes, Low value
add
Yes, atproduct
design
level
Ingenico,
Verifone,
G&D, HCL,
Visiontek,
Analogix
Low
EMS Yes
Yes, only Low
Value Add
Assembly
Yes, at
product
design
level
Flextronics,
SGS, KanesLow
The proportion of the retail market that employs POS systems is still less than 15 per cent. The use of plastic money is still nascent
and the conversion rate is very high;this acts as a huge opportunity for POS installations. The first step to encourage the use of
plastic money is to create awareness amongst the citizens to have banking facilities and hence own a transaction card. Also, it is
noted that there is lack of standards which necessitates manufacturers to make customized terminals for clients. Lack of client
demand leads to a volume issue, hence manufacturers are unable to manufacture in mass thus leading to many cheaper product
imports.
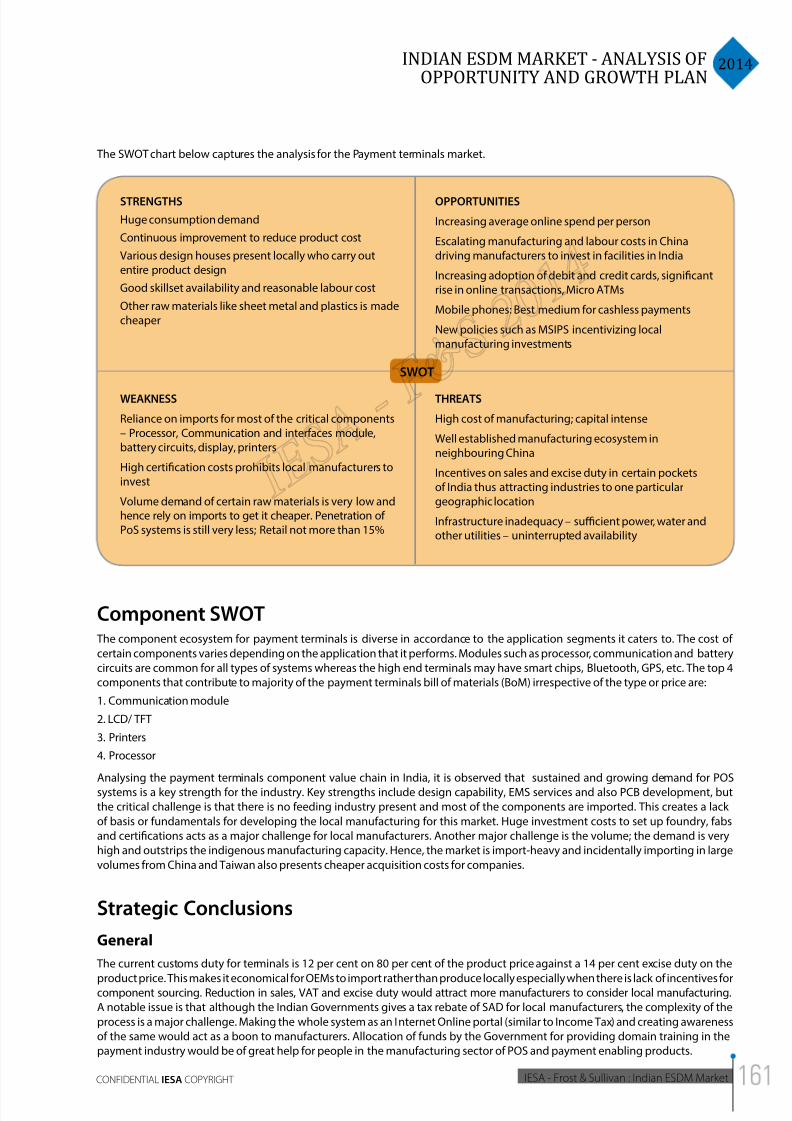
8/11/2019 IESA FS Report Indian ESDM Market
http://slidepdf.com/reader/full/iesa-fs-report-indian-esdm-market 161/172
2014INDIAN ESDM MARKET - ANALYSIS OF
OPPORTUNITY AND GROWTH PLAN
IESA - Frost & Sullivan : Indian ESDM MarketCONFIDENTIAL IESA COPYRIGHT
STRENGTHS
Huge consumption demand
Continuous improvement to reduce product cost
Various design houses present locally who carry outentire product design
Good skillset availability and reasonable labour cost
Other raw materials like sheet metal and plastics is madecheaper
OPPORTUNITIES
Increasing average online spend per person
Escalating manufacturing and labour costs in Chinadriving manufacturers to invest in facilities in India
Increasing adoption of debit and credit cards, significantrise in online transactions, Micro ATMs
Mobile phones: Best medium for cashless payments
New policies such as MSIPS incentivizing localmanufacturing investments
WEAKNESS
Reliance on imports for most of the critical components– Processor, Communication and interfaces module,battery circuits, display, printers
High certification costs prohibits local manufacturers toinvest
Volume demand of certain raw materials is very low andhence rely on imports to get it cheaper. Penetration ofPoS systems is still very less; Retail not more than 15%
THREATS
High cost of manufacturing; capital intense
Well established manufacturing ecosystem inneighbouring China
Incentives on sales and excise duty in certain pocketsof India thus attracting industries to one particulargeographic location
Infrastructure inadequacy – sucient power, water andother utilities – uninterrupted availability
SWOT
Component SWOT The component ecosystem for payment terminals is diverse in accordance to the application segments it caters to. The cost of
certain components varies depending on the application that it performs. Modules such as processor, communication and battery
circuits are common for all types of systems whereas the high end terminals may have smart chips, Bluetooth, GPS, etc. The top 4
components that contribute to majority of the payment terminals bill of materials (BoM) irrespective of the type or price are:
1. Communication module
2. LCD/ TFT
3. Printers
4. Processor
Analysing the payment terminals component value chain in India, it is observed that sustained and growing demand for POS
systems is a key strength for the industry. Key strengths include design capability, EMS services and also PCB development, but
the critical challenge is that there is no feeding industry present and most of the components are imported. This creates a lack
of basis or fundamentals for developing the local manufacturing for this market. Huge investment costs to set up foundry, fabs
and certifications acts as a major challenge for local manufacturers. Another major challenge is the volume; the demand is very
high and outstrips the indigenous manufacturing capacity. Hence, the market is import-heavy and incidentally importing in large
volumes from China and Taiwan also presents cheaper acquisition costs for companies.
The SWOT chart below captures the analysis for the Payment terminals market.
Strategic Conclusions
General
The current customs duty for terminals is 12 per cent on 80 per cent of the product price against a 14 per cent excise duty on the
product price. This makes it economical for OEMs to import rather than produce locally especially when there is lack of incentives forcomponent sourcing. Reduction in sales, VAT and excise duty would attract more manufacturers to consider local manufacturing.
A notable issue is that although the Indian Governments gives a tax rebate of SAD for local manufacturers, the complexity of the
process is a major challenge. Making the whole system as an Internet Online portal (similar to Income Tax) and creating awareness
of the same would act as a boon to manufacturers. Allocation of funds by the Government for providing domain training in the
payment industry would be of great help for people in the manufacturing sector of POS and payment enabling products.
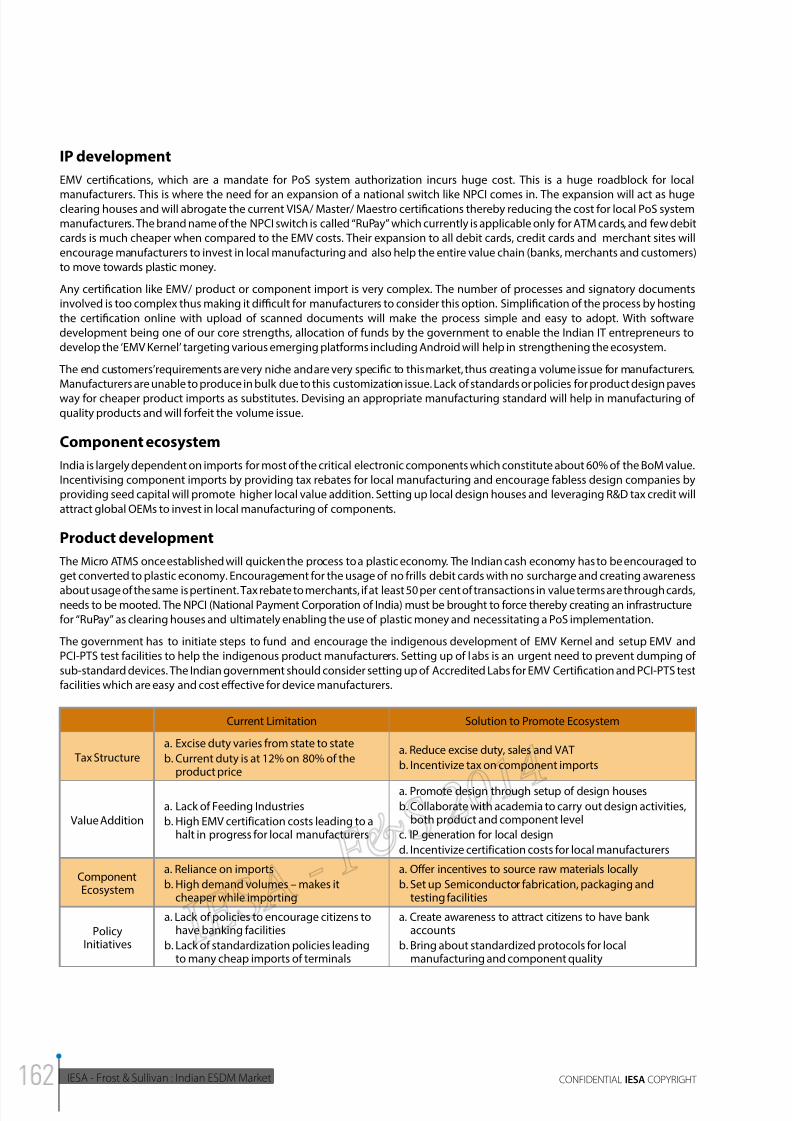
8/11/2019 IESA FS Report Indian ESDM Market
http://slidepdf.com/reader/full/iesa-fs-report-indian-esdm-market 162/172
IESA - Frost & Sullivan : Indian ESDM Market CONFIDENTIAL IESA COPYRIGHT
Current Limitation Solution to Promote Ecosystem
Tax Structurea. Excise duty varies from state to state
b. Current duty is at 12% on 80% of theproduct price
a. Reduce excise duty, sales and VAT
b. Incentivize tax on component imports
Value Additiona. Lack of Feeding Industries
b. High EMV certification costs leading to ahalt in progress for local manufacturers
a. Promote design through setup of design houses
b. Collaborate with academia to carry out design activities,both product and component level
c. IP generation for local design
d. Incentivize certification costs for local manufacturers
ComponentEcosystem
a. Reliance on imports
b. High demand volumes – makes itcheaper while importing
a. Offer incentives to source raw materials locally
b. Set up Semiconductor fabrication, packaging andtesting facilities
PolicyInitiatives
a. Lack of policies to encourage citizens tohave banking facilities
b. Lack of standardization policies leadingto many cheap imports of terminals
a. Create awareness to attract citizens to have bankaccounts
b. Bring about standardized protocols for localmanufacturing and component quality
IP development
EMV certifications, which are a mandate for PoS system authorization incurs huge cost. This is a huge roadblock for local
manufacturers. This is where the need for an expansion of a national switch like NPCI comes in. The expansion will act as hugeclearing houses and will abrogate the current VISA/ Master/ Maestro certifications thereby reducing the cost for local PoS system
manufacturers. The brand name of the NPCI switch is called “RuPay” which currently is applicable only for ATM cards, and few debit
cards is much cheaper when compared to the EMV costs. Their expansion to all debit cards, credit cards and merchant sites will
encourage manufacturers to invest in local manufacturing and also help the entire value chain (banks, merchants and customers)
to move towards plastic money.
Any certification like EMV/ product or component import is very complex. The number of processes and signatory documents
involved is too complex thus making it dicult for manufacturers to consider this option. Simplication of the process by hosting
the certification online with upload of scanned documents will make the process simple and easy to adopt. With software
development being one of our core strengths, allocation of funds by the government to enable the Indian IT entrepreneurs to
develop the ‘EMV Kernel’ targeting various emerging platforms including Android will help in strengthening the ecosystem.
The end customers’ requirements are very niche and are very specific to this market, thus creating a volume issue for manufacturers.
Manufacturers are unable to produce in bulk due to this customization issue. Lack of standards or policies for product design paves
way for cheaper product imports as substitutes. Devising an appropriate manufacturing standard will help in manufacturing of
quality products and will forfeit the volume issue.
Component ecosystem
India is largely dependent on imports for most of the critical electronic components which constitute about 60% of the BoM value.
Incentivising component imports by providing tax rebates for local manufacturing and encourage fabless design companies by
providing seed capital will promote higher local value addition. Setting up local design houses and leveraging R&D tax credit will
attract global OEMs to invest in local manufacturing of components.
Product development
The Micro ATMS once established will quicken the process to a plastic economy. The Indian cash economy has to be encouraged to
get converted to plastic economy. Encouragement for the usage of no frills debit cards with no surcharge and creating awareness
about usage of the same is pertinent. Tax rebate to merchants, if at least 50 per cent of transactions in value terms are through cards,needs to be mooted. The NPCI (National Payment Corporation of India) must be brought to force thereby creating an infrastructure
for “RuPay” as clearing houses and ultimately enabling the use of plastic money and necessitating a PoS implementation.
The government has to initiate steps to fund and encourage the indigenous development of EMV Kernel and setup EMV and
PCI-PTS test facilities to help the indigenous product manufacturers. Setting up of labs is an urgent need to prevent dumping of
sub-standard devices. The Indian government should consider setting up of Accredited Labs for EMV Certification and PCI-PTS test
facilities which are easy and cost effective for device manufacturers.
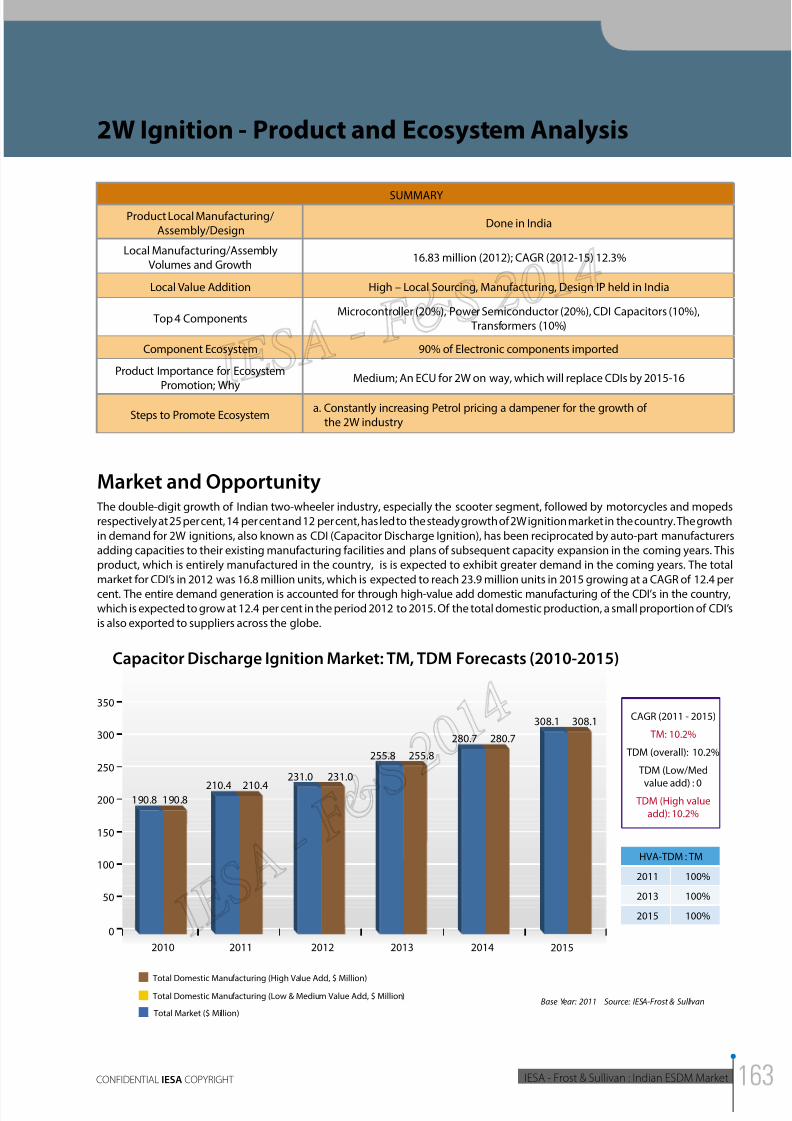
8/11/2019 IESA FS Report Indian ESDM Market
http://slidepdf.com/reader/full/iesa-fs-report-indian-esdm-market 163/172
2014INDIAN ESDM MARKET - ANALYSIS OF
OPPORTUNITY AND GROWTH PLAN
IESA - Frost & Sullivan : Indian ESDM MarketCONFIDENTIAL IESA COPYRIGHT
2W Ignition - Product and Ecosystem Analysis
SUMMARY
Product Local Manufacturing/Assembly/Design
Done in India
Local Manufacturing/AssemblyVolumes and Growth
16.83 million (2012); CAGR (2012-15) 12.3%
Local Value Addition High – Local Sourcing, Manufacturing, Design IP held in India
Top 4 ComponentsMicrocontroller (20%), Power Semiconductor (20%), CDI Capacitors (10%),
Transformers (10%)
Component Ecosystem 90% of Electronic components imported
Product Importance for EcosystemPromotion; Why
Medium; An ECU for 2W on way, which will replace CDIs by 2015-16
Steps to Promote Ecosystema. Constantly increasing Petrol pricing a dampener for the growth of
the 2W industry
Market and Opportunity The double-digit growth of Indian two-wheeler industry, especially the scooter segment, followed by motorcycles and mopeds
respectively at 25 per cent, 14 per cent and 12 per cent, has led to the steady growth of 2W ignition market in the country. The growth
in demand for 2W ignitions, also known as CDI (Capacitor Discharge Ignition), has been reciprocated by auto-part manufacturers
adding capacities to their existing manufacturing facilities and plans of subsequent capacity expansion in the coming years. This
product, which is entirely manufactured in the country, is is expected to exhibit greater demand in the coming years. The total
market for CDI’s in 2012 was 16.8 million units, which is expected to reach 23.9 million units in 2015 growing at a CAGR of 12.4 per
cent. The entire demand generation is accounted for through high-value add domestic manufacturing of the CDI’s in the country,which is expected to grow at 12.4 per cent in the period 2012 to 2015. Of the total domestic production, a small proportion of CDI’s
is also exported to suppliers across the globe.
308.1 308.1
0
100
50
200
150
300
250
350
20112010 2012 2013 2014 2015
Capacitor Discharge Ignition Market: TM, TDM Forecasts (2010-2015)
HVA-TDM : TM
2011
2013
2015
100%
100%
100%
Total Market ($ Million)
Total Domestic Manufacturing (High Value Add, $ Million) Total Domestic Manufacturing (Low & Medium Value Add, $ Million)
Base Year: 2011 Source: IESA-Frost & Sullivan
CAGR (2011 - 2015)
TM: 10.2%
TDM (overall): 10.2%
TDM (Low/Med
value add) : 0 TDM (High value
add): 10.2%
280.7 280.7
231.0 231.0
255.8 255.8
190.8 190.8210.4 210.4
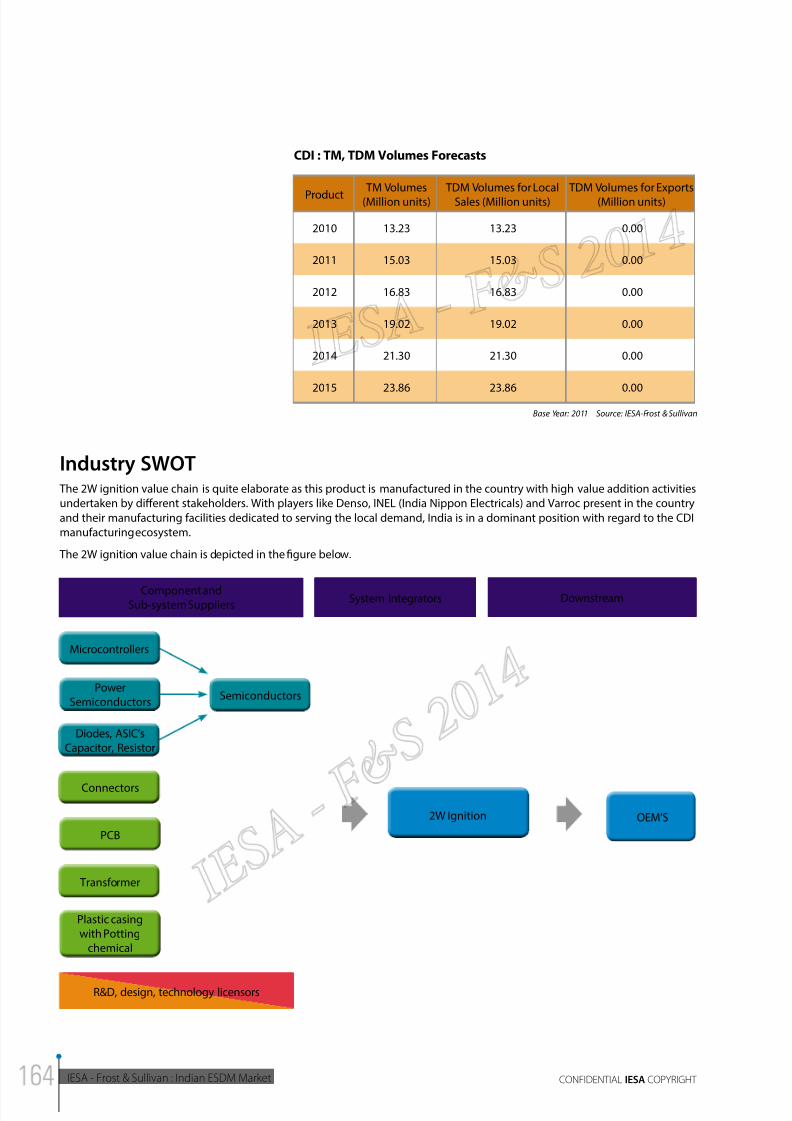
8/11/2019 IESA FS Report Indian ESDM Market
http://slidepdf.com/reader/full/iesa-fs-report-indian-esdm-market 164/172
IESA - Frost & Sullivan : Indian ESDM Market CONFIDENTIAL IESA COPYRIGHT
CDI : TM, TDM Volumes Forecasts
Product TM Volumes(Million units)
TDM Volumes for LocalSales (Million units)
TDM Volumes for Exports(Million units)
2010 13.23 13.23 0.00
2011 15.03 15.03 0.00
2012 16.83 16.83 0.00
2013 19.02 19.02 0.00
2014 21.30 21.30 0.00
2015 23.86 23.86 0.00
Base Year: 2011 Source: IESA-Frost & Sullivan
Industry SWOT The 2W ignition value chain is quite elaborate as this product is manufactured in the country with high value addition activities
undertaken by different stakeholders. With players like Denso, INEL (India Nippon Electricals) and Varroc present in the country
and their manufacturing facilities dedicated to serving the local demand, India is in a dominant position with regard to the CDI
manufacturing ecosystem.
The 2W ignition value chain is depicted in the figure below.
Component andSub-system Suppliers
System Integrators Downstream
Connectors
Diodes, ASIC’sCapacitor, Resistor
PowerSemiconductors
Microcontrollers
Semiconductors
Transformer
Plastic casingwith Potting
chemical
PCB
2W Ignition OEM’S
R&D, design, technology licensors
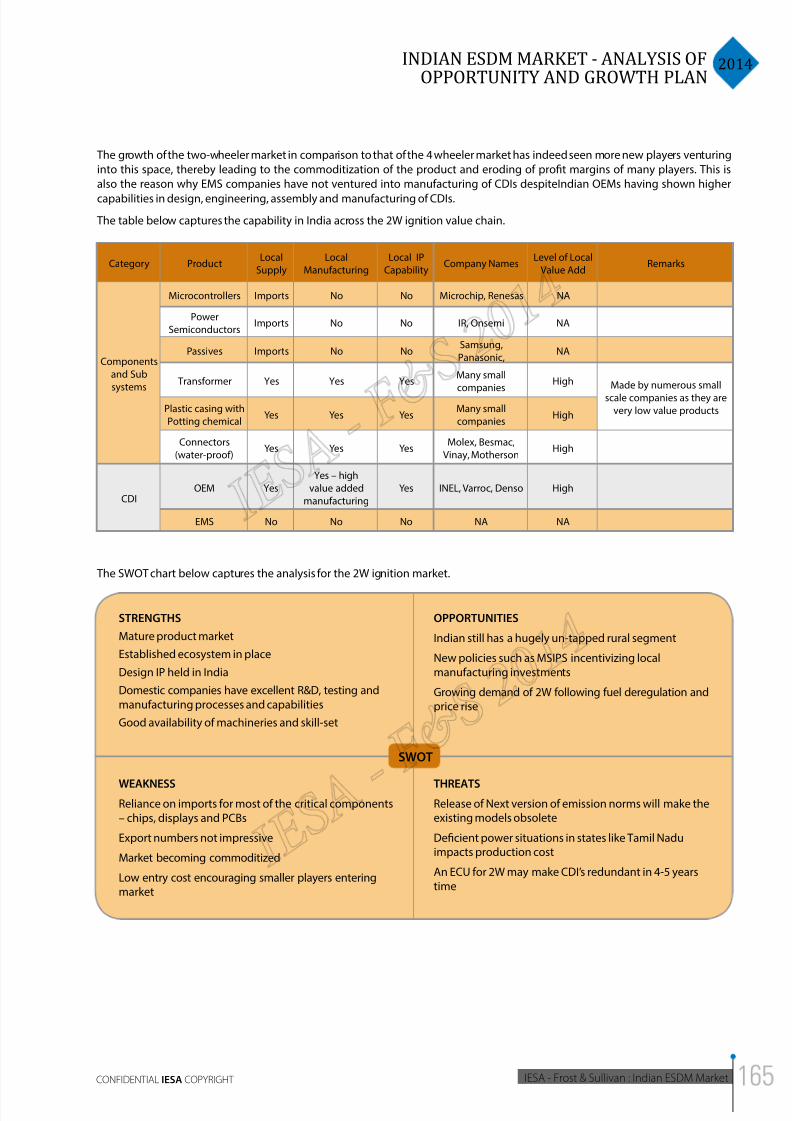
8/11/2019 IESA FS Report Indian ESDM Market
http://slidepdf.com/reader/full/iesa-fs-report-indian-esdm-market 165/172
2014INDIAN ESDM MARKET - ANALYSIS OF
OPPORTUNITY AND GROWTH PLAN
IESA - Frost & Sullivan : Indian ESDM MarketCONFIDENTIAL IESA COPYRIGHT
The growth of the two-wheeler market in comparison to that of the 4 wheeler market has indeed seen more new players venturing
into this space, thereby leading to the commoditization of the product and eroding of profit margins of many players. This is
also the reason why EMS companies have not ventured into manufacturing of CDIs despiteIndian OEMs having shown higher
capabilities in design, engineering, assembly and manufacturing of CDIs.
The table below captures the capability in India across the 2W ignition value chain.
Category ProductLocal
Supply
Local
Manufacturing
Local IP
CapabilityCompany Names
Level of Local
Value AddRemarks
Components
and Sub
systems
Microcontrollers Imports No No Microchip, Renesas NA
Power
SemiconductorsImports No No IR, Onsemi NA
Passives Imports No NoSamsung,
Panasonic,NA
Transformer Yes Yes YesMany small
companies
High Made by numerous small
scale companies as they are
very low value productsPlastic casing with
Potting chemicalYes Yes Yes
Many small
companiesHigh
Connectors
(water-proof)Yes Yes Yes
Molex, Besmac,
Vinay, MothersonHigh
CDIOEM Yes
Yes – high
value added
manufacturing
Yes INEL, Varroc, Denso High
EMS No No No NA NA
The SWOT chart below captures the analysis for the 2W ignition market.
STRENGTHS
Mature product market
Established ecosystem in place
Design IP held in India
Domestic companies have excellent R&D, testing andmanufacturing processes and capabilities
Good availability of machineries and skill-set
OPPORTUNITIES
Indian still has a hugely un-tapped rural segment
New policies such as MSIPS incentivizing localmanufacturing investments
Growing demand of 2W following fuel deregulation andprice rise
WEAKNESSReliance on imports for most of the critical components– chips, displays and PCBs
Export numbers not impressive
Market becoming commoditized
Low entry cost encouraging smaller players enteringmarket
THREATSRelease of Next version of emission norms will make theexisting models obsolete
Deficient power situations in states like Tamil Naduimpacts production cost
An ECU for 2W may make CDI’s redundant in 4-5 yearstime
SWOT
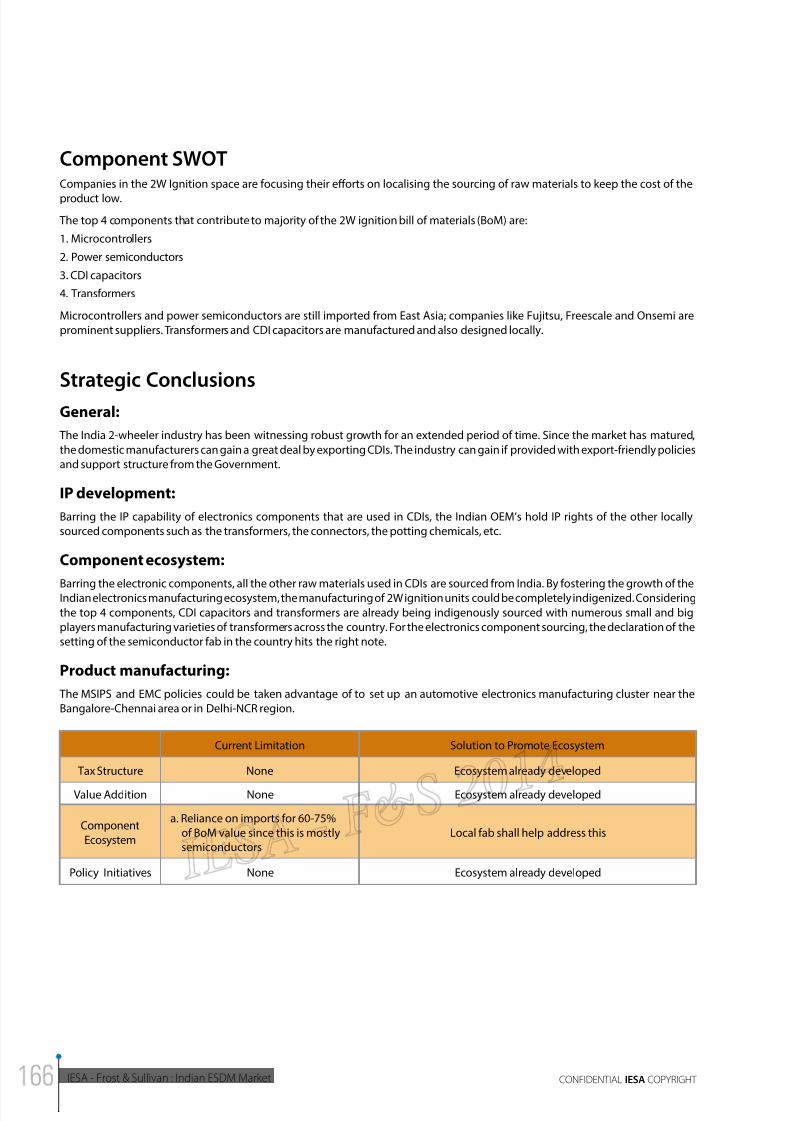
8/11/2019 IESA FS Report Indian ESDM Market
http://slidepdf.com/reader/full/iesa-fs-report-indian-esdm-market 166/172
IESA - Frost & Sullivan : Indian ESDM Market CONFIDENTIAL IESA COPYRIGHT
Component SWOTCompanies in the 2W Ignition space are focusing their efforts on localising the sourcing of raw materials to keep the cost of the
product low.
The top 4 components that contribute to majority of the 2W ignition bill of materials (BoM) are:
1. Microcontrollers
2. Power semiconductors
3. CDI capacitors
4. Transformers
Microcontrollers and power semiconductors are still imported from East Asia; companies like Fujitsu, Freescale and Onsemi are
prominent suppliers. Transformers and CDI capacitors are manufactured and also designed locally.
Strategic Conclusions
General:
The India 2-wheeler industry has been witnessing robust growth for an extended period of time. Since the market has matured,
the domestic manufacturers can gain a great deal by exporting CDIs. The industry can gain if provided with export-friendly policies
and support structure from the Government.
IP development:
Barring the IP capability of electronics components that are used in CDIs, the Indian OEM’s hold IP rights of the other locally
sourced components such as the transformers, the connectors, the potting chemicals, etc.
Component ecosystem:
Barring the electronic components, all the other raw materials used in CDIs are sourced from India. By fostering the growth of theIndian electronics manufacturing ecosystem, the manufacturing of 2W ignition units could be completely indigenized. Considering
the top 4 components, CDI capacitors and transformers are already being indigenously sourced with numerous small and big
players manufacturing varieties of transformers across the country. For the electronics component sourcing, the declaration of the
setting of the semiconductor fab in the country hits the right note.
Product manufacturing:
The MSIPS and EMC policies could be taken advantage of to set up an automotive electronics manufacturing cluster near the
Bangalore-Chennai area or in Delhi-NCR region.
Current Limitation Solution to Promote Ecosystem
Tax Structure None Ecosystem already developed
Value Addition None Ecosystem already developed
Component
Ecosystem
a. Reliance on imports for 60-75%
of BoM value since this is mostlysemiconductors
Local fab shall help address this
Policy Initiatives None Ecosystem already developed
8/11/2019 IESA FS Report Indian ESDM Market
http://slidepdf.com/reader/full/iesa-fs-report-indian-esdm-market 167/172
2014INDIAN ESDM MARKET - ANALYSIS OF
OPPORTUNITY AND GROWTH PLAN
IESA - Frost & Sullivan : Indian ESDM MarketCONFIDENTIAL IESA COPYRIGHT
Appendix
Definitions
Acronyms
TM: Total Market: Total consumption of electronics in India, in whatever form (can be purchased locally,
imported as part of CKD or SKD, imported as a complete product), by whatever source
(Sources are directly from product company oces in India, distributor sales, direct imports
etc) and in whichever currency (US$ or Indian rupee).
TDM: Total Domestic Market: Total domestic manufacturing including CKD assembling that caters
to domestic market consumption; does not include exports.
ESDM Industry Size: Electronics TM + Electronics TE + Electronic Component Market Revenues from Local
Manufacturing + Semiconductor Design Market Revenues + EMS Services Revenues
HVA: High local value addition: Value addition > 50%; high level of local sourcing, high level of
indigenous design, complete system manufacturing.
MVA: Medium local value addition: Value addition 20%-50%; EMS, CKD Assembling, sourcing of
minimal components.
LVA: Low local value addition: Value addition <20%; SKD Assembling, no local sourcing, no local
design influence.
ASIC: Application Specific Integrated Circuit
ASSP: Application Specific Standard Product
BTS: Base Terminal Station
CAGR: Cumulative Average Growth Rate
CBU: Completely Built Unit
CDI: Capacitor Discharge Ignition
eBoM: Electronics Bill of Materials
ECU: Engine Control Unit
EMS: Engine Management System
IC: Integrated Circuit
IP: Internet Protocol
LCD: Liquid Crystal Display
MCU: Microcontroller
MPU: Microprocessor
STB: Set top Box
TM: Total Market
TDM: Total Domestic Market
TAM: Total Available Market
UPS: Uninterrupted Power Supply
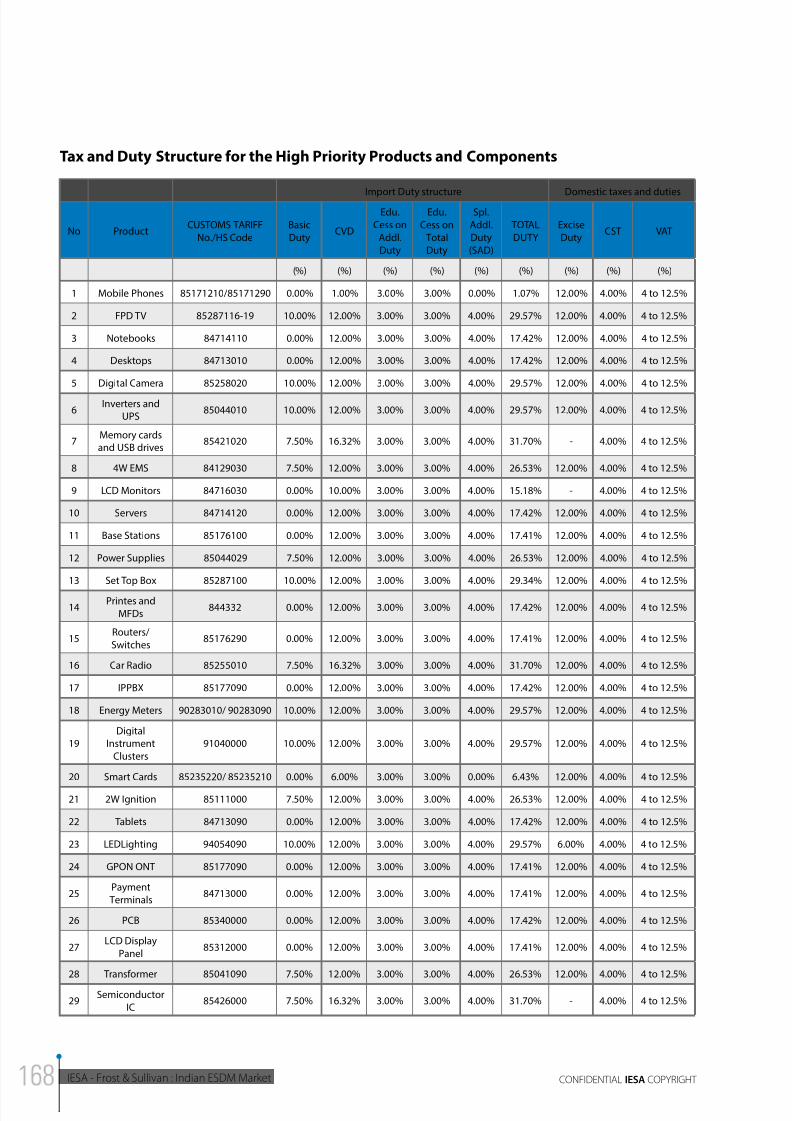
8/11/2019 IESA FS Report Indian ESDM Market
http://slidepdf.com/reader/full/iesa-fs-report-indian-esdm-market 168/172
IESA - Frost & Sullivan : Indian ESDM Market CONFIDENTIAL IESA COPYRIGHT
Import Duty structure Domestic taxes and duties
No ProductCUSTOMS TARIFF
No./HS Code
Basic
DutyCVD
Edu.
Cess on
Addl.
Duty
Edu.
Cess on
Total
Duty
Spl.
Addl.
Duty
(SAD)
TOTAL
DUTY
Excise
DutyCST VAT
(%) (%) (%) (%) (%) (%) (%) (%) (%)
1 Mobile Phones 85171210/85171290 0.00% 1.00% 3.00% 3.00% 0.00% 1.07% 12.00% 4.00% 4 to 12.5%
2 FPD TV 85287116-19 10.00% 12.00% 3.00% 3.00% 4.00% 29.57% 12.00% 4.00% 4 to 12.5%
3 Notebooks 84714110 0.00% 12.00% 3.00% 3.00% 4.00% 17.42% 12.00% 4.00% 4 to 12.5%
4 Desktops 84713010 0.00% 12.00% 3.00% 3.00% 4.00% 17.42% 12.00% 4.00% 4 to 12.5%
5 Digital Camera 85258020 10.00% 12.00% 3.00% 3.00% 4.00% 29.57% 12.00% 4.00% 4 to 12.5%
6Inverters and
UPS85044010 10.00% 12.00% 3.00% 3.00% 4.00% 29.57% 12.00% 4.00% 4 to 12.5%
7Memory cardsand USB drives
85421020 7.50% 16.32% 3.00% 3.00% 4.00% 31.70% - 4.00% 4 to 12.5%
8 4W EMS 84129030 7.50% 12.00% 3.00% 3.00% 4.00% 26.53% 12.00% 4.00% 4 to 12.5%
9 LCD Monitors 84716030 0.00% 10.00% 3.00% 3.00% 4.00% 15.18% - 4.00% 4 to 12.5%
10 Servers 84714120 0.00% 12.00% 3.00% 3.00% 4.00% 17.42% 12.00% 4.00% 4 to 12.5%
11 Base Stations 85176100 0.00% 12.00% 3.00% 3.00% 4.00% 17.41% 12.00% 4.00% 4 to 12.5%
12 Power Supplies 85044029 7.50% 12.00% 3.00% 3.00% 4.00% 26.53% 12.00% 4.00% 4 to 12.5%
13 Set Top Box 85287100 10.00% 12.00% 3.00% 3.00% 4.00% 29.34% 12.00% 4.00% 4 to 12.5%
14Printes and
MFDs844332 0.00% 12.00% 3.00% 3.00% 4.00% 17.42% 12.00% 4.00% 4 to 12.5%
15Routers/
Switches85176290 0.00% 12.00% 3.00% 3.00% 4.00% 17.41% 12.00% 4.00% 4 to 12.5%
16 Car Radio 85255010 7.50% 16.32% 3.00% 3.00% 4.00% 31.70% 12.00% 4.00% 4 to 12.5%
17 IPPBX 85177090 0.00% 12.00% 3.00% 3.00% 4.00% 17.42% 12.00% 4.00% 4 to 12.5%
18 Energy Meters 90283010/ 90283090 10.00% 12.00% 3.00% 3.00% 4.00% 29.57% 12.00% 4.00% 4 to 12.5%
19Digital
Instrument
Clusters
91040000 10.00% 12.00% 3.00% 3.00% 4.00% 29.57% 12.00% 4.00% 4 to 12.5%
20 Smart Cards 85235220/ 85235210 0.00% 6.00% 3.00% 3.00% 0.00% 6.43% 12.00% 4.00% 4 to 12.5%
21 2W Ignition 85111000 7.50% 12.00% 3.00% 3.00% 4.00% 26.53% 12.00% 4.00% 4 to 12.5%
22 Tablets 84713090 0.00% 12.00% 3.00% 3.00% 4.00% 17.42% 12.00% 4.00% 4 to 12.5%
23 LEDLighting 94054090 10.00% 12.00% 3.00% 3.00% 4.00% 29.57% 6.00% 4.00% 4 to 12.5%
24 GPON ONT 85177090 0.00% 12.00% 3.00% 3.00% 4.00% 17.41% 12.00% 4.00% 4 to 12.5%
25Payment
Terminals84713000 0.00% 12.00% 3.00% 3.00% 4.00% 17.41% 12.00% 4.00% 4 to 12.5%
26 PCB 85340000 0.00% 12.00% 3.00% 3.00% 4.00% 17.42% 12.00% 4.00% 4 to 12.5%
27LCD Display
Panel85312000 0.00% 12.00% 3.00% 3.00% 4.00% 17.41% 12.00% 4.00% 4 to 12.5%
28 Transformer 85041090 7.50% 12.00% 3.00% 3.00% 4.00% 26.53% 12.00% 4.00% 4 to 12.5%
29Semiconductor
IC85426000 7.50% 16.32% 3.00% 3.00% 4.00% 31.70% - 4.00% 4 to 12.5%
Tax and Duty Structure for the High Priority Products and Components
8/11/2019 IESA FS Report Indian ESDM Market
http://slidepdf.com/reader/full/iesa-fs-report-indian-esdm-market 169/172
2014INDIAN ESDM MARKET - ANALYSIS OF
OPPORTUNITY AND GROWTH PLAN
IESA - Frost & Sullivan : Indian ESDM MarketCONFIDENTIAL IESA COPYRIGHT
Notes

8/11/2019 IESA FS Report Indian ESDM Market
http://slidepdf.com/reader/full/iesa-fs-report-indian-esdm-market 170/172
IESA - Frost & Sullivan : Indian ESDM Market CONFIDENTIAL IESA COPYRIGHT
Notes

8/11/2019 IESA FS Report Indian ESDM Market
http://slidepdf.com/reader/full/iesa-fs-report-indian-esdm-market 171/172
2014INDIAN ESDM MARKET - ANALYSIS OF
OPPORTUNITY AND GROWTH PLAN
IESA - Frost & Sullivan : Indian ESDM MarketCONFIDENTIAL IESA COPYRIGHT
8/11/2019 IESA FS Report Indian ESDM Market
http://slidepdf.com/reader/full/iesa-fs-report-indian-esdm-market 172/172