Embed Size (px)
Citation preview
IEEE XXX 1
Hierarchical approach to classify food scenes inegocentric photo-streams
Estefanıa Talavera, Marıa Leyva-Vallina, Md. Mostafa Kamal Sarker, Domenec Puig, Nicolai Petkov and PetiaRadeva
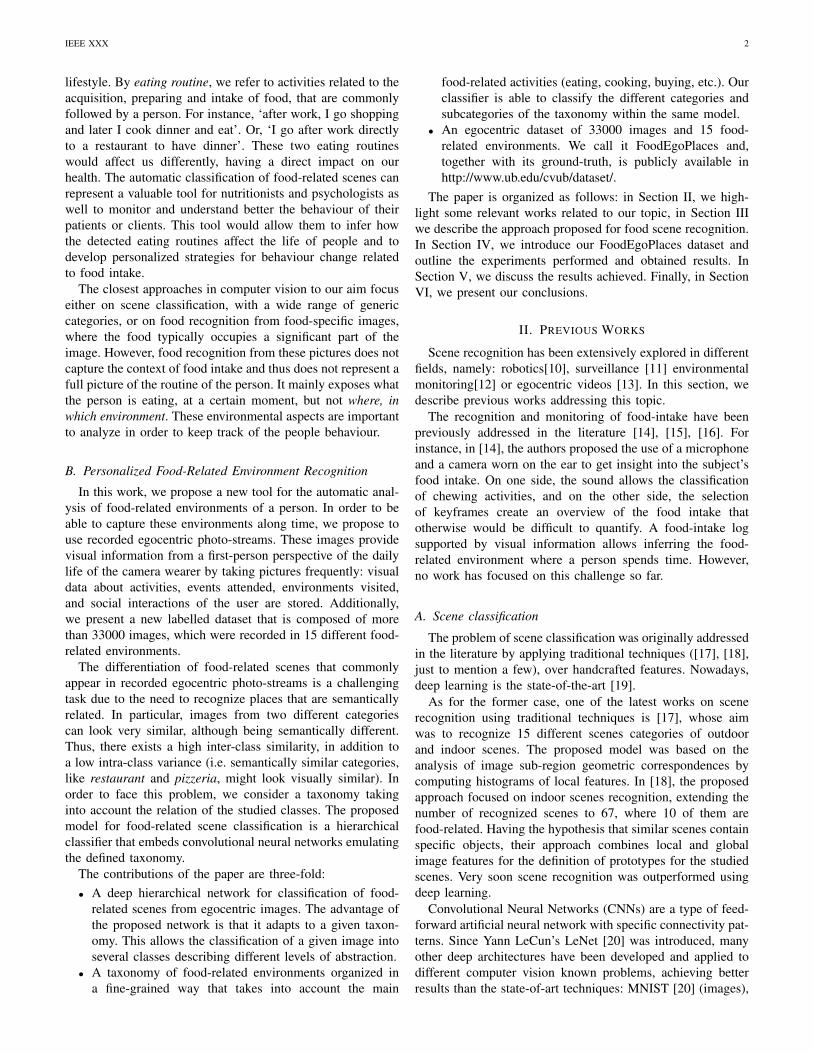
Abstract—Recent studies have shown that the environmentwhere people eat can affect their nutritional behaviour [1]. In thiswork, we provide automatic tools for personalised analysis of aperson’s health habits by the examination of daily recorded ego-centric photo-streams. Specifically, we propose a new automaticapproach for the classification of food-related environments, thatis able to classify up to 15 such scenes. In this way, people canmonitor the context around their food intake in order to get anobjective insight into their daily eating routine. We propose amodel that classifies food-related scenes organized in a semantichierarchy. Additionally, we present and make available a newegocentric dataset composed of more than 33000 images recordedby a wearable camera, over which our proposed model hasbeen tested. Our approach obtains an accuracy and F-score of56% and 65%, respectively, clearly outperforming the baselinemethods.
Index Terms—Egocentric vision, lifestyle, scenes classification,food scenes
I. INTRODUCTION
NUTRITION is one of the main pillars of a healthylifestyle. It is directly related to most chronic diseases
like obesity, diabetes, cardiovascular diseases, and also cancerand mental diseases [2], [3], [4]. Recent studies show that it isnot only important what people eat, but also how/where peopleeat [1]. For instance, it is common knowledge that it is adviseda person who is on a weight-reduction plan should to not go tothe supermarket while being hungry [5]. Social environmentalso matters; we eat more in certain situations, such as partiesthan at home [6]. If we are exposed to the food we feel theneed or temptation to eat, the same feeling of temptation willbe experienced at the supermarket [7]. Not only the sight playsits role, but also smell: everyone has walked in front of abakery shop and felt tempted or hungry immediately [8]. Theconclusion is that where we are can have a direct impact onwhat or how we eat and, by extension, on our health [9].However, there is a clear lack of automatic tools to monitorobjectively the context of our food intake along time.
A. Our aim
Our aim is to propose an automatic tool based on robustdeep learning techniques able to classify food-related sceneswhere a person spends time during the day. Our hypothesis isthat if we can help people get insight into their daily eating
E. Talavera, M. Leyva-Vallina and N. Petkov are with the University ofGroningen.E-mail: [email protected]
P. Radeva is with the University of Barcelona.M.M.K. Sarker and D. Puig are with the University of Rovira i Virgili.Manuscript received x, 2018; revised x, 2018.
Bakery shop Banquet hall
Beer hall Cafeteria
Picnic area
Dining room
Supermarket
Market indoor
Food court
Market outdoor
Bar
Pub indoor
Coffee shop
Restaurant
Ice cream parlor
Fig. 1: Examples of images of each of the proposed food-related categories present in the introduced EgoFoodPlacesdataset.
routine, they can improve their habits and adopt a healthier
arX
iv:1
905.
0409
7v1
[cs
.CV
] 1
0 M
ay 2
019
IEEE XXX 2
lifestyle. By eating routine, we refer to activities related to theacquisition, preparing and intake of food, that are commonlyfollowed by a person. For instance, ‘after work, I go shoppingand later I cook dinner and eat’. Or, ‘I go after work directlyto a restaurant to have dinner’. These two eating routineswould affect us differently, having a direct impact on ourhealth. The automatic classification of food-related scenes canrepresent a valuable tool for nutritionists and psychologists aswell to monitor and understand better the behaviour of theirpatients or clients. This tool would allow them to infer howthe detected eating routines affect the life of people and todevelop personalized strategies for behaviour change relatedto food intake.
The closest approaches in computer vision to our aim focuseither on scene classification, with a wide range of genericcategories, or on food recognition from food-specific images,where the food typically occupies a significant part of theimage. However, food recognition from these pictures does notcapture the context of food intake and thus does not represent afull picture of the routine of the person. It mainly exposes whatthe person is eating, at a certain moment, but not where, inwhich environment. These environmental aspects are importantto analyze in order to keep track of the people behaviour.
B. Personalized Food-Related Environment Recognition
In this work, we propose a new tool for the automatic anal-ysis of food-related environments of a person. In order to beable to capture these environments along time, we propose touse recorded egocentric photo-streams. These images providevisual information from a first-person perspective of the dailylife of the camera wearer by taking pictures frequently: visualdata about activities, events attended, environments visited,and social interactions of the user are stored. Additionally,we present a new labelled dataset that is composed of morethan 33000 images, which were recorded in 15 different food-related environments.
The differentiation of food-related scenes that commonlyappear in recorded egocentric photo-streams is a challengingtask due to the need to recognize places that are semanticallyrelated. In particular, images from two different categoriescan look very similar, although being semantically different.Thus, there exists a high inter-class similarity, in addition toa low intra-class variance (i.e. semantically similar categories,like restaurant and pizzeria, might look visually similar). Inorder to face this problem, we consider a taxonomy takinginto account the relation of the studied classes. The proposedmodel for food-related scene classification is a hierarchicalclassifier that embeds convolutional neural networks emulatingthe defined taxonomy.
The contributions of the paper are three-fold:• A deep hierarchical network for classification of food-
related scenes from egocentric images. The advantage ofthe proposed network is that it adapts to a given taxon-omy. This allows the classification of a given image intoseveral classes describing different levels of abstraction.
• A taxonomy of food-related environments organized ina fine-grained way that takes into account the main
food-related activities (eating, cooking, buying, etc.). Ourclassifier is able to classify the different categories andsubcategories of the taxonomy within the same model.
• An egocentric dataset of 33000 images and 15 food-related environments. We call it FoodEgoPlaces and,together with its ground-truth, is publicly available inhttp://www.ub.edu/cvub/dataset/.
The paper is organized as follows: in Section II, we high-light some relevant works related to our topic, in Section IIIwe describe the approach proposed for food scene recognition.In Section IV, we introduce our FoodEgoPlaces dataset andoutline the experiments performed and obtained results. InSection V, we discuss the results achieved. Finally, in SectionVI, we present our conclusions.
II. PREVIOUS WORKS
Scene recognition has been extensively explored in differentfields, namely: robotics[10], surveillance [11] environmentalmonitoring[12] or egocentric videos [13]. In this section, wedescribe previous works addressing this topic.
The recognition and monitoring of food-intake have beenpreviously addressed in the literature [14], [15], [16]. Forinstance, in [14], the authors proposed the use of a microphoneand a camera worn on the ear to get insight into the subject’sfood intake. On one side, the sound allows the classificationof chewing activities, and on the other side, the selectionof keyframes create an overview of the food intake thatotherwise would be difficult to quantify. A food-intake logsupported by visual information allows inferring the food-related environment where a person spends time. However,no work has focused on this challenge so far.
A. Scene classification
The problem of scene classification was originally addressedin the literature by applying traditional techniques ([17], [18],just to mention a few), over handcrafted features. Nowadays,deep learning is the state-of-the-art [19].
As for the former case, one of the latest works on scenerecognition using traditional techniques is [17], whose aimwas to recognize 15 different scenes categories of outdoorand indoor scenes. The proposed model was based on theanalysis of image sub-region geometric correspondences bycomputing histograms of local features. In [18], the proposedapproach focused on indoor scenes recognition, extending thenumber of recognized scenes to 67, where 10 of them arefood-related. Having the hypothesis that similar scenes containspecific objects, their approach combines local and globalimage features for the definition of prototypes for the studiedscenes. Very soon scene recognition was outperformed usingdeep learning.
Convolutional Neural Networks (CNNs) are a type of feed-forward artificial neural network with specific connectivity pat-terns. Since Yann LeCun’s LeNet [20] was introduced, manyother deep architectures have been developed and applied todifferent computer vision known problems, achieving betterresults than the state-of-art techniques: MNIST [20] (images),
IEEE XXX 3
Reuters [21](documents) and TIMIT [22] (recordings in En-glish), ImageNET [23] (Data Sets classification), etc. Withinthe wide range of recently proposed architectures, some ofthe most popular are: GoogleNet [24], AlexNet [25], ResNet[26], or VGGNet [27]. The use of CNNs for learning high-level features has shown huge progress in scene recognitionoutperforming traditional techniques like [18]. This is mostlydue to the availability of large datasets, those presented in[18], [28] or the ones derived from the MIT Indoor dataset([29], [30]). However, the performance at scene recognitionlevel has not reached the same level of success as objectrecognition. Probably, this is a result of the difficulty presentedwhen generalizing the classification problem, due to the hugerange of different environments surrounding us (e.g. 400 inthe Places2 dataset [29]).
In [31], CNN activation features were extracted and con-catenated following a spatial pyramid structure and used totrain one-vs-all linear classifiers for each scene category. Incontrast, in [29] the authors evaluate the performance of theresponses from the trained Places-CNN as generic features,over several scene and object benchmarks. Also, a probabilisticdeep embedding framework, which analyses regional andglobal features extracted by a neural network, is proposedin [32]. In [33], two different networks called Object-SceneCNNs, are combined by late fusion; the ‘object net’ aggregatesinformation for event recognition from the perspective ofobjects, and the ‘scene net’ performs the recognition withhelp from the scene context. The nets are pre-trained on theImageNet dataset [23] and Places dataset [29] respectively.Recently, in [34] the authors combine object-centric and scene-centric architectures. They propose a parallel model wherethe network operates over different scale patches extractedfrom the input image. None of these methods has beentested on egocentric images, which by themselves represent achallenge for image analysis. In this kind of data, the camerafollows the user’s movements. This results in big variabilityon illumination, blurriness, occlusions, drastic visual changesdue to the low frame rate of the camera, narrow field of view,among other difficulties.
B. Classification of egocentric scenes
In order to obtain personalized scene classification, we needto analyze egocentric images acquired by a wearable camera.Egocentric image analysis is a relatively recent field withincomputer vision concerning the design and development ofComputer Vision algorithms to analyze and understand photo-streams captured by a wearable camera. In [35], several classi-fiers were proposed to recognize 8 different scenes (not all ofthem food-related). First, they discriminate between food/no-food and later, they train One-vs-all classifiers to discriminateamong classes. Later, in [36] a multi-class classifier wasproposed, with a negative-rejection method applied. In [35],[36] they only consider 8 scene categories, just 2 of them arefood-related (kitchen and coffee machine) and without visualor semantic relation.
C. Food-related scene recognition in egocentric photo-streams
In our preliminary work presented in [37], we proposeda MACNet neural architecture for the classification of food-related scenes. This network input image is scaled into fivedifferent resolutions (the original image, with a scale value of0.5). The five scaled images are fed to five blocks of atrousconvolutional networks [38] with three different rates (1, 2,and 3) to extract the key features of the input image in multi-scale. In addition, four blocks of pre-trained ResNet are usedto extract 256, 512, 1024 and 2048 feature maps, respectively.Each feature maps extracted by an atrous convolutional blockis concatenated with the corresponding ResNet block to feedthe subsequent block. Finally, the features obtained from thefourth ResNet layer is the final features are used to classifythe food places images using two fully connected (FC) layers.
However, the challenge still remains due to the high variancethat environments take in real-world places and the wide rangeof possibilities of how a scene can be captured. In this work,we propose an organization of the different studied classesinto semantic groups following the logic that relates them.We define a taxonomy, i.e. a semantic hierarchy relating thefood-related classes. Hierarchical classification is an iterativeprocess that groups features or concepts based on their sim-ilarity into clusters, until merging them all together. Thereare two strategies for hierarchical classification: agglomerative(bottom-up) and divisive (top-down). We aim to classify food-related images following a top-down strategy, i.e. from a less toa more specific description of the scene. The proposed hierar-chical model supports its final classification on the dependenceamong classes at the different levels of the classification tree.This allows us to study different levels of semantic abstraction.The different semantic levels (L), Level 1 (L1), Level 2 (L2)and Level 3 (L3), are introduced in Fig. 2 In this document werefer to meta-class as the class whose instances are semanticand visual correlated classes.
Therefore, we organize environments according to the ac-tions related to them: cooking, eating, acquiring food products.We demonstrate that by creating different levels of classifica-tion and classifying scenes by the person action, it can serveas a natural prior for more specific environments and thus canfurther improve the performance of the model. The proposedclassification model, implemented following this taxonomy,allows analyzing at different semantic levels of where thecamera wearer spends time.
To the best of our knowledge, no previous work has focusedon the problem of food-related scenes recognition at differentsemantic levels, either from conventional or egocentric images.Our work aims to classify food-related scenes from egocentricimages recorded by a wearable camera. We believe that theseimages highly describe our daily routine and can contribute tothe improvement of healthy habits of people.
III. HIERARCHICAL APPROACH FOR FOOD-RELATEDSCENES RECOGNITION IN EGOCENTRIC PHOTO-STREAMS
We propose a new model to address the classificationof food-related scenes in egocentric images. It follows ahierarchical semantic structure, which adapts to the taxonomy
IEEE XXX 4
that describes the relationships among classes. The classesare hierarchically implemented from more abstract to morespecific ones. Therefore, the model is scalable and can beadapted depending on the classification problem, i.e. if thetaxonomy changes.
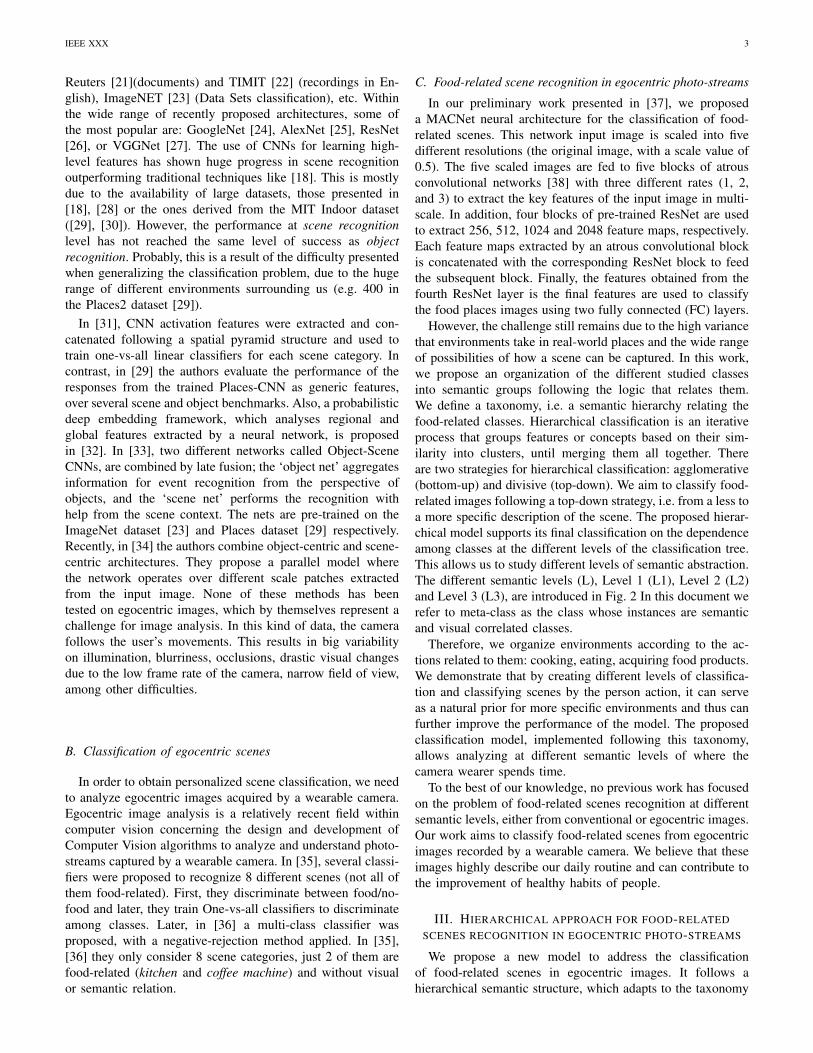
For the purposes of food-related scene classification, wedefine a semantic tree which is depicted in Fig. 2. We redefinethe problem inspired by how humans hierarchically organizeconcepts into semantic groups. The Level 1 directly relatedto the problem of physical activities recognition [13]: eating,preparing, and acquiring food (shopping). Note that the recog-nition of physical activities itself is a well-known and still openresearch problem in egocentric vision[13]. On the other hand,recognition of these three activities has multiple applicationslike for patients with Mild Cognitive Impairment (MCI) inthe Cambridge cognition test [39]. There, the decrease ofolder peoples cognitive functions with time is one of thefactors to estimate their cognitive capacities by measuringtheir capacity to prepare food or go for shopping [40]. Laterit splits eating into eating outdoor or indoor. Some of thesubcategories group several classes, such as the subcategoryeating indoor that encapsulates seven food-related scenesclasses: bar, beer hall, cafeteria, coffee shop, dining room,restaurant, and pub indoor. In contrast, preparing and eatingoutdoor are represented uniquely by kitchen and picnic area,respectively. The semantic hierarchy was defined followingthe collected food-related classes and their intrinsic relation.Thus, the automatic analysis of the frequency and durationof such food-related activities is of high importance whenanalyzing their behaviour. The environment is differentiated inLevel 2. As commented in the manuscript, in [1] the authorsstated that where you are, affects your eating habits. Thus,the food routine or habits of camera wearers can be inferredby recognizing the food-related environment where they spendtime (e.g. outdoor, indoor, etc.).
The classification of scenes is already a scientific challenge,see the dataset Places [19]. For us, the novelty is to addressthe classification of scenes with similar characteristics (food-related) that makes the problem additionally more difficult.
We proposed this taxonomy because we think it representsa powerful tool to address the behaviour of people. Moreover,it could be of interest in order to estimate the cognitive stateof MCI patients. We reached this conclusion after previouscollaborations with psychologists working on the MCI disor-der, and analysing egocentric photo-streams addressing severalproblems.
The differentiation among classes at the different levelsof the hierarchy needs to be performed by a classifier. Inthis work, we propose to use CNNs for the different levelsof classification of our food-related scenes hierarchy. Theaggregation of CNNs layers mimics the structure of the food-related scenes presented in Fig. 2. Due to the good quality ofthe scene classification results over the Places2 dataset [30],we made use of the pre-trained VGG16 introduced in [27],on which we built our hierarchical model. In this work, wewill refer to it as VGG365 network. Note that this approachresembles the DECOC classifier [41] that proves the efficiencyof decomposing a multi-class classification problem in several
binary classification problems organized in a hierarchical way.The difference with the food-related scene classification isthat in the latter case the classes are organized semanticallyin meta-classes corresponding to nutrition-related activitiesinstead of constructing meta-classes without explicit meaning,but according to the entropy of training data [41].
Fig. 2: The proposed semantic tree for food-related scenescategorization. For their later reference, we mark with dashedlines the different depth levels, and with letters the sub-classification groups.
Given an image, the final classification label is based on theaggregation of estimated intermediate probabilities obtainedfor the different levels of the hierarchical model, since a directdependency exists between levels of the classification tree. Themodel aggregates the chain of probabilities by following thestatistical inference method. The probability of an event isbased on its prior estimated probabilities.
Let us consider classes Ci and Ci−1 so that superscriptshows the level of the class in the hierarchy and Ci−1 is theparent of Ci in the hierarchical organization of the tree. Thus,we can write:
P (Ci, x) = P (Ci, x|Ci−1, x) ∗ P (Ci−1|x) (1)
where P () relates to probabilities. P (Ci−1, x|Ci, x) repre-sents the likelihood of Ci−1, given image x, occurring giventhat Ci, given image x, is happening, while P (Ci, x) andP (Ci−1, x) are marginal probabilities given image x, i.e.the probabilities of independently observing Ci and Ci−1,respectively.
Note that we can estimate P (Ci, x|Ci−1, x) from the clas-sifier of the network trained to classify the classes childrenof class Ci, P (Ci−1, x|Ci, x) is 1 since Ci is a subclass ofCi−1.P (Ci−1, x) can be recursively estimated by considering the
estimated probability on Ci−1 and its class parent. Hence, weobtain that for each node Ci in the hierarchy (in particular,for the leaves), we get:
P (Ci, x) = Πij=1P (Cj , x|Cj−1, x) ∗ P (Cj−1, x) (2)
IEEE XXX 5
Without loss of generality, we consider that the probabilityof the class in the root is the probability to have a food-relatedimage, (P (C0)), obtained by a binary classifier.
Let us illustrate the process with an example. Following thesemantic tree in Fig. 2, our goal is to classify an egocentricimage belonging to the class dining room. We observe that asdining room is a subclass of indoor and indoor is of eating, etc.Thus, the probability of dining room occurring giving imagex is computed as:
P (diningroom, x)
= P (diningroom, x|indoor, x) ∗ P (indoor, x|eating, x)
∗ P (eating, x|foodrelated, x) ∗ P (foodrelated, x)
(3)
To summarize, given an image, our proposed model com-putes the final classification as a product of the estimatedintermediate probabilities at the different levels of the definedsemantic tree.
IV. EXPERIMENTS AND RESULTS
In this section, we describe a new home-made dataset thatwe make public, the experimental setup, the metrics used toevaluate the analysis, and the obtained results.
A. Dataset
In this work, we present EgoFoodPlaces, a dataset com-posed of more than 33000 egocentric images from 11 usersorganized in 15 food-related scene classes. The images wererecorded by a Narrative Clip camera1. This device is ableto generate a huge number of images due to its continuousimage collection. It has a configurable frame rate of 2-3images per minute. Thus, users regularly record an amountof approximately 1500 images per day. The camera move-ments and the wide range of different situations that the userexperiences during his/her day, lead to new challenges suchas background scene variation, changes in lighting conditions,and handled objects appearing and disappearing throughoutthe photo sequence.
Food-related scene images tend to have an intrinsic highinter-class similarity, see Fig. 1. To determine the food-relatedcategories, we selected a subset of the ones proposed for thePlaces365 challenge [19]. We focus on the categories with ahigher number of samples in our collected egocentric dataset,disregarding very unlikely food-related scenes, such as beergarden and ice-cream parlor. Furthermore, we found thatdiscriminating scenes like pizzeria and fast-food restaurant isvery subjective if the scene is recorded from a first-personview, and hence, we merged them into a restaurant class.
EgoFoodPlaces was collected during the daily activitiesof the users. To build the dataset, we select the subset ofimages from the EDUB-Seg dataset that described food-relatedscenes, introduced in [42], [43], and later extended it with newcollected frames. The dataset was gathered by 11 differentsubjects, during a total of 107 days, while spending time inscenes related to the acquisition, preparing or consumption
1http://getnarrative.com/
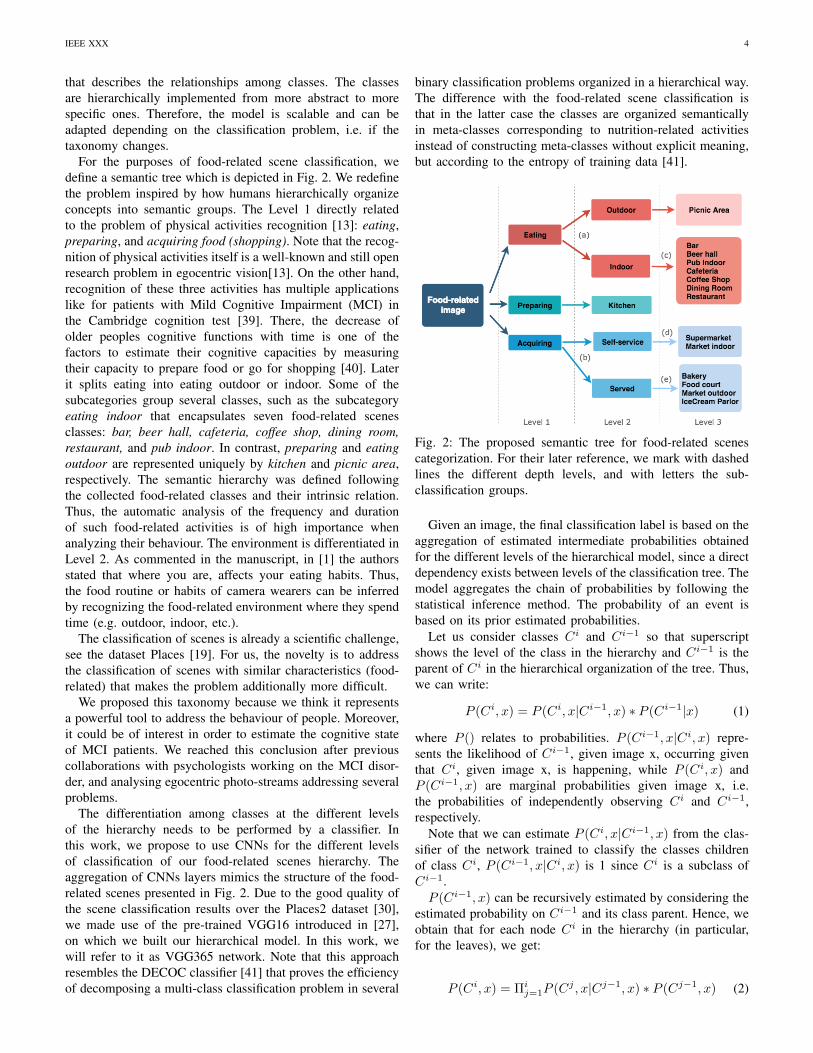
Fig. 3: Total number of images per food-related scene class.We give the number of collected events per class betweenparenthesis.
of food. The dataset has been manually labelled into a totalof 15 different food-related scenes classes: bakery, bar, beerhall, cafeteria, coffee shop, dining room, food court, ice creamparlour, kitchen, market indoor, market outdoor, picnic area,pub indoor, restaurant, and supermarket. In Fig. 3, we showthe number of images per different classes. This figure showsthe unbalanced nature of the classes in our dataset, reflectingthe different prolongation of time that a person spends ondifferent food-related scenes.
Since the images were collected by a wearable camera whenperforming any of the above-mentioned activities, the datasetis composed of groups of images close in time. This leads totwo possible situations. On one hand, images recorded ‘sittingin front of a table while having dinner’ will most likely besimilar. On the contrary, in scenes such as ‘walking at thesupermarket’ the images vary since they follow the walkingmovement of the user in a very varying environment.
In Fig. 4, we present the dataset by classes and events. Thisgraph shows how the average, maximum and minimum spenttime for the given classes differ. Note that this time can bestudied since it is directly related to the number of recordedimages in the different food-related scenes. As we previouslyassumed, classes with a small number of images correspondto unusual environments or environments where people do notspend a lot of time in (e.g. bakery). In contrast, the mostpopulated classes refer to everyday environments (e.g. kitchen,supermarket), or to environments where more time is usuallyspent (e.g. restaurant).
1) Class-variability of the EgoFoodPlaces dataset: Toquantify the degree of semantic similarity among the classesin our proposed dataset, we compute the intra- and inter-classcorrelation. We use the classification probabilities output of theproposed baseline VGG365 network in order to find suitabledescriptors for our images for this comparison. This network
IEEE XXX 6
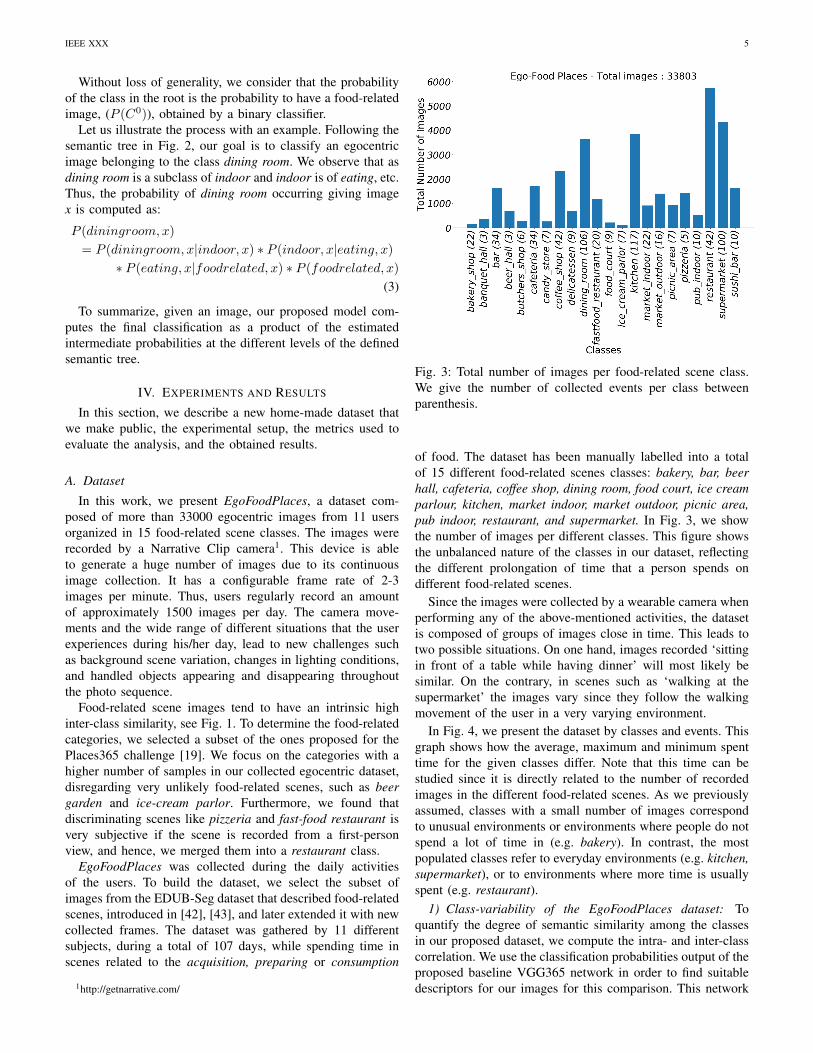
Fig. 4: Illustration of the variability of the size of the events forthe different food-related scene classes. The data is presentedby making the width of the box proportional to the size ofthe group. We give the number of collected events per classbetween parenthesis. The range of the data of a class is shownby the whiskers extend from its data box.
Fig. 5: Visualization of the distribution of the classes usingthe t-SNE algorithm.
was trained for the classification of the proposed 15 food-related scenes. These descriptors encapsulate the semanticsimilarities of the studied classes.
To study the intra-class variability, we compute the meansilhouette coefficient for all samples, that is defined as,
Silhouette score = (b− a)/max(a, b) (4)
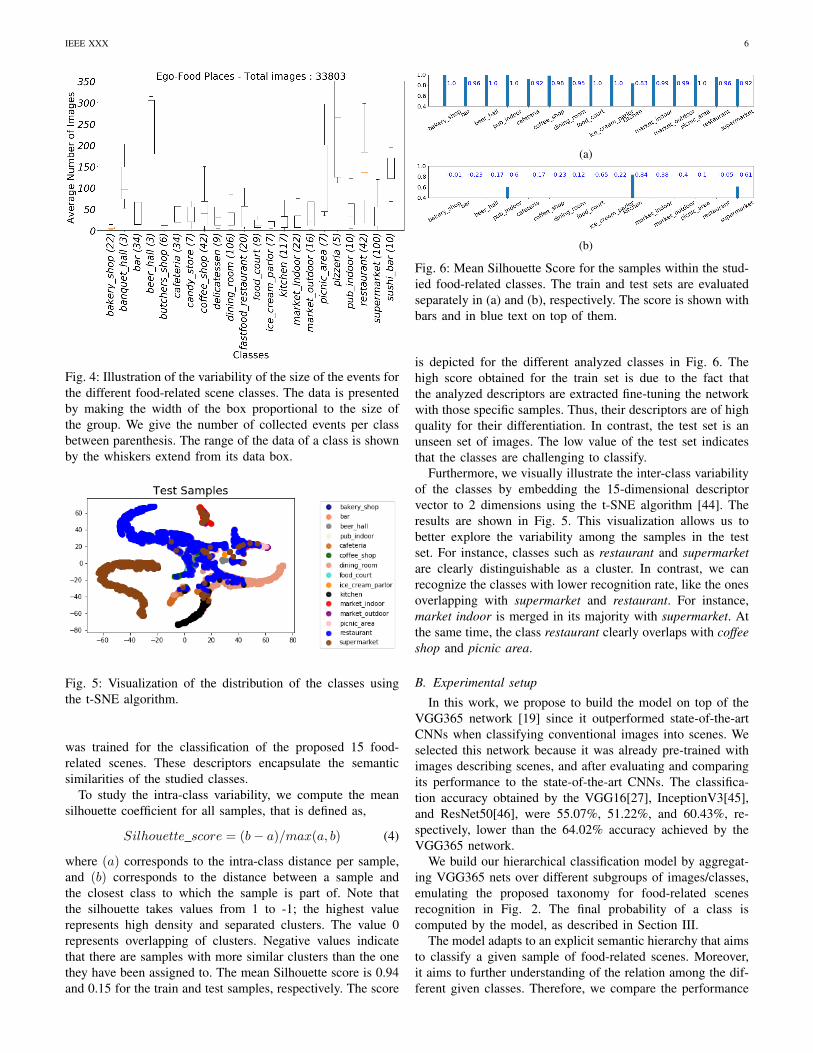
where (a) corresponds to the intra-class distance per sample,and (b) corresponds to the distance between a sample andthe closest class to which the sample is part of. Note thatthe silhouette takes values from 1 to -1; the highest valuerepresents high density and separated clusters. The value 0represents overlapping of clusters. Negative values indicatethat there are samples with more similar clusters than the onethey have been assigned to. The mean Silhouette score is 0.94and 0.15 for the train and test samples, respectively. The score
(a)
(b)
Fig. 6: Mean Silhouette Score for the samples within the stud-ied food-related classes. The train and test sets are evaluatedseparately in (a) and (b), respectively. The score is shown withbars and in blue text on top of them.
is depicted for the different analyzed classes in Fig. 6. Thehigh score obtained for the train set is due to the fact thatthe analyzed descriptors are extracted fine-tuning the networkwith those specific samples. Thus, their descriptors are of highquality for their differentiation. In contrast, the test set is anunseen set of images. The low value of the test set indicatesthat the classes are challenging to classify.
Furthermore, we visually illustrate the inter-class variabilityof the classes by embedding the 15-dimensional descriptorvector to 2 dimensions using the t-SNE algorithm [44]. Theresults are shown in Fig. 5. This visualization allows us tobetter explore the variability among the samples in the testset. For instance, classes such as restaurant and supermarketare clearly distinguishable as a cluster. In contrast, we canrecognize the classes with lower recognition rate, like the onesoverlapping with supermarket and restaurant. For instance,market indoor is merged in its majority with supermarket. Atthe same time, the class restaurant clearly overlaps with coffeeshop and picnic area.
B. Experimental setup
In this work, we propose to build the model on top of theVGG365 network [19] since it outperformed state-of-the-artCNNs when classifying conventional images into scenes. Weselected this network because it was already pre-trained withimages describing scenes, and after evaluating and comparingits performance to the state-of-the-art CNNs. The classifica-tion accuracy obtained by the VGG16[27], InceptionV3[45],and ResNet50[46], were 55.07%, 51.22%, and 60.43%, re-spectively, lower than the 64.02% accuracy achieved by theVGG365 network.
We build our hierarchical classification model by aggregat-ing VGG365 nets over different subgroups of images/classes,emulating the proposed taxonomy for food-related scenesrecognition in Fig. 2. The final probability of a class iscomputed by the model, as described in Section III.
The model adapts to an explicit semantic hierarchy that aimsto classify a given sample of food-related scenes. Moreover,it aims to further understanding of the relation among the dif-ferent given classes. Therefore, we compare the performance
IEEE XXX 7
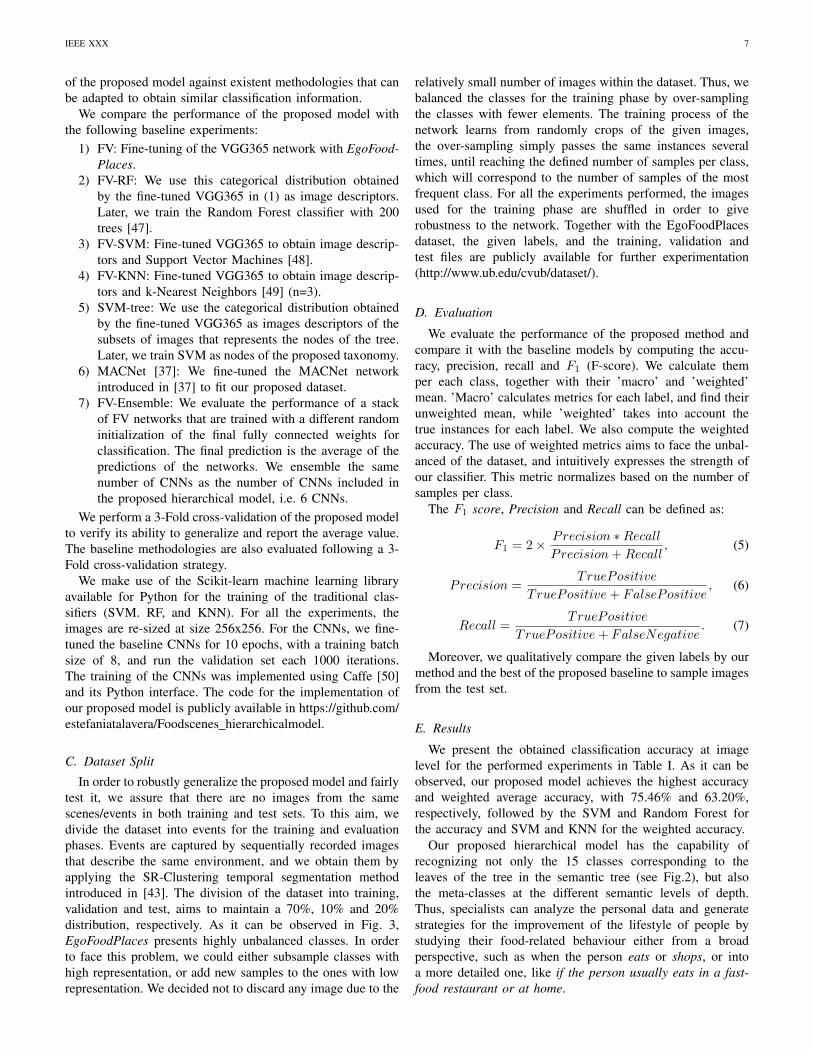
of the proposed model against existent methodologies that canbe adapted to obtain similar classification information.
We compare the performance of the proposed model withthe following baseline experiments:
1) FV: Fine-tuning of the VGG365 network with EgoFood-Places.
2) FV-RF: We use this categorical distribution obtainedby the fine-tuned VGG365 in (1) as image descriptors.Later, we train the Random Forest classifier with 200trees [47].
3) FV-SVM: Fine-tuned VGG365 to obtain image descrip-tors and Support Vector Machines [48].
4) FV-KNN: Fine-tuned VGG365 to obtain image descrip-tors and k-Nearest Neighbors [49] (n=3).
5) SVM-tree: We use the categorical distribution obtainedby the fine-tuned VGG365 as images descriptors of thesubsets of images that represents the nodes of the tree.Later, we train SVM as nodes of the proposed taxonomy.
6) MACNet [37]: We fine-tuned the MACNet networkintroduced in [37] to fit our proposed dataset.
7) FV-Ensemble: We evaluate the performance of a stackof FV networks that are trained with a different randominitialization of the final fully connected weights forclassification. The final prediction is the average of thepredictions of the networks. We ensemble the samenumber of CNNs as the number of CNNs included inthe proposed hierarchical model, i.e. 6 CNNs.
We perform a 3-Fold cross-validation of the proposed modelto verify its ability to generalize and report the average value.The baseline methodologies are also evaluated following a 3-Fold cross-validation strategy.
We make use of the Scikit-learn machine learning libraryavailable for Python for the training of the traditional clas-sifiers (SVM. RF, and KNN). For all the experiments, theimages are re-sized at size 256x256. For the CNNs, we fine-tuned the baseline CNNs for 10 epochs, with a training batchsize of 8, and run the validation set each 1000 iterations.The training of the CNNs was implemented using Caffe [50]and its Python interface. The code for the implementation ofour proposed model is publicly available in https://github.com/estefaniatalavera/Foodscenes hierarchicalmodel.
C. Dataset Split
In order to robustly generalize the proposed model and fairlytest it, we assure that there are no images from the samescenes/events in both training and test sets. To this aim, wedivide the dataset into events for the training and evaluationphases. Events are captured by sequentially recorded imagesthat describe the same environment, and we obtain them byapplying the SR-Clustering temporal segmentation methodintroduced in [43]. The division of the dataset into training,validation and test, aims to maintain a 70%, 10% and 20%distribution, respectively. As it can be observed in Fig. 3,EgoFoodPlaces presents highly unbalanced classes. In orderto face this problem, we could either subsample classes withhigh representation, or add new samples to the ones with lowrepresentation. We decided not to discard any image due to the
relatively small number of images within the dataset. Thus, webalanced the classes for the training phase by over-samplingthe classes with fewer elements. The training process of thenetwork learns from randomly crops of the given images,the over-sampling simply passes the same instances severaltimes, until reaching the defined number of samples per class,which will correspond to the number of samples of the mostfrequent class. For all the experiments performed, the imagesused for the training phase are shuffled in order to giverobustness to the network. Together with the EgoFoodPlacesdataset, the given labels, and the training, validation andtest files are publicly available for further experimentation(http://www.ub.edu/cvub/dataset/).
D. Evaluation
We evaluate the performance of the proposed method andcompare it with the baseline models by computing the accu-racy, precision, recall and F1 (F-score). We calculate themper each class, together with their ’macro’ and ’weighted’mean. ’Macro’ calculates metrics for each label, and find theirunweighted mean, while ’weighted’ takes into account thetrue instances for each label. We also compute the weightedaccuracy. The use of weighted metrics aims to face the unbal-anced of the dataset, and intuitively expresses the strength ofour classifier. This metric normalizes based on the number ofsamples per class.
The F1 score, Precision and Recall can be defined as:
F1 = 2× Precision ∗Recall
Precision + Recall, (5)
Precision =TruePositive
TruePositive + FalsePositive, (6)
Recall =TruePositive
TruePositive + FalseNegative. (7)
Moreover, we qualitatively compare the given labels by ourmethod and the best of the proposed baseline to sample imagesfrom the test set.
E. Results
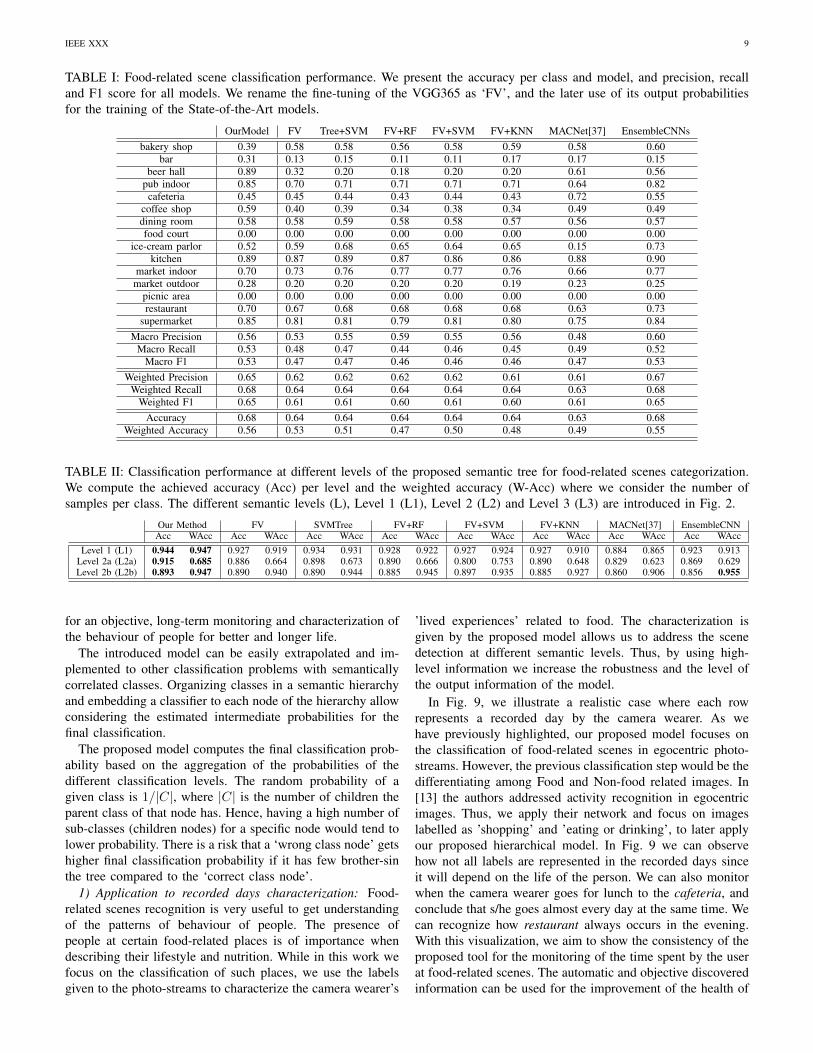
We present the obtained classification accuracy at imagelevel for the performed experiments in Table I. As it can beobserved, our proposed model achieves the highest accuracyand weighted average accuracy, with 75.46% and 63.20%,respectively, followed by the SVM and Random Forest forthe accuracy and SVM and KNN for the weighted accuracy.
Our proposed hierarchical model has the capability ofrecognizing not only the 15 classes corresponding to theleaves of the tree in the semantic tree (see Fig.2), but alsothe meta-classes at the different semantic levels of depth.Thus, specialists can analyze the personal data and generatestrategies for the improvement of the lifestyle of people bystudying their food-related behaviour either from a broadperspective, such as when the person eats or shops, or intoa more detailed one, like if the person usually eats in a fast-food restaurant or at home.
IEEE XXX 8
A logical question is if the model provides a robust classi-fication of meta-classes as well. To this aim, we evaluate theclassification performance at the different levels of the definedsemantic tree. Note that since each class is related to a meta-class on a higher level, an alternative to our model wouldbe to obtain the meta-classes accuracy from their sub-classesclassification. We compare the accuracy of meta-classes fromtheir classification by the proposed model vs inferring theaccuracy from the classification of the subclasses samples forthe set of baseline models. As one can observe in Table II,our model achieves higher accuracy classifying meta-classesin all cases with 94.7%, 68.5%, 94.7% for Level 1 (L1), Level2 (L2) and Level 3 (L3), respectively. This proves that it is arobust tool for the classification of food-related scenes classesand meta-classes.
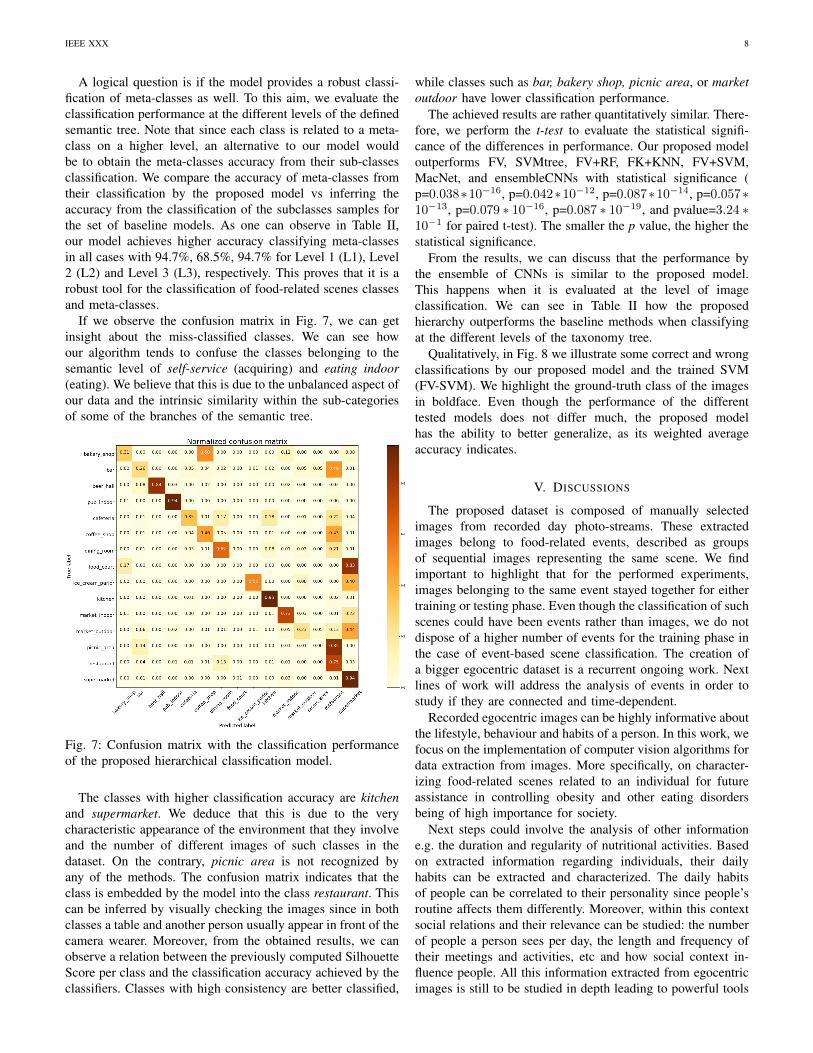
If we observe the confusion matrix in Fig. 7, we can getinsight about the miss-classified classes. We can see howour algorithm tends to confuse the classes belonging to thesemantic level of self-service (acquiring) and eating indoor(eating). We believe that this is due to the unbalanced aspect ofour data and the intrinsic similarity within the sub-categoriesof some of the branches of the semantic tree.
Fig. 7: Confusion matrix with the classification performanceof the proposed hierarchical classification model.
The classes with higher classification accuracy are kitchenand supermarket. We deduce that this is due to the verycharacteristic appearance of the environment that they involveand the number of different images of such classes in thedataset. On the contrary, picnic area is not recognized byany of the methods. The confusion matrix indicates that theclass is embedded by the model into the class restaurant. Thiscan be inferred by visually checking the images since in bothclasses a table and another person usually appear in front of thecamera wearer. Moreover, from the obtained results, we canobserve a relation between the previously computed SilhouetteScore per class and the classification accuracy achieved by theclassifiers. Classes with high consistency are better classified,
while classes such as bar, bakery shop, picnic area, or marketoutdoor have lower classification performance.
The achieved results are rather quantitatively similar. There-fore, we perform the t-test to evaluate the statistical signifi-cance of the differences in performance. Our proposed modeloutperforms FV, SVMtree, FV+RF, FK+KNN, FV+SVM,MacNet, and ensembleCNNs with statistical significance (p=0.038∗10−16, p=0.042∗10−12, p=0.087∗10−14, p=0.057∗10−13, p=0.079 ∗ 10−16, p=0.087 ∗ 10−19, and pvalue=3.24 ∗10−1 for paired t-test). The smaller the p value, the higher thestatistical significance.
From the results, we can discuss that the performance bythe ensemble of CNNs is similar to the proposed model.This happens when it is evaluated at the level of imageclassification. We can see in Table II how the proposedhierarchy outperforms the baseline methods when classifyingat the different levels of the taxonomy tree.
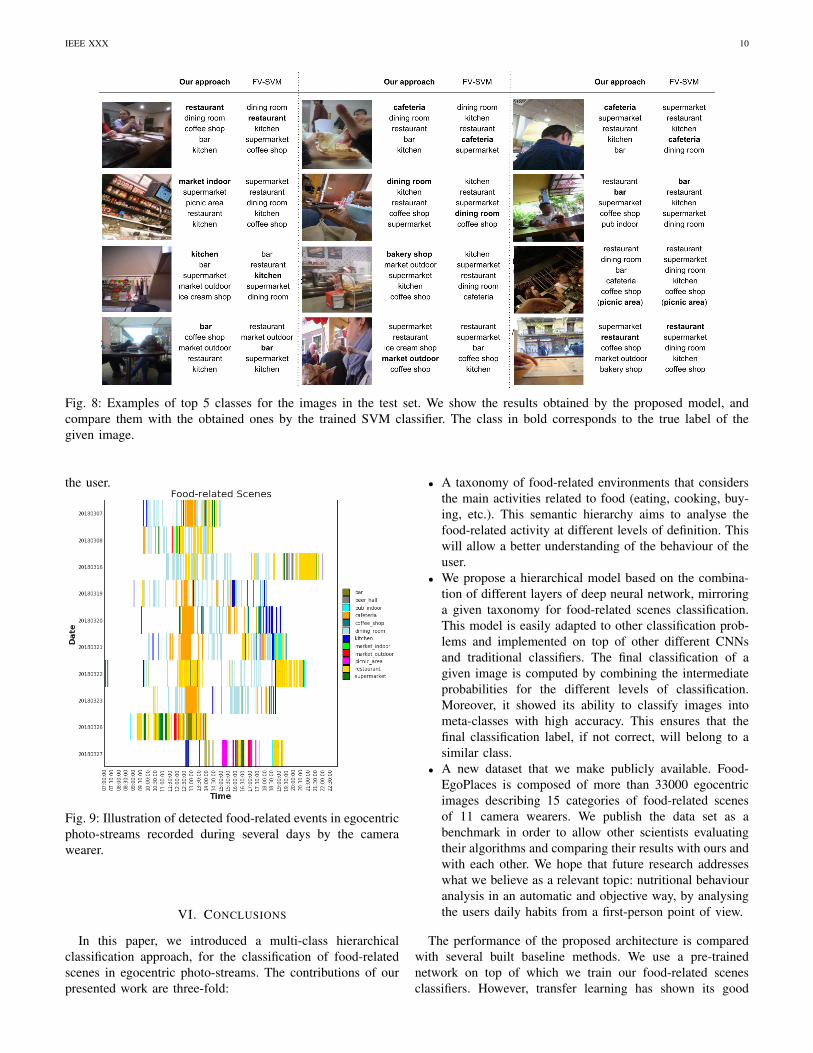
Qualitatively, in Fig. 8 we illustrate some correct and wrongclassifications by our proposed model and the trained SVM(FV-SVM). We highlight the ground-truth class of the imagesin boldface. Even though the performance of the differenttested models does not differ much, the proposed modelhas the ability to better generalize, as its weighted averageaccuracy indicates.
V. DISCUSSIONS
The proposed dataset is composed of manually selectedimages from recorded day photo-streams. These extractedimages belong to food-related events, described as groupsof sequential images representing the same scene. We findimportant to highlight that for the performed experiments,images belonging to the same event stayed together for eithertraining or testing phase. Even though the classification of suchscenes could have been events rather than images, we do notdispose of a higher number of events for the training phase inthe case of event-based scene classification. The creation ofa bigger egocentric dataset is a recurrent ongoing work. Nextlines of work will address the analysis of events in order tostudy if they are connected and time-dependent.
Recorded egocentric images can be highly informative aboutthe lifestyle, behaviour and habits of a person. In this work, wefocus on the implementation of computer vision algorithms fordata extraction from images. More specifically, on character-izing food-related scenes related to an individual for futureassistance in controlling obesity and other eating disordersbeing of high importance for society.
Next steps could involve the analysis of other informatione.g. the duration and regularity of nutritional activities. Basedon extracted information regarding individuals, their dailyhabits can be extracted and characterized. The daily habitsof people can be correlated to their personality since people’sroutine affects them differently. Moreover, within this contextsocial relations and their relevance can be studied: the numberof people a person sees per day, the length and frequency oftheir meetings and activities, etc and how social context in-fluence people. All this information extracted from egocentricimages is still to be studied in depth leading to powerful tools
IEEE XXX 9
TABLE I: Food-related scene classification performance. We present the accuracy per class and model, and precision, recalland F1 score for all models. We rename the fine-tuning of the VGG365 as ‘FV’, and the later use of its output probabilitiesfor the training of the State-of-the-Art models.
OurModel FV Tree+SVM FV+RF FV+SVM FV+KNN MACNet[37] EnsembleCNNsbakery shop 0.39 0.58 0.58 0.56 0.58 0.59 0.58 0.60
bar 0.31 0.13 0.15 0.11 0.11 0.17 0.17 0.15beer hall 0.89 0.32 0.20 0.18 0.20 0.20 0.61 0.56
pub indoor 0.85 0.70 0.71 0.71 0.71 0.71 0.64 0.82cafeteria 0.45 0.45 0.44 0.43 0.44 0.43 0.72 0.55
coffee shop 0.59 0.40 0.39 0.34 0.38 0.34 0.49 0.49dining room 0.58 0.58 0.59 0.58 0.58 0.57 0.56 0.57food court 0.00 0.00 0.00 0.00 0.00 0.00 0.00 0.00
ice-cream parlor 0.52 0.59 0.68 0.65 0.64 0.65 0.15 0.73kitchen 0.89 0.87 0.89 0.87 0.86 0.86 0.88 0.90
market indoor 0.70 0.73 0.76 0.77 0.77 0.76 0.66 0.77market outdoor 0.28 0.20 0.20 0.20 0.20 0.19 0.23 0.25
picnic area 0.00 0.00 0.00 0.00 0.00 0.00 0.00 0.00restaurant 0.70 0.67 0.68 0.68 0.68 0.68 0.63 0.73
supermarket 0.85 0.81 0.81 0.79 0.81 0.80 0.75 0.84Macro Precision 0.56 0.53 0.55 0.59 0.55 0.56 0.48 0.60
Macro Recall 0.53 0.48 0.47 0.44 0.46 0.45 0.49 0.52Macro F1 0.53 0.47 0.47 0.46 0.46 0.46 0.47 0.53
Weighted Precision 0.65 0.62 0.62 0.62 0.62 0.61 0.61 0.67Weighted Recall 0.68 0.64 0.64 0.64 0.64 0.64 0.63 0.68
Weighted F1 0.65 0.61 0.61 0.60 0.61 0.60 0.61 0.65Accuracy 0.68 0.64 0.64 0.64 0.64 0.64 0.63 0.68
Weighted Accuracy 0.56 0.53 0.51 0.47 0.50 0.48 0.49 0.55
TABLE II: Classification performance at different levels of the proposed semantic tree for food-related scenes categorization.We compute the achieved accuracy (Acc) per level and the weighted accuracy (W-Acc) where we consider the number ofsamples per class. The different semantic levels (L), Level 1 (L1), Level 2 (L2) and Level 3 (L3) are introduced in Fig. 2.
Our Method FV SVMTree FV+RF FV+SVM FV+KNN MACNet[37] EnsembleCNNAcc WAcc Acc WAcc Acc WAcc Acc WAcc Acc WAcc Acc WAcc Acc WAcc Acc WAcc
Level 1 (L1) 0.944 0.947 0.927 0.919 0.934 0.931 0.928 0.922 0.927 0.924 0.927 0.910 0.884 0.865 0.923 0.913Level 2a (L2a) 0.915 0.685 0.886 0.664 0.898 0.673 0.890 0.666 0.800 0.753 0.890 0.648 0.829 0.623 0.869 0.629Level 2b (L2b) 0.893 0.947 0.890 0.940 0.890 0.944 0.885 0.945 0.897 0.935 0.885 0.927 0.860 0.906 0.856 0.955
for an objective, long-term monitoring and characterization ofthe behaviour of people for better and longer life.
The introduced model can be easily extrapolated and im-plemented to other classification problems with semanticallycorrelated classes. Organizing classes in a semantic hierarchyand embedding a classifier to each node of the hierarchy allowconsidering the estimated intermediate probabilities for thefinal classification.
The proposed model computes the final classification prob-ability based on the aggregation of the probabilities of thedifferent classification levels. The random probability of agiven class is 1/|C|, where |C| is the number of children theparent class of that node has. Hence, having a high number ofsub-classes (children nodes) for a specific node would tend tolower probability. There is a risk that a ‘wrong class node’ getshigher final classification probability if it has few brother-sinthe tree compared to the ‘correct class node’.
1) Application to recorded days characterization: Food-related scenes recognition is very useful to get understandingof the patterns of behaviour of people. The presence ofpeople at certain food-related places is of importance whendescribing their lifestyle and nutrition. While in this work wefocus on the classification of such places, we use the labelsgiven to the photo-streams to characterize the camera wearer’s
’lived experiences’ related to food. The characterization isgiven by the proposed model allows us to address the scenedetection at different semantic levels. Thus, by using high-level information we increase the robustness and the level ofthe output information of the model.
In Fig. 9, we illustrate a realistic case where each rowrepresents a recorded day by the camera wearer. As wehave previously highlighted, our proposed model focuses onthe classification of food-related scenes in egocentric photo-streams. However, the previous classification step would be thedifferentiating among Food and Non-food related images. In[13] the authors addressed activity recognition in egocentricimages. Thus, we apply their network and focus on imageslabelled as ’shopping’ and ’eating or drinking’, to later applyour proposed hierarchical model. In Fig. 9 we can observehow not all labels are represented in the recorded days sinceit will depend on the life of the person. We can also monitorwhen the camera wearer goes for lunch to the cafeteria, andconclude that s/he goes almost every day at the same time. Wecan recognize how restaurant always occurs in the evening.With this visualization, we aim to show the consistency of theproposed tool for the monitoring of the time spent by the userat food-related scenes. The automatic and objective discoveredinformation can be used for the improvement of the health of
IEEE XXX 10
Fig. 8: Examples of top 5 classes for the images in the test set. We show the results obtained by the proposed model, andcompare them with the obtained ones by the trained SVM classifier. The class in bold corresponds to the true label of thegiven image.
the user.
Fig. 9: Illustration of detected food-related events in egocentricphoto-streams recorded during several days by the camerawearer.
VI. CONCLUSIONS
In this paper, we introduced a multi-class hierarchicalclassification approach, for the classification of food-relatedscenes in egocentric photo-streams. The contributions of ourpresented work are three-fold:
• A taxonomy of food-related environments that considersthe main activities related to food (eating, cooking, buy-ing, etc.). This semantic hierarchy aims to analyse thefood-related activity at different levels of definition. Thiswill allow a better understanding of the behaviour of theuser.
• We propose a hierarchical model based on the combina-tion of different layers of deep neural network, mirroringa given taxonomy for food-related scenes classification.This model is easily adapted to other classification prob-lems and implemented on top of other different CNNsand traditional classifiers. The final classification of agiven image is computed by combining the intermediateprobabilities for the different levels of classification.Moreover, it showed its ability to classify images intometa-classes with high accuracy. This ensures that thefinal classification label, if not correct, will belong to asimilar class.
• A new dataset that we make publicly available. Food-EgoPlaces is composed of more than 33000 egocentricimages describing 15 categories of food-related scenesof 11 camera wearers. We publish the data set as abenchmark in order to allow other scientists evaluatingtheir algorithms and comparing their results with ours andwith each other. We hope that future research addresseswhat we believe as a relevant topic: nutritional behaviouranalysis in an automatic and objective way, by analysingthe users daily habits from a first-person point of view.
The performance of the proposed architecture is comparedwith several built baseline methods. We use a pre-trainednetwork on top of which we train our food-related scenesclassifiers. However, transfer learning has shown its good
IEEE XXX 11
performance when addressing problems where the lack of hugeamounts of data is a problem. By building on top of pre-trained networks, we achieve results that outperform traditionaltechniques on the classification of egocentric images intochallenging food-related scenes. Moreover and as an incentive,the proposed model has the ability of end-to-end automaticallyclassifying different semantic levels of depth. Thus, specialistscan analyze the nutritional habits of people and generate rec-ommendations for improvement of their lifestyle by studyingtheir food-related behaviour either from a broad perspective,such as when the person eats or shops, or into a more detailedone, like when the person is eating in a fast-food restaurant.
The analysis of the eating-routine of a person within itscontext/environment can help to control his/her diet better. Forinstance, someone could be interested in knowing the numberof times per month that s/he goes to eat somewhere (last layerof the taxonomy). Moreover, our system can help to quantifythe time spent at fast-food restaurants, that have shown tonegatively affect adolescents health [51]. In a different clinicalaspect, the capacities for preparing meal or shopping areconsidered as one of the main instrumental daily activities toevaluate cognitive decline [52]. Our model allows analysingthe custodian activities related to food-scenes represented inthe first layer of the taxonomy. Hence, our proposed modelintegrates a set of food-related scenes and activities, that canboost numerous applications with very different clinical orsocial goals.
As future work, we plan to explore how to enrich ourdata using domain adaptation techniques. Domain adaptationallows the adaptation of the distribution of data to other targetdata distribution. Egocentric datasets tend to be relatively smalldue to the low-frequency rate of the recording cameras. Webelieve that by combining techniques of transfer learning,we will be able to explore how the collected dataset can beextrapolated to already available data, sets such as Places2.We expect that the combination of data distributions willimprove the achieved classification performance. Therefore,further analysis of this line will allow us to get a betterunderstanding of people’s lifestyle, which will give insightinto their health and daily habits.
ACKNOWLEDGMENT
This work was partially funded by projects TIN2015-66951-C2, SGR 1742, CERCA, Nestore Horizon2020 SC1-PM-15-2017 (n 769643), ICREA Academia 2014 and Grant 20141510(Marato TV3). The founders had no role in the study design,data collection, analysis, and preparation of the manuscript.The authors gratefully acknowledge the support of NVIDIACorporation with the donation of several Titan Xp GPU usedfor this research. The collected data as part of the study andgiven labels is publicly available from the research group’swebsite: http://www.ub.edu/cvub/dataset/
REFERENCES
[1] M. N. Laska, M. O. Hearst, K. Lust, L. A. Lytle, and M. Story, “How weeat what we eat: identifying meal routines and practices most stronglyassociated with healthy and unhealthy dietary factors among youngadults,” Public health nutrition, vol. 18, no. 12, pp. 2135–2145, 2015.
[2] P. M. Stalonas and D. S. Kirschenbaum, “Behavioral treatments forobesity: Eating habits revisited,” Behavior Therapy, vol. 16, no. 1, pp.1–14, 1985.
[3] J. B. Hopkinson, D. N. Wright, J. W. McDonald, and J. L. Corner,“The prevalence of concern about weight loss and change in eatinghabits in people with advanced cancer,” Journal of pain and symptommanagement, vol. 32, no. 4, pp. 322–331, 2006.
[4] L. M. Donini, C. Savina, and C. Cannella, “Eating habits and appetitecontrol in the elderly: the anorexia of aging,” International psychogeri-atrics, vol. 15, no. 1, pp. 73–87, 2003.
[5] A. Tal and B. Wansink, “Fattening Fasting: Hungry Grocery ShoppersBuy More Calories, Not More Food,” JAMA Intern Med., vol. 173,no. 12, pp. 1146–1148, 2013.
[6] S. Higgs and J. Thomas, “Social influences on eating,” Current Opinionin Behavioral Sciences, vol. 9, pp. 1–6, 2016.
[7] E. Kemps, M. Tiggemann, and S. Hollitt, “Exposure to television foodadvertising primes food-related cognitions and triggers motivation toeat,” Psychology & Health, vol. 29, no. 10, p. 1192, 2014.
[8] W. B. S. C. Ren A de Wijk, Ilse A Polet and J. H. Bult, “Food aromaaffects bite size,” BioMed Central, pp. 1–3, 2012.
[9] N. Larson, M. Story, and M. J, “A review of environmental influenceson food choices,” Annals of Behavioural Medicine, vol. 38, pp. 56–73,2009.
[10] Z. Falomir, “Qualitative distances and qualitative description of imagesfor indoor scene description and recognition in robotics,” AI Communi-cations, vol. 25, no. 4, pp. 387–389, 2012.
[11] D. Makris and T. Ellis, “Learning semantic scene models from observingactivity in visual surveillance,” IEEE Transactions on Systems, Man, andCybernetics, Part B (Cybernetics), vol. 35, no. 3, pp. 397–408, 2005.
[12] M. Higuchi and S. Yokota, “Imaging environment recognition device,”Jul. 19 2011, uS Patent 7,983,447.
[13] A. Cartas, J. Marın, P. Radeva, and M. Dimiccoli, “Batch-based activityrecognition from egocentric photo-streams revisited,” Pattern Analysisand Applications, vol. 21, no. 4, pp. 953–965, 2018.
[14] J. M. Fontana, M. Farooq, and E. Sazonov, “Automatic ingestionmonitor: a novel wearable device for monitoring of ingestive behavior,”IEEE Transactions on Biomedical Engineering, vol. 61, no. 6, pp. 1772–1779, 2014.
[15] D. Ravı, B. Lo, and G.-Z. Yang, “Real-time food intake classificationand energy expenditure estimation on a mobile device,” Wearable andImplantable Body Sensor Networks (BSN), 2015 IEEE 12th InternationalConference on, pp. 1–6, 2015.
[16] J. Liu, E. Johns, L. Atallah, C. Pettitt, B. Lo, G. Frost, and G.-Z. Yang,“An intelligent food-intake monitoring system using wearable sensors,”2012 Ninth International Conference on Wearable and Implantable BodySensor Networks, pp. 154–160, 2012.
[17] S. Lazebnik, C. Schmid, and J. Ponce, “Beyond bags of features: Spatialpyramid matching for recognizing natural scene categories,” Proceedingsof the IEEE Computer Society Conference on Computer Vision andPattern Recognition, vol. 2, pp. 2169–2178, 2006.
[18] A. Quattoni and A. Torralba, “Recognizing indoor scenes.” IEEEConference on Computer Vision and Pattern Recognition, pp. 413–420,2009.
[19] B. Zhou, A. Lapedriza, A. Khosla, A. Oliva, and A. Torralba, “Places:A 10 million image database for scene recognition,” IEEE Transactionson Pattern Analysis and Machine Intelligence, vol. 40, pp. 1452–1464,2018.
[20] Y. LeCun, L. Bottou, Y. Bengio, and P. Haffner, “Gradient-based learningapplied to document recognition,” Proceedings of the IEEE, vol. 86,no. 11, pp. 2278–2324, 1998.
[21] D. D. Lewis, “Reuters-21578,” Test Collections 1, 1987.[22] J. Garofolo and et al., “TIMIT Acoustic-Phonetic Continuous Speech
Corpus,” Philadelphia: Linguistic Data Consortium, 1993.[23] J. Deng, W. Dong, R. Socher, L.-J. Li, K. Li, and L. Fei-Fei, “Imagenet:
A large-scale hierarchical image database,” Computer Vision and PatternRecognition, pp. 248–255, 2009.
[24] C. Szegedy, W. Liu, Y. Jia, P. Sermanet, S. Reed, D. Anguelov, D. Erhan,V. Vanhoucke, and A. Rabinovich, “Going deeper with convolutions,”IEEE Conference on Computer Vision and Pattern Recognition, pp. 1–9,2015.
[25] A. Krizhevsky, I. Sutskever, and G. E. Hinton, “Imagenet classificationwith deep convolutional neural networks,” Advances in neural informa-tion processing systems, pp. 1097–1105, 2012.
[26] K. He, X. Zhang, S. Ren, and J. Sun, “Deep residual learning forimage recognition,” IEEE Conference on Computer Vision and PatternRecognition, pp. 770–778, 2016.
IEEE XXX 12
[27] K. Simonyan and A. Zisserman, “Very Deep Convolutional Networks forLarge-Scale Image Recognition,” International Conference on LearningRepresentations (ICRL), pp. 1–14, 2015.
[28] F. Yu, A. Seff, Y. Zhang, S. Song, T. Funkhouser, and J. Xiao, “Lsun:Construction of a large-scale image dataset using deep learning withhumans in the loop,” arXiv preprint arXiv:1506.03365, 2015.
[29] B. Zhou, A. Lapedriza, J. Xiao, A. Torralba, and A. Oliva, “LearningDeep Features for Scene Recognition using Places Database,” Advancesin Neural Information Processing Systems 27, pp. 487–495, 2014.
[30] B. Zhou, A. Khosla, A. Lapedriza, A. Torralba, and A. Oliva, “Places:An Image Database for Deep Scene Understanding,” ArXiv, pp. 1–12,2016.
[31] M. Koskela and J. Laaksonen, “Convolutional network features for scenerecognition,” Proceedings of the 22nd ACM international conference onMultimedia, pp. 1169–1172, 2014.
[32] L. Zheng, S. Wang, F. He, and Q. Tian, “Seeing the big picture: Deepembedding with contextual evidences,” CoRR, vol. abs/1406.0132, 2014.
[33] L. Wang, Z. Wang, and W. Du, “Object-Scene Convolutional NeuralNetworks for Event Recognition in Images,” IEEE Conference onComputer Vision and Pattern Recognition Workshops, pp. 1–6, 2015.
[34] L. Herranz, S. Jiang, and X. Li, “Scene Recognition With CNNs:Objects, Scales and Dataset Bias,” Conference on Computer Vision andPattern Recognition, pp. 571–579, 2016.
[35] A. Furnari, G. M. Farinella, and S. Battiato, “Temporal segmentation ofegocentric videos to highlight personal locations of interest,” EuropeanConference on Computer Vision, pp. 474–489, 2016.
[36] A. Furnari, G. Farinella, and S. Battiato, “Recognizing Personal Loca-tions From Egocentric Videos,” IEEE Transactions on Human-MachineSystems, vol. 47, no. 1, pp. 1–13, 2017.
[37] M. Sarker, M. Kamal, H. A. Rashwan, E. Talavera, S. F. Banu, P. Radeva,and D. Puig, “Macnet: Multi-scale atrous convolution networks forfood places classification in egocentric photo-streams,” arXiv preprintarXiv:1808.09829, 2018.
[38] L.-C. Chen, G. Papandreou, I. Kokkinos, K. Murphy, and A. L. Yuille,“Deeplab: Semantic image segmentation with deep convolutional nets,atrous convolution, and fully connected crfs,” IEEE transactions onpattern analysis and machine intelligence, vol. 40(4), pp. 834–848, 2018.
[39] B. Schmand, G. Walstra, J. Lindeboom, S. Teunisse, and C. Jonker,“Early detection of alzheimer’s disease using the cambridge cognitiveexamination,” Psychological Medicine, vol. 30(3), pp. 619–627, 2000.
[40] R. C. Petersen, G. E. Smith, S. C. Waring, R. J. Ivnik, E. G. Tangalos,and E. Kokmen, “Mild cognitive impairment: clinical characterizationand outcome,” Archives of neurology, vol. 56, no. 3, pp. 303–308, 1999.
[41] O. Pujol, P. Radeva, and J. Vitria, “Discriminant ECOC: A heuristicmethod for application dependent design of error correcting outputcodes,” IEEE Trans. Pattern Anal. Mach. Intell., vol. 28(6), pp. 1007–1012, 2006.
[42] E. Talavera, M. Dimiccoli, M. Bolanos, M. Aghaei, and P. Radeva, “R-clustering for egocentric video segmentation,” Iberian Conference onPattern Recognition and Image Analysis, pp. 327–336, 2015.
[43] M. Dimiccoli, M. Bolanos, E. Talavera, M. Aghaei, S. G. Nikolov, andP. Radeva, “Sr-clustering: Semantic regularized clustering for egocentricphoto streams segmentation,” Computer Vision and Image Understand-ing, vol. 155, pp. 55–69, 2017.
[44] L. v. d. Maaten and G. Hinton, “Visualizing data using t-sne,” Journalof machine learning research, vol. 9, pp. 2579–2605, 2008.
[45] C. Szegedy, V. Vanhoucke, S. Ioffe, J. Shlens, and Z. Wojna, “Rethinkingthe inception architecture for computer vision,” Conference on ComputerVision and Pattern Recognition, pp. 2818–2826, 2016.
[46] K. He, X. Zhang, S. Ren, and J. Sun, “Deep residual learning forimage recognition,” IEEE Conference on Computer Vision and PatternRecognition, pp. 770–778, 2016.
[47] T. K. Ho, “Random decision forests,” Proceedings of the Third Inter-national Conference on Document Analysis and Recognition Vol.1, pp.278–282, 1995.
[48] C. Cortes and V. Vapnik, “Support-vector networks,” Machine learning,vol. 20, no. 3, pp. 273–297, 1995.
[49] N. S. Altman, “An introduction to kernel and nearest-neighbor non-parametric regression,” The American Statistician, vol. 46, no. 3, pp.175–185, 1992.
[50] Y. Jia, E. Shelhamer, J. Donahue, S. Karayev, J. Long, R. Girshick,S. Guadarrama, and T. Darrell, “Caffe: Convolutional architecture forfast feature embedding,” pp. 675–678, 2014.
[51] R. W. Jeffery, J. Baxter, M. McGuire, and J. Linde, “Are fast foodrestaurants an environmental risk factor for obesity?” InternationalJournal of Behavioral Nutrition and Physical Activity, vol. 3, no. 1,p. 2, 2006.
[52] S. Morrow, “Instrumental activities of daily living scale,” AJN TheAmerican Journal of Nursing, vol. 99, no. 1, p. 24CC, 1999.
Estefania Talavera received her BSc degree in elec-tronic engineering from Balearic Islands Universityin 2012 and her MSc degree in biomedical engi-neering from Polytechnic University of Catalonia in2014. She is currently a PhD student at the Uni-versity of Barcelona and University of Groningen.Her research interests are lifelogging and healthapplications.
Mara Leyva received her BSc degree in SoftwareEngineering from the University of Oviedo in 2011.She continued her studies with the MSc in ArtificialIntelligence in the Polytechnic University of Cat-alonia, graduating in 2017. She is currently a PhDStudent at the Johann Bernoulli Institute for Math-ematics and Computer Science in the University ofGroningen.
Md. Mostafa Kamal Sarker Md, Mostafa KamalSarker is a PhD student at the Intelligent Roboticsand Computer Vision group, Rovira i Virgili Uni-verisity. He received his M.S. degree from ChonbukNational University, South Korea. His research in-terests include the areas of image processing, pat-tern recognition, computer vision, machine learning,deep learning, egocentric vision and visual lifelog-ging.
Dr. Domenec Puig received the M.S. and Ph.D.degrees in computer science from Polytechnic Uni-versity of Catalonia, Barcelona, Spain. He is Asso-ciate Professor at the Department of Computer Sci-ence and Mathematics at Rovira i Virgili University,Spain. He is the Head of the Intelligent Roboticsand Computer Vision group at the same university.His research interests include image processing, tex-ture analysis, perceptual models for image analysis,scene analysis, and mobile robotics.
Prof. Nicolai Petkov received the Dr.Sc.Techn.degree in Computer Engineering from the DresdenUniversity of Technology, Germany. He is Profes-sor and Head of the Intelligent Systems group ofthe Bernoulli Institute for Mathematics, ComputerScience and Artificial Intelligence of the Universityof Groningen, the Netherlands. His current researchis in image processing, computer vision and pat-tern recognition, and includes computer simulationsof the visual system of the brain, brain-inspiredcomputing, and applications in health care and life
sciences.
Prof. Petia Radeva is a senior researcher andprofessor at the University of Barcelona (UB). Sheis Head of Computer Vision at the UB group and theMiLab of Computer Vision Center. Her present re-search interests are on the development of learning-based approaches for computer vision, egocentricvision and medical imaging.