Embed Size (px)
Citation preview

IEEE TRANSACTIONS ON MULTIMEDIA, DECEMBER 2015 1
User Perceived Quality Assessment of DesignStrategies for HTTP-Based Adaptive Streaming
Ayush Bhargava, Yunhui Fu, Sabarish V. Babu and James Martin, Clemson University
Abstract—HTTP-based Adaptive Streaming (HAS) is now the dominant video streaming application on the Internet. One specific formof HAS, Dynamic Adaptive Streaming over HTTP (DASH), piques interest as it is the protocol used by Netflix. While a tremendousamount of prior research has focused on networking and protocol issues and established current understanding of video qualityassessment, the perspective of our work is primarily broadcast video. Assessing video quality for HAS requires an understanding of theprior research but brings additional complexity. The HAS adaptation algorithm becomes the dominant factor when the networkbecomes congested. As network is impaired, the adaptation algorithm selects data from a lower quality representation of the contentwhich leads to reduced network bandwidth consumption. While traditional broadcast video suffers from artifacts such as playbackfreeze, stutters, and various rendering distortions, HAS primarily suffers buffer stalls due to insufficient data in the playback buffer. Thedesign strategy for the adaptation algorithm derives in large part from the approach to mitigate the conflict between avoiding bufferstalls and maximizing video quality. The community has identified ‘best practice guidelines’ based on results that provide high levelguidance that indicates factors such as stalls, rate of quality changes, and overall video quality are important. In this paper, we presentthe results of a user study designed to provide further insight and detail to these guidelines.
Index Terms—HTTP-based Adaptive Streaming (HAS), Imperial Evaluation, Internet streaming, Quality of Experience(QoE), Userstudy, Video streaming subjective assessment
F
1 INTRODUCTION
As described in Sandvine’s most recent Internet trafficreport [], [1], Internet video streaming, referred to as HTTP-Based Adaptive Streaming (HAS), consumes more than67% of the downstream bandwidth delivered to fixed accessend point. A recent forecast from Cisco predicts that videotraffic will represent 80% of all consumer Internet traffic by2019 [2]. Ten years ago the term Internet video streamingassumed UDP transport. Today Internet video streamingtypically involves a TCP streaming system that is based ona form of HTTP-based Adaptive Streaming (HAS). Variousapproaches for HAS have evolved from companies suchas Netflix, Microsoft, Apple, and Google. This evolutionmotivated the development of the Dynamic AdaptiveStreaming over HTTP (DASH) Protocol. DASH providesa standard method for containing and distributing videocontent over the Internet [2], [3]. Both Netflix and Youtubenow support DASH. Further, HTML5 has been extendedto support HAS javascript-based client players. This latteradvancement is significant as it makes the technologyaccessible to developers and open-source communities. Tosupport the user study that we describe in this paper, wehave built a DASH-compliant broadcast system. To simplifythe presentation, we refer to the system under study as HAS.
As illustrated in figure 1, a HAS system consists ofa server and a client. A HAS web server holds encodedcontent packaged in the correct manner. Content is dividedinto self-contained ‘chunks’ referred to as segments suchthat the client can decode the content independent of
• E-mail: see http://cybertiger.clemson.edu/vss/contact.html•
previous or future segments. Each segment representsa specific amount of video in terms of viewing time.The amount of data contained in a segment dependson how it was encoded. A content provider will createmultiple representations of the content, each correspondingto a different level of video quality. Figure 1 illustratesone content selection (for example, one movie) that hasbeen encoded into four different representations. Thehighest quality representation would likely representhigh definition video and the lowest quality would likelyrepresent less than standard definition quality. A foursecond segment (which is a reasonable segment sizeparameter) encoded at high quality could require an orderof magnitude more bandwidth than that required by thelowest quality representation. At the start of a session, theclient receives a Media Presentation Description (MPD) filefor the content selection which identifies the possible bitrateoptions as well as the URL name of all segments.
The client consists of a playback buffer, a controller,and a video player. The playback buffer holds a sufficientamount of video data such that if the network temporarilyexperiences impairment either due to network congestionor wireless connectivity, the player can continue to playbackthe stream without stalling. The controller monitors thearrival rate of data as well as the state of the playbackbuffer. It determines when the client should requestadditional content. The video player consumes video datafrom the playback buffer at a rate based on the encodedvideo rate. If the video player requires more data but theplayback buffer is empty, the player moves into a stallstate referred to as a rebuffering event, the player will notresume rendering video until a minimum amount of data

IEEE TRANSACTIONS ON MULTIMEDIA, DECEMBER 2015 2
Fig. 1. HAS System Model
has been buffered. We describe in more detail the types ofartifacts that are possible in a HAS system later in the paper.
When the network is not congested, the client selectsthe highest quality video representation. When the networkbecomes congested, the client could select lower qualityvideo segments. This adaptation algorithm, which operatesat the controller in Fig. 1, makes decisions based on recentlyobserved network and system conditions. The premisebehind HAS is that reducing the requested video qualityto match available network bandwidth leads to improvedperceived quality. The HAS adaptation algorithm mustaddress the conflicting design goals of maintaining highvideo quality and minimizing buffer stalls. In its simplestform, the former is achieved by having the HAS clientrequest the highest quality segments that conditions appearto support while the latter is achieved by having the clientmake adaptation decisions based only on the state of theplayback buffer. The two approaches refer to capacity-basedand buffer-based adaptation respectively. A capacity-basedapproach prioritizes high video quality and assumes theprediction of available bandwidth is sufficient to avoidbuffer stalls. Buffer-based adaptation assumes that themost reliable method for avoiding buffer stalls is to basethe video quality adaptation on the current state of theplayback buffer.
The two approaches represent opposite ends of therange of design strategies. The best approach is likelya compromise which is quite difficult to pinpoint. Theevaluation of a specific adaptation algorithm requires amethod for obtaining perceived quality assessments fromusers viewing the video stream. An accurate assessmentwould likely involve a utility function that includes
potentially many quality contribution components. Whilethere have been recent contributions towards understandingperceived quality in HAS (see for example [Survey] andits references), there are few studies that provide specificguidance. In fact, most papers that study HAS adaptationrely on a small number of published results that collectivelyprovide best practices towards HAS design. The work in[4] suggests that buffer stalls have the biggest impact onuser engagement. The work in [5] suggests that frequentadaptations are distracting. The work in [6] suggests thatsudden changes in video quality trigger poor subjectivevideo quality scores.
The underlying objective of this research is to providemore concrete design guidance and further insight for aHAS adaptation algorithm than what the current best prac-tices provide. In this paper, we present the results of auser study that we have conducted at Clemson Universitythat tightly couples human assessment in the evaluation ofdesign choices available to a HAS adaptation algorithm.
2 RELATED WORK
The development and study of HAS systems representone of the most active areas of research in the networkingresearch community. The interaction between a HAS client(i.e., the player) and server has been established in recentacademic research [7], [9], [14], [17], [39]. In a HAS system,video and audio content is encoded and made available atservers located either at the content providers facilities ordistributed to locations in the Internet by a content deliverynetwork provider. Multiple representations of the contentare created that reflect a range of possible encoded bitratescorresponding to different levels of video quality and
IEEE TRANSACTIONS ON MULTIMEDIA, DECEMBER 2015 3
subsequently different levels of bandwidth consumption.
The more challenging aspect of HAS is perceived qual-ity assessment. The foundations are based on the vastamount of research on video quality assessment that comesprimarily from the broadcast video community [18], [19],[25]. Objective metrics such as peak signal-to-noise ratio(PSNR), vision-based metrics, or packet-stream orientedmetrics attempt to programmatically compute video quality[25]. Some metrics require a frame-by-frame comparisonbetween a reference video and the video under assessment.No-reference video limits the analysis to the observed video,greatly enhancing the flexibility of assessment. However, thechallenge with no-reference assessment is being able to ac-curately differentiate quality degradation from the originalcontent. Subjective video quality assessment involves askinghuman subjects for their opinion of the video quality. Whilethere are guidelines, subjective video quality assessment canbe difficult due to the complexity and difficulties surround-ing large scale user studies [26], [27], [28]. There are severalspecific results from this prior literature that can be appliedto HAS:
• Users are more tolerant of reduced video quality thatis stable than a video session that frequently changesbetween various levels of quality [5], [12].
• The percentage of time spent buffering has the largestimpact on user engagement across all types of content[4].
• QoE due to frame rate jerkiness changes logarithmicallyand user prefer a single long stall than multiple shortstalls [37].
The 3GPP community has identified several qualitymetrics for HAS including HTTP request/responsetransaction times, average throughput and initial playoutdelay. In [4], the authors explore measures that impactperceived quality of Internet broadcasts and found thatthe percent buffering time has the largest impact onuser engagement although the specific impact varies bycontent genre. The work in [8] performed subjective tests todetermine which bitrate adaptation behaviors lead to thehighest overall perceived quality.
In summary, the majority of the related work focuses onviewer satisfaction and reactions to content streamed usingHAS, exploring HAS systems already in place, or definingbroader metrics for measuring Quality of Experience (QoE).A survey of such works in [35]. Although these yield usefulstatistics related to effectiveness of HAS, they don’t provideconcrete guidance for HAS system designs and behaviors. Inthe research described in this paper, we define the behaviorof the streaming technique under different circumstancesand directly show how it affects the viewer’s quality ofexperience.
3 SYSTEM DESCRIPTION
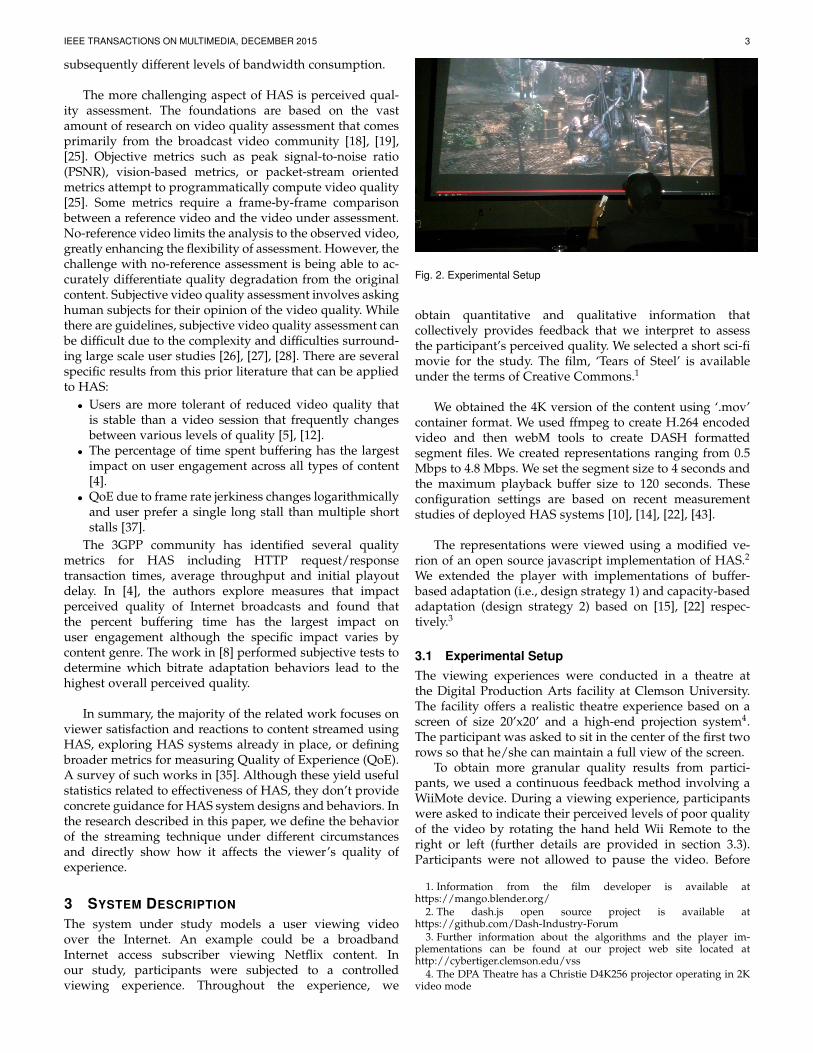
The system under study models a user viewing videoover the Internet. An example could be a broadbandInternet access subscriber viewing Netflix content. Inour study, participants were subjected to a controlledviewing experience. Throughout the experience, we
Fig. 2. Experimental Setup
obtain quantitative and qualitative information thatcollectively provides feedback that we interpret to assessthe participant’s perceived quality. We selected a short sci-fimovie for the study. The film, ‘Tears of Steel’ is availableunder the terms of Creative Commons.1
We obtained the 4K version of the content using ‘.mov’container format. We used ffmpeg to create H.264 encodedvideo and then webM tools to create DASH formattedsegment files. We created representations ranging from 0.5Mbps to 4.8 Mbps. We set the segment size to 4 seconds andthe maximum playback buffer size to 120 seconds. Theseconfiguration settings are based on recent measurementstudies of deployed HAS systems [10], [14], [22], [43].
The representations were viewed using a modified ve-rion of an open source javascript implementation of HAS.2
We extended the player with implementations of buffer-based adaptation (i.e., design strategy 1) and capacity-basedadaptation (design strategy 2) based on [15], [22] respec-tively.3
3.1 Experimental SetupThe viewing experiences were conducted in a theatre atthe Digital Production Arts facility at Clemson University.The facility offers a realistic theatre experience based on ascreen of size 20’x20’ and a high-end projection system4.The participant was asked to sit in the center of the first tworows so that he/she can maintain a full view of the screen.
To obtain more granular quality results from partici-pants, we used a continuous feedback method involving aWiiMote device. During a viewing experience, participantswere asked to indicate their perceived levels of poor qualityof the video by rotating the hand held Wii Remote to theright or left (further details are provided in section 3.3).Participants were not allowed to pause the video. Before
1. Information from the film developer is available athttps://mango.blender.org/
2. The dash.js open source project is available athttps://github.com/Dash-Industry-Forum
3. Further information about the algorithms and the player im-plementations can be found at our project web site located athttp://cybertiger.clemson.edu/vss
4. The DPA Theatre has a Christie D4K256 projector operating in 2Kvideo mode

IEEE TRANSACTIONS ON MULTIMEDIA, DECEMBER 2015 4
the video was played, the participant was asked to fill outsurveys and instructed on how to hold and use the WiiMoteduring the video playback.
3.2 Video Conditions
As mentioned earlier, an actual HAS system involves clientplayers interacting with content servers located in theInternet. For our study we needed to reproduce aspects ofthe actual system but in a manner that supports a repeatableexperimentation platform with sufficient control such thatwe could carry out our study. Our process involved twosteps: 1)Platform emulation and calibration; 2)Productionof the video conditions.
Platform Emulation and Calibration:We used a Content Server that holds the content
correctly formatted in multiple representations and a PCas client to run and test out the streaming strategy videoplaybacks. These machines are connected to Clemson’slarge on-campus computer network. We conducted acalibration analysis allowing us to create realistic networkimpairment that resulted in a reasonable HAS randomoutcome. The HAS outcome implies the specific sequenceof quality levels for each video segment associated with theoutcome.
Modern Linux distributions include a network emulator,referred to as netem, that can add artificial packet loss andlatency to network traffic that is forwarded over a networkinterface. The objective of the calibration phase was to findtwo specific settings of netem that could emulate a highlyimpaired network scenario and a less-impaired networkscenario. For each setting, we streamed the content in twodifferent ways. First using the javascript HAS player usinga buffer-based adaptation design strategy and second usingthe player configured to reflect a capacity-based design.
The calibration allowed us to identify an artificialpacket loss rates to specific HAS video quality levels. Wefound that a random loss process based on a Bernoulli lossmodel (i.e., an uncorrelated loss process) with an averageloss setting of 3% roughly corresponds to a minimallyimpaired scenario. Increasing the average loss rate to 6%corresponds to a highly impaired setting (i.e., a low videostream quality level). However, the Internet is a dynamicsystem that can exhibit highly variable network conditions.In our calibration, we observed that both HAS adaptationapproaches are effective even in high loss rate scenariosas long as the loss process remains stationary. In orderto reflect realistic video streaming sessions, such as thoseobserved in [9], we needed to vary the loss process as thestreaming session progresses. To ensure we could repeat therealization of the underlying random process, we furthercustomized the client player to request a specific sequenceof segments.
Production of the video conditions: We created fourrenderings of the video streaming session which werefer to as the video conditions (identified in Table 1).Each of the four video experiences represents a specific
TABLE 1User Study Conditions - 2 x 2 Experiment design between impairment
(high/low) and strategy (buffer based I vs. capacity based II).
Impairment/Streaming Strategy
Strategy I (Bufferbased)
Strategy II (Capac-ity based)
High S1-HI S2-HILow S1-LO S2-LO
TABLE 2Video Experience Definition and Summary
Quantitative Measure S1-HI S2-HI S1-LO S2-LOAverage playback rate(Mbps) 1.024 1.483 2.988 3.401
Average requested rate(Mbps) 0.899 1.589 2.657 3.156
Average available band-width estimate (Mbps) 3.437 3.437 4.044 4.044
Average playback buffersize (seconds) 64.11 18.40 56.4 8.87
Total number of artifacts 13 41 2 29Number of quality up-grades 3 9 1 1
Number of quality de-grades 6 10 0 0
Number of stalls 0 17 0 12
Number of frame drops 4 5 1 16
sample path of the random process that would normallydefine a random streaming session. Table 2 identifies thefour video experiences. If the client player requested aspecific sequence of segments, randomness due to networkor platform effects might still cause participants whoview the same sequence of segments to possibly observedifference outcomes. To maintain consistency between eachparticipant who viewed a particular video setting, thevideos were prerecorded by streaming over each type ofnetwork impairment under each strategy.5. The videos wererecorded using SSR6 screen capture software. These fileswere placed on a machine that was directly connected tothe projector. During a streaming session, one of the fourvideos was randomly played from the machine locally.
We defined and computed a set of measures that serve toquantify the rendered quality of the video. Some measuresare computed by the HAS player. The measures relatedto rendering artifacts had to be manually identified. Weexamined each of the four video conditions and for eachobserved artifact event, we noted the type of artifact (basedon the set of measures) as well as the time of occurrence.We had three team members perform this followed by ateam discussion to ensure we produced an accurate list ofartifacts. Table 2 summarizes the quantitative characteristicsfrom each experience. The set of quantitative video viewingcharacteristic include the following:
• Average playback rate: Average rate (in bps) at whichthe video was played by the player.
5. The recorded versions of the four video experiences can be viewedat http://cybertiger.clemson.edu/vss/
6. The Simple Screen Recorder is available athttp://www.maartenbaert.be/simplescreenrecorder/

IEEE TRANSACTIONS ON MULTIMEDIA, DECEMBER 2015 5
Fig. 3. WiiMote Usage
• Average request rate: Average data transfer rate (in bitsper second) requested by the player to stream the video.
• Average available bandwidth estimate: Average datatransfer rate (in bits per second) available to stream thevideo.
• Average playback buffer size: Average length of video(in seconds) available in the player’s memory/bufferthat is ready to be played.
• Total number of artifacts: Total number ofevents/interruptions you see in the video like stalls,quality changes, etc.
• Number of quality upgrades: Total number of resolu-tion upgrades in the video.
• Number of quality degrades: Total number of resolu-tion downgrades in the video.
• Number of stalls: Total number of stalls/pauses in thevideo.
• Number of frame drops: Total number of times a framewas skipped in the video.
3.3 WiiMote SetupAn application, developed using the Unity game engine 7,was used to poll the Wii Remote (referred to as a WiiMote)and record the participants continuous feedback of theperceived quality of the video viewing experience into alog file8. The WiiMote communicates with the software thatwe developed on a computer using a Bluetooth connection.To get continuous quality feedback from participants, theywere instructed to hold the device in an upright positionand rotate it from left to right (i.e. from an angle of 0-goodquality low frustration to 180-poor quality high frustration),see figure 3. The WiiMote’s rotation about the vertical axiswas recorded every 50 milliseconds. This reading along witha corresponding unix time stamp was logged in a text file.The starting time of the video session was recorded allowingus to interpret the WiiMote data as a fixed increment timeseries.
3.4 Visualization of ResponseThe study obtained participant feedback in the form ofsurveys and continuous data. The post-survey was admin-istered at the end of the video playback. The participantwas asked to assess his/her QoE at the beginning of the
7. Unity: http://unity3d.com/8. Information about the Wiimote is available at
http://wiibrew.org/wiki/Wiimote.
viewing experience, at the end of the video experience andthen overall. The assessment questions asked the participantto rate the video quality in terms of frustration, distortion,and video clarity. These terms were defined as follows,
• Frustration: feeling of being annoyed with the videoplayback experience.
• Distortion: presence of artifacts that would degrade ordistort the video playback.
• Video Clarity: how clear or crisp the video is. Higherquality implies higher resolution.
The results from each participant in each condition werethen analyzed. A detailed analysis is provided in the resultssection (section 5).
The continuous measure is based on the participantscontinuous feedback obtained from the WiiMote device. Thedata visualized later in figure 4 illustrates a small sample ofthe data collected from one participant’s experience viewingS2-HI video condition. The time relative to the start of thevideo experience, units of in minutes and seconds, is plottedalong the x-axis and the level of frustration (based on theWiiRemote unitless data ranging from 0 to 180) is plottedin blue along the y-axis. The colored vertical bars in thegraph represent different artifacts that occur in the videoat a particular time. The width of the bars indicates theduration of the artifact being represented. These graphswere created using the D3.js JavaScript library. All thecomponents in the graph are scalable vector graphics thatcombine to form a layering of graphs that are synchronizedto the same time reference. The raw data obtained from theWiiMote was further filtered and normalized for analysis.The post-processing analysis is explained in more detailin the Measures sections (section 4.4). As instructed, theparticipants tended to hold the WiiMote around a valueof 90 on the scale of 0 to 180. Values above or below thisrepresented a change in observed perceived quality.
4 EXPERIMENTAL PROCEDURE
4.1 Research Questions and HypothesesThe study is designed to formulate guidelines as to how aHAS adaptation algorithm should address the conflictingrequirement of maximizing video player quality andminimizing the frequency of buffer stalls.
We identify the following hypotheses:• Hypothesis 1: In high impairment network conditions,
perceived quality is greater when using Strategy 1compared with Strategy 2.
• Hypothesis 2: In low impairment network conditions,perceived quality is greater when using Strategy 2compared with Strategy 1.
• Hypothesis 3: For both network conditions, the overallmagnitude of perceived quality was greater with Strat-egy 1.
4.2 Study DesignA within subjects design was used for this study. Usingtwo levels of network impairment and two streamingalgorithms we get a 2X2 grid with 4 different scenarios or

IEEE TRANSACTIONS ON MULTIMEDIA, DECEMBER 2015 6
conditions for the purpose of testing. See table 1. A thirdvariable of viewing time was also used to break down thevideo for better measurement of viewer responses.
We collected demographic and behavioral data,personality data and current mood state data using pre-sruveys and feedback on level of frustration, video quality,distortion and sound clarity at the beginning of the video,the end of the video and an overall measure using post-surveys. A measure of perceived levels of poor quality wasalso recorded as a continuous measure using a WiiMote.After the first session, participants were also asked to recordwhat they could understand about the movie’s storyline.
A total of 33 participants were recruited, 31 malesand 2 females. They included a mix of graduate andundergraduate students from Clemson University. Theparticipant ages ranged from 18 years to 30 years with amean of 22 years. Each participant was expected to attend2 sessions on separate days each lasting approximately 30to 40 minutes. No participant saw the same video twice.This resulted in a total of 66 video sessions, 59 of themcontributed data to the analysis. Each analysis containeddata from 15 participant sessions except S1-LO whichcontained data from 14 sessions.
The types of artifacts recorded from these videos arestalls (long and short), frame drops, distortion and qualitychange (upgrade and degrade). As a result of the foursettings, each video has a varying number of each type ofartifacts.
4.3 Methodology
Participants were required to attend two sessions. In the firstsession,
1) The participant is handed an informed consent describ-ing the purpose and the procedure of the study.
2) Then the participant fills out 3 pre-surveys pertainingto their personality, current mood state, demographicsand general video content watching habits.
3) Following this, instructions are given on how to use theWiiMote while watching the video.
4) Next, one of the 4 videos is randomly selected to bepresented to the participant.
5) After the video, participant fills out a post-experimentsurvey pertaining to his/her (Quality of Experience)QoE.
6) Lastly, the participant is asked to record what he under-stood about the movie’s storyline.
In the second session,1) The participant only fills out the current mood state
pre-survey.2) Then is presented with one of the 3 remaining videos
(similar to steps 3 to 6 on the first session).3) The participant fills out the post-experiment survey.4) Finally, the participant is debriefed regarding the pur-
pose of the experiment.We do not ask the participant to record his/her under-
standing of the movie in the second session as it provides
less useful information compared to the participants firstresponse to the question.
4.4 Measures
4.4.1 Quantitative Subjective MeasuresThe post-survey was used to collect quantitative data aboutthe participant’s QoE. We made use of a 5-point Likert’sscale to help participants represent frustration, distortion,video quality and sound quality by choosing an option thatbest aligned to their view.
To make it simpler for the participants to comprehendthe scale, the values were replaced with phrases. For ex-ample, for frustration the scale read extremely frustrated,somewhat frustrated, neutral, somewhat satisfied and ex-tremely satisfied. Higher the frustration, smaller the valueit represented on the Likert’s scale. This was also true fordistortion. The inverse was true for video clarity and soundclarity, higher the clarity, higher the value on the scale. All4 of the measures were collected for the beginning of thevideo, the end of the video and the overall of the video. Thedetails of analysis on this data can be seen in the resultssection (5.1.1).
4.4.2 Quantitative Objective MeasuresThe raw WiiMote data was filtered and normalized toremove human bias and noise and make the data consistentfor analysis. All the post processing steps explained belowwere completed with the help of an automated program thatparses through a text file containing all the WiiMote valuesand time stamps recorded for a particular participant. Theprogram performed these steps for each participant.
To filter the noise from the raw data, we applied a1 second sliding window filter similar to the movingaverage technique to each participants data individually.Skipping the first and the last half a second from the data,for every stamp we calculated an average of all readingsstarting from half a second before to half a second after thecurrent reading i.e. a subset of 1 second for each time stamp.
Thus, representing each time stamp as t, the perceivedlevel of poor quality at t as vt and the new filtered perceivedlevel of poor quality obtained at t as Vt, we have
Vt =
∑t−0.5 ≤ t < t+0.5 vt
Time stamps recorded between t− 0.5 to t+ 0.5(1)
This removed most of the noise from the data asseen in figure 4. Since, the range of values was differentfor every participant; the readings were normalized byscaling between 0 and 1. This was done by identifying theminimum and maximum values for each participant fromthe complete duration of the video. Each recorded valuewas then subtracted with the minimum value and the resultwas divided by the range, maximum minus the minimumvalue, giving us the 0-1 scale. This was essential to maintainconsistency in our observations and formulating heuristics.

IEEE TRANSACTIONS ON MULTIMEDIA, DECEMBER 2015 7
Fig. 4. Graph with WiiMote readings plotted showing transition from rawto filtered and filtered to normalization
Using L to represent the series of filtered perceived levelsof poor quality, the normalized value of (li) for variable L inthe ith position is calculated as
Normalized(li) =li − Lmin
Lmax − Lmin(2)
where,Lmin = the minimum value for variable LLmax = the maximum value for variable Lif Lmax is equal to Lmin then Normalized (li) is set to 0.5.
We analyzed the continuous data in two different ways.First, we divided each video into 3 equal time intervals,beginning, middle and end, typically around 4 minuteseach. The values from each interval were averaged for eachparticipant and analyzed. The detailed analysis is in section5.2.1.
For a participant P, using d to represent the duration ofvideo playback and vt representing the filtered perceivedlevel of poor quality at a particular time stamp t, thecalculation were as follows
Avgbeg =
∑0 ≤ t < d/3 vt
Ttime stamps recorded between 0 to d/3(3)
Avgmid =
∑d/3 ≤ t < 2d/3 vt
Time stamps recorded between d/3 to 2d/3(4)
Avgend =
∑2d/3 ≤ t < d vt
Time stamps recorded between 2d/3 to d(5)
where,Avgbeg is the average perceived level of poor quality for thefirst 1/3 of the video.
Avgmid is the average perceived level of poor quality for thesecond 1/3 of the video.Avgend is the average perceived level of poor quality for thethird 1/3 or last 1/3 of the video.
Secondly, we identified the number of artifacts aparticipant responded to during the video watchingexperience. This too was done using an automated programbased on the observations made from the normalizedgraphs. The details of the complete process are given belowand the detailed analysis is in section 5.2.2.
From the graphs, we see that the perceived quality curvemoves towards a local maxima or minima based on how theartifact affects the QoE and takes about 2-5 seconds after theartifact start time. For artifacts lasting longer than 5 seconds,the maxima and minima take longer to occur. We might seea combined effect if two or more artifacts occur within 5seconds or less. The automated program looks for artifactsand detects a local maxima and minima corresponding toit. If the maxima or minima meets a specified threshold itis considered to be a response to the corresponding artifact.The program uses the following heuristics:
• A local maxima was considered for stalls, frame dropsand quality degrades. The basis for this assumption isthat we expect the frustration to rise for artifacts thatdegrade the QoE. Thus, a maxima serves as an indicatorfor degraded perceived quality.
• A local minima was considered for quality upgrades.We expect the frustration level to reduce for artifactsthat improve the QoE. Thus, a minima serves as anindicator for upgraded perceived quality.
• The threshold was set to 0.05 units on a normalizedscale for the detection of maxima and minima.
• The time span considered for a local maxima or minimawas 5 seconds from the start time of the artifact.
• If the artifact lasted more than 5 seconds, the completeduration of the artifact was considered as the span fordetecting maximas or minimas.
The value of the global maxima or minima for an artifactwas compared to the value reported by the participant atthe beginning of the corresponding artifact to check for thethreshold.
The above mentioned process gave us the number ofartifacts a participant reacted to during the video viewingexperience. A summary of each condition can be seen intable 3. Since, the number of artifacts present in each of thevideo conditions was different, the participant responseswere converted into percentiles. These responses weremarked on the graph using colored spherical marker tagsplaced right above the maxima or minima correspondingto that artifact (see figure 5). Different colored and sizedmarker tags were used to represent responses to differentartifacts. The color of tags correspond to the color ofthe artifact whose response they represent. In a separatevalidation process, the automatic method of identifyinglocal maxima and minima were verified for correctnessby applying the automatic detection and tagging methodon experimenter created data, and was found to berobust in detecting instances of perceived poor quality

IEEE TRANSACTIONS ON MULTIMEDIA, DECEMBER 2015 8
Fig. 5. Graph with maxima and minima represented by spherical markertags; Color of tags correspond to color of artifact; Minima for qualityupgrade; Maxima for all other artifacts
or improvement in quality corresponding to the artifactsfound in the videos.
Since, the video conditions from the same level of im-pairment did not contain at least 1 of each type of artifact weonly considered a combined count of all types of artifacts.Thus only the percentage of total artifacts responded to bythe participant was considered for studying the effects ofstreaming strategy on the QoE.
4.4.3 Qualitative MeasureThe post-survey also asked participants for comments abouttheir experience at the beginning, end and overall of thevideo. Comments related to the video quality and the arti-facts that occurred during the video were selected from eachvideo condition for further analysis. A detailed analysis canbe found in section 6.
5 RESULTS
5.1 Quantitative Subjective Results
5.1.1 Effects of Network Algorithm, Impairment and sam-pling Time on user’s Frustration, Clarity, Distortion, and Per-ceived Levels of Quality of video experienceFor each of the dependent measure (frustration, clarity, dis-tortion and continuous measure of quality), we performeda 3 x 2 x 2 mixed model Analysis of Variance (ANOVA) sta-tistical analysis. Sampling time, beginning, end and overall,
Fig. 6. Mean frustration QoE scores in the beginning, end and overallin the S2 (Reactive: Capacity based) and S1 (Smooth: Buffer based)algorithm viewing conditions
Fig. 7. Mean frustration QoE scores in beginning, end and overall byimpairment levels high and low
was the within subjects independent variable. Algorithm,Strategy 1 (S1) and Strategy 2 (S2), and impairment, highand low, were the between subjects independent variables.a Frustration:The ANOVA analysis did not reveal a significant main effectof time, but revealed a significant sampling time by algo-rithm interaction on frustration QoE scores F(1.36, 74.8) =3.665, p = 0.047, η2 = 0.06. The data also revealed a significantsampling time by impairment interaction on frustration QoEscores F(1.36, 74.8) = 5.98, p = 0.010, η2 = 0.09. Recall thatlow frustration QoE scores indicate high levels of viewerfrustration and high frustration QoE scores indicate lowlevels of viewer frustration in the video viewing experience.We also performed multiple pairwise independent samplest-tests to examine if the frustration scores were differentwithin blocks of sampling time of beginning, end andoverall. Frustration scores were significantly lower at theend of the video watching experience in the S2 algorithmcondition (M=2.60, SD=1.16), as compared to the S1algorithm condition (M=3.24, SD=1.29), t = -1.99, p = 0.050,d = 0.52. However, frustration scores were not significantlydifferent between the S2 and S1 algorithm conditions in thebeginning as well as the end sampling times.
We then performed a block analysis examining the mean

IEEE TRANSACTIONS ON MULTIMEDIA, DECEMBER 2015 9
frustration QoE scores in the beginning, end and overallby impairment as a 3 x 2 mixed-model ANOVA (SeeFigure 7). The analysis revealed a non-significant maineffect of sampling time of frustration scores, a significantmain effect of impairment (high vs. low F(1, 57) = 4.57,p = 0.037, η2 = 0.074, and a significant frustration byimpairment interaction F(1.36, 77.94) = 5.312, p = 0.015,η2 = 0.085. A block analysis of frustration scores withinthe low impairment condition conducted via a one-waywithin subjects ANOVA across all sampling times revealeda significant effect, F(1.3, 37.8) = 4.12, p = 0.040, η2 = 0.12.A post-hoc pairwise analysis conducted via Bonferroniadjustment revealed that frustration scores in the beginning(M=2.7, SD=1.37) were significantly lower than overall(M=3.53, 1.24), p = 0.028. A block analysis of frustrationscores between low and high impairment conditions in thebeginning was not significant. However, mean frustrationscores were significantly lower in the high impairmentcondition (M=2.58, SD=0.95) in the end of the viewingexperience as compared to the low impairment condition(M=3.23, SD=1.45), t(57) = 2.01, p = 0.048, d = 0.52. Meanfrustration scores were also significantly lower in the highimpairment condition (M=2.52, SD=0.95) overall in theviewing experience as compared to the low impairmentcondition (M=3.53, SD=1.22), t(57) = 3.55, p = 0.001, d = 0.94.
b Clarity:The ANOVA analysis revealed a significant main effect oftime F(1.35, 64.45) = 23.10, p <0.001, η2 = 0.32, and revealeda significant sampling time by impairment interaction onclarity QoE scores F(1.32, 64.45) = 7.38, p = 0.005, η2 =0.13. Sampling time by algorithm as well as the three wayinteraction on clarity QoE scores was not significant. Usingthe Bonferroni technique, we found that clarity scores in thebeginning (M=2.30, SD=1.17) was significantly less than inthe end (M=3.22, SD=1.26) p <0.001 as well as compared tooverall (M=3.39, SD=1.30) p <0.001. Recall that low clarityQoE scores correspond to low levels of perceived clarityand high clarity QoE scores correspond to high levels ofperceived clarity in the video viewing experience.
In order to further examine the interaction effects, we firstperformed a block analysis examining the mean clarityscores in the beginning, end and overall by impairmentas a 3 x 2 mixed-model ANOVA. The analysis revealed asignificant main effect of sampling time of clarity scoresF(1.32, 67.42) = 23.56, p <0.001, η2 = 0.31, a main effect ofimpairment F(1, 51) = 12.35, p = 0.001, η2 = 0.2, and aninteraction effect of sampling time by impairment on clarityscores F(1.32, 67.42) = 7.84, p = 0.003, η2 = 0.13 (See Figure 8).A block analysis of clarity scores were conducted within thehigh impairment condition and within the low impairmentcondition via a one-way within subjects ANOVA withineach impairment block. The one-way within subjectsANOVA of clarity scores in the low impairment conditionwere significantly different F(1.34, 37.50) = 26.68, p <0.001,η2 = 0.49. The contrast analysis using Bonferroni methodrevealed that clarity scores in the beginning (M=2.37,SD=1.32) were significantly less than at the end (M=3.72,SD=1.19) p <0.001, as well as compared to overall (M=4.03,SD=1.12) p <0.001. The one-way within subjects ANOVA
Fig. 8. Mean clarity QoE scores in high and low impairment conditionsby sampling time
of clarity scores in the high impairment condition were notsignificantly different.
Also, clarity scores in the beginning between low and highimpairment were not significant. However, clarity scoreswere significantly lower in the high impairment condition(M=2.62, SD=1.09) in the end as compared to the lowimpairment condition (M=3.72, SD=1.19) t(51) = -3.46, p= 0.001, d = 0.97. Clarity scores overall were significantlylower in the high impairment condition (M=2.62, SD=1.09)as compared to the low impairment condition (M=4.03,SD=1.12) t(51) = -4.61, p <0.001, d = 1.29.
c Distortion:The ANOVA analysis revealed a significant main effectof time F(1.58, 85.33) = 5.53, p = 0.01, η2 = 0.09 and maineffect of impairment F(1, 54) = 16.93, p <0.001, η2 = 0.24and revealed a significant sampling time by impairmentinteraction on distortion QoE scores F(1.58, 85.33) = 11.03,p <0.001, η2 = 0.17. Sampling time by algorithm as wellas the three way interaction on distortion QoE scoreswas not significant. Note that low distortion QoE scorescorrespond to higher levels of perceived distortion in thevideo, whereas high distortion QoE scores correspond tolow levels of perceived distortions in the video viewingexperience. Using the Bonferroni technique, we found thatdistortion QoE scores in the beginning (M=2.65, SD=1.01)was significantly less than in the overall (M=3.21, SD=1.18)p = 0.005. And overall, distortion QoE scores in the highimpairment condition (M=2.55, SD=0.78) were significantlylower than in the low impairment condition (M=3.39,SD=0.79) p <0.001.
In order to further examine the interaction effects, we firstperformed a block analysis examining the mean distortionQoE scores in the beginning, end and overall by impairmentas a 3 x 2 mixed-model ANOVA. The analysis revealed asignificant main effect of sampling time of distortion scoresF(1.58, 88.27) = 5.85, p = 0.007, η2 = 0.09, a main effectof impairment F(1, 56) = 16.36, p <0.001, η2 = 0.23, andan interaction effect of sampling time by impairment on
IEEE TRANSACTIONS ON MULTIMEDIA, DECEMBER 2015 10
Fig. 9. Mean Distortion QoE scores in high and low impairment condi-tions by sampling time
distortion scores F(1.58, 88.27) = 11.62, p <0.001, η2 = 0.17(see figure 9). A block analysis of distortion QoE scores wereconducted within the high impairment condition and withinthe low impairment condition via a one-way within subjectsANOVA within each impairment block. The one-way withinsubjects ANOVA of distortion scores in the low impairmentcondition were significantly different F(1.58, 44.25) = 13.24,p <0.001, η2 = 0.32. The contrast analysis using Bonferronimethod revealed that distortion QoE scores in the beginning(M=2.62, SD=1.17) were significantly less than at the end(M=3.58, SD=1.37) p = 0.015, as well as compared to overall(M=3.93, SD=1.07) p <0.001 in low impairment condition.The one-way within subjects ANOVA of distortion QoEscores in the high impairment condition were not signif-icantly different, and at beginning, end and overall thedistortion QoE scores were all lower than the mean scoresin the low impairment condition at each sampling time.
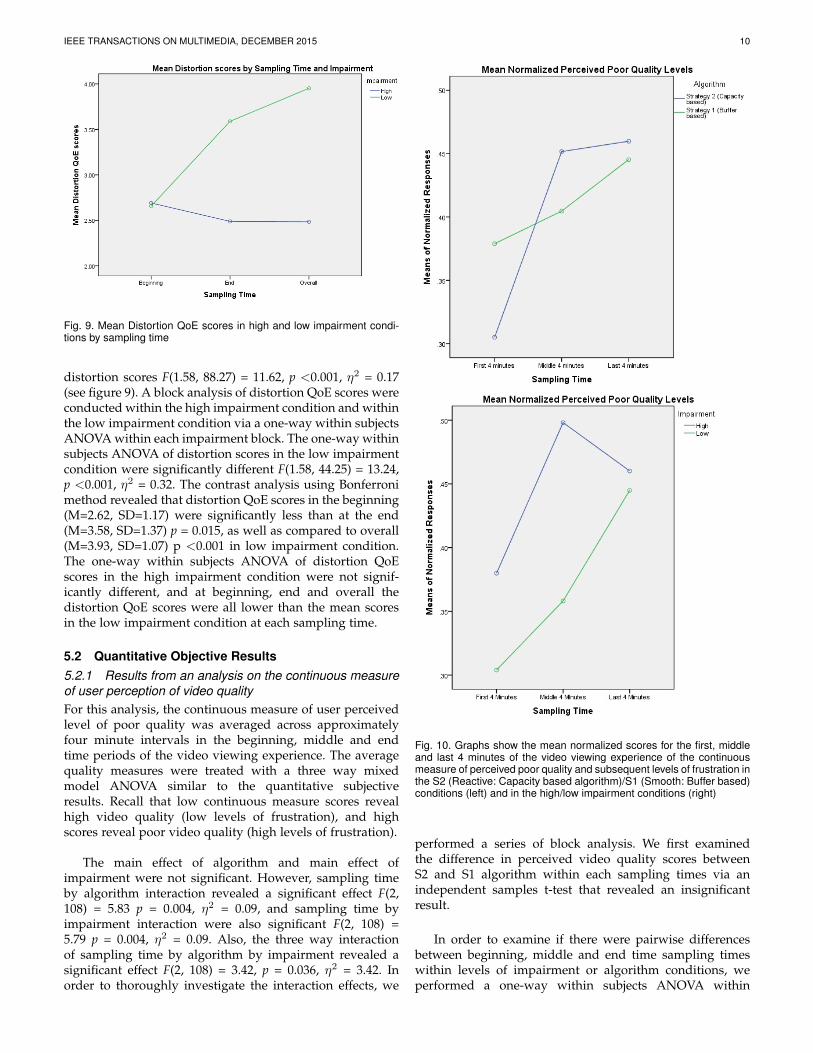
5.2 Quantitative Objective Results5.2.1 Results from an analysis on the continuous measureof user perception of video qualityFor this analysis, the continuous measure of user perceivedlevel of poor quality was averaged across approximatelyfour minute intervals in the beginning, middle and endtime periods of the video viewing experience. The averagequality measures were treated with a three way mixedmodel ANOVA similar to the quantitative subjectiveresults. Recall that low continuous measure scores revealhigh video quality (low levels of frustration), and highscores reveal poor video quality (high levels of frustration).
The main effect of algorithm and main effect ofimpairment were not significant. However, sampling timeby algorithm interaction revealed a significant effect F(2,108) = 5.83 p = 0.004, η2 = 0.09, and sampling time byimpairment interaction were also significant F(2, 108) =5.79 p = 0.004, η2 = 0.09. Also, the three way interactionof sampling time by algorithm by impairment revealed asignificant effect F(2, 108) = 3.42, p = 0.036, η2 = 3.42. Inorder to thoroughly investigate the interaction effects, we
Fig. 10. Graphs show the mean normalized scores for the first, middleand last 4 minutes of the video viewing experience of the continuousmeasure of perceived poor quality and subsequent levels of frustration inthe S2 (Reactive: Capacity based algorithm)/S1 (Smooth: Buffer based)conditions (left) and in the high/low impairment conditions (right)
performed a series of block analysis. We first examinedthe difference in perceived video quality scores betweenS2 and S1 algorithm within each sampling times via anindependent samples t-test that revealed an insignificantresult.
In order to examine if there were pairwise differencesbetween beginning, middle and end time sampling timeswithin levels of impairment or algorithm conditions, weperformed a one-way within subjects ANOVA within

IEEE TRANSACTIONS ON MULTIMEDIA, DECEMBER 2015 11
blocks of the levels of the independent variable. A oneway ANOVA of sampling times within the S2 conditionwas significant F(2, 58) = 18.07, p <0.001, η2 = 0.38.Pairwise comparisons using Bonferroni method revealedthat perceived levels of poor quality was significantly lessin the beginning (M=0.31, SD=0.13) as compared to themiddle (M=0.45, SD=0.16) p <0.001, and perceived levelsof poor quality was significantly lower in the beginning ascompared to the end (M=0.46, SD=0.16) p <0.001. A oneway ANOVA of sampling times within the S1 conditionwas significant F(2, 54) = 3.37, p = 0.04, η2 = 0.11. Pairwisecomparisons using Bonferroni method did not reveal anysignificant pairwise differences between sampling times inthe S1 conditions. A one way ANOVA of sampling timeswithin the high impairment condition was significant F(2,56) = 12.40, p <0.001, η2 = 0.31. Pairwise comparisons usingBonferroni method revealed that perceived levels of poorquality was significantly less in the beginning (M=0.38,SD=0.16) as compared to the middle (M=0.49, SD=0.17)p = 0.001, and perceived levels of poor quality was alsosignificantly lower in the beginning as compared to the end(M=0.46, SD=0.17) p = 0.005. Similarly, a one way ANOVAof sampling times within the low impairment conditionwas significant F(2, 56) = 11.59, p <0.001, η2 = 0.29.Pairwise comparisons using Bonferroni method revealedthat perceived levels of poor quality was significantly lessin the beginning (M=0.30, SD=0.17) as compared to theend (M=0.45, SD=0.23) p = 0.001, and perceived levels ofpoor quality was significantly lower in the middle (M=0.36,SD=0.21) as compared to the end (M=0.45, SD=0.23) p =0.008.
5.2.2 Results from the automatic classification of usersreactions to the artifacts in the videoTo analyze the quantitative results obtained from theautomatic classification of user’s reactions to the presenceof the artifacts in the continuous user response through thehand held input device, we performed a block frequencyanalysis on the total response percentile in each condition.The means and standard deviation for each condition aregiven in table 3. The distribution of scores failed the testof normality thus a Kruskal-Wallis H test was performedon the data. This was performed separately under eachnetwork impairment condition to study the effect ofalgorithm.
The test showed that there was a statisticallysignificant difference in response percentiles betweenthe different video streaming algorithms under highnetwork impairment, χ2 (2) = 5.572, p = 0.018, η2 = 0.19,with a mean rank response percentile of 11.14 for StrategyI and 18.60 for Strategy II. The video streaming strategyaccounts for 19% of the variance in the response percentiles.Participants seem to react more frequently to artifacts whileviewing videos streamed using Strategy II under highnetwork impairment resulting in higher overall frustrationlevels.
The test showed no statistically significant difference inresponse percentiles between the different video streaming
TABLE 3Artifacts and response summary for each condition
Impairment / Strategy I Strategy IIStrategy (Buffer based) (Capacity based)High Total artifacts: 13 Total artifacts: 41
Mean proportion oftimes participantsreacted to artifacts:31.32%
Mean Proportion oftimes participantsreacted to artifacts:51.87%
Std. Deviation: 21.43% Std. Deviation: 15.77%
Low Total artifacts: 2 Total artifacts: 29Mean Proportion oftimes participantsreacted to artifacts:53.57%
Mean Proportion oftimes participantsreacted to artifacts:56.09%
Std. Deviation: 41.42% Std. Deviation: 24.68%
conditions under low network impairment.
6 QUALITATIVE RESULTS
The post-survey also asked the viewer for comments on theperceived quality of the video. We used these commentsto qualitatively assess the perceived level of quality of theoverall experience.
For S1-HI, viewers comments revealed that smoothvideo playback is better but the quality can better; “Smoothis better than stall” “Quality could be better”. Whereas,comments on S2-HI were critical of the frequent stalls andthe low video quality and made it difficult to understandthe plot; “pauses in video were most frustrating” “Pauses invideo were more prominent by the end, and it detracted from myfollowing the plot of the movie”.
Comparing the 2 strategies under low impairmentnetwork scenario, viewers were satisfied with the overallresultant quality of strategy 1 (S1-LO) but thought that thesound wasn’t clear at times; “I could tell what was going onand it was a good short film. Nothing seemed too frustratingoverall” “Audio volume seemed random through the wholething.”. On the other hand, viewers seem to prefer the videoquality for strategy 2 (S2-LO) but were frustrated with thefrequent stalls and frame drops; “Overall, I was impressedwith the quality. Other than the beginning quality, and endinglagging/chopping”.
Ranking the four video conditions depending on viewercomments, we summarize that, S2-Hi seems to provide theworst viewing experience. S1-Hi is better than S2-Hi withsmoother video playback. S1-Lo is better than S1-Hi withbetter video quality and S2-Lo provides the best playbackof the four with an exceptionally great overall experience.9
7 DISCUSSION
From the Quantitative Subjective Results section (5.1.1), weobserve that the frustration QoE scores were lower towards
9. More viewer comments can be found athttp://cybertiger.clemson.edu/vss/

IEEE TRANSACTIONS ON MULTIMEDIA, DECEMBER 2015 12
the end of the video in Strategy 2 than in Strategy 1. ForQuantitative subjective measures (4.4.1), higher frustrationrepresents lower scores on the QoE Likert’s scale, thusthe above observation supports the 1st hypothesis whichstates that the perceived quality is greater for Strategy 1 ascompared to Strategy 2. The 1st hypothesis is also supportedbased on the quantitative objective results (section 5.2.2)i.e. in the high network impairment condition, participantsresponded to artifacts more frequently while viewingvideos streamed using Strategy 2 resulting in higherfrustration levels overall in Strategy 2 (capacity based) ascompared to Strategy 1 (buffer based). The user commentsfrom the qualitative results (section 6) also show a similartrend with viewers favoring videos streamed under highimpairment using Strategy 1 rather than Strategy 2. Hence,supporting the 1st hypothesis. A possible explanationfor this trend could be the presence of a larger numberof artifacts in videos streamed using Strategy 2. Videosstreamed using Strategy 2 also tend to have buffering stallsamong the other artifacts which seems to have the largestimpact on user engagement [4].
User comments (section 6) also supports the 2ndhypothesis which states that in the low impairmentcondition, the perceived quality is less negatively impactedin Strategy 2. Although the video streamed using Strategy 2under low impairment exhibits more artifacts than Strategy1 (section 5.2.2, table III), viewer comments relate thatthe quality was better for Strategy 2 streamed videos incomparison to Strategy 1. This makes sense due to higherplayerRate in Strategy 2. Since, Strategy 2 tries to jump tothe highest available bandwidth the playback is of higherquality.
The analysis of the automatic classification of user re-sponses from quantitative objective results (section 5.2.2)yielded that under high network impairment participantsresponded to artifacts more frequently in Strategy 2 ascompared to Strategy 1 implying higher perceived levelsof poor quality for Strategy 2. This is supportive of the 3rdhypothesis which states that the magnitude of change inperceived poor quality overtime is expected to be higherin Strategy 2 as compared to Strategy 1. Overall, whenpresented with high impairment situations, perhaps arisingdue to network congestion, the quantitative and qualitativeresults of our user study suggests that participants seemsto favor the buffer based Strategy 1 over the capacity basedStrategy 2 of video streaming.
8 CONCLUSIONS AND FUTURE WORK
We conducted a within subjects user study involving a 2x2factorial methodology based on the level of network impair-ment (high impairment or low impairment) and the choiceof adaptation design strategy (buffer-based or capacity-based). We also explored the sensitivity of the results to thetime during the 11-12 minute video (first half, second half, orat the end considering the session in its entirety). The resultspresented in this paper based on the quantitative subjectivedata, quantitative objective data, and qualitative measures,support the hypotheses.
The findings surrounding hypotheses 1 and 2 suggestthat a buffer-based strategy might provide a betterexperience under higher network impairment conditions.For the two design strategies considered, the buffer-basedstrategy is effective in avoiding stalls but does so at thecost of reduced video quality (based on the lower playerRateresults). Participants in Strategy 1 do notice the drop invideo quality causing a decrease in perceived video quality.However, the perceived levels of video quality, viewerfrustration, and opinions of video clarity and distortion aresignificantly worse due to artifacts such as stalls in Strategy2, as compared to Strategy 1. The capacity-based strategytries to provide the highest video quality possible butproduces many more artifacts during playback. The resultssuggest that player video quality has more of an impact onperceived quality when stalls are infrequent.
The objective of our study was to provide design guid-ance for a HAS adaptation algorithm. Our results canbe interpreted from one of two perspectives. First, at amacroscopic level, the results show the human response totwo different design approaches considered in two differentrealizations of a streaming session over a emulated networkenvironment. Second, at a microscopic level, the resultsshow user responses to specific artifacts. For the former, ourresults suggest that, at least for the two specific network sce-narios considered, buffer-based adaptation results in higherperceived quality compared to a capacity-based adaptationalgorithm. For the latter, we have collected (and have madepublicly available) quantitative objective continuous resultsthat shows how different participants react to the same setof artifacts. The majority of the analysis presented in thispaper focus on the macroscopic rather than the microscopicresults. In ongoing work, we continue to explore and under-stand the human reaction to specific artifacts (or sequencesof artifacts) that we have collected. We also plan to considerthe impact of both sound quality and network impairmenton the viewer’s comprehension of the plot and storyline ofthe short movie under each of the strategies. The objectivewould be to empirically evaluate if the presence and typesof artifacts have cognitive effects on viewers. Finally, weplan on extending the scope and scale of the user studyby developing and conducting an online study designedto obtain results from potentially a very large number ofparticipants.
REFERENCES
[1] Sandvine, Global Internet Phenomena Report.https://www.sandvine.com/downloads/general/global-internet-phenomena/2014/2h-2014-global-internet-phenomena-report.pdf: Sandvine Corporation, 2014.
[2] ETSI, “Transparent end-to-end packet switched streaming service(pss); progressive download and dynamic adaptive service overhttp,” vol. 3GPP TS 26.247 version 10.1.0 Release 10, 2012.
[3] T. Stockhammer, P. Frojdh, I. Sodagar, and S. Rhyu, “Informationtechnologympeg systems technologiespart 6: Dynamic adaptivestreaming over http (dash),” ISO/IEC, MPEG Draft InternationalStandard, 2011.
[4] F. Dobrian, V. Sekar, A. Awan, I. Stoica, D. Joseph, A. Ganjam,J. Zhan, and H. Zhang, “Understanding the impact of videoquality on user engagement,” ACM SIGCOMM Computer Commu-nication Review, vol. 41, no. 4, pp. 362–373, 2011.

IEEE TRANSACTIONS ON MULTIMEDIA, DECEMBER 2015 13
[5] N. Cranley, P. Perry, and L. Murphy, “User perception of adaptingvideo quality,” International Journal of Human-Computer Studies,vol. 64, no. 8, pp. 637–647, 2006.
[6] C. Muller and C. Timmerer, “A test-bed for the dynamic adaptivestreaming over http featuring session mobility,” in Proceedings ofthe second annual ACM conference on Multimedia systems. ACM,2011, pp. 271–276.
[7] J. Jiang, V. Sekar, and H. Zhang, “Improving fairness, efficiency,and stability in http-based adaptive video streaming with festive,”in Proceedings of the 8th international conference on Emerging network-ing experiments and technologies. ACM, 2012, pp. 97–108.
[8] R. K. Mok, X. Luo, E. W. Chan, and R. K. Chang, “Qdash: a qoe-aware dash system,” in Proceedings of the 3rd Multimedia SystemsConference. ACM, 2012, pp. 11–22.
[9] T.-Y. Huang, N. Handigol, B. Heller, N. McKeown, and R. Johari,“Confused, timid, and unstable: picking a video streaming rateis hard,” in Proceedings of the 2012 ACM conference on Internetmeasurement conference. ACM, 2012, pp. 225–238.
[10] J. Martin, Y. Fu, N. Wourms, and T. Shaw, “Characterizing netflixbandwidth consumption,” in Consumer Communications and Net-working Conference (CCNC), 2013 IEEE. IEEE, 2013, pp. 230–235.
[11] J. Martin, Y. Fu, and G. Hong, “On the efficacy of the dynamicadaptive streaming over http (dash) protocol extended version.”
[12] A. Balachandran, V. Sekar, A. Akella, S. Seshan, I. Stoica, andH. Zhang, “A quest for an internet video quality-of-experiencemetric,” in Proceedings of the 11th ACM workshop on hot topics innetworks. ACM, 2012, pp. 97–102.
[13] O. Oyman and S. Singh, “Quality of experience for http adaptivestreaming services,” Communications Magazine, IEEE, vol. 50, no. 4,pp. 20–27, 2012.
[14] S. Akhshabi, A. C. Begen, and C. Dovrolis, “An experimentalevaluation of rate-adaptation algorithms in adaptive streamingover http,” in Proceedings of the second annual ACM conference onMultimedia systems. ACM, 2011, pp. 157–168.
[15] C. Liu, I. Bouazizi, and M. Gabbouj, “Rate adaptation for adaptivehttp streaming,” in Proceedings of the second annual ACM conferenceon Multimedia systems. ACM, 2011, pp. 169–174.
[16] S. Lederer, C. Muller, and C. Timmerer, “Dynamic adaptivestreaming over http dataset,” in Proceedings of the 3rd MultimediaSystems Conference. ACM, 2012, pp. 89–94.
[17] S. Akhshabi, L. Anantakrishnan, A. C. Begen, and C. Dovrolis,“What happens when http adaptive streaming players competefor bandwidth?” in Proceedings of the 22nd international workshop onNetwork and Operating System Support for Digital Audio and Video.ACM, 2012, pp. 9–14.
[18] Z. Wang, A. C. Bovik, H. R. Sheikh, and E. P. Simoncelli, “Imagequality assessment: from error visibility to structural similarity,”Image Processing, IEEE Transactions on, vol. 13, no. 4, pp. 600–612,2004.
[19] J. Xia, Y. Shi, K. Teunissen, and I. Heynderickx, “Perceivableartifacts in compressed video and their relation to video quality,”Signal Processing: Image Communication, vol. 24, no. 7, pp. 548–556,2009.
[20] J. Xue, D.-Q. Zhang, H. Yu, and C. W. Chen, “Assessing qualityof experience for adaptive http video streaming,” in Multimediaand Expo Workshops (ICMEW), 2014 IEEE International Conferenceon. IEEE, 2014, pp. 1–6.
[21] Z. Li, A. C. Begen, J. Gahm, Y. Shan, B. Osler, and D. Oran,“Streaming video over http with consistent quality,” in Proceedingsof the 5th ACM Multimedia Systems Conference. ACM, 2014, pp.248–258.
[22] T.-Y. Huang, R. Johari, N. McKeown, M. Trunnell, and M. Watson,“A buffer-based approach to rate adaptation: Evidence from alarge video streaming service,” in Proceedings of the 2014 ACMconference on SIGCOMM. ACM, 2014, pp. 187–198.
[23] C. Alberti, D. Renzi, C. Timmerer, C. Mueller, S. Lederer, S. Bat-tista, and M. Mattavelli, “Automated qoe evaluation of dynamicadaptive streaming over http,” in Quality of Multimedia Experience(QoMEX), 2013 Fifth International Workshop on. Ieee, 2013, pp.58–63.
[24] T. C. Thang, H. T. Le, H. X. Nguyen, A. T. Pham, J. W. Kang,and Y. M. Ro, “Adaptive video streaming over http with dynamicresource estimation,” Communications and Networks, Journal of,vol. 15, no. 6, pp. 635–644, 2013.
[25] S. Winkler and P. Mohandas, “The evolution of video qualitymeasurement: from psnr to hybrid metrics,” Broadcasting, IEEETransactions on, vol. 54, no. 3, pp. 660–668, 2008.
[26] T. S. Sector, “Subjective audiovisual quality assessment methodsfor multimedia applications,” 1998.
[27] P. ITU-T RECOMMENDATION, “Subjective video quality assess-ment methods for multimedia applications,” 1999.
[28] I. R. Assembly, Methodology for the subjective assessment of the qualityof television pictures. International Telecommunication Union,2003.
[29] I. Rec, “P. 10/g. 100 amendment 1: New appendix 1-definition ofquality of experience (qoe),” International Telecommunication Union(Jan. 2007), 2007.
[30] N. Degrande, K. Laevens, D. De Vleeschauwer, and R. Sharpe,“Increasing the user perceived quality for iptv services,” Commu-nications Magazine, IEEE, vol. 46, no. 2, pp. 94–100, 2008.
[31] P. Ni, R. Eg, A. Eichhorn, C. Griwodz, and P. Halvorsen, “Spatialflicker effect in video scaling,” in Quality of Multimedia Experience(QoMEX), 2011 Third International Workshop on. IEEE, 2011, pp.55–60.
[32] J. Xia, Y. Shi, K. Teunissen, and I. Heynderickx, “Perceivableartifacts in compressed video and their relation to video quality,”Signal Processing: Image Communication, vol. 24, no. 7, pp. 548–556,2009.
[33] R. Houdaille and S. Gouache, “Shaping http adaptive streams for abetter user experience,” in Proceedings of the 3rd Multimedia SystemsConference. ACM, 2012, pp. 1–9.
[34] R. Huysegems, B. De Vleeschauwer, K. De Schepper, C. Hawinkel,T. Wu, K. Laevens, and W. Van Leekwijck, “Session reconstructionfor http adaptive streaming: Laying the foundation for network-based qoe monitoring,” in Proceedings of the 2012 IEEE 20th Inter-national Workshop on Quality of Service. IEEE Press, 2012, p. 15.
[35] M. Seufert, S. Egger, M. Slanina, T. Zinner, T. Hobfeld, and P. Tran-Gia, “A survey on quality of experience of http adaptive stream-ing,” Communications Surveys & Tutorials, IEEE, vol. 17, no. 1, pp.469–492, 2014.
[36] Y.-F. Ou, Y. Zhou, and Y. Wang, “Perceptual quality of video withframe rate variation: A subjective study.” in ICASSP, 2010, pp.2446–2449.
[37] Q. Huynh-Thu and M. Ghanbari, “Impact of jitter and jerkinesson perceived video quality,” in Proceedings of the Workshop on VideoProcessing and Quality Metrics, 2006.
[38] H. Sundaram, W. Feng, and N. Sebe, “Flicker effects in adaptivevideo streaming to handheld devices,” in Proceedings of ACMMultiMedia, 2011.
[39] Z. Li, X. Zhu, J. Gahm, R. Pan, H. Hu, A. Begen, and D. Oran,“Probe and adapt: Rate adaptation for http video streaming atscale,” Selected Areas in Communications, IEEE Journal on, vol. 32,no. 4, pp. 719–733, 2014.
[40] G. Tian and Y. Liu, “Towards agile and smooth video adaptation indynamic http streaming,” in Proceedings of the 8th international con-ference on Emerging networking experiments and technologies. ACM,2012, pp. 109–120.
[41] C. Liu, I. Bouazizi, M. M. Hannuksela, and M. Gabbouj, “Rateadaptation for dynamic adaptive streaming over http in con-tent distribution network,” Signal Processing: Image Communication,vol. 27, no. 4, pp. 288–311, 2012.
[42] L. De Cicco, V. Caldaralo, V. Palmisano, and S. Mascolo, “Elastic: aclient-side controller for dynamic adaptive streaming over http(dash),” in Packet Video Workshop (PV), 2013 20th International.IEEE, 2013, pp. 1–8.
[43] L. De Cicco and S. Mascolo, “An adaptive video streaming con-trol system: Modeling, validation, and performance evaluation,”Networking, IEEE/ACM Transactions on, vol. 22, no. 2, pp. 526–539,2014.
[44] F. Jackson, R. Amin, Y. Fu, J. E. Gilbert, and J. Martin, “A userstudy of netflix streaming,” Proceedings of HCI International 2015,2015.
[45] S. S. Krishnan and R. K. Sitaraman, “Video stream quality impactsviewer behavior: inferring causality using quasi-experimental de-signs,” Networking, IEEE/ACM Transactions on, vol. 21, no. 6, pp.2001–2014, 2013.