Embed Size (px)
Citation preview
IEEE Std. C57.100
IEEE Standard Test Procedure for Thermal Evaluation of Liquid-Immersed Distribution and Power Transformers
11:00 am to 12:15 amMonday, 23 October 2006
St. Laurent RoomDelta Centre-Ville Hotel
Montréal, Québec Canada

Agenda
1. Introduction and Rosters2. Approval of Minutes from 20 March 2006 Meeting3. Patent Disclosure (if applicable)4. Discussion of DuPont – Weidmann Test of Power
Transformer Model 5. Discussion regarding work and how to implement
into our document. 6. Open items from past meetings
Discussion of DuPont - WeidmannTest of Power Transformer Model
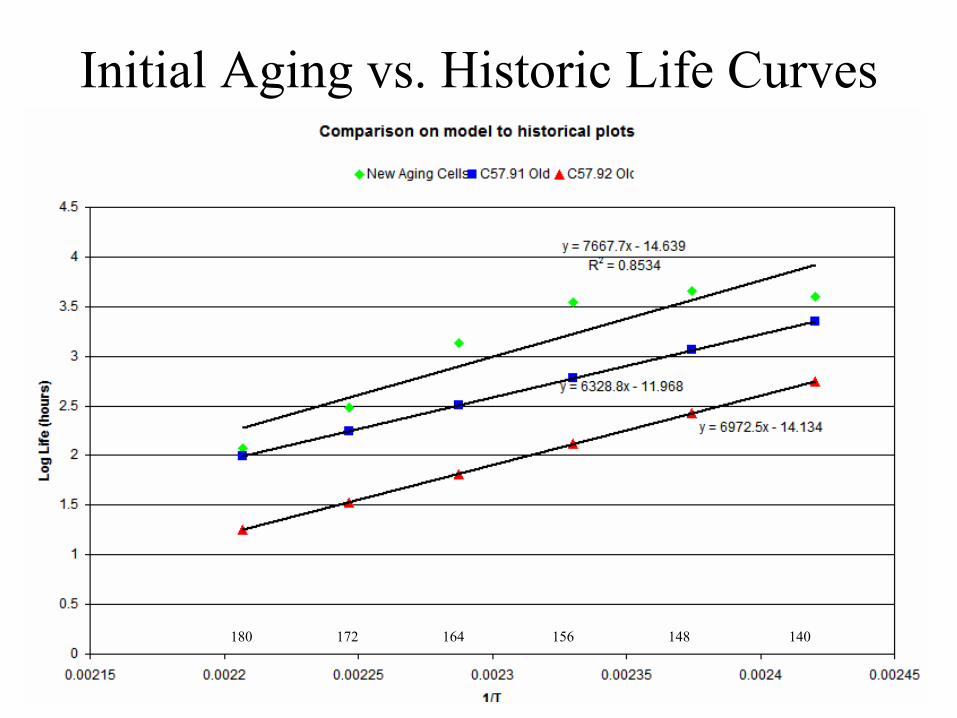
• Comparison Aging Curves to Historical Curves (C57.91-1981 and C57.92-1981)
• Comparison of Model Testing to Sealed Tube Tests
• Comparison of DP Life Curves to 50% Tensile Life Curves
• Comparison of Upgraded to Non-Upgraded Paper• Oil Quality vs. Life Testing• Work in Progress/Future Work
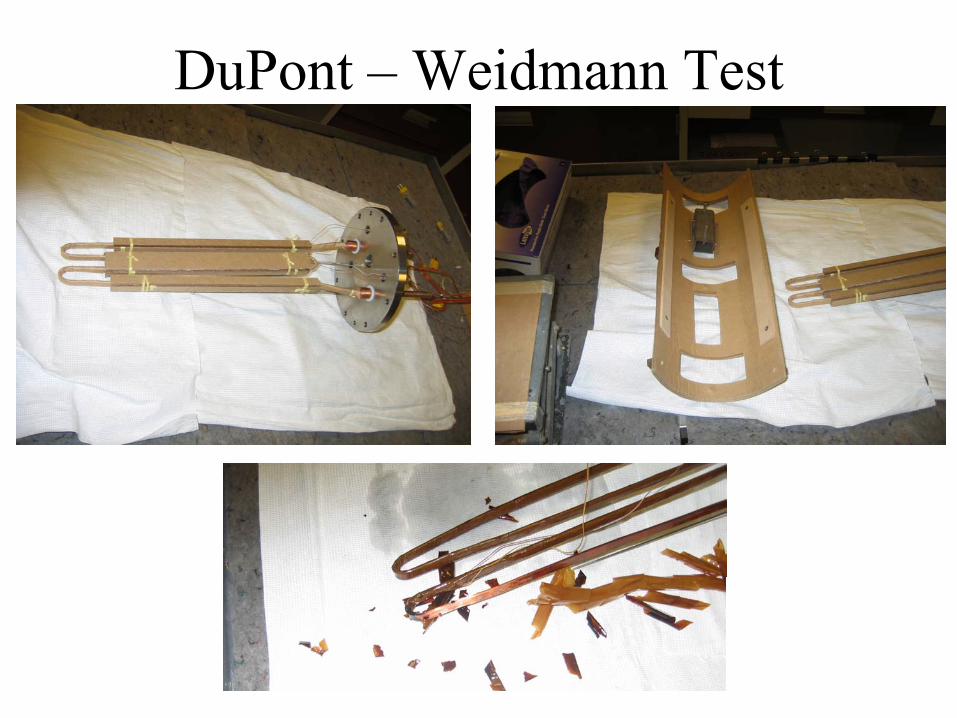
DuPont- Weidmann Test
• Review of purpose of test from last meeting• Findings to Date• Next Steps in Testing• Evaluate test methodology to determine use
as an IEEE method.
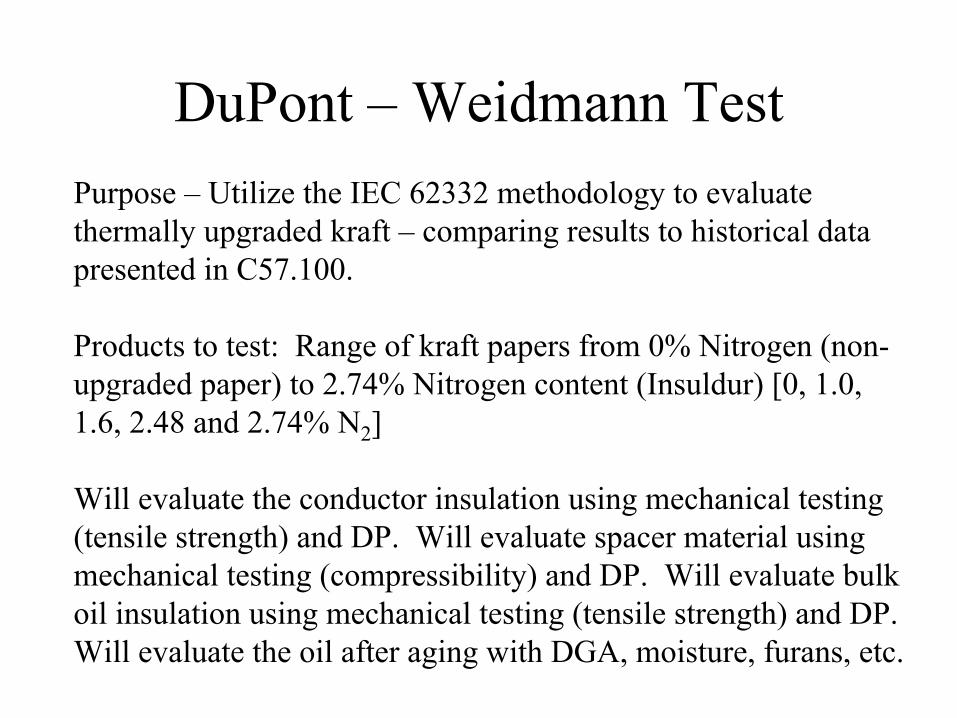
DuPont – Weidmann TestPurpose – Utilize the IEC 62332 methodology to evaluate thermally upgraded kraft – comparing results to historical data presented in C57.100.
Products to test: Range of kraft papers from 0% Nitrogen (non-upgraded paper) to 2.74% Nitrogen content (Insuldur) [0, 1.0, 1.6, 2.48 and 2.74% N2]
Will evaluate the conductor insulation using mechanical testing (tensile strength) and DP. Will evaluate spacer material using mechanical testing (compressibility) and DP. Will evaluate bulkoil insulation using mechanical testing (tensile strength) and DP. Will evaluate the oil after aging with DGA, moisture, furans, etc.
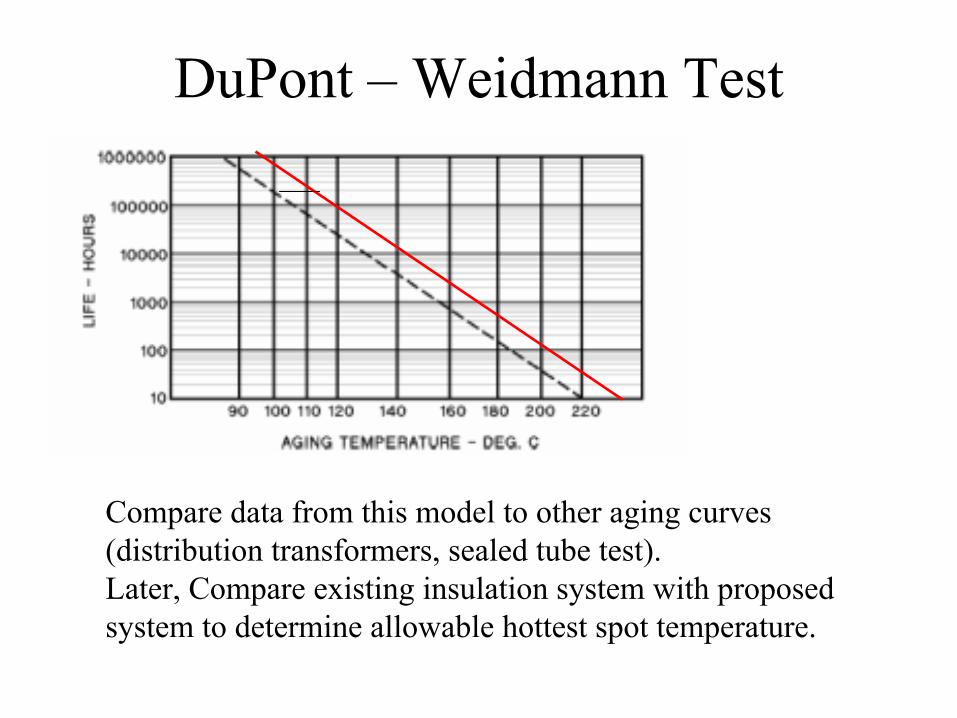
DuPont – Weidmann Test
Compare data from this model to other aging curves (distribution transformers, sealed tube test). Later, Compare existing insulation system with proposed system to determine allowable hottest spot temperature.
DuPont – Weidmann Test
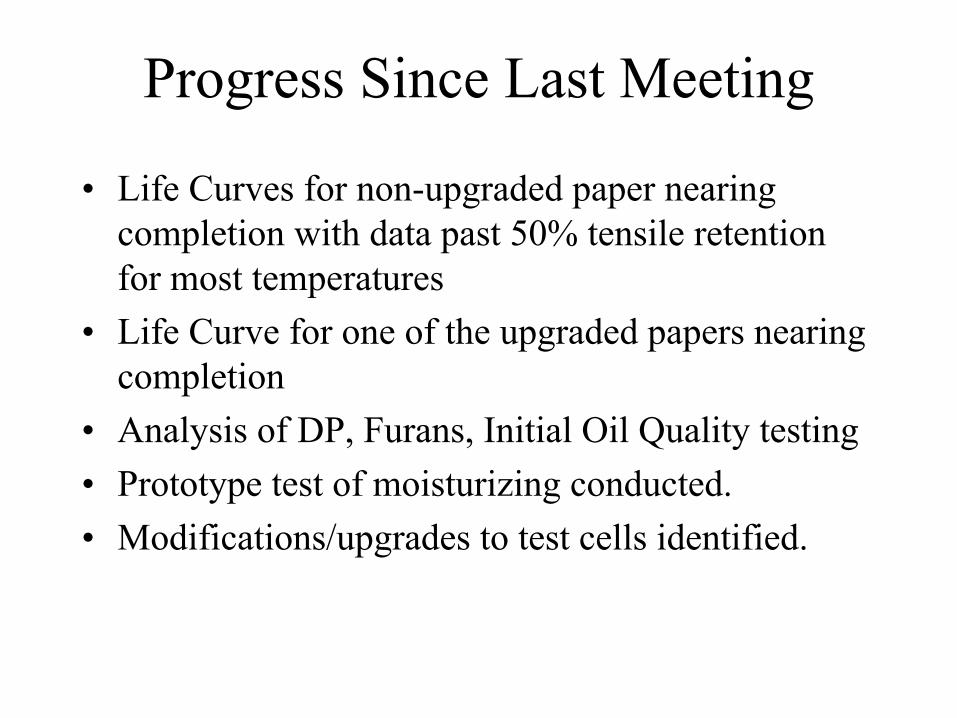
Progress Since Last Meeting
• Life Curves for non-upgraded paper nearing completion with data past 50% tensile retention for most temperatures
• Life Curve for one of the upgraded papers nearing completion
• Analysis of DP, Furans, Initial Oil Quality testing • Prototype test of moisturizing conducted.• Modifications/upgrades to test cells identified.
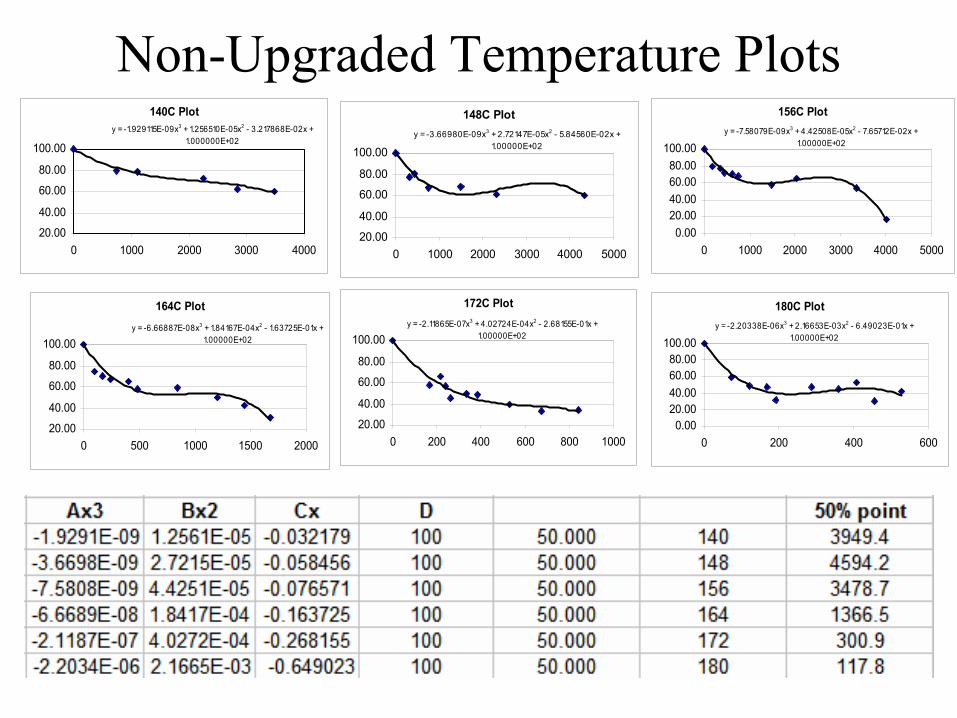
Non-Upgraded Temperature Plots140C Plot
y = -1.929115E-09x3 + 1.256510E-05x2 - 3.217868E-02x + 1.000000E+02
20.00
40.00
60.00
80.00
100.00
0 1000 2000 3000 4000
148C Ploty = -3.66980E-09x3 + 2.72147E-05x2 - 5.84560E-02x +
1.00000E+02
20.00
40.00
60.00
80.00
100.00
0 1000 2000 3000 4000 5000
156C Ploty = -7.58079E-09x3 + 4.42508E-05x2 - 7.65712E-02x +
1.00000E+02
0.0020.0040.0060.0080.00
100.00
0 1000 2000 3000 4000 5000
164C Plot
y = -6.66887E-08x3 + 1.84167E-04x2 - 1.63725E-01x + 1.00000E+02
20.00
40.00
60.00
80.00
100.00
0 500 1000 1500 2000
172C Ploty = -2.11865E-07x3 + 4.02724E-04x2 - 2.68155E-01x +
1.00000E+02
20.00
40.00
60.00
80.00
100.00
0 200 400 600 800 1000
180C Ploty = -2.20338E-06x3 + 2.16653E-03x2 - 6.49023E-01x +
1.00000E+02
0.0020.0040.0060.0080.00
100.00
0 200 400 600
180 172 164 156 148 140
Initial Aging vs. Historic Life Curves
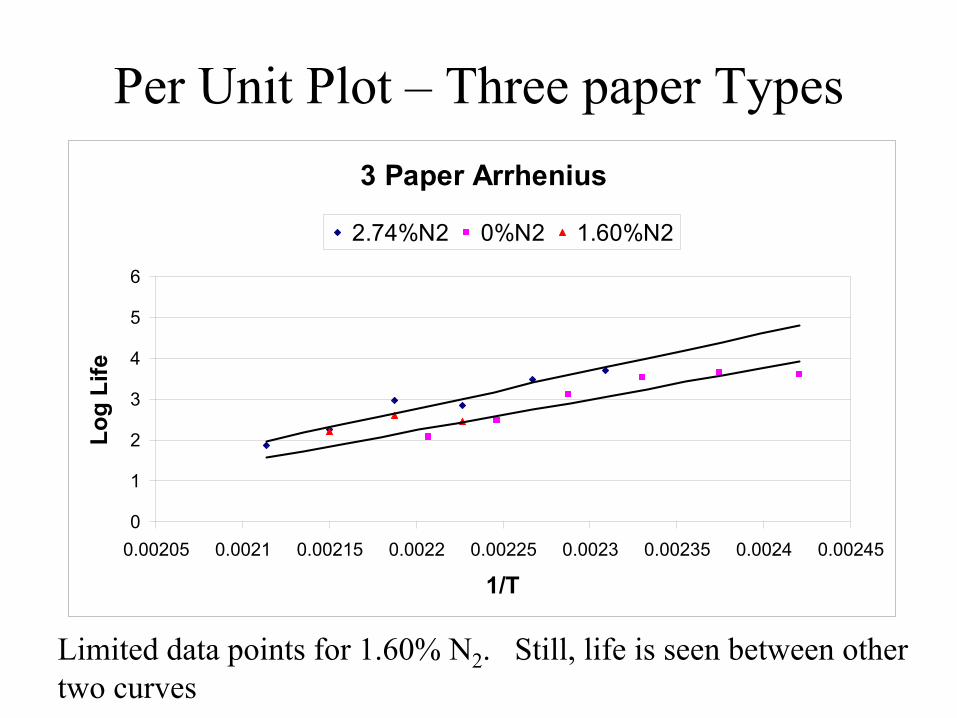
Per Unit Plot – Three paper Types
Limited data points for 1.60% N2. Still, life is seen between other two curves
3 Paper Arrhenius
0
1
2
3
4
5
6
0.00205 0.0021 0.00215 0.0022 0.00225 0.0023 0.00235 0.0024 0.00245
1/T
Log
Life
2.74%N2 0%N2 1.60%N2
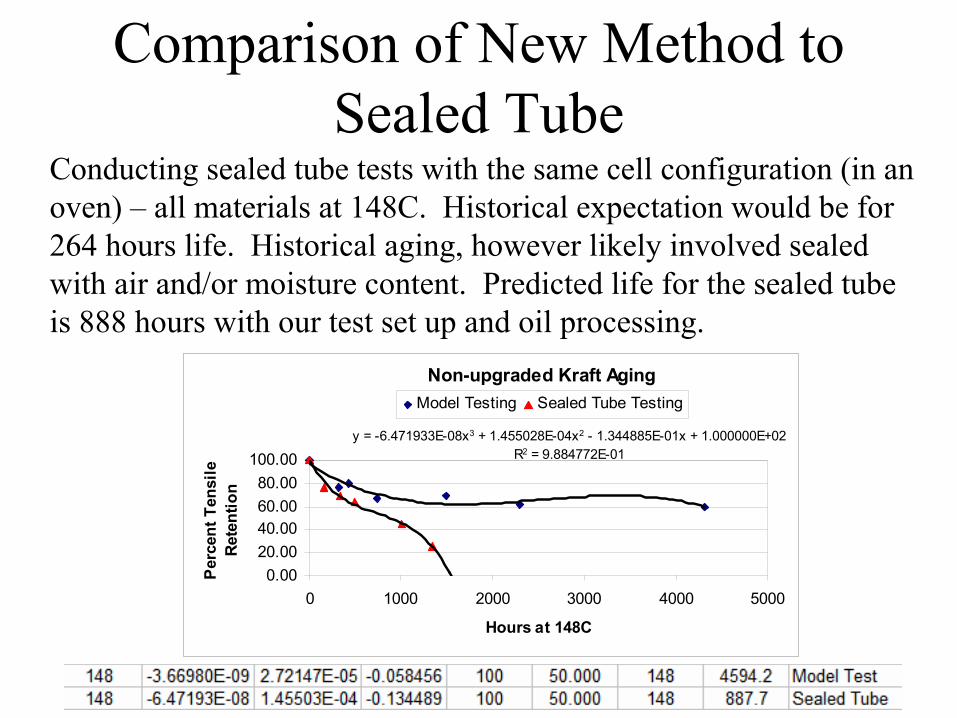
Comparison of New Method to Sealed Tube
Conducting sealed tube tests with the same cell configuration (in an oven) – all materials at 148C. Historical expectation would be for 264 hours life. Historical aging, however likely involved sealed with air and/or moisture content. Predicted life for the sealed tube is 888 hours with our test set up and oil processing.
Non-upgraded Kraft Aging
y = -6.471933E-08x3 + 1.455028E-04x2 - 1.344885E-01x + 1.000000E+02R2 = 9.884772E-01
0.0020.0040.0060.0080.00
100.00
0 1000 2000 3000 4000 5000
Hours at 148C
Perc
ent T
ensi
le
Rete
ntio
n
Model Testing Sealed Tube Testing
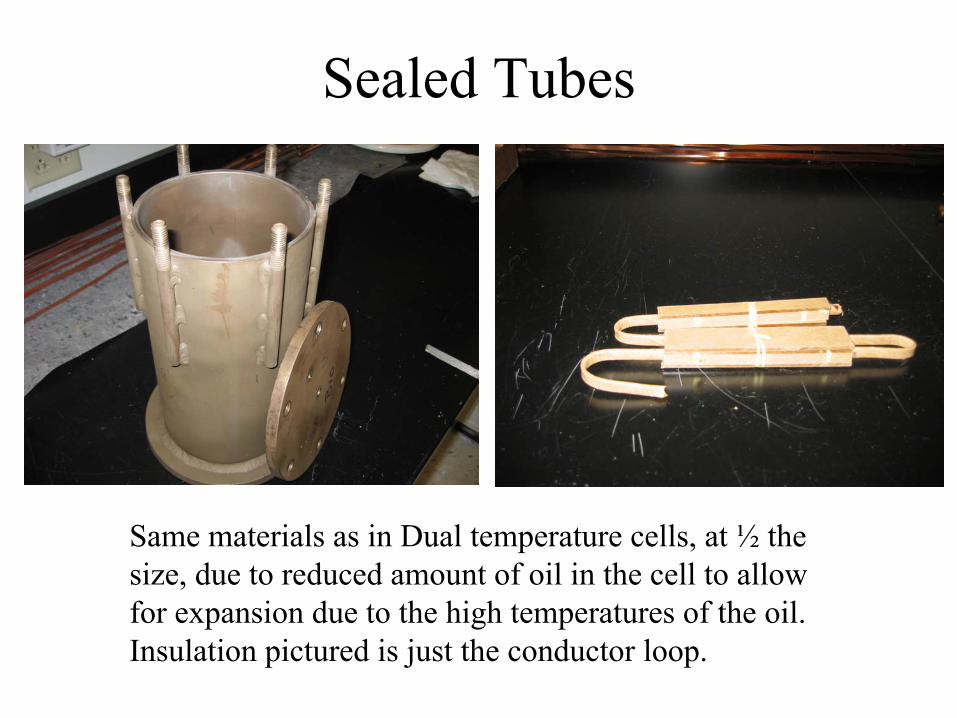
Sealed Tubes
Same materials as in Dual temperature cells, at ½ the size, due to reduced amount of oil in the cell to allow for expansion due to the high temperatures of the oil. Insulation pictured is just the conductor loop.
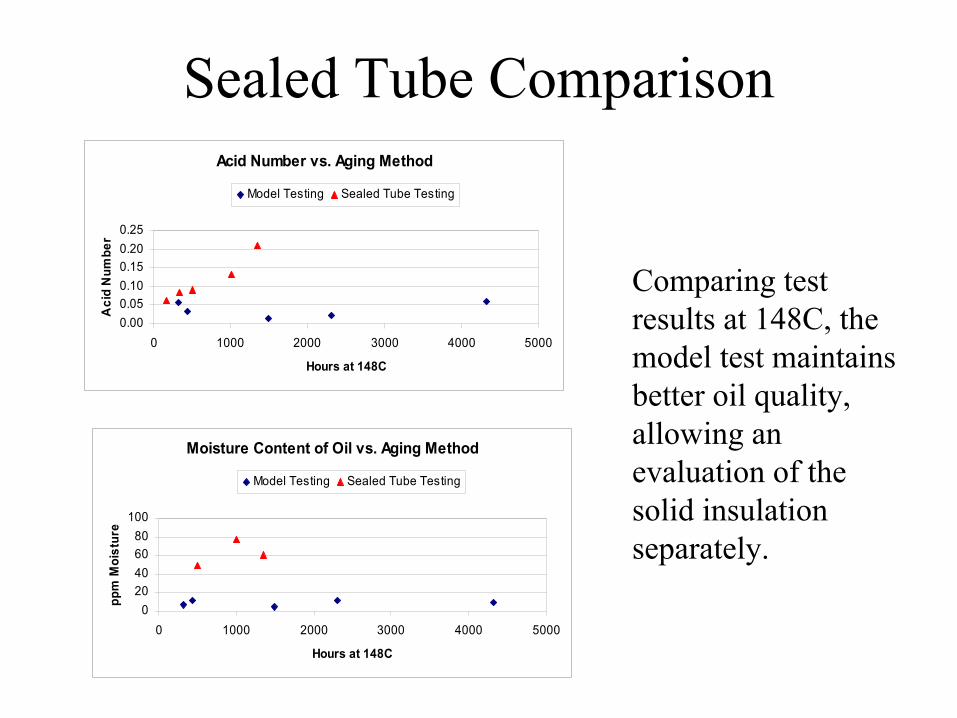
Sealed Tube ComparisonAcid Number vs. Aging Method
0.000.050.100.150.200.25
0 1000 2000 3000 4000 5000
Hours at 148C
Aci
d N
umbe
r
Model Testing Sealed Tube Testing
Moisture Content of Oil vs. Aging Method
020406080
100
0 1000 2000 3000 4000 5000
Hours at 148C
ppm
Moi
stur
e
Model Testing Sealed Tube Testing
Comparing test results at 148C, the model test maintains better oil quality, allowing an evaluation of the solid insulation separately.
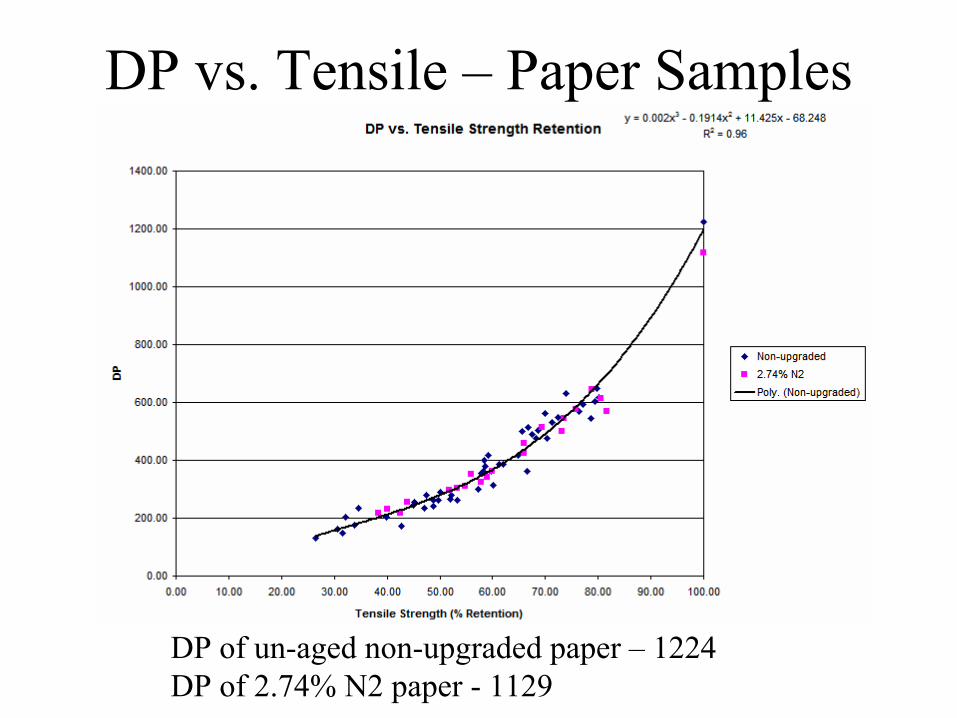
DP vs. Tensile – Paper Samples
DP of un-aged non-upgraded paper – 1224DP of 2.74% N2 paper - 1129
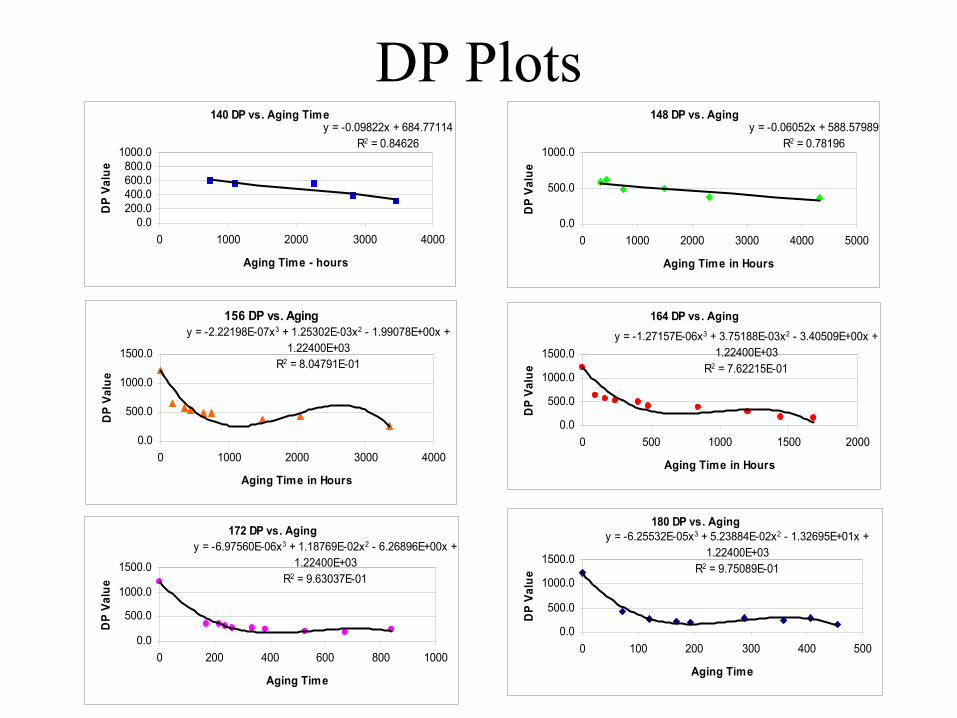
DP Plots140 DP vs. Aging Time
y = -0.09822x + 684.77114R2 = 0.84626
0.0200.0400.0600.0800.0
1000.0
0 1000 2000 3000 4000
Aging Time - hours
DP
Valu
e148 DP vs. Aging
y = -0.06052x + 588.57989R2 = 0.78196
0.0
500.0
1000.0
0 1000 2000 3000 4000 5000
Aging Time in Hours
DP
Valu
e
156 DP vs. Agingy = -2.22198E-07x3 + 1.25302E-03x2 - 1.99078E+00x +
1.22400E+03R2 = 8.04791E-01
0.0
500.0
1000.0
1500.0
0 1000 2000 3000 4000
Aging Time in Hours
DP
Valu
e
164 DP vs. Agingy = -1.27157E-06x3 + 3.75188E-03x2 - 3.40509E+00x +
1.22400E+03R2 = 7.62215E-01
0.0
500.0
1000.0
1500.0
0 500 1000 1500 2000
Aging Time in Hours
DP
Valu
e172 DP vs. Aging
y = -6.97560E-06x3 + 1.18769E-02x2 - 6.26896E+00x + 1.22400E+03
R2 = 9.63037E-01
0.0
500.0
1000.0
1500.0
0 200 400 600 800 1000
Aging Time
DP
Valu
e
180 DP vs. Agingy = -6.25532E-05x3 + 5.23884E-02x2 - 1.32695E+01x +
1.22400E+03R2 = 9.75089E-01
0.0
500.0
1000.0
1500.0
0 100 200 300 400 500
Aging Time
DP
Valu
e
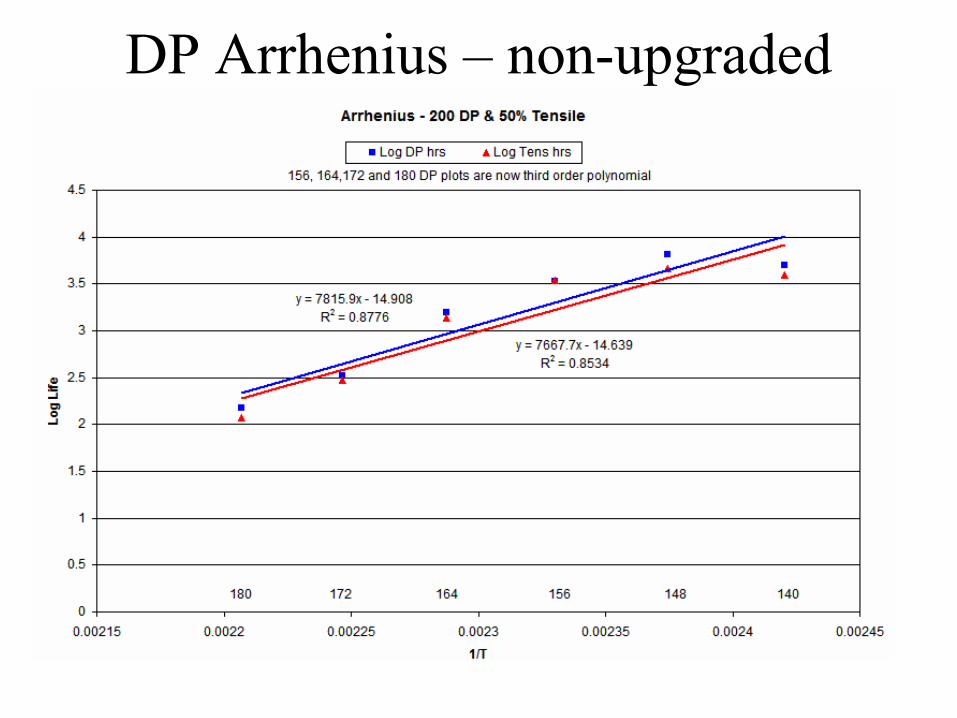
DP Arrhenius – non-upgraded
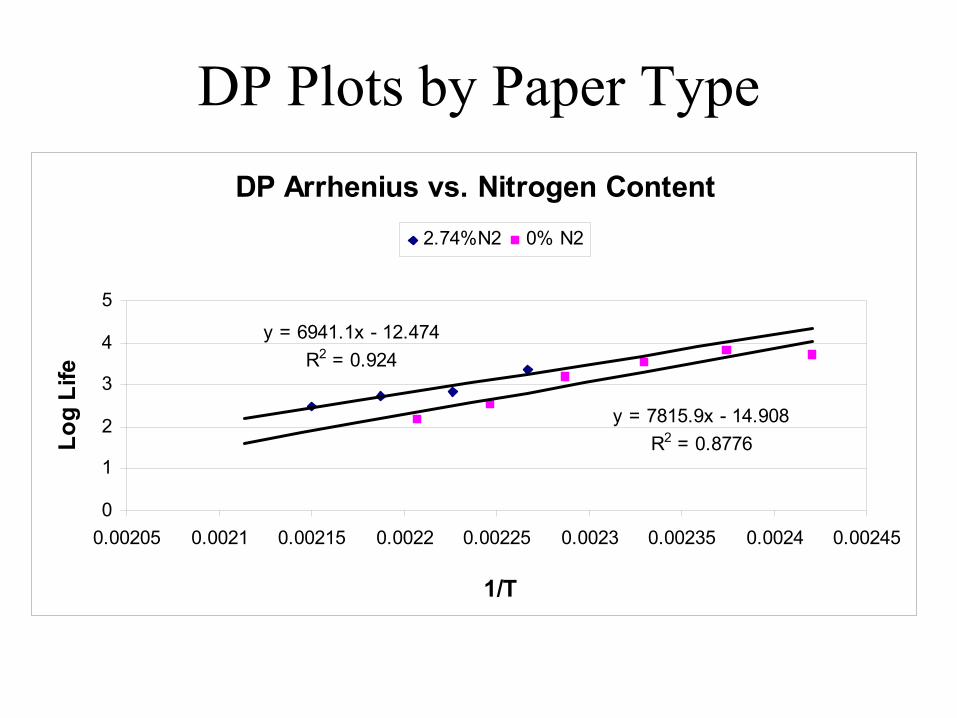
DP Plots by Paper TypeDP Arrhenius vs. Nitrogen Content
y = 6941.1x - 12.474R2 = 0.924
y = 7815.9x - 14.908R2 = 0.8776
0
1
2
3
4
5
0.00205 0.0021 0.00215 0.0022 0.00225 0.0023 0.00235 0.0024 0.00245
1/T
Log
Life
2.74%N2 0% N2
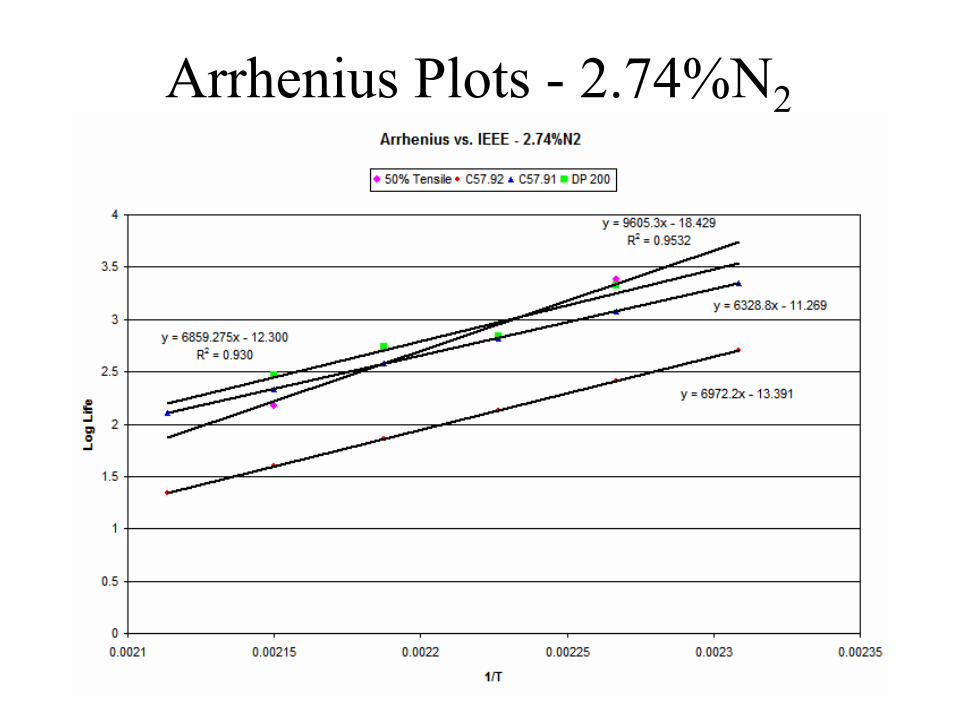
Arrhenius Plots - 2.74%N2
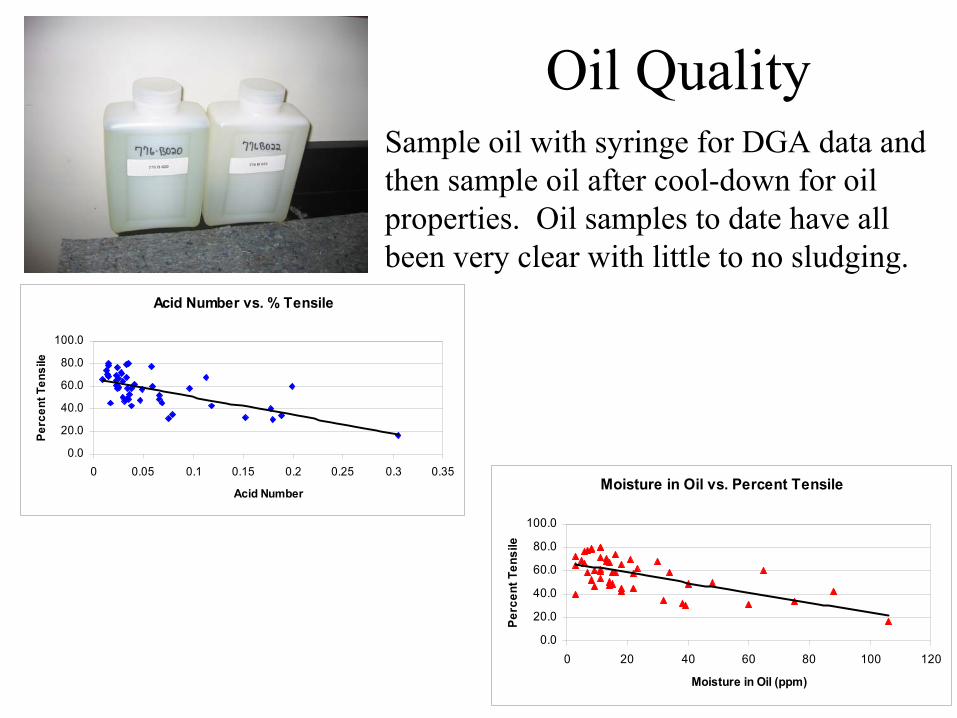
Oil QualitySample oil with syringe for DGA data and then sample oil after cool-down for oil properties. Oil samples to date have all been very clear with little to no sludging.
Acid Number vs. % Tensile
0.0
20.0
40.0
60.0
80.0
100.0
0 0.05 0.1 0.15 0.2 0.25 0.3 0.35
Acid Number
Perc
ent T
ensi
le
Moisture in Oil vs. Percent Tensile
0.0
20.0
40.0
60.0
80.0
100.0
0 20 40 60 80 100 120
Moisture in Oil (ppm)
Perc
ent T
ensi
le
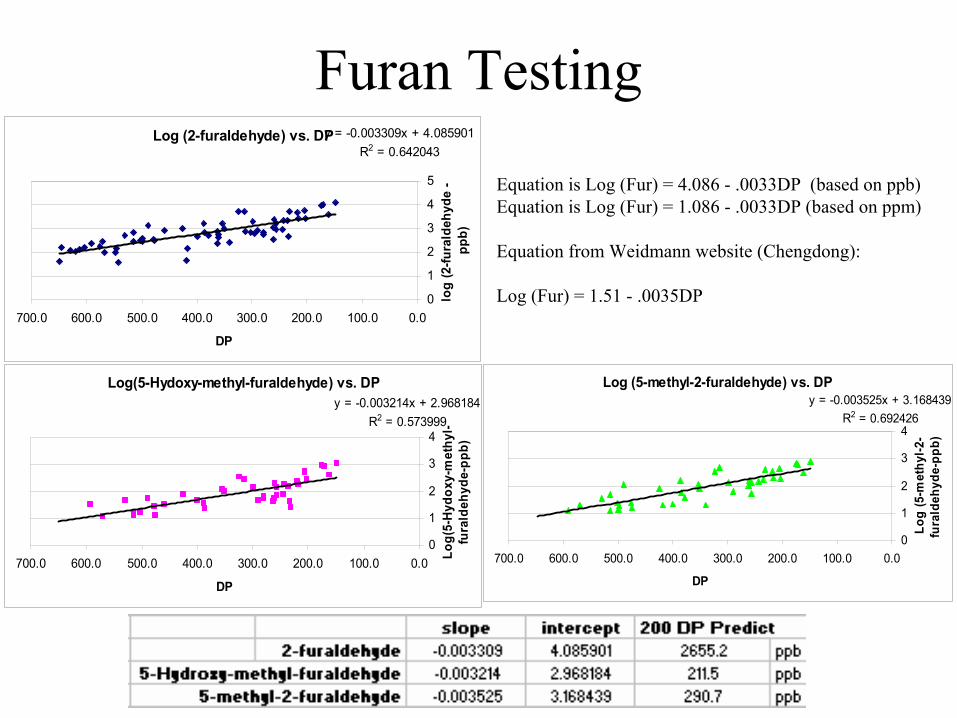
Furan Testing
Equation is Log (Fur) = 4.086 - .0033DP (based on ppb)Equation is Log (Fur) = 1.086 - .0033DP (based on ppm)
Equation from Weidmann website (Chengdong):
Log (Fur) = 1.51 - .0035DP
Log (2-furaldehyde) vs. DPy = -0.003309x + 4.085901R2 = 0.642043
0
1
2
3
4
5
0.0100.0200.0300.0400.0500.0600.0700.0
DP
log
(2-fu
rald
ehyd
e -
ppb)
Log(5-Hydoxy-methyl-furaldehyde) vs. DPy = -0.003214x + 2.968184
R2 = 0.573999
0
1
2
3
4
0.0100.0200.0300.0400.0500.0600.0700.0
DP
Log(
5-H
ydox
y-m
ethy
l-fu
rald
ehyd
e-pp
b)
Log (5-methyl-2-furaldehyde) vs. DPy = -0.003525x + 3.168439
R2 = 0.692426
0
1
2
3
4
0.0100.0200.0300.0400.0500.0600.0700.0
DP
Log
(5-m
ethy
l-2-
fura
ldeh
yde-
ppb)
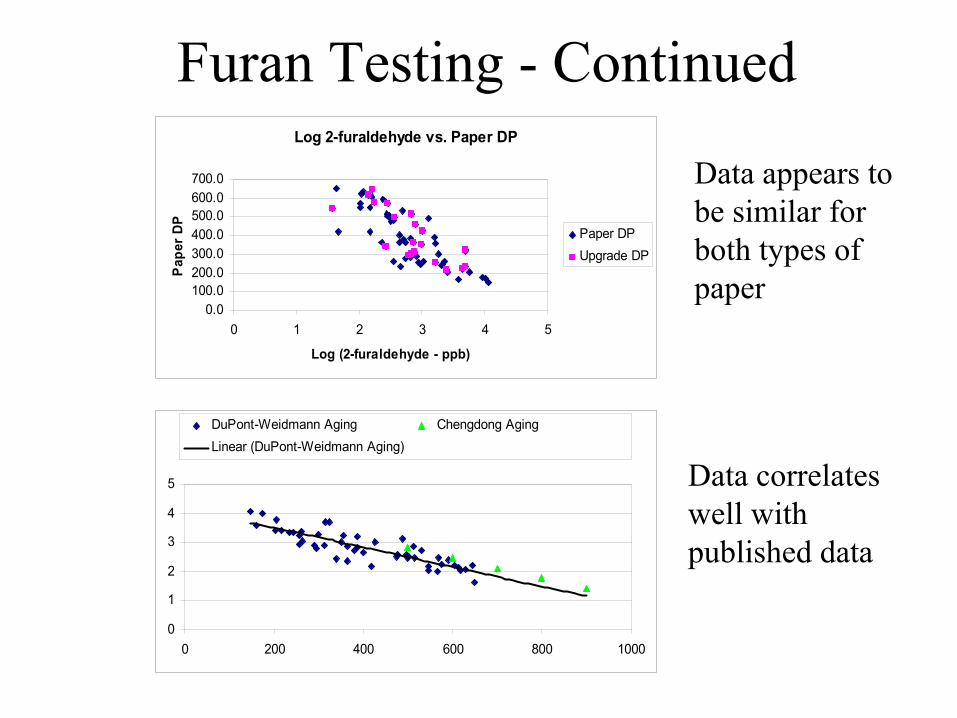
Furan Testing - Continued
Data appears to be similar for both types of paper
Data correlates well with published data
Log 2-furaldehyde vs. Paper DP
0.0100.0200.0300.0400.0500.0600.0700.0
0 1 2 3 4 5
Log (2-furaldehyde - ppb)
Pape
r DP
Paper DPUpgrade DP
0
1
2
3
4
5
0 200 400 600 800 1000
DuPont-Weidmann Aging Chengdong AgingLinear (DuPont-Weidmann Aging)
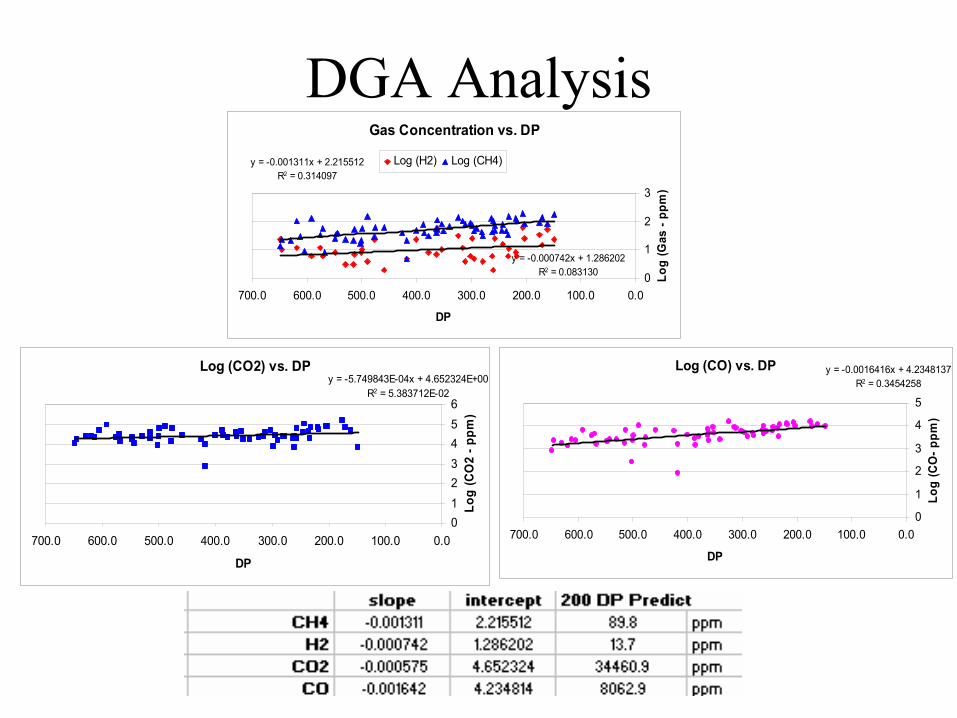
DGA Analysis
Log (CO) vs. DP y = -0.0016416x + 4.2348137R2 = 0.3454258
0
1
2
3
4
5
0.0100.0200.0300.0400.0500.0600.0700.0
DP
Log
(CO
- ppm
)
Log (CO2) vs. DPy = -5.749843E-04x + 4.652324E+00
R2 = 5.383712E-02
0123456
0.0100.0200.0300.0400.0500.0600.0700.0
DP
Log
(CO
2 - p
pm)
Gas Concentration vs. DP
y = -0.001311x + 2.215512R2 = 0.314097
y = -0.000742x + 1.286202R2 = 0.083130 0
1
2
3
0.0100.0200.0300.0400.0500.0600.0700.0
DP
Log
(Gas
- pp
m)
Log (H2) Log (CH4)
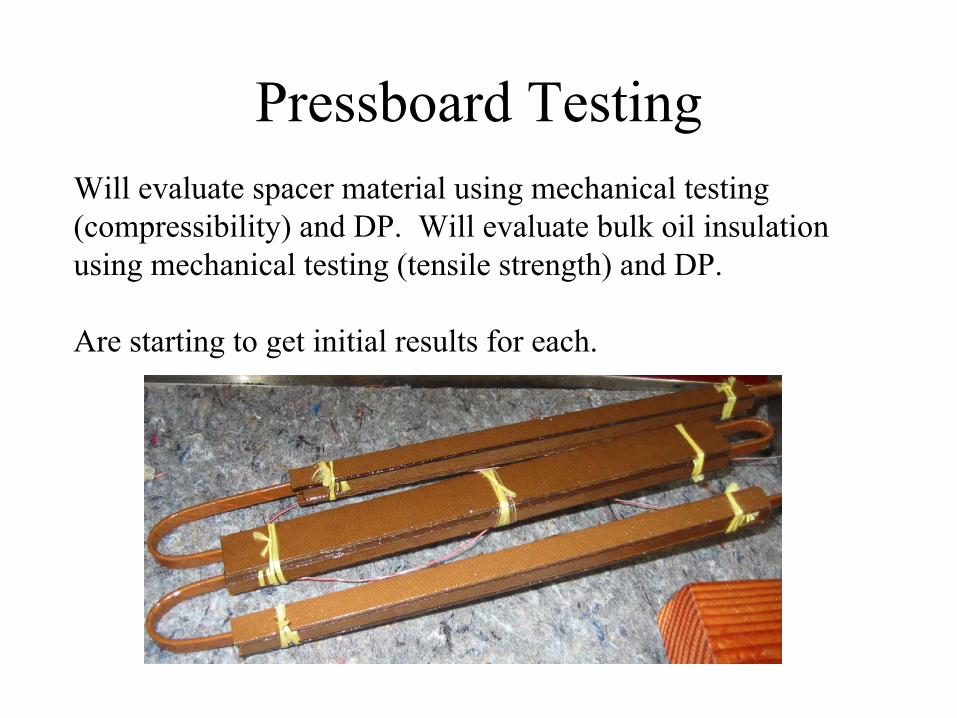
Pressboard TestingWill evaluate spacer material using mechanical testing (compressibility) and DP. Will evaluate bulk oil insulation using mechanical testing (tensile strength) and DP.
Are starting to get initial results for each.
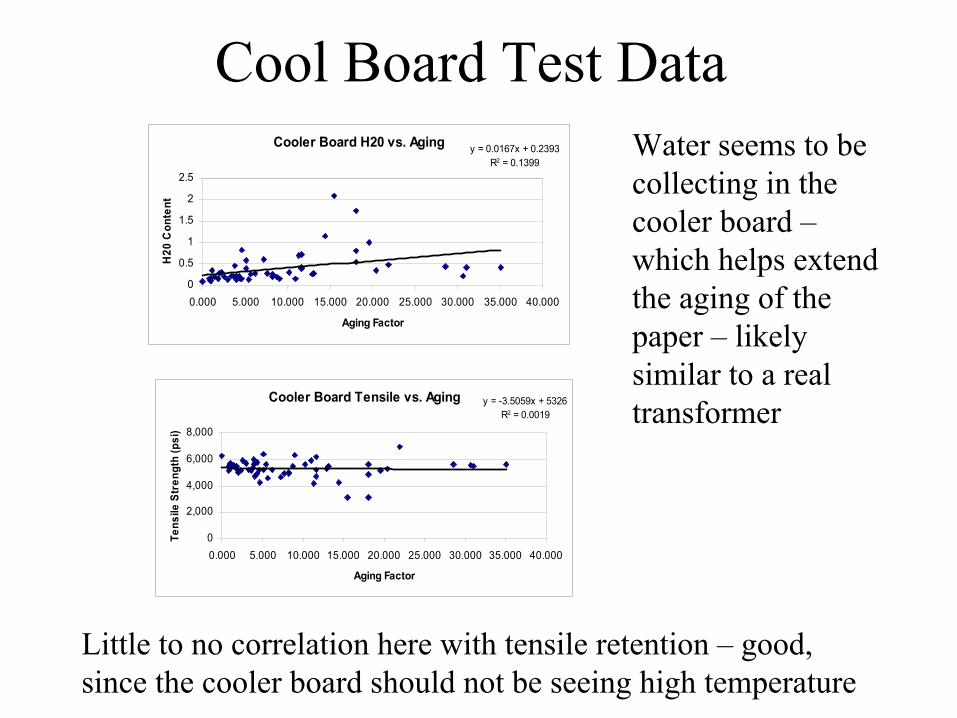
Cool Board Test DataCooler Board H20 vs. Aging y = 0.0167x + 0.2393
R2 = 0.1399
0
0.5
1
1.5
2
2.5
0.000 5.000 10.000 15.000 20.000 25.000 30.000 35.000 40.000
Aging Factor
H20
Con
tent
Cooler Board Tensile vs. Aging y = -3.5059x + 5326R2 = 0.0019
0
2,000
4,000
6,000
8,000
0.000 5.000 10.000 15.000 20.000 25.000 30.000 35.000 40.000
Aging Factor
Tens
ile S
tren
gth
(psi
)
Little to no correlation here with tensile retention – good, since the cooler board should not be seeing high temperature
Water seems to be collecting in the cooler board –which helps extend the aging of the paper – likely similar to a real transformer
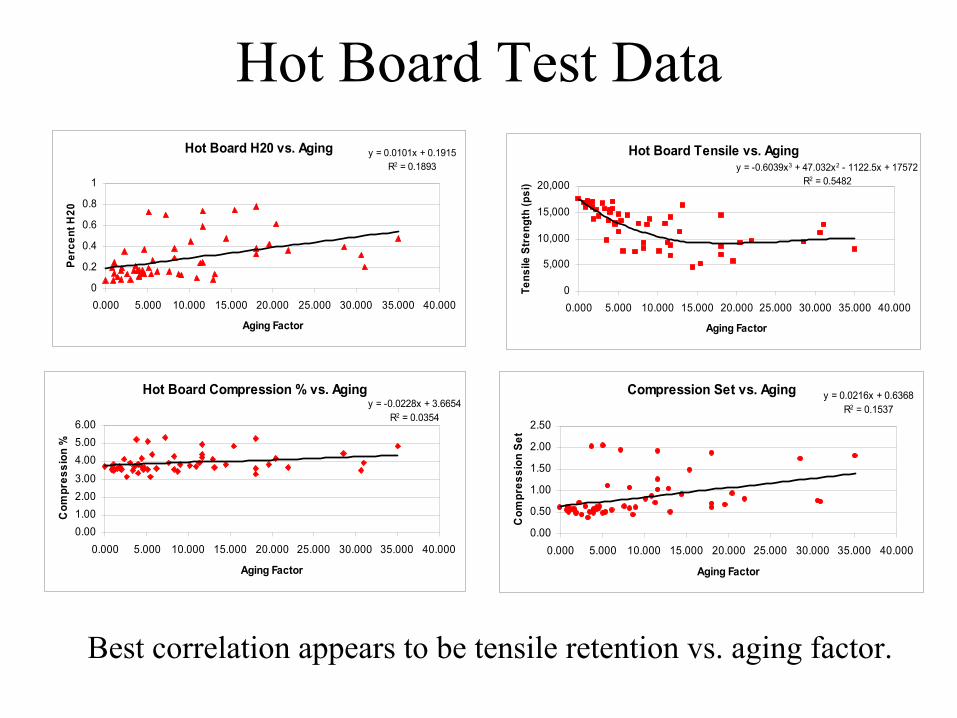
Hot Board Test DataHot Board H20 vs. Aging y = 0.0101x + 0.1915
R2 = 0.1893
0
0.2
0.4
0.6
0.8
1
0.000 5.000 10.000 15.000 20.000 25.000 30.000 35.000 40.000
Aging Factor
Perc
ent H
20
Hot Board Tensile vs. Agingy = -0.6039x3 + 47.032x2 - 1122.5x + 17572
R2 = 0.5482
0
5,000
10,000
15,000
20,000
0.000 5.000 10.000 15.000 20.000 25.000 30.000 35.000 40.000
Aging Factor
Tens
ile S
tren
gth
(psi
)
Hot Board Compression % vs. Agingy = -0.0228x + 3.6654
R2 = 0.0354
0.001.002.003.00
4.005.006.00
0.000 5.000 10.000 15.000 20.000 25.000 30.000 35.000 40.000
Aging Factor
Com
pres
sion
%
Compression Set vs. Aging y = 0.0216x + 0.6368R2 = 0.1537
0.00
0.50
1.00
1.50
2.00
2.50
0.000 5.000 10.000 15.000 20.000 25.000 30.000 35.000 40.000
Aging Factor
Com
pres
sion
Set
Best correlation appears to be tensile retention vs. aging factor.
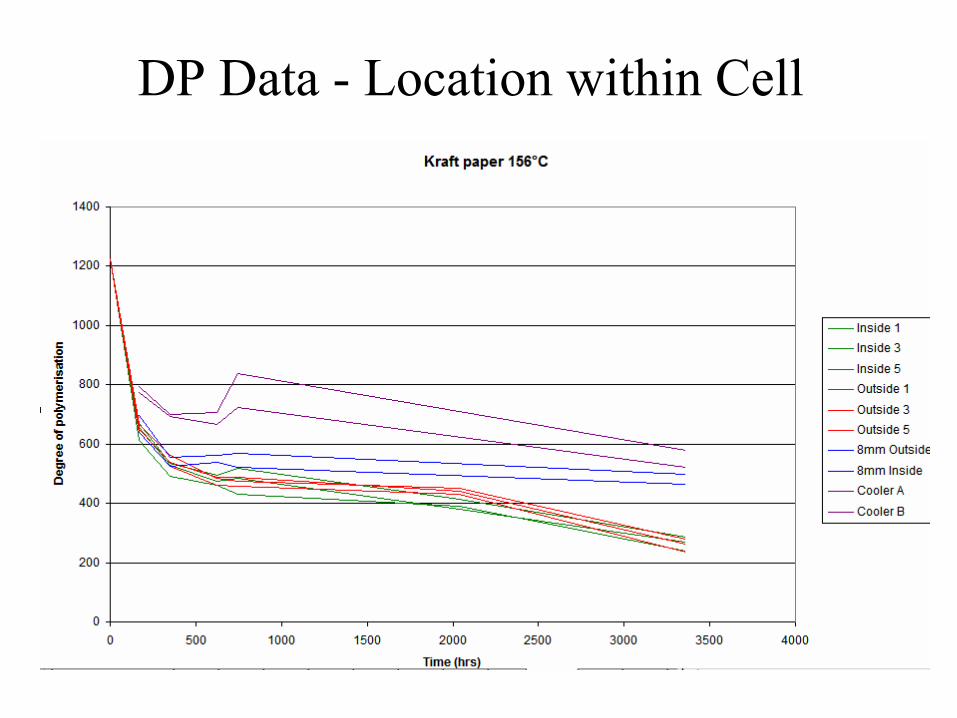
DP Data - Location within Cell
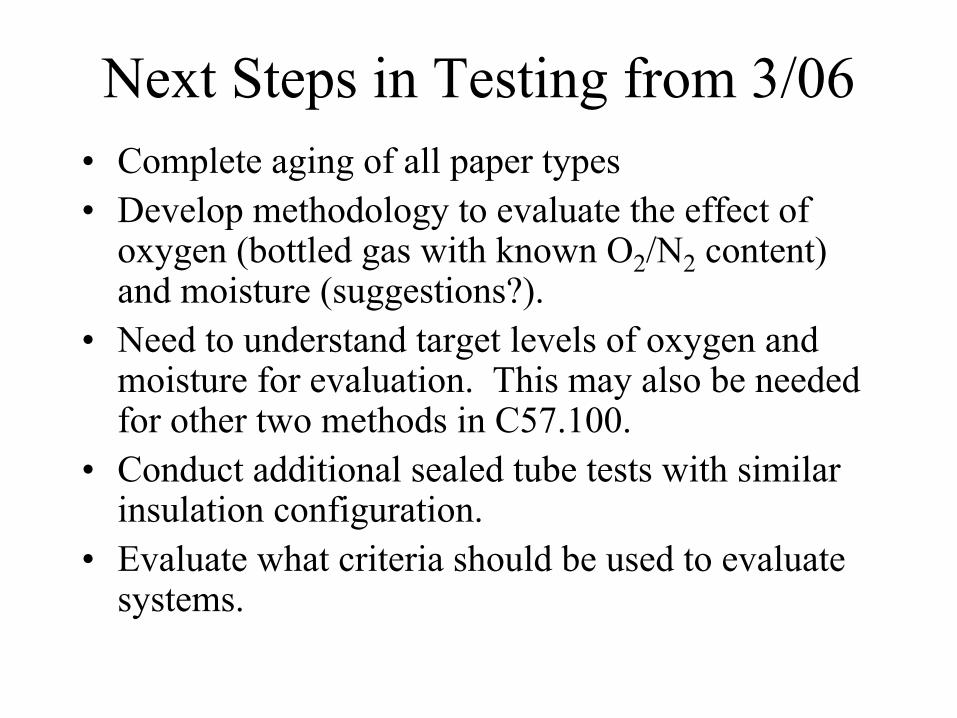
Next Steps in Testing from 3/06• Complete aging of all paper types• Develop methodology to evaluate the effect of
oxygen (bottled gas with known O2/N2 content) and moisture (suggestions?).
• Need to understand target levels of oxygen and moisture for evaluation. This may also be needed for other two methods in C57.100.
• Conduct additional sealed tube tests with similar insulation configuration.
• Evaluate what criteria should be used to evaluate systems.
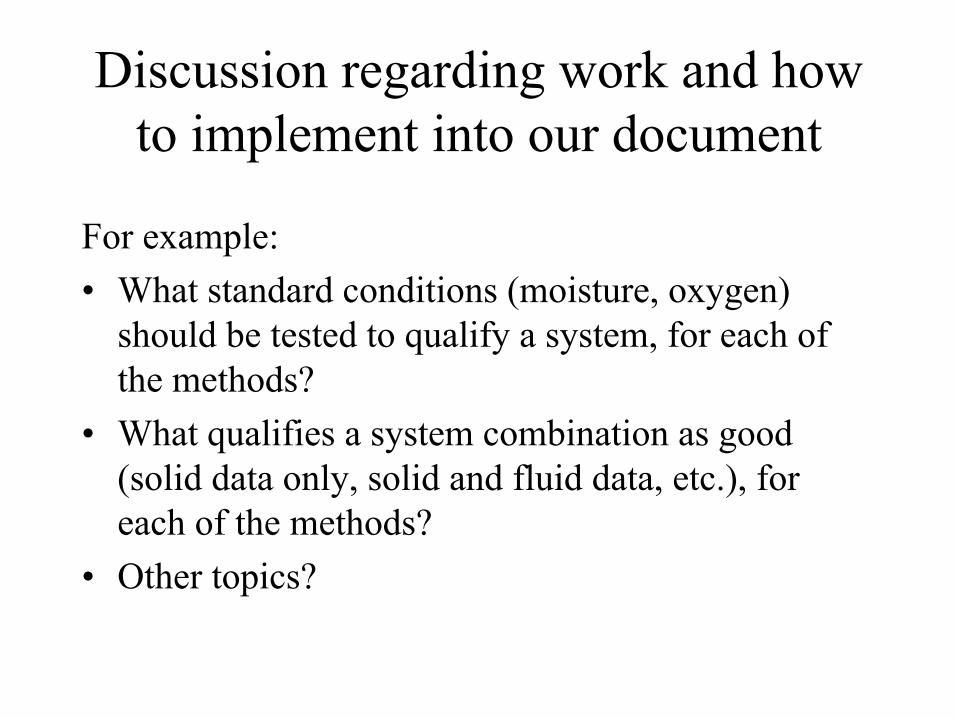
Discussion regarding work and how to implement into our document
For example:• What standard conditions (moisture, oxygen)
should be tested to qualify a system, for each of the methods?
• What qualifies a system combination as good (solid data only, solid and fluid data, etc.), for each of the methods?
• Other topics?
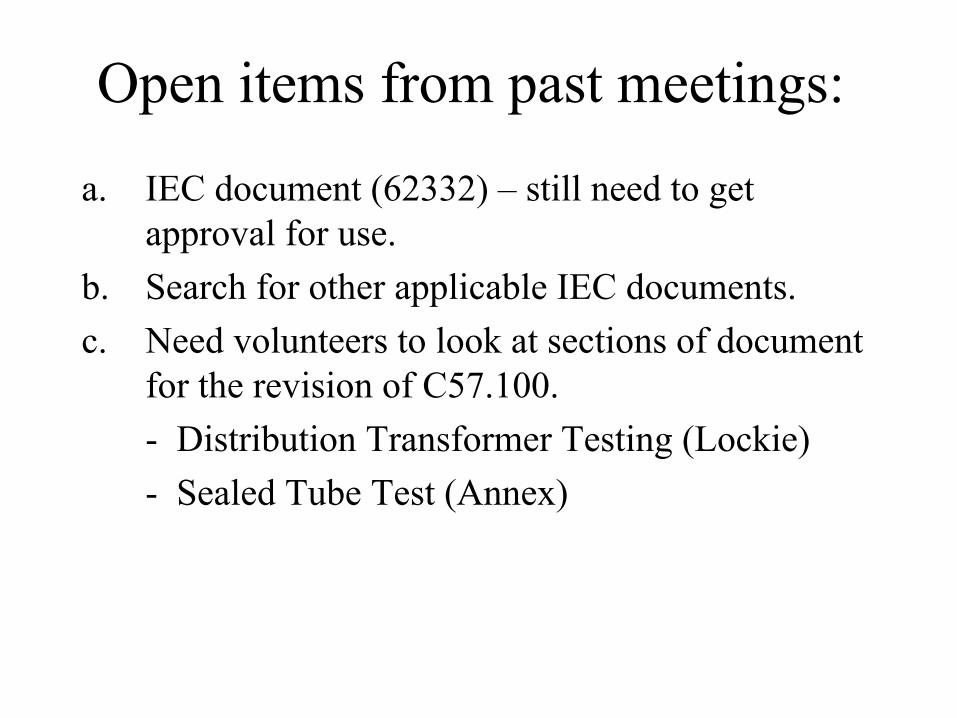
Open items from past meetings:
a. IEC document (62332) – still need to get approval for use.
b. Search for other applicable IEC documents.c. Need volunteers to look at sections of document
for the revision of C57.100.- Distribution Transformer Testing (Lockie)- Sealed Tube Test (Annex)
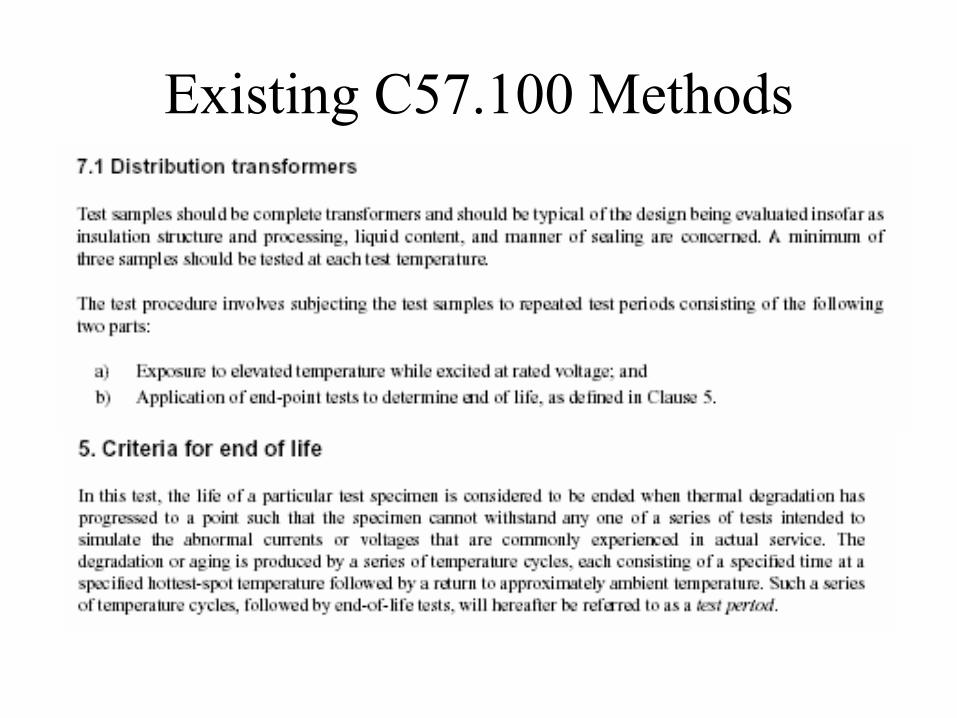
Existing C57.100 Methods
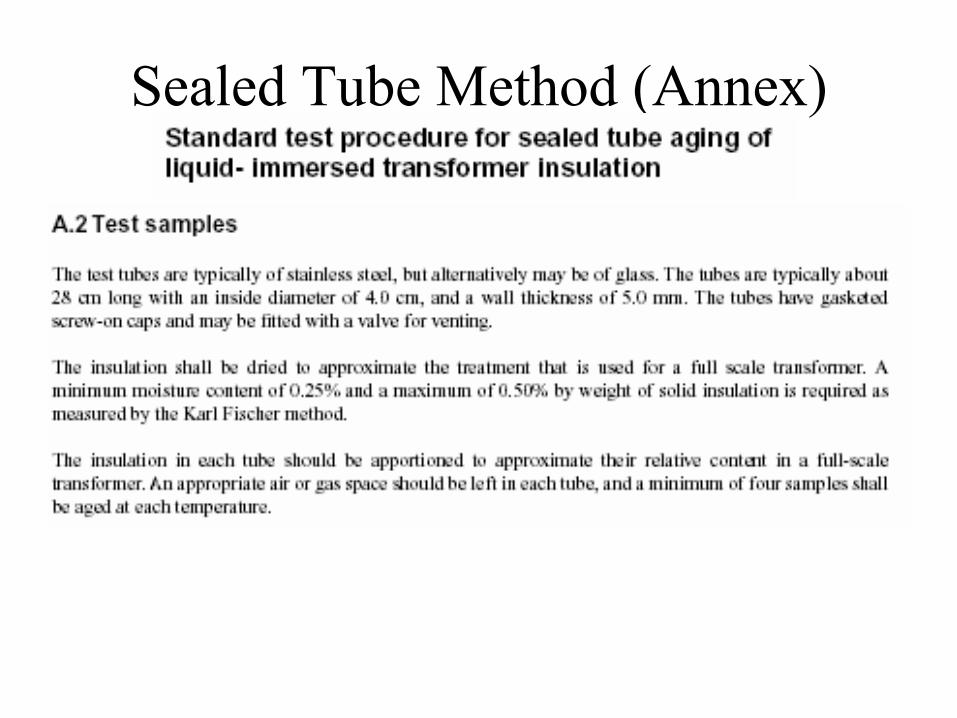
Sealed Tube Method (Annex)

Finish Up meeting