Embed Size (px)
Citation preview

2006-07-01 IEEE C802.16j-06/045
Page 1 of 15
Project IEEE 802.16 Broadband Wireless Access Working Group <http://ieee802.org/16>
Title Path-loss and Shadow Fading Models for IEEE 802.16j Relay Task Group
Date Submitted
2006-07-01
Source(s) I-Kang Fu National Chiao Tung University / Industrial Technology Research Institute 1001 Ta Hsueh Road, Hsinchu , Taiwan 300, ROC.
Wendy C Wong Intel Corporation 2200 Mission College Blvd., Santa Clara, CA 95054, USA.
David Chen Motorola Inc 1441 W. Shure Drive, Arlington Heights, IL 60004 USA.
Mike Hart Sunil Vadgama Fujitsu Laboratories of Europe Ltd. Hayes Park Central Hayes End, Middx., UB4 8FE, UK.
Peter Wang Nokia US 6000 Connection Dr Irving, TX 75039, USA.
[email protected] [email protected] [email protected] [email protected]
Re: Call for comments and contributions for session#44 (IEEE 802.16j-06/006)
Abstract This contribution compares different path-loss and shadow fading models and proposes the appropriate models for performance evaluation in IEEE 802.16j Relay TG.
Purpose Response the chair’s call for comments on Evaluation Methodology (C802.16j_06/040)
Notice This document has been prepared to assist IEEE 802.16. It is offered as a basis for discussion and is not binding on the contributing individual(s) or organization(s). The material in this document is subject to change in form and content after further study. The contributor(s) reserve(s) the right to add, amend or withdraw material contained herein.
Release The contributor grants a free, irrevocable license to the IEEE to incorporate material contained in this contribution, and any modifications thereof, in the creation of an IEEE Standards publication; to copyright in the IEEE’s name any IEEE Standards publication even though it may include portions of this contribution; and at the IEEE’s sole discretion to permit others to reproduce in whole or in part the resulting IEEE Standards publication. The contributor also acknowledges and accepts that this contribution may be made public by IEEE 802.16.
Patent Policy and Procedures
The contributor is familiar with the IEEE 802.16 Patent Policy and Procedures <http://ieee802.org/16/ipr/patents/policy.html>, including the statement “IEEE standards may include the known use of patent(s), including patent applications, provided the IEEE receives assurance from the patent holder or applicant with respect to patents essential for compliance with both mandatory and optional portions of the standard.” Early disclosure to the Working Group of patent information that might be relevant to the standard is essential to reduce the possibility for delays in the development process and increase the likelihood that the draft publication will be approved for publication. Please notify the Chair <mailto:[email protected]> as early as possible, in written or electronic form, if patented technology (or technology under patent application) might be incorporated into a draft standard being developed within the IEEE 802.16 Working Group. The Chair will disclose this notification via the IEEE 802.16 web site <http://ieee802.org/16/ipr/patents/notices>.

2006-07-01 IEEE C802.16j-06/045
Page 2 of 15
Table of Contents
1 INTRODUCTION .............................................................................................................................3 2 PATH-LOSS AND SHADOW FADING MODELS.......................................................................3
2.1 IEEE 802.16 MODEL............................................................................................................................3 2.2 ITU MODEL .........................................................................................................................................4
2.2.1 Indoor Office Test Environment ........................................................................................4 2.2.2 Outdoor to Indoor Pedestrian Test Environment ...............................................................4 2.2.3 Vehicular Test Environment ..............................................................................................5
2.3 WINNER MODEL ................................................................................................................................5 2.3.1 WINNER B1 Scenario .......................................................................................................5 2.3.2 WINNER B5a Scenario .....................................................................................................6 2.3.3 WINNER C2 Scenario .......................................................................................................6
3 CORRELATION MODELS FOR SHADOW FADING ...............................................................7 3.1 AUTO-CORRELATION MODEL FOR SHADOW FADING..........................................................................7 3.2 CROSS-CORRELATION MODEL FOR SHADOW FADING.........................................................................8
4 COMPARISON RESULTS ..............................................................................................................9 4.1 COMPARISON ON PATH-LOSS MODELS................................................................................................9 4.2 COMPARISON ON SHADOW FADING MODELS....................................................................................12
5 SUMMARY......................................................................................................................................13 6 REFERENCES ................................................................................................................................14 APPENDIX A ............................................................................................................................................15

2006-07-01 IEEE C802.16j-06/045
Page 3 of 15
Comparison on Path-loss and Shadow Fading Models for IEEE 802.16j Relay Task Group
I-Kang Fu1, Wendy C Wong2, David Chen3, Mike Hart4 and Peter Wang5
1NCTU/ITRI, 2Intel Corporation, 3Motorola Inc., 4Fujitsu Laboratories of Europe Ltd., 5Nokia US.
1 Introduction
This contribution aims to compare several popular path-loss and shadow fading models to assist IEEE 802.16j Relay TG to conclude appropriate channel models for performance evaluation. Three kinds of channel models are considered here: existing IEEE 802.16 channel model [1], ITU channel model [2] and WINNER channel model [3], which will be introduced in section 2. In section 3, two types of correlation models for simulating shadow fading are introduced. In section 4, comparison on path-loss and shadow fading model will be presented.
2 Path-loss and Shadow Fading Models
The unit of following path-loss and shadow fading models are all in dB.
2.1 IEEE 802.16 Model
The IEEE 802.16 path-loss and shadow fading model is given by [1,4]
PL= A + 10 · γ · log10( d / d0 ) + ΔPLf + ΔPLh + s dB (1)
where d0=100m, A=20·log10(4πd0 /λ) and γ=(a - b· hb+ c/ hb). λ is the wavelength in meter and hb is the base station antenna height, which is between 10m and 80m. “s” is the log-normal shadow fading component in dB and d is the distance in meters. Three propagation scenarios are categorized as
Terrain Type A: Hilly terrain with moderate-to-heavy tree densities
Terrain Type B: Intermediate path-loss condition
Terrain Type C: Flat terrain with light tree densities
The corresponding parameters for each propagation scenario are
Model Parameter Terrain Type A Terrain Type B Terrain Type C
a 4.6 4 3.6
b 0.0075 0.0065 0.005
c 12.6 17.1 20
Standard deviation of “s” 10.6 dB 9.6 dB 8.2 dB

2006-07-01 IEEE C802.16j-06/045
Page 4 of 15
Moreover, the correction factors for carrier frequency (ΔPLf) and receive antenna height (ΔPLh) are:
ΔPLf = 6 · log10( f / 2000) dB (2) where f is the carrier frequency in MHz.
ΔPLh = - 10.8 · log10( h / 2 ) dB ; for Terrain Type A and B (3) ΔPLh = - 20 · log10( h / 2 ) dB ; for Terrain Type C where h is the receive antenna height between 2m and 10m.
2.2 ITU Model
The following ITU models are referenced from [2].
2.2.1 Indoor Office Test Environment
The path-loss model for indoor environment is
PL = 37 + 30 · log10( d ) + 18.3 · n((n+2)(n+1)-0.46) dB (4) where d is the distance in meters and n is the number of floors in the path.
The corresponding standard deviation of log-normal shadow fading is 12dB.
(Note: There is no frequency correction term for this model in [2], therefore we apply Equation 2 for frequency correction in following comparison results.)
2.2.2 Outdoor to Indoor and Pedestrian Test Environment
The following model is used for the outdoor to indoor and pedestrian test environment:
PL = 49 + 40 · log10( d ) + 30 · log10( f ) dB (5) where d is the distance in kilometers and f is the carrier frequency of 2000 in MHz
The corresponding standard deviation of log-normal shadow fading is 10dB for outdoor users and 12 dB for indoor users and the average building penetration loss is 12dB with 8dB standard deviation.
2.2.2.1 Model for Manhattan-like Environment A more detailed model is introduced to consider the line-of-sight (LOS) and non line-of-sight (NLOS) situations:
(Note: There is no frequency correction term for this model in [2], therefore we apply Equation 2 for frequency correction in following comparison results.)

2006-07-01 IEEE C802.16j-06/045
Page 5 of 15
( )
( )
( )
Manhattan macro
Manhattan 10 11
macro
,
420 log
1
24 45 log 20
min
nn
jj
br br
br
PL PL
dPL D s
x x x xwhere D x
x x
PL d
PL
dB
dB
πλ −
=
⎛ ⎞⎛ ⎞= ⋅ ⋅⎜ ⎟⎜ ⎟⎜ ⎟⎝ ⎠⎝ ⎠
>⎧= ⎨ ≤⎩
= + ⋅ +
=
∑ (6)
The parameter illusory distance dn can be obtained by kn = kn-1 + dn-1·c and dn = kn·sn-1 + dn-1 with d0 = 0 and k0 = 1. The break point xbr is set to 300m, and c is set to be 0.5 for 90 degree street crossing in Manhattan-like environment. x is the distance from transmitter to receiver and sn-1 is the length of the last segment. d is the shortest physical geographical distance from transmitter to receiver in meters, and other detail description of each parameter can refer to [5] and [6].
2.2.3 Vehicular Test Environment
This model is applicable for the test scenarios in urban and suburban areas outside the high rise core:
PL = 40·(1- 4×10⁻³Δhb)·log10(d) - 18·log10(Δhb) + 21·log10( f ) + 80 dB (7) Δhb is the base station antenna height in meters, which is measured from average rooftop level and valid from 0 to 50m. d is the distance in kilometers, and f is the carrier frequency of 2000 in MHz. The standard deviation of log-normal shadow fading is considered as 10dB here.
2.3 WINNER Model
Currently, only part of the WINNER channel models are in public [3]. We select the following ones whose propagation scenarios are close to the target of IEEE 802.16j project.
2.3.1 WINNER B1 Scenario
This scenario is defined for Manhattan-like urban micro-cell environment where both transmit and receive antenna heights are below surrounding buildings. The models for this scenario are classified as LOS and NLOS cases, which are shown below. (Note: Original B1 and C2 models do not provide the frequency correction term, the terms in following models are referenced from B5a model in [3].)
For B1 LOS scenario:
PL = 41 + 22.7 · log10( d ) + 20 · log10( f / 5 ) dB (8) where d is the distance in meters and valid from 10m to 650m.
For B1 NLOS scenario:
PL = 65 + 0.096 · d1 + (28-0.024 · d1) · log10(d2) + 20 · log10( f / 5 ) dB (9) where d1 is the distance along the main street in meters and d2 is for perpendicular street.

2006-07-01 IEEE C802.16j-06/045
Page 6 of 15
Fig.1 Geography of WINNER B1 NLOS Scenario
The probability to have LOS condition is given as:
( )( )( )1
3 310
1 15
1 1 1.56 0.48 log 15LOS
d mP
d d m
≤⎧⎪= ⎨− − − ⋅ >⎪⎩
(10)
The standard deviation of log-normal shadow fading is 2.3dB for LOS scenario and 3.1 dB for NLOS scenario.
(Note: Currently there is no frequency correction term for this model, the term 20·log10(f/5) is referenced from WINNER B5a model with the carrier frequency of 5GHz.)
2.3.2 WINNER B5a Scenario
This scenario is defined for LOS stationary transmission, where both transmit and receive antenna are above rooftop.
( ) ( )10 1036.5 23.5 log 20 log / 2.5PL d f= + ⋅ + ⋅ (11)
where d is the distance in meters and valid from 30m to 8km, and f is the carrier frequency in GHz.
The standard deviation of log-normal shadow fading is 3.4dB for this scenario.
2.3.3 WINNER C2 Scenario
This scenario is defined for urban macro cell, where base station antenna height is above rooftop and the mobile station is at street level. NLOS transmission is the typical case in this scenario, the model is given as
( ) ( )10 1038.4 35 log 20 log / 5 0.7 mPL d f h= + ⋅ + ⋅ − ⋅ (12)
where d is the distance in meters and valid from 50m to 5km, and f is the carrier frequency in GHz.
The standard deviation of log-normal shadow fading is 8dB for this scenario.
(Note: Currently there is no frequency correction term for this model, the term 20·log10(f/5) is referenced from WINNER B5a model with the carrier frequency of 5GHz.)

2006-07-01 IEEE C802.16j-06/045
Page 7 of 15
3 Correlation Models for Shadow Fading
By given mean (usually equal to 0dB) and standard deviation, the level of shadow fading (in dB) is usually simulated by dropping a Normal distributed random variable. This refers to typical log-normal shadow fading model. However, the correlation of the propagation environment for different observation time or different radio links can not be presented if the simulator drops these variables independently. Two types of correlation models for shadow fading are introduced in this section.
3.1 Auto-correlation Model for Shadow Fading
The auto-correlation of shadow fading indicates the correlation among the shadowing effects among the same radio link in different locations, which is illustrated in Figure 2.
Fig.2 Auto-correlation of shadow fading
A popular model proposed by Gudmundson [7] is well understood in following form [2]:
| | ln 2( ) cor
xdx eρ
−
= (13)
where ρ is the correlation coefficient and Δx is the distance between adjacent observation locations. dcor is the de-correlation distance, which was suggested as 20m in vehicular test environment in [2].
The way to apply this model in system level simulation is briefly described as follows:
Consider the log-normal shadow fading model with zero mean and variance σ2 in dB. If L1 is the log-normal component at position P1 and L2 is the one for P2, which is Δx away from P1. Then L2 will be normally distributed in dB with mean ρ(Δx)·L1 and variance ( 1-[ρ(Δx)]2 ) · σ2.
This result can be derived through the analysis in Appendix A [8].
2006-07-01 IEEE C802.16j-06/045
Page 8 of 15
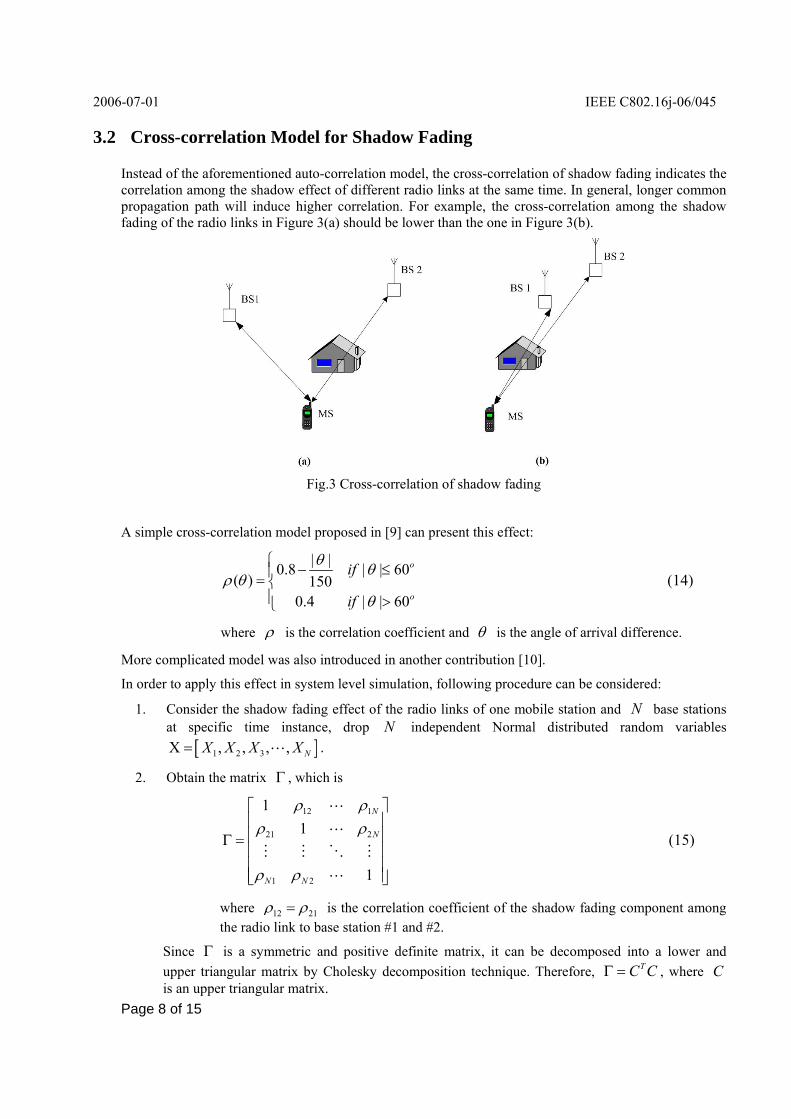
3.2 Cross-correlation Model for Shadow Fading
Instead of the aforementioned auto-correlation model, the cross-correlation of shadow fading indicates the correlation among the shadow effect of different radio links at the same time. In general, longer common propagation path will induce higher correlation. For example, the cross-correlation among the shadow fading of the radio links in Figure 3(a) should be lower than the one in Figure 3(b).
Fig.3 Cross-correlation of shadow fading
A simple cross-correlation model proposed in [9] can present this effect:
| |0.8 | | 60( ) 150
0.4 | | 60
o
o
if
if
θ θρ θ
θ
⎧ − ≤⎪= ⎨⎪ >⎩
(14)
where ρ is the correlation coefficient and θ is the angle of arrival difference.
More complicated model was also introduced in another contribution [10].
In order to apply this effect in system level simulation, following procedure can be considered:
1. Consider the shadow fading effect of the radio links of one mobile station and N base stations at specific time instance, drop N independent Normal distributed random variables
[ ]1 2 3, , , , NX X X XΧ = .
2. Obtain the matrix Γ , which is
12 1
21 2
1 2
11
1
N
N
N N
ρ ρρ ρ
ρ ρ
⎡ ⎤⎢ ⎥⎢ ⎥Γ =⎢ ⎥⎢ ⎥⎢ ⎥⎣ ⎦
(15)
where 12 21ρ ρ= is the correlation coefficient of the shadow fading component among the radio link to base station #1 and #2.
Since Γ is a symmetric and positive definite matrix, it can be decomposed into a lower and upper triangular matrix by Cholesky decomposition technique. Therefore, TC CΓ = , where C is an upper triangular matrix.

2006-07-01 IEEE C802.16j-06/045
Page 9 of 15
3. [ ]1 2 3, , , , NY XC Y Y Y Y= = will be the cross-correlated log-normal shadow fading components for each radio link.
4 Comparison Results
4.1 Comparison on Path-loss Models
In this section, the aforementioned path-loss models are compared in following figures. The corresponding system parameters are:
Carrier frequency: 3.5GHz
Base station antenna height: 30m
Average rooftop height: 15m
Mobile station antenna height: 2m
Number of floors in the path for ITU indoor model: 0
Fig.4 Comparison on IEEE 802.16 path-loss models

2006-07-01 IEEE C802.16j-06/045
Page 10 of 15
Fig.5 Comparison on ITU path-loss models
Fig.6 Comparison on WINNER path-loss models

2006-07-01 IEEE C802.16j-06/045
Page 11 of 15
Fig.7 Joint comparison on 802.16, ITU and WINNER path-loss models
Fig.8 Joint comparison on ITU and WINNER path-loss models

2006-07-01 IEEE C802.16j-06/045
Page 12 of 15
4.2 Comparison on Shadow Fading Models
Scenario Environment Standard Deviation of Log-normal Shadow Fading [dB]
IEEE 802.16 Type A 10.6
IEEE 802.16 Type B 9.6
IEEE 802.16 Type C
Sub-urban macro cell
8.2
ITU Indoor Indoor small office 12
ITU Pedestrian Urban macro cell 10
ITU Pedestrian - Manhattan Urban micro cell – Manhattan layout 10
ITU Vehicular Sub-urban macro cell 10
WINNER B1 LOS Urban micro cell 2.3
WINNER B1 NLOS Urban micro cell – Manhattan layout 3.1
WINNER B5a LOS fixed station (rooftop to rooftop) 3.4
WINNER C2 Urban macro cell 8
Informative Notes:
The log-normal fading effect for WINNER B1 NLOS scenario comes from the tunneling effect, and part of the shadowing effect by building has already been incorporated into the path-loss model.
The log-normal fading effect for LOS scenario represents the different level of first Fresnel zone clearance. The break distance of the first Fresnel zone is dB=4·ht·hr/λ, where ht is transmit antenna height, hr is the receive antenna height and λ is the propagation wavelength.

2006-07-01 IEEE C802.16j-06/045
Page 13 of 15
5 Summary
According to aforementioned comparison results, following comments are concluded for C802.16j_06/040 [11]:
1. In order to specify appropriate path-loss and shadow fading models for performance evaluation, we would like to propose following table to be included into C802.16j_06/040:
Category Propagation Environment
Description Proposed Model Applicability Range
Std. of Log- normal Shadow
Fading [dB]
Type A Hilly terrain with moderate-to-heavy tree densities
Existing IEEE 802.16 Type A model
10.6
Type B Intermediate path-loss condition
Existing IEEE 802.16 Type B model
9.6
Type C
Sub-urban macro cell
Flat terrain with light tree densities
Existing IEEE 802.16 Type C model
100m < d < 8km
8.2
Type D LOS fixed stations
Both Tx & Rx antennas are above rooftop
WINNER B5a model
30m< d <8km 3.4
Type E Urban macro cell
Tx antenna is above rooftop but Rx antenna is below rooftop (vice versa)
WINNER C2 model
50m< d < 5km 8
WINNER B1 LOS model
10m< d < 650m 2.3 Type F Urban micro cell
Both Tx & Rx antennas are below rooftop
WINNER B1 NLOS model
10m < d1 <550m
15m< d2 < 450m 3.1
Type G Indoor Indoor small office ITU Indoor model
Indoor range 12
Informative Note:
I. The carrier frequency from 450MHz to 11.2GHz will be valid by applying the frequency correction term of each model.
II. The frequency correction term in Equation 2 is proposed to be applied for Type G path-loss model.
III. For multi-hop relay system, each hop may apply different channel model. For example:
i. Type D model may be appropriate for BS↔RS LOS link, RS↔RS LOS link.
ii. Type E model may be appropriate for BS↔RS NLOS link, RS↔RS NLOS link, BS↔MS NLOS link and RS↔MS NLOS link.
iii. Type F model may be appropriate for RS↔MS LOS link and RS↔MS NLOS link.
The propagation models for each hop should be specified when simulating multi-hop relay systems. More detail description on each propagation scenario can refer to [12].

2006-07-01 IEEE C802.16j-06/045
Page 14 of 15
2. In order to specify the appropriate correlation model for shadow fading, we would like to propose following text to be included into C802.16j_06/040:
“The auto-correlation model for shadow fading is given as:
| | ln 2( ) cor
xdx eρ
−
=
where ρ is the correlation coefficient and Δx is the distance between adjacent observation locations. dcor is the de-correlation distance, which was suggested to be 20m. The way to apply this correlation model can refer to C802.16j-06/045.”
6 References
[1] IEEE 802.16a-03/01, “Channel Models for Fixed Wireless Applications”.
[2] ETSI TR 101.112 v3.2.0, “Selection procedures for the choice of radio transmission technologies of the UMTS”, April 1998.
[3] IST-2003-507581 WINNER D5.4 v1.4, “Final Report on Link Level and System Level Channel Models”, November 2005. https://www.ist-winner.org/
[4] V. Erceg, L. J. Greenstein, S. Y. Tjandra, S. R. Parkoff, A. Gupta, B. Kulic, A. A. Julius and R. Bianchi, “An Empirically Based Path Loss Model for Wireless Channels in Suburban Environments,” IEEE Journal on Selected Areas in Communications, pp.1205-1211, Vol.17, NO.7, July 1999.
[5] J-E Berg, “A Recursive Method for Street Microcell Path Loss Calculations,” IEEE International Symposium on Personal, Indoor and Mobile Radio Communications, pp.140-143, Vol.1, September 1995.
[6] IEEE C80216mmr-06/003, “On the Throughput Enhancement of Fixed Relay Concept in Manhattan-like Urban Environments,”
[7] Gudmundson, M., “Correlation Model for Shadow Fading in Mobile Radio Systems,” Electronics Letters, pp.2145-2146, vol. 27, No 23, November 1991.
[8] I-Kang Fu, “A Dynamic Simulation Platform for Heterogeneous Multiple Access Systems,” Master Thesis, Department of Electrical Engineering, National Chung Cheng University, Taiwan, R.O.C., July 2002.
[9] T. Klingenbrunn and P. Mogensen, “Modeling Cross-Correlated Shadowing in Network Simulations,” IEEE Vehicular Technology Conference, pp.1407-1411, Vol.3, September 1999.
[10] IEEE C802.16j-06/009, “Correlated Lognormal Shadowing Model”,
[11] IEEE C802.16j-06/040, “Multi-hop System Evaluation Methodology (Channel Model and Performance Metric),”
[12] IEEE C802.16j-06/020, “Channel Models and Performance Metrics for IEEE 802.16j Relay Task Group,”

2006-07-01 IEEE C802.16j-06/045
Page 15 of 15
Appendix A
Consider X and Y are both Normal distributed random variables. Given Y = y and the correlation coefficient as ρ, the probability distribution function fX ( x | y ) can be derived as:
2 21 2 1 2
,
22 21 1 2 2 2
,2 2, 1 1 2 2 2
2221 2 ,
Consider , and , are the mean and variance of and ( , )
( | )( )
1 ( )exp ( ) 2 ( )( ) ( ) exp2(1 ) 2
22 1
X YX
Y
X YX Y
X Y
m m X Yf x y
f x yf y
x m x m y m y m y m
σ σ
ρρ σ σ σ σ σ
πσπσ σ ρ
=
⎧ ⎫⎡ ⎤ ⎡− − − − −⎪ ⎪ ⎧ ⎫−− + −⎨ ⎬ ⎨ ⎬⎢ ⎥ ⎢−⎪ ⎪⎣ ⎦⎩ ⎭ ⎩ ⎭=−
⎣
1
2 2 2 21 1 2 2 2, ,22 2
, 1 1 2 2 21 ,
2
1 2,22 2
, 1 21 ,
2 21 ,
1 1exp ( ) 2 ( )( ) ( ) (1 )( )2(1 )2 (1 )
1 1exp2(1 )2 (1 )
12 (1
X Y X YX YX Y
X YX YX Y
X Y
x m x m y m y m y m
x m y m
ρ ρρ σ σ σ σ σπσ ρ
ρρ σ σπσ ρ
π σ ρ
−⎤⎥
⎢ ⎥⎢ ⎥⎢ ⎥⎢ ⎥⎦
⎧ ⎫⎡ ⎤− − − − − −⎪ ⎪= − + − −⎨ ⎬⎢ ⎥−− ⎪ ⎪⎣ ⎦⎩ ⎭
⎧ ⎫⎛ ⎞− − −⎪ ⎪= −⎨ ⎬⎜ ⎟−− ⎝ ⎠⎪ ⎪⎩ ⎭
=−
( )
( )
11 , 2
22 21 ,
2 211 , 2 1 ,
2
exp2 (1 ))
the mean of ( | ) is and variance is (1 )
X Y
X Y
X X Y X Y
x m y m
f x y m y m
σρσ
σ ρ
σρ σ ρσ
⎛ ⎞⎡ ⎤− − −⎜ ⎟⎢ ⎥
⎣ ⎦⎜ ⎟−⎜ ⎟−⎜ ⎟⎜ ⎟⎝ ⎠
∴ + − −
If X and Y are both with zero mean and variance σ2, and the correlation coefficient between X and Y are equal to ρ. Then, the mean of fX ( x | y ) will beρ·y and its variance will beσ2·(1-ρ2).