Embed Size (px)
Citation preview
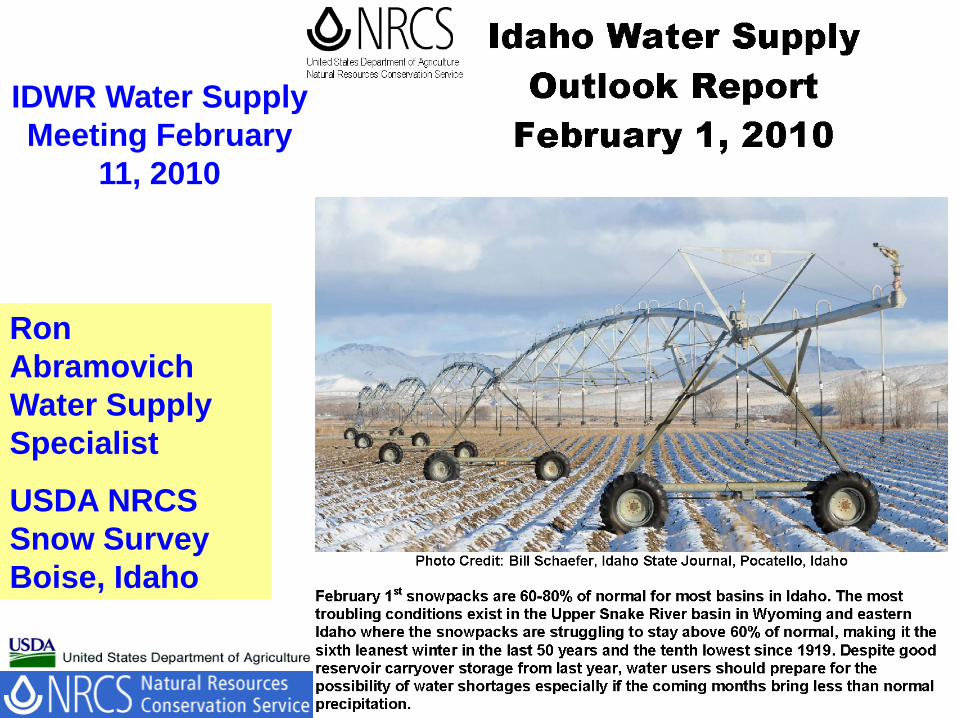
IDWR Water Supply Meeting February
11, 2010
Ron Abramovich Water Supply Specialist
USDA NRCS Snow Survey Boise, Idaho

Spring and Summer Streamflow Forecasts as of February 1, 2010
Legend
percent
- >180
- 150-180
- 130 - 149
- 110 - 1 29
- 90-109
70-89
- 50-69
- 25-49
- <25
Prepared by USDA, Natural Resources Conservation Service National Water a nd C limate Center Portland, Oregon http://www.wcc.nrcs.usda.gov
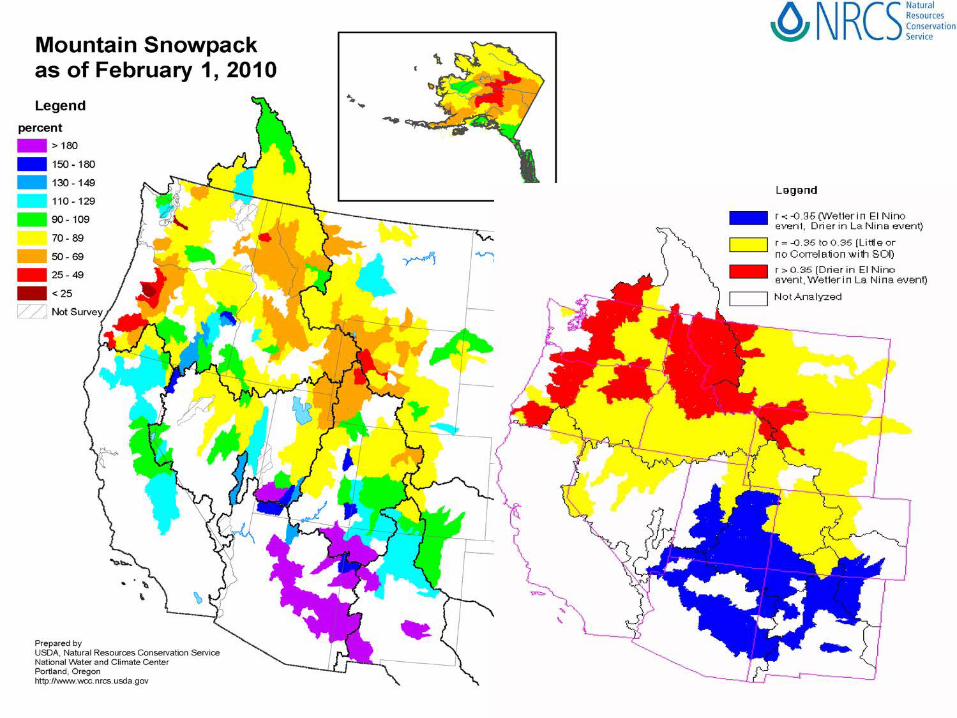
Mountain Snowpack as of February 1, 2010
Legend
percent
- >180
- 150 -180
- 130 - 149
- 110-129
- 90-109
70- 89
- 50 -69 - 25 - 49
- <25
Prepared by USDA, Natural Res National water and ~(:~,;'~~~~;ation Service Por~and, O regon http://www.wcc.nrcs.usda.gov
....
'
0 NRCSNatural Resources
~ ~~~~~~vation
Legend
- ~ < -0.35 (YYet1er in 1:1 N ino ven t, Oner in L a N ina event)
~ r = -0.35 to 0 .35 (Li l1le or no CorTela1ion w ith SOI)
- r > 0 .35 [Drier in El Nino event,Wet1er ln La Nina event)
Not Analyzed

2010 Mountain Snowpack Change between January 1 and February 1
Legend Percent Change
- >30
- 16to30
6 to 15
No Change
-15 to -6
-30 to -16
- < -30
P repared by USDA, Natural Resources Conservation Service National Water and C limate Center Portland, O regon http://www. wcc.n res. usda.gov
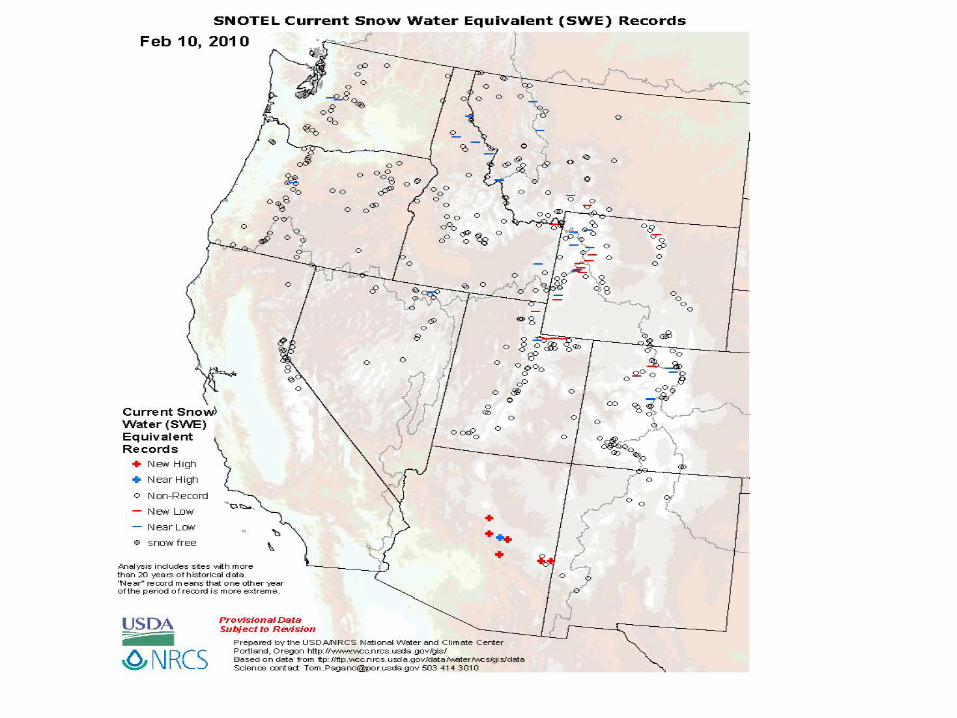
SNOTEL Current Snow Water Equivalent (SWE) Records
Feb 1 0, 201 O L
Current Snow> Water (SWE) Equivalent Records
+ New High
+ Near High
0 Non-Record
New l.Dw
Near Low
0 snow free
0
Oo
o o,s,
0
· ~t::,,..
+ ..... +
.Analysis ind udes sites 'l.t\41 h m or e than 2 0 years of historica l data . 'N ear" record mea ns that one other year of the per iod of record is m o re extreme.
USDA ~
'°' NRCS
Provisional Data Subject to Revision
Prepared by the USDAA\IR CS Nation al Water and Climate Center Portland, Oregon http:l/www.Vt1C;c .nrcs.usda .govlg is/ Based on data from ftp: //ftp .VI.Cc.n res. usd a .gov/data f\n.eter/Vt.cslgi sldata Sc ience cont act: To m [email protected] sda.gov 503 414 3010
0
0 <12> 0
08 ~ o
6> 0
0
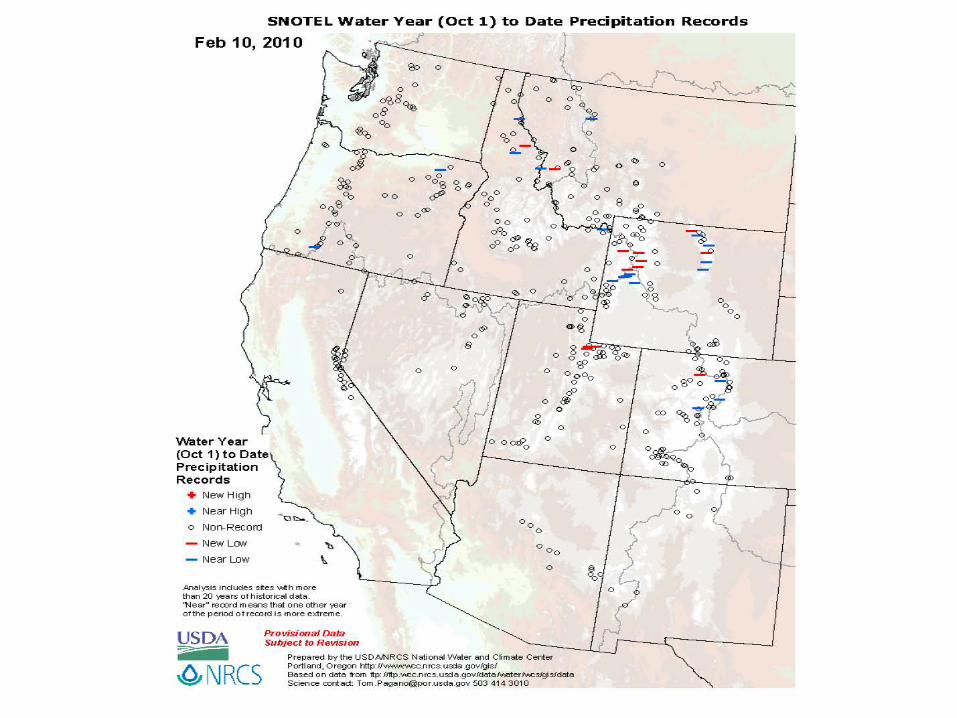
Water Year (Oct 1) to Date Pree ip itation Records
+ New H igh
+ Near High
o Non-Record
- New Low
- Near Low
.Anal ysis indudes sites wth m ore th a n 20 years o1 h istorica l data . "Near•• record m ea n s t hat o ne oth er year o f th e p e riod of reoo rd i s more extreme.
0
USDA ~
Provisional Data Subject to Revision
_ o o O 0
013
Oo ,sfo'
o o<S>
0
0 0
0 0 0
000
0
'°' NRCS Prepa red by th e US DAIN RCS National Water an d C limate C enter Portland, 0 regon http: l/vwvw.v-.cc.nrcs. usda .gov /gis / Based o n data from ttp: /Jttp.V1.Cc.nrcs.u&:la.gov /d ata f.Aeterl\i\cs/gisld-ata Scien ce oontad : Tom .Pag-ano @por.usd a .g ov 503 414 301 0
0 <12> 0
e
8 @o
~-~
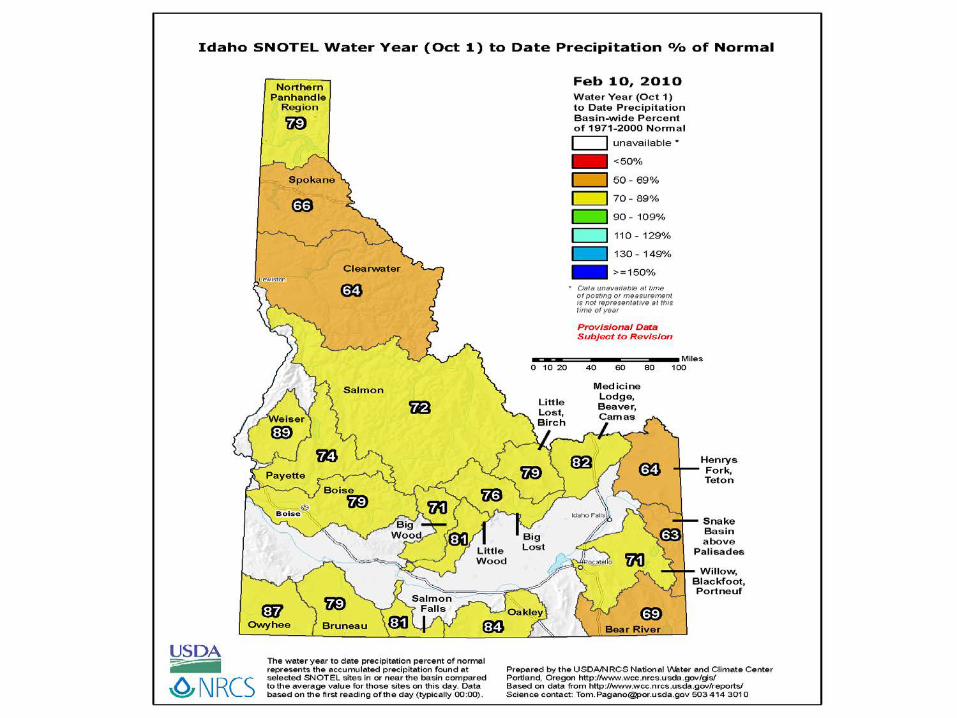
Idaho SNOTEL Water Year (Oct 1) to Date Precipitation °/o of Normal
Northern Panhandle
Region
€fl Owyhee
USDA ~
~NRCS The water year to date precipitation percent of normal represents the accumulated precipitation found at selected SN OT EL sites in or near the basin compared to the average value for those sites on this day. Data based on th e first reading of the day (typically 00:00) .
Feb 10, 2010 W ater Year (Oct 1) t o Date Precipitation Basin-w ide P e rcent of 1971-2000 Normal
c::::::::J unavailable*
- <50 %
c::::::::J 50 - 69%
c::::::::J 70 - 89%
c::::::::J 90 - 109'Vo
c::::::::J 11 0 - 1 29%
- 130- 149%
- >=150% Oate unev9il9bte et lime of posrmg or measurBl'n6nt >snot represenrstive ar this t ime ofyeor
Provlslonal Data Subject to Revision
---===----===:::::1--•M iles 0 10 20 40 60 80
~/ Bear River
100
He nrys F o rk, Teton
Snake Basin above
Palisades
Prepared by the USDAINRCS National 1/11!,.ter and Climate Center Portland, Oregon http://www.wcc.nrcs.usda.gov/gisl Based on data from http://www.wcc.nrcs.usda.gov/reports/ Science contact: Tom.Pagano@!por.usda.gov 503 414 301 O
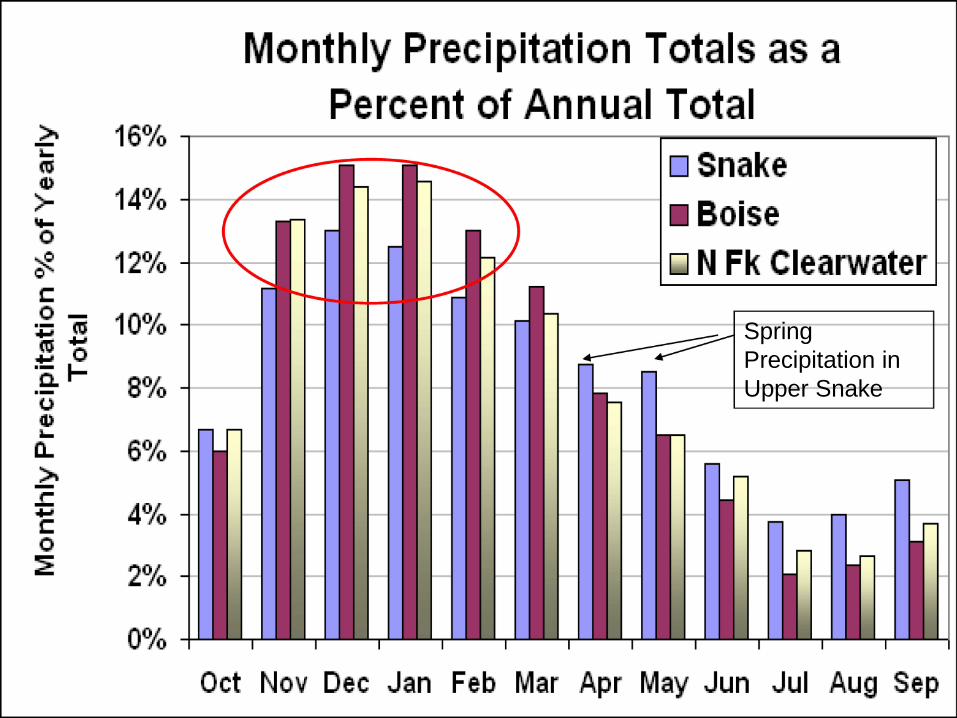
Spring Precipitation in Upper Snake
~ -:I.. m d)
>-""-0 '
~ 0
C 0 -·- tci ~ (Ill
...., 0 ...., ' ·- I-a. ·-u
d) :I..
D.. ~ -r:--...., C 0 :E
16o/o
14o/o
12o/o
10°A " ·.o
8% 0
6°/o
4% '·O
2°A 0
00/ / 0
-
Monthly Precipitation Totals as a Percent of Annual Total
o Snake 11 Boise
N Fk Clearwater
Oct Nov Dec Jan Feb Mar Apr May Jun Jul Aug Sep
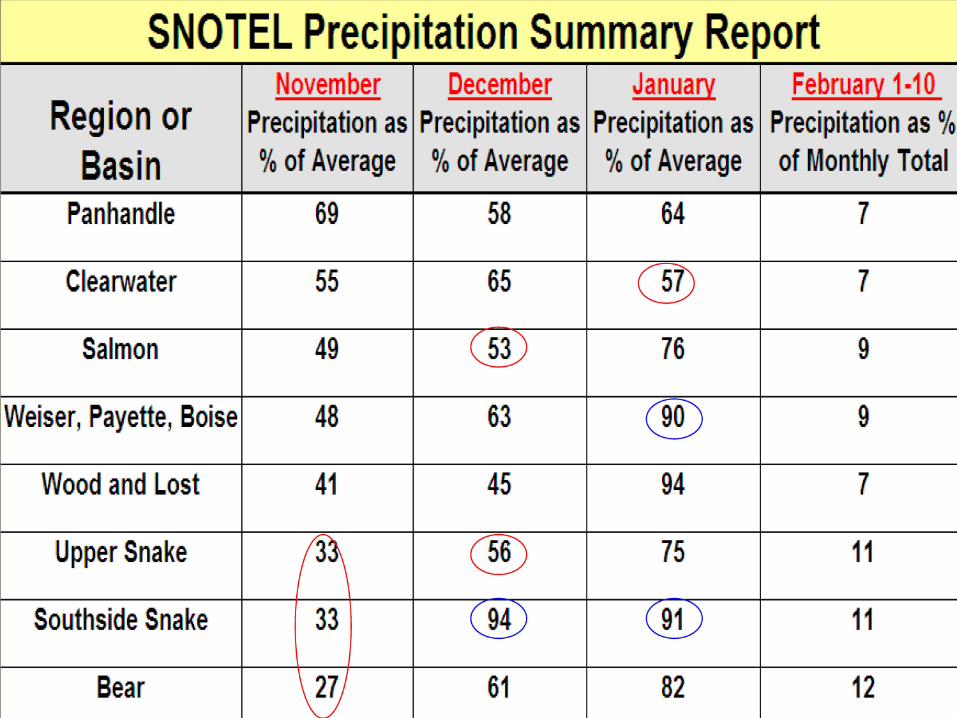
SNOTEL Precipitation Summary Report November December January February 1-10
Region or Precipitation as Precipitation as Precipitation as Precipitation as 0/o
Basin 0/o of Average 0/o of Average % of Average of Monthly Total
Panhandle 69 58 64 7
Clearwater 55 65 ® 7
Salmon 49 ~ 76 9
Weiser, Pay·ette Boise 48 63 ® 9
Wood and Lost 4'1 45 94 7
Upper Snak.e 3, . ® 75 11
Southside Snalke 33 C!D C!0 11
Bear \2V 6'1 82 12
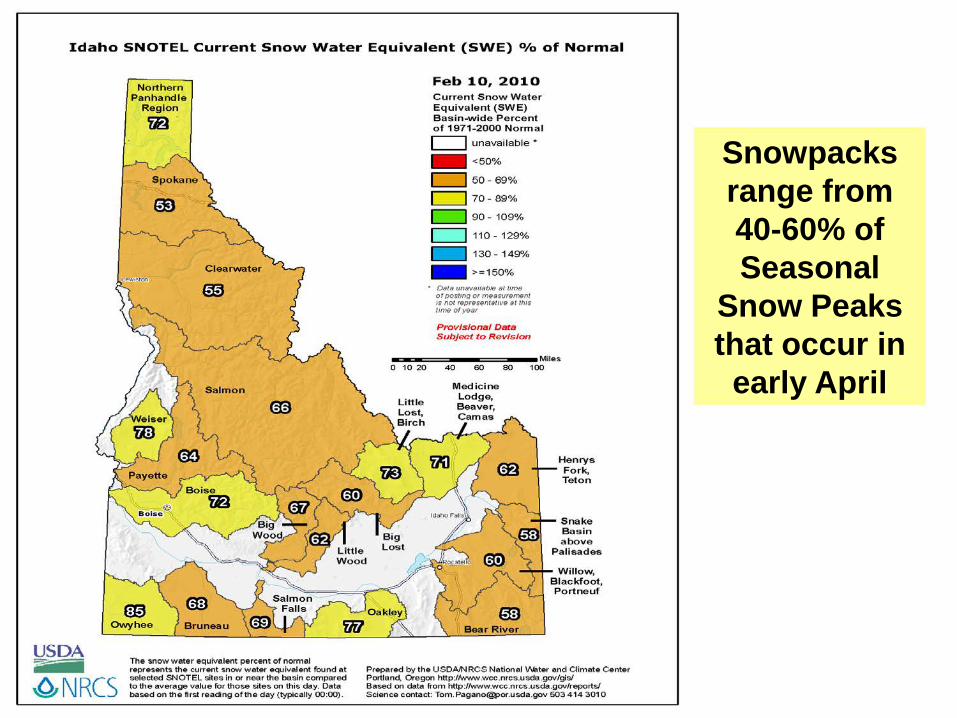
Snowpacks range from 40-60% of Seasonal
Snow Peaks that occur in
early April
Idaho SNOTEL Current Snow Water Equivalent (SWE) 0/o of Normal
Northern Panhandle
Region
'cB
(m3 Owyhee
USDA ~
~ NRCS The snow water equivalent percent of nomial represents the current snow water equ ivalent found at selected SN OT EL sites in or near the basin compared to the average value for those sites on this day. Data based on th e first reading of th e day (typically 00:00).
Feb 10, 2010 C urre n t S now Wat e r E q uivale nt (SW E) Bas in-w ide Pe rce nt of 197 1-2000 Norm al
(=i unavailable *
- <50%
(=i 50-69%
c::::J 70 - 89%
c::::J 90 - 109%
(=i 110 - 129%
- 130-149%
- >=150% 0819 u,,svsilsb/6 a£ ume 01 posrmg or messuremem ,snot represenuwve st th,s limo of yoor
Provisional Data Subject to Revision
---===---c::=::::11--• Miles 0 10 20 40 60 80 100
H enrys Fo rk, Tet o n
S nak e Bas in a bove
Palisades
Prepared by the U SOA/NRCS National 11\A>ter and Climate Center Portland, O regon http :/,www.wcc.nrcs.usda.gov/gisf Based on data from http://www.wcc.nrcs.usda.gov/reports/ Science contact: [email protected] 503 414 301 O

Idaho Snowpack February 1, 2010
Snowpack Lowest Year I Percent Record Percent of
River or Basin of Average Rank Starts Average
Spokane 53o/o 5th Lowest 1961 1977 / 34%
Clearwater 55% 6th Lowest 1961 1977 / 37%
Salmon 66% 6th Lowest 1981 2001 / 54%
Payette 64% 10th Lowest 1961 1978 / 13%
Big Wood 67% 11th Lowest 1961 1977 / 15%
Little Wood 62% 11th Lowest 1961 1977 / 16%
Big Lost 60% 10th Lowest 1961 1978 / 9%
Henrys Fork/Teton 62% 7th Lowest 1961 1977 / 33%
Snake above Palisades 58% 5th Lowest 1961 1977 / 33%
Willow/Blkft/Portneuf 60% 7th Lowest 1961 1977 / 21%
American Falls 59% 6th Lowest 1961 1977 / 32%
Bear River 58% 9th Lowest 1975 1977 / 24%
K
+
'°' NRCS
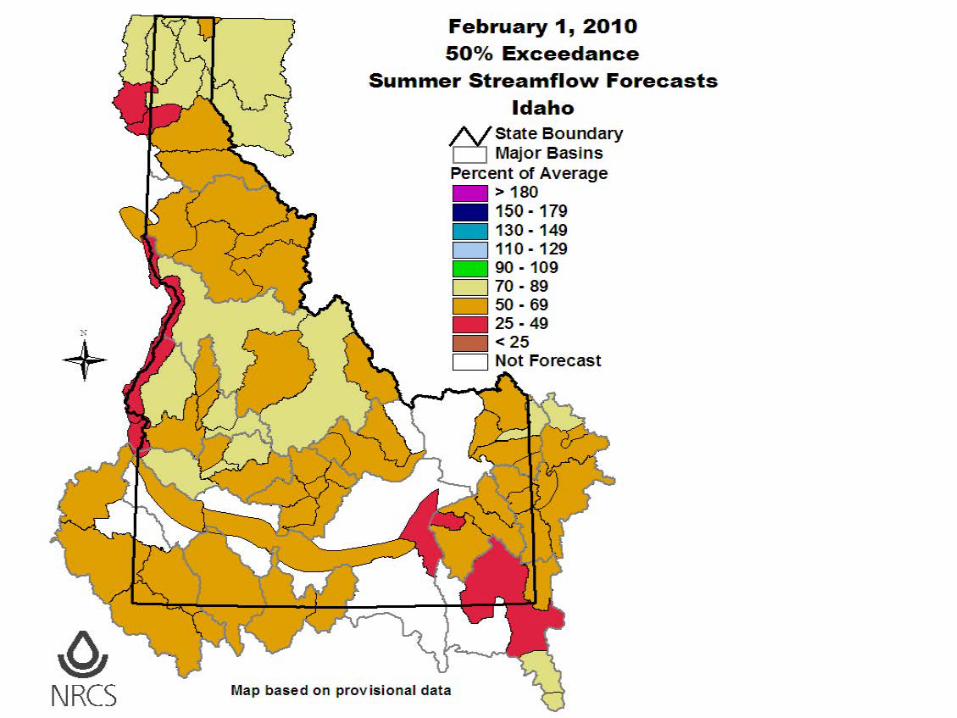
February 1 , 2010 50°/o Exceedance
Summer Streamflow Forecasts Idaho
/\/ State Boundary ·o Major Basins Percent of Average - > 180
Map base d on prov isi onal data
- 150 - 179 - 130 - 149 D 110 - 129 D 90 - 109 D 70 - 89 D 50 - 69 - 25 - 49 - <25 D Not Forecast
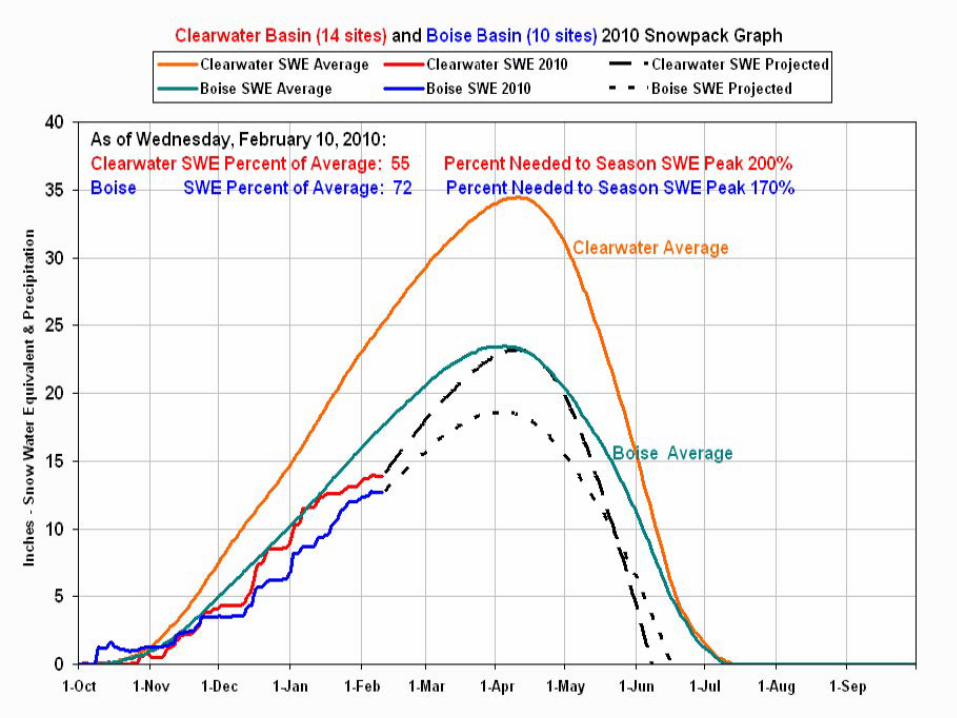
Clearwater Basin (14 sites) and Boise Basin (10 sites) 2010 Snowpack Graph
--Clemw,lter SWE Avernge --Clemwlller SWE 2010
--Boise SWE Avernge --Boise SWE 2010
As of W.ednesd~y, Febru ry 10, 2 10: Clearw ter SW~ Percent of Avera , e: 55
- • Clemwlller SWE Projected
• • · Boise SWE Prnjected
35 - Boise SWE!-~ercer-it of-Ave.ra -e.;-72
C: 0
·s 30 .t::
"'" ·.:; .. ~
~ 25
gi 10 '5 ..:
1-Nov 1-Dec 1..Jan
-... ..
1-Feb 1-Mm 1-A11r
\ \ "'
\ \ ' \
' ,,_ ' \'
1-May 1..Jun 1..Jul 1-Aug 1.se1>
42 ,n 40 G.) 38 .c u 36 C 34 -C 32 ·-..-. 30 w ;t 28 (/J 26 ....... .... 24 G.)
C 22 cu - 20 > ·-:J 18 O" 16 G.)
w 14 I.. G.) 12 ..., cu 10 := 8 t 6 0 C 4 (/J
2 0
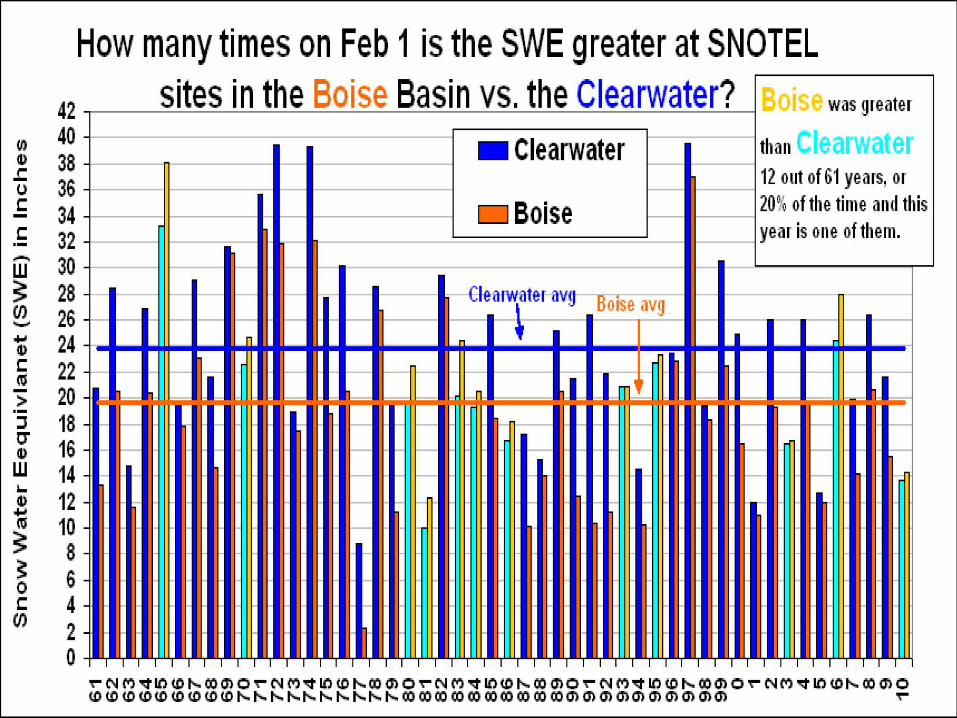
How many times on Feb 1 is the SWE greater at SNOTEL .----------,
sites in the Boise Basin vs. the Clearwater? Bai was greater ------------- ------- -
- - -- - ----- -- - -- - -- - - - - -. ,- - - - - - . - ,-
- -
- -- -
- ,- . ,- ,-
----- l
• Clearwater --
o Boise --
Cl e11 iwate r-avg ~i Boise avg
- - -
than I arwater 12 out of 61 years, or 20% of the time and this year is one of them.
----- - ,-
- . - ,-
- - -
I I I I I I I I I I I I I I I I I I I I I I I I I I I I I I I I I I I I I I I I I I I I I I I I I
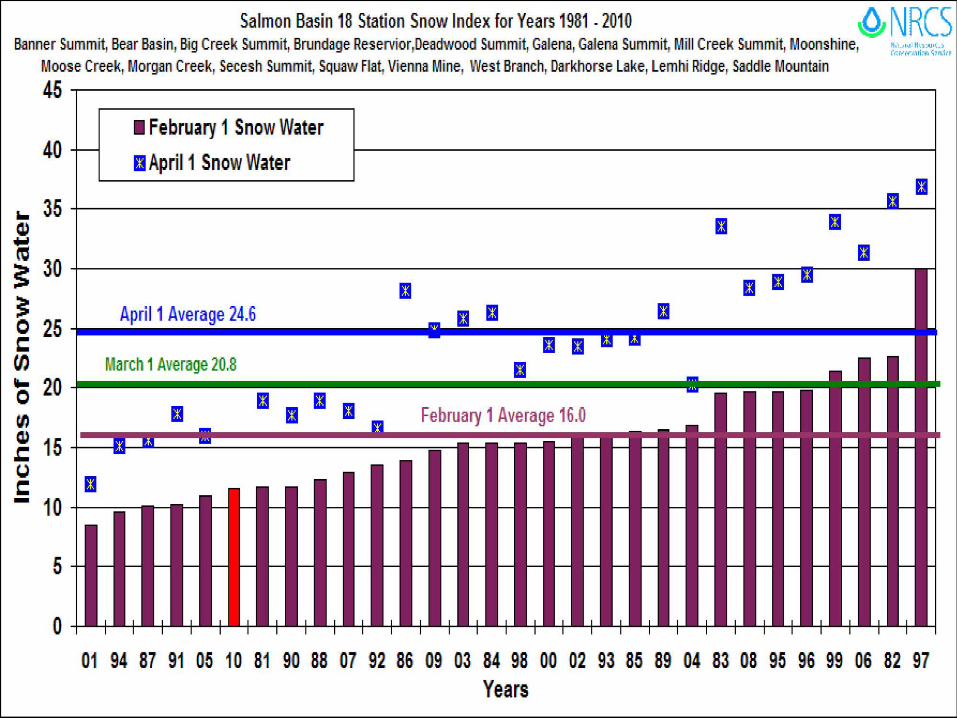
Salmon Basin 18: Station Snow Index for Years 1981 -2010 '°1 NR(S Banner Summit, Bear Basin, Big1 Creek Summit, Brundag:e Reservior,Deadwood Summit, Galena, Galena Summit, Mill Creek Summit, Moonshine, "·'·'" "'"''''·'
' (r.r,,/f"A,~ :V, ~,llfiP
... G,)
,; ~ ~ 0 C: VJ II-0 rn G,)
.c: (.)
C: -
Moose Creek, Morgan Cr,eekr Seoesh Summit.r Sq,uaw Flat, Vienna Mine1 West Branch, Darkhorse Lak,e, Lemhi Ridge,, Saddle Mountain
45
40
35
30
25
20
15
10
5
0
I Febru.ary 1 Snow Water --
II April 1 Snow Water
n II
II II II
-II II II II
April 1 Average 24.·6 II II II • II II II II
Maron 1 Average 2~.8 II --.. .. •• II
II II
II II February 1 Average 16.0 n • - - --.. - ------ •• n ll!I - - ,..._ ,..._ - - ,..._ - - ,..._ - - ,..._ ,..._ - ,..._ ,..._ --II
,..._ - ,..._ ,..._ - - ,..._ ,..._ - ,..._ ,..._ - ,..._ ,..._ - - ,..._ - - ,..._ - - ,..._ ,..._ - ,..._ ,..._ -
-- - - ,..._ - ,..._ ,..._ - - ,..._ ,..._ - ,..._ ,..._ - ,..._ ,..._ - - ,..._ - - ,..._ - - ,..._ ,..._ - ,..._ ,..._ -
-- + + Lf- + Lf- Lf- + + Lf- + + Lf- Lf- + Lf- Lf- + + Lf- ++ Lf- + +Lt Lf- + Lf- Lf- -
Di1 94 87 91 05, 10 S.1 90 BB 07 92 86 D9 03 .94 98 00 02 93, 85 89 04 83 08 95 96 99 06 82 917 Years
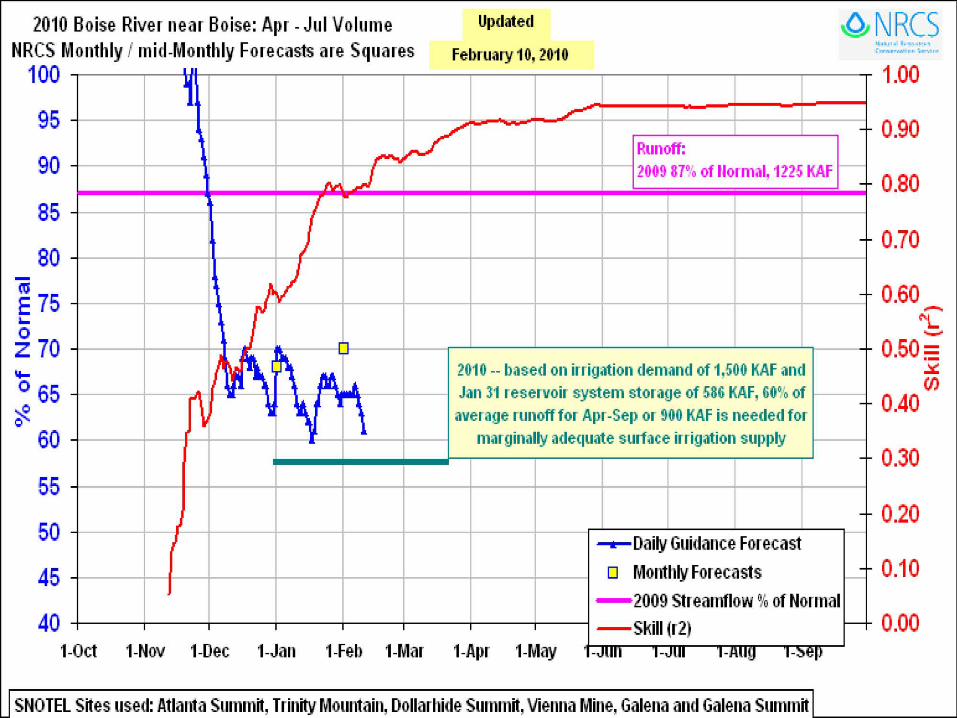
2010 Boise River near Boise: Apr -Jul Volume NRCS r~ onthly I mid-Monthly Forecasts are s,~trnres
U1>dated
February 1 O, 2010 ~ NRCS
.. . , , • • • , 1 , , ....... .... I "; ......
100 -,-----,-- ,-ft-•r---, -----.----,--------,-1 ----,--I --I-----,------.---~ 1.00
I -- I
-- 1 Runoff: 1 2009 87° o of tlormal~ 12:?5 KAF -
______ .....__ ....... ......-"-'IICii .............. ---....... - ........ ....iiiiiiiiiiiiiiiiiiiiiiiiiiiiiiiiiiiiiiiiiiiiiiiiiiiiiiiiiiiiiiiiiii.-l--- 0 .80
95 - y-90 - n I
"" .L -85 -
: .. 0.90
80 -'i JI J
--- 0.70
--- 0.60 ,.-., E 75 - ~ ~ 70 ---.--- - ---='" J1 - D
('\L
1;J; M 2010 -- based on irrigation demand of 1,500 KAF and II,.
0 65 -i average runoff for A1n -Se1> or 900 KAF is needed for
._. -·-- 0.50:
- ___ 0.40 .::.:: 00 ---+-~r..J ... !1\ --- ·~· - ~n-·.....A-,l----· Jan 31 reservoir system storage of 586 KAF I 60°~ of
• marginally ade<1uate surface irrigation su1>1>ly 60 ---- -0.30
55 -
50 -
45 -
40 1-Oct
I I I I I I I
.._.... Daily Guidance Forecast
D Monthly Forecasts
- 2009 streamflow % of Normal - Skill (r2)
1-Nov 1-Dec 1-Jan 1-Feb 1-Mar 1-A1n 1-May -Jm 1 ·1-Jm ·1-Aug ·1-::,eJJ
---
--- 0.20
--- 0.10 -
--- 0.00
SNOTEL Sites used: Atlanta Summit, Trinity rij1ountain, Dollarhide Summit, Vienna Mine, Galena and Galena Summit~----~
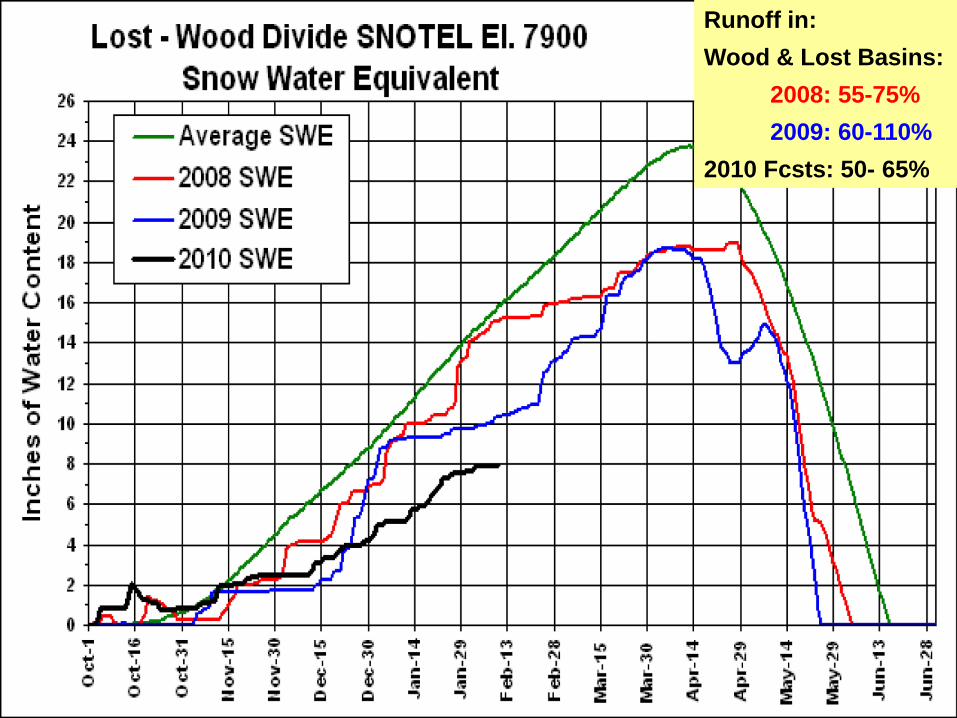
Runoff in:Wood & Lost Basins:
2008: 55-75%2009: 60-110%
2010 Fcsts: 50- 65%
Lost • Wood Divide SNOTEL El. 7900
26 Snow Water Equivalent
24 Average SWE - /' 2008 SWE _./ 22 - / - 1\- ,--
...., 2009 SWE C 20
.,, - ~v \ (l) - -...., 2010 SWE ~ --C 18 - ,", l: ·. ' '
V r \ \ ' 0 u 16 \
# T \ A :I.. . (l) 14 --' ....,
A J V \. I,' , \ m I :.B 12 I' l,.) \ ""- /_ _,.I 0 10 I"'
~ -' ~ -U'Jj \ (l) 8 / rtf r v_rj u / - ,
\ -u .,, C 6
~V_ IJ ~,,-J .--
\ - \ 4 /- f t1
, \ ~
\ 2
~ ~ """," \ \ 0 ~
"'" ~ "'" ltli = ltli = ~ ~ M cc ltli = ~ ~ ~ ~ M cc I "'" M "'" M M ('fr, I N .... "'" "'" ('fr,I "'" "'" M "'" N "'" N "'" I I I I I I I I I I
~ ~ I I I ~ t t =- =- ~ ~
I
~ ~ ,.. ,.. .... .... ~ ~
,.. ,.. 0 0 0 - - ~ ~ I I
.... .... - -I,:! I,:! - - I I - -0 0 . - -:z: :z: Q Q -.. -.. u.. u.. i( Ii,( -.. -..
1000 Acre.feel ,,
1000 Acre-Feet "Tl C1> (P
............ "'"'"' '~wwwu ~ ~ ... tr "'~~o"'m~o"'~~o"' ~ ~o c ... I',) w "'
,.,, al -.J co (D 0 .,
o~o~omo~o~omo~o~ r !a> 0 0 0 0 0 0 0 0 0 o OJ C 0 0 0 0 0 0 0 0 0 0 0 - · SI)
1971 O '< 1971 IQ ~
1/i .. ~ ... 1972 ; 1972 1973 <' !!:! 1973 g OJ lffl ~~ 1974
Q, 1a' .., r
~ ~ 1975 ti o 1975 1976
~ 1, < 0 - .. 1976 ~ 0 0 (/) 1977 ~ C 1977 - tr Q,
1978 ;u :::i. 1978 (P (/)
1979 ~ la) 1979
0 C 1/i () ~ ;'
1980 ~ C1> 1980
~ ~ s I")
1981 1981 SI) (P
1982 2. la) 19. ~ .., ... 1982
1983 ~~ 1983 I") SI)
1984 s: (/) Qo ;-
Q) C 1984 s ., 1985 () ,, 1985 SI) (/)
1986 ,:' ,, IQ C Q) - 1986 - -· "C
1987 '< 2 1987 I") "C
;u :; )> ;:o -1988 - (P '<
)> ~ CL 1988 - Q, 1/i C1> ID 1/1 ::J
1989 ll. ~ X 1989 .a (P Q,
-< 19S0 C1> ~- C < ID .a -< 1990 - Al
: 19S1 C 0 (/) ... 0 >< =· ~ : 1991 - ID -· "'"' !.> ., (/)
~ 19S2 ... . (/)
cil 1992 ., C1> • ., ~ 19$3 - IE' ., 1993 (/) :::!. Al
19S4 ~ 1994 -· ~. .._,
19S5 !.> 0 ~ 1995 :I
19$6 0 1996 ~ :; Al
19S7 ~ I I 1997 ... ID
19S8 !.> ::u (/) 1998 ., • • ... C1> ..
C1> Ill ;:o (/) 19S9 ., Ill ., 1999 C
2000 (/) C1> C1> 'ti (P r+ ., la) 2000 "O 1/1 ;
2001 C < 3
2001 '< (P SI) ,, 0 :!I - < 3 2002 ,, - · 0 2002
)>
~ : ~ -• er 0 ::!I
2003 2003 0 - · 0 )> .. )> < ~ ~
2004 O' L ,, 2004 - ID -;" )> 0 la) ., I\)
2005 < :J I 2005 " (.. "O C1>
(/) (II SI) .,
2006 C1> 2006 ~
::J ' .. ,, (/)
2007 00 2007 ID 0 ,, "O
2008
" 2008
2009 )>
~ 2009 -2010·90%
,, 2010,90% ~ - -2010-70% . r·z 2010,70% •I
2010-50% I I i,
2010-50% i Z . ~t JJ I •• I I
2010-30% H(') 2010,30% l )J 2010·10% I vi I :n . ;; L/) 2010-10%
~ ! (.I)
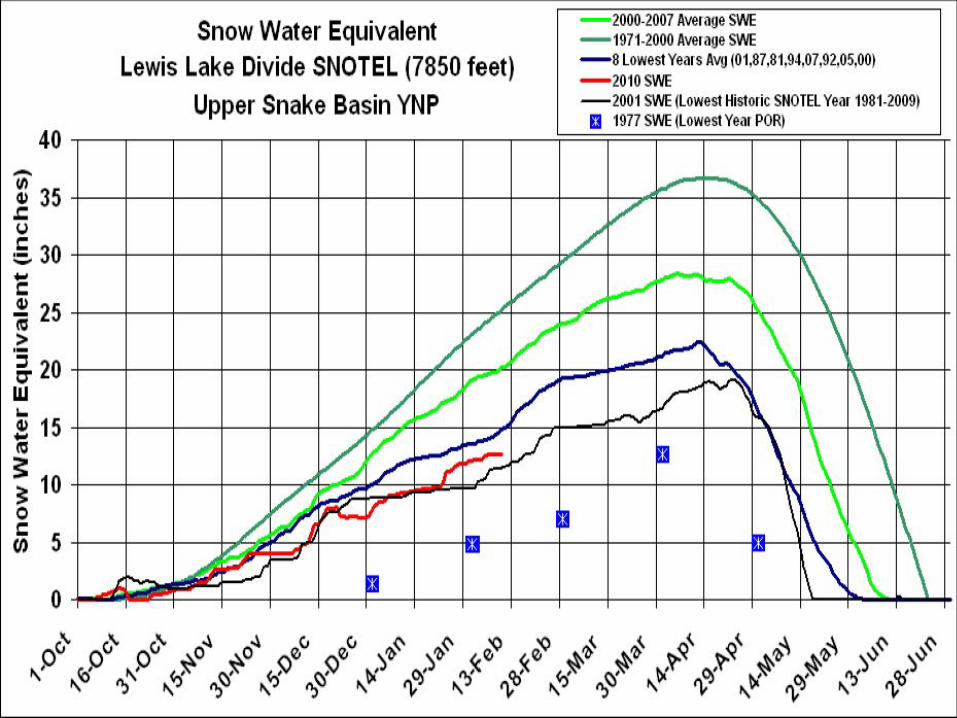
- 2000-2007 Average SWE - 1971-2000 Average SWE Snow Water Equivalent - a Lowest Yeai·s Avg (01,87,81,94,07,92,05,00) - 2010SWE - 2001 SWE (Lowest Histo1ic SNOTEL Yem 1981-2009)
Lewis Lake Divide SNOTEL (7850 feet)
Upper Snake Basin YNP El 1977 SWE (Lowest Year POR)
40~--r-~~r-~---,----,~,-----,----,~-'i===r====,=::::::::::=;===;=~====;==:::;=:::::!..
-~ 35 ~ i----t--i--t----t--+---t--+--+----+-+--1---:..4=:.._-l-~....--1--l----l--~ (J
~ 30t----t-~t----t-----t~+--+~t---+-----1~--J,.o!~ ~+----t-~l---X-----l-~_j_----l. ... C: i 25t----t~t----t~t----t~t--+~+---::,,4-~ ~ ~ ~+----l-~~ ---l----\---l----l-~~ > ·-~ 20 r-----i-~i----i-----t~-i-----i-~~ :....+:;-""1r---±:;,.+~:r:--+~ l--\l------)~-I------I-w I.,
! 15t----t--t---t--t--l--~ S!-f---+~.f---::r+--~~----+---l4----U...--~ .---!--1 ~
~1or-~-r---r-~ ~ ~ ~_,/=,r-t-t--t----t----t-+---W--\l~ H 0
~ 5 -t--t--t--i+
40
35
.. 30 Q,)
,; ~ 25 ~ 0
~ 20 ... 0 ,n a., 15 .c (J
C: - 10
5
0
_....__
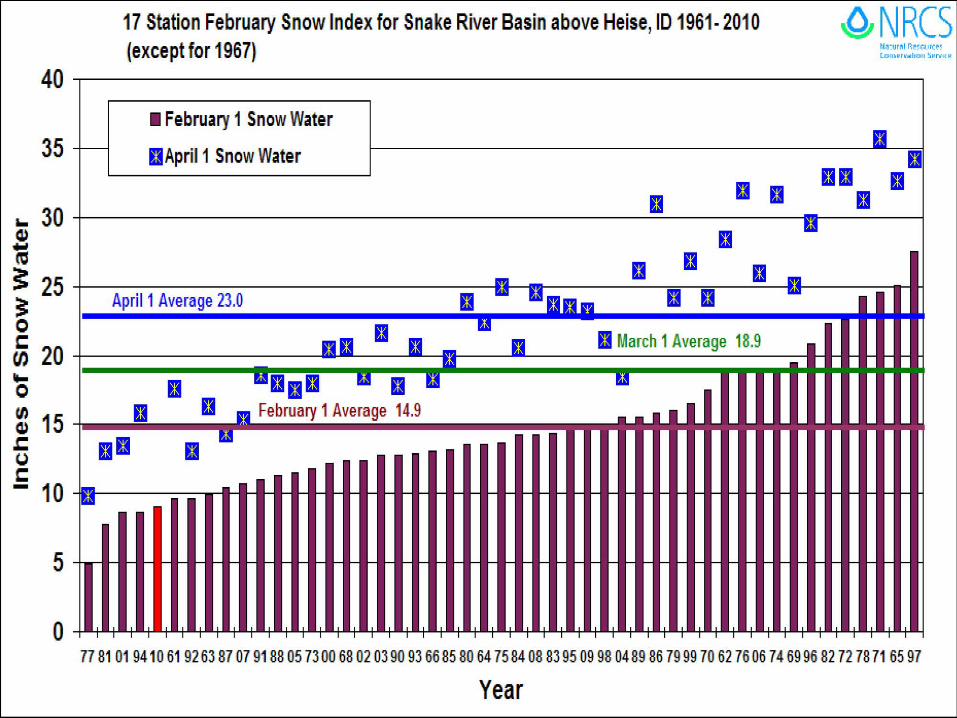
17 Station February Snow Index for Snake River Basin above Heise, ID 1961-2010 (except for 1967)
I February 1 Snow Water
I April 1 Snow Water
I I
I I I I
April 1 Average 23.0 I Dn I I
nn I II II
n I March 1 Average 18.9
I lgl I I I Februar)' 1 Average 14.9
11 I -II
I
'°' NRCS
II
t1~·11rft l llm:o.1r,:~s t.am,rn .. h QII ~HIV.ff H
.II_ I
I I
I I I I I I I I I I I I I I I I I I I I I I I I I I I I I I I I I I I I I I I I I I I I I I I I
77 81 01 94 10 61 912 63 87 07 9·1 88 05 73 00 68 02 03 90 93 66 85 80 64 75 84 08 83 95 09 98 04 89 86 79 991 70 6,2 76 06, 7 4 6,9 96 82 72 78 71 65 97
Year
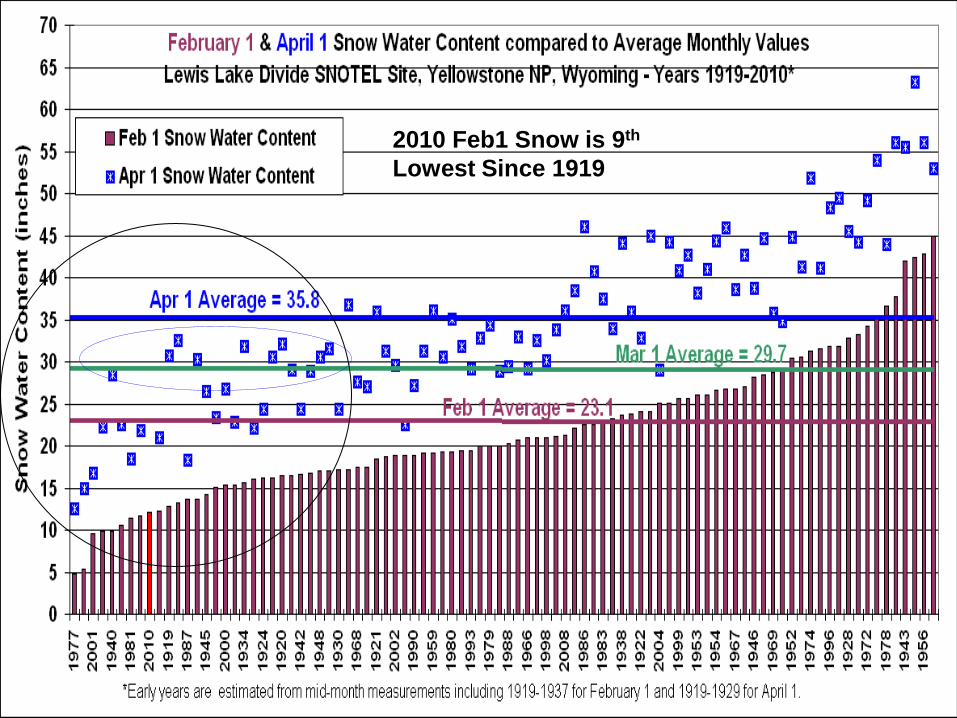
2010 Feb1 Snow is 9th
Lowest Since 1919

Upper Snake Basin H Station Snow Index and Sna~e Riv,er abov,e Heise April -September Streamflow
P,ernent of Av,erage for Y,ears 1%1 -1008:
14Qi
... ,, r-..
D~· .t • ~ I 11 • ,,,. 1 ' M • -I
• • 1} •
..
- j\pril 1 Snow Wat,er as % of Av,erage
-+- Sna~e Riv,er near Heise ~pr-Sep, Flow as % of Av,erage
~ { \
V ... ... J
/J • I \
t I ~ ,, 1
I/ ~
~I ~ I
\
'°1 NRCS
I I
!IL!!t\l~I ~~~llr<:~! tun:.HIIJHI 1: 111 !:.Hr.-i-: H
t J \
'
I I I I I I I I I I I I I I I I I I I I I I I I I I I I I I I I I I I I I I I I I I I I I I I
Y,ears
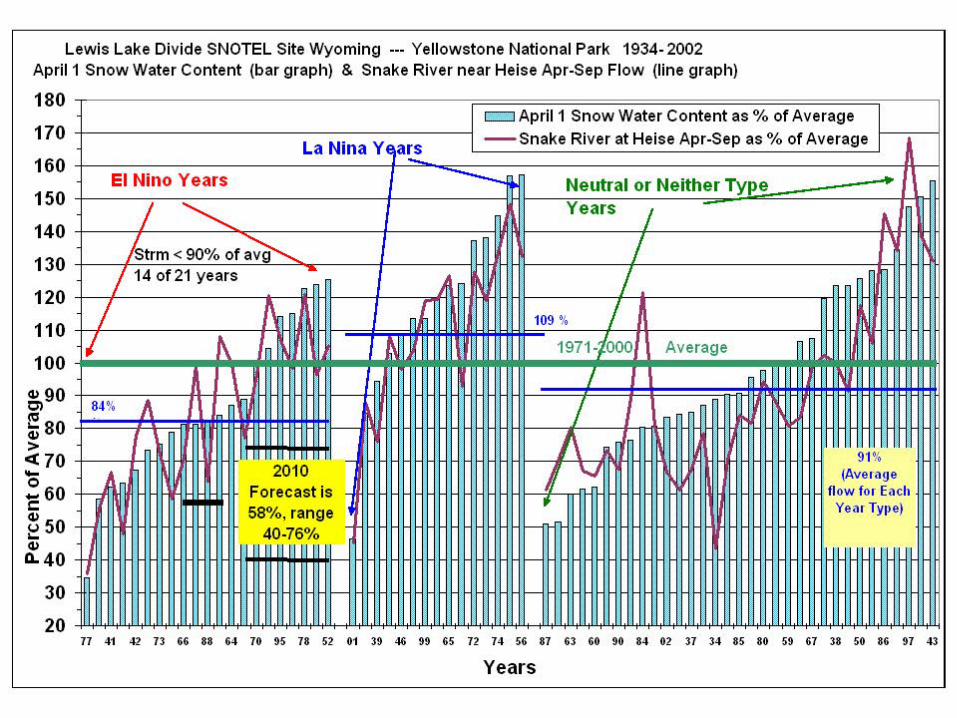
Lewis Lake Divide SNOTEL Site Wyoming --- Yellowstone National Park 1934- 2002 April 1 Snow Water Content (bar graph) & Snake River near Heise Apr-Sep Flow (line graph)
180 . i •••••••••••••••••• i April 1 Snow Water Content as 0/o of Average
170 - Snake River at Heise Apr-Sep as 0/o of Average La Nina Yi ars
160 - ---. El Nino Years Neutral or Neither Type -150
I ~ Years I ,. ... \ 140
/strm < 90°/o of ~ I .
I ~ 130
/ 14 of 21 years - I M 120 . I " nl JM I 111 110
109 %
100 I/ \ ,u.
~ 1971-/ 000 Average 11 I .
4190 84% J -nl !U AIJII I 1:11
Eso I 41 1111 I! I J, Jn IN > . i ~70 I I Ul l\ 9·1% - INIAI 2010 BIi I " (Avernge 0 ... 60 -- Forecast is flow to.- Each C . 58°/o, range
., Ye,u Type) 41 ~fl v 50 ->-· 40-76°/o -... 41
11.40 - -. 30 - >- >-
20 77 41 42 73 66 88 64 70 95 78 52 01 39 46 99 65 72 74 56 87 63 60 90 84 02 37 34 85 80 59 67 38 so 86 97 43
Years
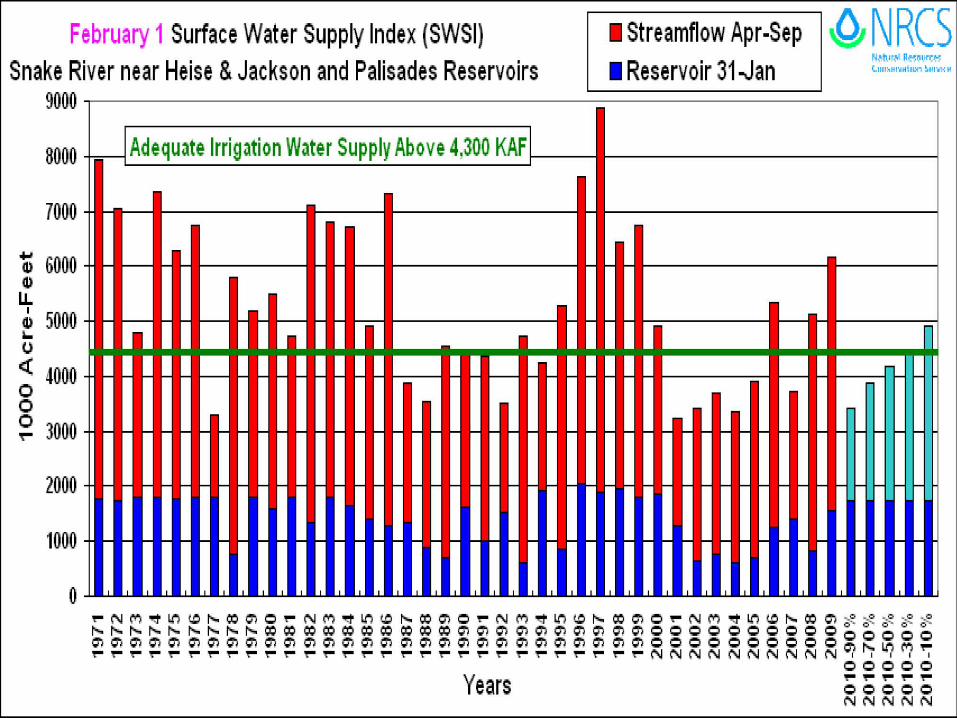
February 1 Surface Water Supply Index (SWSI) Snake River near Heise & Jackson and Palisades Reservoirs
9000
8000
7000
~ 6000 G)
u. ~ 5000 I.. u ( 4000 0 . 0
~ 3000
2000
1000
0 I I
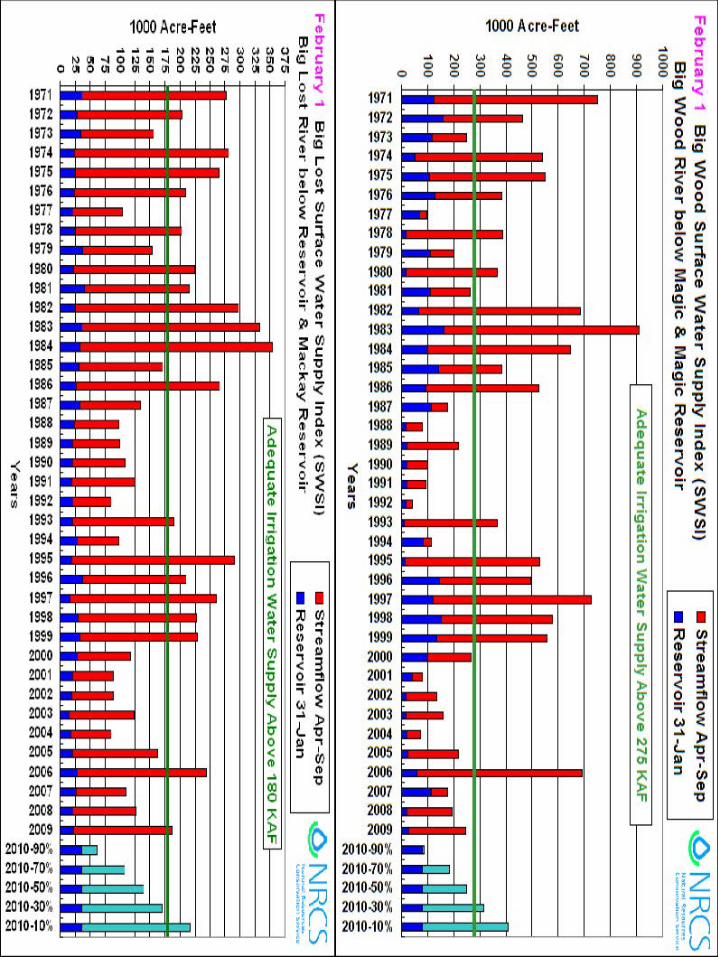
Adequate Irrigation Water Supply Above 4,300 KAF
I I I I I I I I I I I I I I I I I I I I I
Years
I I I
I Streamflow Apr-Sep I Reservoir 31-Jan
I I I I I I I I I I I I
'°1 NRCS
I
,.
--
I
ll.,r,ti.1r~ ~~9~ t llll~Hl~Hl l lll'I ~Hl'l1< H
-- -- - -- - -
I I I
""' ""' "" "" "" QQQQO NNNNN
36
33
30 ... C: 27 "' ... C:
24 0 0 .. 21
"' ... "' 18 :s:: -0
15
(/) 12 "' .s::.
(.) 9 ..5
6
3
0
a; -«s ~ 3: 0 C: en .... 0 u, Cl)
~ c., C:
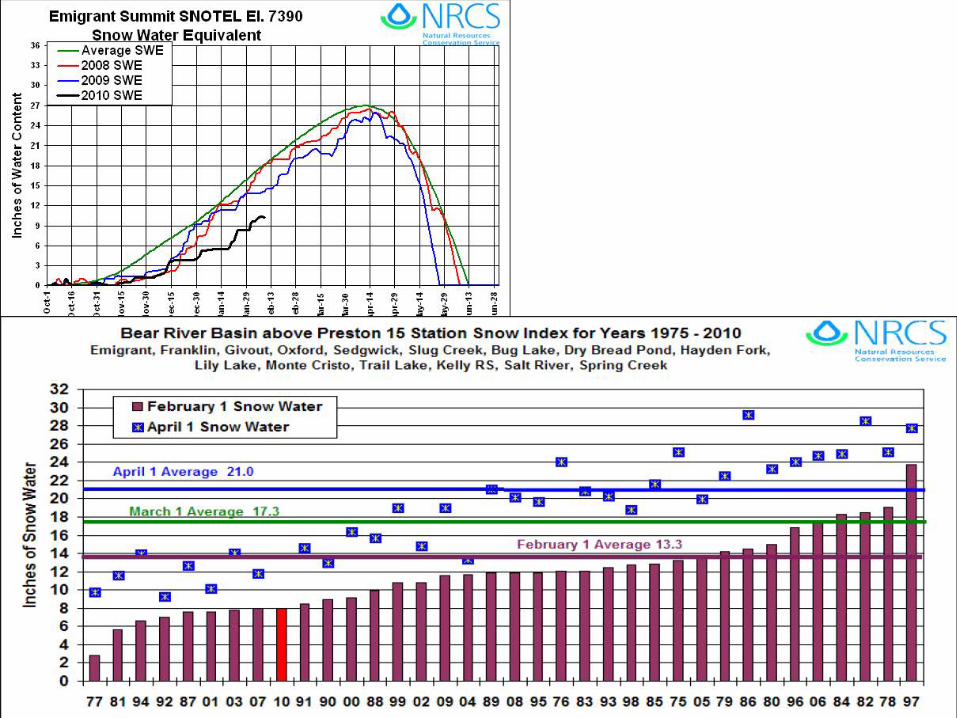
Emigrant Summit SNOTEL El. 7390 Snow Water Equivalent
- Average SWE - 2008SWE - 2009SWE - 2010SWE
VJ l,,C v ,.
~ V' hi
/f r' ~ ~
al ~ .r ~/f ,.) r
,,, ,, L ,-~ ~ -- -
"' !
~ NRCS NMural Resources ,. .... n ... ., ·' n c,.~,1"
,::::;... ~ \. \
'\" 1
,\
\\ -,
\ \ \ \\ \ \ \
B ear R iv er B asin above Preston 15 Statio n S now Index for Years 1975 - 2010 Emigrant, Franklin, Givout, Oxford , Sedgwick, S lug Creek, Bug Lake, Dry Bread P o nd , Hayden Fork,
Li ly Lake, Monte Cr isto, Trail Lake, Kelly RS, Sa lt River, Spring Creek
32 30 28
->--- • February 1 S n o w Water D
->--- D April 1 Snow Water 26 24 22
D April 1 Average 21 .0 - El ....
20 18
El El ..... D -March 1 Averaae 17.3
16 14
.... .... El February 1 Average 13.3 -
iii
12 D u - - - - - - -..... .... 10 -
El - - - - - - --- --8 - - - - - - - - - - - - - - - - -6 - - - - - - - - - - - - - - --- -4 - - - - - - - - - - - - - - - - - -2 0 - - - - - - - - - - - - - - - --- -I . ' ' ' ' . .
' ' ' ' ' ' ' ' ' ' '
-
' '
'°"' NRCS
El D
' '
N;i,tural hC'$0urc,.,,e~ Corut:-rvation S.e-rvice
.... .... II
. . ' ' '
77 81 94 92 87 01 03 07 10 91 90 00 88 99 02 09 0 4 89 08 95 76 83 93 98 85 75 05 79 86 80 96 06 84 82 78 97
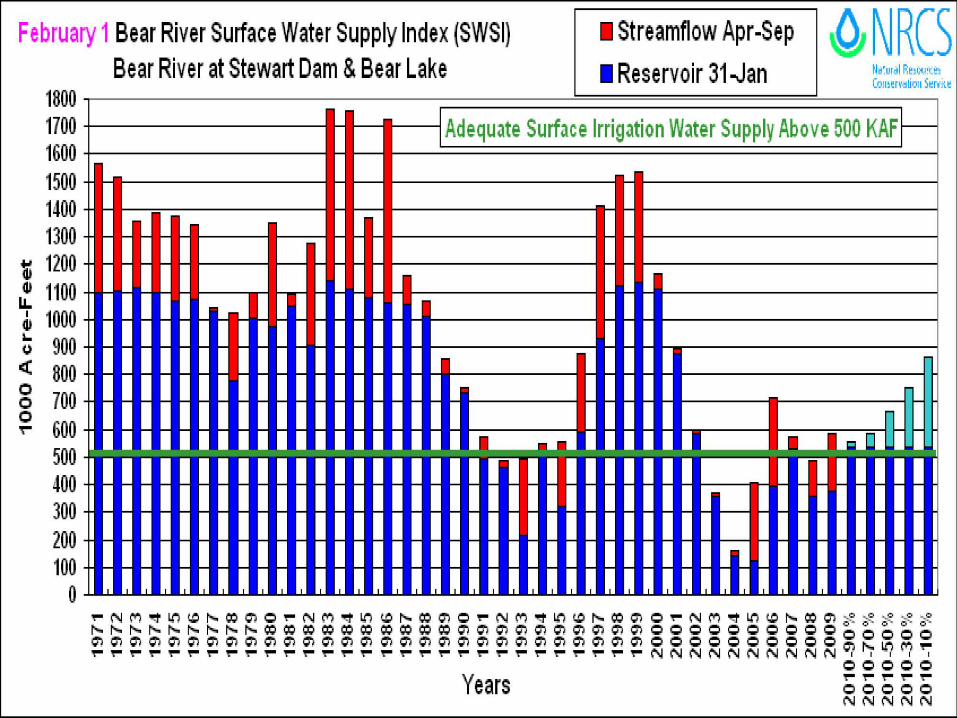
February
1800 1700 1600 1500 1400 1300
t; 1200 ~ 1100 ~ 1000 ~ 900 ct 800 g 700 0 ~ 600
500 400 300 200 100
0
1 Bear River Surface Water Supply Index (SWSI) I Streamflow Apr -Sep ~NRC Bear River at Stewart Dam & Bear Lake I Reservoir 31.Jan lld'.urdl R~il.,'l,i:m
Ccirnr~-!ltiou Sm
s Adequate Surface Irrigation Water Supply Above 500 KAF -
I I I I I I I I I I I I I I I I I I I I I I I I
Years
I I I I I I I I I I I I I I I
--- -
-
I I I I
T"' T"' T"' T"' "" OOOQO NNNNN
1000 Acre-Feet "11 (D
er 1000 Acre-Feet "11
(D
N 0 0,
...... 0, -., 0 N 00,00,
~ ~ N N N ~ o, -., o N o, O C 0 o, 0 o, 0 A)
~~~~~~
_.NW ,l>, O,Ol...,COl,l)O_.NW ,l>, O, 0000000000000000
O' ., C Ill
I I I • • I I I I I ~ . ,
1~1 ~ ~ I I I I I I I I I I I I I
1972 ~ I • I I I ; ;
1971 ~ 1 1 1 1 I I I I I 1972
1973 ~ I I I I I _. ; C
1974 ~ I ' I I I ! ~ iJ, 1975 ' II (/) ('I
' "' Ill (D 1976 ~ :, ~ 1977 ' ~ t ~
' .., 0 (D 1978 ~ - · ., 0 :,
1979 Gt ,... "' - 0 C 1980 1!0 "C 1981 ~ I I "2,
~ I ' ! (/)'( 1982 , !. :i 1983 g ~
1973 f I I I I
1974 ~ I I I I
1975 ' 1976 I
1977 1978 1979 1980 1981 f I • ' '
1982 ~ I •
1983 1984 ' :, X 1984 ' ' ' ' 1~' :i I I I I I I I
1986 ~ ~ 1987 ~ I I ::0 ~ 1988 ~ I I ~ :
1989 ' ~ 3 .J 1990 ~ o 0 ...., ' )> - · :, (D 1991 o. ., 111 , m "11 ;;J 1992 - I .0 !!!. C -1993 ' ' • '
1994 ~ I I I I I
1995 1996 ,
1
I 1997 1998 ' 1999 ' 2000 ' 2001 ' '
2002 1
2003 ' 2004 I
2005' I I I
2006 ' 2007' I I
2008 '
Al "' ... m
3. Ul Al ... o· ::,
i ... m .., (I) C ,, ,, '< )> tT 0 < m ... ... Q
I I ::0 (/) (D ...
"' ; (D Ill
< 3 0 :!I - · 0 ~~ .... :ii: L 111 Ill ., :J I
(/) (D
"C
1985 1986 I I
1987 f I • ' '
1988 f I
1989 -( 1990 I
~ 1991 ul 1992 ..
1993 ' ' 1994 f I I I
1995 1996 I
1997 I I
1998 1999 2000 2001
I I
2002 2003 I
2004 I
2005 I I
2006 ' ' 2007 I I I
2008 I
2009 f I I • •
2010,90% f I ' ' ' ~ 2010-70% ' ' 2010-50% I
f 2009 f I
~ 2010,90% f I
~t Z 2010-70% i, ·~ 2010-50%
6'. m .0 t: Al ... m
3. Ul Al e. 0 ::,
i ; .., (I) t: ,, ,, '< ~ 0 < m 0, Q
~ '11
-,-'
2010..JO% ' 1
2010-10% ~ 1 1 ', I I I I I
h :JJ 2010..JO% , i~ Q 2010,10% f
1
' , I I I I I I I I I
'< .... 0 Ill
0 C: A) (D
~ '< (D (/)
'< C - ::i. :, Ill :!I 0 0 (D
~ ~ l!O Ill ;:u ... (D ~ ~ (/) < C 0 "C - · "2. .., '<
:, Q. (D
>< -(/)
~ (/) .....
I I ::0 (/) (D ... "' ., (D (D
< 3 0 :!I -· 0 ~ ~ .... :1:: L 111 A) ., :J I
(/) (D
"C
~ HZ 'e -r, l, ,A.I
l! I"\ :~ ( I PVl
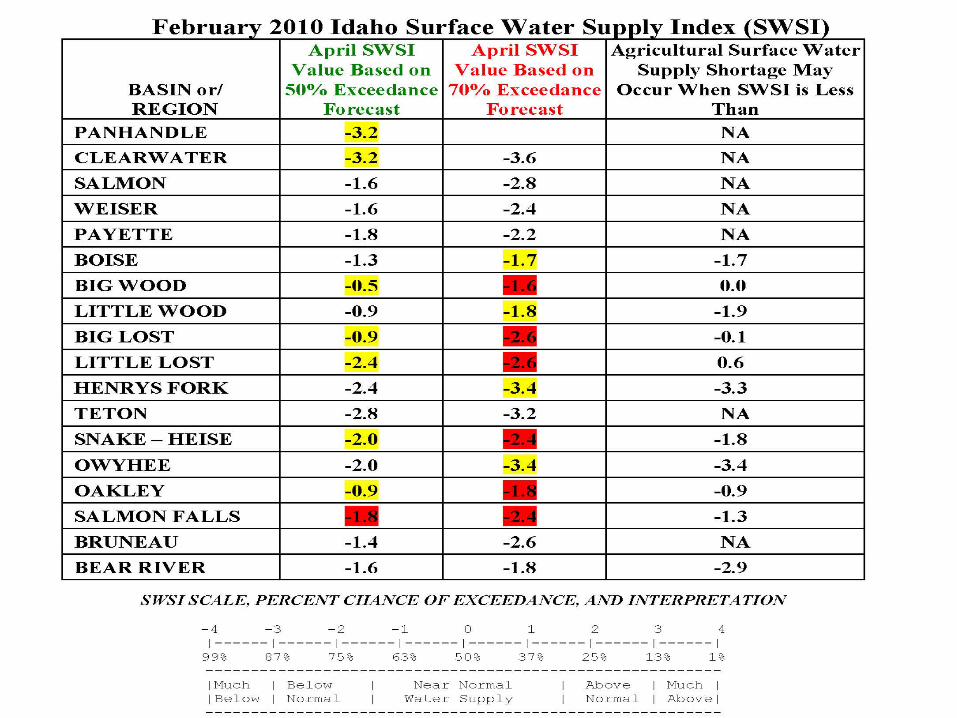
February 2010 Idaho Surface Water Supply Index (SWSI) April SWSI April SWSI Agricultural Surface Water
Value Based on Value Based on Supply Shortage May BASIN or/ 50°/o Exceedance 70°/o Exceedance Occur When SWSI is Less REGION Forecast Forecast Than
PANHANDLE -3.2 NA
CLEARWATER -3.2 -3.6 NA
SALMON -1.6 -2.8 NA
WEISER -1.6 -2.4 NA
PAYETTE -1.8 -2.2 NA
BOISE -1.3 -1.7 -1.7
BIGWOOD -0.5 - 0.0
LITTLEWOOD -0.9 -1.8 -1.9
BIG LOST -0.9 - -0.1
LITTLE LOST -2.4 - 0.6
HENRYSFORK -2.4 -3.4 -3.3
TETON -2.8 -3.2 NA
SNAKE - HEISE -2.0 - -1.8
OWYHEE -2.0 -3.4 -3.4
OAKLEY d).9 - -0.9
SALMON FALLS - - -1.3
BRUNEAU -1.4 -2.6 NA
BEAR RIVER -1.6 -1.8 -2.9
SWSI SCA LE, PERCENT CHA NCE OF EXCEEDA NCE, A ND INTERPRETA TION
- 4 - 3 - 2 -1 0 1 2 3 4 1------ 1------1------ 1------1------1------1------ 1------ 1
99% 87% 75%
!Muc h I Below !Below I Norma l
63% 5 0%
Near No rmal Water Supply
37% 25% 13% 1%
Above I Much I Normal I Abovel
Looks like Idaho’s Capitol, but it is our
Nation’s Capitol after recent storms and
their 4th consecutive Snow Day
Questions / Comments?