Embed Size (px)
Citation preview
c.AlDJ)IAN PORK IH»OR!l'S
I'DSIBILITY AND POHHTUL ItG'tAC1'
G.n. Griffith and B. Scott
Cont ~ Lbuted paper prese.flted at the 3Sth Annual Conferenc·e of the Austr,alian Aqrieult.ural £coflcnUes Society,
University of t~e'" &nql.andf' Amld/Al.o February U-14, 1991
Authors are Senior Resoarch S.:ientist# NSW Aqriculturo " F.isherie5, Armid;lila1 and undof(Jladu4te student, Department of
Aqricultural Economict$ and Business Management, University of Now england, Armidale.
'1'h1.5 paper has been partly funded by th.o Pig Resoarch and Oevelopement Cc.u::pt.I'rt'ltion.
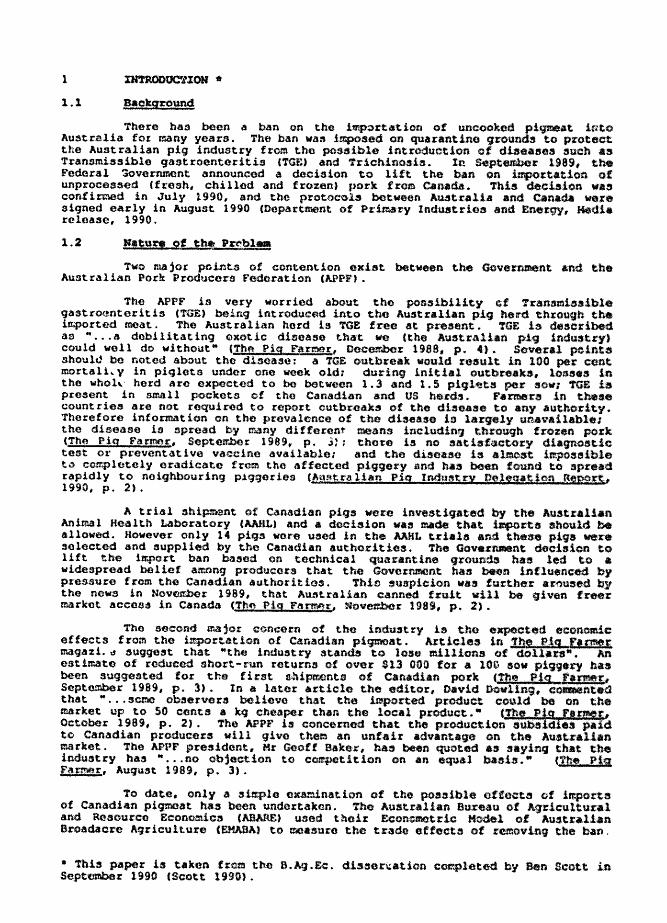
1 IN'1'ROD~IIOlf * 1.1 Baok91ound
"there has been 4 ban on the i.mp~rtat ion of uncooked Pi.9Mat iato Australiafot many years. The ban watt imposed on quarant1.ne qroun.ds to p~Qtect the Australian pig lndustry from the possible introduction ot diseases such 48 Transmissible gastroenteritis (TG&') and 'trichinosis. InSt'tpt~.r 1989, the ."ederal ~vernment announoed a decision to lift the ban on .importation of unprocessed (fresh, chilled and frozen) porkfrctll Callada. This deoiaion was c·onf'irm.ed in July 1990, and tbo protocols between AU4tra11.a and CAnada were Signed early in August 1990 (Department of Primary Industrios and &ner{/tY, ~4.1. releaso, 1990.
1.2 Natura qt tb6 Prcrbl ..
Two majoJ:' points of cont.ent.ion ex.iat between the GClvernMnt And tbe Australian Pork Producers Federation (APPF).
The APPF is very worried About the possibility tif Tr.ansmiasible gastroenteritis (TGE) being 1ntrodtle~d into the AustraU .. an pig berd tbrough t.he imported meat. The Australian bord is TGE free at present. TO£ 18 deSCribed as " ... 4 debilitating exotic ditl104Se that we (the AustrAlian pig industry) could well do without" (Tn" Pig Parmar., Dece.~r 1908, p. 4). Severa.l pol.nts shoul~ be noted about the disease: a TOE outbreak would x·eault in 100 per cent mortali .. y 1n piglots under one week old: during l.nitial outbrfUtk5" 104"'.3 1n the whol\.· herd are expect.ed to be between 1.3 and 1.5 piql.ts pe.r S01l; 'fGB 1s present in SmAll pockets IOf the Canadia.n and US h«u:d.~. Farmers in these countries are not required to report outbreaks of the (i,l.:u:uule to any aut.hority. Therefore information on the prevalence of the dlaettse is largely u:~.vailabl.: the disease 1s :spread by many different means includ.1ng through froz.en pork (The Pig Ftumor, Septcl'fner 1989 .. p. 3:: there is no satisfactory (U .. agno5tic test or preventative vaceine ava.ilable; and the di$(UkaO is almost 1.mpo8sib.1e to cornpl&tcly eradicate from tho Affected pi9gory ",nd haa been found to apr.ad rapidly to neighbouring 1)19901'108 (!tHlttra 11311 Pig Indttt,ta 9,1'9.$:1010 Bmpsu;;t, 1990. p. 2).
A tria.l ahipm-ant of Canadian P193 were investigated by the Au;stra11.an Animal Health Laboratory (MHL) and .. decision was made tbat import". should. be allowed. However only 14 pigs VOl"€) used in the AJUlt tria.la and these pigs were selected and supplied by the Canadian authorities. The Govcu:nmtant. docision to lift the In-.po.r·t ban basad on technical quarantine grounds has led to ,. wldespre.ad belief a.:r.on.g producers that the Government baa MOD influenced by pressure from the Canadian authoritios. Thin suspicion vasfurtber ar~ul$.,d by the news in Novel'f.ber 1989, thet Australia.n canned f;:uit will .t>e given freer market access in Canada (Th.-, Pig Farmll'u:, Novembcu: 1989, p. 2).
Tho socond ft"<i4jor concern of the industry i8 the expGct~d economic effects from the i:r.port4tion of Canadian pit;:mat. Articles in ~ 'Ig tlm!E maga:!. ~ suggest that "the industry stands to loa., mill.ions of .'Oi1a"8". An estimate of reduced short-run returns of over $13 000 f·ol.' a 100 sow p199011f has been suggested for the first al~d.pn:ents of Canadian pork ('th1 Pis_bu:et, Septo!rQer 1989, p. 3). In .. laterarticlo the editor, David 00'11. ftg. c~nt.d that " ... 1$O.n'IIC ob$o:rV'or$ believe that the import.ed prod.uct could be on the market up to SO cents a kg cheaper than the local product." (Ib, fig rom;,. OctobeJ: 1989, p. 2). The APPl;' 1:. concerned that the product,ion subsd1e.$ p.:1d to Canadian producers vill 9ive them an unfair advar.titge on the Australlan market. The APl'F president. HI.' Geoff Baker" has been quoted as saying th.at. the indu5try haa ..... no objection to ccur,petltlon on an eQUid. baeis." tlb, fig I:aFm!r, Auqu8t 1989, p. 3,.
To date, only a simplo oxar.l:inat.iQft of the pos:dble oftoctol of 1.rq::orta of Cana.dian pJ..gme.8t has been undertaken. The Australian Bu.reau of A9r,lcu.ltura.l and Resource Econom.ica (MARS. used their Ec.onometric Modelef AU4.t.ra.l.l .• n Broadacre Agr:ieultu.re (EHABA) to measure the trade effects of removing the ban.
• This paper 13 taken from tl'lo 8.Ag.Ee. dlsaer~.tion cc~pl.eted by Ben Scott in Septtmlber 1990 (Scott 1990).
This included @a.t1.matol! of p!~.t l.ft\p:octs, eff·.eta on Auatr.li.n productlcn iI,net eorun.:a:mption •. neS prle.e efte·eta (ABARE, 1'989,p.. 1). the ~dm.\d.at.lon3 MUUt£ ca~"i.d out. udo 3s.sW'I'lPtio:ns about excbange :tat.a., 9~owth In tht) Japanea8 beef l#port quot.a and feed 9l'Aln price.s. Tbo price ·of CAnadian pl~.t W3.$ tla.r:ied. using 4al018rd price:e. ~ al.so au:c@:unted for tbe f'.~t that ptleo stabt lisation art'iitn9~_nt. ex1at. tOt the C.anad1an dONatio pig indu:rtry. This results in 1.0"".1' fMrket prices (AnAAE, 1989, p. 2).
ABARE' 5 rosults 8\.J990.stod that tbore would bet little eff\lct on tbe Auat:al14n plq industry beeaU$O tbe level ot lmpott8 1a likely to be 10v and leports are unlikoly to occur (tvery year. The exchange rate .a8 cited a8 tbe b jor int luonce on whother C..:tnadlan lmpOtt.$ would en:teu: Auatr.:ll1... .1:. the tiM the ABARE I':-epott WAS written, tho Auat.rallAn dol14% tUld w,u::llned t.n "IIalu. relative to the C;lnadi.ah doll,ar, put.t.lng t.h. AtUft-raU.an plq 111.dU.3t~y in '. strongor ec:r.pot.ltlvo pculitlon (ABARE, 1989, p. 3). Ha_verf the r.lat;icnab:1.p betvceOll tbo two curroncies fta" not1 movod bACk tba other.ai,lY, sugge:stlnq tbllt trade MY be beco.~lrH~ moJo. fO(ls1ble.
1.3 ~ ~ 2b1,g~l!l'
It was d«leld€l!d to ~xa1ll11ne furthor' the po:n,tbl.e economic et.reets 4sDoeiat.ed with il'tporting Canadian pJ.~4t. Altho.u;h AaN\£. bas alread.y dono itn arHllyai3. thia researeh was cQtuJidoZ'ad relevant be:c4uao the C!lccncmic .nv1ro~nt htl::. ctun~90d &inci) the tt_ of ,u:it.if\; of ABARE' a r::eport. (p"trt,ieularly chanqe,fS in exch4nqe r4t6$ and rel-ttivo price 1ev8.18.', and" more ca:r.ploto plct.ur,o o·f fU)sslbl.e outceC'lltH. of lzr.portinv C,anad1an pl91f'M&t. 18 ant lei-pated so that tbo results ~y be v1~wed by ptodu.CGr5 and other interested p.lrt ies as belnq an unbiased ~pprtli5al of tb,e situation.
Tho objGctives of ttl!. rOS(Nu:ch &::0 to evaluate th. t •• a.1.bl1.ity of Canadian pl~at trade and to analys. t.bo effi\et.s ofvtu:ious bypothcult.sed quantitios of C4D<ildlan pigM.at In;ports on Auatralian production and daNna, fa·t:l1.I and rotail pr1et'U~ and lndu.atry uwenUfl5. Aa vell 4iU, ahn:wlng the effect a At t.he lndustry lovel.. the effect on 4ft individual f,BnV!rf " profltlib11.ity 1a als<1) ox.aminod. Tho 1.:tpact of 4 poss1blo -:~ •• ~roak of TOE 14 not elum~1.ned here, but tt'.ay form tho basia of scme fur'tt'ulft' r(u:Jeb~Ch.
'tbo hypot.hosla to be tested 1$1
flo: That thoro wl11 be no $1qnifie.ant economic effect-s on tbe AI.1!!1t.t4\1!4n pi9 industry 4S 4 rosult. oj! tho 1~rt4t1of.l of Canadian pi.,...t C.,asu.m!og thoro 10 no TGE In;p4Ct).
Ha: That tbero will be atq.n.if.lcant oconmde effects on tM Au!ttr41.!.an piq indust.ry 48 a te3ult of the ittpOt't4t.ion of CanadiAn plgmeat t •. 3sumlJ'i.g' the~e i 9 no TGE impact'.
2.1 Intr24uC1;loD
It. study by Gill and G.tlffit.b (1981) outlines in same detail the nwu:ket atruet.ufO of the Australian 1"19 industry. 'they ~acribe the Auat.taU,an pi9 fMrket as a.n interactive national mlIrkot with aignificant interstate tl':£nsferl! ot piqrtllftat as t* rr.a ;01.' charactori.at ic. This may pro'l/$ to be l!riport~mt if ltr.po.rta o.f C.anadlan piqm,e4t dQ oceur. For .xampl~, pl~at landed 1n Sydney CQuld have offect:t en the whole national F..Ilrket rat.her than jU4t the New Soutb Wt.lea U.rkCl.
Pat'ticipant.s in ·;,be mA.rket include pig pr'Odueer$, Auction selling conCf,U:na, abattoirs, ..,1'101O'8a.101:'8. retcil,ers and corufumars. The m.all_ producing statos are New Sout.h Wales.. Victor la, Qu6ensland and South 1'.uatralla. Th~ dUfl'Alst 1c ma.rkct 1s the prezjf;t,minanl out let for piqmeat. Quant itios of p1qmoat and pl9JOO1lt derivatives oxported 4::0 8tt'.all, with .impol'ttl, a1ao small, t'cstrlct.ed mai.nly to canned nams 4nd bacon prooucts.
r
S~veral proces5ing channels may be followed ooc.- pigs halve been sold. The live P1Y3, ma.ir.ly heavier 'baconera' may''''' • .old t.o pr'OccuJsinq firM that generally have their own slaught-oxhoU3& tiS part of their cperat.lon. The p:lg5 Are !Slaughtered and procesned into ".ricus piqme.tt producta such 4S eur:ed and canned hams, bacon and amaU9oods. The fin,hshed product3 An. d.i,dtributed to retailera for 841e to consumers.
Another channel i3 gene.rally u1Jod for frush pigu.eat product a . 'the pLgo, Nin,ly lighter: 'po,rkera' are sold to "holesale and retail butchers and generally sent to independent abatt.oirs for: slau911tor. Reta!l butchers tben sell the prodt~ct directly t.o comnlJners while 'K'holeaalera distribute t.h&ir: product to retail outl,etb 4uch a.$ 5upermark"~$.
Participants in the marl(f~jt must neceasaril.y conform to a varlet)' of health regulation:!, Mtiat Industry acts, Shops and i·4cto~i.s act. and local council regulations. Apart teem t.he8fl, the AU$tt::411an p19 industry is ,,'l:.~ a5 being largely unre9ulated (Gl11 and Griffith, 198'7) • There io no "ostriction on output, no interference in priCing and,unl1~. u.ny otber AU4trallan primary indu'trl«u" no .E'equiremant tOt: producel's to sell thoir product through it statutory marketing Authority. Producer", ar. requ1rod to contribute.. through a levy e<n pig8 :s14u~hter:edl to indu8ts:::y pr.omotion and research.
2.2
2.2.1
Sir!!n!; JP4U!t£Y !1~u!t12n (:see 1able 2.1)
production gf elEat
Production of pigmoat ,hows <iii cyclic.-l beba't'iour. Tbis is due 1n part to smaller fariM moving in and out of produc.tlon wit.h fluctuation" in peteoa. Since tho nun-ber of small f.ftM haa been declirrlng it is thou9ht that the pig cycle it} bfleoming lOS8 pronounced. Production wat' at a cyclic.l ,*"k in 19$0, declinln9 slightly in 1981 lind 1982 before increasing atea.dU.y alnce 1982 tRible, McGrath, Strong and Griffith, 1990). Production is expec:ted to continue to riso to a peal: in 1994 (A9APE, 1989). Potk producta have averaged approximately 44 per: cent of total piqmeat production since 1984.
2.2.2
The number of pigs slaughtered in Au.:stralia decr.as.cler~ 1980 to 1982. Since then slaughterings have lncr811uufd at an averllg3 of about 3.2 per cent per year. Slaughterinq5 in 19Q9 were o,lose to 5 million head nUbia flit al, 1990). Similarly,4ver.a96 carca3e weight tuu, r1sen stead.i.ly since 1982 and, in 1989, was 62.1 kilogrAms (kg).
2.2.3
Per: capita consumption of pigmeat in AustrAlia naa r1aon et •• dily f'J'!'om 15.9 kg/peraon/year in 1982 to 17.8 k.g/pareon/year in 1989. As" proportion of red meat consumed, pigmeat cc .1aW't'lptio.n ba$ increa:sod from leas than 1a per cent. to over 22 per corlt over the period 1980 to 1989 (Ribic et a.l~ 1990). Pork consumption, aa & percentage of total pigmeat conaumod, has incrtluu,.,d slightly from 1980 to be approximately 43 per cent in 1989 (Rlbic at al, 1990).
2.2.4
The pig industry is c:-taracterised by I large number of/. amall-sc .. 1a producers And a amall num1>er: ot very lorge, highly integrated produe0r3 and processors. The nU'll'iober ,,\f est.ablishments with pigs has declined by mo~.tb.n 60 per cent since 1980. The number of farms with over 500 pi.gs had increAsed from 752 in 1980 to 1032 in 1988, reflecting a gr:eat.r proportion of 8maller farms lea.ving the industry. However nome of this decline can be attributed to changes in ADS definitiona of pi.q enterprises.
2.2.5
Expo.rts of piglM!at products are clas:s1.tied as careast) p1qmeat (pork), el1,nncd tpiqmeat and miac,ellaneou5 piqmeat. Since 1.980 exporta have VAried following no consistent pattern. However, the;, total a~unt of exports bas not been qreater than 2.9 per cent (1988) of domestic production.
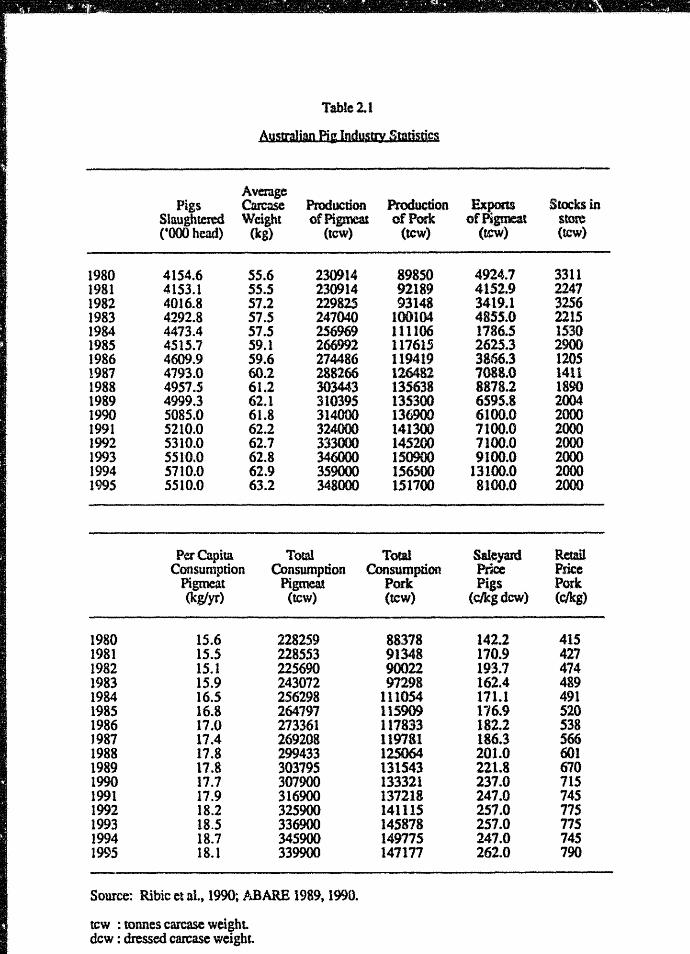
Table 2.1
aYstrJUan Pi& Ioduaux Sunjllim;
Average Production Expons Stocks in Pigs Carcase Production
Slaughtered Weight ofPigmeal ofPOtk ofPigmeat store COOOhead) (kg) (lew) (tcw) (rcw) (tcw)
1980 4154.6 55.6 230914 89850 4924.7 3311 1981 4153.1 55.5 230914 92189 4152.9 2247 1982 4016.8 57.2 229825 93148 3419.1 3256 1983 4292.8 57.5 247040 100104 4855.0 2215 1984 4473.4 57.5 256969 111106 1786.5 1530 1985 4515.7 59.1 266992 117615 2625.3 2900 1986 4609.9 59.6 274486 119419 3866.3 1205 1987 4793.0 60.2 288266 126482 1088.0 1411 1988 4957.5 61.2 303443 135638 8878.2 1890 1989 4999.3 62.1 310395 135300 6595,,8 2004 1990 5085.0 61.8 314000 136900 6100.0 2000 1991 5210.0 62.2 324000 141300 7100.0 2000 1992 5310.0 62.7 333000 145200 7100.0 2000 1993 5510.0 62.8 346000 150900 9100.0 2000 1994 5710.0 62.9 359000 15650(} 13100.0 2000 1995 5510.0 63.2 348000 151700 8100.0 2000
Per Capita Total Tocal Saleyard RelaU Consumption Consumption Consumption Price Price
Pigmeat Pigmea! Pork Pigs Pork (kglyr) (tcw) (lew) (cJkgdcw) (elkg)
1980 15.6 228259 88378 142 .. 2 415 1981 15.5 228553 91348 170.9 427 1982 15.1 225690 90022 193.7 474 1983 15.9 243072 97298 162.4 489 1984 16.5 256298 111054 171.1 491 1985 16.8 264797 115909 r/6.9 520 1986 17.0 273361 117833 182.2 538 J987 17.4 269208 119781 186.3 S66 1988 17.8 299433 125064 201.0 601 1989 17.8 303795 131543 221..8 670 1990 17.1 307900 133321 237.0 715 1991 17.9 316900 137218 241.0 745 1992 18.2 325900 141115 251.0 775 1993 18.5 336900 145878 251.0 775 1994 18.7 345900 149775 247.0 745 1995 18.1 339900 147177 262.0 790
Source: Ribie et at, 1990; JrJJARE 1989, tWO.
leW : toooes carcase weighL dew: dressed careasc weight.
2.2.6 Pigme&t atocks in ato:e
The amount of piqmeat stocks in store varies greatly from year to year. However, as a percentage of total production, stocks in store rarely exceed 1.5 per cent. In 1989, stocks were 2004 tonnes carcase weight (tcw) out of 310 395 tcw total production.
2.2.7 Imports of pigmaat
The level of imports has been low in recent years. Uncooked pigmeat has been banned and imports of processed meats have been restricted to mainly canned hams and bacon, with quotas applicable to these products (Gill (u~d Griffith, 1987). In 1986-87, pigmaat imports were valued at $37 000 (ABS, 1988, p. 8).
2.2.8 Piqmaat. price.
Aust.ralian national average saleyard prices showed a cyclical peak in 1982, droppin9 in 1983 and rising steadily from 1984 onwards. The Australian average saleyard price for pigs was ?21.8 c/kg dressed carcase weight (dew) in 1989. Retail prices did not reflect "he trough of 1983. They have risen steadily since 1980. In 1989, the Australian national average retail price of pork was 670 c/kg dcw.
2.3 Industry Forecasts
Saleyard and retail prices are expected to rise to a peak in 1993, dip in 1994 and rise a9ain in 1995. Production, slaughterings, exports and per capita consumption are all expected to increase steadily until 1994 and then decrease as a result of a lagged response to the projected fall in prices.
2.4 Summary of Australian Pia 7ndustry
The Australian pig industry can be viewed as being lilell balanced. Domestic production largely meets the requirements of the domestic market in both quantity and variety. This is reflected by the low levels of both exports and imports. The induatry is expected to maintain this balance with increases on the production side covering any increases in demand. The cyclical trends are expected to continue with consumption and production lagging behind prices. As the number of small farm3 continues to decline, the pig cycle is likely to become less pronounced.
3 THE CANADIAN PIG INDUSTRY
3.1 Introduction
The Canadian pi9 industry is much larger than its Australian counterpart. Conunercial pork production is approximately four times greater than Australian production. Exports of pig-meat products and live pigs are very important to the Canadian economy. For example, the total value of pigmeat exports (including live pi9S) was over C$125 million in 1989 compa>::ed to Australia'S exports of A$32 million.
The industry is heavily influenced by the United States (US) pig industry due mainly to the volume of exports to that country. US pig prices and the value of the Canadian dollar, with respect to the US dollar, are major influences on the prices received by Canadian producers.
In recent years, exports to the US have been subject to a countervailing duty applied to live pigs and fresh, chilled and frozen pork. This has been a major problem for the Canadian industry rflsulting in reduced exports to the US. Reviews by the US Commerce Department have resulted in a drop in duty on live barrow and gilt exports for the fiscal years 1986/87 and 1987/88, resulting in a refund to exporters (Alberta Agriculture, July 1990, p. 15) •
Canadian and US officials had been conducting reviews on the , countervail case' against pork products. A recommendation from the General Agreement on Tariffs and Trade (GATT) has led to the US dropping its countervail case against imports of Canadian pork (Canadian Consulate spokesperson, per~. comm., September 1990). Alberta Agriculture (July 1990, p. 15) suggested that the outcoIOOS of these decisions n •••• will have a major influence on trends in Canadian pork production and exports in coming years." As the dQcisions have only recently been made, one can only speculate about Canadian production and exports over the coming year3. However, it would seem likely that the decrease in the duty will result in increased exports to the US and less pork available for other destinations, such as Austral.!a, and for the Canadian dOlRef.'tic market.
3.2 Natura o~ Government Intervention
Agriculture in Canada is very heavily subsidised by the Federal Government. In 1981/82 Federal expenditure on agriculture was an estimated 31 per cent of agricultural gross domestic product. This figure had risen to 68 per cent in 1988/89 (Government of Canada, in ~y~n-Clark, 1990).
The latest support scheme in the livestock industries is the Tripartite Red Meats Program (TRMP), first implemented in 1986. The program was de5igned to replace the numerous provincial programs already in place. The scheme is essentially a buffer fund arrangement with equal funding from producers, the provincial governments and the federal government as a percentage of the volume of marketings (Agriculture Canada, 1989, p. 2,74). The basis for the scheme is to support prices received by producers.
For pig producers, n ••• the aupport price is set quarterly and is equal to the current cash costs of production plus 95 per cent of the average margin during the same quarter of the preceding five years." (Agriculture Canada, 1989, p. 75). Margins are calculated as the price leas cash coats for the product produced in that particular period. Calculations are made using national prices and costs rather than provincial figures. When the average market price is lower than the support price, participants in the acheme are paid the difference from the atabilisation account (Agriculture Canada, 1989, p. 75).
In 1989, only four provinces were enrolled in the TRMP for pigs. These were Alberta, SaSkatchewan, Manitoba and Ontario. These provinces accounted for about 60 pe.r cent of slaughterings in 1985. The largest producing province is Quebec accounting for approximately 32 per cent of dome~tic slaughter in 1989 (Agriculture Canada, 1989, p. 75). While government subsidisation of the Canadian pig industry is a concern of Australian producers, it should be emphasised that only 60 per cent of slaughterlng8 in 1989 were covered by the TlUiP and that the scheme does not always produce payments. In the first quarter of 1990, C$9.67 per slaughter hog marketed t1as paid, but it is expected that there will be no further payments for the rest of 1990 (Alberta Agriculture, July 1990, p. 16).
3.3
3.3.1
Current Zndustry Situation (Table 3.1)
Production of piQ!!at
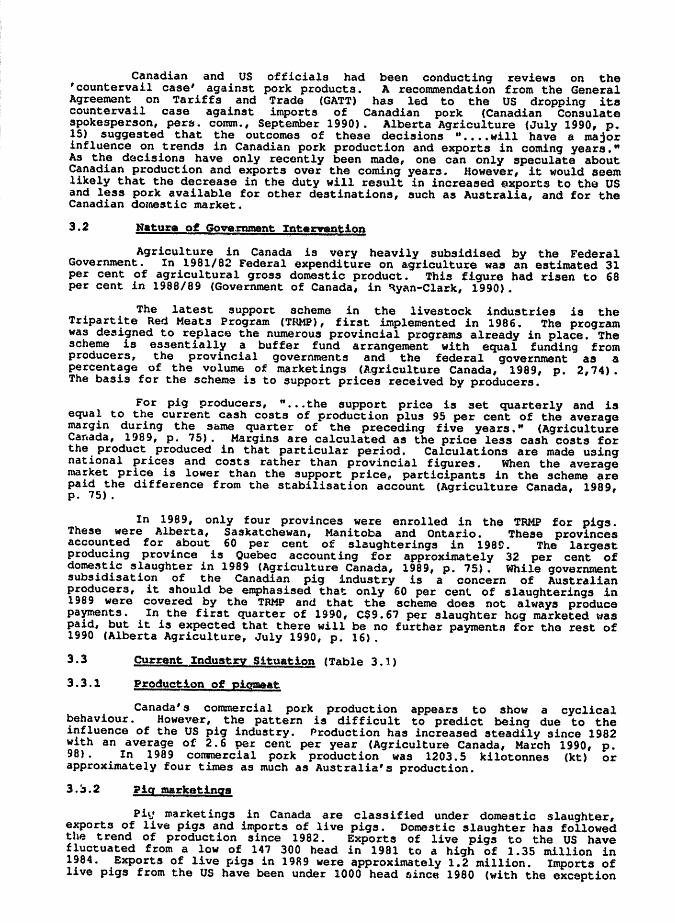
Canada's commercial pork production appears to show a cyclical behaviour. However, the pattern ia difficult to predict being due to the influence of the US pig industry. Production has increased steadily since 1982 with an average of 2.6 per cent per year (Aqriculture Canada, March 1990, p. 98). In 1989 commercial pork production was 1203.5 kilotonnes (kt) or approximately four timea as much as Australia's producti.on.
3.:'.2 Pig marketing.
Pi\! rnark.etings in Canada are classified under domestic slaughter, exporta of live pigs and imports of live piga. Domestic alaughter has followed the trend of production since 1982. Exports of live pigs to the US have fluctuated from a low of 147 300 head in 1981 to a high of 1.35 million in 1984. Exports of live pigs in 19R9 were approxiInately 1.2 million. Imports of live pigs from the US have been under 1000 head (linca 1980 (with the exception
Table 3.1
CQ1D~[kiW HQg ima fgrk Brui!n~~ Sb~~la Cani!dila 1210-90
HOGS PORK COM1~OD1TIES
Beginning Ending Domestic Cammer- pork Imports Domestic pork ExportS disappear- Pet capita
Domestic Exports of ImportS of Hog ciaI pork commodity of pork pork commodity of pork ancc of pork disappear-slaugblet live hogs live bogs marketings production stocks commodity supply stocks commodities commodities. ance
(thousand head) (Ihousand toones) (kgkapita) 1970 10351 88.2 3.9 10435.3 745.7 11.1 11.9 768.7 12.2 32.3 619.3 29.0 J971 11352 88.7 0.8 11439.9 813.1 12.2 12.3 837.6 13.1 45.2 779.3 36.1 1912 10997 88.7 1.0 11 084.7 787.1 13.1 20.4 820.6 8.S 52.4 618.6 31.1 1913 10657 90.2 0.8 10746.4 763.4 8.5 24.6 796.5 15.0 57.1 64S.7 29.3 1974 10700 196.8 0.7 10896.1 767.2 IS.0 31.6 813.8 10.4 42.0 682.5 30.5
1975 9164 30.7 0.7 9194.0 654.7 lOA 44.1 709.1 7.8 40.8 593.1 26.1 1976 8969 45.0 0.9 9013.1 643.2 7.8 111.2 762.3 12.5 50.7 632.9 27.5 1977 9037 43.6 0.5 9080.1 647.7 12.5 117.5 777.8 9.8 59.5 641.1 27.6 1918 9940 188.0 1.8 10126.2 741.4 9.g 69.9 821.2 11.8 72.1 660.9 28.1 1979 12001 122.6 1.1 ''': ::' 4) 889.3 11.8 42.5 943.6 11.9 101.6 738.S 31.1
1980 13978 237.6 0.7 14214.9 1033.6 11.9 22.0 J 067.5 14.4 149.3 797A 33.1 1981 13692 147.3 0.8 13838.5 1015.2 14.4 24.9 1054.5 12.1 164.4 773.5 31.8 1982 13458 305.3 O.S 13 762.8 1005.9 12.1 18.8 1036.8 9.4 201.9 715.9 29.1 1983 13702 459.3 O.S 14 160.8 1029.6 9.4 24.2 1 063.2 10.5 201.2 745.5 30.1 1984 13886 1346.5 0.2 15232.3 1043.8 10.S 18.2 1072.4 11.1 223.9 730.0 29.2
1985 14452 1152.4 0.3 15604.1 1088.4 11.1 21.2 1 120.7 9.0 250.8 148.8 29.7 1986 14444 502.2 0.9 14945.3 1097.3 9.0 17.9 1 124.2 8.1 271.9 731.2 28.8 1987 14854 427.6 0.7 15280.9 1130.9 8.1 22.1 1 161.0 8.4 301.1 735.1 28.7 1988 15526 868.3 3.3 16391.0 1 188.3 8.4 IS.7 1212.4 9.7 318.7 760.2 293 1989 15530 1204.2 0.6 16733.6 1203.5 9.7 13.7 1226.9 10.4 310.7 778.9 29.7
1990 15375 102S 0.6 16399.4 1 179.4 10.4 12.0 1 201.8 10.0 264.1 797.8 30.1
Domestic disappeamnceincludcs a reduction from supply for manufacturing and waste.
Source: Statistics Canada (hiStOrical): AgricultureCanada (forecast).
of 1988 when Canada imported 3300 pigs). Imports of live pigs were lLmited to 600 head in 1989. Total pig marketings for 1989 were approximately 16.7 million head (Agriculture Canada, t.s.arch 1990, p. 98).
3.3.3 Par capita consumption of piqmeat
Per capita of pigrneat has fluctuated since 1980 with no clear pattern. The average consumption has been 29.9 kg/capita over the period 1980-89 (Agriculture Canada, March 1990, p. 98). In 1989, conbumption in Canada was approximately 66 per cent higher than consumption in Australia on a per capita basis.
3.3.4 Exports of piqmaat
Exports of pigmeat products can be broken down into exports of live pigs and pork commodities. Exporta of pork commodities had been increasing from 1980 t reaching a peak in 1988. The level of exports in 1989 was 310.7 kt or approximately the same as Austr~lia's total domestic production for the same year. It is interesting to note that exports of fresh and frozen pork totalled 228.44 kt in 1989 (Agriculture Canada, March 1990, p. 93). Of this, over 93 per cent went to either the US or Japan. T~is left only 15.1 kt for exports to other dest inations. New Zealand was the destination for 772 t of this quantity.
3.3.5 ;mports of pigmeat
Imports of pigmeat products are relatively low, both absolutely and with respect co exports. Since 1980 the highest amount imported has been 24.9 kt in 1981 (Agriculture Canada, March 1990, p. 98). In 1989 Canada imported 13.1 kt, representing approximately 4 per cent of exports for the same year.
3.4 Indu8tE! ror.c~8t8
It is difficult to make forecasts about the Canadian industry due to its dependence on the US industry. Agriculture Canada (March 1990) had forecast that total output of pork would be lower in 1990 than in 1989, falling further 1n 1991. However, recent high prices may lead to an increase in production towards the second half of 1991.
Pricee in both the US and Canadian markets have been extremely hi~h for the first half of 1990. The strong Canadian dollar, with respect to its US counterpart, is the only reason why record prices have not been achieved (Alberta Agriculture, April 1990, p. 16). Alberta Agriculture suggests that the current price rally ha~ been driven uy demand as well as tight supplies in the US. Prices peaked in early June. but short supplies are expected to keep producer prices above 1969 levels for the remainder of the year. Prices received by Canadian producers tend of drop in December due to a seasonally low demand (Alberta Agriculture, July 1990, p. 16).
Predictions about trade are important from an Australian perspective. While uncertainty ex.ists over the volume of exports to the US in the near future, Japan is expected to continue to be a major tmporter in 1991 (Agriculture Canada, March 1990, p. 34). However, figures for 1990 BO far indicate that exports to Japan are down on 1989 l.evels (Alberta Agriculture, July 1990, p. 21). This year Canada opened up a new market in the USSR, with exports of 10 000 t to that country. Eastern Europe is a likely outlet for more Canadian exports over the next two to five years. Poland, Romania, Yugoslavia and Bulgaria are all described by Alberta Agriculture (April 1990) as potential customers.
3.5 Summary of canadian Pig Industry
The Canadian pig induDtry is a large net exporter of both pigmeat products and live pigs. The US decisions to lower the countervailing duties on Canadian pigs and pork products are likely to be the major influences on Canada's production and exports to the US. In the short term, it may be e~cted that exports to the US will increase. This could mean that export supplies for other destinations are reduced. In addition, the opening of new
markets in Eastern Europe will be influential in shaping the Canadian pig industry well into the 1990s. There may also be an increase in Canada's production of pigmeat, in the medium run, to take advantage of these export opportunities.
Recent high prices should lea~ to increased production over the next two years. Live pigs and pigmeat products should continue to be mt!jor export earners.
4 THE INCllN'l'IVBS '1'0 TRADI
4.1 Introductio~
This section aims to assess whether it is economically feasible for Canada to export unprocessed pigmeat to Australia. This involves an analysis of a number of variables including the Canadian export price, Australian wholesale price, Australia's exchange rate with both Canada and the US, shipping c~sts, Australian and Canadian production levels and government policy. Changes in these variables are difficult to predict with any degree of accuracy. Therefore, questions will be asked along the lines of a 'what if ..• ' basis rather than on the basis of formal forecasts, although i most likely' combinations are highlighted. Several assumptions have been made in order to correct for data deficiencies, and these are outlined at appropriate times.
4.2
4.2.1
Outline of Variables
Canadian export prica
Primary data on Canadian export prices were unavailable at the time of writing. Therefore, two estimates were used as a basis for a ' Free On Board' (FOB) price. Tile first of these was based on Agriculture Canada's 1989 figures for fresh and frozen pork exports by volume and value. This gave a 1989 export value of C$2.30/kg. The second estimate was based on the volume and value of Canadian pork exported to New Zealand (NZ) in 1989 (in $NZ Cost, Insurance and Freight [CIF]. This value was converted to Australj.an dollars and then back to Canadian dollars using exchange rates for the end of June, 1989 (Reserve Bank of Australia Bulletin, December 1989). The value was found to be C$2. 43.
4.2.2 Austr~lian wholesale price
The Australian wholesale price was taken from Nielseo Marketing Research (1989 and 1990) published in The Australian Meat Industry Bulletin. The price was an Australian national average rather than a specific cut price. The 1989 annual average estimate was $2.79/kg. For 1990 estimates, the figure wns the May national average of $2.69/kg.
4.2.3 Exchange rates
Exchange rates between 1'..l4tralia and Canada, Australia and the US and Canada and the US were all taken from The Reserve Bank of Australia Bulletin for December 1969 and July 1990.
4.2.4 Transport costa
Transport costs are calculated in US currency. The values given were for an 18 tonne refrigerated container. Transport costs include the flat r~te per container, Canadian wharfage, currency adjustment factor, bunker surcharge, terminal receiving charge, protective service charge and Australian wharfage charg'e. Transport from dockside to the wholesaler's distribution centre was considered to be negligible in terms of a per kilogram cost.
Estimates for 1990, in $A/kg, were based on an end of June 1990 Australia/US exchange rate with currency adjustment and bunker surcharge costs from September 1990 (Shipping company rapresentative [Name withheld by request], pers. comm., 1990). Per container costs were cheaper from the west coast (Vancouve.r) than the east coast (Toronto, Montreal). When converted to a per kilogram cost It was found that east coast transport was A$0.31 compared to a west coast cost of A$O. 30/kg. It would seem that Vancouver is the most
likely outlet for potential Canadian pork exports to Australia. Thus, the west coast transport rate has been used in the analysis. For the first two simulations below, the rate used was an early 1990 value. It has been suggested that the average annual increase in transport costs: is. approximately 10 per cent (Shipping company representative [Name withheld by request], pers.. comm., 1990]. However, the AMLC (Market Notes, 1989, 1990) suggests that refrigerated transport costs for beef have decreased since the middle of 1989. It would be expected that refrigerated transport costs for pork are fairly similar, so the sensitivity analysis below has allowed for both increases and decreases in transport costs.
•. 2.5 AustrAlian production levels
Details about the level of production in Australia are available in section 2. The industry is expected to maintain its balance, with production covering domestic demands and leaving small quantities available for export. Saleyard and retail prices are e>tpected to rise by around 4 per cent per year over 1990 to 1992.
4.2.6 Canadian production l8vol~
Details about the Canadian industry are available in section 3. Alberta Agriculture (July 1990) expect a gradual increase in production and a gradual decrease in price for the remainder of 1990 and early 1991.
4.2.7 Government pOlicy
Changes in government policy, rather than directly influencing feasibility, may have an indirect influence on trade in pigmeat between Australia and Canada. Three areas that may influence trade are;
i) There is a possibi lity that AQIS may change the quarantine regulations on imports of uncooked pigmeat. As far as Australian pig producers are concerned, the TGE issue is not resolved and further representations on this issue seem likely. It is possiole, though highly unlikely, that the import ban could be reinstated, meaning no uncooked pigme.at would be allowed into Australia. Another possible scenario is that AQIS could ask for tighter inspect lon rules with importers being levied for the extra cost. This could make imp.cting the Canadian product more expensive.
ii) The Canadian government may, in the future, decide to lower assistance levelS to the agricultural sector because of budgetary considerations. This may cause a reduction in supply (possibly forcing some Canadian pig producers out of the industry) thus reducing the availability of export meat. It may also raise the FOB price at which export shipments are offered for sale.
iii) The outcon.e of the us countervailing duty case is expected to have an influence on Canadian production and exports in future years. More exports to the US are likely and less supplies would then be available for other export markets such as Australia.
4.3 Analysis of Incentives to ~rade
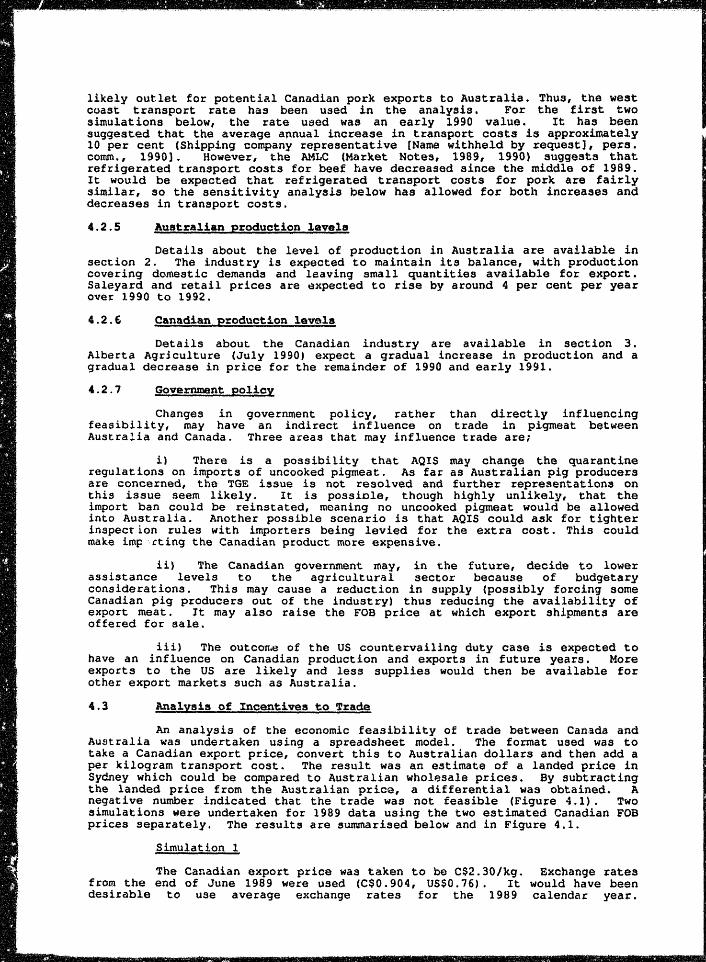
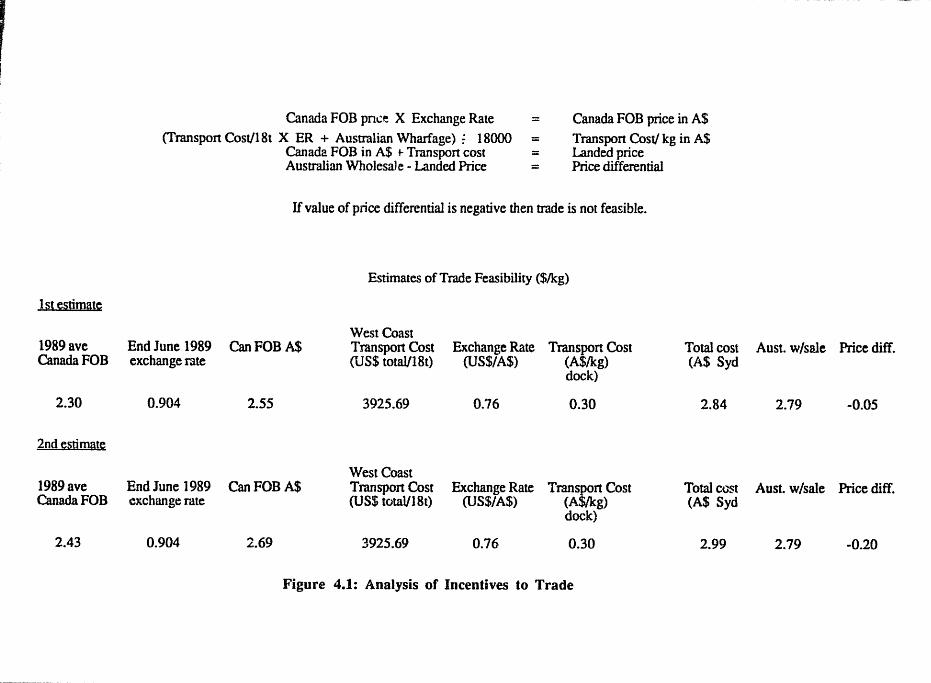
An analysis of the economic feasibility of trade between Can,!lda and Australia was undertaken using a spreadsheet rnodel. The format used was to take a Canadian export price, convert this to Australian dollars and then add a per kilogram transport cost. The result was an estimate of a landed price in Sydney which could be compared to Australian wholp;sale prices. By subtracting the landed price from the Australian price, a differential was obtained. A negative number indicated that the trade was not feasible (FiguJ;e 4.1). Two simulations were undertaken for 1989 data using the two estimated Canadian FOB prices separately. The results are summarised below and in Figure 4.1.
Simulation 1
The Canadian export price was taken to be C$2.30/kg. Exchange rates from the end of June 1989 were used (e$o. 904, US$O. 76) • It would have been desirable to use average exchange rates for the 1989 calendar year.
lS1~timal~
1989 ave Canada FOB
2.30
2ndts1im§~
1989 ave Canada FOB
2.43
Canada FOB pnce X Exchange Rate = (Transport Cost/18t X ER + Australian Wharfage) ~ 18000 =
Canada FOB price in A$
Transport Cost/ kg in A$ Landed price Canada FOB in A$ t- Transport cost =
Australian WholesaJe - Landed Price = Price differential
IT value of price differential is negative then trade is not feasible.
Estimates of Trade Feasibility ($/kg)
West Coast End June 1989 CanFOBA$ Transport Cost Exchange Rate Transpon Cost Total cost exchange rate (U S$ totaV18t) (US$/A$) (A$/kg) (A$ Syd
dock)
0.904 2.55 3925.69 0.76 0.30 2.84
West Coast End June 1989 CanFOBA$ Transport Cost Exchange Rate Trans~n Cost Total cost exchange rate (US$ total/1St) (US$/A$) (A g) (A$ Syd
dock)
0.904 2.69 3925.69 0.76 0.30 2.99
Figure 4.1: Analysis of Incentives to Trade
Aust. w/sale Price diff.
2.79 -0.05
Aust. w/sale Price diff.
2.79 -0.20
Un.fQ"t.un8t~ly, t.bO!lG dostIA were unavailable at the ti;;!le of wttt1nq. ltOVOYOC, the variations 1n exchango rates OVOI' tbe wnGle y~ar were taton into account whon sl',tttng tho exchange rato ranqo$ in tho at!n.tltlv1ty analY315 belov_ Wltb an Australian national avorago wholesale prico of $2.19/k; and a freigh.t cost of $0 301lul. t~\ir p:rlco dlfftu:entlal vaa fo'Und to bo -eo.O$/leQ_
.!.~P'Ul '" Si 10n 2
Thi3 VJ.mu14tion used the acco.nd oatwto of C$2.43/k9 fer the Canadian export pri.ce. liGlding exchange t.a:toa and tra.ru'lport c·ost.tI eonetallt., it va, found that the price dlfftn:ential WIilS -$0.20/kg-.
Therofore, baaed on ). 989 data, ther,e 18 0.0' cconam.1c .incentive for t tade 1 n unproccH)sod pork bet w(J\@za AU3tral1.a and Canada.
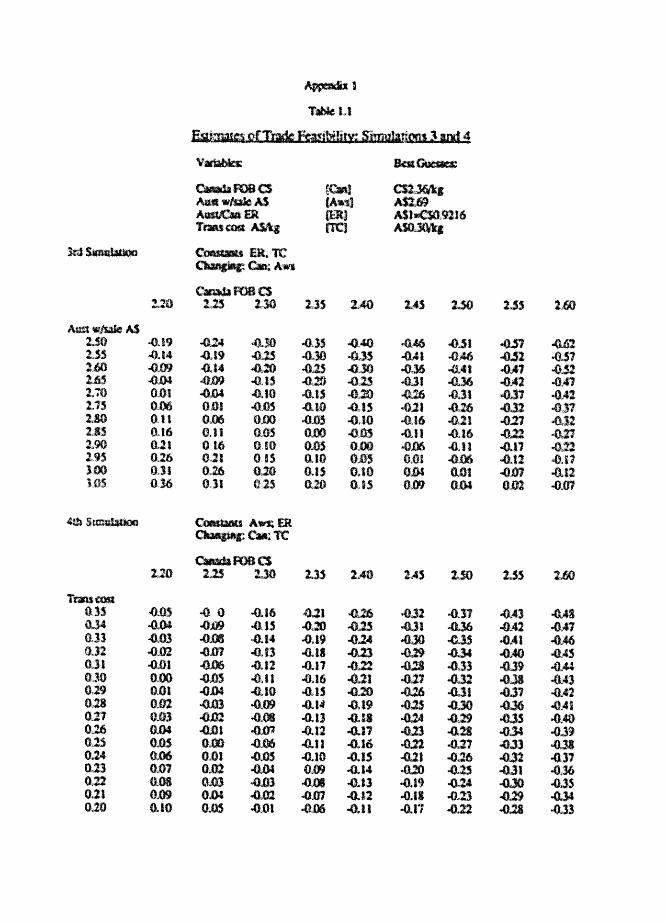
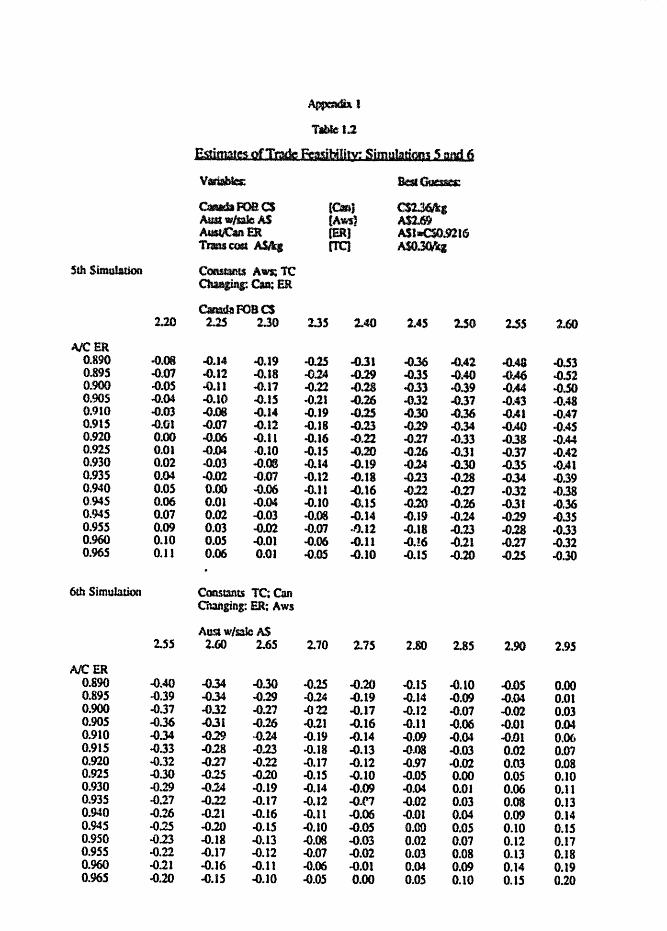
Ntlxt, a serlsitivity 4n.alysis WlU, carried out by incorporat.l.n; 'best guess' valuca f(u rbC9.nt e.ontt\s into the apr4uulabeot to a110" tvo variable. to be cb~'U'l9.d while hold1n9 tvo v>IIrl"blea cont)tant. «lb8 'beet gU$SS' •• lU.8 dr. :,a)ton t.o be C:$2. 3£ for t.ho Can:lldian Fon p'tice (0.11\9 tha _v6:ag1l of t.he t",,'O estimateS! above); $.2.69 foz: tbe It.u.strali.an wholetl'aln prie-a (being the JOy 1990 clItiona!. averaqe); an excbatulC r4te of A~1.00 .. C$0.9.216 (be.l.rn; the exchange rat() at the I!nd of June 19~!.'H; and a tra.nsport ccst of eo. :tnlk; (bttlog the west coast tr:4nSptu"t cost w'ith A,u3tral!,40 vhDrtago charges inelud .. ,d). The reaulta er~ !)utt'.marlsed bolo. 4nd §.n "tables 1.1 .. 1.2 .nd 1.3 tn ApfK\ud.lx 1-
iimul!!~,h,~n ~
For tbis caso, tho eKchango rato iln:li tl'anspo~t cost woro ~o.la eOhstant at the ' ooat q:tJo~u~# vI,dues, with tho C4nGdla.n FOSano Au,str41!an ttlholes41e pt'ice ttoiftg vA,rica. TM reaults shotlji that tt.tde bec.c_:t ~t'e {-castnl. with a hlqber Aua.t~.lLan .bole:u~lo pr1co and/or 4. lower C1uuldian 1'08 prteo. For (ue'8Rple, vtth tho 91v~m e.xcb.angt.l rate a.ld tran13port ccat, 1f tbe' AU8t rll 11lu' wholesale prlee 1s qf:fl,a.tOt t.h41ft $3.0(/)(;9, tb&n any Cana41an FO'S pr ice under C$2. 49/k9 .would t'.\.~ko the t rado fcaa£blCil. 1 t tho Aunt raltan pr.ice 15 S2. 70/k9., f.ben tho Canlu:Uac pri.ce would havo to be under (:$2 .20/~~ for tho t fAde t@ OOCt)ff;O vlQble.
Sirnul~tion "
'this sl:::mlAt.ion hold tho Auatr611.An wholosa\e price and e .• chango s:,ftto ct,1"l:staut at tho t tJ:.cet gUfl3S' valulills wbilo ,,4.,)'ln9 the Caruldla.n "08 price .and the t J:<lllnSP-OI't. cost. It V85 found that low valuO.8 of the Canad.ian ron price 'Wtlluld n'.IIko tbo t rado foasl.bl0 tthun Cc::.bblod vitb low tran%lpOltt cotJts. Fo:,e (uti.'lfi';plo., wit.h tho given AU8'tl"allao tdtolOSD10 prico and Qxehar.9Q rat4S; it the CtM\i:u,11&n r08 price was <:$2.2G/k9, tb<m IJ-ny transptltt f:oat below $O.30Ikg would tMk. UtO trade feaelbl,e. Sl$.tlacly, if the transport. cost vert) to fall \.0 GO .2~/kgf them C~t\ll'.dlan pl'clee& bellOW C$.iL29ikt; would make the t;,adD oe'l£llne..~j.cally !aasibltr.
~~
Tb~ f lfth 5i~1.iile!1tlcn inyolved bolding the tr.fu~port cost and AustrAlia*, ~~\ H~~ole pric.g at the'b$st, 90SS8' V41tUl8 .~,tle vatyi,ng til." Canadi.an "ii"ilU ~ ice with t.be exCh4rtg@ rate. 1t. V#3 tcu~d that a 5t::enG Aust:'al.LaD .jl)l t ~ .... ~ith tospt'tct to tho CaruuUen dollar, vr;uld bo nood;nd v1tb .. 10101 Canadian pt iIC0 before ic,port'..o. (;iI.! pi~4t vtlruld becamG v.1~.ble. Fer exa:r.pl.t an ex,ch.at\l1!it'l r~to 4.~f A$l.OO ... <:,00.' b~ or <\it04tOl' \rfuuld a:: .. :ail:e the t:rado viable fo.r Canadian prlc;o8 undo:&' C$2.30/k\l.
Q ,I CilltU. ~?n 6
tbissimulat.1Q;D varied the o.lliu:h&n9fJ ratQ 49alm'lt thO Austra·ll,ffc .,bol.esal0 price. Tr4nspntt costa and t.h$ C,.nadlan Foa price ~ro b:eld con:u: ... nt at tht-,lr: r~3~ctive 'bast 9UO~tf,' values. Tho r:·4su.lto in4ieat~ that " :St.~on9 tinl"ar and & td.t;h AU;$tralian prl~~ ec=:bin4tl<1tl lI~Qld t'Ulke .btp!:U:tlfllg c.n.~U~n pl.g.i':l(Hlt !frl-1blfJ. Fez ex:er.plo, an Australian prl,e-o 9lteater tl'utn $2. SO/kgc~ined with an O~Cb4rujO f'ato h19hor tban (:$0.945 Vl1)uld _to tbo tt'~ ocoumJI'1ie.ally foald.blG.
~ !t:''''i \,",,191) '1
This at::uJl,atiQ:' held tho ,k.Jstcallan wholesale .00 C:,anadian rCBp.c1eea ecn8t.ant. at 'best quOtlt8' valuol) while ehan91nq t.he traftsptl:t coat and •• ebatl;e "At.U$ • It WIUI found tl'Utt VOl")\' bigh ~Jt1!'bAn9. 1t:4tetiJ would noed to M cpe:r41ft.lq wltD loW' tr4n#port Cost3 bo:hu;1I\l tho $r..port5 ~tlld be"C~ te ... lble.ro.t' exmtple, vl,tb AUIt.raU.an and Canad.ia.n prir.:ea at. $2.69 and Cf=' ~ l 1"1' kl1crgr •• respect 1901y. an exehangG rato of A"l.OO .. (:$0.9'7S wotdd aoly ......... ow t:r •• t@ .be fOA,ldbltfl i ftt"..o t.l'anoport eo:..st _44 bolcv !)~. 211kq .
il~* itt ~ 10 n •. it Thla final tuc:ulatlon .U'~flolvctt vA"y1ng tho Auatr.lll.ac "bole.ale pa,lc:.
witb respect to UiO tr:tUllpt)r.T. coat. Tbo Can.cd14u'i rca price And.jCeb.n~. tate wore bold at tbe 'beat quoss' valuQa. 'fhe ".aulta he It'll. aU9Pil~U~.t hIgh AtuI;t"altan pr!.ce8 and It::Jv tran$,POrt. cost.a art) neeeata4ry before tr •• ~~a via.bhJt. ''''\In' (ucazr.ple, at.ly Alustra1141n p.:::lco above 12. 85/k9 a;i;oltrade oeorncm.lcall.y toaslbl0 if t.1I!4USport ~o.st$ 4:-0 tlie:l·@v ~O .ISlkg.
'r:b:021Q IJbt;~.d.t.lctHI) do nGt pro'?ide all the an:swo'Cat.o the .co:ne~le toaDlbl1it.y t:llf tl"adG 1n pl.~4t betwoen AustraliA lind Can.da. fI.ovever, they ~ provide thO b ... ek9I'Otlt~~ fol' a~ l~rt.nt e~nc.h.\ilJ1C\n5.
Tho oxebar.;o rate OOt.Wf.)on Aual ::.lia and C.nA~. 1& enl, (J;tt:. ma'o:r .tnthsenco cn J~ot{!nt1.1 t.lrade oot~n tho two e.ount.t"ills. 1'1"'.- pl':ic •.• , both wb@losal@ in A~st 1'4114 and "(t~ in C4n4da.. are alao ft:ry lnf'lue3ttal. 1he tref.l:spo:n. cost 19 of 10:1$ 1:;r,p'O.fttu~.e.o si:lqllly OOe.lIU$.O 1.·1.'90 elumfea .~o ~lr.d t@ the pee container e05t, bct("llro t..bi$ t-.;4S a tt.lp.Ull!:'ulnt lm.flue~=:e at _per kl1&'9ltam 10vol. fUm.11al'ly, tbo Q:xlir!han~., tato bet-un Autltr ... J.l.- and t.he US I. td.3Q l~ea .ltr,portant. 'or o .. ~le t;;ho AU3t1'41!an d,f)11a.r Wi.i:l1uld bav.to tstrenqthe.n fOf US$0.18 to ij'S~O.83 to 1011101' t.he t.l'anap,of:t (:0:11:. fl'o='.I $O.3C/1tg to GtJ.28/k9. Ilovovor, tho US (il)llar N'y pr@vide int1~,r-uct filff'Q:ctson the t('tl,&lbl1.1tv of trado thl'@uqb Its influen:J!G ~n bCtb the Aust.l'aU.ilU\ and ean'4!d.lan c~~:m~lC8 . Tb.tt le, the Canadittn dlll1ar is g'ooorall.,. fairly IJt;iJbl. witb rospotet t.O tho US (11)11.41' while t.he Austl"aU.4tl 00114: tends to be) m.o::eun.t .. "le.
T(j lIuai1!tl .. 'U'iao U~& rcaults, '~.rt.D @f Unpl'MC5Bod C·4uutd1l1n pi.91fIOat are ~r$ U.kc1V t..O oceul':
a) The 10\1'0: tbe C.&nddian f'QB price [email protected] p1.~.tl
b. Tho hi9her t.he Austra.U.4n vholoaalo p.rtc'O of pnrk:
e» The at lOR9Or tho 14us.t ra1. 1,an dol1tu' v1 th roe,peet to botb the Can.adian .n.d US d:ol1.u·tu 4,,(1
d) Tho lower tho C~3t of tof r: igorated t rilu'UJptllrt bot"en Canada cnd Au.stl'alJ.4.
The ' best 9ue:I!UJ# 'fIl!lfJQ;8 of theJJo variAb.les were C$2 .. 36 fer the C.anadian Fon pr.!co, $2.69 for tb~ AlI;tstraU.aD na,t!cnala',n:u::a;f: wh(),ltuualo pe1e., 1.$1 .. C$O.9216 for t.he e.x.eban110 r: .. t.o and ,f,U)'30/k9 fer: tho tl~nsporteo.$t. At t.tc(tso 'bea:t 9uo,s.:l' ".,luG', th,(t pr:i.ca dU'ferC'oti.41 VAS :fou . .r.d tlfl bt.t -0 .. 1' CAS). Tbit) v41uo i.e:pllcUl that tho tt .. de 18 oeonlD'mical,ly infcas·tble.
51 ~
'fbl.$ acct.l.on 41~ to ~utU,ntJ the e~Qn4'}mie etfe:ct.l of varyln, bypot.h(u'!iitH!d lGv(l'l~ of 1w;p@rt$ o.f unproo.0380'd C4ftadlan pl~~.t. on tbe Au_tr:alJ.lln pt.; industry. An ~co:n~td.e ~el ot tho Aastraltan Indu.ilJt.:y i. uHd to show the atgrf;qate ef.feet.a em k.oy il1du.st: ry varlablos tprcduct.1oa,. d~nd, farm and feta!l pri.cQ:J and l.ndustry ro·venuaa).
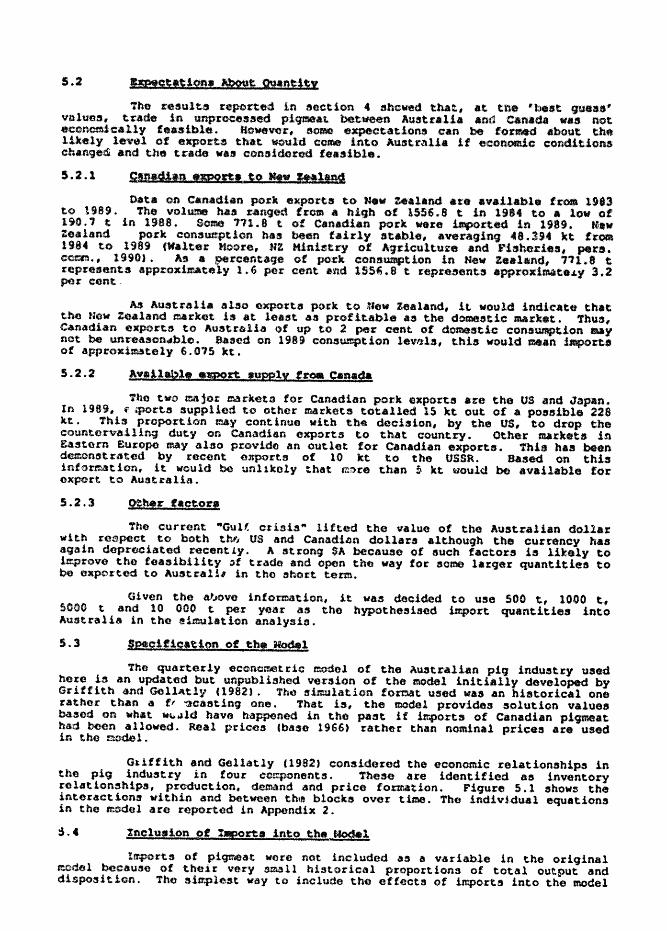
The results reported 1n section • :shewed tba.t, at tn. 'best. que,s' vtll,uo.:I, trade in unproc.18.:u,ed pi9'Ml!aL betveen Auatrililla and C.nada WAS nlQt eeonamically f ... .sible. Hovevar, some turpeetatlon8 can be for.rliitd about the 11k8.1y levtd of exp0l:ta that would eo_ into Au.stralia 1f economic condition" ct:u.n9~ and tbo trade wall eoftlticiermi fea.si.ble.
5.2.1
Data on Ca.nattl.n pork experts to ne., haland ate ava.!14b1. from 1983 to 1989. The volu.i!fe b4.8 ranged trom • hi.gb of 1556.8 t in 1984 to .. low of 1 iO . 1 t 1n 1988. Some 111.8 t of Canadi.an pork we!!e 1I'lporte4 in 1989.. N._ Zealand po.rk eo.ftsW'!ption hall beentairly at.able, Averaging 48.394 kt fJ::orA 1984 to 1989 (Waltor Moore, HZ Ministry ot Agricultuze and Fiabtu:le.s, per •• c:o:e;p., lS90). AD a ~rcentage of pork con!lWl\ption in Hew zealand, 711.8 t s:epre:sent.1J appzoxitr.ately 1.6 per cont and 1556. a t repre.aent8 approxlsutG.LY 3.2 per cent.
M Auatr.al1a also exporta p.odc. to new zealand, it. would indicat. that the tlcw Zealand market 18 at lea:st aa profit.able 45 the domestic ur:k.t. 1'bu4, Canadian export.a to Auatr&lia of up to 2 per cent of domestic consw.ption may not be unreason4bllD. Baaod on 1989 consumption l.ewd.s, this would mean i,mport .• of approximately 6.075 Itt.
5.2.2
Tho two ft"AjQt markets tOt: CanAdian po%:'k expotta are tho US and Japan. In 1989" f'iporta supplied to other markets tOltAlled IS kt out of • possible 228 kt . This proportion may cont lnue w.ltn tho deci:sion, by the US, to drop the courU:.e.rva.l11n9 duty on Canadian expruts to that count.ry. Other marketa in Eastorn Europe may a.180 provide an outlet f·or Cana.dian exportts. Thi" has been dc:m:onstrated by rec·ent export.s of 10 kt to the USSR. Based on this intor::r.ation, it would be unl Uc.oly t.hat rz:.1>re than !\ kt tlould be available for oxp,ort to AuatraU,a.
5.2.3
The current "Gulf. cd.aia" lifted the 'Value of the Australian dollA.r with re~pcct to both Utl'1 US and Canadi4n dollars although the currency has 4g-ain dopreciated recent Ly. A strong $A because of :such fact.ora i3 likely to It:t.prove the feasibility :>t trade and open the vay for: some largor quantities to be expol,tod to Australh 1.n tho short term.
Given the VJOVO i.nforr"..4tion, it was decided to use 500 t, 1000 t, 5000 t a.nd 10 000 t per year ,U) the h.ypothesised 1sr.port quantities into Australia 1n tho eimulat10n analysis.
S.3 Sf!clflcatl"n of the No<Sel
The quarterly econametric: C'.Qdel of t.he Australian pig industry \Iced hore i:s an updated but unpublisbed vora1on of the model .initially developed by Griffith and GellAtl!l «1982'. Th.., •. 1mulation fOrnlt used was an hietorical one rather than a f, ~ca8ti.ng one. That 1.a" the model providea solution values baaed on what lItu ... ld have happened in the past if .ur.ports of CanAdian pilJmGat had been allowed. Real prices (base 1966) rathe·r than nom.!nal price:s are used in tho fWdel.
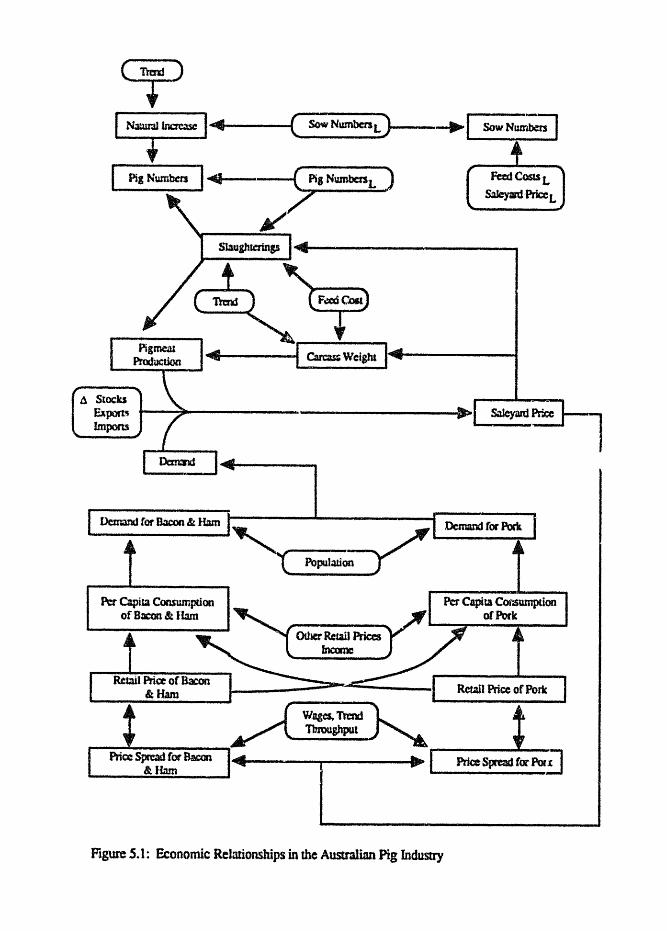
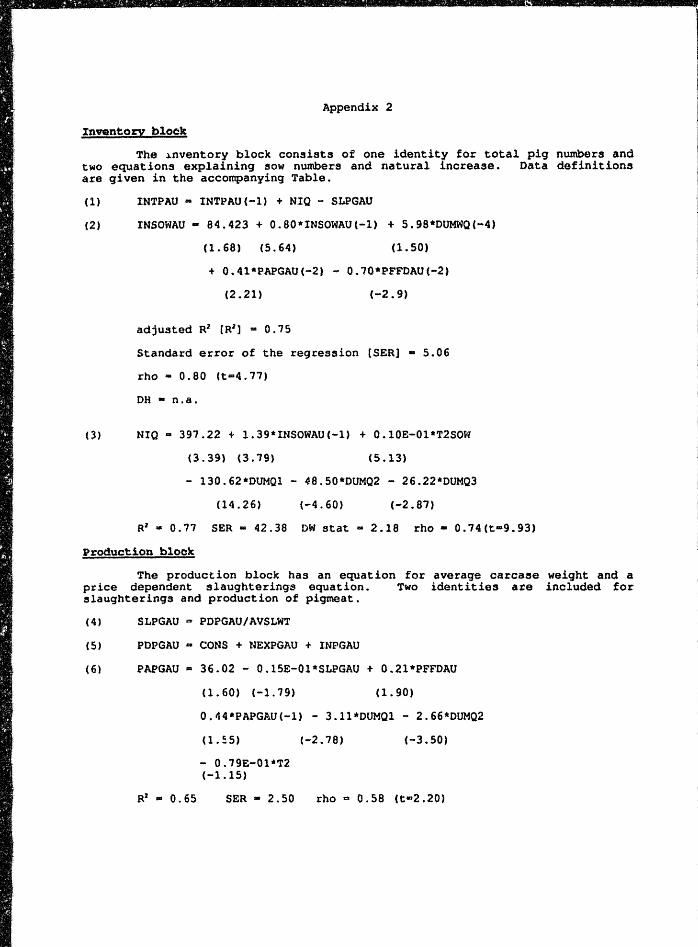
Gt.iffith and Gellatly (1982) considered the economic relationships in the piC; industry in four co!t.ponents. Those are identified IU, lnventory rel.4tioRsb.ips, pl'oduction, demand and price formation. Fiqure 5.1 show5 the interactions w1thin and between UH~ blocks over ti.ane. The lnd1v!dual equationa in the ft'..odel are roported i;n Append.1x 2.
:i. 4 Il'1elu.,i2ft of I!p9rtllf into the Uodel
ttT.port3 of pic.;rmeat were not included as a variable 1.0 the original reodol boc4use of theJ.r very small historical proportions of total output and. disposition. The 81:r;pl~st way to include tho effects of isr.portlS into the model
A Stocks Export~ t---:iiIIII---------------., S11cyard PrXe 1-.......,
JmportS
,,---\.. Population
Figure 5.1: Economic Relalionsmps in the Ausualian Pig Industty
wi,ltS to add i.mports into exports to 9i ve net exports. This led to a c;hange in the supply/demand identity for production of pi~at as noted above (Equation 5.5) .
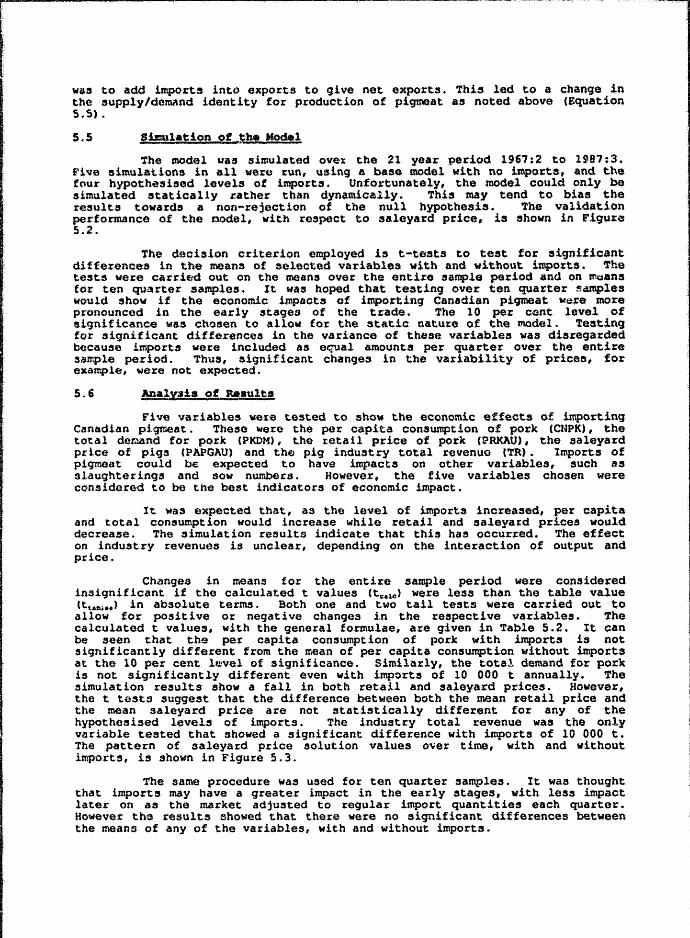
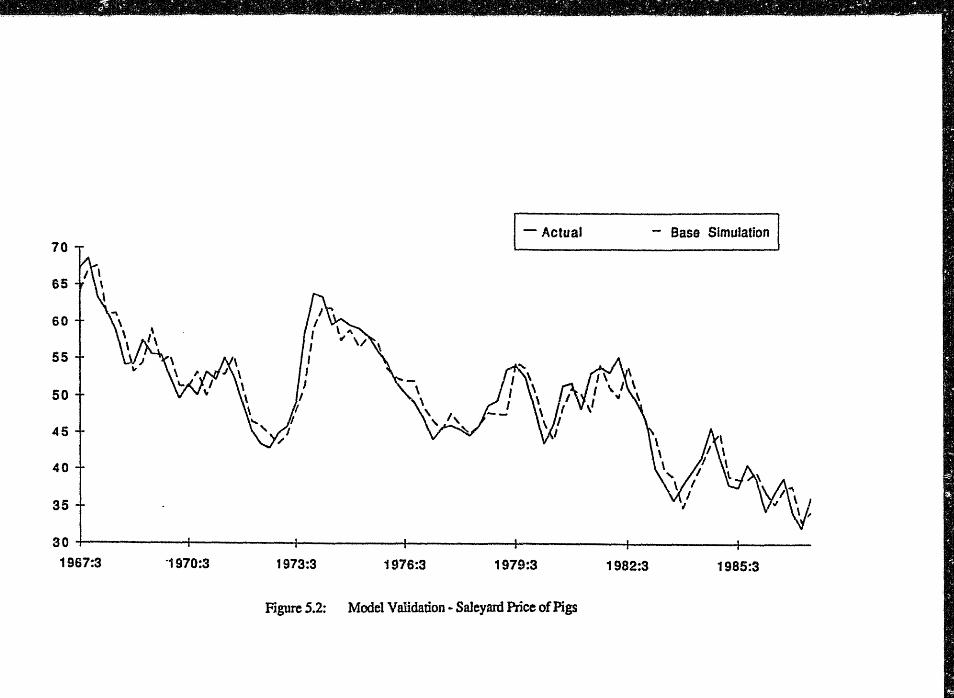
5.5 IlatlatlOQ of .~H Moal
'the model \lall simulated ovex the 21 year period 1967:2 to 1981 :3. Five sim.ulations in 411 wet~ tun, using Il baae model with no impot:ta, and the four hypothesised levels of importtS. Unfortunately, the model could only be simulated statically rather than dynamically. This may tend to bias the results towards a non-rejection of the null hypothesis. -.rhe validation performance of the DOdel, with respect to saleyard price, ia shown in Figure 5.2.
The deoision criterion employed is t-teats to test for :siqnificant differences in the means of selected variables with and witbo\,lt imports. 'The testa were carriftd out on the means over the entire sample period and on me.os for ten qu.arter samplos. It was hoped that testing over ten quarter ~amples would show if the economic impacts of importing Canadia.n pigmeat we.-:e more prunounced in the early stages of the trade. The 10 per cent level of significance waa chosen to allo~ for the static nature of the model. Testing for :significant differences .in the variance of theoe variables was disregarded because impor.ts we.re included as equal amounts per quarter over the entire san-p1e period. Thus, significant changes in the variability of prices, for example, vere not expected.
5.6 Anal!!!. of Re,ult$
Five variables wete tested to show the economic effects of impol:ti.ng Can&dian pi9J'Geat. These were the per capita consumption of pork (CNPK), the total demand for pork (PKDM), the retail price of porle. (r?RKAU), the saleyal:'d pri.ce of piqs (PAPGAU) and the pig industry total revenue (TR). Imports of piqmoat could be expected to have impact.8 on other variables, such a8 slaughterings and sow numbers. However, the five variables chosen were considered to be the best indicators of economic impact.
It was expected that, as the level of tmports increased, per capita and total consumption would increase while retail and saleyard prices would decrease. The simulation results indicate that this has occurred. The ef.f(Sct on industry revenues i:s unclear, depending on the int.eraction of output and price.
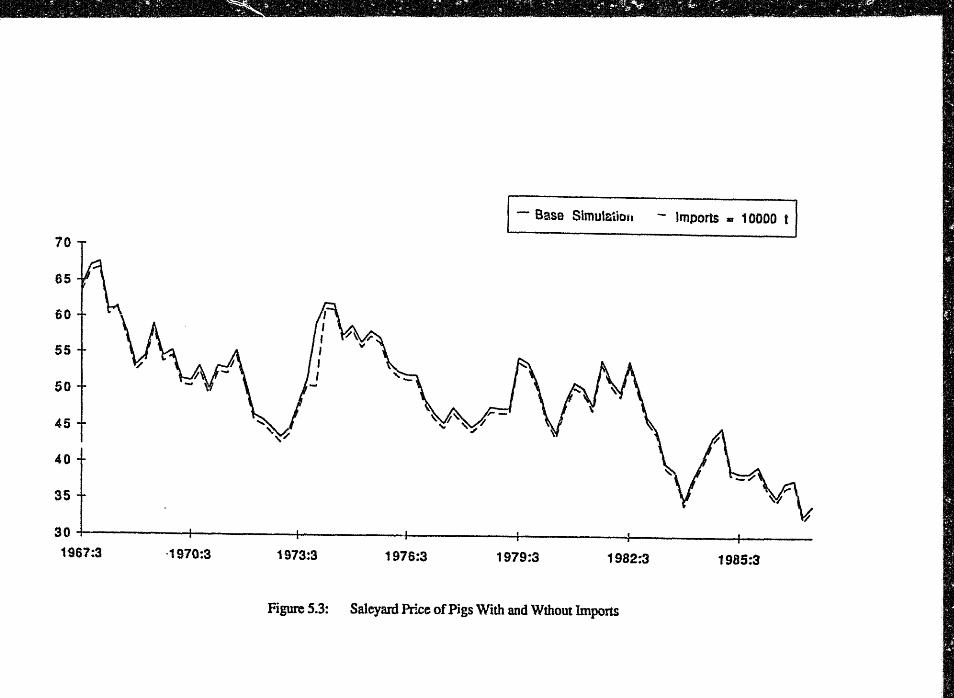
Changes in means for the entire sample period we.re considered insignificant if the calculated t values (tu1C ) were less than the table value tt ... "'i .. ) in absolute terms. Both one and two tail tests were carried out to allow for positive or negative ch.angos 1n the reapective variables. 'the calculated t values. with the general formulae, are given in Table 5.2. It can be fleen that the per capita consumption of pork with imports is not significantly different from the mean of per capita consumption without imports at the 10 per cent level of significance. Similarly, the total demand for pork is not significantly different even with imports of 10 000 t annually. The simulation results show a fall in both retail and saleyard prices. However, the t tests suggest that the difference between both the mean retail price and the ~an saleyard price are not statistically different for any of the hypothesised levels of imports. The industry total revenue was the only variable tested that :showed a significant difference with imports of 10 000 t. The pattern of saleyard price solution values over time, with and without imports, is shown in Fiqure 5.3.
The same procedure was used for ten quarter samples. It was thought that imports may have a greater impact in the early stages, with less impact later on as the market adjusted to regular import quantities each quarter. However th@ t6sults showed t.hat there were no significant differences between the means of any of the variables, with and without imports.
70 [~Actual - Base SlmulatiDn I
65
60
55
50
45
40
35
30
1967:3 1970:3 1973:3 1976:3 1979:3 1982:3 1985:3
Figure 5.2: Model Validation .. Saleyard Price of Pigs
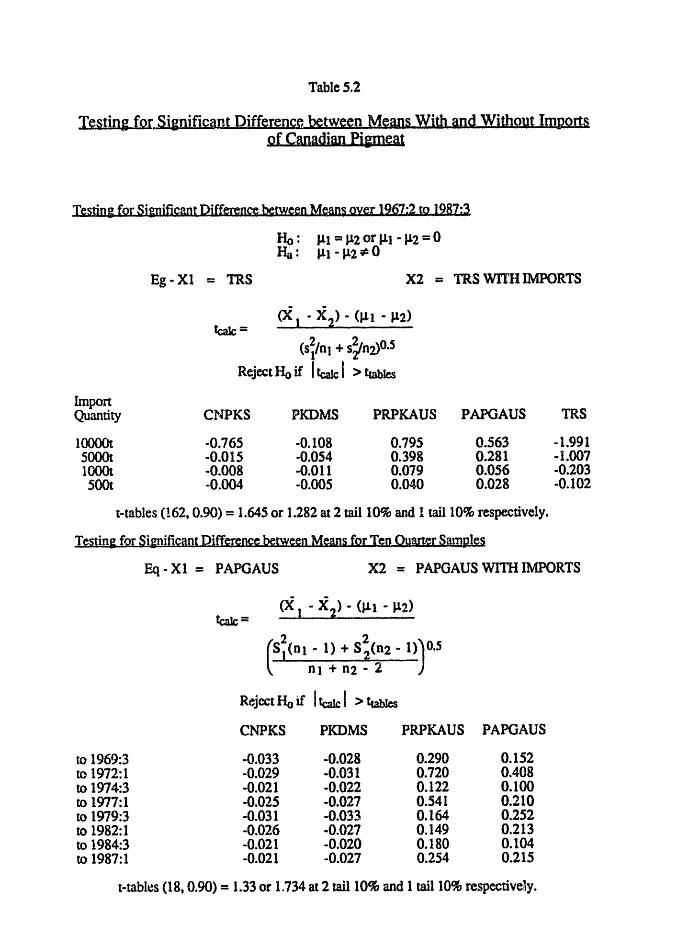
Table 5.2
TS}sting for Signjficant Difference between Means With and Without ImRQrt& of Canadian Pigmeat
TestiDI: for SiiDificant Difference between Mans oyer 1967:2 to 1287:3
Ho: J.l.l = Jl2 or III -1l2 = 0 Ha : J.l.l .. 112 ~ 0
Eg-Xl = TRS X2 = TRS WITH IMPORTS
hnport Quantity
lOOOOt sOOOt lOOOt sOOt
(si/nl + s~nVO.5 Reject Ho if I fcalc I > tumles
CNPKS
-0.765 -0.015 -0.008 -0.004
PKDMS
-0.108 -0.054 -0.011 -0.005
PRPKAUS
0.795 0.398 0.079 0.040
PAPGAUS
0.563 0.281 0.056 0.028
t-tables (162, 0.90) = 1.645 or 1.282 at 2 tail 10% and 1 tall 10% respectively.
Testin& for Simificant Difference between MeanS for Ten Quarter Samples
TRS
-1.991 .. 1.007 -0.203 -0.102
Eq-Xl = PAPGAUS X2 = PAPGAUS WlTIllMPORTS
to 1969:3 to 1972:1 to 1974:3 to 1977:1 to 1979:3 to 1982:1 to 1984:3 to 1987:1
(S~(nl • 1) + S~(n2 • 0)0.5 nl + n2 .. 2
Reject Ho if I fca1c I > !tables
CNPKS PKDMS PRPKAUS
-G.033 -0.028 0.290 .. 0.029 -0.031 0.720 -0.021 ... 0.022 0.122 -0.025 .. 0.027 0.541 -0.031 -0.033 0.164 .. 0.026 .. 0.027 0.149 -0.021 -0.020 0.180 -0.021 -0.027 0.254
PAPGAUS
0.152 0.408 0.100 0.210 0.252 0.213 0.104 0.21S
t-tables (18,0.90) = 1.33 or 1.734 at 2 tail 10% and 1 wi 10% respectively.
;'. ,:~_,,_.1;' ,',",' ,,';'_":"', '. ':, ~,::~
- Base Simulation - Imports .. 10000 t
70
65
60
55
50
45
40
35
30~--------~----------~------___ +-________ -+ __________ ~ ________ ~ ____ __ 1967:3 '1970:3 1973:3 1976:3 1979:3 1982:3 1985:3
Figure 5.3: Saleyard Price of Pigs With and Wthout Imports
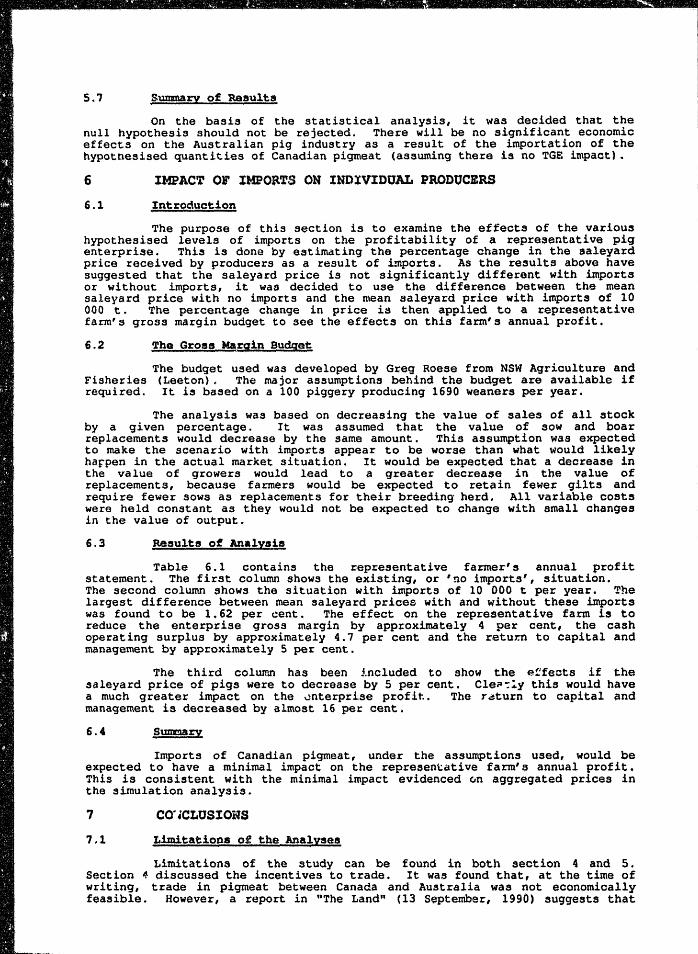
5.7 Summary of Results
On the basis of the statistical analysis, it was decided that the null hypothesis should not be rejected. There will be no significant economic effects on the Australian pig industry as a result of the importation of the hypotnesised quantities of Canadian pigmeat (assuming there is no TGE impact).
6 IMPACT 01' IMPORTS ON INDIVIDUAL PRODUCERS
6.1 Introduction
The purpose of this section is to examine the effects of the various hypothesised levels of imports on the profitability of a representative pig enterprise. This is done by estimating the percentage change in the saleyard price received by producers as a result of imports. As the results above have suggested that the saleyard price is not significantly different with imports or without imports, it waa decided to use the difference between the mean saleyard price with no imports and the n~an saleyard price with imports of 10 000 t. The perce.ntage change in price i::s then applied to a representative farm's gross margin budget to see the effects on this far.m's annual profit.
6.2 ~hQ Gross Margin Budget
The budget used was developed by Greg Roese from NSW Agriculture and Fisheries (Leeton). The major aasumptions behind the budget are available if required. It is based on a 100 piggery producing 1690 weaners per year.
The analysis was based on decreasing the value of sales of all stock by a given percentage. It was assumed that the value of sow and boar replacements would decrease by the same amount. This assumption was expected to make the scenario with imports appear to be worse than what would likely harpen in the actual market situation. It would be expected that a decrease in the value of growers would lead to a greater decrease in the value of replacements, because farmers would be expected to retain fewer gilts and require fewer sows as replacements for their breeding herd. All variable costs were held constant as they would not be expected to change with small changes in the value of output.
6.3 Results of Analys!!
Table 6.1 contains the representative farmer's annual profit statement. The first column shows the existing, or ,~O imports', situation. The second column shows the situation with imports of 10 000 t per year. The largest difference between mean saleyard prices with and without these imports was found to be 1.62 per cent. The effect on the representative farm is to reduce the enterprise gross margin by approximately 4 per cent, the cash operating surplus by approximately 4.7 per cent and the retu~ to capital and management by approximately 5 per cent.
The third column has been lncluded to show the e!.'fects if the saleyard price of pigs were to decrease by 5 per cent. Cle~:~y this would have a much greater impact on the \Jnterprise profit.. Tho T~turn to capital and management is decreased by almost 16 per cent.
6.4 S~ry
Imports of Canadian pigmeat, under the assumptions used, would be expected to have a minimal impaot on the repre5en~ative farm's annual profit. This is consistent with the minimal impact evidenced un aggregated prices in the simulation analysis.
7 co· iCLUSIOHS
7.1 Limitations of the Analyses
Limitations of the study can be found in both section 4 and 5. Section ~ discussed the incentives to trade. It was found that, at the time of writing, trade in pigmeat between Canada and Australia was not economically feasible. However, a report in "The Land" (13 September, 1990) suggests that
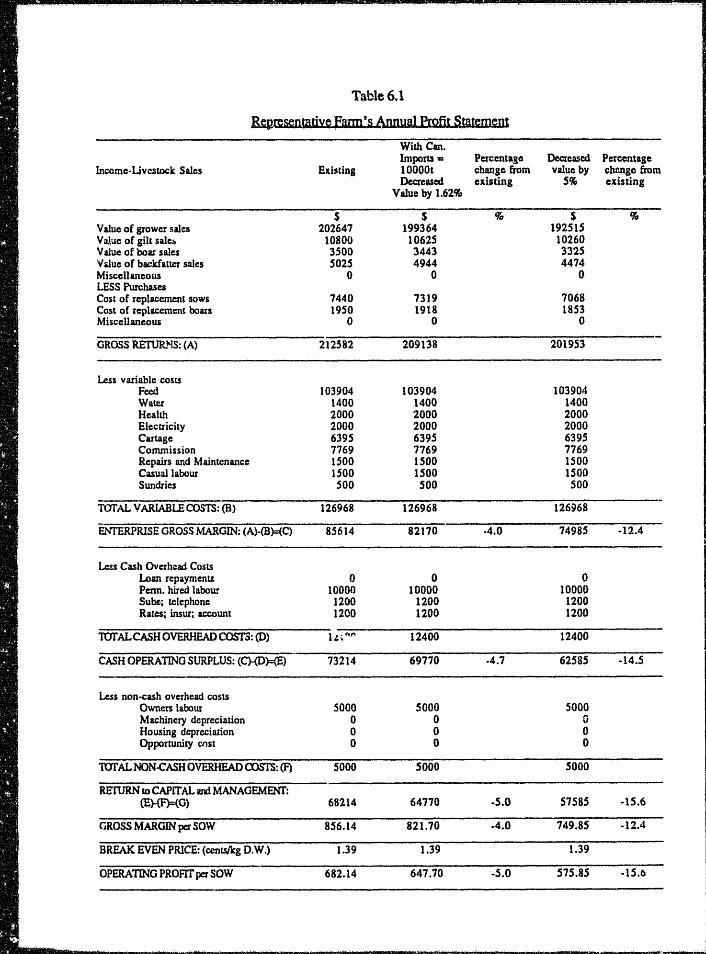
Table 6.1
~~Drati~ Bum's t\nm.ud fJ:afit Sra"Wt:Dt With Can. Imports- Petcenta!~ Decteas!:d Percent_ge
lnccmc-Uvcstock. Sales Exbting 10000t change from value by chnnge from Decreased existing S% existing
Value by 1.62%
$ $ % S 9:, Value of grower sales 202647 199364 19251$ Valae of gilt sale:. 10800 10625 10260 Valae of boat sales 3500 3443 3325 Value of backfatter weI 5025 4944 4474 Miscellaneous 0 0 0 LESS Purchases Cost of replacement sows 7440 7319 7068 Cost of repla.cemen\ boars 1950 1918 1853 Miscellaneous 0 0 0
GROSS RE'flJR.NS: (A) 212582 209138 201953
Less variable costs Feed 103904 103904 103904 Water 1400 1400 1400 Health 2000 2000 2000 Electricity 2000 2000 2000 Cartage 6395 6395 6395 Commission 7169 7769 7769 Repairs and Maintenance 1500 1500 1500 Casuallibour 1500 1500 1500 Sundries 500 soo sao
TOTAL VARIABLE COSTS: (B) 126968 126968 126968
ENrERPRISE GROSS MARGIN: (A)-(B)=(C) 85614 82170 -4.0 74985 -12.4
Less Cash Overh.:ad Costs Loan repayment& 0 0 0 Penn. hired labour 10000 10000 10000 Sube; telephone 1200 1200 1200 Rates; insur; account 1200 1200 1200
IDrALCASH OVERHEADCOSI'S: (0) 1"~ f\J'\ 12400 12400
CASH OPERATING SURPLUS: (C)-{D)::(E) 73214 69710 -4.7 62585 -14.5
Less non-cash overhead costs Ownen labour 5000 5000 5000 Machinery depreciation 0 0 0 Housing depreciation 0 0 0 Opportunity c.(')st 0 0 0
101' AL NON-CASH OVERHEAD COSTS: (F) 5000 5000 5000
REIURN toCAPlTAL and MANAGEMENT: (B}{F)=(O) 68214 64110 -s.n 51S85 -15.6
GROSS MARGIN per SOW 856.14 821.70 -4.0 749.85 -12.4
BREAK EVEN PRICE: (centslkg D.W.) 1.39 1.39 1.39
OPERATING PROFIT per SOW 682.14 647.70 -S.O 575.85 -15.6
imports of about 180 t are due for delivery in Sydney and Tasmania. Several reasons oan be outlined that explain why these imports are taking place despite the results obtained above.
First, the Australian dollar has ~ppreciated signifioantly, with respeot to both Canadian nnd US currencies, since the end of June, 1990. "The Weekend Australian" (29 Septernbe~, p. 49) puts the Australian dollar at C$0.958 and US$O. 827. However, by t.he analysis in Section 4, the price differential would still ~ -0.06 $/kg so the trade is still not economically viable.
Second, it may be possible that an importing firm is bringing lr. Canadian pork at a loss ju~t to test out the Australian market reaction to tho Canadian product.
Third, the analysis did not take into account the price difference between primals. That i." it is expected that mainly leg meat would come into Australia because the re~t of the Canadi dn carcase is considered too fat for Australian consumers (The Land, Septdmber 1990, p. 19). The leg cut is particularly expensive in \ustralia (R. Sewell, pers. comm., September 1990). Thus, if the Canadian price fo:: .leg cuts is significantly cheaper, the trade may be economically feasible. These data were unavailable at the time of writing.
Finally, the pork prices used in the analysis were estimated as Canadian and Australian national averages. As well ae di3r.egarding the differences between primals, the prices used did not take into account regional differences in both Australia and Canada. It may also be said that the prices reported in AMI~C and similar publicdtions may be significantly different from those negotiated by individual importers and exporters.
In Section 5, the model used was run in a static format. This means that the model is limited because it is unable to show the full supply response effects of the changes in prices, especially over the longer term. Another limitation is the fact that imports were specified to enter the Australian market as equal quantities each quarter over the entire sample period. It may be found, in the real situation, that a relatively large quantity could come into Australia in one quarter with no imports in the next quarter. This would be expected to have a more disruptive influence on the Australian pig industry, possibly leading to lower and more variable prices received by producers.
7.2 Conclusions
As shown in Section 4, the important varl.ablea in determining the feasibility of trade are the exchange rates between Australia and Canada, the Canadian FOB price of pork, the Australian wholesale price of pork and the cost of refrigerated transport between Canada and Australia. Although there are some limitations to this analysis, trade in pigmeat between Canada and Australia was found to be economically infeasible. Thus, the level of imports is likely to remain low.
Should imports enter the Australian market, processors may b~ perceived to benefit from slightly lower saleyard prices. Consumers would be unlikely to see much benefit from this, although the model has indicated that retail prices will fall marginally. Producers would suffer small losses, increasing as the level of imports increases.
The results of this research suggest that lifting the import restriction of' Canadian pork carcas~es will have a limited impact on the Australian pig induBtry.
7.3 Sugqostions for Further Research
All of the limitations, outlined above, form possible areas for further research. In particular, data could be updated to include the price differences between the primals for both Canada and Australia as well as some more accurate Canadian export prices.
Another obvious ;. ea for further research would be to upgrade the model to run on a dynamic oasis, thus allowing the full supply effects of the changing prices to be she n.
Aside from j .tprovements to the work already carried out, another important area for .Jrther research lies in the disease risk aspect. In particular, an ana' Isis of the risk of TGE entering Australia through the imported piqrneat Jould be coupled to an economic analysis to show the possible effects on produc\.!-s if an outbreak of TGE occurred.
REFERENCES
ABARE (June 1990 and earlier issues), 'Pig and poultry meats', Agriculture and Resources Quarterly, 2(2), p. 119.
(1989), Estimated Trade Effects of Removal of Ban on Pigmeat Imports from ---- Canada, Unpublished report, Canberra.
Australian Bureau of Statistics (1988) I Imports, Australia, Annual Swrunary Tables, Catalogue no. 5426.0, Canberra.
1990 a, Li ve 5 t 0 c k and Li ves t,~o;.:;:c:.:.;:k=---::..P.:;.r.:::.o.:::.d.:::.u.:::.c-=t.::::s.,_...:A:.:.u=s.:::.t.:;.r.:::.a.:::l.:::i.::::a:.r.' ___ 1.:;,9.;;,8.;:;,8_-.:;,8,.:;.9, Catalogue no. 7221.0, Canberra.
________ ~~(1990b), Agricultural Industries, Structure of Operating Units, Australia, 31 March, 1989, Catalogue no. 7102.0, Canberra.
____ ~(1990c), Production of Food, Drink, Tobacco and Stock and Poultry Food, Australia, Catalogue no. 8359.0, Canberra.
~griculture Canada (1990 and earlier issues), Market Commentary, Market Outlook and Analysis Division of the Policy Branch, Ottawa.
Alberta Agriculture (1990 and ear lier issues), Livestock Situation and Outlook, Market Analysis Branch, Alberta.
Anon (1990a and earlier i~sue8), 'Government says ban must go', The Pig Farmer, 24(7), 2-4.
Anon (1990b), 'Summary: Exchange Rates', The Weekend Australian, 29 September, p. 49.
Australian Meat and Livestock Corporation (1990 and earlier issues), Market Notes: Livestock and Meat, No. 765, Sydney.
Australian Pig Industry Delegation (1990), 'Transmis.:iible Gastro Enteritis; A Report based on the ~ indings of the Australian Pig 1.:ndustry Delegation', Unpublished report, Canberra.
Bennett, C. (1982), 'The changing Australian pig industry', Quarterly Review of the Rural Economy, 4(41, 313-323.
Doran, H.E. and Guise, J.W.B. (1984), Single Equation Methods in Econometrics! Applied Regression ,l'.nalysis, University of New England, -Armidale.
Doti, J.L. and Adibi, ~. (1988), Econometric Analysis; An Applications Approach, Prentice Hall, New Jersey.
Gill, R.A. and Griffith, G.R. (1987), Market Structure of the Australian Pig Industry, Division of Marketing and Economic Services, NSW Department of Agriculture, Research Workpaper No. 11/87.
Graham, V. and Rowlatt, M. (1990), , I='irst Canadian pork shipment next week', The Land, 13 September, p. 19.
Market teg and Economics, tkJv Gout Aqf'ieult.ure, M18collaneous Bulletin No.
Moat and AllLed 1'l'ade:l!I federation of Australia (1990 and earlier itUSUGs' f ?h! ~"l!Ml H~./Ilt Ind~U'5\tY ~hlll."ln, 13 (6), p. 54.
Pl.ndyck, R.S. and Rub.lnfeld, D.L. (1981), liqonomt.1tric Hodn!" lmd t;9on2~t:tlc f'$lt:z'f':!!f(tUU;'s, 2nd Ed., M::Graw Kill, Sydney.
Rya~"'Clark., F. (199(H, , tlow Canad<) (:ttu:ked the Au~trol.lan pork market', l)~l~tf""l&!!n nuS""l T1mtR, AU9uat 9 - August 15, p. 26.
Resol"ve8ank of AU6t r411a U 990 and earlier 140U(8), fiS'tn!ui:VQ n~.n!; of "Mlt rnU! ftuUnttn, Rclllerv(} 8a~k, Sydnoy, S48-849.
Rtb1c,
IbtlaO, G. (1\J9()), 'ASSOS8bliQ <1 Chatlqe in prcduction', Unpubli.ahed :cepott., N.3.". Aqrhmltu:e and ,'ishol'i6a, Leeton.
S~ott,
Van
~J
T~I.ol
Eat=;;a "fInIS; ~tilXi SmmWiml J IDd ':1 v~ Bat~
CaalIRXlCS &CMl CU.36ik1 Aa.wfAJeAS (A-I AS2.6\) A~ER (iaD AS t.a;o,91 16 tfIAS (:Of4 AStt. rtC1 AtalMl
)t:iJSam~ ~ ER. TC CktAJit;; c:..: AWl
c~''08a 1,20 1"25 130 13' 1M) 145 ~ 2.!S 2,60
~ .. ~M l.SO ·(tlt) ..(ll4 .0,]0 .. (llS 440 4A6 '()<ll 4lS1 462 loSS .0.14 4.19 .(l15 '(llO '(uS -GAl 4lA6 .oJ1 .a51 160 -0.1 .. 8 ,.(J.t4 4UO .(US .Q.JO .0,36 .0(141 4A7 .oJ2 lAS .(liM 4U» .o,tS ..0.20 ..o~ "(}.JI 436 .(tAl 414' 2.70 (UU -01\4 ..0,10 ·(US 4.20 .(U6 .o~ll ..oJ1 4lAl 2,1' 0.0t$ O.ill 4.OS 4.10 ..o"lS -4JI 4},26 .(Ul .(t11 180 O.U fU16 (tOO .(J.n! ..0,10 4,16 421 .021 4.:J2 1,1$ 0,16 (l,n (lOS 0.,00 4111' ..oJ, 4.16 ..on 421 2,90 tt2'! 016 (UO 0.05 0,00 ·0.06 ..c,1I ..o..n .0"-:32 2,95 026 (l2S o .a, 0.10 OJI5 CUll .o.D6 412 .0,,11 :tOO t131 tt26 0.20 0..5 O~IO 01M 0.01 .om ..c.1l lOS 016 (l)1 C.lS ttlO OoDS 0.09 (lOot tlOl ..(len
4:bStmD~ c~ AWl; Eft ~C_TC
c.-FOBCS 2.,20 2,,25 1JO 2.3, 2AO 2,4.S uo 2.55 2m
Tn1Blmtl 03' .(l0, ..0, 0 .0.16 4.21 416 41J2 .. O¢31 ..QA' .oM O~.J4 41.01 ..om .ellS .a."O ..0.2$ 411 4U6 .0.142 .0..11 0.31 40l ..Q"oo ·()~14 ..0.19 ..(J.l4 .(jJO .('U5 .o~41 446 OJ2 -OlD .om .(lU ..0.11 .0.23 .Q.19 ..0.34 . .QAO .cAS 0,31 .Ql)J .cAS .all "(l11 .(Ul 4!B "()~3 419 ..oM. (lJO 0 . .00 ..QDS ·(Ul ..(116 ..(UI .Ql7 ..nJ2 ~J8 ..(l4] 0,19 OJn .QJ.M .(lIO 4lS 420 .a.26 -0"31 .oJ7 .0.42 0,28 OJl2 4..03 -0.09 .0.." 419 ..0'» 4JO .QJ6 .0.41 0.%1 on) -om ·(l~ 4.13 ..(tu, .(U4 .0.29 43S ·(MO 0,26 Oli4 .o.oa .Q;01 .0.12 411 .on 421 ..034 .(t,j9 0<15 on, 01D .cUl6 4.11 416 .(U2 421 .0.33 ..0...11 0..24 0.06 O •. fU ..(U)S .0.10 ..(lIS 421 ..a26 .0.32 4)7 O~3 run OJD 404 om ..0.14 ..(UO 4~ ..Ql1 ..0.36 0.22 cu. an] ~m .()JX4 4..1J ·6.19 ..Q.24 ..QJO ..0.35 0.21 om O.Ol ..()m ·.elm ..0.12 .oc>JI .0,,23 ..o.l9 ..QJ4 0.20 6.10 O.OS .ont ·(U16 .au ..o.rl ..on 421 -0.33
~I
Table 1.2
BaimAt= £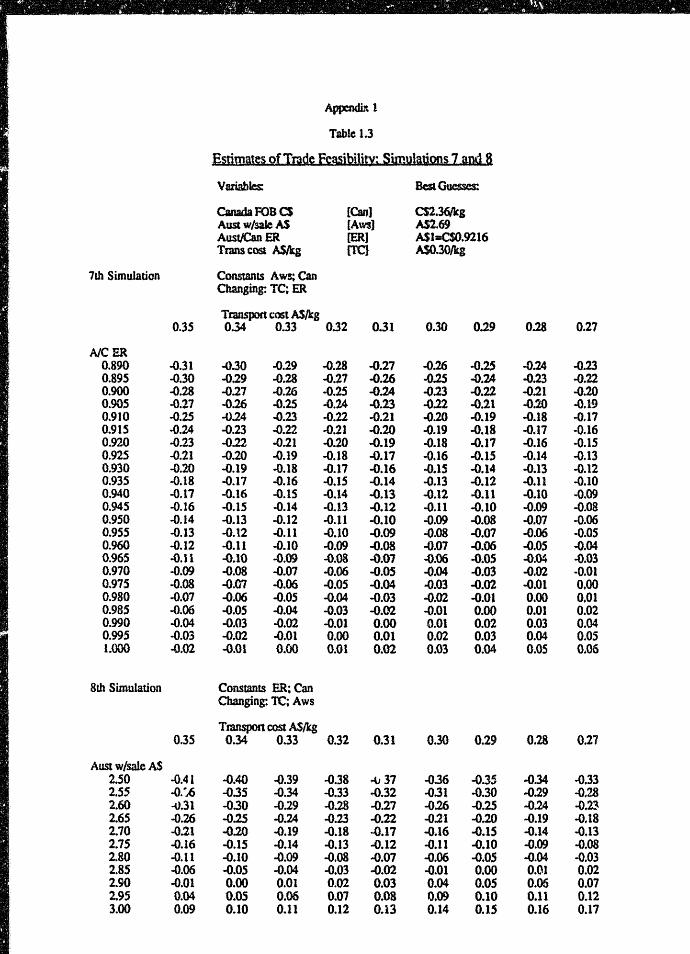
App:ndil !
Table 1.3
fisrimiU~:i 2f Imd~ &gibilia. SWnllDd2D~ 11\m1 a Variables: Best Gue$ses:
Canada FOB CS [Can] CS2.36Ikg Aust w/saJe AS [Aws) AS2.69 AusVCanER [ER] ASlaCSO.9216 Trans tost ASIka {TC} ASO.30Jkg
7th Simulation Constants Aws; Can Changing: TC; ER
Transport cost AS/kg 0.35 0.34 0.33 0.32 0.31 0.30 0.29 0.28 0.27
A/CER 0.890 ..().31 '().30 -0.29 -0.28 .fJ.27 -0.26 ..().2S "().24 -0.23 0.895 -0.30 .fJ.29 ..Q.28 -0.27 .fJ.26 ..0.25 -0.24 -0.23 -0.22 0.900 -0.28 "{).27 ..Q.26 -0.25 -0.24 .().23 -0.22 .fJolt -0.20 0.905 ..().27 -0.26 ..(}.2S -0.24 -0.23 -0.22 -Oolt -0.20 -0,19 0.910 -O.2S -0.24 -0.23 -0.22 -0.21 -0.20 -0.19 -0.18 -0.17 0.915 .0.24 -0.23 -0.22 .().21 -0.20 -0.19 -0.18 -0.17 -0.16 0.920 .0.23 -0.22 -0.21 .0.20 -0.19 -0.18 -0.11 -0.16 -0.15 0.925 -0.21 -0.20 -0.19 -0.18 -0.17 -0.16 -D. IS -0.14 -OJ 3 0.930 -0.20 -0.19 -0.18 -D.l7 -0.16 -O.IS -D. 14 -0.13 -0.12 0.935 '().l8 -0.17 -0.16 -OJS .fJ.14 -0.13 ..o.12 ..o.ll -0.10 0.940 -OJ1 -0.16 ..o.tS ..o.t4 ..o.t3 ..o.l2 ..(l.ll ..(l.IO -0.09 0.945 -0.16 -0.15 -0.14 -OJ 3 ..(l.12 -OJ 1 -0.10 -0.09 -O.OR 0.950 '().l4 -0.13 -D.l2 -D.tl ..o.10 -0.09 ..o.08 -0.07 -0.06 0.955 .oJ 3 -0.12 .().tl -0. to ..o.09 -O.OS -D.07 -0.06 .().OS 0.960 .().12 -0.11 -D. 10 -0.09 ..o.08 -0.07 .fJ.06 ..o.OS -0.04 0.965 -O.t i -0.10 -0.09 ..().08 -0.01 ..().06 -O.OS -0.04 .().03 0.970 -0.09 ..o.08 -0.07 -D.06 -0.05 .(}.04 -D.03 -0.02 -0.01 0.975 -O,OS -0.07 -0.06 ..o.os -0.04 -0.03 -0.02 -Q.OI 0.00 0.980 -0.07 -Q.06 -0.05 -0.04 -0.03 -0.02 -Q.Ot 0.00 0.01 0.985 -0.06 ..o.os -0.04 -0.03 -0.02 -0.01 0.00 0.01 0.02 0.990 -O.M -0.03 -0.02 ..Q.OI 0.00 0.01 0.02 0.03 0.04 0.995 -0.03 -0.02 -0.01 0.00 0.01 0.02 0.03 0.04 0.05 1.000 -0.02 -0.01 0.00 0.01 0.02 0.03 0.04 0.05 0.06
8th Simulation Constants ER; Can Changing: TC; Aws
Tmnsporl cost AS/kg 0.35 0.34 0.33 0.32 0.31 0.30 0.29 0.28 0.21
Aust wI sale AS 2.50 -0.41 -0.40 -0.39 -0.38 ..u 37 -036 -O.3S -0.34 -0.33 2.55 -O."J6 -0.35 -0.34 -0.33 ..().32 -0.31 ..o.30 -0.29 -0.28 2.60 -0.31 -030 -0.29 -0.28 -0.21 -0.26 -0.25 -0.24 -O.~ 2.65 -0.26 -0.25 -0.24 -0.23 "().22 -0.21 -0.20 -0.19 -0.18 2.70 .Q.lI -0.20 ..(}.I9 -0.18 ...a. 17 -0.16 ..(l.IS -0.14 -O.ll 2.75 -0.16 -0.15 ..Q.14 -0.13 -0.12 -OJ 1 -0.10 -0.09 .Q.OS 2.80 -O.ll -0.10 ~.09 -0.08 -0.07 -0.06 -0.05 -Q.04 -0.03 2.85 -0.06 -0.05 ..0.04 -0.03 -0.02 -0.01 0.00 0.01 0.02 2.90 -0.01 0.00 0.01 0.02 0.03 0.04 0.05 0.06 0.07 2.95 0.04 0.05 0.06 0.07 0.08 0.09 0.10 0.11 0.12 3.00 0.09 0.10 0.11 0.12 0.13 0.14 0.15 0.16 0.11
Appendix 2
Inventory block
The ~nventory block consists of one identity for total pig numbers and two equations explaining sow numbers and natural increase. Data definitions are given in the accompanying Table.
(1) IN'l'PAU - INTPAU(-l) + NIO - SLPGAU
(2) INSOWAU - 84.423 + 0.80*INSOWAU(-1) + 5.98*OUMWQ(-4)
(1.68) (5.64) (1. 50)
+ 0.41*PAPGAU(-2) - 0.70*PFFDAU(-2)
(2.21) (-2.9)
adjusted R' [RI] - 0.15
Standard error of the regression [SER] - 5.06
rho - 0.80 (t-4.17)
DH - n.a.
(3) NIQ - 391.22 + 1.39*INSOWAU(-1) + 0.lOE-01*T2SQW
(3.39) (3.19) (5.13)
- 130.62*DUMQl - 48.50*DUMQ2 - 26.22*DUMQ3
(14.26) (-4.60) (-2.87)
R' - 0.11 SER - 42.38 ow stat - 2.18 rho - 0.74(t-9.93)
Ptoduction block
The product.ion block has an equation for average carCAae weight and a price dependent slaughterings equation. Two identities are included for slaughterings and production of pigmeat.
(4) SLPGAU = POPGAU/AVSLWT
(5) POPGAU - CONS + NEXPGAU + INPGAU
(6) PAPGAU - 36.02 - 0.15E-Ol*SLPGAU + 0.21*PFFDAU
(1. 60) (-1.19) (1.90)
0.44*PAPGAU(-1) - 3.11*DUMQl - 2.66*DUMQ2
(1.55)
- O. 79E-01'*12 (-1.15)
SER - 2.50
(-2.18) (-3.50)
rho Q 0.58 (t-2.20)
(7) AVSLWT - 0.14E-01 + 0.68*AVSLWT(-1) - 0.45E-03*07273
(3.63) (8.50) (-1. 46)
+ 0.18E-02*DUMQ1 + O.18E-02*DUM02 +
(6.95) (1.54)
0.14E-02*DUMQ3 + 0.488-04*T2
(6.07) (3.98)
SER =0 0.76E-01 OH :r;; -2.38
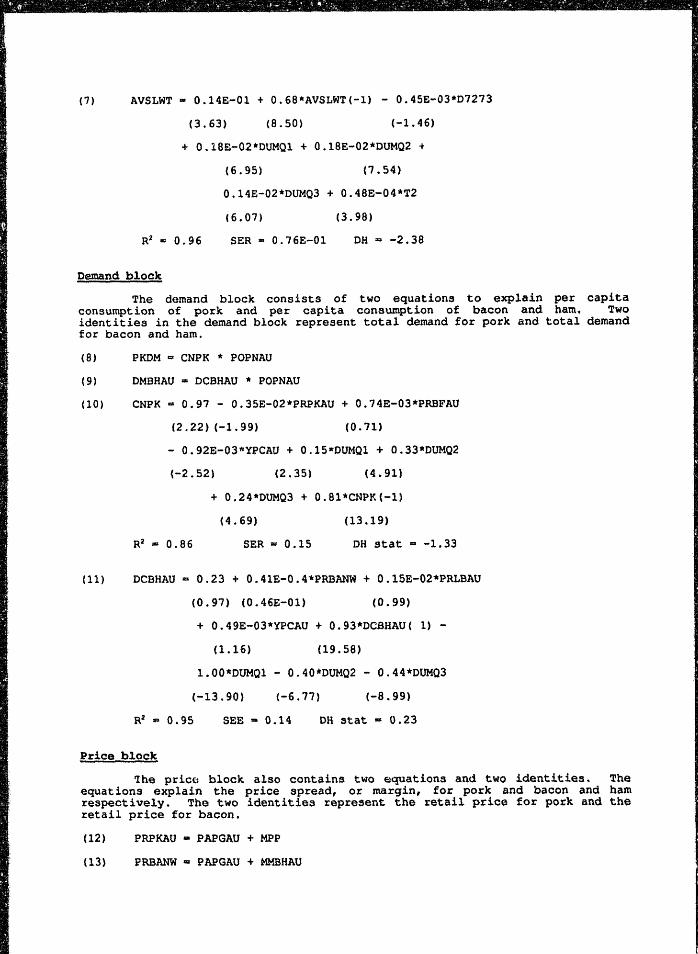
Demand block
The demand block consists of two equations to explain per capita consumption of pork and per capita consumption of bacon and ham. Two identities in the demand block represent total demand for pork and total demand for bacon and ham.
(8) PKDM ~ CNPK * f?OPNAU
(9) OMBHAU - DCBHAU * POPNAU
(10) CNPK - 0.97 - 0.35E-02*PRPKAU + 0.74E-03*PRBFAU
(2.22) (-1. 99) (0.71)
- 0.92E-03*YPCAU + 0.IS-PUM01 + 0.33*PUM02
(-2.52) (2.35) (4.91)
+ 0.24 1lDUMQ3 + 0.81*CNPK{-1)
(4.69) (13.19)
SER 11:1 0.15 DH stat - -1.33
(11) DCBHAU'" 0.23 + 0.41E-0.4*PRBANW + 0.15E-02*PRLBAU
(0.97) (0.46E-01) (0.99)
+ 0.49E-03*YPCAU + 0.93*DC8HAU( 1) -
( 1.16) (19.58)
1.00*DUMQ1 - 0.40*PUMQ2 - O.44*DUMQ3
(-13.90) (-6.77) (-8.99)
R2 #I 0.95 SEE - 0.14 OH stat - 0.23
Price block
'the pric(~ block also contains two equations and two identities. The equations explain the price spread, or margin, for pork and bacon and ham respectively. The two identities represent the retail price for pork and the retail price for bacon.
(12) PRPKAU - PAPGAU + MPP
(13) f?RBANW oa PAPGAU + MMBHAU
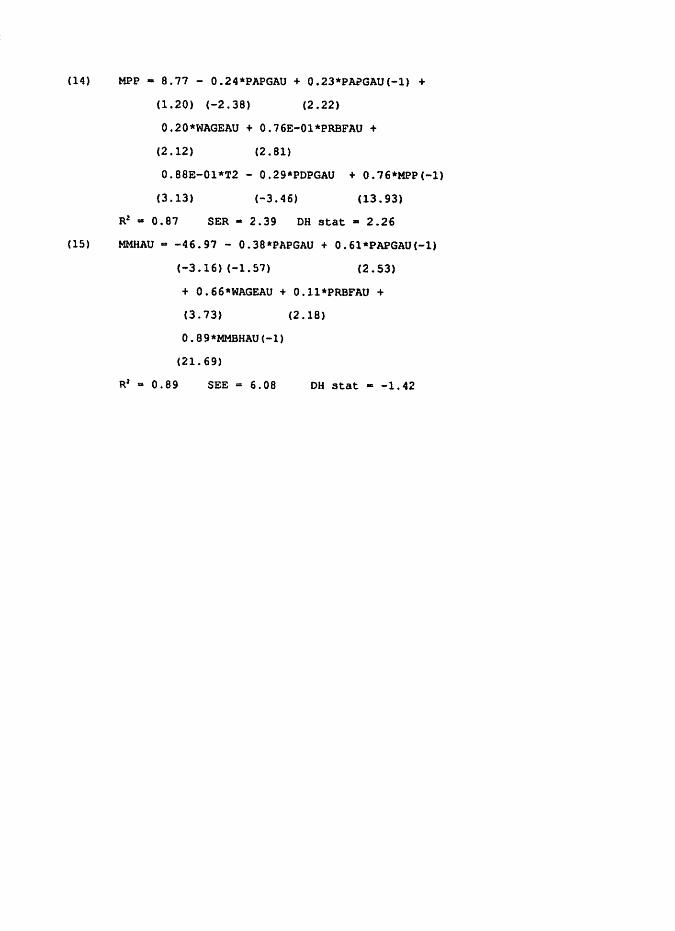
(14) MPP - 8.77 - 0.24*PAPGAU + O.23*PA?GAU(-1) +
(1.20) (-2.38) (2.22)
O.20*WAGEAU + 0.76E-01*PRBFAU +
(2.12) (2.81)
0.88E-01*T2 - 0.29*PDPGAU + 0.76*MPP(-1)
(3.13) (-3.46) (13.93)
Rl - 0.87 SER - 2.39 DR stat - 2.26
(15) MMHAU - -46.97 - O.38*PAPGAU + 0.61*PAPGAU(-1)
(-3.16) (-1.51) (2.53)
+ 0.66*WAGEAU + O.ll*PRBFAU +
(3.73) (2.18)
O. 89*MMBRAU (-1)
(21. 69)
SEE"" 6.08 OR stat - -1. 42
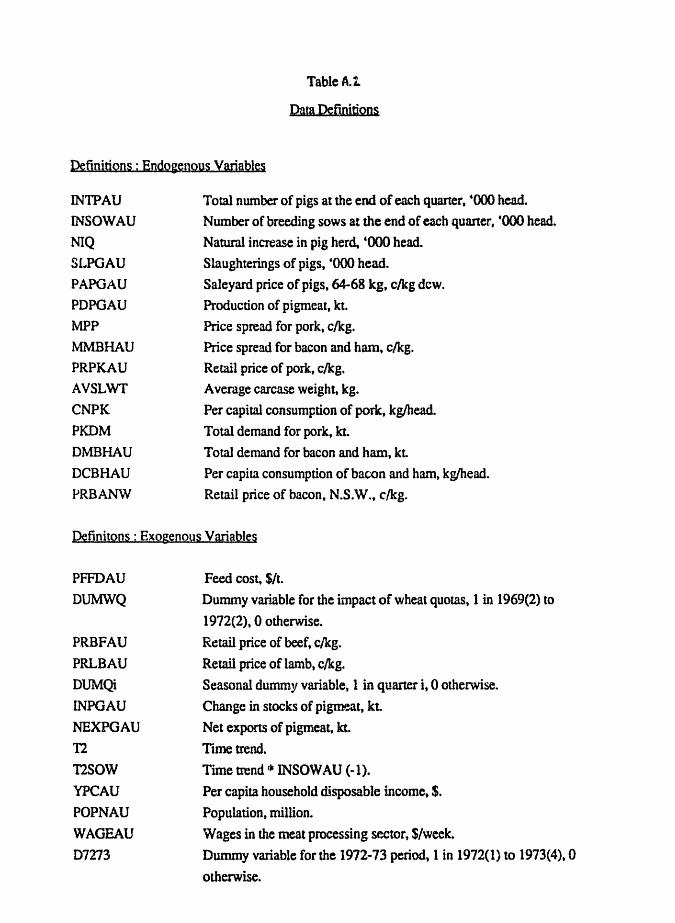
TablcA.l
Data Definitions
Definitions: Endogenous Variables
lNTPAU
lNSOWAU
NIQ
SLPGAU
PAPGAU PDPGAU MPP lv1MBHAU PRPKAU AVSLWf
CNPK
PKDM Dl\1BHAU
DCBHAU
PRBANW
Total number of pigs at the end of each quaner, ·000 head.
Number of breeding sows at the end of each quaner, '000 head.
Natural increase in pig herd. '000 bead. Slaughterings of pigs, ·000 head.
Saleyard price of pigs, 64-68 kg, c/kg dew. Production of pigmeat, kt.
Price spread for pork, clkg. Price spread for bacon and ham, c/kg.
Retail price of pork, c/kg. Average carcase weight, kg.
Per capital consumption of pork, kg/head.
Total demand for pork, In.
Total demand for bacon and bam, kL
Per capita consumption of bacon and ham, kg/head. Retail price of bacon, N.S.W . ., clkg.
Definitons ; Exogenous variables
PFFDAU
DUMWQ
PRBFAU
PRLBAU
DUMQi
INPGAU
NEXPGAU
12
T2S0W
YPCAU
POPNAU
WAGEAU
D7273
Feed cost, SIt. Dummy variable for the impact of wheat quotas, 1 in 1969(2) to
1972(2), 0 otherwise.
Retail price of beef, C/kg. Retail price of lamb, c/kg.
Seasonal dummy variable, 1 in quarter i, 0 othctwise.
Change in stocks of pigmeat, kt.
Net expons of pigmeat, kt.
Time trend.
Time trend 111 INSOW AU (-1).
Per capita household disposable income, $.
Population, million.
Wages in the meat processing sector, S/week. Dummy variable for the 1972-73 period, 1 in 1972(1) to 1973(4).0
otherwise.