Embed Size (px)
Citation preview

AGRICULTURAL ECONOMICS
ELSEVIER Agricultural Economics 16 (1997) 227-235
Fertilizer demand in Greece
G.J. Mergos *, Ch.E. Stoforos Department of Economics, University of Athens, 8 Pesmazoglou Street, 105-59 Athens, Greece
Accepted 5 March 1997
Abstract
Limiting fertilizer use is becoming an important policy objective world-wide. However, the debate on appropriate policy measures is far from settled and evidence on fertilizer demand elasticities is still insufficient. Past studies on fertilizer demand leave several methodological and empirical issues open. This paper aims to contribute to the debate on the methodology of estimating fertilizer demand using single-equation methods. Dynamic aspects are also considered using error-correction modelling methodology and cointegration techniques. The model is applied using data from Greece. Short-run and long-run price elasticities of fertilizer demand with respect to own price and to output prices show significant response to price changes and the adjustment coefficient of fertilizer use to the error-correction term was found to be fairly rapid. The main policy conclusion of the paper is that reducing agricultural support may be an alternative and, perhaps, more effective way of reducing fertilizer demand than increasing fertilizer prices. © 1997 Elsevier Science B. V.
1. Introduction
Increased attention has been paid in recent years to the intensive use of fertilizer for several reasons. Increased fertilizer and agrochernical use has been a major stimulus of output gains in agriculture worldwide, but also the main source of water pollution. The debate, however, on appropriate policy measures is far from settled. The principal policy measure proposed for controlling fertilizer consumption is the use of a fertilizer tax. The same result however, may be achieved by reducing agricultural price support.
Fertilizer demand has been the focus of numerous studies. A summary of approaches used to estimate fertilizer demand is presented in Burrell (1989). A large number of earlier studies for developing coun-
* Corresponding author. Fax: + 30-1-3236529; e-mail: mer[email protected]
tries are reviewed by Shields (1976). There are two main approaches: First, estimation of single equation ad hoc demand functions is the easiest and most popular way of estimating relative own price elasticities of fertilizer demand. In most studies, relative price is defined as the price of fertilizer with respect to the price of agricultural output. This approach has several disadvantages that have been discussed extensively by Burrell (1989). However, the simplicity of estimation and interpretation of the results is a strong advantage that cannot be overlooked. The second approach estimates fertilizer demand elasticities in the context of estimating complete elasticity matrices of output supply and input demand, based on duality theory. This approach, although theoretically more sound and complete, is plagued with a number of problems related to the estimation and, mainly, the imposition of regularity conditions. Fox and Kivanda (1994) evaluated the empirical performance of production theory in agricultural, fisheries
0169-5150/97/$17.00 © 1997 Elsevier Science B.V. All rights reserved. PI/ S0169-5150(97)00013-3

228 G.J. Mergos, Ch.E. Stoforos /Agricultural Economics 16 (1997) 227-235
and forestry applications and they raise strong reservations about the results of the approach. It has been claimed that time series analysis may be preferable (Clark and Coyle, 1994), especially when the purpose of the analysis is prediction of response, in particular outside the sample range and away from the point of approximation.
Dynamic aspects of fertilizer demand can be addressed, also, using recent popular time series analysis techniques. Error correction models have recently been used extensively in various fields (e.g., Diakosavvas, 1995), including fertilizer demand analysis (Denbaly and Vroomen, 1993; Rayner and Cooper, 1994). For example, Hallam and Zanoli (1993) present an error correction specification testing for supply response in the UK pig breeding herd. The main advantage of error correction models is that they manifest, through their correspondence with the statistical concept of cointegration, long run relations between variables avoiding the problem of spurious regressions, so easily specified and accepted with series which exhibit strong trend, resulting in misleading conclusions. The error correction model with the statistical concept of cointegration seems to offer a more flexible and general alternative .framework to the partial adjustment model traditionally used in fertilizer demand analysis. Starting from this premise, one of the purposes of this paper is to use modem time series methods to estimate elasticities of fertilizer demand. Previous work on fertilizer demand, starting with the pioneering work of Griliches (1959) uses either a Koyck distributed lag specification or a partial adjustment model in a single equation double log fertilizer demand function. Similar work has been done by Denbaly and Vroomen (1993) and Rayner and Cooper (1994) (they have estimated dynamic models of fertilizer demand) and partially by Foster and Mwanaumo (1995). However, the point of departure of this paper is the assessment of fertilizer response to changes in output prices (elasticities) in the context of single equation models.
Although duality theory can provide a consistent theoretical framework for estimating such elasticities, there are in most cases insurmountable difficulties in the empirical implementation of such a framework (e.g., see Mergos, 1991 for Greece). It is unavoidable, then, when the dual approach fails to
give acceptable results, to use single equation methods taking advantage of recent developments in time series analysis techniques. Therefore, the purpose of this paper is twofold: (a) To extend single equation estimation of fertilizer demand to include output effects and dynamic aspects, using an error correction specification; and (b) to apply this methodology in a case study and derive policy conclusions for Greece. The paper is organized as follows. The methodological part, underlying the specification and estimation of a single equation fertilizer demand, including an error correction specification of dynamic aspects of fertilizer demand, is presented in Section 2. Empirical specification, data used, and estimation of the parameters, elasticities and tests carried out follow in Section 3. Finally, summary and conclusions are presented in Section 4.
2. Estimating dynamic fertilizer demand
Single equation fertilizer demand estimation may not need to be ad hoc. Following a standard dual approach, we can assume a profit function describing producer profit maximizing behaviour from which, by Hotelling's Lemma, output supply and input demand functions are derived. The profit maximization problem of the multi-output multi-input competitive firm can be represented by:
7T = max( PY - RX) ( 1) Y,X
subject to F( Y, X ;Z) = 0
where P and R are vectors of output and input prices, and Y and X are vectors of output and input quantities, respectively and F(.) is a transformation function. The normalized profit function for the multi-output multi-input competitive firm is given by,
1r= G( p,q) =Sup{ py + qx- F( y,x)} (2)
where p and q are the normalized prices of y and x in terms of the price of the numeraire, respectively. Assuming a normalised profit function, with the price of intermediate inputs other than fertilizer as numeraire, and following standard duality theory output supply and input demand functions can be obtained using the derivative property. The following

G.J. Mergos, Ch.E. Stoforos /Agricultural Economics 16 ( 1997) 227-235 229
specification for the fertilizer demand function is, then, obtained:
(3)
where, Y/: Quantity of fertilizer demanded, Pp: price of fertilizer, P 1b: price of labour, Pc: price of crop products, Pv: price of livestock products, X1:
vector of other variables, where all prices are normalized with the price of intermediate inputs other than fertilizers. This specification provides estimates of Marshallian elasticities (see, also, Burrell, 1989).
Output supply and input demand equations are usually estimated as a system, either with or without the profit function, testing and imposing the required properties (or regularity conditions) of the profit function. If, however, the focus is on a single input, such as fertilizer, and the estimation of the system fails to satisfy the regularity properties required for the profit function (see Mergos, 1991), one has no alternative but to proceed with the estimation of a single equation model. In such case, Eq. (3) provides a model that is theoretically superior to ad hoc models, where the main explanatory variable used in estimating fertilizer demand is the ratio of fertilizer and crop prices (relative fertilizer price). In fact, it is not necessary to use the crop price as the normalizer but, according to duality theory, any price can be used as numeraire. Hence, using an input price as the numeraire allows the estimation, in addition, of fertilizer demand elasticities with respect to output prices.
Earlier single equation fertilizer demand models are either static or dynamic, based on Koyck' s distributed lag structure (Griliches, 1959; Gunjal et al., 1980) and the partial adjustment specification (Shields, 1976; O'Rourke and McStay, 1978). Recent advances in econometric techniques provide the tools (unit root, cointegration) for the application of dynamic error-correction models in analysing fertilizer demand (Denbaly and Vroomen, 1993; Rayner and Cooper, 1994). Moreover, it is now well established that the validity of the partial adjustment approach depends upon establishing that the variables used in the estimation are cointegrated, indicating a long run relationship. An important, and not fully investigated aspect, is the dynamic consideration of fertilizer demand using cointegration techniques. The concept of cointegration and error-cor-
rection modelling may be used to capture the dynamic effects of the time series. Although it is not necessary to repeat here well established concepts, a brief but succinct presentation of cointegration analysis seems necessary.
When X, and Y, are integrated with the same order d, it is generally true (e.g., see Hallam and Zanoli, 1993) that the linear combination Z1 =X,aY, will also be /(d). However, it is possible that Z1 ::::: /(d-b), b > 0. When this occurs, a special constraint operates on the long-run components of the series. If, for example, d = b = 1, so that X 1, Y1
are both integrated with order one with dominant long-run component and zl is integrated with order zero without especially strong frequencies, then the constant a is such that the bulk of the long-run components of X 1 and Y, cancel out.
The components of the vector X 1 are said to be cointegrated of order d,b denoted X,::::: CI(d,b), if: (a) all components of X, are /(d); (b) there exists a vector a( =I= 0) so that Z1 =a' X,::::: I(d- b), b > 0. The vector 'a' is called the cointegrating vector. If X, and Y, are both J(l), cointegration theory implies that only if Z,::::: /(0), equation X 1 = aY, can be considered as a long-run equilibrium relationship, Z1
measures the extent to which the system X 1 , Y1 is out of equilibrium, and can be called the equilibrium error. Cointegration implies that the equilibrium error will be /(0), thus, cointegration appears as a natural framework to test for long-run (steady-state) equilibrium relationships.
Formal testing for cointegration uses three popular residual-based tests: The 'cointegrating regression Durbin-Watson' (CRDW) test of Sargan and Bhargava (1983), the Dickey-Fuller (DF) test and the Augmented Dickey-Fuller (ADF) test. All are unit root tests testing whether a series is /(1) against the alternative /(0). Such earlier tests have been superseded by the maximum likelihood methods proposed by Johansen (Johansen and Juselius, 1990). The latter provide likelihood ratio tests for the existence of different numbers of cointegrated vectors.
A two-step estimation procedure has been suggested (Engle and Granger, 1987) in which the static long-run steady-state equilibrium relation is initially estimated and tested for cointegration. If there is a cointegrated relationship, the lagged residuals from the cointegrating regression [ /(0)] are then used as
230 G.J. Mergos, Ch.E. Stoforos /Agricultural Economics 16 (1997) 227-235
the error correction term in the dynamic error correction model, thus imposing the long-run equilibrium relationship as a restriction. All variables entering the model, then, satisfy the requirement of stationarity and the error correction model represents a valid description of the dynamic process.
Both partial adjustment and error correction models result from the minimisation of an intertemporal loss function. This assumption which is now common place in the study of dynamic models of behaviour of economic agents has the double advantage of generating a linear decision rule while simultaneously allowing first period certainty equivalence results to be applied.
3. Empirical implementation
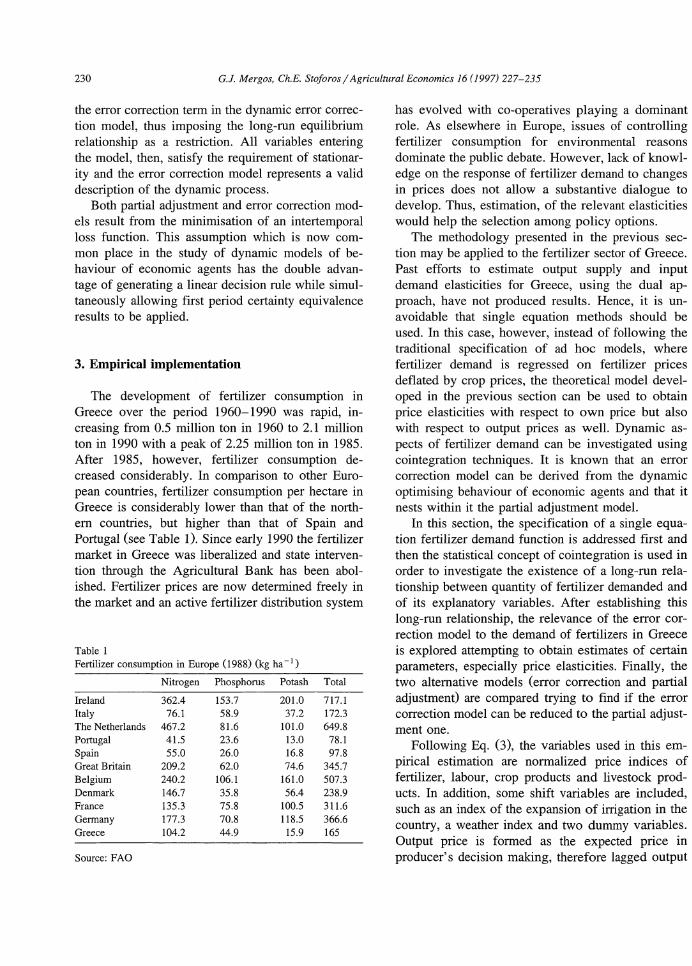
The development of fertilizer consumption in Greece over the period 1960-1990 was rapid, increasing from 0.5 million ton in 1960 to 2.1 million ton in 1990 with a peak of 2.25 million ton in 1985. After 1985, however, fertilizer consumption decreased considerably. In comparison to other European countries, fertilizer consumption per hectare in Greece is considerably lower than that of the northem countries, but higher than that of Spain and Portugal (see Table 1). Since early 1990 the fertilizer market in Greece was liberalized and state intervention through the Agricultural Bank has been abolished. Fertilizer prices are now determined freely in the market and an active fertilizer distribution system
Table I Fertilizer consumption in Europe (1988) (kg ha -I)
Nitrogen Phosphorus Potash Total
Ireland 362.4 153.7 201.0 717.1 Italy 76.1 58.9 37.2 172.3 The Netherlands 467.2 81.6 101.0 649.8 Portugal 41.5 23.6 13.0 78.1 Spain 55.0 26.0 16.8 97.8 Great Britain 209.2 62.0 74.6 345.7 Belgium 240.2 106.1 161.0 507.3 Denmark 146.7 35.8 56.4 238.9 France 135.3 75.8 100.5 311.6 Germany 177.3 70.8 118.5 366.6 Greece 104.2 44.9 15.9 165
Source: FAO
has evolved with co-operatives playing a dominant role. As elsewhere in Europe, issues of controlling fertilizer consumption for environmental reasons dominate the public debate. However, lack of knowledge on the response of fertilizer demand to changes in prices does not allow a substantive dialogue to develop. Thus, estimation, of the relevant elasticities would help the selection among policy options.
The methodology presented in the previous section may be applied to the fertilizer sector of Greece. Past efforts to estimate output supply and input demand elasticities for Greece, using the dual approach, have not produced results. Hence, it is unavoidable that single equation methods should be used. In this case, however, instead of following the traditional specification of ad hoc models, where fertilizer demand is regressed on fertilizer prices deflated by crop prices, the theoretical model developed in the previous section can be used to obtain price elasticities with respect to own price but also with respect to output prices as well. Dynamic aspects of fertilizer demand can be investigated using cointegration techniques. It is known that an error correction model can be derived from the dynamic optimising behaviour of economic agents and that it nests within it the partial adjustment model.
In this section, the specification of a single equation fertilizer demand function is addressed first and then the statistical concept of cointegration is used in order to investigate the existence of a long-run relationship between quantity of fertilizer demanded and of its explanatory variables. After establishing this long-run relationship, the relevance of the error correction model to the demand of fertilizers in Greece is explored attempting to obtain estimates of certain parameters, especially price elasticities. Finally, the two alternative models (error correction and partial adjustment) are compared trying to find if the error correction model can be reduced to the partial adjustment one.
Following Eq. (3), the variables used in this empirical estimation are normalized price indices of fertilizer, labour, crop products and livestock products. In addition, some shift variables are included, such as an index of the expansion of irrigation in the country, a weather index and two dummy variables. Output price is formed as the expected price in producer's decision making, therefore lagged output

G.J. Mergos, Ch.E. Stoforos /Agricultural Economics 16 ( 1997) 227-235 231
price was used as a proxy for the current output price. Price of livestock is also included because it may affect the entire production system through its impact on derived demand for grains and other crop output, and crop producers' behaviour is unlikely to dominate total fertilizer demand at sector level. For example in UK, in 1982-84, dairy producers spent more per hectare on fertilizers than specialist cereal producers whilst livestock producers spent nearly half as much (Rickard, 1986, Table V). This evidence is a reminder that the technical and economic importance of fertilizers varies between outputs and that the effects of substitution between outputs may be considerable at sector level (Burrell, 1989). Hence, livestock price should not be excluded from the analysis of fertilizer demand, at least on theoretical grounds.
The weather index is defined as:
(4)
where Pi is monthly precipitation for the ith month in millimetres, Ti is average temperature for the ith month in C0 , n is the number of months in the period and the constant 10 is added to temperature to avoid negative values. Fertilizer use, following established farming practices world-wide, is related to water availability and for this reason a weather index showing water availability is included in the analysis. Expansion of the land under irrigation (Ir) changes farm technology and allows intensive cultivation of certain high value crops with intensive fertilizer use. Hence, the index of the expansion of irrigated land can be regarded as a proxy for technological change that results from the availability of water. In addition, dummy variables were introduced for the years 1980 and 1993, respectively, because of preparation for EC accession (1981) and the liberalization of the fertilizer market ( 1992).
A single equation functional form of fertilizer demand, to be used for empirical implementation, can be derived from the theoretical framework presented in the previous section. A double log specification of Eq. (3) can be derived from a Generalized Cobb-Douglas functional form of the profit function, while a linear form of Eq. (3) can be derived from a generalized quadratic specification of the
normalized profit function 1• Assuming a Generalized Quadratic functional form for the normalized profit function:
1r= ao + ""f-bipj + L ""f-cijPiPj + ""f-bkZk j i j k
k n k
and applying Hotelling's Lemma, the product supply and input demand equations are derived as:
DP/Dpi = Yi = bi L cijpj + L cikzk (6) j k
where Yi > 0 for outputs and Yi < 0 for inputs, pj are output and input prices and zk are shift variables. Including, also, the shift variables as discussed above, the general form of the single-equation model used to empirically estimate fertilizer demand in Greece is:
1'; = f( Pft'Plb1 ,Pet' Put' At'lrt'D80,D93) (7)
where, Y1 denotes the quantity of fertilizer demanded, Pi 1 are normalized output and input prices, i.e., PJ; is the price of fertilizers, Plb1 is the price of labour, Pc1 is the weighted price of crop products and Pv1 is the weighted price of livestock products, lr1 is an index of the expansion of irrigated land, A 1
is the weather index and D80, D93 are the dummy variables for 1980 and 1993 respectively. No fixed factor is included among the variables, hence, this specification may represent a long-run relationship. Both forms, the double-log and the linear specification have been estimated with very similar results, but only the results from the linear specification are presented.
The data used for the empirical estimation have been collected from various sources, mainly from the Ministry of Agriculture and the NSSG (National Statistical Service of Greece). Moreover, the data used are annual and cover a thirty three year period (1961-1993).
1 The quadratic form cannot be tested for homogeneity because if homogeneity is imposed it reduces to a linear function and then it cannot provide a second-order approximation to an arbitrary function (see, e.g., Wall and Fisher, 1987); hence, we assume a quadratic profit function in its own right (not as a second order approximation).

232 G.J. Mergos, Ch.E. Stoforos /Agricultural Economics 16 ( 1997) 227-235
Table 2 Tests for order of integration
DF (with trend) DF (without trend) ADF (with trend) ADF (without trend)
LY 0.0393 -2.5762 0.5901 (1) -2.4791 (1) IlLY -6.1104 -4.8702 -4.0370 (1) -3.0356 (1) Llr -2.1793 -1.6904 -2.1565 (1) -1.7936 (1) !lLir -6.0704 -5.8515 -4.5111 (1) -4.6381 (1) LPf -3.2764 -1.2013 -2.2489 (1) -0.6638 (1) !lLPf -7.3321 -7.4605 -4.8919 (1) -4.9820 (1) LPb -1.1365 -1.9161 -1.2755 (1) -1.9205 (1) !lLPb -4.9946 -4.7019 -3.7655 (1) -3.0595 (1) LPc -1.0512 1.1213 -0.8701 (1) 0.7834 (1) llLPc -5.9432 -4.2135 -4.6154 (1) -4.2868 (1) LPl -1.0222 -2.0456 -1.3089 (1) -2.0027 (1) !lLPl -6.9856 -7.0621 -4.5962 (1) -3.0071 (1)
Notes: (a) For each variable the first line is giving the level and the second gives the flrst difference, (b) The numbers in brackets indicate the number of lags in ADF, (c) Critical values for DF and ADF (with trend) for the variables in levels: - 3.55, -3.56 and without trend: -2.95,- 2.95, respectively and for DF and ADF (with trend and without trend) for the variables in differences: -3.56, -3.56, -2.95, -2.96.
First, the variables of interest are tested for cointegration. For this purpose, the DF test and the ADF test were used. The ADF test was carried out after fitting various lags to the data, where the number of lags were sufficient to ensure that there was no autocorrelation in the residuals. Two criteria were used to determine the number of lags: (a) the significance of the parameter estimates of the lags and (b) the Lagrange multiplier (LM) test for first and second order autocorrelation. All statistics for levels of variables were lower than the critical values, indicating non-stationarity (Table 2). The tests were performed with trend and without trend. The first differences of the variables yielded significant values on all tests (Table 2).
Moreover, two standard stability tests were performed to test for possible structural brake in the series of fertilizer consumption. The first test is based on the cumulative sum of recursive residuals and is shown in Fig. la. The second test is based on the cumulative sum of squares recursive residuals and is shown in Fig. lb. The results demonstrate the absence of a structural brake in the series of fertilizer consumption.
The second condition for cointegration is that there should exist some linear combination of the data series that must be stationary /(0), even though the individual series are not. The results reject the null hypothesis of non-cointegration (Table 3).
a) Plot of Cumulative Sum of Recursive Residua1s
b) Plot of Cumulative Sum of Squares of Recursive Residuals
1.311!Z
.7118111
.21993
The straight lines represent critical bounds at 5% significance level.
Fig. 1. Testing for structural break of fertilizer consumption.
G.J. Mergos, Ch.E. Stoforos /Agricultural Economics 16 ( 1997) 227-235 233
Table 3 Cointegration tests
Null Alternative Statistic 95% critical value
Cointegration lR test based on trace of the stochastic matrix
r=O r~l 106.4575 94.1550 r co;, 1 r~2 56.7035 68.5240 r:o;2 r~3 31.9867 47.2100 r:o;3 r~4 17.1550 29.6800 r:o;4 r=5 6.2121 15.4100 r:o;5 r=6 0.0063 3.7620
Cointegration LR test based on maximal eigenvalue of the stochastic matrix
r=O r=1 49.7540 39.3720 r:o;1 r=2 24.7167 33.4610 r:o;2 r=3 14.8318 27.0670 r:o;3 r=4 10.9428 20.9670 r:o;4 r=5 6.2058 14.0690 r:o;5 r=6 0.0063 3.7620
Note: The maximum lag in V AR = 1
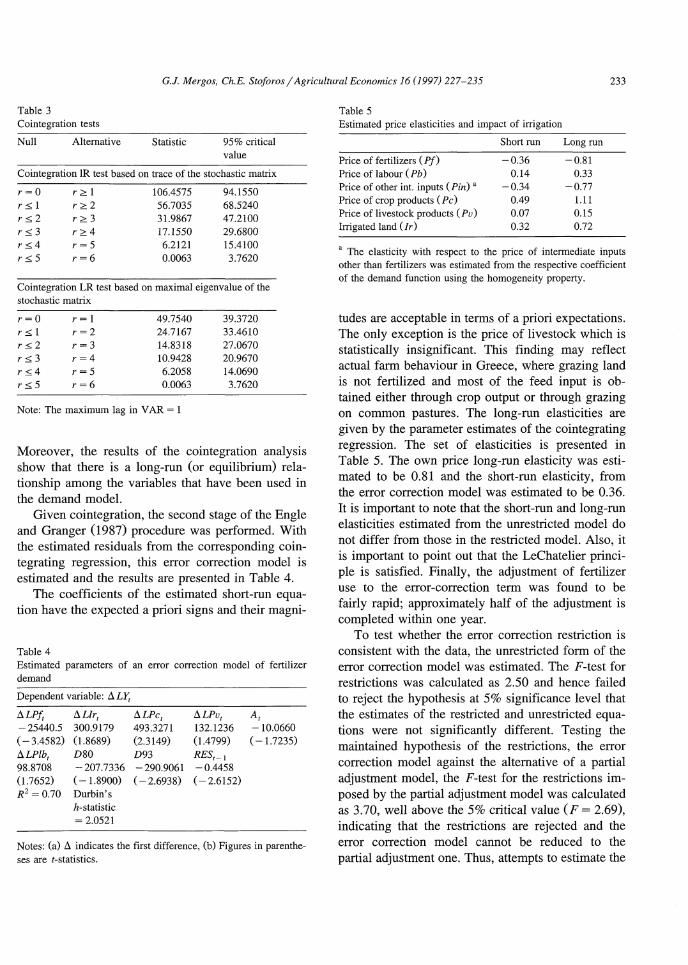
Moreover, the results of the cointegration analysis show that there is a long-run (or equilibrium) relationship among the variables that have been used in the demand model.
Given cointegration, the second stage of the Engle and Granger (1987) procedure was performed. With the estimated residuals from the corresponding cointegrating regression, this error correction model is estimated and the results are presented in Table 4.
The coefficients of the estimated short-run equation have the expected a priori signs and their magni-
Table 4 Estimated parameters of an error correction model of fertilizer demand
Dependent variable: A LY,
ALPf, ALlr1 ALPc, ALPv, A, -25440.5 300.9179 493.3271 132.1236 -10.0660 (- 3.4582) (1.8689) (2.3149) (1.4799) ( -1.7235) ALPlb, D80 D93 RES,_ 1
98.8708 -207.7336 -290.9061 -0.4458 (1.7652) ( -1.8900) ( -2.6938) (-2.6152) R2 = 0.70 Durbin's
h-statistic = 2.0521
Notes: (a) A indicates the first difference, (b) Figures in parentheses are !-statistics.
Table 5 Estimated price elasticities and impact of irrigation
Short run Long run
Price of fertilizers ( Pf) -0.36 -0.81 Price of labour ( Pb) 0.14 0.33 Price of other int. inputs (Pin) a -0.34 -0.77 Price of crop products (Pc) 0.49 1.11 Price of livestock products ( Pv) 0.07 0.15 Inigated land (/r) 0.32 0.72
' The elasticity with respect to the price of intermediate inputs other than fertilizers was estimated from the respective coefficient of the demand function using the homogeneity property.
tudes are acceptable in terms of a priori expectations. The only exception is the price of livestock which is statistically insignificant. This finding may reflect actual farm behaviour in Greece, where grazing land is not fertilized and most of the feed input is obtained either through crop output or through grazing on common pastures. The long-run elasticities are given by the parameter estimates of the cointegrating regression. The set of elasticities is presented in Table 5. The own price long-run elasticity was estimated to be 0.81 and the short-run elasticity, from the error correction model was estimated to be 0.36. It is important to note that the short-run and long-run elasticities estimated from the unrestricted model do not differ from those in the restricted model. Also, it is important to point out that the LeChatelier principle is satisfied. Finally, the adjustment of fertilizer use to the error-correction term was found to be fairly rapid; approximately half of the adjustment is completed within one year.
To test whether the error correction restriction is consistent with the data, the unrestricted form of the error correction model was estimated. The F-test for restrictions was calculated as 2.50 and hence failed to reject the hypothesis at 5% significance level that the estimates of the restricted and unrestricted equations were not significantly different. Testing the maintained hypothesis of the restrictions, the error correction model against the alternative of a partial adjustment model, the F-test for the restrictions imposed by the partial adjustment model was calculated as 3.70, well above the 5% critical value (F = 2.69), indicating that the restrictions are rejected and the error correction model cannot be reduced to the partial adjustment one. Thus, attempts to estimate the

234 G.J. Mergos, Ch.E. Stoforos /Agricultural Economics 16 (1997) 227-235
demand function of fertilizers using a partial adjustment model in the past have imposed restrictions which may not be true.
The empirical findings of this paper have significant policy implications. The short-run price elasticity of fertilizer demand in Greece is estimated at -0.36 and the long-run at -0.81. These elasticity estimates are quite high compared to the own price elasticities estimated by Denbaly and Vroomen (1993) for the US which range from -0.21 to -0.25 for short-run and -0.31 to -0.41 for longrun; but are lower compared to estimates provided by Burrell for the UK, which show that fertilizer demand responds to own price changes with an elasticity somewhere between -0.4 and -0.6 (Burrell, 1989, p. 16). Rayner and Cooper (1994) on the other hand, estimated the short-run and long-run own price elasticities of nitrogen fertilizer demand at around -0.1 for the short-run and -0.25 for the long-run. The difference in the estimated elasticities for the UK, between Burrell on the one hand and Rayner and Cooper on the other, cannot be easily attributed to either differences in the estimation method, data used or other factors. Estimates of O'Rourke and McStay (1978) for Ireland, a country with the highest consumption of fertilizer per hectare in Europe, show elasticities that are much higher than those estimated for Greece (O'Rourke and McStay, 1978, p. 48). Similarly, Shields reporting results of a previous study by Timmer (Shields, 1976, p. 338) shows the own price elasticity of fertilizer demand ranging for various developing countries from - 0.17 to - 2.03 for the short-run and from - 0.34 to - 6.63 for the long-run.
Although the own price elasticity of fertilizer demand is higher in Greece than in some other European countries, it is lower than the elasticity with respect to the price of crop output. The elasticities of fertilizer demand with respect to crop price are 0.49 and 1.11 for the short- and long-run respectively. The policy implication of this findings is that it is more effective to reduce fertilizer use through a decrease in crop output prices than through a fertilizer tax which would be difficult to impose and administer. Also, of interest is the response of fertilizer use to changing technology through the expansion of irrigation, which has an impact of similar magnitude, at least in the short-run. Restriction,
therefore, of the expansion of irrigation not only constraints overall agricultural supply, but restricts fertilizer use, as well. It may, therefore, be concluded that the objective of limiting fertilizer use can be obtained with an increase in fertilizer price or with a reduction in crop output prices and by slowing down expansion of irrigation. The latter policy measures are more effective and easier administratively than a fertilizer tax.
4. Summary and conclusions
The responsiveness of fertilizer demand to own price and to agricultural price changes is a topical issue for two reasons. First, the selection among various policy measures to control fertilizer use (in particular nitrogen) for environmental reasons is an important current consideration. Second, the prediction of fertilizer consumption to changes in product prices, mainly as a result of policy changes introduced by the CAP reform and the GATT agreement, is a second major concern. The main policy measure proposed for controlling fertilizer consumption is the use of a fertilizer tax. The same result, however, may be achieved with a less difficult and complex way by reducing agricultural price support or constraining the expansion of irrigation.
Estimation of single equation ad hoc demand functions is the easiest and most popular way of estimating relative elasticities of fertilizer demand. The alternative of using duality theory in estimating complete elasticity matrices of input demand and output supply is not always feasible. This paper extends the single equation method to include output effects and dynamic aspects using cointegration analysis, and applies this methodology in the fertilizer sector of Greece.
With regard to the set of estimated fertilizer demand elasticities for Greece, the following can be said: (a) The estimated short-run own price elasticities are higher in comparison with similar estimates for other countries; (b) The long-run elasticities obtained are much higher, they satisfy the LeChatelier principle and indicate a strong response. The results of cointegration analysis have shown that there is a long-run relationship among the variables that have been used, a fact that ensures the credibility of the

G.J. Mergos, Ch.E. Stoforos /Agricultural Economics 16 (1997) 227-235 235
estimated long-run elasticities, thus reinforcing the above results given by the error correction model. Moreover, the results have shown that the error correction model cannot be reduced to a partial adjustment model.
The policy implications of the empirical findings are interesting for choosing among alternative policy instruments. Although, fertilizer demand in Greece is more responsive to changes in fertilizer prices than in other countries, still, it is more responsive to changes in crop output prices and to technology changes that are introduced with the expansion of irrigation. Therefore, given the empirical results of this paper, the main policy conclusion that can be deduced, at least for Greece, is that a more effective way of reducing fertilizer demand is through reducing agricultural price support and restraining expansion of irrigated land, rather than through increasing fertilizer prices.
References
Burrell, A., 1989. The demand for fertilizer in the UK. J. Agricult. Econ. 40, 1-20.
Clark, J.S., Coyle, B.T., 1994. Comments on neoclassical production theory and testing in agriculture. Can. J. Agricult. Econ. 42, 19-27.
Denbaly, M., Vroomen, H., 1993. Dynantic fertilizer nutrient demands for corn: A cointegrated and error-correcting system. Am. J. Agricult. Econ. 75, 203-209.
Diakosavvas, D., 1995. How integrated are world beef markets? The case of Australian and US beef markets. Agricult. Econ. 12, 37-53.
Engle, R.F., Granger, C.W.J., 1987. Cointegration and error correction: representation, estimation and testing. Econometrica 55 (2), 251-276.
Foster, K.A., Mwanaumo, A., 1995. Estimation of dynamic maize supply response in Zambia. Agricult. Econ. 12, 99-107.
Fox, G., Kivanda, L., 1994. Popper or production?. Can. J. Agricult. Econ. 42, 1-13.
Griliches, Z., 1959. Distributed lags, disaggregation, and regional demand functions for fertilizer. J. Farm Econ. 41, 90-102.
Gunjal, K.R., Roberts, R.K., Heady, E.O., 1980. Fertilizer demand functions for five crops in the United States. South J. Agricult. Econ. 12, 111-116.
Hallam, D., Zanoli, R., 1993. Error correction models and agricultural supply response. Eur. Rev. Agricult. Econ. 20, 151-166.
Johansen, S., Juselius, K., 1990. Maximum likelihood estimation and inference on cointegration - with applications to the demand for money. Oxford Bull. Econ. Stat. 52 (2), 169-210.
Mergos, G.J. (1991), Output supply and input demand in Greek agriculture. A multi-output profit function approach, Studies No. 6, Center of Planning and Econontic Research, Athens, Greece.
O'Rourke, A.D., McStay, T., 1978. The demand for fertilizer in Ireland. Irish J. Agricult. Econ. Rural Sociol. 7, 41-78.
Rayner, A.J., Cooper, D.N., 1994. Cointegration analysis and the UK demand for nitrogen fertilizer. Appl. Econ. 26, 1049-1054.
Rickard, 1986. Nitrogen lintitation: A Way Forward? Paper presented at a one-day conference, Agricultural Economics Society, London, December 1986.
Sargan, J.D., Bhargava, A., 1983. Testing residuals from least squares regression for being generated by the gaussian random walk. Econometrica 51 (1), 153-174.
Shields, J.T., 1976. Estimating fertilizer demand. Food Policy, August: 333-341.
Wall, C.A., Fisher, B.S., 1987, Modelling a Multiple Output Production System: Supply Response in the Australian Sheep Industry. Research Report No. 11. Dept. of Agricultural Economics, University of Sydney, Australia.