Embed Size (px)
Citation preview
IDLC Finance Limited
Earnings Disclosure
FY 2018
18 February 2019
Forward Looking Statements
This presentation may contain statements that constitute forward-looking statements about the Company, within the
general meaning of the term and within the meaning of applicable securities laws, including financial projections and
estimates and their underlying assumptions, statements regarding plans, objectives and expectations. These statements
may appear in a number of places in this document and may include statements regarding our intent, belief or current
expectations regarding our customer base, estimates regarding future growth in our different business lines, market share,
financial results and other aspects of our activity and situation relating to the Company. The forward looking statements in
this document can be identified, in some instances, by the use of words such as “expects”, “anticipates”, “intends”,
“believes”, and similar language or the negative thereof or by the forward-looking nature of discussions of strategy, plans
or intentions.
Such forward-looking statements, by their nature, are not guarantees of future performance and involve risks and
uncertainties, and actual results may differ materially from those in the forward-looking statements as a result of various
factors.
Neither this presentation nor any of the information contained herein constitutes an offer of purchase, sale or exchange,
nor a request for an offer of purchase, sale or exchange of securities, or any advice or recommendation with respect to
such securities.
Finally, be advised that this document may contain summarized information or information that has not been audited. In
this sense, this information is subject to, and must be read in conjunction with, all other publicly available information.
Slide 2 of 22
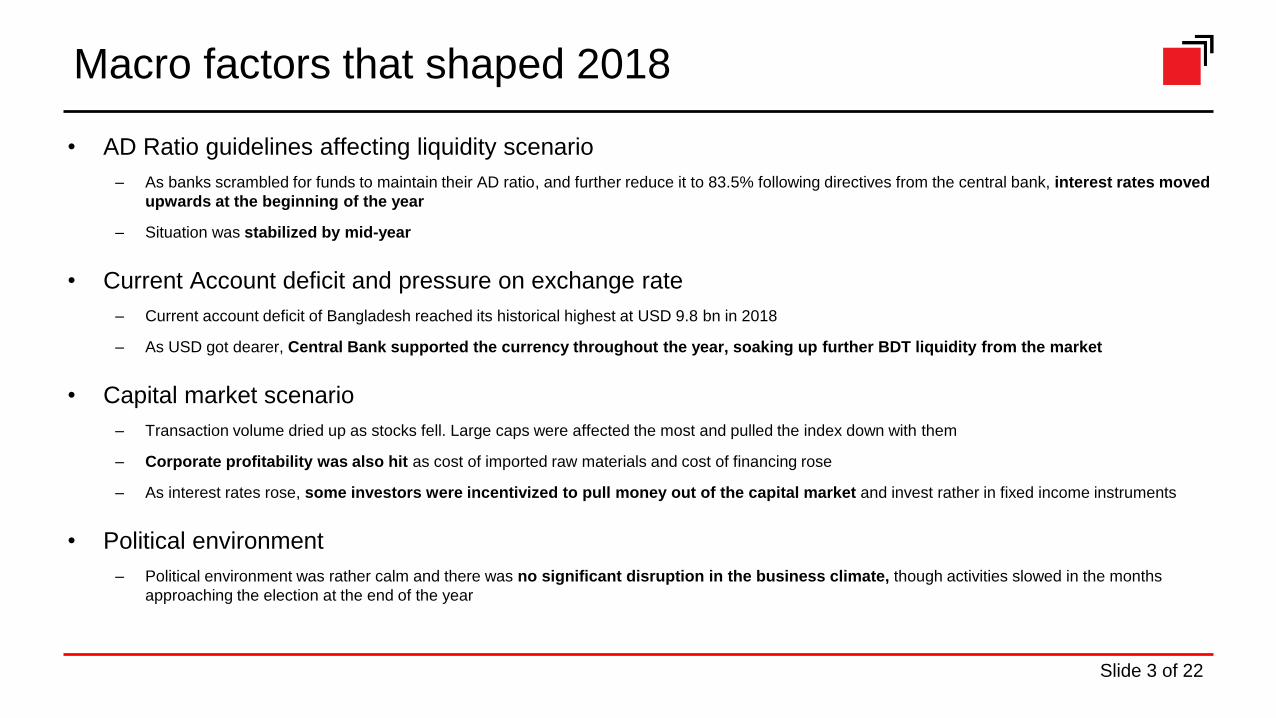
Macro factors that shaped 2018
• AD Ratio guidelines affecting liquidity scenario
– As banks scrambled for funds to maintain their AD ratio, and further reduce it to 83.5% following directives from the central bank, interest rates moved
upwards at the beginning of the year
– Situation was stabilized by mid-year
• Current Account deficit and pressure on exchange rate
– Current account deficit of Bangladesh reached its historical highest at USD 9.8 bn in 2018
– As USD got dearer, Central Bank supported the currency throughout the year, soaking up further BDT liquidity from the market
• Capital market scenario
– Transaction volume dried up as stocks fell. Large caps were affected the most and pulled the index down with them
– Corporate profitability was also hit as cost of imported raw materials and cost of financing rose
– As interest rates rose, some investors were incentivized to pull money out of the capital market and invest rather in fixed income instruments
• Political environment
– Political environment was rather calm and there was no significant disruption in the business climate, though activities slowed in the months
approaching the election at the end of the year
Slide 3 of 22
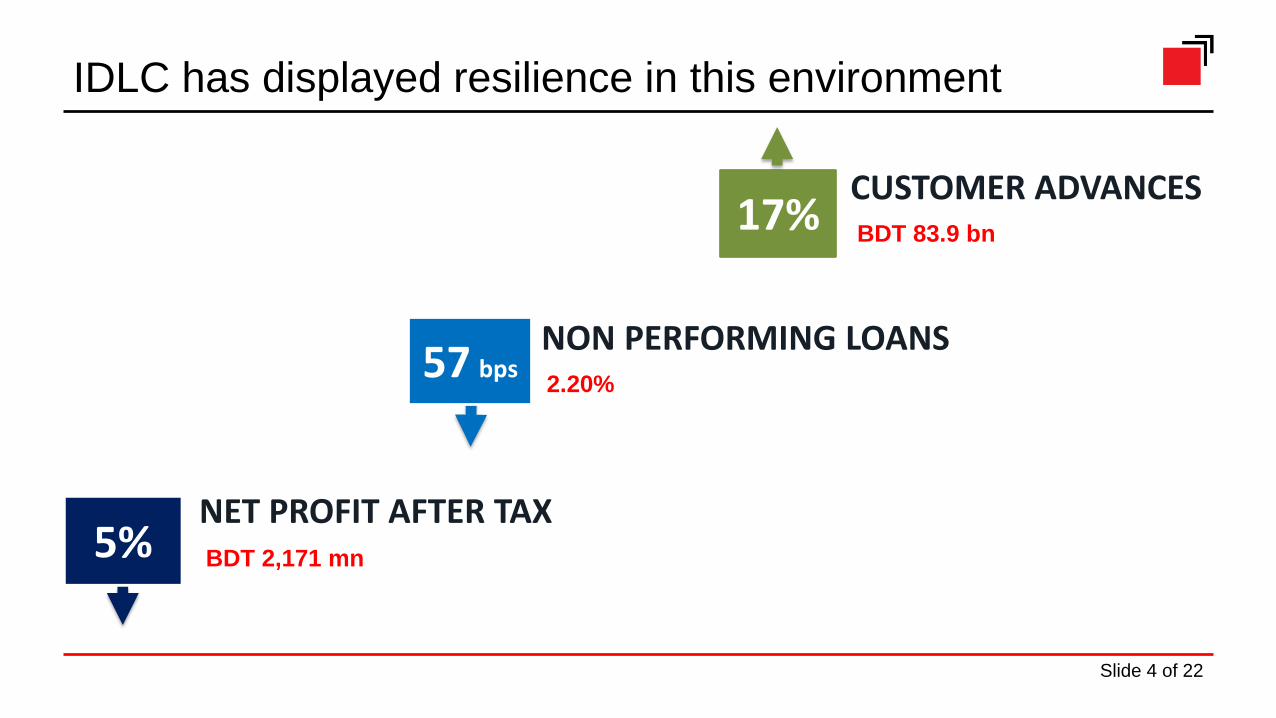
57 bps
IDLC has displayed resilience in this environment
2.20%
NON PERFORMING LOANS
BDT 83.9 bn
CUSTOMER ADVANCES17%
BDT 2,171 mn
NET PROFIT AFTER TAX5%
Slide 4 of 22
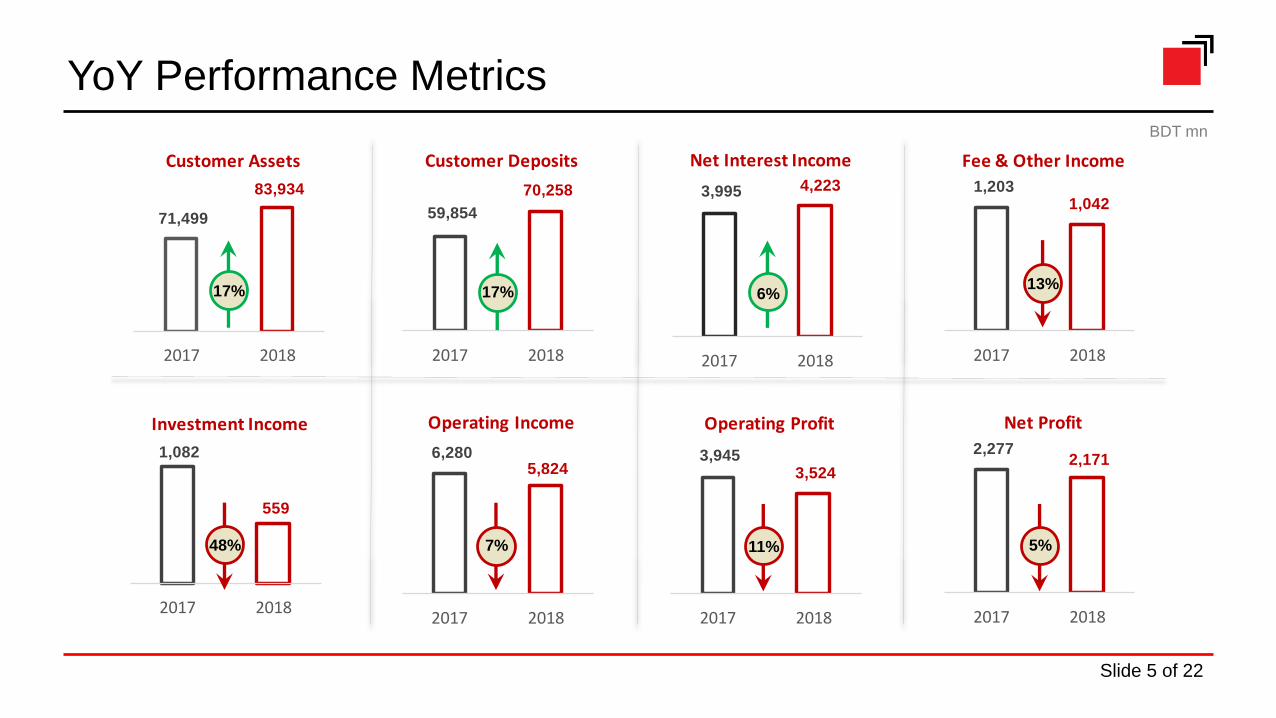
2,277 2,171
2017 2018
Net Profit
3,945 3,524
2017 2018
Operating Profit
6,280 5,824
2017 2018
Operating Income
1,082
559
2017 2018
Investment Income
1,203 1,042
2017 2018
Fee & Other Income
3,995 4,223
2017 2018
Net Interest Income
59,854
70,258
2017 2018
Customer Deposits
71,499
83,934
2017 2018
Customer Assets
13%17% 17% 6%
7% 11% 5%
BDT mn
48%
YoY Performance Metrics
Slide 5 of 22
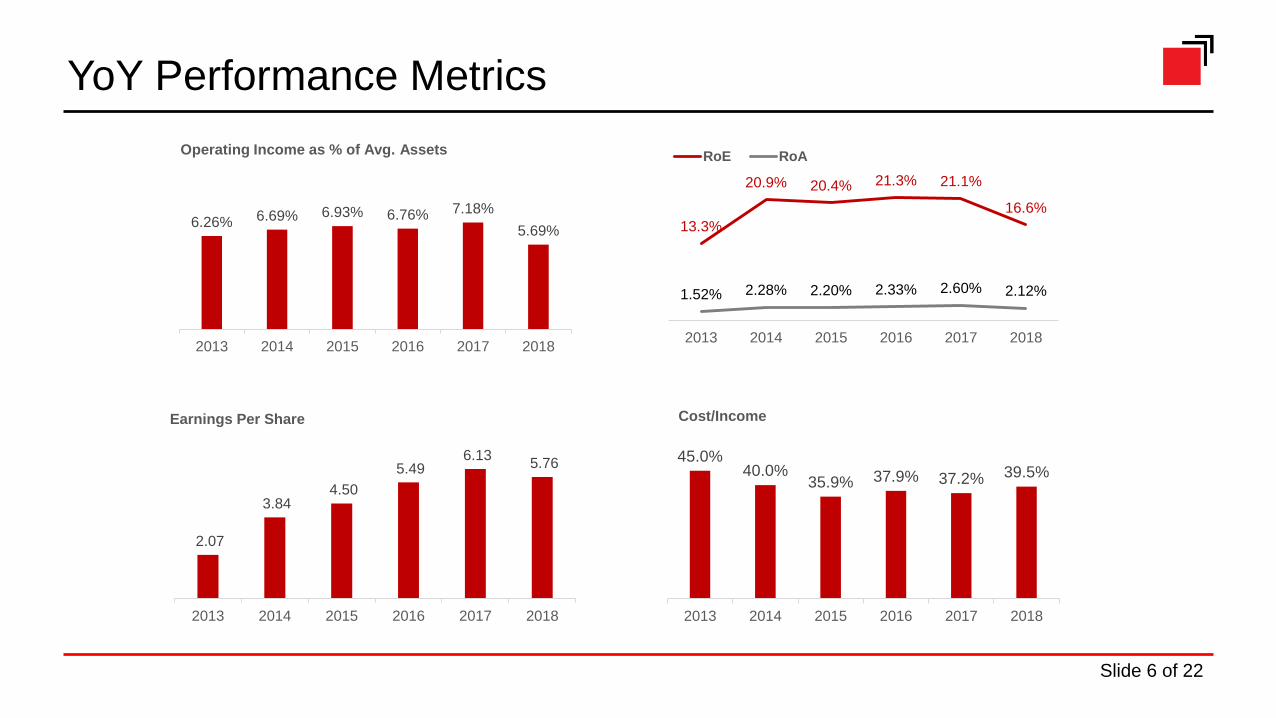
6.26% 6.69% 6.93% 6.76% 7.18%
5.69%
2013 2014 2015 2016 2017 2018
Operating Income as % of Avg. Assets
45.0%40.0%
35.9% 37.9% 37.2% 39.5%
2013 2014 2015 2016 2017 2018
Cost/Income
13.3%
20.9% 20.4% 21.3% 21.1%
16.6%
1.52% 2.28% 2.20% 2.33% 2.60% 2.12%
2013 2014 2015 2016 2017 2018
RoE RoA
2.07
3.84 4.50
5.49 6.13
5.76
2013 2014 2015 2016 2017 2018
Earnings Per Share
YoY Performance Metrics
Slide 6 of 22
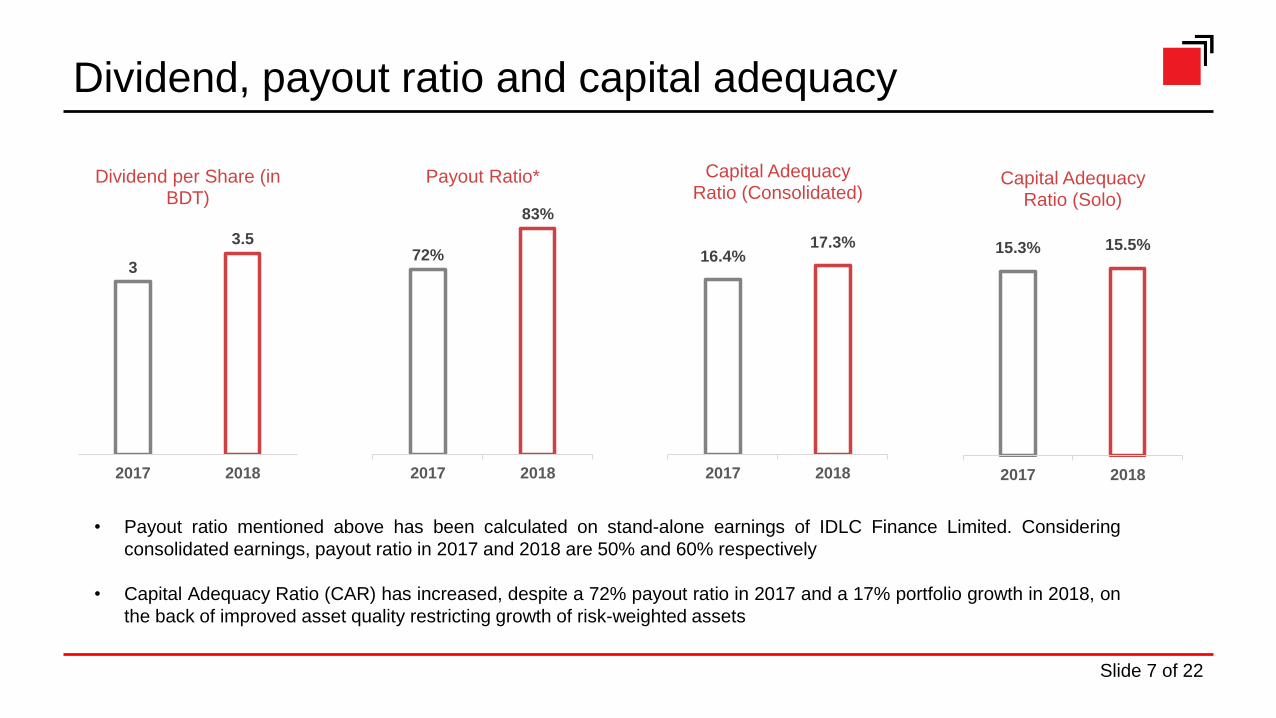
Dividend, payout ratio and capital adequacy
3
3.5
2017 2018
Dividend per Share (in BDT)
72%
83%
2017 2018
Payout Ratio*
16.4%17.3%
2017 2018
Capital Adequacy Ratio (Consolidated)
15.3% 15.5%
2017 2018
Capital Adequacy Ratio (Solo)
• Payout ratio mentioned above has been calculated on stand-alone earnings of IDLC Finance Limited. Considering
consolidated earnings, payout ratio in 2017 and 2018 are 50% and 60% respectively
• Capital Adequacy Ratio (CAR) has increased, despite a 72% payout ratio in 2017 and a 17% portfolio growth in 2018, on
the back of improved asset quality restricting growth of risk-weighted assets
Slide 7 of 22
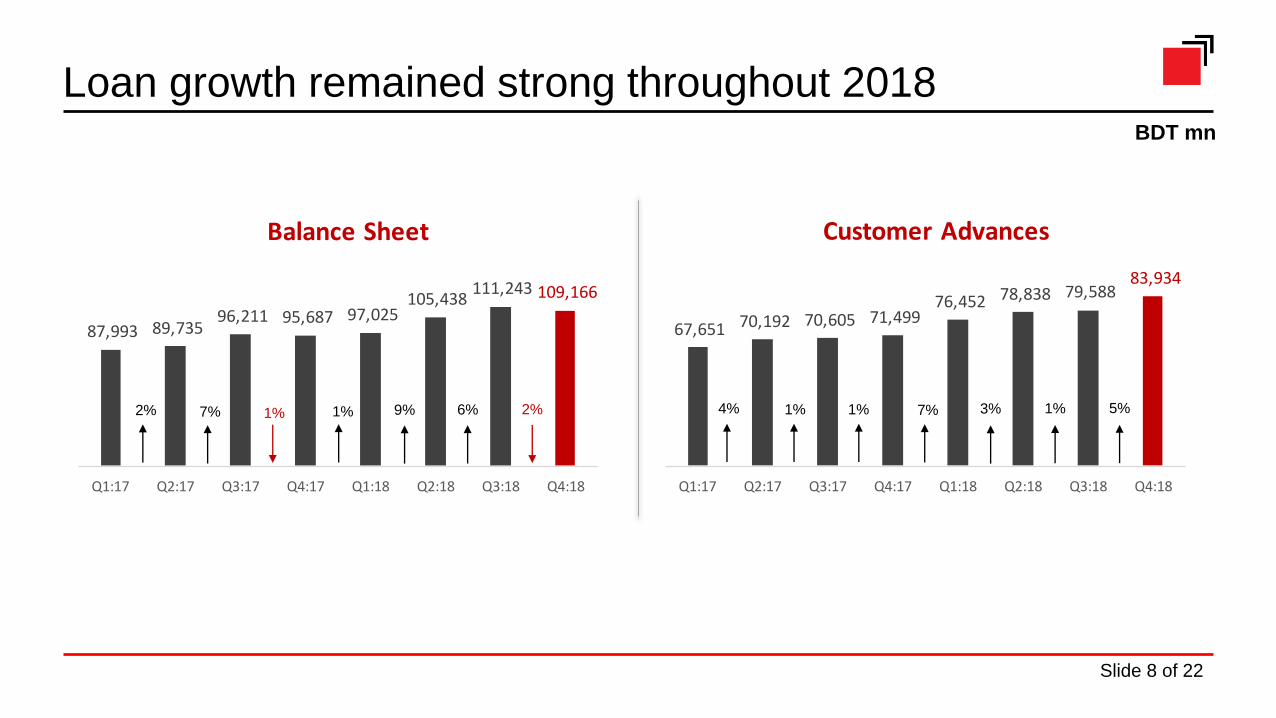
67,651 70,192 70,605 71,499 76,452 78,838 79,588
83,934
Q1:17 Q2:17 Q3:17 Q4:17 Q1:18 Q2:18 Q3:18 Q4:18
Customer Advances
87,993 89,735 96,211 95,687 97,025
105,438 111,243 109,166
Q1:17 Q2:17 Q3:17 Q4:17 Q1:18 Q2:18 Q3:18 Q4:18
Balance Sheet
Loan growth remained strong throughout 2018BDT mn
4% 1% 1% 7%2% 7% 1% 1% 9% 3%6% 1%2% 5%
Slide 8 of 22
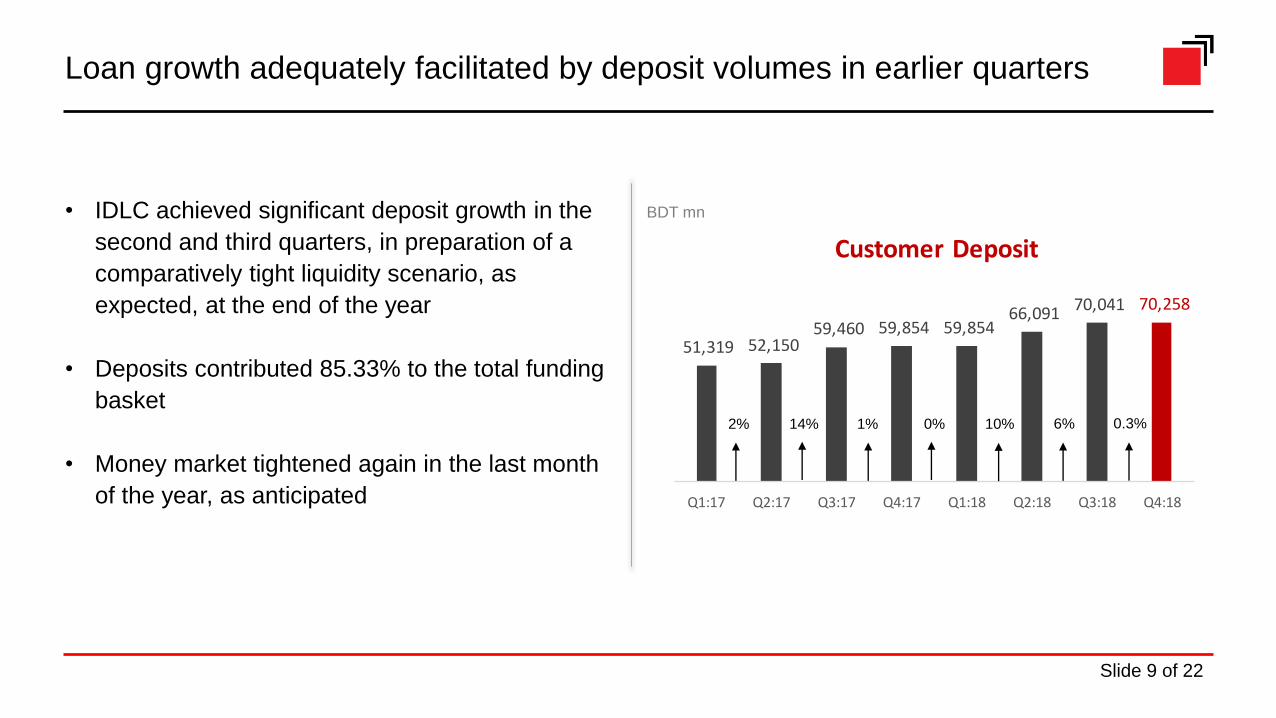
51,319 52,150 59,460 59,854 59,854
66,091 70,041 70,258
Q1:17 Q2:17 Q3:17 Q4:17 Q1:18 Q2:18 Q3:18 Q4:18
Customer Deposit
Loan growth adequately facilitated by deposit volumes in earlier quarters
BDT mn
2% 14% 1% 0% 10% 6%
• IDLC achieved significant deposit growth in the
second and third quarters, in preparation of a
comparatively tight liquidity scenario, as
expected, at the end of the year
• Deposits contributed 85.33% to the total funding
basket
• Money market tightened again in the last month
of the year, as anticipated
0.3%
Slide 9 of 22
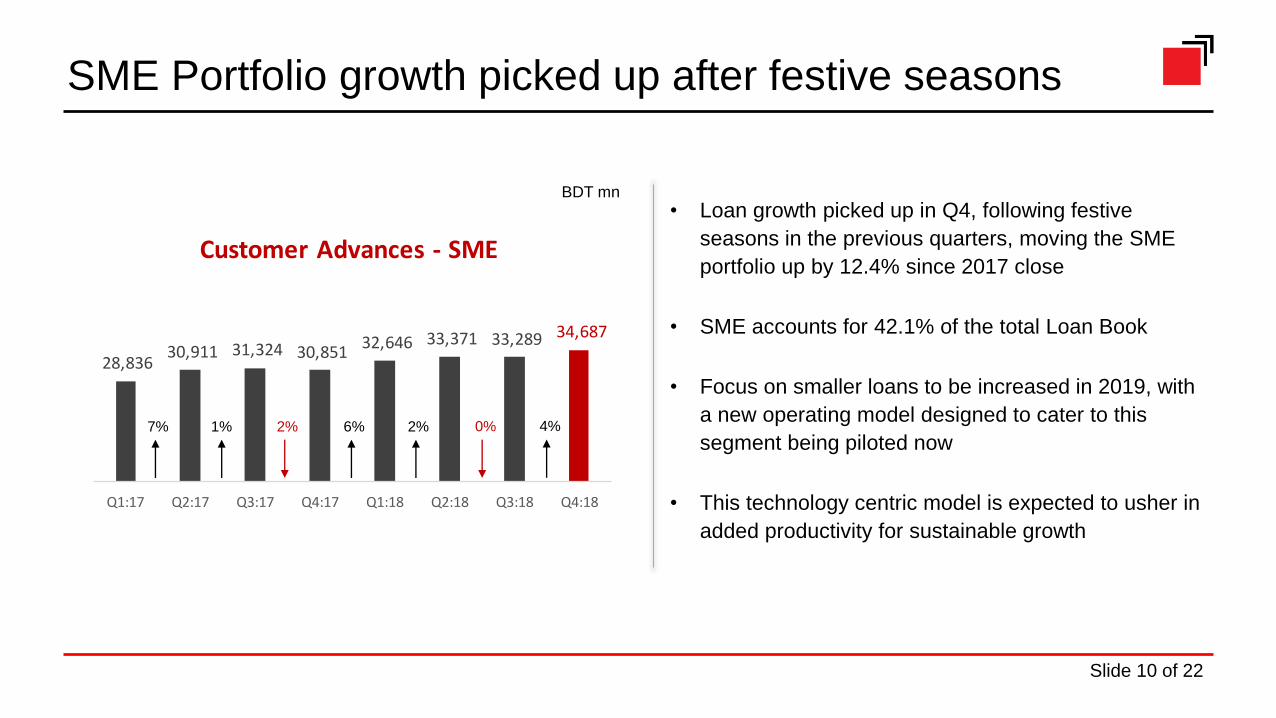
28,836 30,911 31,324 30,851
32,646 33,371 33,289 34,687
Q1:17 Q2:17 Q3:17 Q4:17 Q1:18 Q2:18 Q3:18 Q4:18
Customer Advances - SME
SME Portfolio growth picked up after festive seasons
BDT mn
7% 1% 2% 6% 2% 0%
• Loan growth picked up in Q4, following festive
seasons in the previous quarters, moving the SME
portfolio up by 12.4% since 2017 close
• SME accounts for 42.1% of the total Loan Book
• Focus on smaller loans to be increased in 2019, with
a new operating model designed to cater to this
segment being piloted now
• This technology centric model is expected to usher in
added productivity for sustainable growth
4%
Slide 10 of 22
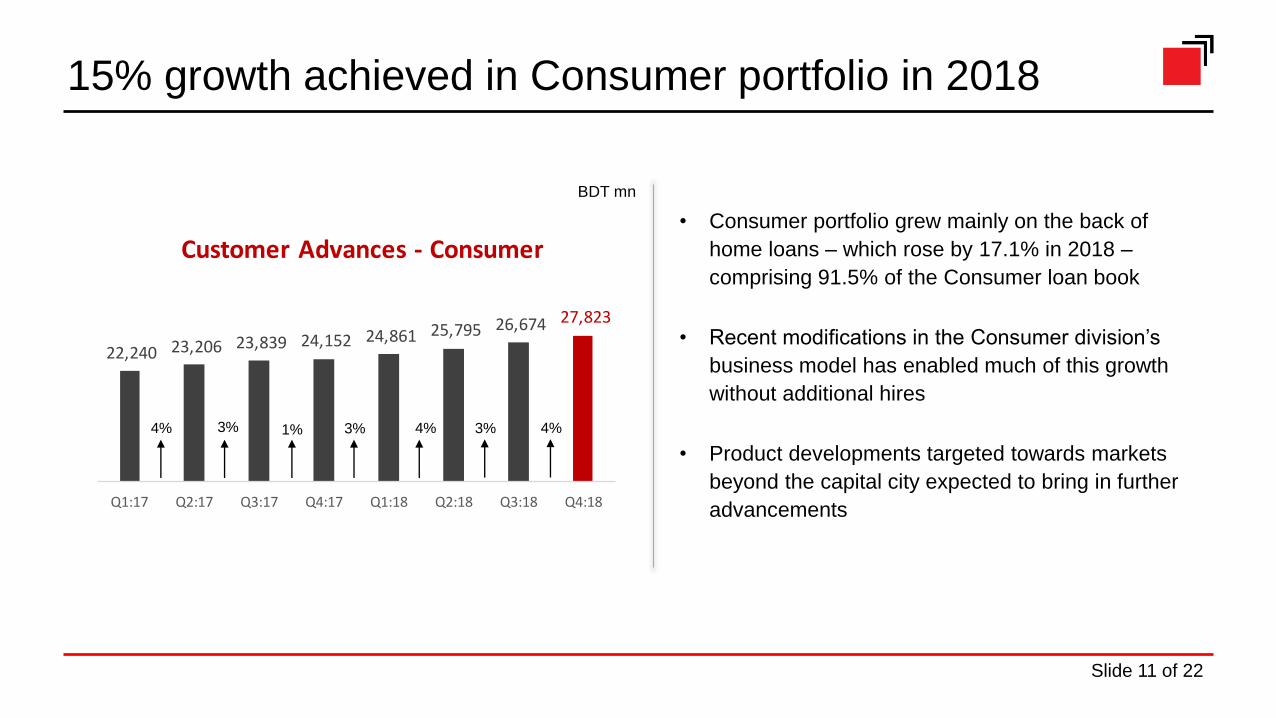
22,240 23,206 23,839 24,152 24,861 25,795 26,674 27,823
Q1:17 Q2:17 Q3:17 Q4:17 Q1:18 Q2:18 Q3:18 Q4:18
Customer Advances - Consumer
4% 3% 1%
BDT mn
3% 4% 3%
15% growth achieved in Consumer portfolio in 2018
• Consumer portfolio grew mainly on the back of
home loans – which rose by 17.1% in 2018 –
comprising 91.5% of the Consumer loan book
• Recent modifications in the Consumer division’s
business model has enabled much of this growth
without additional hires
• Product developments targeted towards markets
beyond the capital city expected to bring in further
advancements
4%
Slide 11 of 22
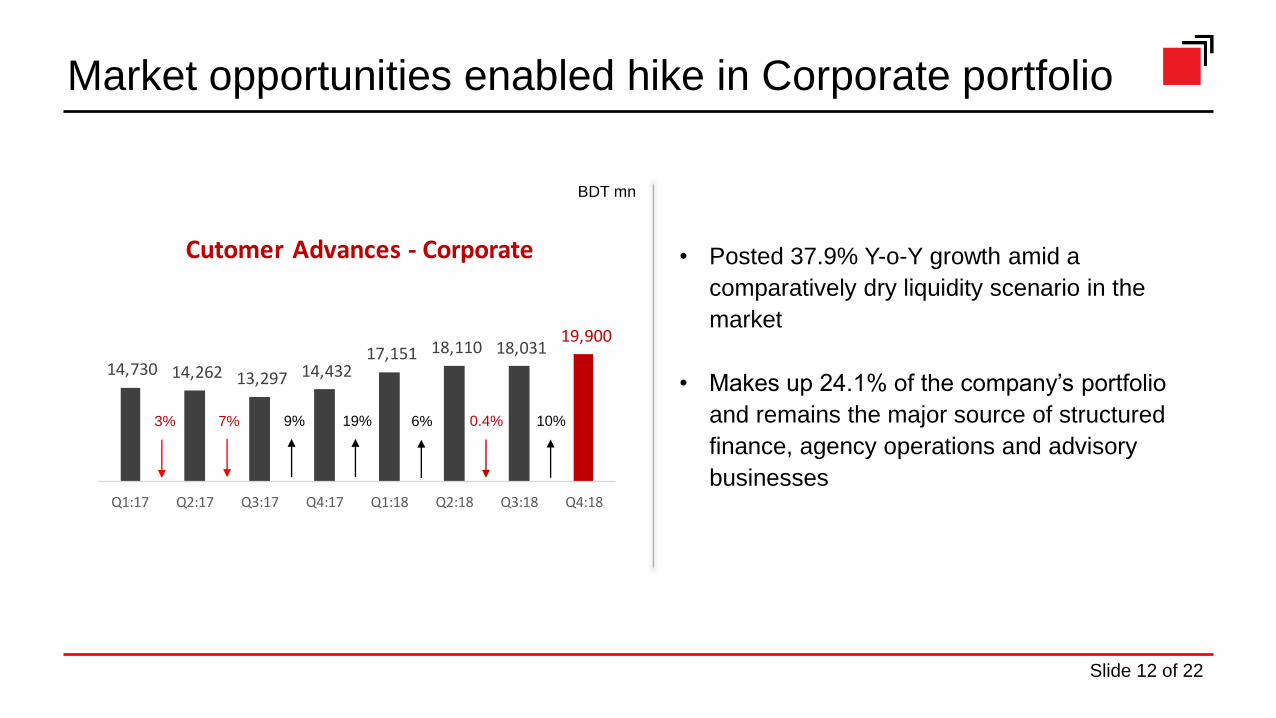
14,730 14,262 13,297 14,432 17,151 18,110 18,031
19,900
Q1:17 Q2:17 Q3:17 Q4:17 Q1:18 Q2:18 Q3:18 Q4:18
Cutomer Advances - Corporate
3% 7% 9%
• Posted 37.9% Y-o-Y growth amid a
comparatively dry liquidity scenario in the
market
• Makes up 24.1% of the company’s portfolio
and remains the major source of structured
finance, agency operations and advisory
businesses
BDT mn
19% 6% 0.4%
Market opportunities enabled hike in Corporate portfolio
10%
Slide 12 of 22
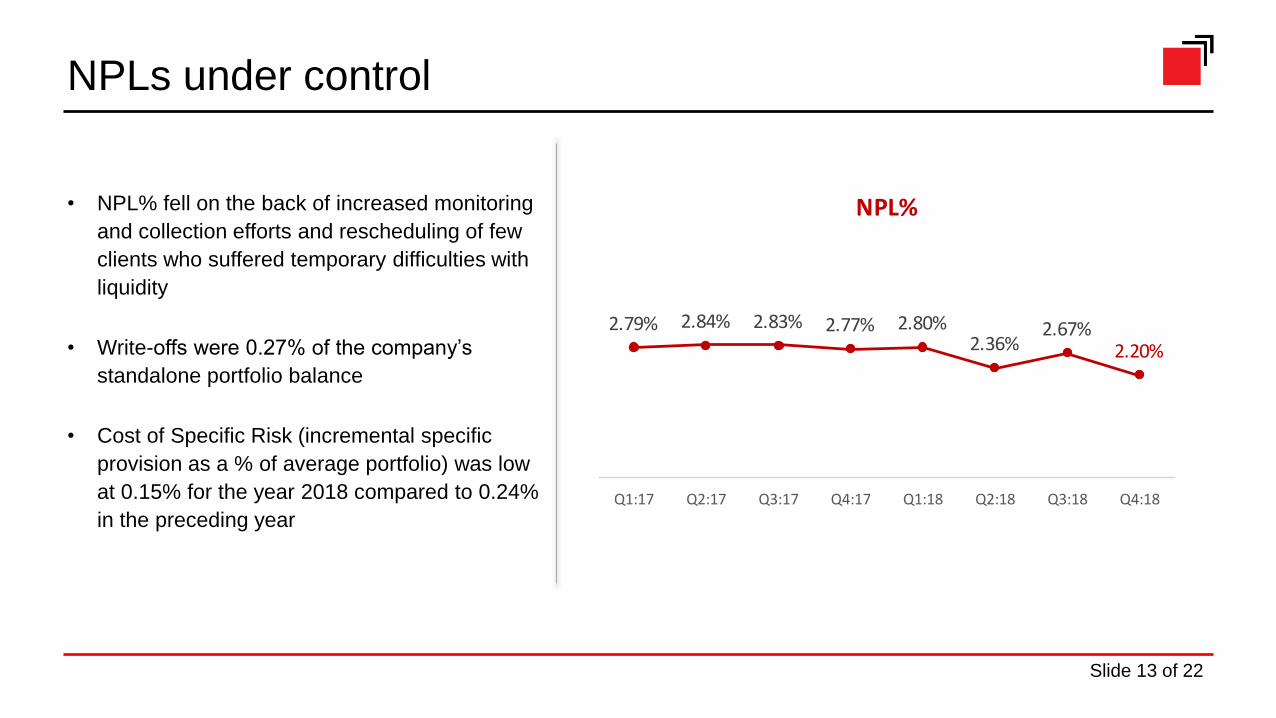
• NPL% fell on the back of increased monitoring
and collection efforts and rescheduling of few
clients who suffered temporary difficulties with
liquidity
• Write-offs were 0.27% of the company’s
standalone portfolio balance
• Cost of Specific Risk (incremental specific
provision as a % of average portfolio) was low
at 0.15% for the year 2018 compared to 0.24%
in the preceding year
NPLs under control
2.79% 2.84% 2.83% 2.77% 2.80%2.36%
2.67%2.20%
Q1:17 Q2:17 Q3:17 Q4:17 Q1:18 Q2:18 Q3:18 Q4:18
NPL%
Slide 13 of 22
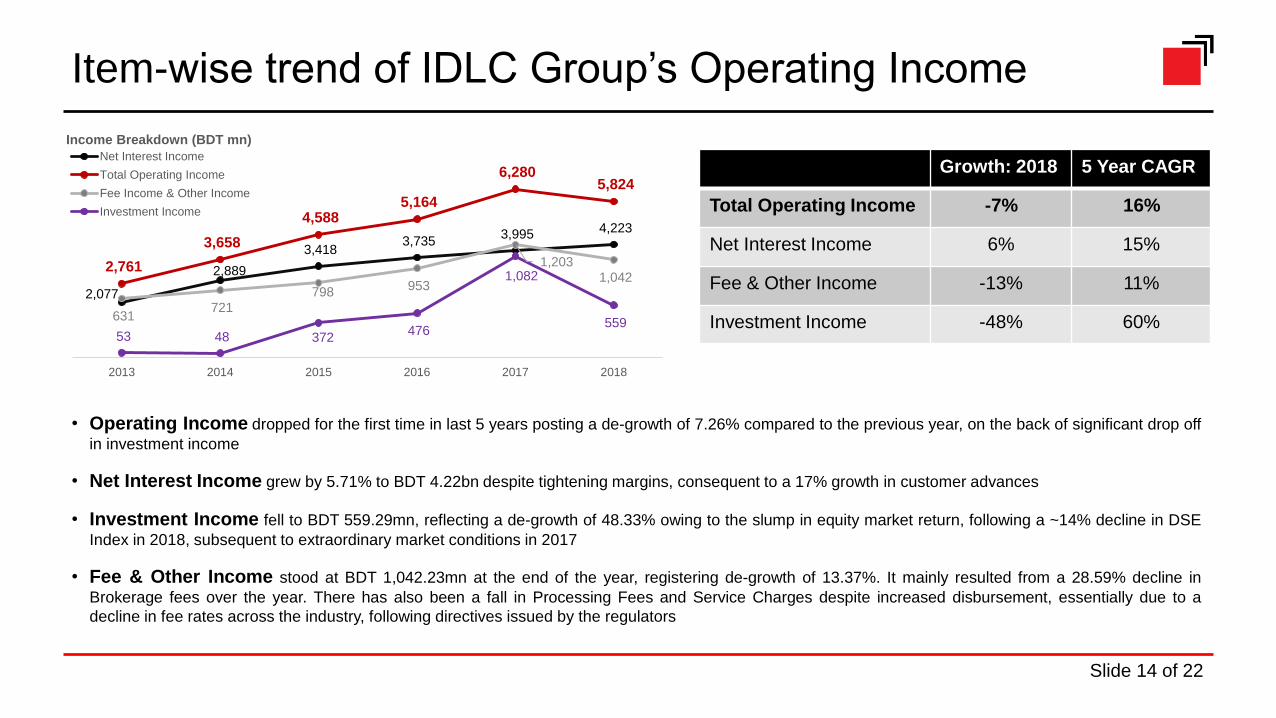
Item-wise trend of IDLC Group’s Operating Income
Growth: 2018 5 Year CAGR
Total Operating Income -7% 16%
Net Interest Income 6% 15%
Fee & Other Income -13% 11%
Investment Income -48% 60%
2,077
2,889
3,418 3,735
3,995 4,223
2,761
3,658
4,588 5,164
6,280 5,824
631 721
798 953
1,203 1,042
53 48 372 476
1,082
559
2013 2014 2015 2016 2017 2018
Income Breakdown (BDT mn)
Net Interest Income
Total Operating Income
Fee Income & Other Income
Investment Income
• Operating Income dropped for the first time in last 5 years posting a de-growth of 7.26% compared to the previous year, on the back of significant drop off
in investment income
• Net Interest Income grew by 5.71% to BDT 4.22bn despite tightening margins, consequent to a 17% growth in customer advances
• Investment Income fell to BDT 559.29mn, reflecting a de-growth of 48.33% owing to the slump in equity market return, following a ~14% decline in DSE
Index in 2018, subsequent to extraordinary market conditions in 2017
• Fee & Other Income stood at BDT 1,042.23mn at the end of the year, registering de-growth of 13.37%. It mainly resulted from a 28.59% decline in
Brokerage fees over the year. There has also been a fall in Processing Fees and Service Charges despite increased disbursement, essentially due to a
decline in fee rates across the industry, following directives issued by the regulators
Slide 14 of 22
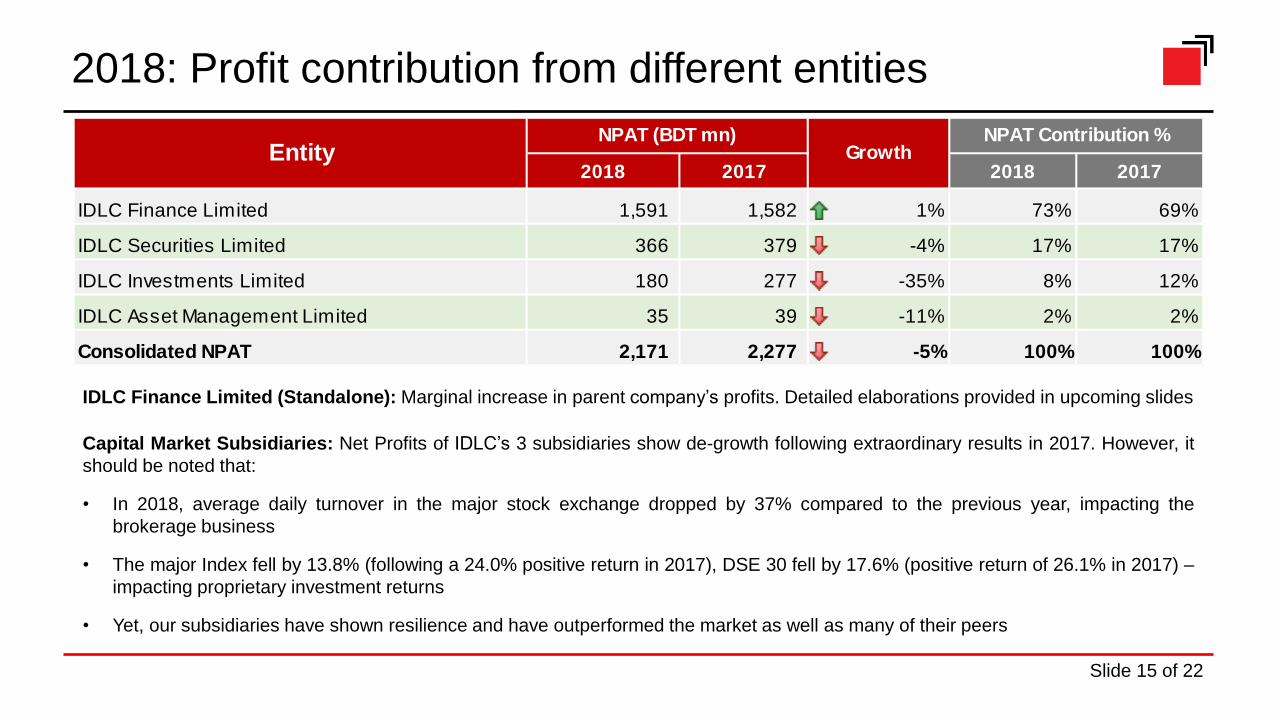
2018: Profit contribution from different entities
2018 2017 2018 2017
IDLC Finance Limited 1,591 1,582 1% 73% 69%
IDLC Securities Limited 366 379 -4% 17% 17%
IDLC Investments Limited 180 277 -35% 8% 12%
IDLC Asset Management Limited 35 39 -11% 2% 2%
Consolidated NPAT 2,171 2,277 -5% 100% 100%
EntityNPAT Contribution %
GrowthNPAT (BDT mn)
IDLC Finance Limited (Standalone): Marginal increase in parent company’s profits. Detailed elaborations provided in upcoming slides
Capital Market Subsidiaries: Net Profits of IDLC’s 3 subsidiaries show de-growth following extraordinary results in 2017. However, it
should be noted that:
• In 2018, average daily turnover in the major stock exchange dropped by 37% compared to the previous year, impacting the
brokerage business
• The major Index fell by 13.8% (following a 24.0% positive return in 2017), DSE 30 fell by 17.6% (positive return of 26.1% in 2017) –
impacting proprietary investment returns
• Yet, our subsidiaries have shown resilience and have outperformed the market as well as many of their peers
Slide 15 of 22
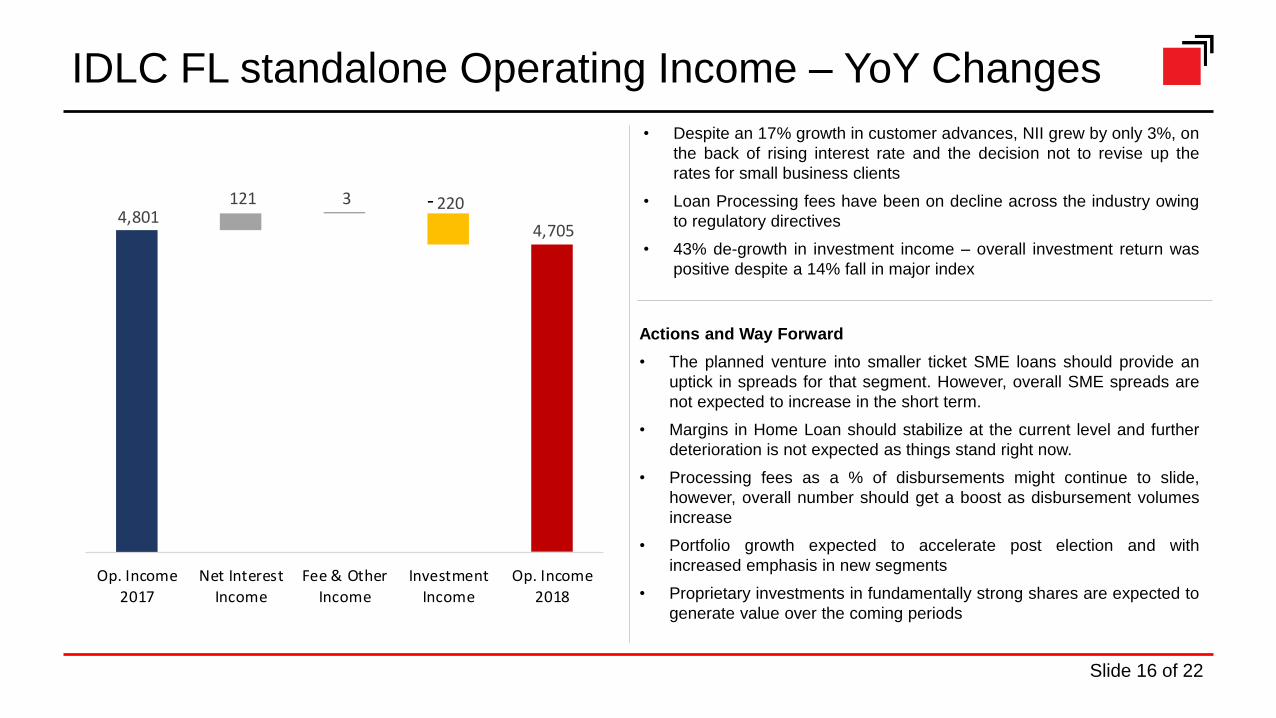
• Despite an 17% growth in customer advances, NII grew by only 3%, on
the back of rising interest rate and the decision not to revise up the
rates for small business clients
• Loan Processing fees have been on decline across the industry owing
to regulatory directives
• 43% de-growth in investment income – overall investment return was
positive despite a 14% fall in major index
Actions and Way Forward
• The planned venture into smaller ticket SME loans should provide an
uptick in spreads for that segment. However, overall SME spreads are
not expected to increase in the short term.
• Margins in Home Loan should stabilize at the current level and further
deterioration is not expected as things stand right now.
• Processing fees as a % of disbursements might continue to slide,
however, overall number should get a boost as disbursement volumes
increase
• Portfolio growth expected to accelerate post election and with
increased emphasis in new segments
• Proprietary investments in fundamentally strong shares are expected to
generate value over the coming periods
IDLC FL standalone Operating Income – YoY Changes
4,705
220 4,801
121 3
Op. Income
2017
Net Interest
Income
Fee & Other
Income
Investment
Income
Op. Income
2018
-
Slide 16 of 22
1,913
22
20
1,934 3
18
Op. Expense2017
Salary &Allowance
OfficeMaintenance
& Depreciation
Others* Advertisement& Promotional
Expense
Op. Expense2018
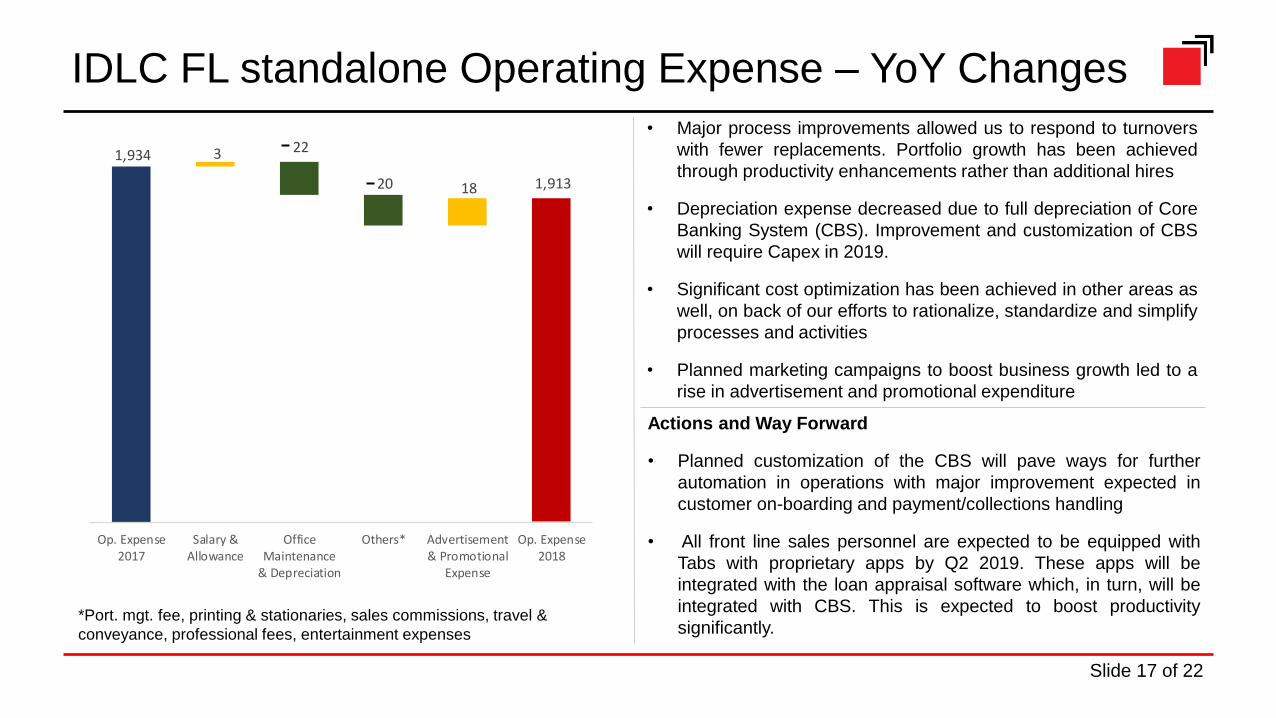
• Major process improvements allowed us to respond to turnovers
with fewer replacements. Portfolio growth has been achieved
through productivity enhancements rather than additional hires
• Depreciation expense decreased due to full depreciation of Core
Banking System (CBS). Improvement and customization of CBS
will require Capex in 2019.
• Significant cost optimization has been achieved in other areas as
well, on back of our efforts to rationalize, standardize and simplify
processes and activities
• Planned marketing campaigns to boost business growth led to a
rise in advertisement and promotional expenditure
IDLC FL standalone Operating Expense – YoY Changes
Actions and Way Forward
• Planned customization of the CBS will pave ways for further
automation in operations with major improvement expected in
customer on-boarding and payment/collections handling
• All front line sales personnel are expected to be equipped with
Tabs with proprietary apps by Q2 2019. These apps will be
integrated with the loan appraisal software which, in turn, will be
integrated with CBS. This is expected to boost productivity
significantly.*Port. mgt. fee, printing & stationaries, sales commissions, travel &
conveyance, professional fees, entertainment expenses
Slide 17 of 22
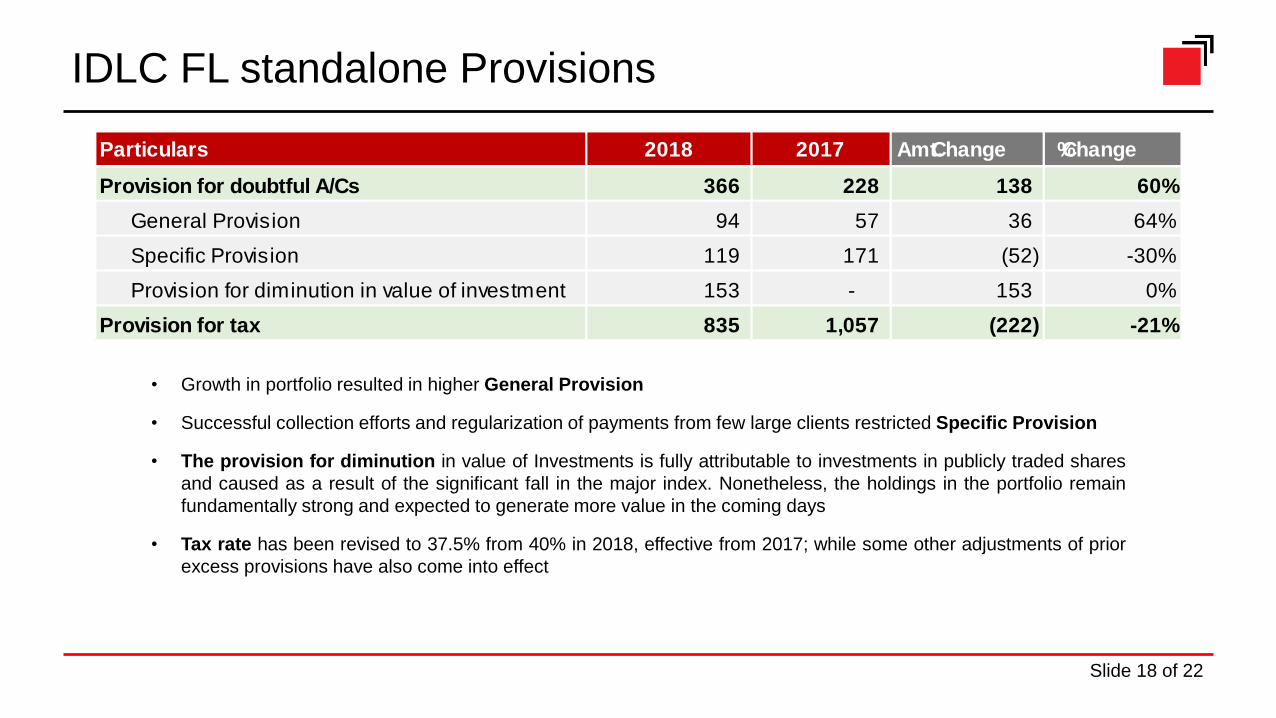
• Growth in portfolio resulted in higher General Provision
• Successful collection efforts and regularization of payments from few large clients restricted Specific Provision
• The provision for diminution in value of Investments is fully attributable to investments in publicly traded shares
and caused as a result of the significant fall in the major index. Nonetheless, the holdings in the portfolio remain
fundamentally strong and expected to generate more value in the coming days
• Tax rate has been revised to 37.5% from 40% in 2018, effective from 2017; while some other adjustments of prior
excess provisions have also come into effect
IDLC FL standalone Provisions
Particulars 2018 2017 Amt. Change % Change
Provision for doubtful A/Cs 366 228 138 60%
General Provision 94 57 36 64%
Specific Provision 119 171 (52) -30%
Provision for diminution in value of investment 153 - 153 0%
Provision for tax 835 1,057 (222) -21%
Slide 18 of 22
Ongoing challenges and mitigation avenues
• Maturity mismatch – lack of a mature bond market and limited availability of other long-term funding means creates a maturity
mismatch for most Banks and NBFIs that book long-term loan assets
Focus on maintaining renewal rates
o On an average, 75%-80% deposits in IDLC are renewed upon maturity
Continue to seek long-term funding opportunities through the bond market and other avenue for borrowing
Any reform of the National Savings Certificate will potentially boost mobilization of long term deposits
• Tightening margins – growing competition in home loans as well as SMEs have gradually reduced margins over the years
Roll-out product development initiatives targeted towards markets beyond the capital city
o Mainly through developing the right offerings for lower ticket sizes, both for SME and Home Loans
Continue efforts at improving operational efficiency and scalability to reduce loan acquisition and management costs
Continue improvements in loan underwriting and collections policies and procedures to decrease cost of risk further
Slide 19 of 22
Ongoing challenges and mitigation avenues
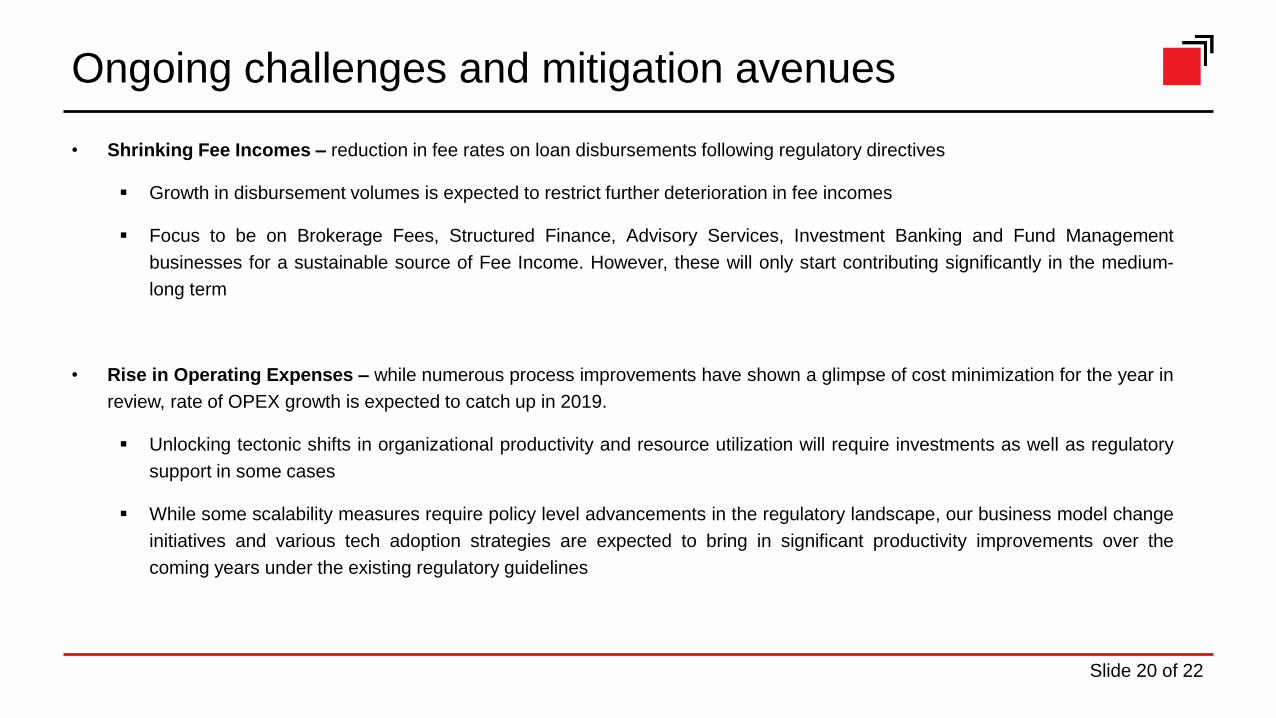
• Shrinking Fee Incomes – reduction in fee rates on loan disbursements following regulatory directives
Growth in disbursement volumes is expected to restrict further deterioration in fee incomes
Focus to be on Brokerage Fees, Structured Finance, Advisory Services, Investment Banking and Fund Management
businesses for a sustainable source of Fee Income. However, these will only start contributing significantly in the medium-
long term
• Rise in Operating Expenses – while numerous process improvements have shown a glimpse of cost minimization for the year in
review, rate of OPEX growth is expected to catch up in 2019.
Unlocking tectonic shifts in organizational productivity and resource utilization will require investments as well as regulatory
support in some cases
While some scalability measures require policy level advancements in the regulatory landscape, our business model change
initiatives and various tech adoption strategies are expected to bring in significant productivity improvements over the
coming years under the existing regulatory guidelines
Slide 20 of 22
Accomplishments of 2018 and focus areas going forward
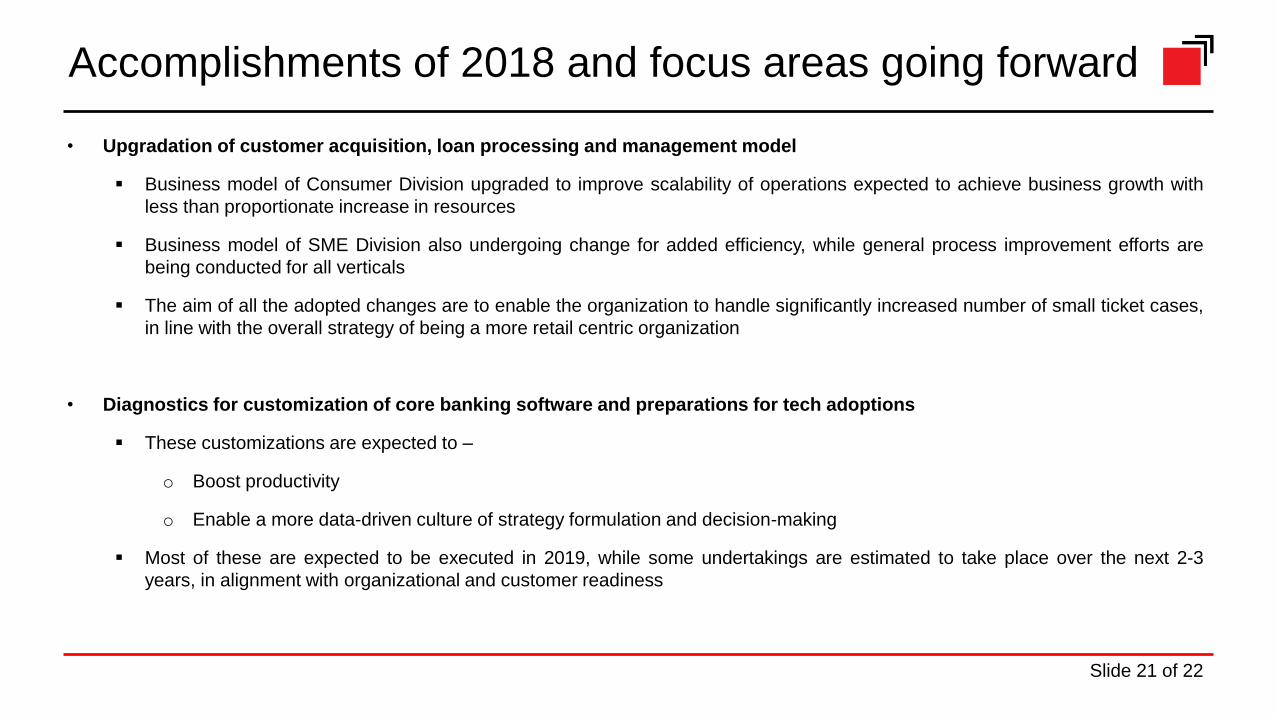
• Upgradation of customer acquisition, loan processing and management model
Business model of Consumer Division upgraded to improve scalability of operations expected to achieve business growth with
less than proportionate increase in resources
Business model of SME Division also undergoing change for added efficiency, while general process improvement efforts are
being conducted for all verticals
The aim of all the adopted changes are to enable the organization to handle significantly increased number of small ticket cases,
in line with the overall strategy of being a more retail centric organization
• Diagnostics for customization of core banking software and preparations for tech adoptions
These customizations are expected to –
o Boost productivity
o Enable a more data-driven culture of strategy formulation and decision-making
Most of these are expected to be executed in 2019, while some undertakings are estimated to take place over the next 2-3
years, in alignment with organizational and customer readiness
Slide 21 of 22
Accomplishments of 2018 and focus areas going forward
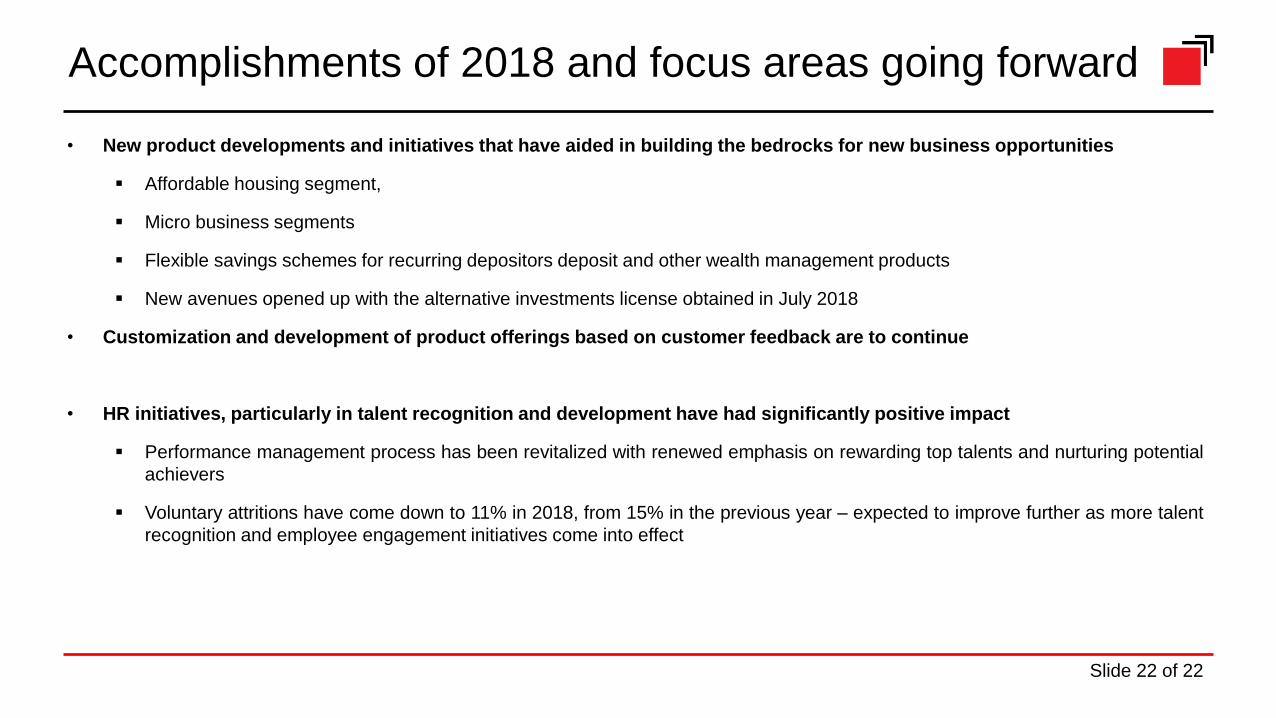
• New product developments and initiatives that have aided in building the bedrocks for new business opportunities
Affordable housing segment,
Micro business segments
Flexible savings schemes for recurring depositors deposit and other wealth management products
New avenues opened up with the alternative investments license obtained in July 2018
• Customization and development of product offerings based on customer feedback are to continue
• HR initiatives, particularly in talent recognition and development have had significantly positive impact
Performance management process has been revitalized with renewed emphasis on rewarding top talents and nurturing potential
achievers
Voluntary attritions have come down to 11% in 2018, from 15% in the previous year – expected to improve further as more talent
recognition and employee engagement initiatives come into effect
Slide 22 of 22

Thank you
Q & A


![20140408 digital newspapers collections [idlc kuala lumpur]](https://img.pdfslide.us/doc/110x75/53fea18e8d7f72835c8b4595/20140408-digital-newspapers-collections-idlc-kuala-lumpur.jpg)