Embed Size (px)
Citation preview
1
IDLC ASSET MANAGEMENT LIMITED
ASSET MANAGER’S REPORT March 31, 2018
Mutual Funds are subject to market risks. Investors are highly encouraged to know all the risks associated with investment
from the prospectus of respective mutual funds.
To know more and invest, please visit aml.idlc.com or call 16409.
Head office: South Avenue Tower (5th floor),
Unit no: 502, House: 50, Road: 3,
7 Gulshan Avneue, Dhaka.
DATE OF PUBLICATION: April 30, 2018
2
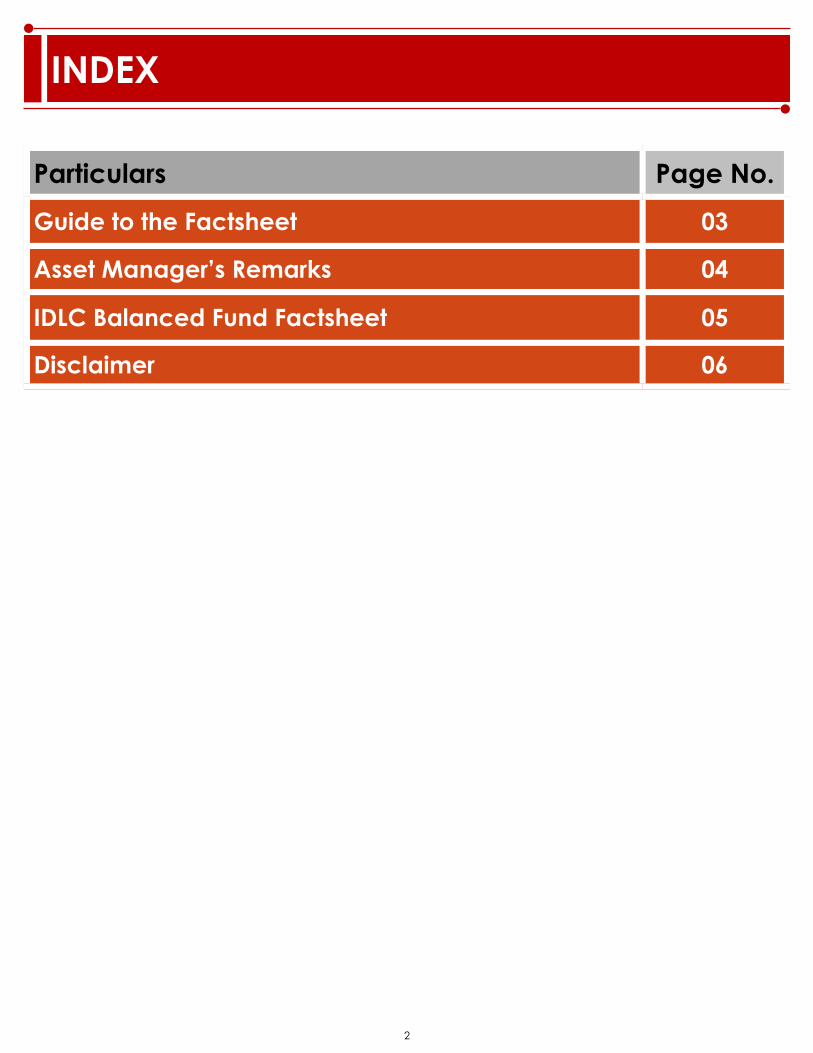
INDEX
Particulars Page No.
Guide to the Factsheet 03
Asset Manager’s Remarks 04
IDLC Balanced Fund Factsheet 05
Disclaimer 06
3
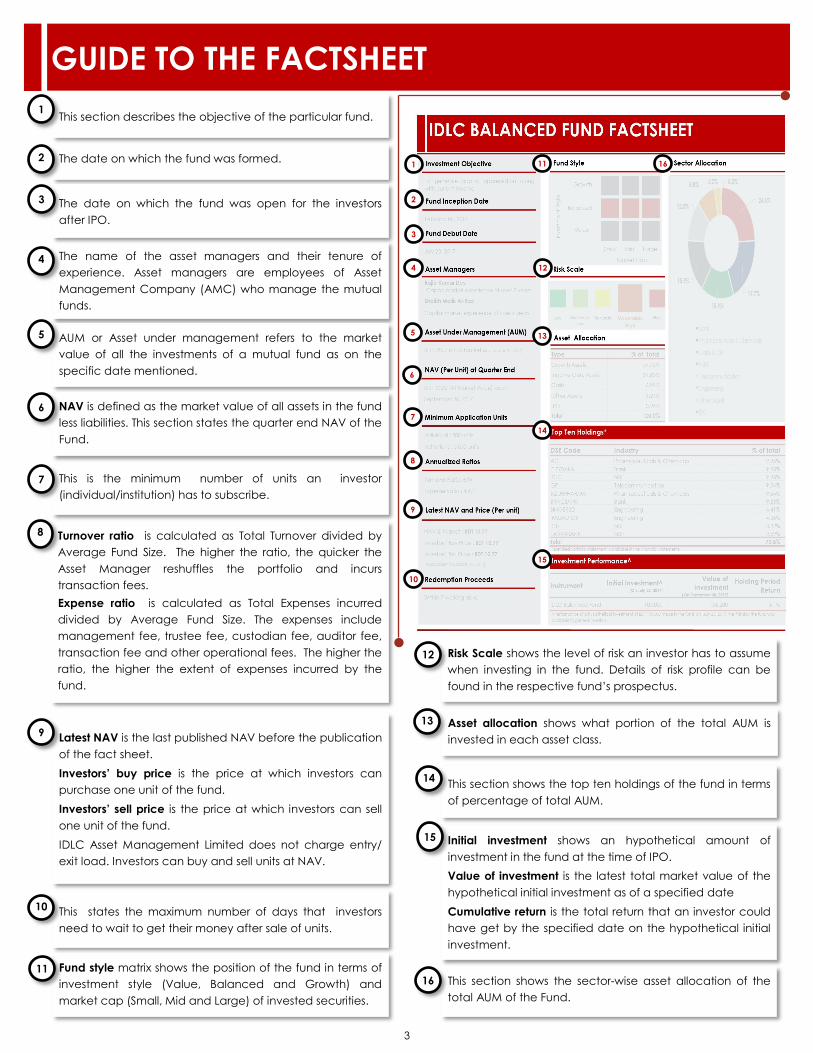
GUIDE TO THE FACTSHEET
This section describes the objective of the particular fund. 1
The date on which the fund was formed. 2
The name of the asset managers and their tenure of
experience. Asset managers are employees of Asset
Management Company (AMC) who manage the mutual
funds.
4
AUM or Asset under management refers to the market
value of all the investments of a mutual fund as on the
specific date mentioned.
5
NAV is defined as the market value of all assets in the fund
less liabilities. This section states the quarter end NAV of the
Fund.
6
Turnover ratio is calculated as Total Turnover divided by
Average Fund Size. The higher the ratio, the quicker the
Asset Manager reshuffles the portfolio and incurs
transaction fees.
Expense ratio is calculated as Total Expenses incurred
divided by Average Fund Size. The expenses include
management fee, trustee fee, custodian fee, auditor fee,
transaction fee and other operational fees. The higher the
ratio, the higher the extent of expenses incurred by the
fund.
8
This states the maximum number of days that investors
need to wait to get their money after sale of units.
10
Fund style matrix shows the position of the fund in terms of
investment style (Value, Balanced and Growth) and
market cap (Small, Mid and Large) of invested securities.
11
This section shows the top ten holdings of the fund in terms
of percentage of total AUM.
14
Initial investment shows an hypothetical amount of
investment in the fund at the time of IPO.
Value of investment is the latest total market value of the
hypothetical initial investment as of a specified date
Cumulative return is the total return that an investor could
have get by the specified date on the hypothetical initial
investment.
15
This section shows the sector-wise asset allocation of the
total AUM of the Fund.
16
Latest NAV is the last published NAV before the publication
of the fact sheet.
Investors’ buy price is the price at which investors can
purchase one unit of the fund.
Investors’ sell price is the price at which investors can sell
one unit of the fund.
IDLC Asset Management Limited does not charge entry/
exit load. Investors can buy and sell units at NAV.
9
This is the minimum number of units an investor
(individual/institution) has to subscribe.
7
Asset allocation shows what portion of the total AUM is
invested in each asset class.
13
1
4
3
8
11
2
5
6
7
14
15
16
12
13
9
10
Risk Scale shows the level of risk an investor has to assume
when investing in the fund. Details of risk profile can be
found in the respective fund’s prospectus.
12
The date on which the fund was open for the investors
after IPO.
3
4
ASSET MANAGER’S REMARKS
Get the updates on the investments and the performance of your Fund right from
your Asset Manager.
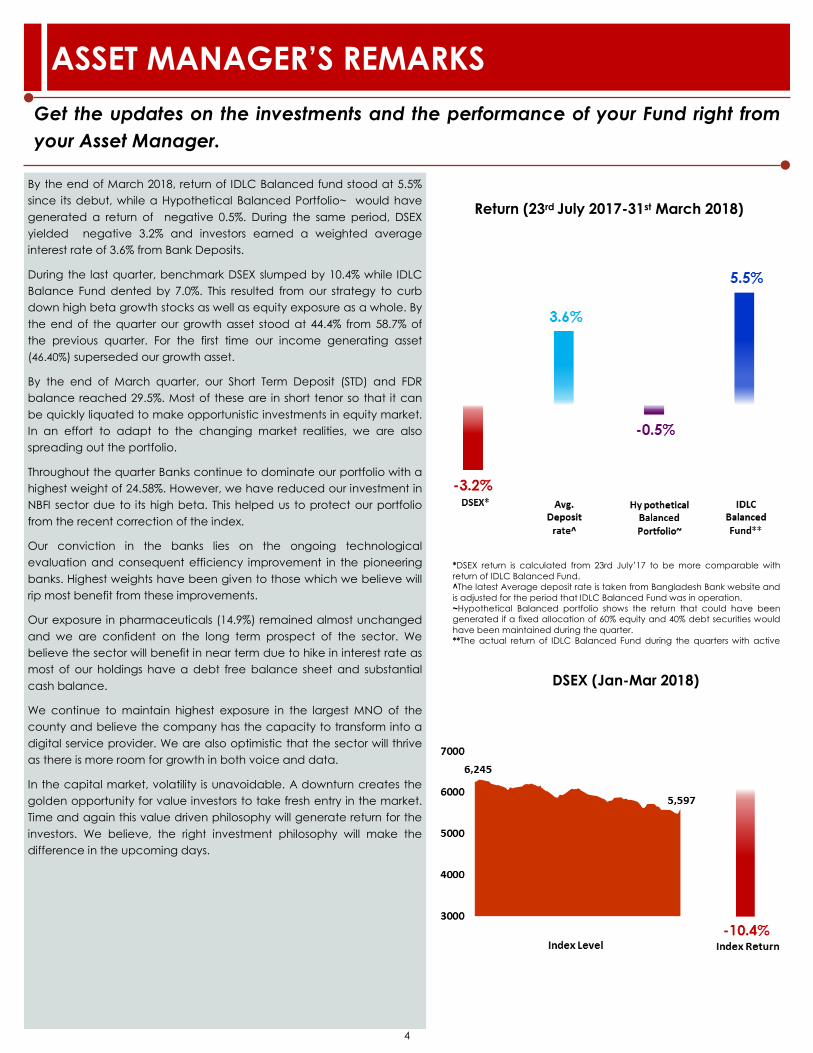
By the end of March 2018, return of IDLC Balanced fund stood at 5.5%
since its debut, while a Hypothetical Balanced Portfolio~ would have
generated a return of negative 0.5%. During the same period, DSEX
yielded negative 3.2% and investors earned a weighted average
interest rate of 3.6% from Bank Deposits.
During the last quarter, benchmark DSEX slumped by 10.4% while IDLC
Balance Fund dented by 7.0%. This resulted from our strategy to curb
down high beta growth stocks as well as equity exposure as a whole. By
the end of the quarter our growth asset stood at 44.4% from 58.7% of
the previous quarter. For the first time our income generating asset
(46.40%) superseded our growth asset.
By the end of March quarter, our Short Term Deposit (STD) and FDR
balance reached 29.5%. Most of these are in short tenor so that it can
be quickly liquated to make opportunistic investments in equity market.
In an effort to adapt to the changing market realities, we are also
spreading out the portfolio.
Throughout the quarter Banks continue to dominate our portfolio with a
highest weight of 24.58%. However, we have reduced our investment in
NBFI sector due to its high beta. This helped us to protect our portfolio
from the recent correction of the index.
Our conviction in the banks lies on the ongoing technological
evaluation and consequent efficiency improvement in the pioneering
banks. Highest weights have been given to those which we believe will
rip most benefit from these improvements.
Our exposure in pharmaceuticals (14.9%) remained almost unchanged
and we are confident on the long term prospect of the sector. We
believe the sector will benefit in near term due to hike in interest rate as
most of our holdings have a debt free balance sheet and substantial
cash balance.
We continue to maintain highest exposure in the largest MNO of the
county and believe the company has the capacity to transform into a
digital service provider. We are also optimistic that the sector will thrive
as there is more room for growth in both voice and data.
In the capital market, volatility is unavoidable. A downturn creates the
golden opportunity for value investors to take fresh entry in the market.
Time and again this value driven philosophy will generate return for the
investors. We believe, the right investment philosophy will make the
difference in the upcoming days.
Return (23rd July 2017-31st March 2018)
DSEX (Jan-Mar 2018)
*DSEX return is calculated from 23rd July’17 to be more comparable with
return of IDLC Balanced Fund.
^The latest Average deposit rate is taken from Bangladesh Bank website and
is adjusted for the period that IDLC Balanced Fund was in operation.
~Hypothetical Balanced portfolio shows the return that could have been
generated if a fixed allocation of 60% equity and 40% debt securities would
have been maintained during the quarter.
**The actual return of IDLC Balanced Fund during the quarters with active
5
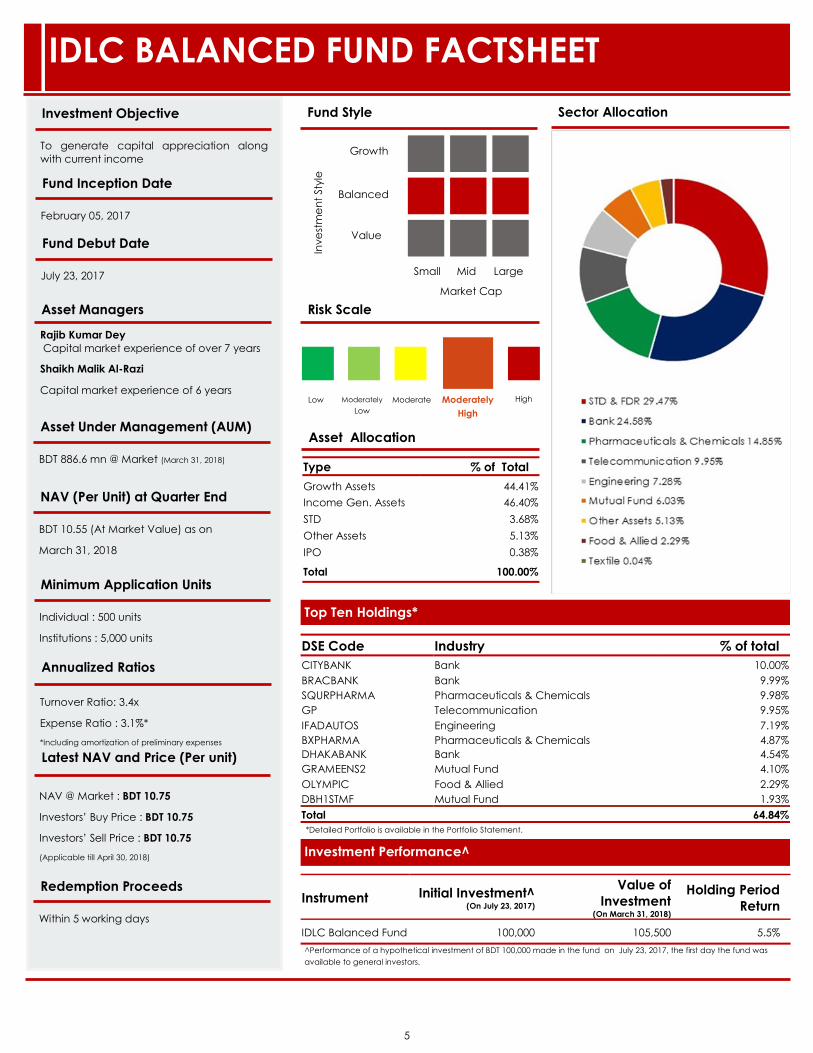
IDLC BALANCED FUND FACTSHEET
Investment Objective
To generate capital appreciation along
with current income
Asset Managers
Rajib Kumar Dey
Capital market experience of over 7 years
Shaikh Malik Al-Razi
Capital market experience of 6 years
Latest NAV and Price (Per unit)
NAV @ Market : BDT 10.75
Investors’ Buy Price : BDT 10.75
Investors’ Sell Price : BDT 10.75
(Applicable till April 30, 2018)
Annualized Ratios
Turnover Ratio: 3.4x
Expense Ratio : 3.1%*
*Including amortization of preliminary expenses
DSE Code Industry % of total
CITYBANK Bank 10.00%
BRACBANK Bank 9.99%
SQURPHARMA Pharmaceuticals & Chemicals 9.98%
GP Telecommunication 9.95%
IFADAUTOS Engineering 7.19%
BXPHARMA Pharmaceuticals & Chemicals 4.87%
DHAKABANK Bank 4.54%
GRAMEENS2 Mutual Fund 4.10%
OLYMPIC Food & Allied 2.29%
DBH1STMF Mutual Fund 1.93%
Total 64.84%
Top Ten Holdings*
Fund Inception Date
February 05, 2017
Minimum Application Units
Individual : 500 units
Institutions : 5,000 units
Redemption Proceeds
Within 5 working days
Instrument Initial Investment^ (On July 23, 2017)
Value of
Investment (On March 31, 2018)
Holding Period
Return
IDLC Balanced Fund 100,000 105,500 5.5%
Investment Performance^
Sector Allocation
Low Moderately
Low
Moderate Moderately
High
High
Risk Scale
Type % of Total
Growth Assets 44.41%
Income Gen. Assets 46.40%
STD 3.68%
Other Assets 5.13%
IPO 0.38%
Total 100.00%
Asset Allocation Asset Under Management (AUM)
BDT 886.6 mn @ Market (March 31, 2018)
Fund Style
Growth
Balanced
Value
Inve
stm
en
t Sty
le
Market Cap
Small Mid Large
NAV (Per Unit) at Quarter End
BDT 10.55 (At Market Value) as on
March 31, 2018
*Detailed Portfolio is available in the Portfolio Statement.
^Performance of a hypothetical investment of BDT 100,000 made in the fund on July 23, 2017, the first day the fund was
available to general investors.
Fund Debut Date
July 23, 2017
6
DISCLAIMER
Investors should know that the return from mutual funds is not guaranteed. Past performance of
the Sponsor and their affiliates / AMC does not guarantee future performance of the funds. Name
of the funds does not in any manner indicate either the quality of the funds or their future
prospects and returns.
Mutual Funds are subject to market risks. Investors are highly encouraged to know all the risks
associated with investment from the prospectus of respective mutual funds.
To know more and invest, please visit aml.idlc.com or call 16409.