Embed Size (px)
Citation preview
Identifying Winners and Losers in Southern Africa from Global Trade Policy Reform:
Integrating Findings from GTAP and Poverty Case Studies
Paper prepared for the Fourth Annual Conference on Global Economic
Analysis Purdue University, West Lafayette, June 27-29, 2001
David Evans Institute of Development Studies,
University of Sussex, Brighton BN1 9RE, UK
tel 44 1273 606261 [email protected]
CONTENTS ABSTRACT ................................................................................................................................................. II
1. INTRODUCTION TO TRADE AND POVERTY ISSUES.................................................................. 1
1.1 AGGREGATE VS DISAGGREGATED APPROACH ...................................................................................... 1 TABLE 1: WINNERS AND LOSERS FROM TRADE POLICY CHANGE: IMPACT ON INCOME POVERTY ............................................................................................................................................. 2
1.2 METHODOLOGY.................................................................................................................................... 3 1.3 DEVELOPING THE ARGUMENT: CASE STUDIES AND GTAP: A ZAMBIA ‘EXAMPLE’ .............................. 4 1.4 HYPOTHESIS ......................................................................................................................................... 4
2. REGIONAL CONTEXT OF THE ZAMBIAN 'EXAMPLE'............................................................... 4
2.1 ECONOMIC STRUCTURE OF SOUTHERN AFRICAN ECONOMIES .............................................................. 4 TABLE 2: ECONOMIC STRUCTURE OF SOUTHERN AFRICAN ECONOMIES ............................. 5
2.2 REGIONAL CONTEXT OF TRADE POLICY LIBERALISATION.................................................................... 5 2.3 POVERTY ESTIMATES FOR SOUTHERN AFRICA ..................................................................................... 5
TABLE 3: POVERTY MONITORING FOR SEVEN SOUTHERN AFRICAN COUNTRIES ................ 6
3. SOME SALIENT FEATURES OF ZAMBIA CASE STUDIES .......................................................... 6
3.1 SALIENT FEATURES SUMMARISED ........................................................................................................ 6 3.2 RECEIVED WISDOM ON TRADE POLICY LIBERALISATION ..................................................................... 7
4. ZAMBIA IN THE CONTEXT OF A MULTI REGIONAL TRADE MODEL.................................. 7
4.1 INCOME POVERTY IMPACT OF TRADE POLICY CHANGE........................................................................ 7 4.2 THE DATASET....................................................................................................................................... 8
TABLE 4: STRUCTURE OF GTAP DATABASE.................................................................................. 8 4.3 OVERVIEW OF MODEL AND ASSUMPTIONS ........................................................................................... 8 4.4 MEASUREMENT OF PROTECTION AND STRUCTURE OF PROTECTION IN SOUTHERN AFRICA .................. 9
TABLE 5. SADC APPLIED TARIFFS USED IN POLICY MODELS, 1990s..................................... 10 4.5 THE TRADE POLICY EXPERIMENTS ..................................................................................................... 10
5. SOME PRELIMINARY RESULTS ..................................................................................................... 11
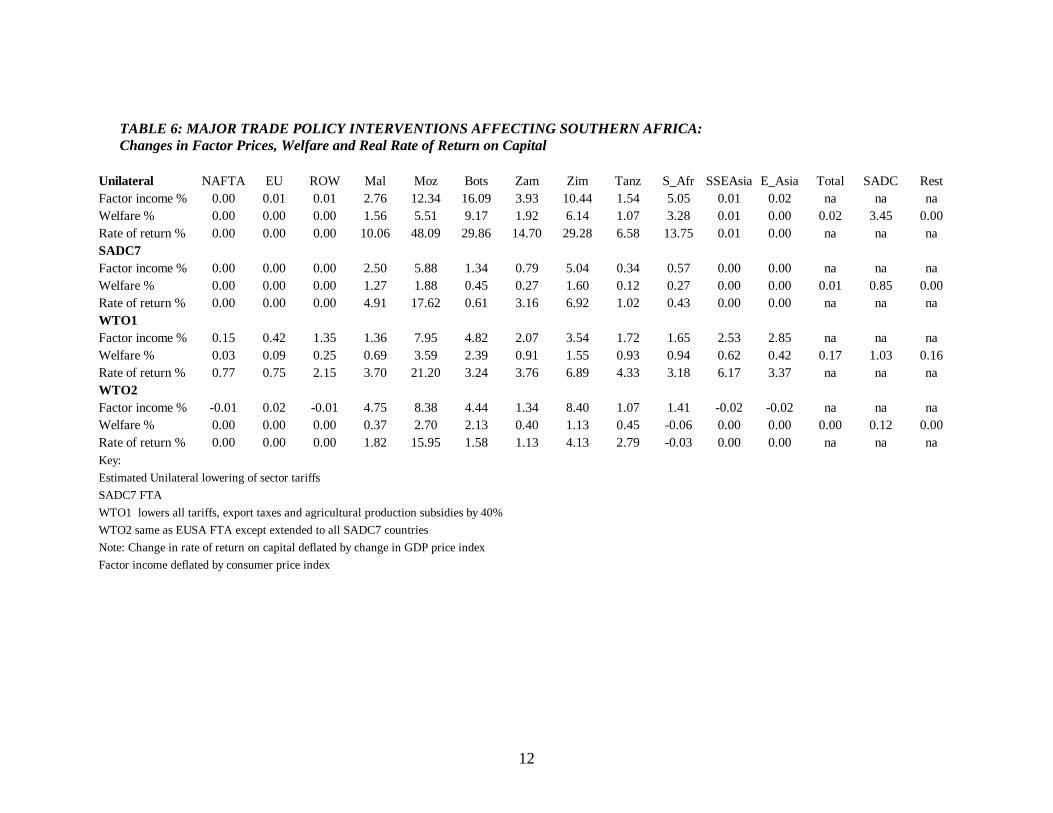
TABLE 6: MAJOR TRADE POLICY INTERVENTIONS AFFECTING SOUTHERN AFRICA: ........ 12 Changes in Factor Prices, Welfare and Real Rate of Return on Capital............................................ 12 TABLE 7: TRADE SHOCKS, HOUSEHOLD INCOME POVERTY IN ZAMBIA:.............................. 14 Real Household Income Net of Taxes Change %................................................................................ 14 TABLE 8: CHANGE IN OUTPUT IN ZAMBIA %: ............................................................................ 16 Trade Policy Shocks............................................................................................................................ 16
6. CONCLUSIONS..................................................................................................................................... 16
APPENDIX ................................................................................................................................................. 18
TABLE A.1: TRADE POLICY INTERVENTIONS AFFECTING SOUTHERN AFRICA IN DETAIL: .. Changes in Factor Prices, Welfare and Real Rate of Return on Capital 19
REFERENCES CONSULTED ................................................................................................................. 20
Abstract The IFI's rely on twin propositions that poverty alleviation is best pursued through increased growth, and that trade liberalisation encourages growth and thereby poverty alleviation. These aggregate propositions are not disputed in this paper. Rather, the argument is made for disaggregation to identify the winners and losers among the poor in the short and medium run from further trade policy liberalisation, both between and within countries. Disaggregation is important on both equity grounds, especially when the losers are among the poor. It is also important on efficiency grounds particularly when designing policies to help poor losers realise the opportunities for gain from trade policy liberalisation in the longer run. Two methodologies are frequently employed to assess the linkages between trade and poverty. Country and sector case studies dominate the literature. The key difficulty with case studies is that it is not possible to deploy their rich descriptive data in a consistent analytical framework. It is usually not possible to construct a quantitative counterfactual situation, for example the impact of a trade policy change on the poor. Obtaining a counterfactual through general equilibrium trade models has its own catalogue of difficulties arising from data availability, model assumptions and interpretation of results. The two methodologies lie at extreme ends of a spectrum, but insights from both can be mutually reinforcing. This paper uses Zambia as an 'example' country to explore the possibility of combining the rich poverty case study material available for that country with the results for Zambia of a multilateral trade model based on the GTAP dataset and modelling software. It describes some of the salient features of case studies of poverty in Zambia. A common thread runs through all the case studies, that trade policy reform in Zambia is likely to be pro-poor. This key proposition is tested using the GTAP dataset and modelling software. The GTAP database for 1997 is described including an extension for Zambia to permit the analysis of poverty impacts for four classes of households together with the modelling strategy adopted for this exploratory study. It then reports on the poverty impacts of a series of trade policy experiments using the 1996 LCMS Survey for Zambia to estimate headcount changes from: • Unilateral trade policy reforms in Southern Africa that took place from 1992-4 up to
1997. • A seven-country version of the SADC FTA. • A 'suppose' WTO Round. • A 'suppose' effective extension of the EU/South Africa FTA into an EU/SADC7 FTA
through Least Developed Country access into the EU through negotiations about to begin.
Zambian households are disaggregated into four groups so that GTAP aggregate household results can be disaggregated to real post-tax income changes in each of the four household groups in post simulation calculations. A key finding is that regionally
ii
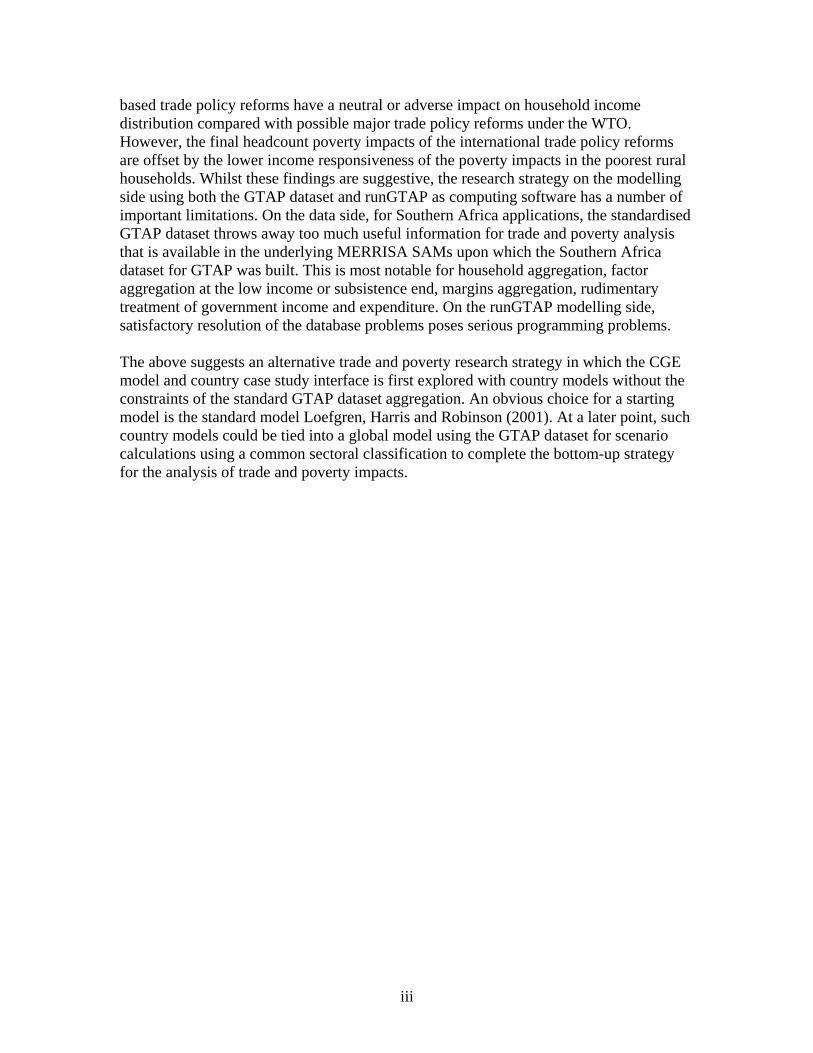
based trade policy reforms have a neutral or adverse impact on household income distribution compared with possible major trade policy reforms under the WTO. However, the final headcount poverty impacts of the international trade policy reforms are offset by the lower income responsiveness of the poverty impacts in the poorest rural households. Whilst these findings are suggestive, the research strategy on the modelling side using both the GTAP dataset and runGTAP as computing software has a number of important limitations. On the data side, for Southern Africa applications, the standardised GTAP dataset throws away too much useful information for trade and poverty analysis that is available in the underlying MERRISA SAMs upon which the Southern Africa dataset for GTAP was built. This is most notable for household aggregation, factor aggregation at the low income or subsistence end, margins aggregation, rudimentary treatment of government income and expenditure. On the runGTAP modelling side, satisfactory resolution of the database problems poses serious programming problems. The above suggests an alternative trade and poverty research strategy in which the CGE model and country case study interface is first explored with country models without the constraints of the standard GTAP dataset aggregation. An obvious choice for a starting model is the standard model Loefgren, Harris and Robinson (2001). At a later point, such country models could be tied into a global model using the GTAP dataset for scenario calculations using a common sectoral classification to complete the bottom-up strategy for the analysis of trade and poverty impacts.
iii
1. Introduction to Trade and Poverty Issues 1.1 Aggregate vs Disaggregated Approach
The IFI's rely on twin propositions that poverty alleviation can be achieved through pro-poor growth, and that trade liberalisation encourages growth and thereby poverty alleviation.1 These aggregate propositions are not in dispute. Rather, the argument is made for disaggregation to identify poor winners and losers in the short and medium run from further trade policy liberalisation, both between and within countries. Disaggregation is important on both equity grounds since inevitably there will be both winners and losers are among the poor. It is also important, on efficiency grounds, when designing policies to help poor losers realise the opportunities for gain from trade policy liberalisation in the longer run. Normally, trade policy reform will yield winners and losers. In the context of post-war GATT rounds, this was dealt with structurally since the participants in these rounds were essentially OECD members with similar levels of development. The distribution issue was dealt with by mutually reinforcing growth from trade policy liberalisation and policy intervention of national governments. The Uruguay Round posed new problems since developing countries were participants for the first time, and general equilibrium trade model estimates of gains and losses showed that African countries were likely to lose.2 In the case of the proposed WTO Millennium Round, the Group 77 countries are all too aware of the possibility of significant gains and losses for the poorest countries and groups within these countries. No firm predictions of poor winners and losers has yet been made, but even the highly simplified view of some of the interactions between trade and poverty shown in Table 1 below suggests that it is very likely that there will be poor winners and losers.
1 A strong version of the aggregate argument can be found in Dollar and Kraay 199b, 2000). Various aspects of the disaggregated argument can be found in DfID (2001), Kanbur (2001), White and Anderson (2000), White (2000). 2 See the survey by Whalley (1999).
1
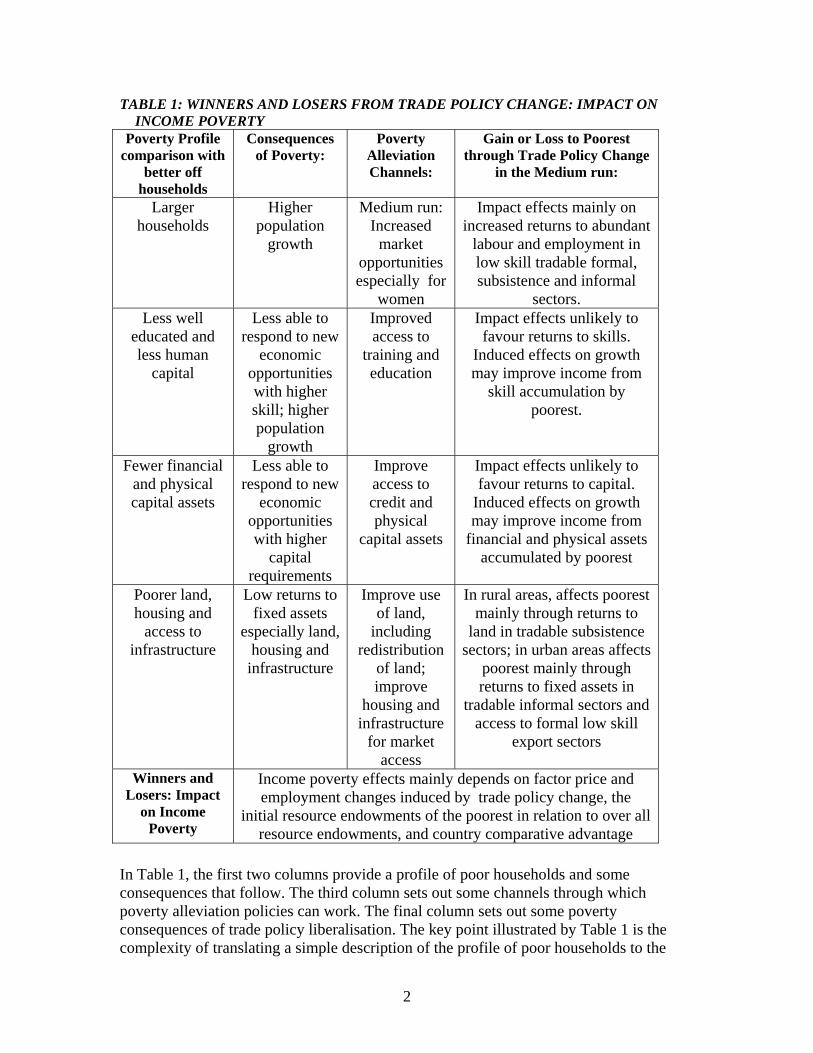
TABLE 1: WINNERS AND LOSERS FROM TRADE POLICY CHANGE: IMPACT ON INCOME POVERTY
Poverty Profile comparison with
better off households
Consequences of Poverty:
Poverty Alleviation Channels:
Gain or Loss to Poorest through Trade Policy Change
in the Medium run:
Larger households
Higher population
growth
Medium run: Increased
market opportunities especially for
women
Impact effects mainly on increased returns to abundant
labour and employment in low skill tradable formal, subsistence and informal
sectors. Less well
educated and less human
capital
Less able to respond to new
economic opportunities with higher skill; higher population
growth
Improved access to
training and education
Impact effects unlikely to favour returns to skills.
Induced effects on growth may improve income from
skill accumulation by poorest.
Fewer financial and physical capital assets
Less able to respond to new
economic opportunities with higher
capital requirements
Improve access to credit and physical
capital assets
Impact effects unlikely to favour returns to capital.
Induced effects on growth may improve income from
financial and physical assets accumulated by poorest
Poorer land, housing and
access to infrastructure
Low returns to fixed assets
especially land, housing and
infrastructure
Improve use of land,
including redistribution
of land; improve
housing and infrastructure
for market access
In rural areas, affects poorest mainly through returns to
land in tradable subsistence sectors; in urban areas affects
poorest mainly through returns to fixed assets in
tradable informal sectors and access to formal low skill
export sectors
Winners and Losers: Impact
on Income Poverty
Income poverty effects mainly depends on factor price and employment changes induced by trade policy change, the
initial resource endowments of the poorest in relation to over all resource endowments, and country comparative advantage
In Table 1, the first two columns provide a profile of poor households and some consequences that follow. The third column sets out some channels through which poverty alleviation policies can work. The final column sets out some poverty consequences of trade policy liberalisation. The key point illustrated by Table 1 is the complexity of translating a simple description of the profile of poor households to the
2
poverty impact of trade policy liberalisation. The general observation, that trade policy liberalisation yields winners and losers, holds a fortiori for the likely impact on poor households. Acceptance of the argument for disaggregation to facilitate the identification of poor winners and losers from trade policy reform poses a methodological problem. 1.2 Methodology
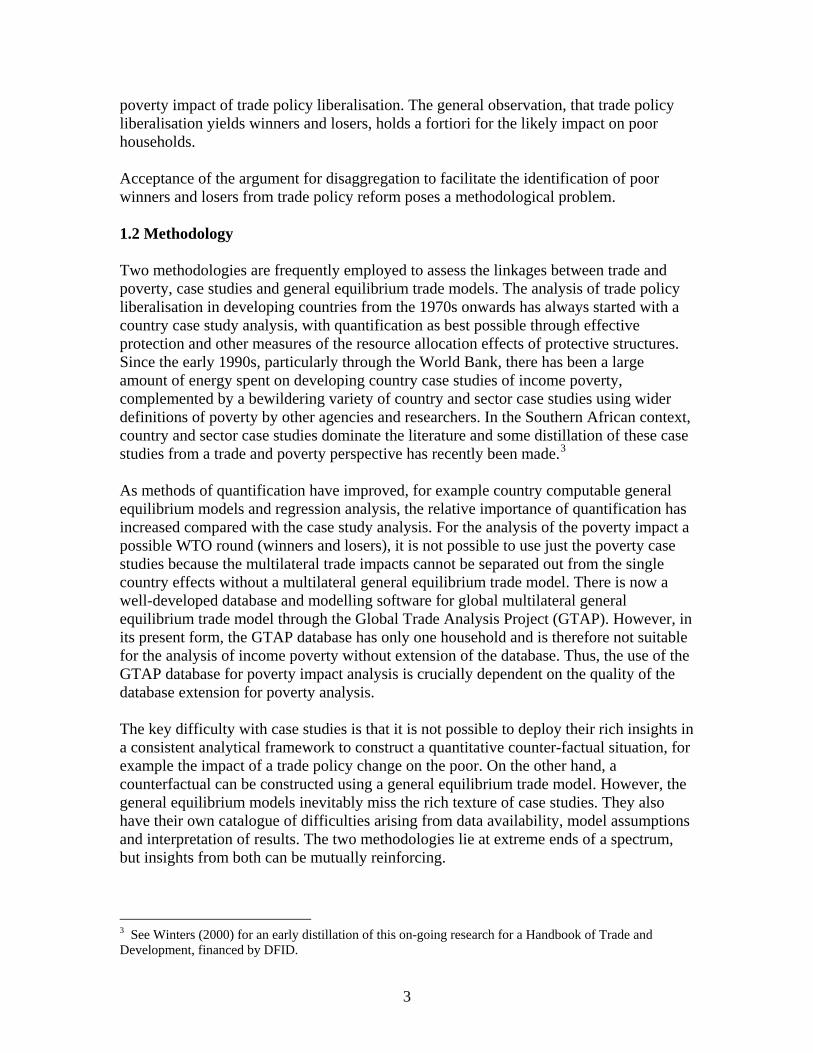
Two methodologies are frequently employed to assess the linkages between trade and poverty, case studies and general equilibrium trade models. The analysis of trade policy liberalisation in developing countries from the 1970s onwards has always started with a country case study analysis, with quantification as best possible through effective protection and other measures of the resource allocation effects of protective structures. Since the early 1990s, particularly through the World Bank, there has been a large amount of energy spent on developing country case studies of income poverty, complemented by a bewildering variety of country and sector case studies using wider definitions of poverty by other agencies and researchers. In the Southern African context, country and sector case studies dominate the literature and some distillation of these case studies from a trade and poverty perspective has recently been made.3 As methods of quantification have improved, for example country computable general equilibrium models and regression analysis, the relative importance of quantification has increased compared with the case study analysis. For the analysis of the poverty impact a possible WTO round (winners and losers), it is not possible to use just the poverty case studies because the multilateral trade impacts cannot be separated out from the single country effects without a multilateral general equilibrium trade model. There is now a well-developed database and modelling software for global multilateral general equilibrium trade model through the Global Trade Analysis Project (GTAP). However, in its present form, the GTAP database has only one household and is therefore not suitable for the analysis of income poverty without extension of the database. Thus, the use of the GTAP database for poverty impact analysis is crucially dependent on the quality of the database extension for poverty analysis. The key difficulty with case studies is that it is not possible to deploy their rich insights in a consistent analytical framework to construct a quantitative counter-factual situation, for example the impact of a trade policy change on the poor. On the other hand, a counterfactual can be constructed using a general equilibrium trade model. However, the general equilibrium models inevitably miss the rich texture of case studies. They also have their own catalogue of difficulties arising from data availability, model assumptions and interpretation of results. The two methodologies lie at extreme ends of a spectrum, but insights from both can be mutually reinforcing.
3 See Winters (2000) for an early distillation of this on-going research for a Handbook of Trade and Development, financed by DFID.
3
1.3 Developing the Argument: Case Studies and GTAP: a Zambia ‘example’
This paper uses Zambia as an 'example' country to explore the possibility of combining the rich poverty case study material available for that country with the results for Zambia of a multilateral trade model based on the GTAP dataset and modelling software. There are several salient features of case studies of poverty in Zambia, but this paper explores as an example a common thread that runs through all the case studies, that trade policy reform in Zambia is likely to be pro-poor. This key proposition is tested using the GTAP dataset and modelling software. The provisional GTAP database for 1997 is described including an extension for Zambia to permit the analysis of income poverty impact for four classes of households together with the modelling strategy adopted for this exploratory study. 1.4 Hypothesis The main hypothesis is that multi-country general equilibrium trade models and country poverty case studies are highly complementary. In particular, the country poverty case studies provide real-time, sector and institutional detail missing from a general equilibrium trade model. However, case studies may draw general conclusions about the trade policy impact on poverty that are contradicted by estimates of poverty impacts using country or multicountry general equilibrium trade models. The supplementary hypothesis is that it is feasible to exploit the low marginal cost of using the GTAP database and modelling framework to estimate the poverty impact effects, gains and losses to complement the case study literature. These hypotheses are developed in relation an 'example' country, Zambia. 2. Regional Context of the Zambian 'Example' 2.1 Economic Structure of Southern African Economies The first point to be made about the regional context of the Southern Africa trade policy reform in the immediate and recent past, in the pipeline, and in the possible future, is that the main countries represented are very heterogeneous. This is shown in Table 2 below in terms of population, GDP and GDP per capita.
4
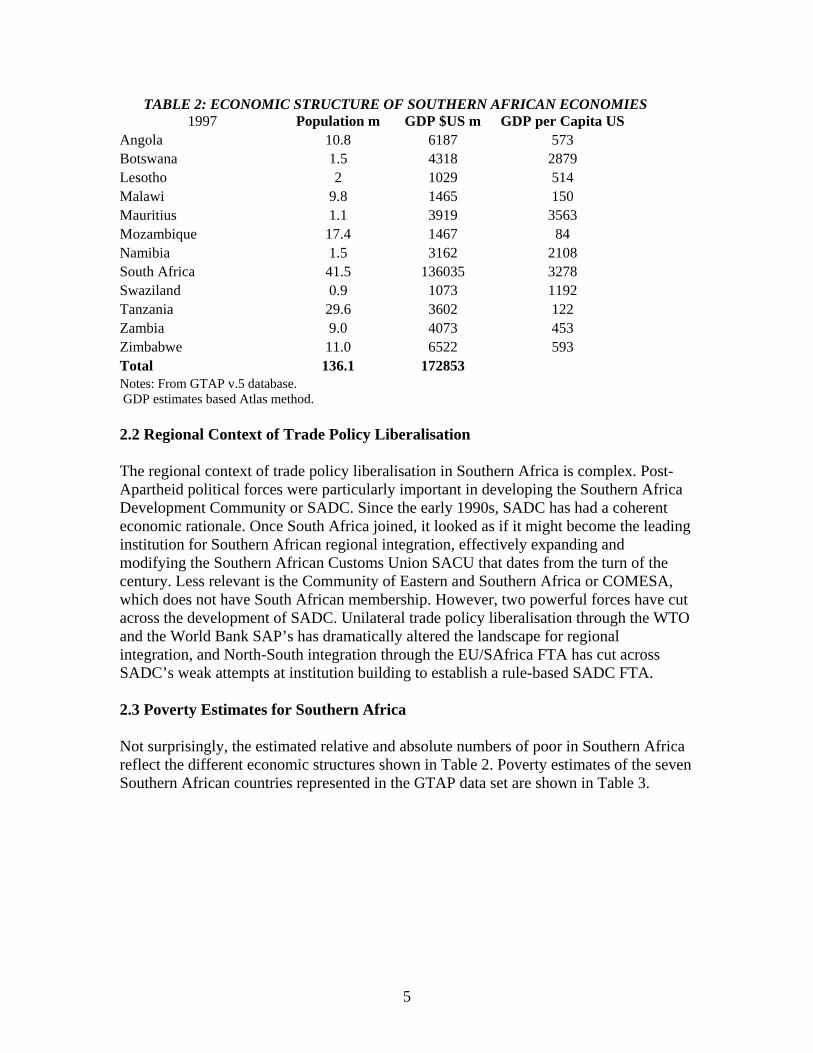
TABLE 2: ECONOMIC STRUCTURE OF SOUTHERN AFRICAN ECONOMIES 1997 Population m GDP $US m GDP per Capita US
Angola 10.8 6187 573 Botswana 1.5 4318 2879 Lesotho 2 1029 514 Malawi 9.8 1465 150 Mauritius 1.1 3919 3563 Mozambique 17.4 1467 84 Namibia 1.5 3162 2108 South Africa 41.5 136035 3278 Swaziland 0.9 1073 1192 Tanzania 29.6 3602 122 Zambia 9.0 4073 453 Zimbabwe 11.0 6522 593 Total 136.1 172853 Notes: From GTAP v.5 database. GDP estimates based Atlas method. 2.2 Regional Context of Trade Policy Liberalisation The regional context of trade policy liberalisation in Southern Africa is complex. Post-Apartheid political forces were particularly important in developing the Southern Africa Development Community or SADC. Since the early 1990s, SADC has had a coherent economic rationale. Once South Africa joined, it looked as if it might become the leading institution for Southern African regional integration, effectively expanding and modifying the Southern African Customs Union SACU that dates from the turn of the century. Less relevant is the Community of Eastern and Southern Africa or COMESA, which does not have South African membership. However, two powerful forces have cut across the development of SADC. Unilateral trade policy liberalisation through the WTO and the World Bank SAP’s has dramatically altered the landscape for regional integration, and North-South integration through the EU/SAfrica FTA has cut across SADC’s weak attempts at institution building to establish a rule-based SADC FTA. 2.3 Poverty Estimates for Southern Africa Not surprisingly, the estimated relative and absolute numbers of poor in Southern Africa reflect the different economic structures shown in Table 2. Poverty estimates of the seven Southern African countries represented in the GTAP data set are shown in Table 3.
5
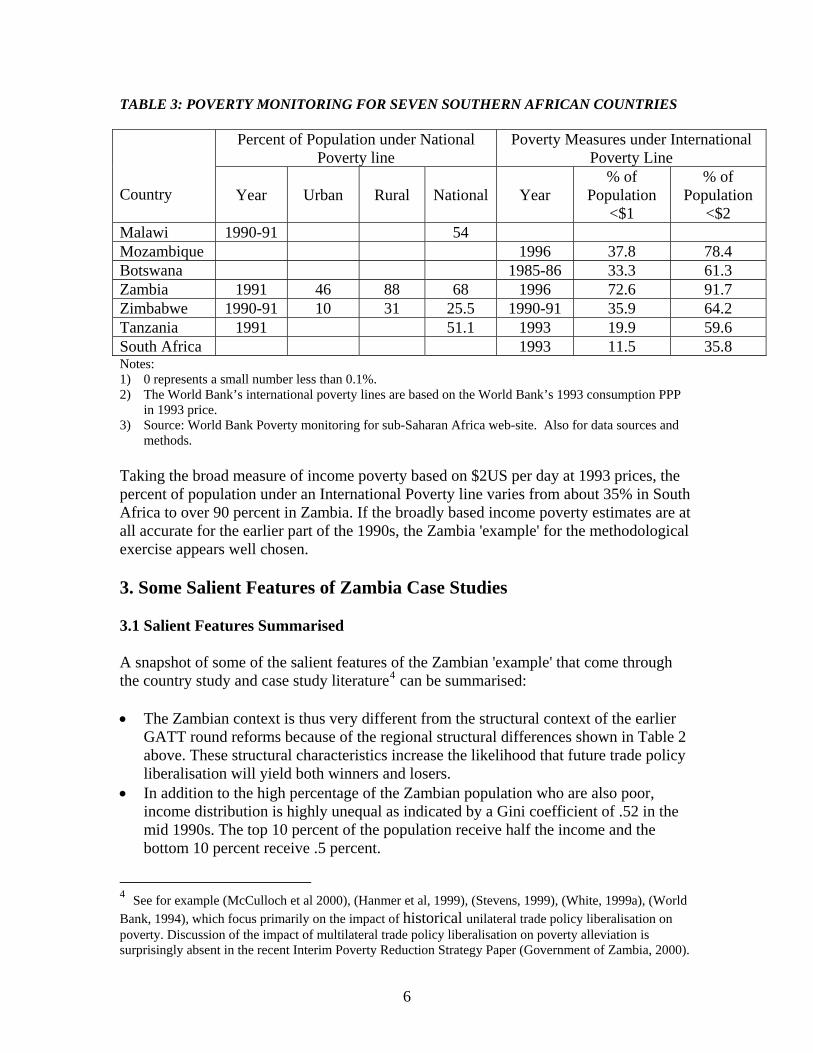
TABLE 3: POVERTY MONITORING FOR SEVEN SOUTHERN AFRICAN COUNTRIES
Percent of Population under National Poverty line
Poverty Measures under International Poverty Line
Country
Year
Urban
Rural
National
Year
% of Population
<$1
% of Population
<$2 Malawi 1990-91 54 Mozambique 1996 37.8 78.4 Botswana 1985-86 33.3 61.3 Zambia 1991 46 88 68 1996 72.6 91.7 Zimbabwe 1990-91 10 31 25.5 1990-91 35.9 64.2 Tanzania 1991 51.1 1993 19.9 59.6 South Africa 1993 11.5 35.8 Notes: 1) 0 represents a small number less than 0.1%. 2) The World Bank’s international poverty lines are based on the World Bank’s 1993 consumption PPP
in 1993 price. 3) Source: World Bank Poverty monitoring for sub-Saharan Africa web-site. Also for data sources and
methods. Taking the broad measure of income poverty based on $2US per day at 1993 prices, the percent of population under an International Poverty line varies from about 35% in South Africa to over 90 percent in Zambia. If the broadly based income poverty estimates are at all accurate for the earlier part of the 1990s, the Zambia 'example' for the methodological exercise appears well chosen. 3. Some Salient Features of Zambia Case Studies 3.1 Salient Features Summarised A snapshot of some of the salient features of the Zambian 'example' that come through the country study and case study literature4 can be summarised: • The Zambian context is thus very different from the structural context of the earlier
GATT round reforms because of the regional structural differences shown in Table 2 above. These structural characteristics increase the likelihood that future trade policy liberalisation will yield both winners and losers.
• In addition to the high percentage of the Zambian population who are also poor, income distribution is highly unequal as indicated by a Gini coefficient of .52 in the mid 1990s. The top 10 percent of the population receive half the income and the bottom 10 percent receive .5 percent.
4 See for example (McCulloch et al 2000), (Hanmer et al, 1999), (Stevens, 1999), (White, 1999a), (World Bank, 1994), which focus primarily on the impact of historical unilateral trade policy liberalisation on poverty. Discussion of the impact of multilateral trade policy liberalisation on poverty alleviation is surprisingly absent in the recent Interim Poverty Reduction Strategy Paper (Government of Zambia, 2000).
6
• The 1990s were characterised by sweeping economic reforms in the 1990s, for example macro economic stabilisation, liberalisation of agricultural marketing, a large privatisation programme, trade policy liberalisation, public sector reform, all of which have potentially important poverty impacts.
• For most of the 1990s, GDP growth performance was poor. In the 9 years from 1990 to 1998 inclusive, per capita GDP growth was negative in 6 years. In 1999, per capita GDP growth was near zero but some positive per capita growth has been estimated for 2000. In this context the redistributive aspects of trade policy changes are likely to be particularly important for short and medium run poverty alleviation.
• Copper prices on the world market were unfavourable over the decade after a brief peak in 1995, whilst copper production and exports were hampered by delayed privatisation and only began to grow again by 2000. Here, there is a dilemma, for the re-emergence of copper as an export sector is not likely, on balance, to be pro-poor in the short and medium run, but could facilitate longer run pro-poor investment.
• Only 17 percent of the workforce is employed in the formal sector at the beginning of the 1990s, declining to 10 per cent by the end of the 1990s. Thus a large part of the unskilled workforce identified in the GTAP database is in the subsistence sector.
• As a result of macroeconomic stabilisation, there were high real interest rates and a real appreciation of the kwacha over much of the 1990s. In the short run, this real appreciation of the kwacha is likely to dominate the effects of trade policy liberalisation, which tends to depreciate the real exchange rate. The focus of this paper is on the medium to long run impact of trade policy liberalisation on poverty.
• Partly as a result of the macro imbalances induced by the real appreciation on the Kwacha, overall poverty during the 1990s increased sharply at first and then declined to levels roughly comparable to the beginning of the decade.
• Over-all inequality fell over the 1990s from about .56 to about .51 due to the observed relative improvement in rural incomes.
3.2 Received Wisdom on Trade Policy Liberalisation A key proposition that pervades many of the Zambia country case studies is that the past and anticipated trade policy liberalisation has improved both on the level of income of the poor and the distribution of income towards the poor. The empirical work reported in the rest of this paper tests these propositions using a preliminary version of the 1997 GTAP database and a multilateral general equilibrium trade model to estimate income poverty impact indicators of both historical, contemporaneous and possible future trade policy changes. 4. Zambia in the Context of a Multi Regional Trade Model 4.1 Income Poverty Impact of Trade Policy Change The multi-regional trade model was developed to explore the income poverty impacts of a variety of trade policy reforms and to compare the results with the received wisdom on the poverty impacts from the case study literature. A more extensive exploration of the poverty impacts of other polices such as debt relief, world copper price trends,
7
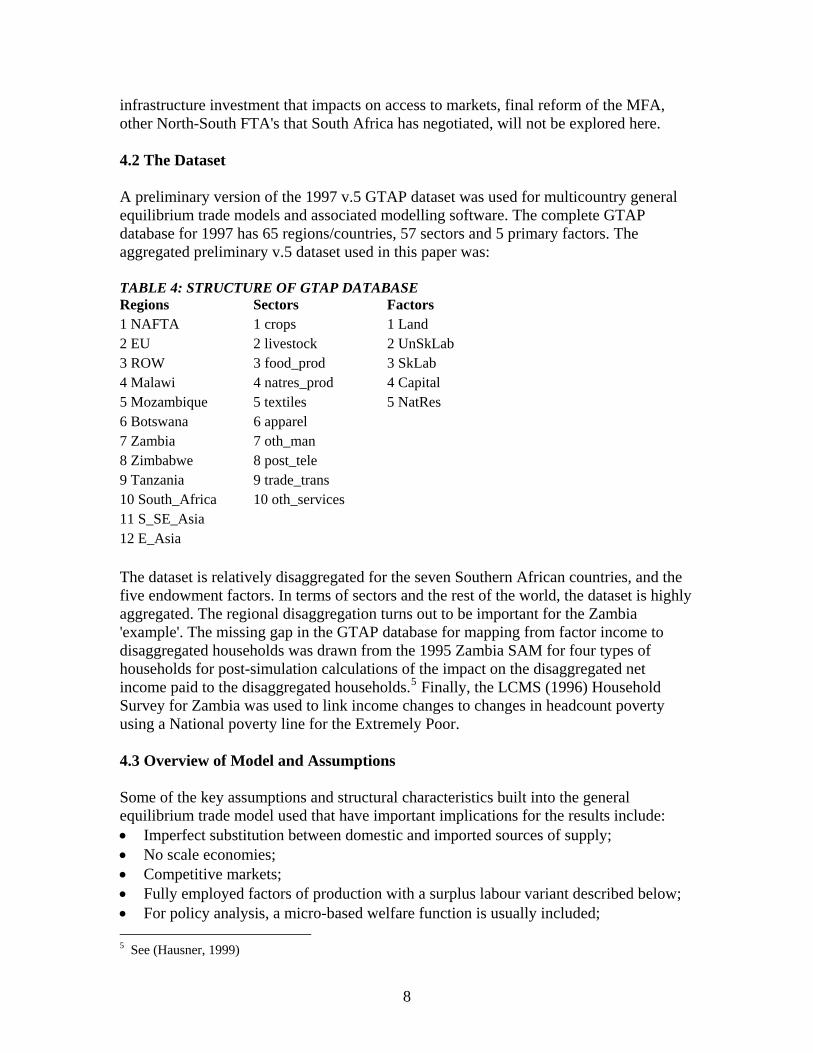
infrastructure investment that impacts on access to markets, final reform of the MFA, other North-South FTA's that South Africa has negotiated, will not be explored here. 4.2 The Dataset A preliminary version of the 1997 v.5 GTAP dataset was used for multicountry general equilibrium trade models and associated modelling software. The complete GTAP database for 1997 has 65 regions/countries, 57 sectors and 5 primary factors. The aggregated preliminary v.5 dataset used in this paper was: TABLE 4: STRUCTURE OF GTAP DATABASE Regions Sectors Factors 1 NAFTA 1 crops 1 Land 2 EU 2 livestock 2 UnSkLab 3 ROW 3 food_prod 3 SkLab 4 Malawi 4 natres_prod 4 Capital 5 Mozambique 5 textiles 5 NatRes 6 Botswana 6 apparel 7 Zambia 7 oth_man 8 Zimbabwe 8 post_tele 9 Tanzania 9 trade_trans 10 South_Africa 10 oth_services 11 S_SE_Asia 12 E_Asia The dataset is relatively disaggregated for the seven Southern African countries, and the five endowment factors. In terms of sectors and the rest of the world, the dataset is highly aggregated. The regional disaggregation turns out to be important for the Zambia 'example'. The missing gap in the GTAP database for mapping from factor income to disaggregated households was drawn from the 1995 Zambia SAM for four types of households for post-simulation calculations of the impact on the disaggregated net income paid to the disaggregated households.5 Finally, the LCMS (1996) Household Survey for Zambia was used to link income changes to changes in headcount poverty using a National poverty line for the Extremely Poor. 4.3 Overview of Model and Assumptions Some of the key assumptions and structural characteristics built into the general equilibrium trade model used that have important implications for the results include: • Imperfect substitution between domestic and imported sources of supply; • No scale economies; • Competitive markets; • Fully employed factors of production with a surplus labour variant described below; • For policy analysis, a micro-based welfare function is usually included; 5 See (Hausner, 1999)
8
• Trade models have a rich specification of the 'tax wedges' that affect trade flows; • The multicountry/region versions of the above that include multilateral trade flows
are essentially a more complex version of a single country model; • Variation of the key assumptions above such as unemployment of one or more factors
such as labour and imperfectly competitive markets can be introduced using advanced computation techniques and modelling software;
• A variant of a surplus labour model was specified for all of the Southern African countries by fixing the real unskilled wage at base levels so that the employment of unskilled labour is free to vary.
The choice of a surplus labour specification requires some justification and has important implications. In Sub Saharan Africa it is usually the case that there is unemployed unskilled labour and effectively full employment for skilled labour. Simplifying a little by merging natural resource endowments and ignoring capital inputs, the impact of changing tariff protection in a GTAP based model will closely follow Heckscher-Ohlin lines. Thus, when unskilled wages are determined exogenously and there is a high resource to skill ratio and high initial trade protection, across the board trade policy liberalisation is likely to benefit resource rents and harm skilled wages. By definition, unskilled wages do not change. The employment of unskilled labour will tend to rise or fall according to the unskilled labour intensity of exports compared with import competing production. 4.4 Measurement of Protection and Structure of Protection in Southern Africa There are a number of well-known difficulties in measuring the structure of protection for modelling purposes. Tariff negotiations centre around changing bound tariffs, whilst in the GTAP database protection is primarily measured as average applied tariffs. Thus, the correspondence between negotiated tariff changes and applied tariff changes is at best an approximation. There are a variety of other protective measures such as tariff equivalents, such as measures tariff quotas for temperate agricultural imports and export controls in the MFA, some of which are included in the GTAP database. As a first approximation, tariff equivalents of non-tariff measures have been included as ordinary tariffs and have not been specifically modelled to take into account the particular forms of protection that lie behind them. It is possible to assemble comparative data on the initial average applied sector tariffs in the Southern Africa from the end of the Uruguay Round up to 1997, the year for the GTAP v.5 database. The trade weighted country averages are shown in Table 5, columns (1) and (4).
9
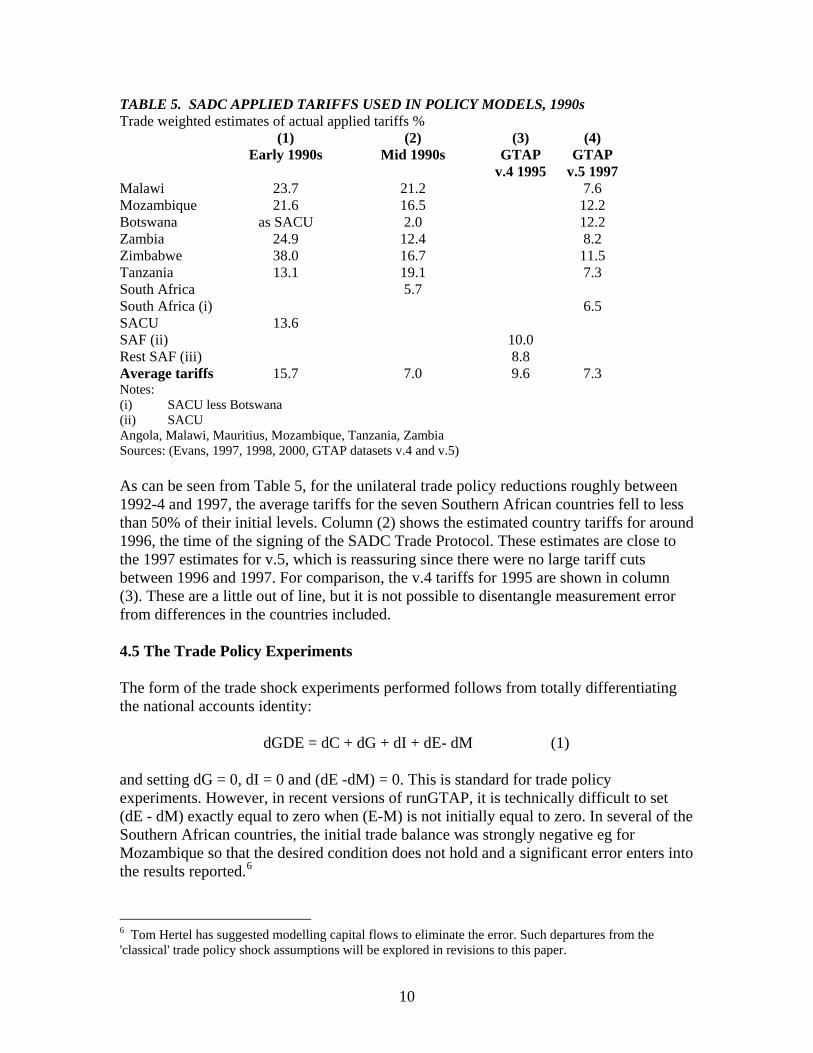
TABLE 5. SADC APPLIED TARIFFS USED IN POLICY MODELS, 1990s Trade weighted estimates of actual applied tariffs % (1) (2) (3) (4) Early 1990s
Mid 1990s
GTAP
v.4 1995 GTAP
v.5 1997 Malawi 23.7 21.2 7.6 Mozambique 21.6 16.5 12.2 Botswana as SACU 2.0 12.2 Zambia 24.9 12.4 8.2 Zimbabwe 38.0 16.7 11.5 Tanzania 13.1 19.1 7.3 South Africa 5.7 South Africa (i) 6.5 SACU 13.6 SAF (ii) 10.0 Rest SAF (iii) 8.8 Average tariffs 15.7 7.0 9.6 7.3 Notes: (i) SACU less Botswana (ii) SACU Angola, Malawi, Mauritius, Mozambique, Tanzania, Zambia Sources: (Evans, 1997, 1998, 2000, GTAP datasets v.4 and v.5)
As can be seen from Table 5, for the unilateral trade policy reductions roughly between 1992-4 and 1997, the average tariffs for the seven Southern African countries fell to less than 50% of their initial levels. Column (2) shows the estimated country tariffs for around 1996, the time of the signing of the SADC Trade Protocol. These estimates are close to the 1997 estimates for v.5, which is reassuring since there were no large tariff cuts between 1996 and 1997. For comparison, the v.4 tariffs for 1995 are shown in column (3). These are a little out of line, but it is not possible to disentangle measurement error from differences in the countries included. 4.5 The Trade Policy Experiments The form of the trade shock experiments performed follows from totally differentiating the national accounts identity:
dGDE = dC + dG + dI + dE- dM (1)
and setting dG = 0, dI = 0 and (dE -dM) = 0. This is standard for trade policy experiments. However, in recent versions of runGTAP, it is technically difficult to set (dE - dM) exactly equal to zero when (E-M) is not initially equal to zero. In several of the Southern African countries, the initial trade balance was strongly negative eg for Mozambique so that the desired condition does not hold and a significant error enters into the results reported.6
6 Tom Hertel has suggested modelling capital flows to eliminate the error. Such departures from the 'classical' trade policy shock assumptions will be explored in revisions to this paper.
10
11
Three specific types of trade policy reform and income poverty impacts were explored: Unilateral: Post Uruguay Round Unilateral Tariff Reform under World Bank SAPs and WTO auspices were heavily concentrated in the period immediately after the completion of the Uruguay Round, roughly up till 1997. The impact of the these changes was estimated using a backcast from 1997 back to the initial tariffs shown in Table 5 column (1), disaggregated to the sector level. Regional: The SADC FTA, implemented recently, was modelled for seven countries only on the 1997 base by setting the intra SADC7 tariffs and exports taxes to zero The strong assumption is that the rules of origin can be enforced. Modelling the EU/SA FTA is not straightforward because not all of the intra trade barriers were set to zero. Translating the exclusions under the agreement into tariff equivalents has not been done, to the best of my knowledge. Early work on the EU/SA FTA set all intra trade barriers to zero.7 More recent work set Non-Agricultural barriers to One approach to this problem is to assume that agricultural and food trade barriers are cut by 50% and the rest were cut by 100% on a 1997 base. A not very happy 'guesstimate' to deal with the lack of data. The regional results of the EU/SA FTA were not reported for the Zambia specific results because the impacts were so small. Global: A prospective WTO Millennium Round, and an extended version of the EU/SA FTA extended to a EU/SADC FTA. The 'suppose' Millennium Round was constructed in the spirit of the sketches in Wang and Winters (2000) and Hertel et al (2000), whereby temperate agricultural and global manufacturing trade barriers were cut by 40%. Service sectors tariff equivalents were not incorporated into the data set, so there were no service sector effects. It was notionally assumed that the WTO round begins in 2005. An updated base was calculated including the SADC7 FTA and an EU/SA FTA. No adjustments for GDP growth from 1997 to 2005 were included at this stage. The EU/SADC7 FTA simply extended the EU/SA FTA to all of the SADC7. Negotiation for this is about to begin with the EU for the Least Developed Countries (4 out of 7 of the SADC7) and is likely to be extended to all of SADC.8
5. Some Preliminary Results Some preliminary results are summarised in Tables 6 and 7 below. Full details of the trade policy experiments can be obtained from the author.
7 See for example Davies (1998), Lewis et al (1999) and Arndt et al (2000). 8 See Commission of the European Communities (2000)
12
TABLE 6: MAJOR TRADE POLICY INTERVENTIONS AFFECTING SOUTHERN AFRICA: Changes in Factor Prices, Welfare and Real Rate of Return on Capital
Unilateral NAFTA EU ROW Mal Moz Bots Zam Zim Tanz S_Afr SSEAsia E_Asia Total SADC RestFactor income % 0.00 0.01 0.01 2.76 12.34 16.09 3.93 10.44 1.54 5.05 0.01 0.02 na na naWelfare % 0.00 0.00 0.00 1.56 5.51 9.17 1.92 6.14 1.07 3.28 0.01 0.00 0.02 3.45 0.00Rate of return % 0.00 0.00 0.00 10.06 48.09 29.86 14.70 29.28 6.58 13.75 0.01 0.00 na na naSADC7Factor income % 0.00 0.00 0.00 2.50 5.88 1.34 0.79 5.04 0.34 0.57 0.00 0.00 na na naWelfare % 0.00 0.00 0.00 1.27 1.88 0.45 0.27 1.60 0.12 0.27 0.00 0.00 0.01 0.85 0.00Rate of return % 0.00 0.00 0.00 4.91 17.62 0.61 3.16 6.92 1.02 0.43 0.00 0.00 na na naWTO1Factor income % 0.15 0.42 1.35 1.36 7.95 4.82 2.07 3.54 1.72 1.65 2.53 2.85 na na naWelfare % 0.03 0.09 0.25 0.69 3.59 2.39 0.91 1.55 0.93 0.94 0.62 0.42 0.17 1.03 0.16Rate of return % 0.77 0.75 2.15 3.70 21.20 3.24 3.76 6.89 4.33 3.18 6.17 3.37 na na naWTO2Factor income % -0.01 0.02 -0.01 4.75 8.38 4.44 1.34 8.40 1.07 1.41 -0.02 -0.02 na na naWelfare % 0.00 0.00 0.00 0.37 2.70 2.13 0.40 1.13 0.45 -0.06 0.00 0.00 0.00 0.12 0.00Rate of return % 0.00 0.00 0.00 1.82 15.95 1.58 1.13 4.13 2.79 -0.03 0.00 0.00 na na naKey: Estimated Unilateral lowering of sector tariffsSADC7 FTAWTO1 lowers all tariffs, export taxes and agricultural production subsidies by 40%WTO2 same as EUSA FTA except extended to all SADC7 countriesNote: Change in rate of return on capital deflated by change in GDP price indexFactor income deflated by consumer price index
Concentrating first on the welfare effects, shown as a % of base GDE (or GDP) and excluding terms of trade and capital goods revaluation effects, are shown in Table 6, there are positive global welfare benefits from the trade policy shocks considered. In the case of the unilateral tariff reduction in the SADC7 impact effects are over 3%, which is large by any standards. Whilst there are no aggregate losses for any particular country, there is a strong dispersion of the welfare benefits with Tanzania experiencing low benefits compared with Botswana and Zimbabwe. It is true that the over-all impact of the SADC7 Unilateral liberalisation was gainful. These countries should indeed gain negotiating credits from their unilateral liberalisation in a new WTO Millennium Round.9
The welfare benefits of the SADC7 FTA are substantial at over .8%. Again, although there are no estimated negative effects on welfare, the dispersion of welfare benefits is very large. The 'suppose' WTO1 round shows welfare benefits of slightly more than 1% with much lower dispersion of the size of benefits between countries. WTO2, the EU/SADC7 FTA shows comparatively low welfare gains and substantial dispersion of the gains. It is difficult to account for the relationship between post-tax factor income changes and the welfare changes, except to note that these are very different measures. The rate-of-rate of return changes gives an indicator of the changes in the growth potential from the reforms. The impact of the above trade policy shocks on four types of households in Zambia is shown in Table 7 on the next page. The first column shows the aggregate effect, the second and third columns show the impact on high and low metropolitan households, and the fourth and firth columns show the impact on not-metropolitan urban and rural households. The poorest households are in the low-income metropolitan group, and rural households. Across the rows, the headcount measure of the Extremely Poor in 1996 is shown. Next, the arc elasticities of the headcount change for a 1% change in income at the Extremely Poor poverty line are shown. For each of the policy experiments, the estimated change in household income, the induced change in the headcount of the Extremely Poor, and the % change in the headcount are shown.
9 See Wang and Winters (2000) who argue the case for such credits rather well.
13
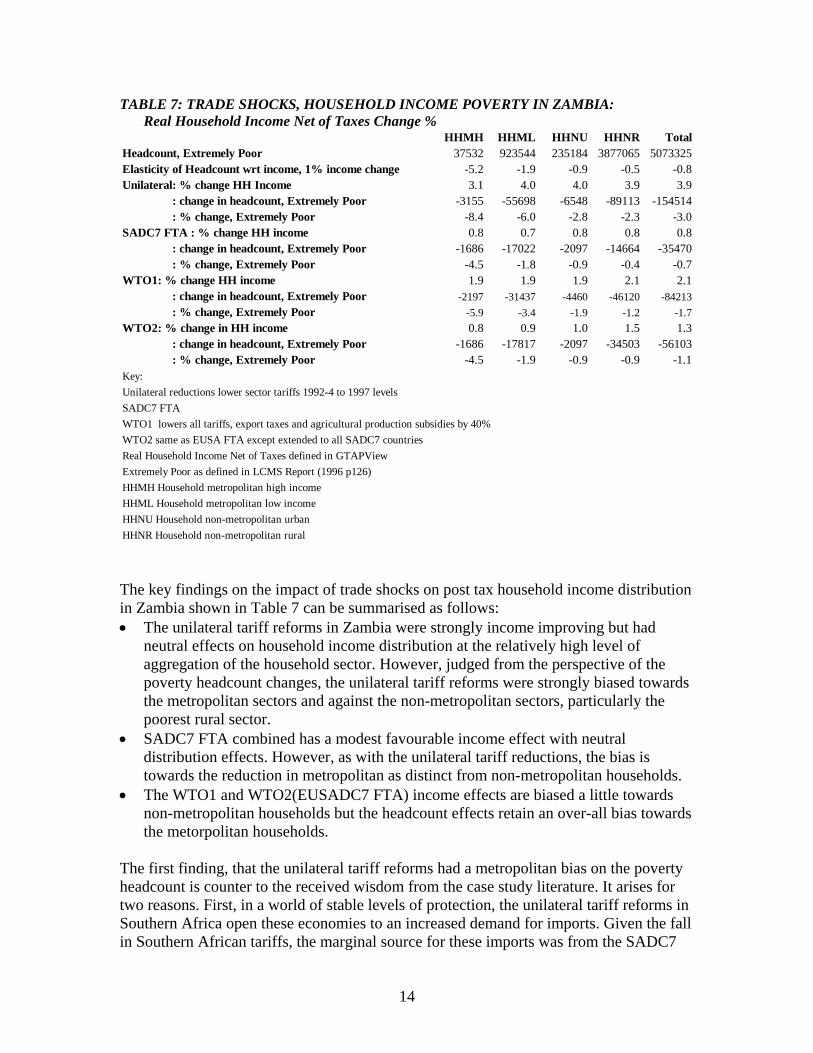
TABLE 7: TRADE SHOCKS, HOUSEHOLD INCOME POVERTY IN ZAMBIA: Real Household Income Net of Taxes Change %
HHMH HHML HHNU HHNR TotalHeadcount, Extremely Poor 37532 923544 235184 3877065 5073325Elasticity of Headcount wrt income, 1% income change -5.2 -1.9 -0.9 -0.5 -0.8Unilateral: % change HH Income 3.1 4.0 4.0 3.9 3.9 : change in headcount, Extremely Poor -3155 -55698 -6548 -89113 -154514 : % change, Extremely Poor -8.4 -6.0 -2.8 -2.3 -3.0SADC7 FTA : % change HH income 0.8 0.7 0.8 0.8 0.8 : change in headcount, Extremely Poor -1686 -17022 -2097 -14664 -35470 : % change, Extremely Poor -4.5 -1.8 -0.9 -0.4 -0.7WTO1: % change HH income 1.9 1.9 1.9 2.1 2.1 : change in headcount, Extremely Poor -2197 -31437 -4460 -46120 -84213 : % change, Extremely Poor -5.9 -3.4 -1.9 -1.2 -1.7WTO2: % change in HH income 0.8 0.9 1.0 1.5 1.3 : change in headcount, Extremely Poor -1686 -17817 -2097 -34503 -56103 : % change, Extremely Poor -4.5 -1.9 -0.9 -0.9 -1.1Key: Unilateral reductions lower sector tariffs 1992-4 to 1997 levelsSADC7 FTA WTO1 lowers all tariffs, export taxes and agricultural production subsidies by 40%WTO2 same as EUSA FTA except extended to all SADC7 countriesReal Household Income Net of Taxes defined in GTAPViewExtremely Poor as defined in LCMS Report (1996 p126)HHMH Household metropolitan high incomeHHML Household metropolitan low incomeHHNU Household non-metropolitan urbanHHNR Household non-metropolitan rural The key findings on the impact of trade shocks on post tax household income distribution in Zambia shown in Table 7 can be summarised as follows: • The unilateral tariff reforms in Zambia were strongly income improving but had
neutral effects on household income distribution at the relatively high level of aggregation of the household sector. However, judged from the perspective of the poverty headcount changes, the unilateral tariff reforms were strongly biased towards the metropolitan sectors and against the non-metropolitan sectors, particularly the poorest rural sector.
• SADC7 FTA combined has a modest favourable income effect with neutral distribution effects. However, as with the unilateral tariff reductions, the bias is towards the reduction in metropolitan as distinct from non-metropolitan households.
• The WTO1 and WTO2(EUSADC7 FTA) income effects are biased a little towards non-metropolitan households but the headcount effects retain an over-all bias towards the metorpolitan households.
The first finding, that the unilateral tariff reforms had a metropolitan bias on the poverty headcount is counter to the received wisdom from the case study literature. It arises for two reasons. First, in a world of stable levels of protection, the unilateral tariff reforms in Southern Africa open these economies to an increased demand for imports. Given the fall in Southern African tariffs, the marginal source for these imports was from the SADC7
14
countries themselves. Whilst intra trade in Southern Africa is not particularly strong for all of the well-known reasons, it is not absent either, as noted in earlier studies, for example Evans (1997,1998). In the case of the unilateral tariff reforms, it appears from these preliminary estimates that the balance of net change in output in Zambia is like trade diversion and against comparative advantage. This observation is confirmed in Table 8 below:
15
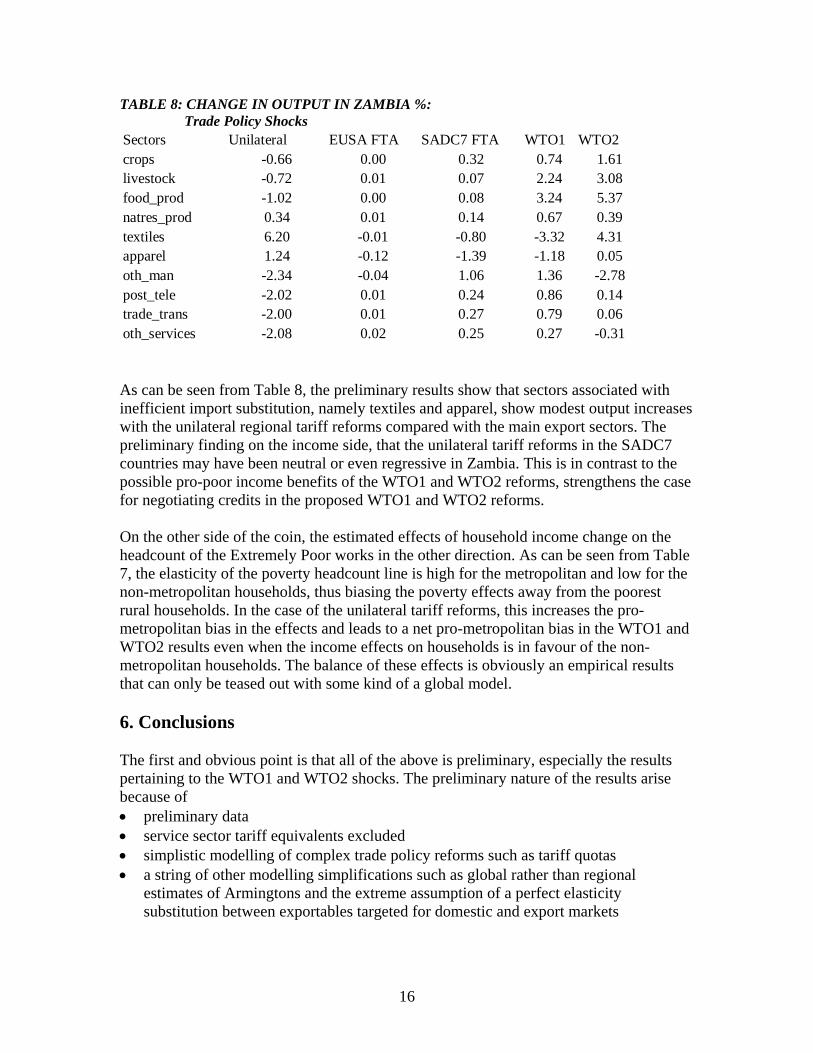
TABLE 8: CHANGE IN OUTPUT IN ZAMBIA %: Trade Policy Shocks
Sectors Unilateral EUSA FTA SADC7 FTA WTO1 WTO2crops -0.66 0.00 0.32 0.74 1.61livestock -0.72 0.01 0.07 2.24 3.08food_prod -1.02 0.00 0.08 3.24 5.37natres_prod 0.34 0.01 0.14 0.67 0.39textiles 6.20 -0.01 -0.80 -3.32 4.31apparel 1.24 -0.12 -1.39 -1.18 0.05oth_man -2.34 -0.04 1.06 1.36 -2.78post_tele -2.02 0.01 0.24 0.86 0.14trade_trans -2.00 0.01 0.27 0.79 0.06oth_services -2.08 0.02 0.25 0.27 -0.31 As can be seen from Table 8, the preliminary results show that sectors associated with inefficient import substitution, namely textiles and apparel, show modest output increases with the unilateral regional tariff reforms compared with the main export sectors. The preliminary finding on the income side, that the unilateral tariff reforms in the SADC7 countries may have been neutral or even regressive in Zambia. This is in contrast to the possible pro-poor income benefits of the WTO1 and WTO2 reforms, strengthens the case for negotiating credits in the proposed WTO1 and WTO2 reforms. On the other side of the coin, the estimated effects of household income change on the headcount of the Extremely Poor works in the other direction. As can be seen from Table 7, the elasticity of the poverty headcount line is high for the metropolitan and low for the non-metropolitan households, thus biasing the poverty effects away from the poorest rural households. In the case of the unilateral tariff reforms, this increases the pro-metropolitan bias in the effects and leads to a net pro-metropolitan bias in the WTO1 and WTO2 results even when the income effects on households is in favour of the non-metropolitan households. The balance of these effects is obviously an empirical results that can only be teased out with some kind of a global model. 6. Conclusions The first and obvious point is that all of the above is preliminary, especially the results pertaining to the WTO1 and WTO2 shocks. The preliminary nature of the results arise because of • preliminary data • service sector tariff equivalents excluded • simplistic modelling of complex trade policy reforms such as tariff quotas • a string of other modelling simplifications such as global rather than regional
estimates of Armingtons and the extreme assumption of a perfect elasticity substitution between exportables targeted for domestic and export markets
16
Second, whilst the Zambia results are interesting, the particular disaggreation of households retains a strong metropolitan/non-metropolitan dichotomy. Further disaggregation may be warranted to capture more of the income distribution impacts on poverty. Third, there are a number areas of policy change where trade has an important bearing on the income poverty consequences that could be estimated for Zambia in a regional and country context. These areas range from debt relief to mineral sector rehabilitation to the consequences of infrastructure investment that affect both country, regional and international transport costs for the SADC7 countries. Finally, in these preliminary results, the neutral or even regressive household income effects of the unilateral trade policy reforms, which is driven by the intra SADC7 trade relationships, runs against the metropolitan bias in the headcount elasticities. The stronger household income effects in the non-metropolitan households under the WTO1 and 2 shocks confirms the conventional wisdom of the authors of the case studies, but these effects too are blunted by the pro-metropolitan bias in the headcount elasticities. All this is very preliminary. If there have been welfare benefits from the unilateral and regional trade policy reforms to date, so too should there be negotiation credits for a better pro-poor deal in the WTO1 and WTO2 type reforms. Both the GTAP dataset constraints and the runGTAP modelling constraints limit the above preliminary findings. They suggests an alternative trade and poverty research strategy in which the CGE model and country case study interface is first explored with country models without the constraints of the standard GTAP dataset aggregation. An obvious choice for a starting model is the standard model Loefgren, Harris and Robinson (2001) and the Hausner (1999) SAM for Zambia. At a later point, such country models could be tied into a global model using the GTAP dataset for scenario calculations using a common sectoral classification and country models with disaggregation consistent with the SAM data sources. This would provide a better basis for a bottom-up strategy for the analysis of trade and poverty impacts.
17
18
Appendix
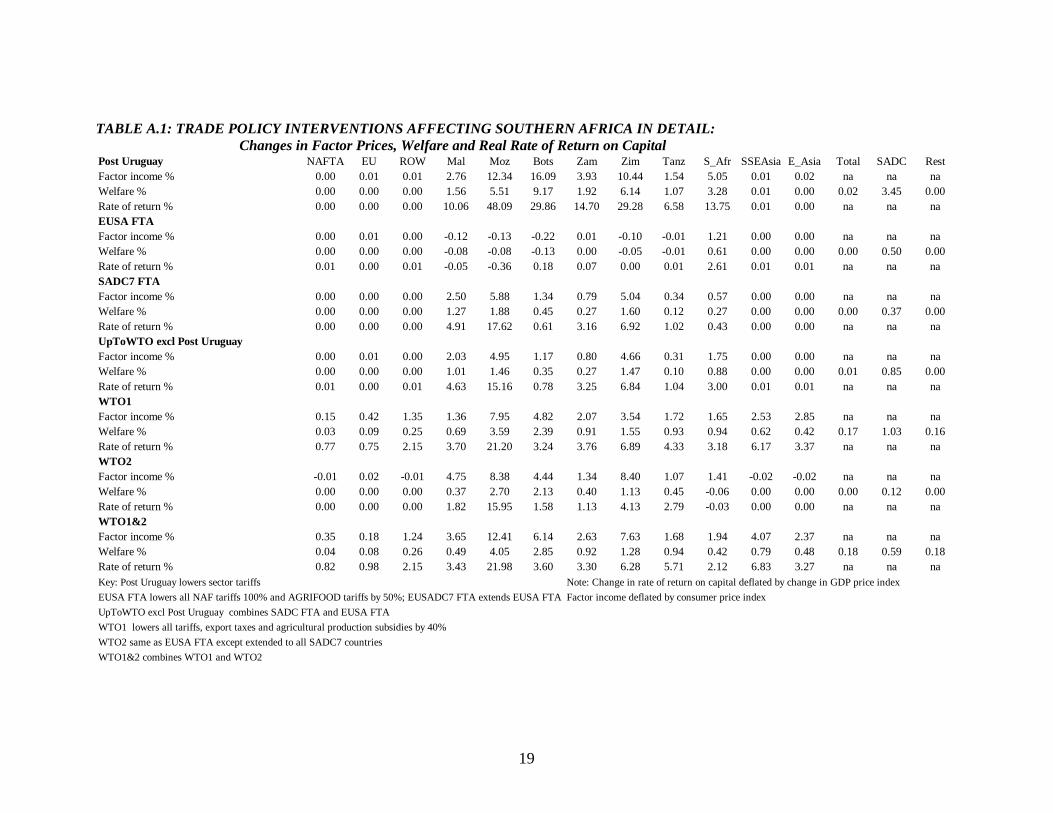
TABLE A.1: TRADE POLICY INTERVENTIONS AFFECTING SOUTHERN AFRICA IN DETAIL: Changes in Factor Prices, Welfare and Real Rate of Return on Capital Post Uruguay NAFTA EU ROW Mal Moz Bots Zam Zim Tanz S_Afr SSEAsia E_Asia Total SADC RestFactor income % 0.00 0.01 0.01 2.76 12.34 16.09 3.93 10.44 1.54 5.05 0.01 0.02 na na naWelfare % 0.00 0.00 0.00 1.56 5.51 9.17 1.92 6.14 1.07 3.28 0.01 0.00 0.02 3.45 0.00Rate of return % 0.00 0.00 0.00 10.06 48.09 29.86 14.70 29.28 6.58 13.75 0.01 0.00 na na naEUSA FTAFactor income % 0.00 0.01 0.00 -0.12 -0.13 -0.22 0.01 -0.10 -0.01 1.21 0.00 0.00 na na naWelfare % 0.00 0.00 0.00 -0.08 -0.08 -0.13 0.00 -0.05 -0.01 0.61 0.00 0.00 0.00 0.50 0.00Rate of return % 0.01 0.00 0.01 -0.05 -0.36 0.18 0.07 0.00 0.01 2.61 0.01 0.01 na na naSADC7 FTAFactor income % 0.00 0.00 0.00 2.50 5.88 1.34 0.79 5.04 0.34 0.57 0.00 0.00 na na naWelfare % 0.00 0.00 0.00 1.27 1.88 0.45 0.27 1.60 0.12 0.27 0.00 0.00 0.00 0.37 0.00Rate of return % 0.00 0.00 0.00 4.91 17.62 0.61 3.16 6.92 1.02 0.43 0.00 0.00 na na naUpToWTO excl Post UruguayFactor income % 0.00 0.01 0.00 2.03 4.95 1.17 0.80 4.66 0.31 1.75 0.00 0.00 na na naWelfare % 0.00 0.00 0.00 1.01 1.46 0.35 0.27 1.47 0.10 0.88 0.00 0.00 0.01 0.85 0.00Rate of return % 0.01 0.00 0.01 4.63 15.16 0.78 3.25 6.84 1.04 3.00 0.01 0.01 na na naWTO1Factor income % 0.15 0.42 1.35 1.36 7.95 4.82 2.07 3.54 1.72 1.65 2.53 2.85 na na naWelfare % 0.03 0.09 0.25 0.69 3.59 2.39 0.91 1.55 0.93 0.94 0.62 0.42 0.17 1.03 0.16Rate of return % 0.77 0.75 2.15 3.70 21.20 3.24 3.76 6.89 4.33 3.18 6.17 3.37 na na naWTO2Factor income % -0.01 0.02 -0.01 4.75 8.38 4.44 1.34 8.40 1.07 1.41 -0.02 -0.02 na na naWelfare % 0.00 0.00 0.00 0.37 2.70 2.13 0.40 1.13 0.45 -0.06 0.00 0.00 0.00 0.12 0.00Rate of return % 0.00 0.00 0.00 1.82 15.95 1.58 1.13 4.13 2.79 -0.03 0.00 0.00 na na naWTO1&2 Factor income % 0.35 0.18 1.24 3.65 12.41 6.14 2.63 7.63 1.68 1.94 4.07 2.37 na na naWelfare % 0.04 0.08 0.26 0.49 4.05 2.85 0.92 1.28 0.94 0.42 0.79 0.48 0.18 0.59 0.18Rate of return % 0.82 0.98 2.15 3.43 21.98 3.60 3.30 6.28 5.71 2.12 6.83 3.27 na na naKey: Post Uruguay lowers sector tariffs Note: Change in rate of return on capital deflated by change in GDP price indexEUSA FTA lowers all NAF tariffs 100% and AGRIFOOD tariffs by 50%; EUSADC7 FTA extends EUSA FTA Factor income deflated by consumer price indexUpToWTO excl Post Uruguay combines SADC FTA and EUSA FTAWTO1 lowers all tariffs, export taxes and agricultural production subsidies by 40%WTO2 same as EUSA FTA except extended to all SADC7 countriesWTO1&2 combines WTO1 and WTO2
19
References Consulted
Adelman, I. and S. Robinson, 1978, Income Distribution Policy in Developing Countries, OUP for the World Bank.
Arndt, C. et al, 2000,'Analysing the South Africa-European Union Free Trade Area: a
Multi-Country General Equilibrium Perspective', paper prepared for the TIPS/IDRC Southern Africa Regional Symposium, Johannesburg, South Africa, September 17.
Baulch, Bob, 1996, "Neglected Trade-Offs in Poverty Measurement", article, IDS
Bulletin, Vol 27 No 1, pp 36-42, Institute of Development Studies, University of Sussex, Brighton.
Commission of European Communities, 2000, Council Regulation no 2820/98 Davies, R., 1998, 'Global Trade Analysis for Southern Africa: The Resource Allocative
Effects of Free Trade Areas in Southern Africa', paper presented to the EAGER Semi-Annual Workshop, Johannesburg, South Africa.
DfID, 2001, Whitepaper on Globalisation and Poverty, Department of International
Development, London, (draft). Dollar, D and A. Kraay, 2000, 'Growth Is Good for the Poor,' World Bank mimeo. Evans, D., 1997, 'Study of the Impact of the Removal of Tariffs for the Free Trade Area
of the Southern African Development Community SADC', Occasional Paper No 5, Commonwealth Secretariat, December. Based on a report prepared for the SADC Industry and Trade Co-ordination Division SITCD, with the Assistance of the Commonwealth Secretariat, 1996.
Evans, D., 1998, 'The Regional Trade Model of Southern Africa: New Data and Results',
with M. -J. Cortijo. Final Report to the IDC and the DTI, Pretoria. May. Evans, D., 2000, 'Options for Regional Integration in Southern Africa,' The South
African Journal of Economics Die Suid-Afrikaanse Tydskrif vir Ekonomie, Vol. 68: 4 2000 December - Desember
Government of Zambia, 2000, 'Interim Poverty Reduction Strategy Paper', Ministry of Finance and Economic Development, Lusaka, 7 July. Hanmer, Lucia C., Pyatt, Graham, White, Howard, 1999, "What do the World Bank's
Poverty Assessments Teach Us About Poverty in Sub-Saharan Africa", Development and Change, Vol 30 No 4, pp795-823
Hausner, U., 1999, 'A 1995 Social Accounting Matrix for Zambia', TDM Discussion
Paper No, 49, IFPRI, Washington D.C.
20
Hertel, T. et al, 2000, 'Multilateral Trade Liberalisation and Poverty Reduction', October
10, Purdue. Kanbur, R, 2001, 'Economic Policy, Distribution and Poverty: The Nature of
Disagreements', Cornell University, Draft December 2000, minor changes January2001.
Living Conditions Monitoring Survey, 1996, Report, Central Statistical Office, Republic
of Zambia. Lipton, M., Ravallion, M., 1993, "Poverty and Policy", ch 39 in J.Berhman and
T.N.Srinivasan eds Handbook of Development Economics vol 3B, Amsterdam: North-Holland.
Loefgren, H., R.L. Harris and S. Robinson, 2001, 'A Standard Computable General
Equilibrium Model (CGE) in GAMS, TMD Discussion Paper, May McCulloch, N. et al, 2000, 'Poverty, Inequality and Growth in Zambia During the 1990's',
World Bank. Robinson, S. and K. Thierfelder, 1999, 'Trade Liberalisation and Regional Integration:
The Search for Large Numbers,' International Food Policy Research Institute, Trade and Macroeconomics Division Working Paper No. 34, Washington DC.
Stevens, C., 1999, "Liberalisation and Poverty", An OXFAM - IDS Research Report,
Commissioned by DFID. Wang, H.K and L.A. Winters, 2000, 'Putting 'Humpty' Together Again: Including
Developing Countries in a Consensus for the WTO', CEPR Policy Paper No. 4. Whalley, J., 1999, 'Quantifying the impacts of WTO negotiating rounds: lessons for the
Millennium round and Developing Countries from the Uruguay Round models', very rough draft, Universities of Warwick and Western Ontario and the NBER.
White, Howard, 1999a, "A Black Sheep Among the Reformers: Programme Aid to
Zambia", A SIDA Evaluation Report, Evaluation of Swedish Programme Aid, Institute of Social Studies, Stockholm.
White, Howard, 1999b, "Global Poverty Reduction: Are We Heading in the Right
Direction?", Journal of International Development, Vol 11 No 4, pp503-19. White, H., 2000, 'Pro Poor growth', IDS, mimeo. White, H. and E.Anderson, 2000, 'Growth versus Distribution: Does the Pattern of
Growth Matter?', IDS, Mimeo.
21
Winters, L.A., 2000, 'Trade and Poverty', WTO. World Bank, Zambia Poverty Study, 1994.
22