Embed Size (px)
Citation preview

Identifying the Needs of AAPI Elder-Serving Organizations
Community-based organizations (CBOs) across the U.S. play an essential role in addressing health, economic, and social disparities of Asian Americans and Pacific Islanders (AAPIs). In an effort to better understand the landscape of AAPI-serving CBOs and the needs of AAPI elders, the National Asian Pacific Center on Aging (NAPCA) conducted a needs assessment survey of 558 of its community partners. This report reveals the extent to which AAPI-serving CBOs vary in programming, resources, and clientele, and identifies the service gaps and barriers to information and resources of the AAPI older adult community.
Profile of CBO RespondentsGEOGrAPhy
Figure 1: Geographic Distribution of CBO respondents by region
<10,000
West
Midwest
Northeast
South
Survey responses came from organizations in all four of the U.S. geographic regions (as defined by the U.S. Census).1 Compared to the geographic distributions of the AAPI elder and overall AAPI populations, the West was overrepresented by survey respondents, and the Northeast and South were underrepresented. The Midwest was adequately represented among respondents.
West Midwest Northeast South
64% of responding CBOs � 14% of responding CBOs � 11% of responding CBOs � 11% of responding CBOs �Most commonly served �AAPI ethnicities: Chinese, Vietnamese, Filipino, Korean, Japanese
Most commonly served �AAPI ethnicities: Korean, Lao, Vietnamese, Chinese, Cambodian, Hmong
Most commonly served �AAPI ethnicities: Chinese, Korean, Vietnamese
Most commonly served �AAPI ethnicities: Vietnamese, Chinese, Korean, Filipino
54% of all AAPI elders in �the U.S.
9% of all AAPI elders in �the U.S.
18% of all AAPI elders in �the U.S.
18% of all AAPI elders in �the U.S.
47% of all AAPIs in the U.S. � 12% of all AAPIs in the U.S. � 20% of all AAPIs in the U.S. � 22% of all AAPIs in the U.S. �

2 National Asian Pacific Center on Aging
OrGANIzAtION SIzE
The majority of CBO respondents (62%) indicated that they are small organizations with zero to 19 paid employees on staff (Figure 2). Responding CBOs often receive additional unpaid assistance, with the number of volunteers ranging from less than 20 to more than 300 per organization (Figure 3), or an average of 70 volunteers per CBO. Over 50% of responding CBOs serve under 5,000 clients annually, about one-third (32%) serve 5,000-49,999 clients, and 4% serve over 50,000 clients per year.
OrGANIzAtION BuDGEt
CBOs reported annual budgets ranging from less than $100,000 to over $3 million (Figure 4). The median response came from CBOs with annual budgets in the $500,000-$1 million range. Elder-specific CBOs tend to have lower budgets (41% reported having a budget of $0-$100,000), suggesting that organizations that focus specifically on elders tend to have fewer financial resources (Figure 5).
Profile of Populations Served by CBOsGEOGrAPhIC ArEAS
CBOs in NAPCA’s network primarily serve their local AAPI communities in urban settings. The majority of responding CBOs (64%) serve urban areas, while only 2% of respondents reported serving rural communities. This corresponds with data from the U.S. Census, which indicates that only 3% of AAPIs live in rural areas.2 Most of the CBO respondents serve cities (48%) or counties (53%), whereas only 10% serve AAPIs nationwide.
tArGEt POPulAtIONS
Survey respondents specialize in serving populations across the age spectrum. A total of 81 CBOs (84%) serve adults ages 55 and over, and 19 CBOs (20%) are elder-specific, meaning that they exclusively serve individuals 55 years and older. CBOs also reported serving youth up to 24 years (78%) and adults ages 25-54 years (51%). When asked to specify the target populations served, responding CBOs most often identified low-income immigrants, older adults, and families (Figure 6). Most of the elder-specific CBOs (n=12) serve low-income elders.
62%
19%
13%
6%
0-19
20-99
100-299
300+
Figure 2: Number of Paid Staff per CBO
Figure 3: Number of unpaid Volunteers per CBO
49%
26%
14%
11%
0-19
20-99
100-299
300+
16%
25%
15%
19%
25%
$0-$100K
$100-$500K
$500K-$1M
$1-$3M
$3M+
Figure 4: CBO Budgets (n=91)
Figure 5: Elder-Specific CBO Budgets (n=17)
41%
12%
18%
6%
23%
$0-$100K
$100-$500K
$500K-$1M
$1-$3M
$3M+

3Identifying the Needs of AAPI Elder-Serving Organizations
0 10 20 30 40 50 60 70 80
Children/Youth
Other
Lesbian, Gay, Bisexual, Transgender
Disabled
Unemployed
Refugees
Medically Underserved
Men
English Language Learners
Women
Families
Older Adults (55+ years)
Low-Income/Below Poverty
Immigrants
Percent of Respondents
8
13
15
25
32
36
36
48
51
54
57
65
71
74
Figure 6: Key Populations Served by CBOs
rACIAl AND EthNIC GrOuPS
Responding CBOs serve a wide range of racial and ethnic groups. Because the survey was mailed to AAPI-serving CBOs, all of the respondents reported serving AAPIs, either exclusively or in addition to other racial groups. A majority of respondents serve Caucasians (63%), Hispanics/Latinos (62%), and African Americans (61%). A smaller number of CBOs reported serving American Indians or Alaska Natives (19%), Middle Eastern populations (7%), and other African immigrants (5%). About 7% of the CBOs reported serving individuals of mixed races.
The ethnic groups that respondents most commonly reported serving, such as Chinese, Vietnamese, Korean, and Filipino, correspond with the AAPI ethnic groups with the largest populations in the U.S. (Figure 7 & Table 1). However, CBOs that serve Cambodians appear to be slightly overrepresented by survey respondents, and CBOs that serve Asian Indian populations are underrepresented.
0 10 20 30 40 50 60 70 80
Bhutanese
Micronesian
Burmese
Guamanian
Malaysian
Native Hawaiian
Mien
Tongan
Other AAPI
Samoan
Indonesian
Pakistani
Hmong
Thai
Asian Indian
Lao
Japanese
Cambodian
Filipino
Korean
Vietnamese
Chinese
Percent of Respondents
3
7
8
10
13
14
14
15
17
18
19
20
22
28
28
31
36
40
53
57
60
64
Figure 7: Ethnic Groups Served by CBOs
table 1: u.S. Asian Ethnic Groups, ranked in Order of largest Population
Ethnic Group
Chinese1.
Asian Indian2.
Filipino3.
Vietnamese4.
Korean5.
Japanese6.
Pakistani7.
Hmong8.
Cambodian9.
Taiwanese10.
Source: U.S. Census Bureau, 2010 Census

4 National Asian Pacific Center on Aging
lANGuAGES SPOKEN
Languages spoken by CBO clients reflect the general AAPI demographics. Chinese (43%), Vietnamese (39%), and Korean (36%) were the most commonly reported languages spoken other than English (Figure 8). This is representative of the ethnicities that the CBOs serve. Thirty-two percent of CBOs reported serving Spanish-speaking individuals. After Spanish, Tagalog (25%) and Khmer/Cambodian (20%) were the next most commonly reported primary languages spoken by CBO clients.
OrGANIzAtION tyPE
Responding CBOs were asked to identify which organization types best describe them. Respondents were allowed to choose more than one category, as many CBOs often serve numerous functions in their communities. Over half (53%) of responding CBOs identified as a social services provider, 25% as a senior center, 23% as a health clinic or health care center, 23% as a community center, 7% as a housing organization, and 7% as an education or cultural center.
A majority of the respondents provide health education and information/referral services. Many of the responding CBOs also offer immigration/citizenship services, volunteer programs, and recreational and social activities (Figure 9). Very few offer mental health services and long-term care, even though they identify these as needed resources for AAPIs. (See “Key Issues Not Being Addressed.”) Most elder-specific CBOs reported that they offer recreational and social activities (68%), health education (68%), and meals/nutrition (63%), which is consistent with senior center services.
One-quarter of the CBO respondents reported that they provide support groups. Most commonly offered support groups include caregiver (33%), cancer patient/survivor (17%), chronic illness/disease management (13%), and grief (8%). Other groups mentioned services pertaining to drug and substance abuse, HIV, youth, disabled seniors, and support groups for parents with children with special needs.
Needs of AAPI EldersPrIOrItIES
CBOs were asked to rank a list of 10 issues facing AAPI elders based on their importance, with 1 indicating “most important” and 10 indicating “least important.”
0 10 20 30 40 50 60 70 80
Tamil
Bahasa-Indonesian/Malay
Native Hawaiian
Malayalam
Gujarati
Pakistani
Bengali
Tongan
Punjabi
Urdu
Mien
Samoan
Thai
Hindi
Ilocano
Laotian
Hmong
Other
Japanese
Khmer/Cambodian
Tagalog
Spanish
Korean
Vietnamese
Chinese - Mandarin
Chinese - Cantonese
English
3
3
4
4
5
6
6
7
7
8
8
9
11
11
15
16
16
18
19
20
25
32
36
39
43
43
66
Percent of Respondents
Figure 8: languages Spoken by Clients Served

5Identifying the Needs of AAPI Elder-Serving Organizations
The top priority issues for AAPI elders identified by CBOs were health/medical care/fitness, economic security, and housing. The next most important issues for AAPI elders were caregiving/long-term care and food/nutrition.
Elder-specific CBOs identified health/medical care/fitness as the top priority issue, housing as the second most important issue, and food/nutrition and economic security tied as the third most important issue.
The priority issues that were identified varied by type of organization and the services that the CBO provides. For example, organizations that provide health care tend to rate health/medical care as the top priority issue, while organizations that provide housing tend to rate housing as the top priority issue for AAPI elders. Tables 2 and 3 list the priority issues for AAPI elders and the average ranking.
0 10 20 30 40 50 60 70 80
Mental Health Services
Long-term Care/Nursing Home
Other
Home Health Care
Educational/Cultural Programs
Adult Day Care
Financial Assistance
Legal Assistance
Caregiver/Respite Care
Domestic Violence
Elder Abuse Prevention
Crisis Intervention
Day Care/Youth Programs
Health/Medical Care
Economic Development
Benefits/Health Insurance Counseling
Transportation
Support Groups
Housing
Nutrition/Meals/Food Bank
Job Training/Placement
Counseling
English Language Classes
Interpretation/Translation
Case Management
Volunteer
Recreational/Social Activities
Immigration/Citizenship
Information/Referral
Health Education
5
5
7
10
11
11
13
16
18
19
20
20
21
22
22
22
25
25
25
30
34
39
40
43
44
45
45
46
59
61
Percent of Respondents
Figure 9: CBO Services and Programs
Priority Issue Average ranking
Health/Medical Care/Fitness1. 3.4
Economic Security2. 4.0
Housing3. 4.2
Caregiving/Long-term Care4. 4.9
Food/Nutrition5. 5.0
Transportation6. 5.3
Immigration/Citizenship7. 5.4
Mental Health8. 5.5
Employment9. 6.0
Elder Abuse10. 7.7
table 2: Priority Issues for AAPI Elders, reported by All responding CBOs
Priority Issue Average ranking
Health/Medical Care/Fitness1. 2.5
Housing2. 3.7
Food/Nutrition3. 4.1
Economic Security4. 4.1
Caregiving/Long-term Care5. 4.7
Mental Health6. 4.7
Immigration/Citizenship7. 6.2
Transportation8. 6.8
Elder Abuse9. 6.8
Employment10. 7.8
table 3: Priority Issues for AAPI Elders, Reported by Elder-Specific CBOs
6 National Asian Pacific Center on Aging
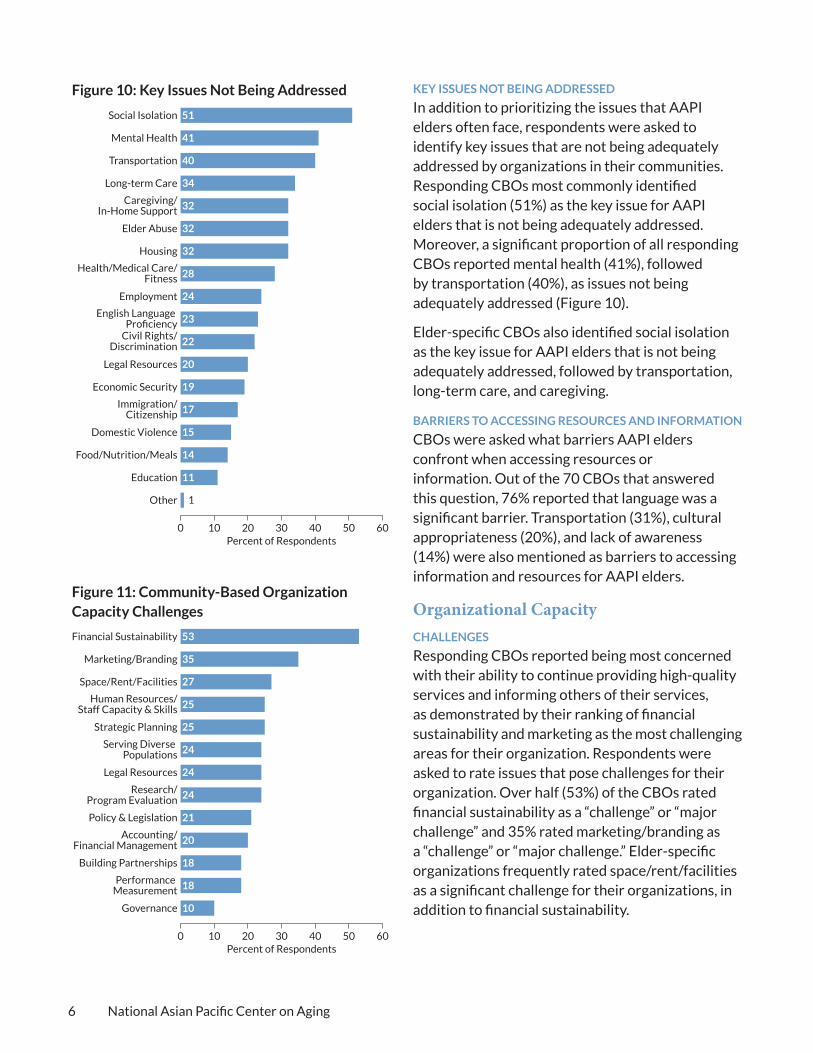
KEy ISSuES NOt BEING ADDrESSED
In addition to prioritizing the issues that AAPI elders often face, respondents were asked to identify key issues that are not being adequately addressed by organizations in their communities. Responding CBOs most commonly identified social isolation (51%) as the key issue for AAPI elders that is not being adequately addressed. Moreover, a significant proportion of all responding CBOs reported mental health (41%), followed by transportation (40%), as issues not being adequately addressed (Figure 10).
Elder-specific CBOs also identified social isolation as the key issue for AAPI elders that is not being adequately addressed, followed by transportation, long-term care, and caregiving.
BArrIErS tO ACCESSING rESOurCES AND INFOrMAtION
CBOs were asked what barriers AAPI elders confront when accessing resources or information. Out of the 70 CBOs that answered this question, 76% reported that language was a significant barrier. Transportation (31%), cultural appropriateness (20%), and lack of awareness (14%) were also mentioned as barriers to accessing information and resources for AAPI elders.
Organizational CapacityChAllENGES
Responding CBOs reported being most concerned with their ability to continue providing high-quality services and informing others of their services, as demonstrated by their ranking of financial sustainability and marketing as the most challenging areas for their organization. Respondents were asked to rate issues that pose challenges for their organization. Over half (53%) of the CBOs rated financial sustainability as a “challenge” or “major challenge” and 35% rated marketing/branding as a “challenge” or “major challenge.” Elder-specific organizations frequently rated space/rent/facilities as a significant challenge for their organizations, in addition to financial sustainability.
0 10 20 30 40 50 60
Other
Education
Food/Nutrition/Meals
Domestic Violence
Immigration/Citizenship
Economic Security
Legal Resources
Civil Rights/Discrimination
English Language Proficiency
Employment
Health/Medical Care/Fitness
Housing
Elder Abuse
Caregiving/In-Home Support
Long-term Care
Transportation
Mental Health
Social Isolation
Percent of Respondents
1
11
14
15
17
19
20
22
23
24
28
32
32
32
34
40
41
51
Figure 10: Key Issues Not Being Addressed
0 10 20 30 40 50 60
Governance
Performance Measurement
Building Partnerships
Accounting/Financial Management
Policy & Legislation
Research/Program Evaluation
Legal Resources
Serving Diverse Populations
Strategic Planning
Human Resources/Staff Capacity & Skills
Space/Rent/Facilities
Marketing/Branding
Financial Sustainability
Percent of Respondents
10
18
18
20
21
24
24
24
25
25
27
35
53
Figure 11: Community-Based Organization Capacity Challenges

7Identifying the Needs of AAPI Elder-Serving Organizations
ADDItIONAl FuNDING
NAPCA asked CBOs what they would do with additional funding. Out of the 81 CBOs that responded to this question, half said that they would expand existing programs or add new services with additional funding; 40% would hire more staff or raise staff salaries; 23% would use funding to build new infrastructure or fix existing facilities; and 8% would offer transportation. Other responses included conducting radio broadcasts, establishing paid internships for seniors and youth in the community, helping uninsured patients, serving more meals, and subsidizing citizenship fees.
NAPCA HelplineNAPCA’s toll-free multilingual Helpline provides information on Medicare, Medicaid, and Social Security to limited English speaking Chinese, Korean, and Vietnamese seniors. The Helpline also provides assistance on enrollment in Medicare Part D, the Medicare Low Income Subsidy, and other Medicare savings programs.
CBOs were asked if they had heard of the Helpline and if they would refer their AAPI elder clients to this resource. A majority of the respondents (62%) have never heard of the Helpline. However, a large proportion of the respondents (87%), regardless of whether or not they have heard of Helpline, would refer their AAPI elder clients to this resource. Among those who said they would not refer to the Helpline, the most common response reported was that the Helpline does not cater to the languages of those CBOs’ client populations. The languages mentioned were Tagalog, Ilocano, Hindi/Urdu, Bengali, Punjabi, and Hmong. Other reasons for not referring clients to the Helpline included referring clients to local providers and not working with elder clients.
The survey also asked CBOs what additional information or assistance NAPCA could provide to their clients through Helpline. Only 25 CBOs answered this question and three requested languages other than the ones that are already offered. Two CBOs mentioned housing or estate planning. Other topics mentioned include mental health, long-term care, job training, and phone reassurance services. This illustrates the critical need for education and outreach to AAPI elders to inform and explain to them the myriad of important issues they may face as they age, as well as the resources they can access.
MethodsIn April 2012, the survey was mailed to 558 AAPI-serving CBOs that are among the CBOs in NAPCA’s network. A total of 97 organizations completed the survey, yielding a 17% response rate. The survey consisted of 29 questions in English. Key survey topics included: CBO characteristics; CBO programs and services;
0
20
40
60
80
100NoYes
Refer to HelplineHeard of Helpline
6238
Per
cen
t o
f Res
po
nd
ents
1387
Figure 12: CBO Awareness and Intention to refer to NAPCA’s helpline
priorities of CBOs; AAPI elders’ needs and barriers to service; organization capacity and challenges; and methods for reaching AAPI elders. Elders in this survey and report are defined as adults aged 55 years and over (55+).
While we attempted to design this survey in a way that captured important data without overwhelming respondents, one limitation of this survey is that 97 of the CBOs responded with a completed survey. While a 17% response rate is not uncommon for an organizational survey,3 a larger response rate and a more random sample of respondents would produce a broader and more generalizable representation of the priorities, needs, and challenges of AAPI-serving CBOs and AAPI older adults.
ConclusionsThe results of the 2012 CBO survey reveal the priorities and challenges of AAPI-serving CBOs. Responding CBOs reported that while health/medical care, economic security, and housing are top priority issues for AAPI elders, they feel that social isolation, transportation, and mental health are key issues for AAPI elders that are not being adequately addressed in AAPI communities. Language and transportation, followed by lack of cultural appropriateness, were identified as the main barriers to accessing information and resources for AAPI elders.
The responding CBOs provide service to over half a million clients that need linguistically and culturally appropriate resources and programs. As identified by community service providers, it is evident that more funding is needed for CBOs to properly serve the AAPI older adult population. CBOs reported they are unable to address key issues facing AAPI elders; half reported that they would expand existing programs or add new services if additional resources were available.
NAPCA will use the results of this assessment to improve upon existing services and identify new opportunities for future partnerships with CBOs committed to improving the lives of AAPI elders. We greatly appreciate the feedback and support of our partners and for the staff of these organizations who provide essential services to the AAPI community.
1511 Third Avenue, Suite 914 • Seattle, WA 98101-1626 • 206-624-1221 • Fax 206-624-1023 • www.napca.org
references
1. U.S. Census Bureau. 2010 geographic terms and concepts. http://www.census.gov/geo/reference/terms.html. Accessed March 2013.
2. U.S. Census Bureau, 2000 Census.
3. Hager MA, Wilson S, Pollak TH, Rooney PM. (2003). Response rates for mail surveys of nonprofit organizations: A review and empirical test. Nonprofit and Voluntary Sector Quarterly, 32(2), 252-67.
Compiled by Karen Blacher, NAPCA Research Associate. Design by Debbie Louie. Printed September 2013.
AcknowledgementsThis report was made possible by the generous support of: