Embed Size (px)
Citation preview
IDENTIFYING LAND USE CHANGES USING LANDSAT IMAGE (1979, 2006, AND 2014) AND GEOGRAPHICAL INFORMATION SYSTEM TO
PREDICT FLOOD PRONE AREA AROUND JATINANGOR, SUMEDANG, WEST JAVA
Dede NUROHIM1∗, Panji RIDWAN1, Endah TRESNASARI1, Murni SULASTRI1, Nana SULAKSANA1
1Faculty of Geological Engineering, Universitas Padjadjaran
*Corresponding author: [email protected]
Abstract
Changes in land use becoming one of the important issues to determine flood prone areas. Jatinangor area has a lot of problems related to land use, one of them is reduction of water-catching area . Therefore, this research aims to determine changes of land use using Landsat image data and Geographical Information System (GIS) analysis in order to determine flood prone areas surrounding Jatinangor in three time periods : 1979, 2006, and 2014 to date. Based on the results, there are significant increase in expansion of urban area. Land use for settlement is increasing, while water-catching areas and agroforest are significantly decreasing. Interestingly, there is an increase in industrial and commercial land use which shows a change of land use from the unbuilt area into built area, and expansion of urban area to the surrounding region. This situation becoming a challenge for Jatinangor development especially with the increase of population. In addition to regional development, land use should consider risks of disaster potential that could happen in case of inability of land to support built infrastructures. Based on river morphometric analysis, river density shows value of 2,89 while river circularity shows value of 0,42 which shows that the area has a good resistancy and decent drainage although there are flood threat at some area. Based on the flood prone area map, Hegarmanah, Cikeruh, Cibeusi, and Rancaekek District are the most flood prone area during high rain intensity.
Keywords: Landsat, Flood, Land, Urbanization, Jatinangor
The 2nd Join Conference of Utsunomiya University and Universitas Padjadjaran, Nov.24,2017
220
INTRODUCTION Background
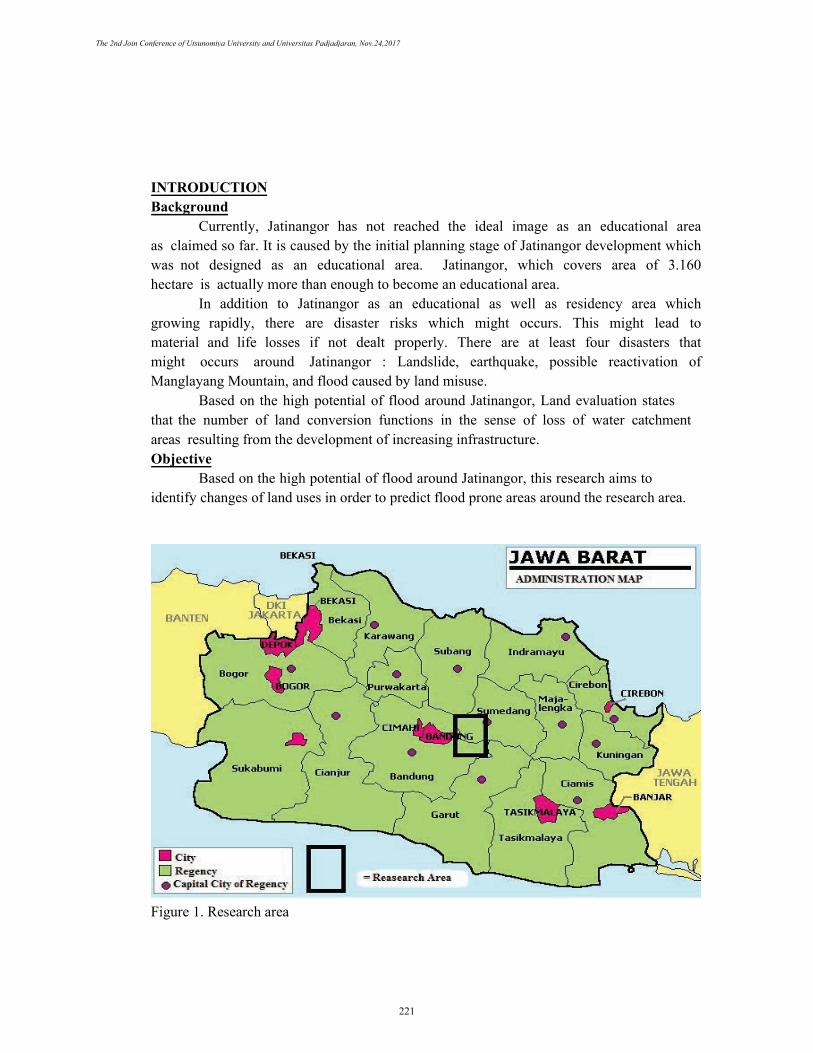
Currently, Jatinangor has not reached the ideal image as an educational area as claimed so far. It is caused by the initial planning stage of Jatinangor development which was not designed as an educational area. Jatinangor, which covers area of 3.160 hectare is actually more than enough to become an educational area.
In addition to Jatinangor as an educational as well as residency area which growing rapidly, there are disaster risks which might occurs. This might lead to material and life losses if not dealt properly. There are at least four disasters that might occurs around Jatinangor : Landslide, earthquake, possible reactivation of Manglayang Mountain, and flood caused by land misuse.
Based on the high potential of flood around Jatinangor, Land evaluation states that the number of land conversion functions in the sense of loss of water catchment areas resulting from the development of increasing infrastructure. Objective
Based on the high potential of flood around Jatinangor, this research aims to identify changes of land uses in order to predict flood prone areas around the research area.
Figure 1. Research area
The 2nd Join Conference of Utsunomiya University and Universitas Padjadjaran, Nov.24,2017
221
METHODOLOGY The base of this research is about the observation of field utilization in the area of
universities in Jatinangor based on the capability of the field included the angle of the slope and the drainage and also the physical character of the rocks that are observed from the geology of the observation area
This research is a comparison analysis between primary and secondary data. Secondary data was obtained through literature study of previous researches with similar topic, then we also obtained primary data through spatial data observavtion. Spatial data observation is conducted to gain direct information regarding current condition of the area : total land usage and physical characteristics including slope steepness, river flow pattern, and Landsat image analysis. Obtained data will be classified into two data groups : quantitative data which shown as value/numbers, and qualitative data which shown as sentences or symbols and then the data is processed using Mapinfo, compared, and analyzed.
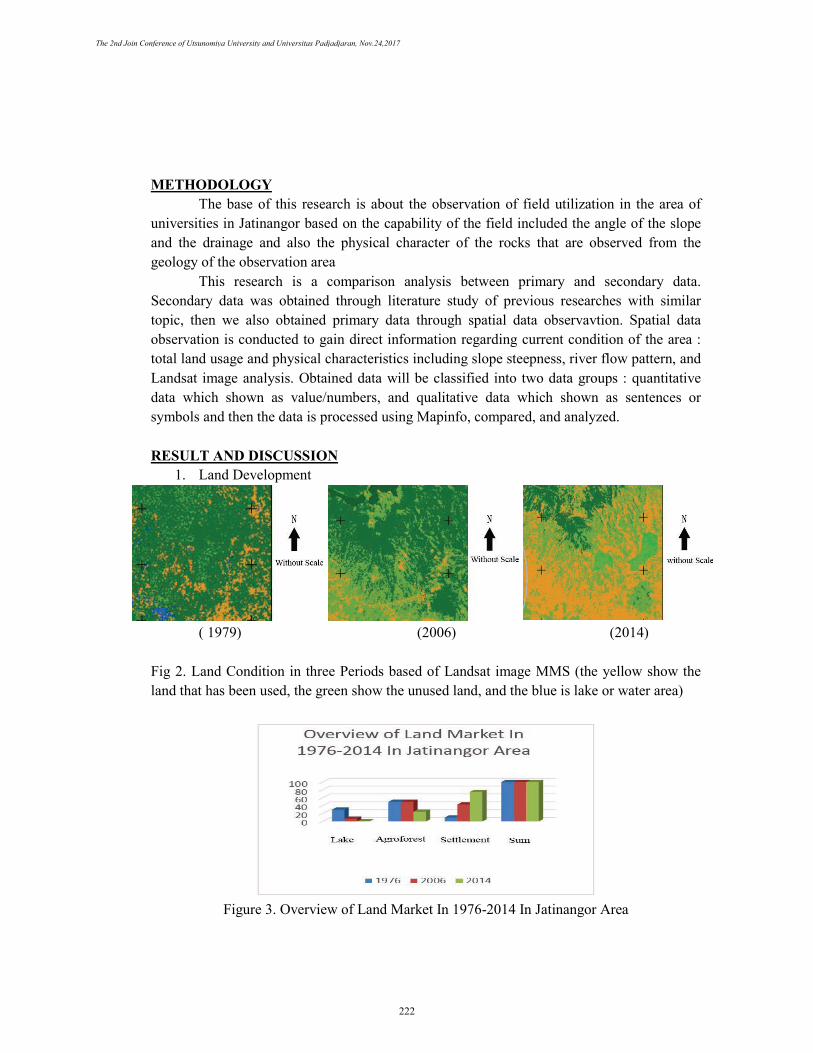
RESULT AND DISCUSSION 1. Land Development
( 1979) (2006) (2014)
Fig 2. Land Condition in three Periods based of Landsat image MMS (the yellow show the land that has been used, the green show the unused land, and the blue is lake or water area)
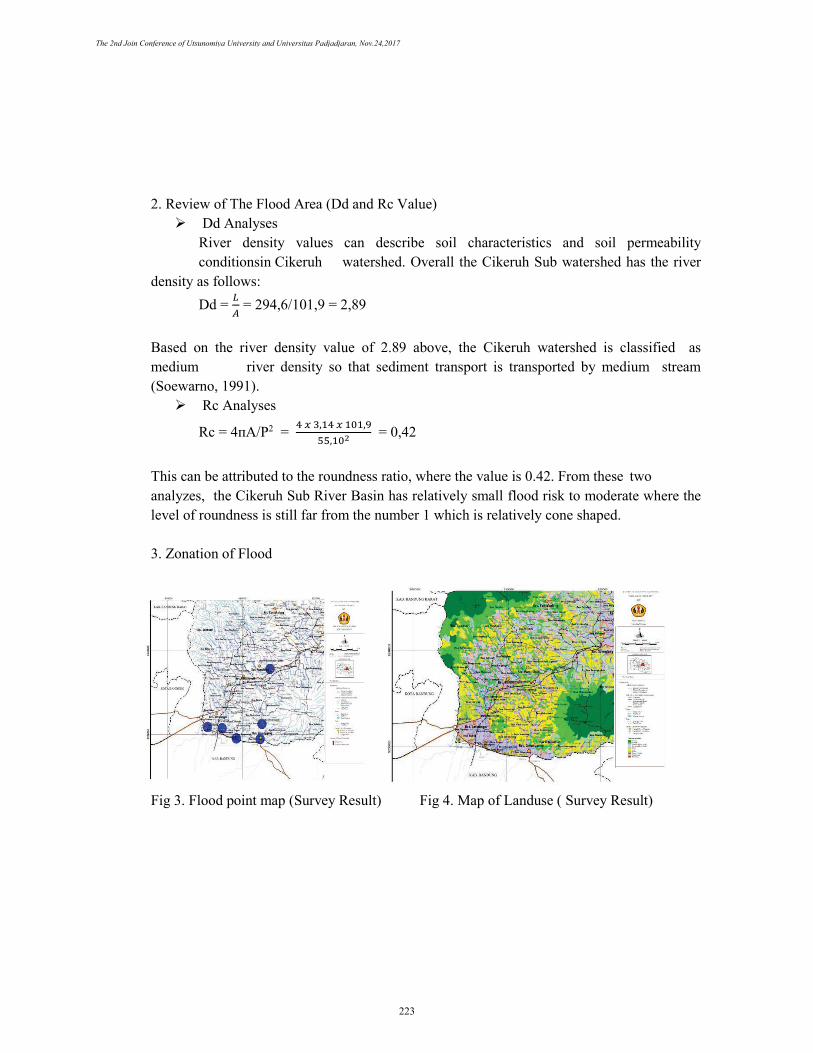
Figure 3. Overview of Land Market In 1976-2014 In Jatinangor Area
The 2nd Join Conference of Utsunomiya University and Universitas Padjadjaran, Nov.24,2017
222
2. Review of The Flood Area (Dd and Rc Value) Dd Analyses
River density values can describe soil characteristics and soil permeabilityconditionsin Cikeruh watershed. Overall the Cikeruh Sub watershed has the river
density as follows: Dd = 𝐿𝐿
𝐴𝐴 = 294,6/101,9 = 2,89
Based on the river density value of 2.89 above, the Cikeruh watershed is classified as medium river density so that sediment transport is transported by medium stream (Soewarno, 1991). Rc Analyses
Rc = 4пA/P2 = 4 𝑥𝑥 3,14 𝑥𝑥 101,955,102
= 0,42
This can be attributed to the roundness ratio, where the value is 0.42. From these two analyzes, the Cikeruh Sub River Basin has relatively small flood risk to moderate where the level of roundness is still far from the number 1 which is relatively cone shaped.
3. Zonation of Flood
Fig 3. Flood point map (Survey Result) Fig 4. Map of Landuse ( Survey Result)
The 2nd Join Conference of Utsunomiya University and Universitas Padjadjaran, Nov.24,2017
223
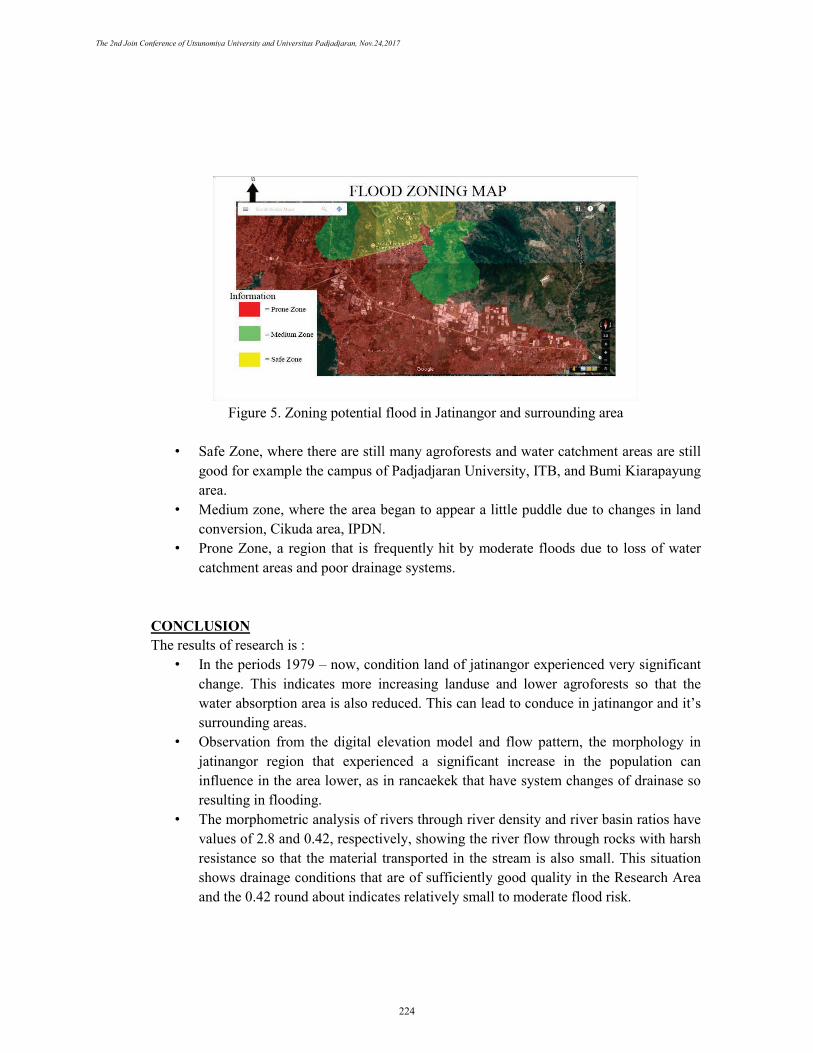
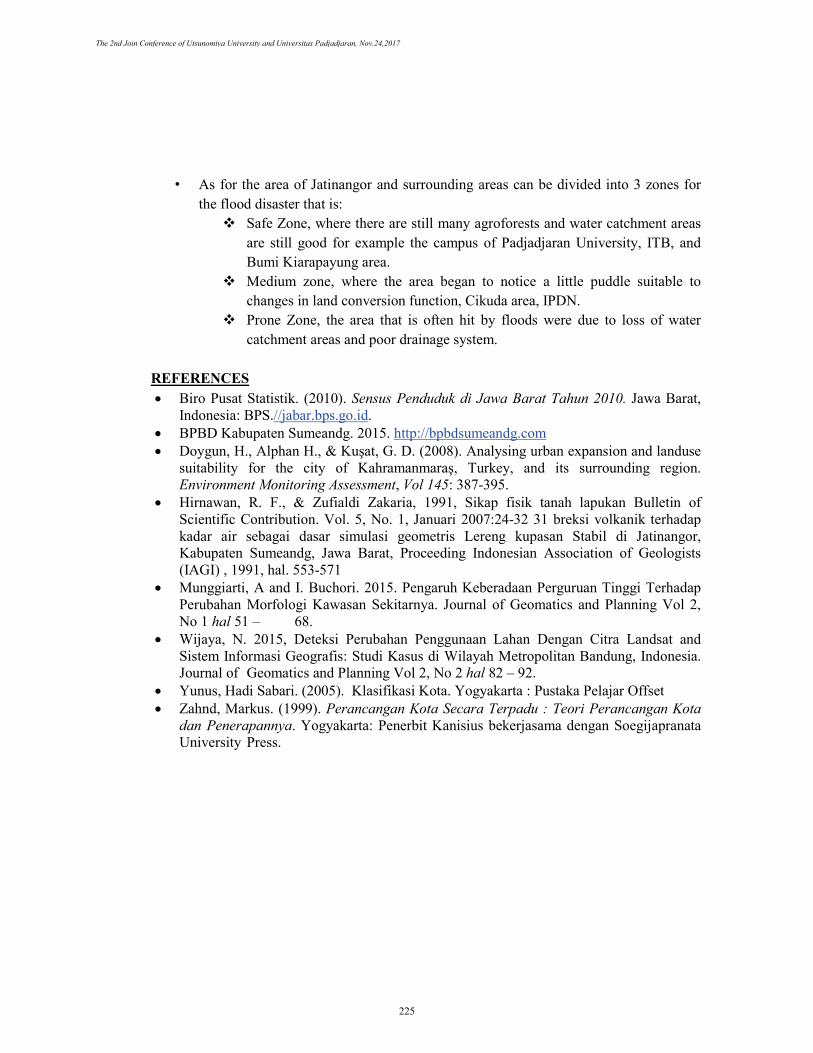
Figure 5. Zoning potential flood in Jatinangor and surrounding area
• Safe Zone, where there are still many agroforests and water catchment areas are stillgood for example the campus of Padjadjaran University, ITB, and Bumi Kiarapayungarea.
• Medium zone, where the area began to appear a little puddle due to changes in landconversion, Cikuda area, IPDN.
• Prone Zone, a region that is frequently hit by moderate floods due to loss of watercatchment areas and poor drainage systems.
CONCLUSION The results of research is :
• In the periods 1979 – now, condition land of jatinangor experienced very significantchange. This indicates more increasing landuse and lower agroforests so that thewater absorption area is also reduced. This can lead to conduce in jatinangor and it’ssurrounding areas.
• Observation from the digital elevation model and flow pattern, the morphology injatinangor region that experienced a significant increase in the population caninfluence in the area lower, as in rancaekek that have system changes of drainase soresulting in flooding.
• The morphometric analysis of rivers through river density and river basin ratios havevalues of 2.8 and 0.42, respectively, showing the river flow through rocks with harshresistance so that the material transported in the stream is also small. This situationshows drainage conditions that are of sufficiently good quality in the Research Areaand the 0.42 round about indicates relatively small to moderate flood risk.
The 2nd Join Conference of Utsunomiya University and Universitas Padjadjaran, Nov.24,2017
224
• As for the area of Jatinangor and surrounding areas can be divided into 3 zones forthe flood disaster that is: Safe Zone, where there are still many agroforests and water catchment areas
are still good for example the campus of Padjadjaran University, ITB, andBumi Kiarapayung area.
Medium zone, where the area began to notice a little puddle suitable tochanges in land conversion function, Cikuda area, IPDN.
Prone Zone, the area that is often hit by floods were due to loss of watercatchment areas and poor drainage system.
REFERENCES • Biro Pusat Statistik. (2010). Sensus Penduduk di Jawa Barat Tahun 2010. Jawa Barat,
Indonesia: BPS.//jabar.bps.go.id.• BPBD Kabupaten Sumeandg. 2015. http://bpbdsumeandg.com• Doygun, H., Alphan H., & Kuşat, G. D. (2008). Analysing urban expansion and landuse
suitability for the city of Kahramanmaraş, Turkey, and its surrounding region.Environment Monitoring Assessment, Vol 145: 387-395.
• Hirnawan, R. F., & Zufialdi Zakaria, 1991, Sikap fisik tanah lapukan Bulletin ofScientific Contribution. Vol. 5, No. 1, Januari 2007:24-32 31 breksi volkanik terhadapkadar air sebagai dasar simulasi geometris Lereng kupasan Stabil di Jatinangor,Kabupaten Sumeandg, Jawa Barat, Proceeding Indonesian Association of Geologists(IAGI) , 1991, hal. 553-571
• Munggiarti, A and I. Buchori. 2015. Pengaruh Keberadaan Perguruan Tinggi TerhadapPerubahan Morfologi Kawasan Sekitarnya. Journal of Geomatics and Planning Vol 2,No 1 hal 51 – 68.
• Wijaya, N. 2015, Deteksi Perubahan Penggunaan Lahan Dengan Citra Landsat andSistem Informasi Geografis: Studi Kasus di Wilayah Metropolitan Bandung, Indonesia.Journal of Geomatics and Planning Vol 2, No 2 hal 82 – 92.
• Yunus, Hadi Sabari. (2005). Klasifikasi Kota. Yogyakarta : Pustaka Pelajar Offset• Zahnd, Markus. (1999). Perancangan Kota Secara Terpadu : Teori Perancangan Kota
dan Penerapannya. Yogyakarta: Penerbit Kanisius bekerjasama dengan SoegijapranataUniversity Press.
The 2nd Join Conference of Utsunomiya University and Universitas Padjadjaran, Nov.24,2017
225