Embed Size (px)
Citation preview

Portland State University Portland State University
PDXScholar PDXScholar
Dissertations and Theses Dissertations and Theses
1-1-2010
Identifying Best Quality Management Practices for Identifying Best Quality Management Practices for
Achieving Quality and Innovation Performance in the Achieving Quality and Innovation Performance in the
Forest Products Industry Forest Products Industry
Scott A. Leavengood Portland State University
Follow this and additional works at: https://pdxscholar.library.pdx.edu/open_access_etds
Let us know how access to this document benefits you.
Recommended Citation Recommended Citation Leavengood, Scott A., "Identifying Best Quality Management Practices for Achieving Quality and Innovation Performance in the Forest Products Industry" (2010). Dissertations and Theses. Paper 136. https://doi.org/10.15760/etd.136
This Dissertation is brought to you for free and open access. It has been accepted for inclusion in Dissertations and Theses by an authorized administrator of PDXScholar. Please contact us if we can make this document more accessible: [email protected].
Identifying Best Quality Management Practices for Achieving Quality and Innovation
Performance in the Forest Products Industry
by
Scott Allen Leavengood
A dissertation submitted in partial fulfillment of the requirements for the degree of
Doctor of Philosophy in
Systems Science: Engineering Management
Dissertation Committee: Timothy R. Anderson, Chair
Wayne Wakeland Tugrul Daim
Tom Gillpatrick Robert D. Dryden
Portland State University ©2011
i
ABSTRACT
In many business sectors today, the focus on quality as a competitive tool is
being replaced by a focus on innovation. Research exploring connections between
quality management, innovation, and company performance suggests that quality is
‘necessary but insufficient’ in today’s business environment. In short, the question
facing managers, particularly those in small firms, is how to adapt their quality
management practices to achieve innovation performance in addition to quality
performance.
To answer this question, West Coast U.S. forest products manufacturers were
surveyed about quality management practices and performance with respect to both
quality and innovation. Quality management practices were assessed following the
systems perspective articulated by the Malcolm Baldrige National Quality Award.
Data envelopment analysis was used to identify companies efficiently using quality
management practices to lead to quality and/or innovation performance. Survey
responses from the efficient firms were then analyzed via cluster analysis to identify
two categories of firms: those achieving primarily quality outcomes and those
achieving both quality and innovation outcomes. Executives from two firms in each
category were interviewed to provide detail on the management practices used by the
companies. Interview transcripts were examined to identify similarities and
differences in practices between the two categories of firms.

ii
Results suggest several specific areas of focus for firms wanting to adapt their
quality management practices to achieve both quality and innovation performance. For
example, firms focused on innovation proactively seek to identify and meet
customers’ needs whereas quality-focused firms primarily emphasize reacting to
customer complaints. More specifically with respect to ‘customer focus’, firms
focused on innovation emphasize convenience for their customers through practices
such as standardizing product lines and providing product specifications on their
websites. In contrast, neither quality-focused firm had a website. These firms were at
their production capacity (at least prior to the recession) and viewed websites strictly
as a means to attract new business rather than as a service to existing customers. Also
with regards to customer focus, firms focused on innovation sought to generate new
business – not just for their company, but for their customers as well. Beyond
customer focus, firms focused on innovation provide employees with opportunities to
help the organization implement changes. With respect to benchmarking, firms
focused on innovation actively sought to measure their performance against the ‘best
practice’ in the industry; firms focused primarily on quality performance demonstrated
little if any emphasis on benchmarking. Finally, there were apparent overarching and
hence cultural differences between the two categories of firms – firms focused on
innovation were more proactive, strategic, and willing to take risk; in addition, these
firms discussed innovation as the means to improve product quality, reduce costs, or
attract new customers. By contrast, the quality-focused firms were reactive,
conservative, and risk-averse; these firms discussed innovation primarily as
‘technology’ without reference to potential linkages to company performance.

iii
Acknowledgements
To my family – thanks for enduring 9+ years of me being a ‘bit preoccupied.’ To my
beautiful wife of nearly 20 years, thank you so much for hanging in there with me
through thick and thin with this! Without your love and support, I would have given
up long ago. To my daughters, now ‘dad’s home’ means he’s really home (and not
sitting in the office on the computer…).
To my mom – thanks for demonstrating for me the value of education.
To my colleagues Eric Hansen and Chris Knowles – thanks for your insights and
encouragement.
To members of the Oregon Wood Innovation Center Advisory Council (Roy
Anderson, Blake Holton, Lee Jimerson, David Schmidt, and David Stallcop) – thanks
for reviewing the interview questions. And to the survey respondents and interviewees
– thanks for taking the time to respond to ‘yet another survey!’
To Mark Edwards, my friend and colleague - thank you for all your advice and
support. And thanks for taking the time to read several drafts of my methods – only a
true friend would do that!

iv
And last but not least, many thanks to my committee, Drs. Anderson, Wakeland,
Daim, Dryden, and Gillpatrick. I greatly appreciate your wisdom and guidance – and
in particular, your patience enduring my submission of a couple very long drafts right
at the deadline!
v
Table of Contents
Abstract ........................................................................................................................ i
Acknowledgements .................................................................................................... iii
List of Tables .............................................................................................................. vi
List of Figures ........................................................................................................... vii
Chapter 1. Introduction ............................................................................................... 1
Chapter 2. Literature Review .................................................................................... 14
Quality ................................................................................................................... 14
Innovation .............................................................................................................. 39
Data Envelopment Analysis (DEA) ....................................................................... 56
Case Study Method ................................................................................................ 62
Relationships between Quality Management and Organizational Performance ... 69
Gaps in the Literature .......................................................................................... 112
Chapter 3. Research Methods ................................................................................. 116
Chapter 4. Results & Discussion ............................................................................. 147
Chapter 5. Contributions ......................................................................................... 232
References ............................................................................................................... 248
Appendix A – Quality Constructs and Measurement Instruments .......................... 263
Appendix A1 – Saraph et al. ................................................................................ 264
Appendix A2 – Flynn et al. ................................................................................. 267
Appendix A3 – Ahire et al. .................................................................................. 270
Appendix A4 – Singh and Smith ......................................................................... 273
Appendix A5 – Samson and Terziovski .............................................................. 277
Appendix A6 – Final Measurement Instrument Used ......................................... 280
Appendix A7 – Cover Letter for Questionnaire .................................................. 284
Appendix A8 – Case Study Interview Questions ................................................ 285
Appendix B – Innovation Constructs and Measurement Instruments .................... 288
Appendix C - Graphical Representation of Efficiency ........................................... 290
Appendix D – Results of Test for Non-response Bias ............................................ 291
Appendix E – DEA Results ..................................................................................... 294
vi
List of Tables
Table 1. Performance Measures for Each Critical Factor of TQM [71] ...................... 37
Table 2. Scales to Measure Product and Process Innovation Performance [25] .......... 54
Table 3. Distinctive Principles Associated with TQC and TQL Compared to Common TQM Precepts [24] ....................................................................................................... 92
Table 4. Summary of Conflicting Arguments on the Relationship Between TQM and Innovation [30] ............................................................................................................. 93
Table 5. Constructs for Measuring Technology and R&D Management [35] ........... 102
Table 6. Summary of Literature Exploring Relationships between Quality and Innovation ................................................................................................................... 110
Table 7. Respondents by Industry Sector ................................................................... 150
Table 8. Number of Employees in Population vs. Survey Respondents .................... 151
Table 9. Characteristics of Case Firms ....................................................................... 154
Table 10. Cross-Case Comparison of Questionnaire Responses (Inputs) .................. 166
Table 11. Cross-Case Comparison of Questionnaire Responses (Outputs) ............... 166
Table 12. Quality Management Practices that Differ between Balanced and Quality-Oriented Firms ............................................................................................................ 184
Table 13. Number of Comments Related to Hard and Soft TQM Factors ................. 188
Table 14. Recommended Practices for Proactive Customer Interaction .................... 231
vii
List of Figures
Figure 1. Baldrige Criteria Framework: A Systems Perspective [61] .......................... 21
Figure 2. Three Fundamental Principles of TQM ........................................................ 26
Figure 3. Dualities within TQM Implementation ......................................................... 27
Figure 4. A Multidimensional Model of Innovation [72] ............................................. 42
Figure 5. Innovation and Stage of Development [78] .................................................. 46
Figure 6. TQM and Innovation: Research Framework [30] ......................................... 98
Figure 7. Flow Diagram for Research ........................................................................ 119
Figure 8. DEA Input-Output Model Used in this Study ............................................. 126
Figure 9. Selection of Cases ....................................................................................... 129
Figure 10. Cluster Analyis Dendrogram and Average Performance Responses for DEA-Efficient Firms .................................................................................................. 153
1
Chapter 1. Introduction
Organizations have long recognized the importance of quality. Prior to the
industrial revolution, quality was ensured through apprenticeship programs, skilled
craftsman, and the training and standards of professional guilds. Mass production
systems led to a transition to relying on product inspection for quality assurance.
Beginning in World War II, the quality sciences and profession grew rapidly. The
‘quality movement’ began with a focus on specific tools such as acceptance sampling
procedures and Statistical Process Control (SPC); efforts were centered primarily in
production [1]. Quality management programs eventually grew to encompass a
company-wide, i.e., systems-based approach which is now known as Total Quality
Management (TQM) [2].
Widely publicized failures of TQM to deliver bottom-line results led many
management experts to declare TQM a failure and/ or pose the question, is TQM dead
[3-8]? Numerous researchers have studied the impacts of TQM on performance and
the results are mixed. Regardless, early approaches to implementing TQM were said
to over-emphasize quality-related metrics to the exclusion of financial metrics, i.e.,
bottom-line results. Further, TQM has been criticized for failing to emphasize
‘breakthrough’ improvements. That is, TQM, and continuous improvement by
extension, are said to focus on evolutionary rather than revolutionary improvement.
2
Business Process Reengineering (BPR) and later, Six Sigma, were established to
address the perceived weaknesses of TQM. And of course, TQM itself continues to
evolve.
BPR emphasizes radical improvement by completely revamping processes, or
eliminating unnecessary processes altogether, rather than simply making incremental
improvements [9]. Said another way, where the continuous improvement philosophy
might lead practitioners to pose the question “how can we do this (process) better?”, in
BPR one would ask, “do we need this process at all?” BPR faded in popularity in the
1990s due to perceived linkages with downsizing, i.e., employees began to associate
reengineering with ‘improving the bottom line via layoffs’ [10]. Drawing distinctions
between BPR and TQM has been a subject of much debate. Some see BPR as a stand-
alone philosophy that is a replacement for TQM. Others have argued that BPR is
simply a subset of TQM albeit with a focus on breakthrough vs. incremental
improvement where feasible [11, 12].
Six Sigma was also developed in part to address perceived weaknesses of
TQM. Six Sigma integrates well-established quality tools and techniques into a
structured approach (DMAIC – define, measure, analyze, improve, control) to quality
improvement projects and by emphasizing project selection. Projects are selected
based on the potential for significant positive impact on profitability. As with BPR,
some see Six Sigma as an alternative or replacement for TQM while others argue that
3
there is nothing new in Six Sigma; it is simply ‘TQM repackaged’ [13-15]. The
principle of reducing variation to improve quality remains.
In discussing the evolution of TQM and debate over whether competing
philosophies are truly new, it should become clear that there is no single universally
accepted definition of TQM. A significant amount of research has been devoted
purely to defining TQM and developing constructs to differentiate ‘TQM firms’ from
‘non-TQM firms’ [16-20].
Further, part of the evolution of TQM has been to recognize the importance of
adapting the philosophy to suit the strategy, context, and culture of the firm and thus
the need for a ‘contingency approach’ to implementing TQM. Early TQM programs
emphasized the technical or ‘hard’ tools such as statistical process control, Pareto
charts, and design of experiments. Over time, practitioners recognized the inadequate
attention being paid to the systems approach fundamental to TQM, primarily the need
to address the human side of quality. Such recognition resulted in greater emphasis on
the ‘soft’ factors such as teams and employee empowerment [21].
In fact, researchers have revealed other potential dualities within TQM beyond
the ‘hard vs. soft’ factors [22-24]. One such duality may be described as having an
internal vs. external focus – focusing primarily on improving efficiency of internal
operations vs. focusing externally on customer relations. This internal/ external focus
could also manifest itself as being reactive to customer needs as opposed to proactive.
4
With respect to the scope of implementation of TQM in a firm, there are firms that
focus primarily on downstream plant-floor operations and those that strive to truly
implement TQM company-wide.
Today, arguments as to whether TQM is a failure or success, dead or alive
seem to have shifted to a more productive question: “What is the role of quality
management in business today?” At least one author has stated that quality is now
simply a ‘qualifying criterion’ (Prajogo and Sohal [25] citing Hill [26]). The apparent
result of the quality movement, and TQM by extension, has been that dramatic
improvements in quality resulted in dramatic increases in customer expectations. For
most companies, quality is thus necessary but not sufficient as an element of
competitive strategy. Globalization of markets and rapid economic growth in
developing nations are forcing firms in developed nations to look to new sources for
competitive advantage. Innovation is now widely recognized as a key factor to long-
term competitiveness [27].
For managers, the question then becomes where and how to focus – quality or
innovation? Of course, it is not an either/ or decision. If quality is a qualifying
criterion for staying in business, managers must learn how to manage for quality and
innovation simultaneously. However, are the two compatible? Are there trade-offs
involved, i.e., if a firm focuses on quality will innovation necessarily suffer or vice-
versa? Quality programs have emphasized stability and efficiency, that is, ‘doing it
right the first time.’ Further, quality programs typically focus on satisfying existing
5
customers. Conversely, innovation requires flexibility and effectiveness, in other
words, ‘doing right things.’ Innovation is often focused on attracting new customers;
innovative firms acknowledge the risk of paying too much attention to satisfying
existing customers at the expense of neglecting to stay attuned to the changing
business environment. For these reasons, some say that a quality-oriented culture in a
firm may be counter-productive to fostering a culture focused on innovation [24, 28-
32]. Further, how can a manager choose between the right balance of the hard and
soft factors, internal and external focus, implementation in downstream activities or
upstream, etc.
Hence, for managers today, the primary questions related to quality and
innovation are:
Can a company manage for quality such that innovation is positively impacted
as well?
Can existing quality programs be adapted to also address innovation
performance? If so, how, that is, what are the ‘best practices?’
Problem Definition
Researchers have only recently begun to explore relationships between quality
management and innovation performance. As with research exploring the impact of
TQM on quality performance, the results of research exploring the impact of TQM on
innovation performance have been mixed as well. Singh and Smith concluded that
there was insufficient evidence to link TQM and innovation [33]. Kanji states that
successful innovation depends on TQM although this premise is not tested [34].
6
Studies by Prajogo et al. have shown positive correlations between TQM and
innovation performance [25, 30]. However, these same researchers have conducted
research showing no significant relationships between quality and innovation
performance when other factors such as technology management and R&D
management were also considered [35].
Even for studies showing a positive correlation between TQM and innovation
performance, it is not yet clear which of the many approaches to implementing TQM
(e.g., selection of, and emphasis on, specific principles and practices) lead to enhanced
innovation performance. To date, research addressing the importance of the
contingency approach to implementing TQM has emphasized relationships to quality
performance rather than innovation performance [19, 20, 36-47]. Sitkin et al. touched
on the topic of innovation performance in discussing a contingency approach to
implementing TQM by proposing two separate approaches: Total Quality Control
(TQC) and Total Quality Learning (TQL) [24]. Choice of approach is dependent on
the level of uncertainty in the firm’s environment. TQC firms emphasize satisfying
existing customers and exploiting existing skills. TQL firms emphasize scanning for
new customers and exploring new skills and resources.
‘Control vs. learning’ is only one of many possible dualities discussed in the
literature related to TQM implementation. As mentioned previously, implementation
of TQM also varies in the nature of the principles and practices used. Lewis et al.
7
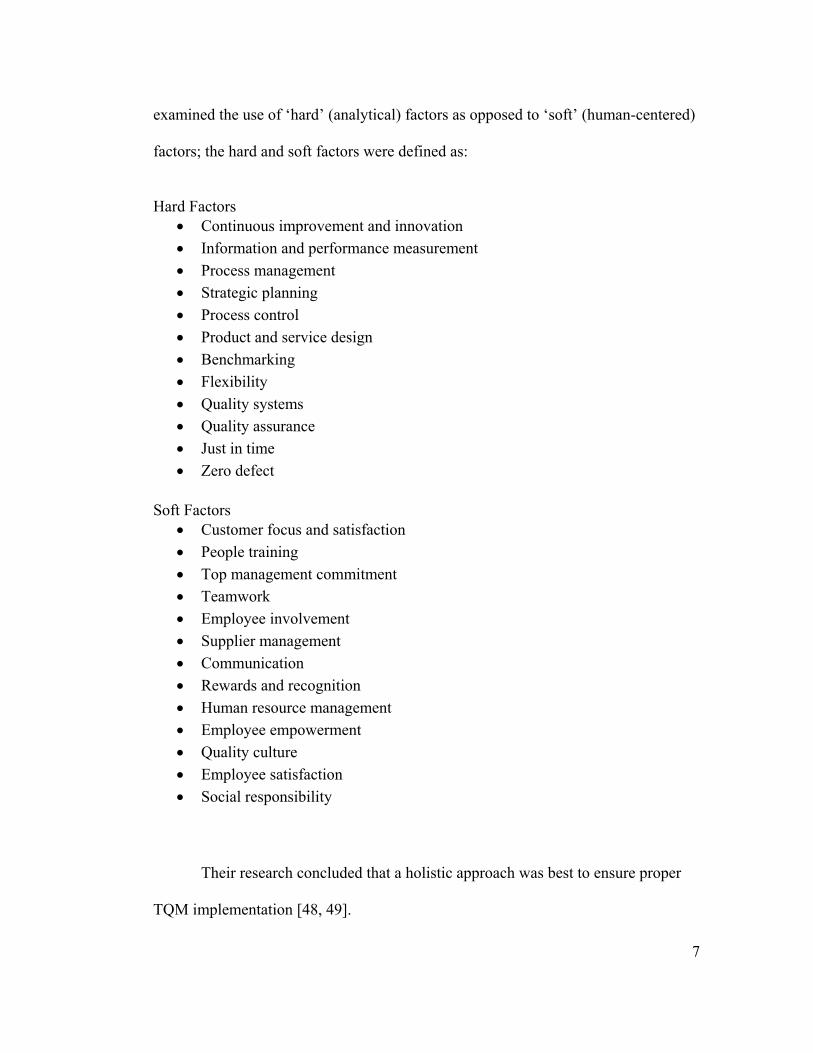
examined the use of ‘hard’ (analytical) factors as opposed to ‘soft’ (human-centered)
factors; the hard and soft factors were defined as:
Hard Factors
• Continuous improvement and innovation • Information and performance measurement • Process management • Strategic planning • Process control • Product and service design • Benchmarking • Flexibility • Quality systems • Quality assurance • Just in time • Zero defect
Soft Factors
• Customer focus and satisfaction • People training • Top management commitment • Teamwork • Employee involvement • Supplier management • Communication • Rewards and recognition • Human resource management • Employee empowerment • Quality culture • Employee satisfaction • Social responsibility
Their research concluded that a holistic approach was best to ensure proper
TQM implementation [48, 49].
8
Other researchers have discussed an internal vs. external focus to TQM
implementation [23, 25, 30]. Internally-focused efforts emphasize improving
operational efficiency whereas externally-focused programs place greater emphasis on
customer relations. This internal/ external focus could also manifest itself as being
reactive rather than proactive with respect to meeting customer needs. Reactive firms,
while they may seek to understand customer needs, focus primarily on meeting current
needs. Proactive firms work to educate customers about, for example, how new
products could address latent needs (i.e., assisting customers to ‘imagine the
possibilities’) [25, 28-30]. Additionally, within the concept of external focus, there
are firms that take what could be considered a ‘closed system’ view of the firm’s
external environment, namely entities within the firm’s supply chain. Firms that take
more of an ‘open system’ view allow for consideration of a much broader picture of
the company context. Such a view might include end consumers (for firms that do not
sell direct to consumers), the communities where their products will be used,
environmental impacts, etc.
Scope of implementation of TQM in a firm also varies; quality tools and
techniques were initially focused primarily on downstream plant-floor operations.
Over time, some firms expanded their quality management programs to include
upstream operations such as design, sales and marketing, and accounts payable.
In summary, in addition to a multitude of principles and practices within the
‘TQM toolbox’, researchers have also identified a myriad of approaches to
9
implementing TQM. The fact that TQM has had mixed results is not surprising; TQM
has often been presented as a ‘turnkey’ philosophy for quality management. Over-
zealous proponents have gone so far as to label as heretics anyone that would suggest
TQM may not be applicable to all situations [24]. It is little wonder that managers see
each new philosophy that comes along as the ‘fad of the month.’ Exhortations on the
importance of innovation (as an ‘add on’ to quality) to firms’ future competitiveness,
if not even survival, likely serve only to exacerbate the confusion and frustration.
Even for firms that see value in continuing to invest in TQM, how can managers
decide which of the many permutations of TQM to implement?
From the standpoint of evaluating the extent of implementation of TQM in
firms, key limitations in the existing research have been the inability to capture the key
contextual differences for firms combined with the difficulty in addressing the
multitude of performance outputs desired from a quality management system. To
address the first issue, there is growing recognition that there is no single approach to
TQM that can accommodate the vast differences in context and strategy that exist
from firm to firm [50, 51]. How companies approach implementing TQM varies,
depending on the industry, the level of maturity of their product, their strategy and
objectives, organizational culture, and a host of other factors. However the
measurement instruments currently used to evaluate the extent of TQM
implementation in a company do not take into account how ‘efficiently’ or how well
the tools are used. For example, a firm may report that they use statistical process
control (SPC) to a limited extent. Regardless, they may make very effective use of

10
SPC by using it only where it gains them the most for their effort. Conversely,
another firm may report they make extensive use of SPC, which may simply be a
symptom of taking a ‘shotgun approach’ to using quality tools. As a result, compared
with the other firm, they may feel that they get very little payoff given their
investment. There has been little if any research examining the relationship between
quality management and performance that adequately addresses this challenge.
Further, as will be discussed below, there are multiple definitions and
perspectives of quality. Early research in the field primarily examined quality from
the perspective of “conformance to specifications.” Researchers and practitioners
increasingly recognized the fallacies of this view in that it fails to address the
multidimensional nature of quality. Conformance to specification is one key
dimension of quality; others include reliability, durability, and customer satisfaction.
Further, for researchers interested in exploring the impact of quality on organizational
performance, there are numerous potential dimensions that could be explored with
respect to organizational performance. In today’s business environment, many have
argued that innovation must be added to the growing list of essential organizational
performance metrics [52].
However, evaluating and comparing performance within and between
organizations can be quite difficult when there are multiple, inter-related dimensions
to performance. Data Envelopment Analysis (DEA) is a non-parametric approach to
productivity and efficiency analysis that allows for simultaneous comparison of
11
multiple inputs and multiple outputs [53]. It is uniquely suited to the situation at-hand
here as it would enable the examination of multiple quality inputs and multiple
performance outputs. In the context of efficiency, its use here would be on the
‘efficiency’ of use of principles and practices of quality management; that is, what
benefit (outputs) are firms getting given their investments? Further, DEA would
enable the analysis to take into account the contextual variation described above for
firms’ quality management systems.
Further, the results of DEA analysis can be combined with the case study
method to provide rich descriptions of the specific practices that benchmark firms use
to achieve superior performance. Specifically, the DEA results will point to firms that
are efficiently converting quality management inputs into quality and innovation
performance outputs, i.e., firms that have focused on specific practices as opposed to
firms taking a ‘shotgun approach’ to quality management. Case studies with both
groups of firms can then be conducted to provide deeper insights into the best
practices.
In summary, by identifying best quality management practices to achieve
improved performance (specifically quality and innovation performance), managers
will be better able to design quality management systems that enable them to
simultaneously address two of the primary competitive factors in business today.
12
A point must be made here regarding the decision to focus principally on
TQM; to this point, only passing mention has been made of other approaches to
quality management. When examining the impact of quality management systems on
performance, shouldn’t other approaches like Business Process Reengineering (BPR),
Six Sigma, and ISO 9000 also be given due consideration? As discussed previously,
there is disagreement in the research community as to whether BPR and Six Sigma are
truly separate and distinct from TQM. Furthermore, also as discussed previously,
there is no universally-accepted definition of TQM. Many authors have made the
point that the label itself is not what is important but the practices and the underlying
principles guiding their use. For example, Prajogo and Brown examined the
performance impacts of formal vs. informal TQM programs and concluded that it is
more important to implement TQM as a set of practices than to be concerned with the
label [20]. What is proposed here is just that – a focus on the adaptation of a set of
principles and practices to quality management. At the same time, the convention of
the literature in quality management systems has been to label all company-wide or
systems-based approaches to quality management as TQM regardless of the vast
differences in implementation.
With respect to the ISO 9000 series of standards, the choice was made not to
explicitly address these standards. The original standards and 1994 revision were
slanted toward documentation and verification of processes rather than emphasizing
performance. The European Union called for de-emphasis of ISO 9000 registration
because it was felt firms were more concerned with “passing a test” than on quality
13
improvement [2]. It may be that there has not been sufficient time such that changes
made to the most recent version of the standards (ISO 9000:2000) to address these
weaknesses have become evident. However, research by Prajogo and Brown revealed
that “…organizations that had focused solely on ISO 9000 did not produce any
noticeable performance benefits”, whereas “broader approaches” to quality such as
TQM did produce better quality outcomes [44].
For these reasons, the term TQM is used here synonymously with broad-based
(company-wide) quality management systems in general. Again however, it is the
specific principles and practices of quality management that will be examined rather
than simply the impact on performance of ‘applying the TQM label.’
14
Chapter 2. Literature Review
For the research conducted here, the relevant literature includes topics related
to definitions of quality, TQM, innovation, and measurement constructs. These topics
are presented followed by an overview of the proposed research methods, Data
Envelopment Analysis (DEA) and the case study method. The section concludes with
a review of the literature exploring the relationships between quality and performance.
Quality
To understand the roles quality plays in an organization, one must first understand
how the term is defined. This is much easier said than done; quality can be defined
from numerous perspectives and in both objective and subjective terms. The
American Society for Quality (ASQ) defines quality as:
“A subjective term for which each person has his or her own definition. In
technical usage, quality can have two meanings: 1. the characteristics of a product or
service that bear on its ability to satisfy stated or implied needs. 2. a product or service
free of deficiencies.” [54]
This definition explicitly recognizes the subjective element as well as at least
two dimensions – customer needs and conformance to specifications (i.e., absence of
defects). Garvin’s five approaches to defining quality reveal some additional
dimensions of quality [55]:
15
1. Transcendent is synonymous with “innate excellence”; quality traits are an absolute and universally recognized. Thus, quality cannot be defined precisely but “you just know it when you see it.” [2] The primary criticism of this view is that it does not provide a means to measure quality and hence for managers to make decisions.
2. Product-based views quality of a product as represented by some measurable
attribute. For example, the quality of a car could be reflected by its horsepower rating and/or mileage. Although this approach to defining quality is quantitative, it suffers from the fact that the value of the specific attributes to individual customers will be highly variable.
3. User-based is in essence the ‘customer is always right’ view of quality. This is
a highly subjective view given that each customer determines how quality is defined. Another way of stating this view is ‘fitness for intended use.’ [2]
4. Manufacturing-based is the analytical, and most objective view of quality in
that it can be summarized as conformance to specifications; hence it is often called ‘conformance quality.’ This view of quality was the predominant definition in industry for the early decades of the quality movement. This definition underlies the approach to quality that emphasizes data-based decision making and management by fact. However, like the product-based view, a weakness to this view of quality lies in the differing value individual customers ascribe to different product attributes. Taken to an extreme, a firm can have near perfect conformance to a specification that makes no difference to their customers.
5. Value-based relates usefulness or satisfaction to price. This view of quality
recognizes the need for balance – excellence at a fair price (customer, i.e., external view) and conformance to specifications at a reasonable cost (firm, i.e., internal view).
Based on these views, Garvin proposed eight dimensions to quality:
conformance to specifications, product reliability, product durability, design quality,
product improvement, brand image, company reputation, and customer service [55].

16
According to Evans and Lindsay, by the end of the 1980s, many companies
began defining quality as “meeting or exceeding customer expectations” [2]. This
definition reveals a shift in philosophy from product-focused to customer-focused.
How firms perceive and define quality naturally impacts their approach to
quality management. In the early years of formal quality management programs,
quality was primarily viewed through the lens of Garvin’s manufacturing-based
definition. That is, quality was equated with conformance to specifications. Thus,
approaches to quality management centered on analytical methods to measure,
monitor, and control specific process variables. Analytical tools like statistical process
control (SPC) developed in the late 1920s in the U.S. telecommunications industry
were the cornerstone of such approaches to quality [56]. The emphasis on statistical
methods to improve quality in manufacturing operations were the primary focus of
quality programs from the 1930s through WWII; emphasis in manufacturing was on
producing consistent and reliable goods for the war effort.
Following the war, quality gurus like W. Edwards Deming and Joseph M.
Juran rose to prominence in Japan as their quality tools and philosophies guided
efforts to rebuild Japan’s post-war economy. During this time, recognition of the need
for a holistic, systems view of quality began to grow. In the 1950s, Armand
Feigenbaum coined the term ‘Total Quality Control’; the Japanese adopted this view
and termed it ‘companywide quality control’ [2]. The roots of TQM were thus
established; however the quality movement had yet to take hold in the U.S.
17
The rapid development of quality methods in Japan following the war had a
dramatic and positive impact on the quality of Japanese goods. As export of these
goods increased, quality rose in importance as a source of competitive advantage. In
1983, Garvin conducted a groundbreaking study comparing U.S. and Japanese
manufacturers of room air conditioners [57]. He reported that “…the poorest Japanese
company (with respect to quality) typically had a failure rate less than half that of the
best U.S. manufacturer.” By the 1980s, U.S. industry, automakers and electronics
firms in particular, were feeling significant pressure to improve quality [58]. TQM as
a management philosophy spread rapidly around the globe in the 1980s [59].
In summary, quality can be defined via both subjective as well as objective
measures. In the early years of the quality profession, the predominant measures were
objective, specifically conformance to specifications. As the profession has changed
through time, however, practitioners and researchers alike have increasingly
recognized the inherent multidimensionality of quality and hence the need to
accommodate subjective measures as well. Further, the focus has shifted from an
internal and product-focused view of quality (e.g., defects) to an external focus and
customer-focused view. This is evident by the common definition of quality,
“meeting or exceeding customer expectations.”
With the preceding as background on quality in general, the focus is now
shifted to more precisely defining TQM, the fundamental principles, key criteria, as
18
background for discussing key constructs and tools to measure extent of
implementation of TQM in a firm.
TQM
As difficult as it is to define quality, it is equally if not more difficult to define
TQM. Numerous authors have attempted to provide a simple definition. Forker et al.
define TQM as “…an integrated system of principles and procedures whose goal is to
improve the quality of an organization’s goods and services” [38]. Flynn et al. define
TQM as, “an integrated approach to achieving and sustaining high quality output,
focusing on the maintenance and continuous improvement of processes and defect
prevention at all levels and in all functions of the organization, in order to meet or
exceed customer expectations” [60]. These definitions include key principles of
continuous improvement, the inclusion of all functions/ integration, and focus on the
customer. In this vein, Evans and Lindsay state that Total Quality is based on three
fundamental principles:
1. A focus on customers and stakeholders; 2. Participation and teamwork by everyone in the organization; and 3. A process focus supported by continuous improvement and learning [2].
By today’s standards, these principles may seem quite commonplace.
However, when the philosophy of TQM was in the developmental stages, quality was
the job of the quality department and consisted of ensuring products met specifications
[2]. Teamwork was by and large unheard of as was the focus on understanding
customer needs and requesting customer feedback. Thus, TQM was a radical
19
departure from contemporary management philosophies and practices. One apparent
success of TQM has been to make these fundamental principles the current modus
operandi for many businesses around the globe. Even so, the point has been argued
that many failures of TQM to positively impact quality performance have been traced
to failures in execution, i.e., inadequate attention given to one or more of these
fundamental principles and to adapt the principles to company strategy, culture and
context [22, 46].
Sitkin et al. discuss a slightly different set of three fundamental principles
underlying TQM [24]. While they also mention a focus on customer satisfaction and
continuous improvement, they essentially blend the principles of process focus and
teamwork into a third principle defined as “treating the organization as a total system.”
This systems view of quality management is important to state explicitly in that one of
the evolutionary improvements to TQM has been to expand the view of the system
from encompassing ‘sales to shipping’ (i.e., the internal view) to include the company,
its suppliers, and its customers (the external view) and even beyond to communities
and the environment [61].
While the three principles described above serve as a simple means to define
the guiding principles of TQM, they lack sufficient detail to define key principles and
practices used in firms to implement TQM. The U.S. Malcolm Baldrige National
Quality Award (MBNQA) is often used as the conceptual framework for defining the
key principles and practices [62, 63].
20
The MBNQA was developed following a national study on productivity
initiated by President Reagan in 1982. The Malcolm Baldrige National Quality
Improvement Act was signed into law in 1987. The program focused on stimulating
quality and productivity in American companies; recognizing achievements of
exemplary companies; establishing guidelines for firms to evaluate their quality
improvement efforts; and providing guidance to other companies via publishing
information on the practices of award-winning firms. The award is named in honor of
the U.S. Secretary of Commerce who was killed in an accident prior to the act being
signed into law. The National Institute of Standards and Technology administers the
MBNQA [2].
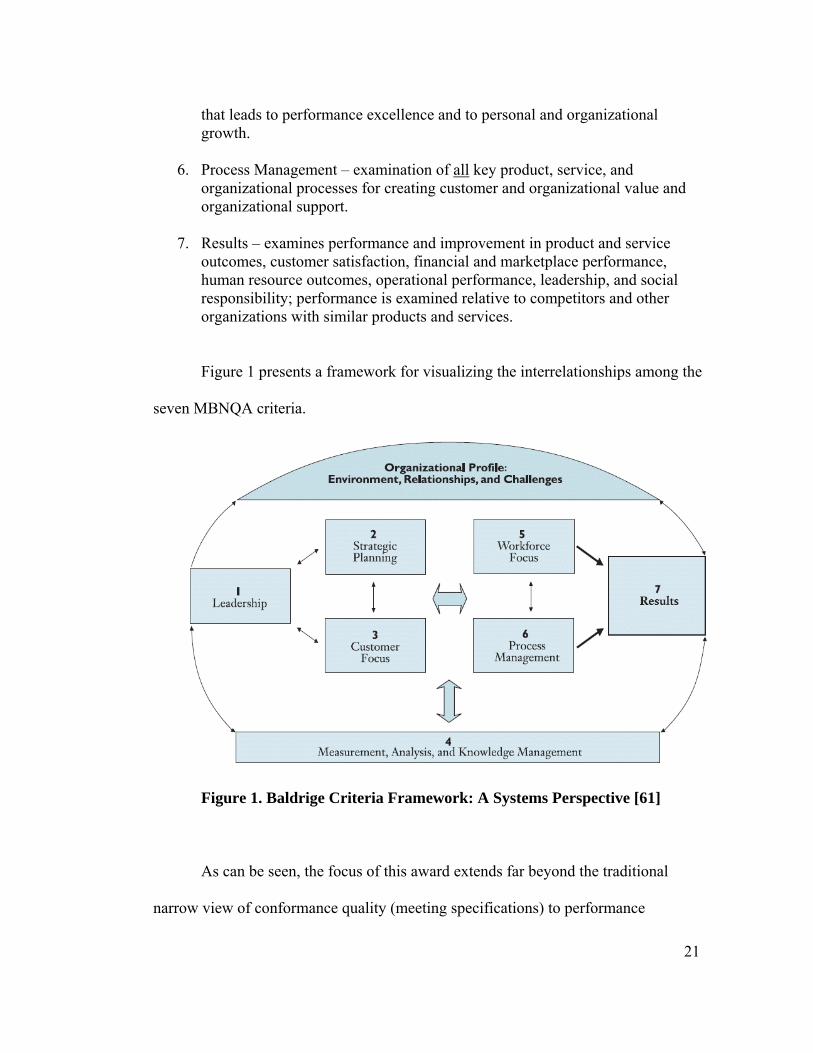
The seven criteria that comprise the MBNQA include [61]:
1. Leadership – how senior leaders guide and sustain an organization as well as governance of the firm and how ethical, legal, and community responsibilities are addressed.
2. Strategic planning – how strategic objectives and action plans are developed as
well as how they are deployed and changed; how progress is measured.
3. Customer and Market Focus – how the requirements, needs, expectations, and preferences of customers and markets are determined; how relationships with customers are built and the key factors leading to customer acquisition, satisfaction, loyalty, retention and sustainability.
4. Measurement, Analysis, and Knowledge Management – how information and
knowledge assets are selected, gathered, analyzed, managed, and improved as well as how performance is reviewed.
5. Workforce Focus – how work systems, employee learning, and motivation
enable the development and utilization of employees’ full potential in alignment with strategic objectives and action plans; how the organization builds and maintains a work environment and climate for employee support
21
that leads to performance excellence and to personal and organizational growth.
6. Process Management – examination of all key product, service, and
organizational processes for creating customer and organizational value and organizational support.
7. Results – examines performance and improvement in product and service
outcomes, customer satisfaction, financial and marketplace performance, human resource outcomes, operational performance, leadership, and social responsibility; performance is examined relative to competitors and other organizations with similar products and services.
Figure 1 presents a framework for visualizing the interrelationships among the
seven MBNQA criteria.
Figure 1. Baldrige Criteria Framework: A Systems Perspective [61]
As can be seen, the focus of this award extends far beyond the traditional
narrow view of conformance quality (meeting specifications) to performance
22
excellence and takes a systems view of the firm. As discussed previously, BPR
developed in part due to a criticism of TQM to focus too heavily on incremental
improvement. One of the changes to the MBNQA criteria was to expand the
definition of improvement to include breakthrough improvement [31]. For example,
the MBNQA section on Measurement, Analysis, and Knowledge Management poses
the question to award applicants – “How do you translate organizational performance
review findings into priorities for continuous and breakthrough improvement and into
opportunities for innovation?”
In summary, like quality, TQM is difficult to define. However, the three
fundamental principles of process focus/ continuous improvement, customer focus,
and participation and teamwork capture the essence. Further, the seven criteria of the
MBNQA are widely recognized as providing a framework for assessing the use of
TQM in a firm and its impact on organizational performance. To understand how
TQM has changed since its inception, it is important to understand some of the key
dualities within TQM and how these affect implementation.
Dualities within TQM
Several TQM researchers have addressed the concept of dualities or
dichotomies within TQM. The concepts may also be viewed as continuums, but for
purposes of discussion here, the term duality, as originally used by Sitkin with respect
to the ‘control vs. learning duality’ within TQM [24] will be used.
23
Perhaps the most widely studied duality is ‘hard vs. soft’ factors1. Wilkinson
was among the earliest authors to note that insufficient attention was being given to
the ‘soft’, or human resource-related issues within TQM [64]. Lewis et al. explored
the soft vs. hard factors. Soft factors were defined as including customer focus and
satisfaction, people training, top management commitment, teamwork, employee
involvement, and supplier management. Hard factors include continuous
improvement and innovation, information and performance measurement, process
management, strategic planning, process control, and product and service design [48].
These authors also advocate for a holistic approach to implementing TQM; firms
using the ISO 9001 quality system standard as a means to implementing TQM were
giving insufficient attention to the soft factors. Dow et al. explored the impact of
specific TQM practices on quality performance and concluded that hard factors
(defined as benchmarking, cellular work teams, advanced manufacturing technologies,
and close supplier relations) did not contribute to superior quality performance
whereas the soft factors did [65]. Citing Kekale and Kekale [22], Prajogo et al.
captured this issue well in stating that “…perceiving TQM narrowly as a set of tools
and techniques (i.e., hard aspects) has proven to be one of the primary failures of
TQM implementation” [30].
A second type of duality within TQM is the scope of implementation of TQM
in a firm. From the start, the ‘Total’ in Total Quality Management indicated the goal
1 Note: The terms hard vs. soft, while imprecise, are the convention in the literature for distinguishing between the analytical/ technical/ quantitative tools and techniques and the more human-focused/ qualitative tools and techniques, respectively.
24
of focusing quality improvement efforts company-wide [2]. Regardless, years of
quality efforts being focused solely on the plant floor, combined with challenges in
adapting quality methods to non-manufacturing applications, led to slow spread of
TQM throughout organizations. As such, TQM programs that were narrower in scope
were such that quality continued to be the responsibility of the quality department;
involvement of other business functions and personnel was minimal. Firms with
strong senior management leadership and commitment to TQM focus truly company-
wide and include upstream operations such as product design, sales and marketing,
maintenance, shipping, and accounts payable in addition to downstream
manufacturing operations [2]. Along these same lines, McAdam et al. state that the
literature on TQM divides TQM into two categories – holistic TQM and continuous
improvement TQM [23].
The third duality within TQM involves issues related to internal vs. external
focus. Internally-focused efforts emphasize continuous process improvement whereas
externally-focused programs place greater emphasis on customer relations. These are
of course, two of the three fundamental principles of TQM presented above. Thus, a
balanced approach to implementing TQM would give equal attention to both
principles.
Internal/ external focus can also manifest itself as being reactive rather than
proactive with respect to meeting customer needs. Reactive firms include not only
firms that react in the sense of waiting for customers to complain before they take
25
action, but also firms that seek to understand customer needs. The primary issue is
that the firms focus primarily on meeting current needs. Proactive firms work to
educate customers about, for example, how new products could address latent needs
(i.e., assisting customers to ‘imagine the possibilities’) [24]. Additionally, within the
concept of external focus, there are firms that take what could be considered a ‘closed
system’ view of the firm’s external environment, namely customers and suppliers with
whom they have direct business relationships. Firms that take more of an ‘open
system’ view allow for consideration of a much broader picture of the company
context. Such a view might include end consumers (for firms that do not sell direct to
consumers), the communities where their products will be used, and environmental
impacts [24].
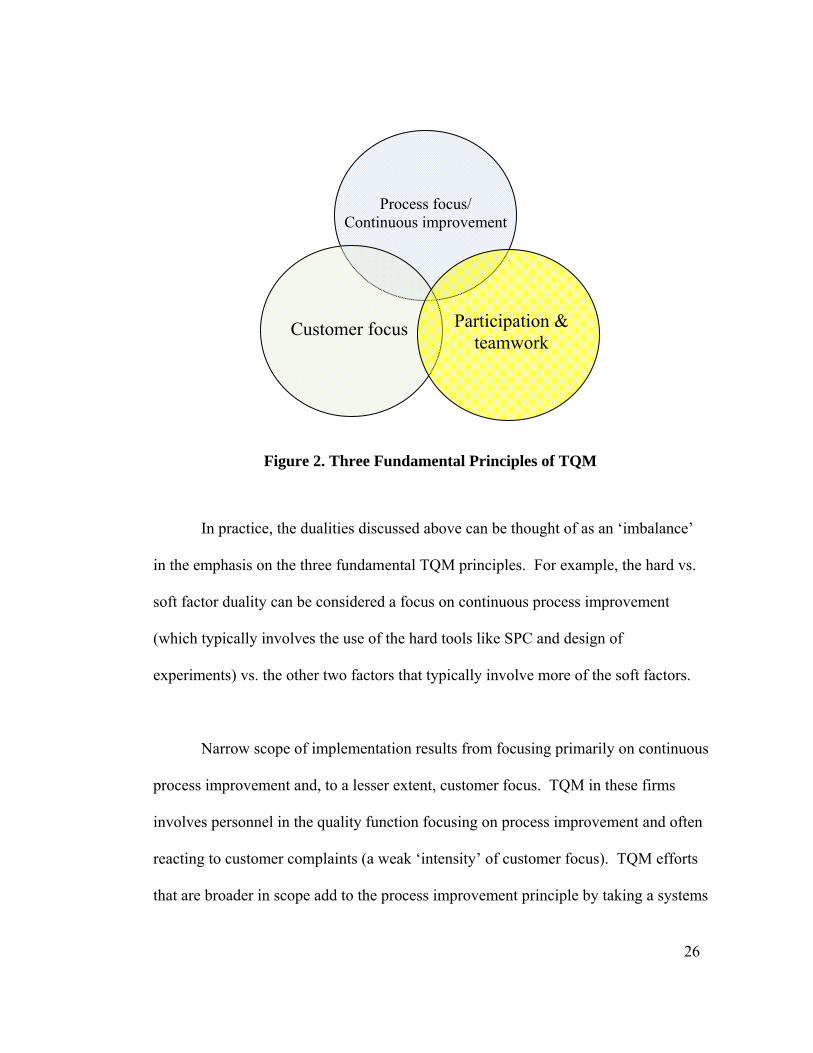
Figure 2 presents a graphical model of the three fundamental TQM principles
discussed previously. As these principles are fundamental, successful implementation
requires giving adequate attention to all three principles.
26
In practice, the dualities discussed above can be thought of as an ‘imbalance’
in the emphasis on the three fundamental TQM principles. For example, the hard vs.
soft factor duality can be considered a focus on continuous process improvement
(which typically involves the use of the hard tools like SPC and design of
experiments) vs. the other two factors that typically involve more of the soft factors.
Narrow scope of implementation results from focusing primarily on continuous
process improvement and, to a lesser extent, customer focus. TQM in these firms
involves personnel in the quality function focusing on process improvement and often
reacting to customer complaints (a weak ‘intensity’ of customer focus). TQM efforts
that are broader in scope add to the process improvement principle by taking a systems
Process focus/ Continuous improvement
Customer focus Participation & teamwork
Figure 2. Three Fundamental Principles of TQM
27
view of the firm’s processes and hence include upstream as well as downstream
operations. Broader scope can also lead to an expanded view of customer focus. As a
result, broadening the scope requires company-wide participation and teamwork.
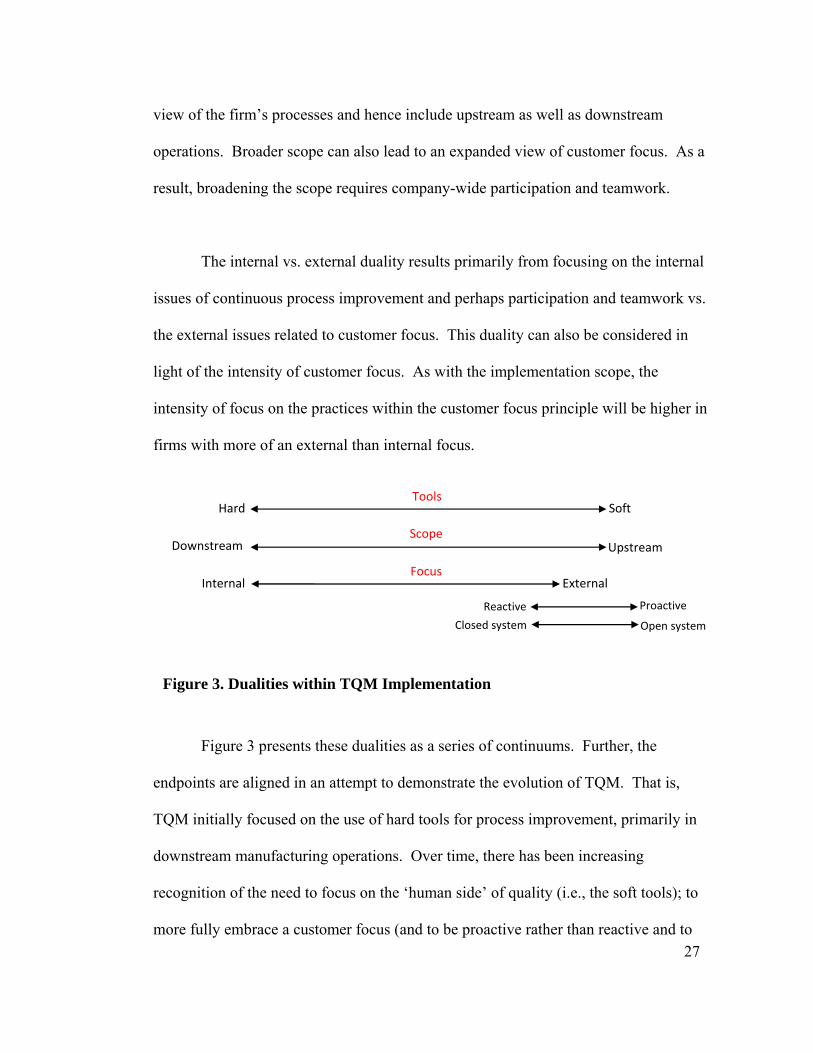
The internal vs. external duality results primarily from focusing on the internal
issues of continuous process improvement and perhaps participation and teamwork vs.
the external issues related to customer focus. This duality can also be considered in
light of the intensity of customer focus. As with the implementation scope, the
intensity of focus on the practices within the customer focus principle will be higher in
firms with more of an external than internal focus.
Figure 3 presents these dualities as a series of continuums. Further, the
endpoints are aligned in an attempt to demonstrate the evolution of TQM. That is,
TQM initially focused on the use of hard tools for process improvement, primarily in
downstream manufacturing operations. Over time, there has been increasing
recognition of the need to focus on the ‘human side’ of quality (i.e., the soft tools); to
more fully embrace a customer focus (and to be proactive rather than reactive and to
Figure 3. Dualities within TQM Implementation
ToolsHard Soft
ScopeDownstream Upstream
FocusInternal External
Reactive Proactive
Closed system Open system
28
take a more open view of the system to including needs of potential new customers);
and to expand the scope of TQM to be truly ‘Total’ Quality Management - i.e., to use
the principles and practices in upstream as well as downstream operations.
In summary, there are several well-established dualities within TQM including
use of hard vs. soft tools and techniques, internal vs. external focus, and scope of
implementation. The dualities may be conceived of as varying levels of emphasis on
the three fundamental principles of TQM of process focus/ continuous improvement,
customer focus, and participation and teamwork. Failures of TQM to positively
impact performance have been traced to failures of execution; such failures can often
be traced to inadequate attention being given to one of the three fundamental
principles. Further, and a key point underlying these dualities, is that there is no single
approach to implementing TQM; approaches can be expected to vary from firm to
firm. Where a firm producing commodity products might place a great deal of
emphasis on practices that lead to conformance quality (i.e., ensuring products meet
specifications) another firm focused on growing market share by introducing new
products might place more emphasis on customer focus. Ideally, decision makers
would have the information available to them to know where and how to focus quality
management efforts to achieve the objectives suited to their particular context.
Additionally, decision makers need to know how to adapt quality management efforts
to achieve new areas of emphasis such as innovation performance. However, prior to
determining what to change, organizations must have some means of evaluating
29
current extent of implementation of the various principles and practices of TQM, i.e., a
quality management measurement instrument.
Quality Management Constructs and Measurement Instruments
Within a decade of the ‘explosion’ of TQM in the 1980s came an implosion of
sorts. Reports of failures of TQM to produce results began to hit the popular press in
the 1990s [3]. In his address to the 1993 annual conference of the American Society
for Quality, Senge reported that less than a third of the 500 TQM firms surveyed were
accomplishing anything; and two-thirds of the TQM programs had ceased to function
[8]. In the 90s, researchers began in earnest to explore the relationships between TQM
and organizational performance. However, it quickly became apparent that a
measurement instrument was needed that would enable researchers to distinguish
TQM from non-TQM firms as well as to quantify the level or intensity of
implementation of the various principles and practices within TQM.
As discussed above, the MBNQA criteria are often used as the conceptual
framework for quality management. Flynn et al. state, “Use of the Baldrige criteria is
a way of judging the face validity of any framework which might be proposed for
quality management” [60]. In this regard, it might seem that researchers and
practitioners could simply use the award criteria as a measurement instrument to
assess the extent of TQM implementation in a firm rather than ‘recreating the wheel.’
However, the award criteria are not intended to serve as a measurement instrument per
se. Rather, they are intended to elicit narrative responses regarding how applicant
30
firms address each of the seven primary MBNQA criteria described above and shown
in Figure 1. For example, for the Customer and Market Focus criterion, applicants are
asked, “How do you identify customers, customer groups, and market segments? How
do you predetermine which customers, customer groups, and market segments to
pursue for current and future products and services? How do you include customers
of competitors and other potential customers and markets in this determination?” [66]
Thus, while the MBNQA may not serve as an instrument to provide a score for extent
of implementation of various quality management principles and practices, many
researchers have used the criteria to guide the development of such measurement
instruments.
Saraph et al. were among the first to develop a quality management
measurement instrument [67]. These authors recognized that quality data such as
defect rates, error rates, rework cost, etc. are not measures of organization-wide
quality management. The authors reviewed a large body of quality literature including
the philosophies of well-known quality experts such as Crosby, Deming, Garvin,
Ishikawa, and Juran. The principles proposed by these experts were synthesized to
formulate critical quality factors. Data were collected from industry professionals to
develop operational measures for each critical factor; measures were tested for
reliability and validity. For reliability, Cronbach’s alpha was used as a measure of
internal consistency [68]. Following deletion of one to three items from each factor,
the factors were deemed reliable (i.e., all scores were greater than the 0.70 threshold
31
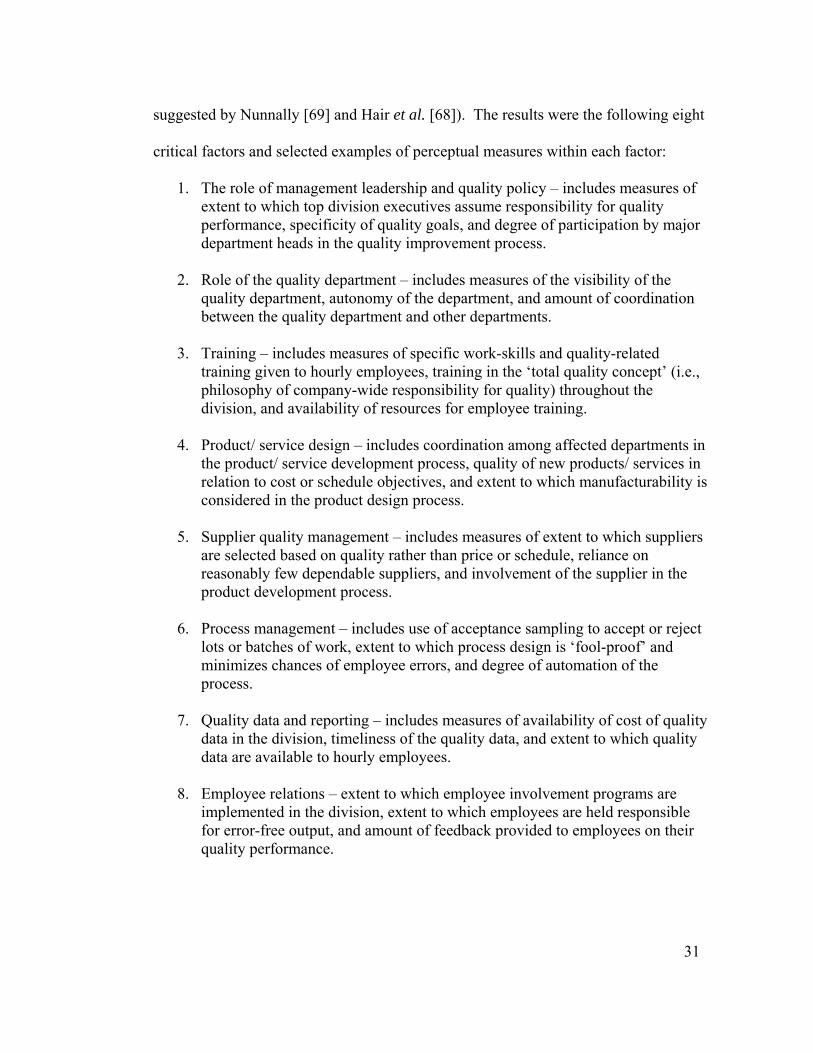
suggested by Nunnally [69] and Hair et al. [68]). The results were the following eight
critical factors and selected examples of perceptual measures within each factor:
1. The role of management leadership and quality policy – includes measures of extent to which top division executives assume responsibility for quality performance, specificity of quality goals, and degree of participation by major department heads in the quality improvement process.
2. Role of the quality department – includes measures of the visibility of the
quality department, autonomy of the department, and amount of coordination between the quality department and other departments.
3. Training – includes measures of specific work-skills and quality-related
training given to hourly employees, training in the ‘total quality concept’ (i.e., philosophy of company-wide responsibility for quality) throughout the division, and availability of resources for employee training.
4. Product/ service design – includes coordination among affected departments in
the product/ service development process, quality of new products/ services in relation to cost or schedule objectives, and extent to which manufacturability is considered in the product design process.
5. Supplier quality management – includes measures of extent to which suppliers
are selected based on quality rather than price or schedule, reliance on reasonably few dependable suppliers, and involvement of the supplier in the product development process.
6. Process management – includes use of acceptance sampling to accept or reject
lots or batches of work, extent to which process design is ‘fool-proof’ and minimizes chances of employee errors, and degree of automation of the process.
7. Quality data and reporting – includes measures of availability of cost of quality
data in the division, timeliness of the quality data, and extent to which quality data are available to hourly employees.
8. Employee relations – extent to which employee involvement programs are
implemented in the division, extent to which employees are held responsible for error-free output, and amount of feedback provided to employees on their quality performance.
32
The full measurement instrument is shown in Appendix A1 (Note: items
deleted to improve reliability are not shown in the instrument).
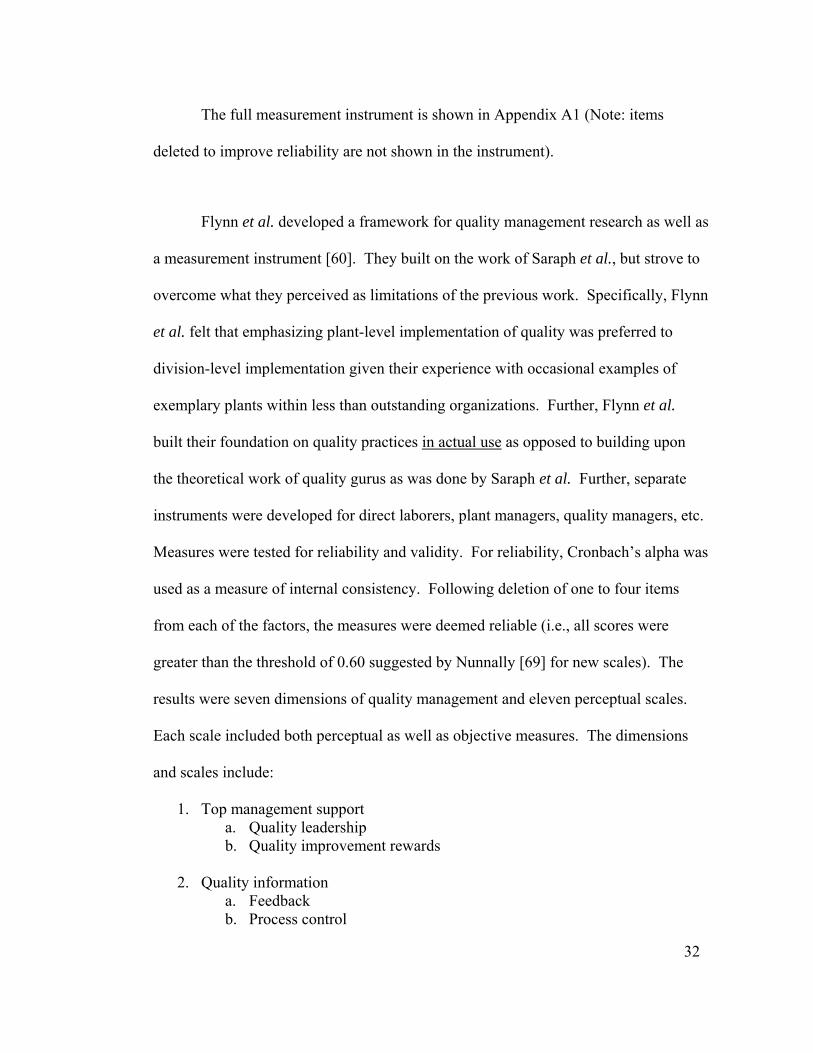
Flynn et al. developed a framework for quality management research as well as
a measurement instrument [60]. They built on the work of Saraph et al., but strove to
overcome what they perceived as limitations of the previous work. Specifically, Flynn
et al. felt that emphasizing plant-level implementation of quality was preferred to
division-level implementation given their experience with occasional examples of
exemplary plants within less than outstanding organizations. Further, Flynn et al.
built their foundation on quality practices in actual use as opposed to building upon
the theoretical work of quality gurus as was done by Saraph et al. Further, separate
instruments were developed for direct laborers, plant managers, quality managers, etc.
Measures were tested for reliability and validity. For reliability, Cronbach’s alpha was
used as a measure of internal consistency. Following deletion of one to four items
from each of the factors, the measures were deemed reliable (i.e., all scores were
greater than the threshold of 0.60 suggested by Nunnally [69] for new scales). The
results were seven dimensions of quality management and eleven perceptual scales.
Each scale included both perceptual as well as objective measures. The dimensions
and scales include:
1. Top management support a. Quality leadership b. Quality improvement rewards
2. Quality information
a. Feedback b. Process control
33
3. Process management a. Cleanliness and organization
4. Product design
a. New product quality b. Interfunctional design process
5. Workforce management
a. Selection for teamwork potential b. Teamwork
6. Supplier involvement
a. Supplier relationship
7. Customer involvement a. Customer interaction
The complete measurement instrument is shown in Appendix A2.
Ahire et al. conducted a number of studies to compare quality management in
TQM versus non-TQM firms and to develop implementation constructs [17, 50, 63].
Their research built on that by Saraph et al. and Flynn et al. and worked to overcome
perceived limitations of the previous work. Specifically, the authors felt that Saraph et
al. excluded two important constructs: customer focus and SPC. Interestingly, Saraph
et al. initially included a variable on the use of SPC, however the item was dropped to
improve instrument reliability [67]. This is a curious result given that SPC played
such a critical role in the founding of the quality sciences and was synonymous with
quality for many years. Further, Ahire et al. felt there were several tautologies in the
Saraph et al. instrument. For example, including “commitment of the divisional top
management to employee training” in the Training construct likely resulted in
34
artificially high correlations among constructs due to overlap with the Role of
Divisional Top Management and Quality Policy construct.
With respect to the Flynn et al. measurement instrument, Ahire et al. stated the
two instruments were quite complementary. The principal differences are that Ahire
et al. include constructs for Employee Empowerment and Benchmarking and omit the
team-oriented scales and cleanliness and organization scale found in Flynn et al.’s
instrument. Also, Ahire et al. opted for a construct on Customer Focus as opposed to
customer interaction stating that higher customer interaction may in fact reflect poor
quality management. This distinction could be drawn based on the impetus for the
interaction, i.e., whether it was reactive (responding to complaints) or proactive
(requesting feedback). Measures were tested for reliability and validity. For
reliability, Cronbach’s alpha was used in conjunction with the Werts-Linn-Jorsekog
coefficient (ρc). Following deletion of five (of eight) items from the Employee
Involvement construct, the factors were deemed reliable, i.e., all alpha scores were
greater than the minimum value of 0.70 suggested by Nunnally [69] and greater than
0.50 for ρc. The authors acknowledge that deletion of this many items from a single
construct may have resulted in problems with content validity.
The 10 constructs to measure integrated quality management presented, as well
as two dimensions to measure performance (product quality and supplier performance)
by Ahire et al. include:
35
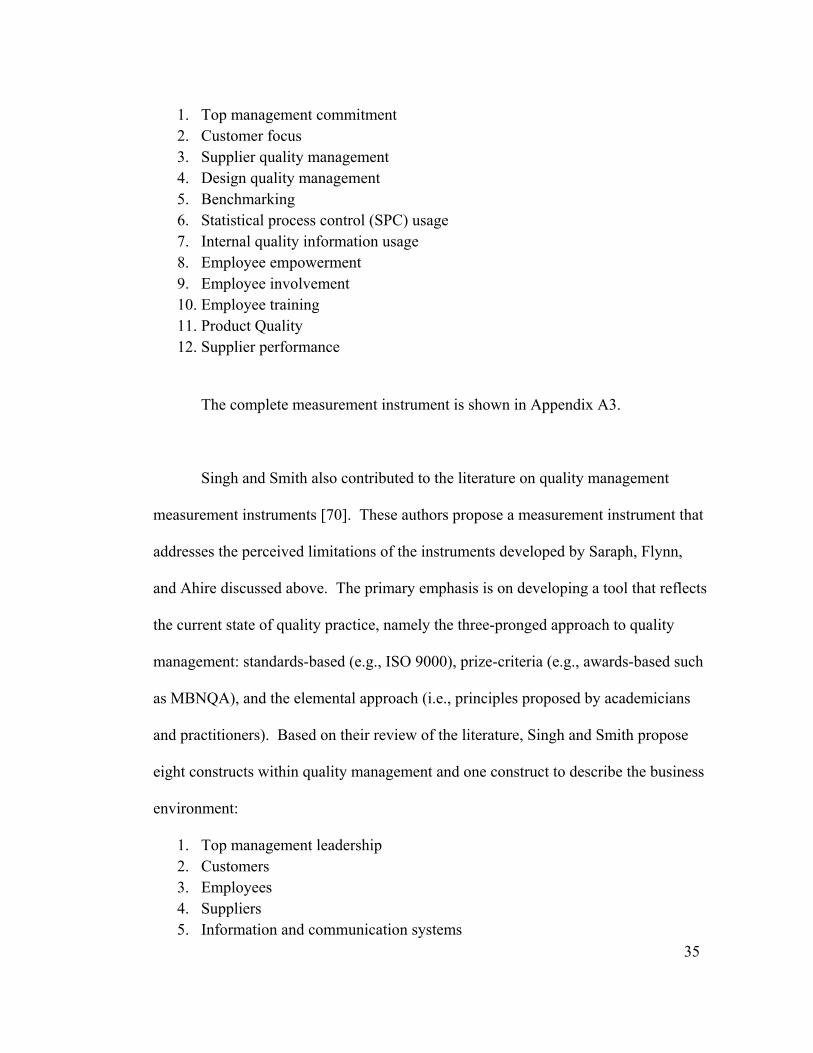
1. Top management commitment 2. Customer focus 3. Supplier quality management 4. Design quality management 5. Benchmarking 6. Statistical process control (SPC) usage 7. Internal quality information usage 8. Employee empowerment 9. Employee involvement 10. Employee training 11. Product Quality 12. Supplier performance
The complete measurement instrument is shown in Appendix A3.
Singh and Smith also contributed to the literature on quality management
measurement instruments [70]. These authors propose a measurement instrument that
addresses the perceived limitations of the instruments developed by Saraph, Flynn,
and Ahire discussed above. The primary emphasis is on developing a tool that reflects
the current state of quality practice, namely the three-pronged approach to quality
management: standards-based (e.g., ISO 9000), prize-criteria (e.g., awards-based such
as MBNQA), and the elemental approach (i.e., principles proposed by academicians
and practitioners). Based on their review of the literature, Singh and Smith propose
eight constructs within quality management and one construct to describe the business
environment:
1. Top management leadership 2. Customers 3. Employees 4. Suppliers 5. Information and communication systems

36
6. Processes 7. Wider community 8. Competitors 9. Business conditions
Reliability was assessed using maximal composite reliability coefficients.
Coefficients exceeded the 0.60 threshold for all but two constructs – customers and
suppliers – and these were only marginally outside the limit and were hence retained.
Therefore, the authors deemed the measures to be generally reliable. The complete
measurement instrument is shown in Appendix A4.
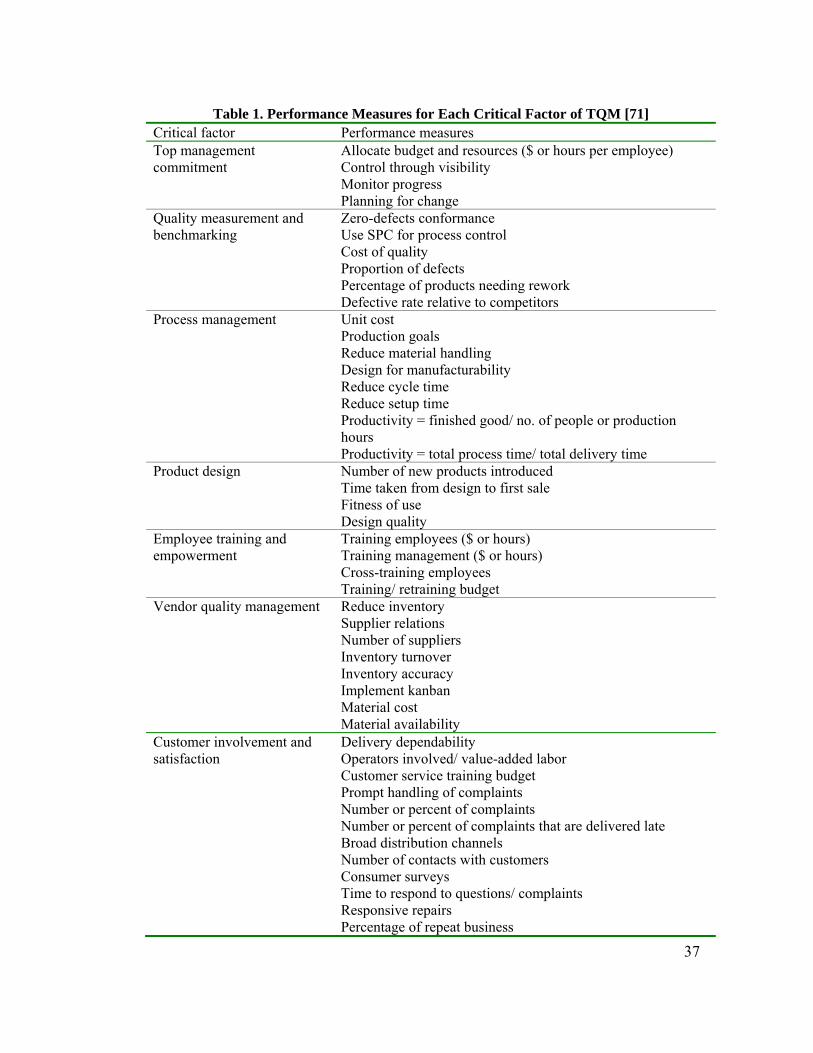
Motwani identified the critical factors and performance measures of TQM
[71]. Critical factors were identified via blending the approaches used by Saraph,
Flynn, and Ahire along with three other studies directed to develop TQM critical
factors. Motwani’s unique contribution to the research in TQM constructs is the
development of quantitative, in addition to qualitative performance measures for each
of the constructs as shown in Table 1.
While there is certainly value in having quantitative, objective measures for the
critical factors in TQM in order to develop a score for “extent of implementation”,
many of the measures listed by Motwani are not readily obtainable from objective
data. Further, these measures are merely proposed in the research and not validated or
tested in empirical research.
37
Table 1. Performance Measures for Each Critical Factor of TQM [71] Critical factor Performance measures Top management commitment
Allocate budget and resources ($ or hours per employee) Control through visibility Monitor progress Planning for change
Quality measurement and benchmarking
Zero-defects conformance Use SPC for process control Cost of quality Proportion of defects Percentage of products needing rework Defective rate relative to competitors
Process management Unit cost Production goals Reduce material handling Design for manufacturability Reduce cycle time Reduce setup time Productivity = finished good/ no. of people or production hours Productivity = total process time/ total delivery time
Product design Number of new products introduced Time taken from design to first sale Fitness of use Design quality
Employee training and empowerment
Training employees ($ or hours) Training management ($ or hours) Cross-training employees Training/ retraining budget
Vendor quality management Reduce inventory Supplier relations Number of suppliers Inventory turnover Inventory accuracy Implement kanban Material cost Material availability
Customer involvement and satisfaction
Delivery dependability Operators involved/ value-added labor Customer service training budget Prompt handling of complaints Number or percent of complaints Number or percent of complaints that are delivered late Broad distribution channels Number of contacts with customers Consumer surveys Time to respond to questions/ complaints Responsive repairs Percentage of repeat business
38
Samson and Terziovski also developed a TQM implementation measurement
instrument [46]. These authors used the MBNQA criteria to develop TQM
implementation constructs and used the measurement instrument developed to explore
the relationships between TQM practices and operational performance. Reliability
was assessed using Cronbach’s alpha and, following deletion of a total of eight
variables, five of the seven constructs exceeded the 0.70 threshold. Two constructs,
Process Management and Organizational Performance, fell slightly short of the 0.70
threshold (0.697 and 0.674, respectively) and were retained rather than reduce the
number of indicators. Given that the authors also used the instrument to explore
relationships between TQM and organizational performance, a more detailed summary
of the paper will be presented below.
In summary, the measurement instruments to assess extent of implementation
of various quality management principles and practices have evolved to address
limitations of prior generations of instruments and to stay current with quality
management practices. The instruments available to-date are not without limitations.
For example, certain principles such as measurement of customer satisfaction and a
proactive approach to customer focus are addressed to a limited extent, if at all. Key
tools (e.g., SPC) are omitted from a few of the instruments or have been deleted to
improve instrument reliability. Again, this is curious given that tools like SPC played
a prominent role in the early stages of TQM. These limitations aside, the fact that the
instruments have, with the exception of Motwani’s [71], all been tested and found to

39
be reliable and valid provides assurance that they are adequate for purposes of
measuring extent of implementation of quality management in an organization.
Having discussed the varying definitions of quality and TQM, underlying
principles of TQM and measurement instruments for assessing extent of
implementation of TQM, the discussion is now shifted to a similar analysis of
innovation – how it is defined and measured, as well as key areas of commonality with
quality management.
Innovation
In common usage, the term innovation often connotes a new high-tech device
or ‘gadget’; the terms technology, invention, and innovation are often used
synonymously [72]. In this regard, innovation in a firm would be primarily the
purview of the R&D department. However, the literature on innovation reveals that
the research community conceives of innovation much more broadly.
Betz contrasts innovation with invention by defining invention as “…the
creation of a functional way to do something, an idea for a new technology” [73]. By
contrast, innovation is “…introducing a new or improved product, process, or service
into the marketplace.” In short, the output of invention is knowledge and the output of
innovation is the economic benefit derived from the commercialization of the
invention [73]. In Betz’s view, both terms center on the idea of creation of something
new.

40
Damanpour defines innovation as “the adoption of an idea or behavior new to
the adopting organization” [74]. Similarly, in the book Diffusion of Innovations,
Rogers defines innovation as, “…an idea, practice, or object that is perceived as new
by an individual or other unit of adoption” [75]. Thus, these authors focus on adoption
rather than creation of innovation.
The key similarities in these definitions are the emphasis on ‘newness’ or
novelty. In fact, in addressing the question, “What is innovation and how should it be
operationalized?”, Johannessen et al. proposed that ‘newness’ was the common
denominator for the various definitions of innovation [76].
While newness is a common denominator for innovation, one must ask
specifically what is new? As stated previously, innovation is commonly thought of as
new products, however numerous authors agree that innovation is not limited to
products. For example, Betz’s definition of innovation includes process and service
dimensions of innovation in addition to product. And taking the typology a step
further, Utterback adds administrative and technological innovations [77].
Administrative innovations are changes that affect policies, allocation of resources and
other factors associated with social structures; they are indirectly related to the basic
work activity of an organization and directly related to its management.
Technological innovations pertain to products, services, and the technology used to
produce products or render services and are directly related to the basic work activity
of an organization. From this latter definition, there seems to be significant overlap
41
between technological innovations and process innovations; specifically, technological
innovations facilitate process innovations (regardless of whether it is an administrative
process or a manufacturing process). Such overlap would likely lead to challenges in
measuring process innovations as distinct from technological innovations.
Hovgaard and Hansen define three basic types of innovations – product,
process, and business systems [52]. In their view, business systems innovations
include any innovation that does not fall under product or process innovation.
Examples include innovative management and marketing techniques. This definition
appears to combine the administrative and the service-focused aspects of the
technological innovations in Utterback’s definition. The Hovgaard and Hansen
typology has the advantage in allowing for measurement of process innovation
without being confounded with the technology that facilitates the process innovation.
An additional dimension of innovation has to do with the impact of the
innovation on the industry. As described by Betz, discontinuous innovations result in
creating or altering industrial structures; continuous innovations reinforce the existing
structure [73]. The essence is the degree of ‘radicalness’ of the innovation. Thus,
discontinuous innovations are also referred to as radical, next-generation,
revolutionary, breakthrough, or disruptive. Continuous innovations are also referred
to as sustaining, evolutionary, or incremental. Johannessen et al. viewed this
dimension of innovation from the viewpoint of newness but specifically ‘new to
42
whom?’; in their view, incremental innovations are new to the adopting firm whereas
radical innovations are new to the industry [76].
Cooper (citing Utterback [77]) defines a multidimensional model of innovation
that presents a graphical depiction of the preceding discussion on innovation typology.
The model is shown in Figure 4.
Figure 4. A Multidimensional Model of Innovation [72]
In this ‘3-D’ view of innovation, any individual innovation can involve varying
degrees of each of the three dimensions. Hence, overlap of different forms of
innovation, specifically process and technological innovation as discussed previously,
is readily acknowledged in this model. The author cites the use of the Internet to
advertise and distribute products/ services as a type of administrative-product
innovation because it involves altering the product/ service offered as well as
organizational procedures and structures. However, for future research, the author
poses questions regarding the relative importance of each type of innovation and
Administrative Technological
Product
Process
Incremental
Radical
43
implications for organizational structure and strategy. For example, if the degree of
radicalness of an innovation overshadows the other dimensions and centralization is
shown to foster adoption of radical innovations, does that outweigh the importance of
decentralization to foster adoption of process innovations? Although this question is
merely posed as a suggestion for future research, there are implications for measuring
organizational innovation performance. Specifically, measurement instruments that
define innovation performance narrowly may either fail to account for the contingency
approaches firms take in pursuing innovation and/ or implicitly predetermine the
relative importance of the various forms of innovation.
In addition to the multi-dimensional nature of innovation, Damanpour’s
definition alludes to the possibility of varying definitions based on one’s perspective.
Rogers makes this explicit in stating that innovations are something “…perceived as
new by an individual or other unit...” Therefore, by this definition, innovation may be
measured via subjective as well as objective measures.
As discussed previously, innovation research has also emphasized creation as
well as adoption of innovations. Authors such as Betz have focused primarily on
innovation from the standpoint of creating something new [73]. Viewed this way,
innovation performance would be measured via metrics such as number of patents and
new products introduced. Other authors have focused on the process by which firms
adopt or implement something new [74, 75]. Damanpour further decomposes
innovation adoption into the stages of initiation (problem perception, information
44
gathering, attitude formation and evaluation, and resource attainment leading to a
decision to adopt) and implementation (events and actions pertaining to modification
of both the innovation and the organization, the initial utilization, and the continued
use of the innovation until it becomes a routine feature of the organization) [74].
From the standpoint of adoption, innovation performance would be measured via
metrics such as new processes implemented, new sources of supply, and new ways of
organizing.
Given the preceding discussion of the varied dimensions and definitions of
innovation, one can see there are close parallels with quality. Both quality and
innovation are inherently multi-dimensional and can be measured objectively as well
as subjectively. However, prior to turning attention to the literature on measurement
of innovation performance, further development of innovation theory, particularly
with respect to relationships to quality management will be discussed.
Innovation Theory Development
Utterback and Abernathy explored relationships between innovation and
competitive strategy and between innovation and production process characteristics
[78]. The authors propose models for both process and product development and
integrate these models into three stages:
Stage I - processes are uncoordinated, rates of change are high and
processes are not yet standardized; processes are organic and respond easily to
environmental change. Performance-maximizing is emphasized early in the
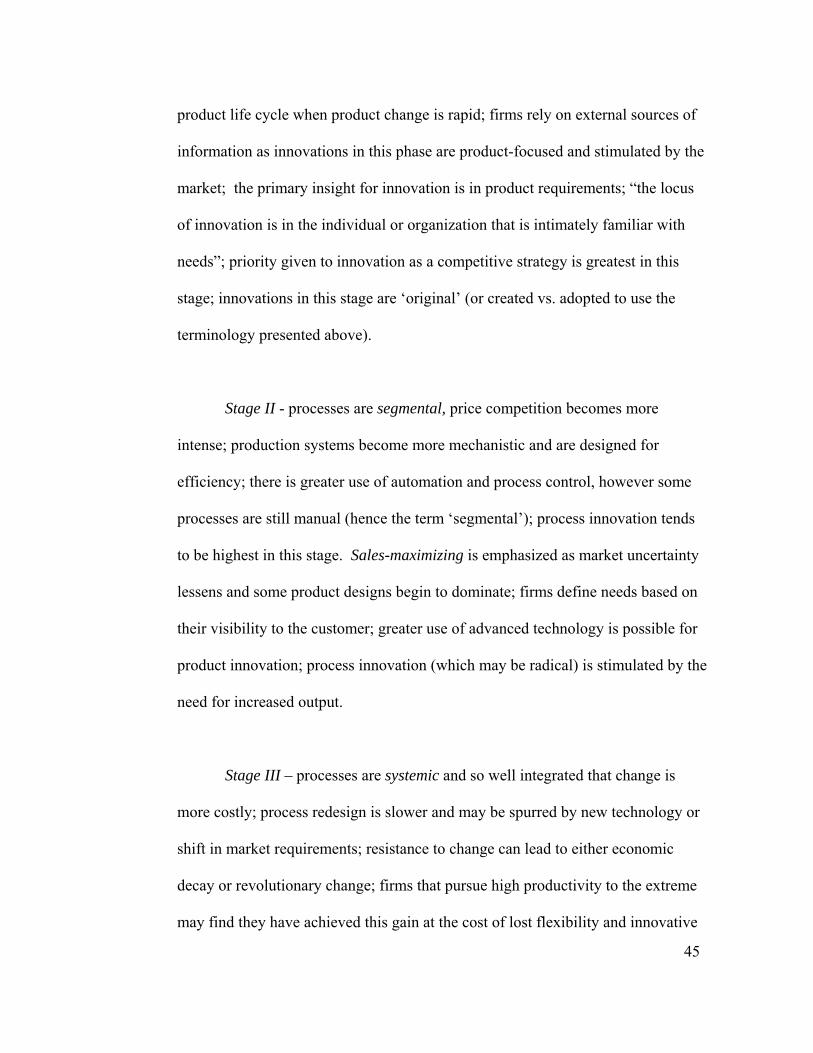
45
product life cycle when product change is rapid; firms rely on external sources of
information as innovations in this phase are product-focused and stimulated by the
market; the primary insight for innovation is in product requirements; “the locus
of innovation is in the individual or organization that is intimately familiar with
needs”; priority given to innovation as a competitive strategy is greatest in this
stage; innovations in this stage are ‘original’ (or created vs. adopted to use the
terminology presented above).
Stage II - processes are segmental, price competition becomes more
intense; production systems become more mechanistic and are designed for
efficiency; there is greater use of automation and process control, however some
processes are still manual (hence the term ‘segmental’); process innovation tends
to be highest in this stage. Sales-maximizing is emphasized as market uncertainty
lessens and some product designs begin to dominate; firms define needs based on
their visibility to the customer; greater use of advanced technology is possible for
product innovation; process innovation (which may be radical) is stimulated by the
need for increased output.
Stage III – processes are systemic and so well integrated that change is
more costly; process redesign is slower and may be spurred by new technology or
shift in market requirements; resistance to change can lead to either economic
decay or revolutionary change; firms that pursue high productivity to the extreme
may find they have achieved this gain at the cost of lost flexibility and innovative
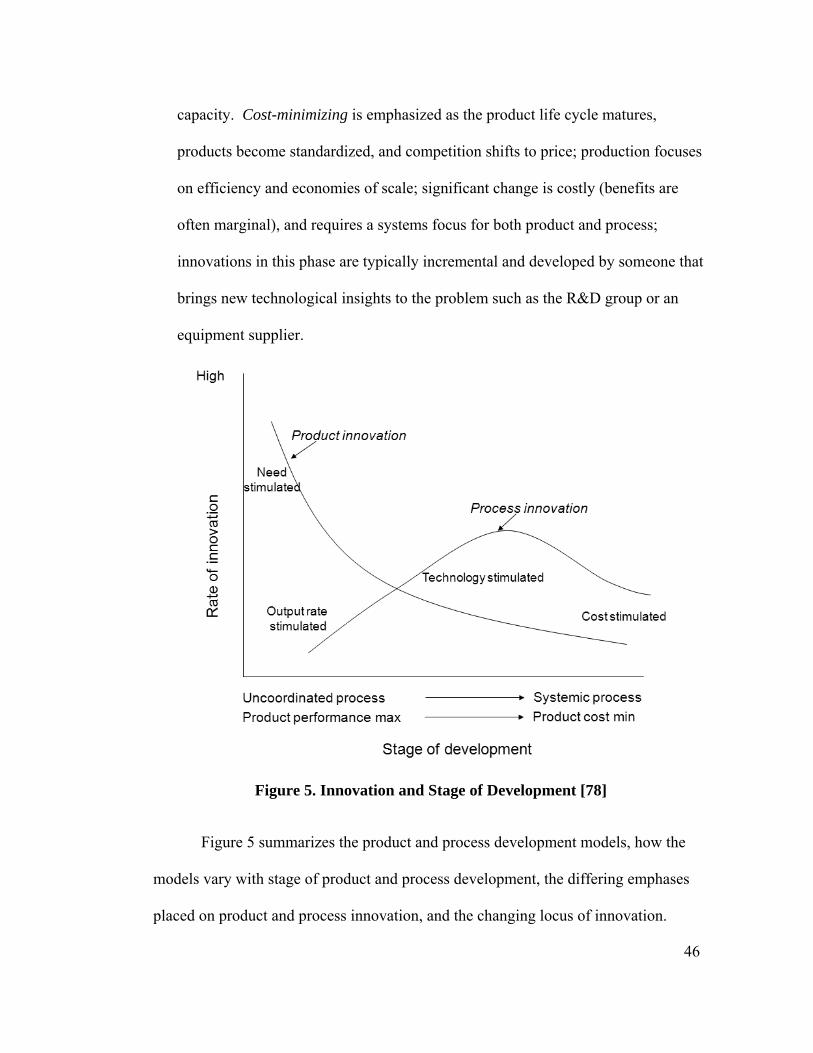
46
capacity. Cost-minimizing is emphasized as the product life cycle matures,
products become standardized, and competition shifts to price; production focuses
on efficiency and economies of scale; significant change is costly (benefits are
often marginal), and requires a systems focus for both product and process;
innovations in this phase are typically incremental and developed by someone that
brings new technological insights to the problem such as the R&D group or an
equipment supplier.
Figure 5. Innovation and Stage of Development [78]
Figure 5 summarizes the product and process development models, how the
models vary with stage of product and process development, the differing emphases
placed on product and process innovation, and the changing locus of innovation.

47
Key points from this paper from the standpoint of measurement of innovation
include reinforcement of the multidimensional nature of innovation. For example, few
if any Stage III firms would be deemed innovative if innovation was defined as
radical, original (created), and product-focused. Conversely, if innovation was more
broadly defined and included incremental, adopted, and process-focused innovations,
the results would likely be quite different.
From the standpoint of quality management, Utterback and Abernathy draw
linkages to the importance of customer relationship management and external
communication. Specifically, given that the locus of innovation in Stage I is in firms
intimately familiar with the needs of the market, it is crucial for such firms to take a
proactive approach to customer focus. Further, the authors note the importance of
understanding the locus of innovation and the difference between creation and
adoption of innovation. In this regard, assessing the innovation performance of an
industry sector in Stage III, for example, lumber manufacturing, would best be
measured from the viewpoint of adoption of process innovations. At the same time,
assessing the innovation performance of equipment suppliers to lumber manufacturers
could involve a broader view of innovation.
Damanpour conducted a meta-analysis of innovation to identify relationships
between innovation and organizational determinants such as specialization, functional
differentiation, centralization, and internal/ external communication [79]. The author

48
synthesized results of published empirical research to provide information for theory
development and to address existing questions on innovation.
From the standpoint of quality management, key findings from this research
include the finding of positive associations between innovation and internal and
external communication. Again, external communication lends support to the idea
that customer relationship management leads to innovation. Further, given that
‘information and communication systems’ are a key factor in TQM, there is a potential
link to the importance of internal communication as well.
In addition, Damanpour states that standardization of work processes, which is
often emphasized in the TQM construct for process management, can establish the
managerial control required for successful adoption of innovation. This finding may
beg the question as to whether TQM practices are more closely connected to adoption
of innovation rather than creation.
Type of innovation (which Damanpour defines broadly as product/ process;
administrative/ technical; and radical/ incremental) did not influence the relationships
between organizational determinants and innovation. This finding seems to contradict
the suggestion by Cooper of the importance of a multidimensional view of innovation
[72]. However the finding is supported by Johannessen et al. (described below) in that
their research suggests that measuring innovation via a single construct is possible
[76].
49
Damanpour also found that direct supervision inhibits innovation, lending
support to the employee empowerment aspect of TQM. With respect to organizational
culture, the author found that an organic culture enhances initiation of technical
innovations whereas a mechanistic culture supports implementation of administrative
innovations.
Damanpour also examined the relationships between organizational
complexity and innovation [74]. Key findings from this research from the standpoint
of quality management include a positive relation between innovation and
organizations facing high environmental uncertainty. This finding agrees with the
‘control vs. learning’ dichotomy within quality management expressed by Sitkin and
described below [24]. Also, in defining product and process innovations, the author
presents a possible distinction between two types of innovation and internal vs.
external focus. Specifically, product innovations “…refer to the introduction of new
products or services to meet an external market or user need”, while process
innovations refer to the “…introduction into the organization’s production process or
service operations of new elements (e.g., input materials, task specifications, work and
information flow, and equipment) that are used to produce a product or render a
service.” Hence, there may be a tendency towards product innovations in firms that
are externally focused and process innovation in firms that are more internally
focused.

50
In summary, the dimensions (product/ process, adopt/ create, and radicalness)
and locus of innovation change in an organization depending on stage of the product
life cycle and degree of development of the firm’s processes. In the early stage of a
firm, the emphasis is on the creation of innovative products with customer needs
serving as a crucial source of information. Later in a firm’s development, the rate of
innovation is much lower and the emphasis is typically on adoption of process
innovation provided via a vendor. These concepts reinforce the notion of the
multidimensional nature of innovation and the imperative to take this into account
when measuring organizational innovation performance. Further, there are a number
of areas that point to connections between innovation and key aspects of quality
management. For example, internal (e.g., process focus/ continuous improvement)
focus may lead to an emphasis on process innovation whereas external (customer)
focus may lead to product innovation. Prior to exploring additional conceptual
linkages between innovation and quality, and between quality management and
innovation performance, the means by which innovation performance is measured
must first be addressed.
Measuring Innovation Performance
While there has been extensive research in the quality field related to the
development of measurement constructs for assessing the extent of implementation of
TQM, constructs for innovation are not as well developed [25]. For purposes of
discussion here, the primary constructs of interest are innovation outputs, that is,
metrics that effectively reflect innovation performance. Common measures of
51
innovation performance include patents and/ or new product releases [80]. However,
these metrics represent a fairly narrow perception of innovation.
As stated above, Johannessen et al. proposed that ‘newness’ was the common
denominator for the various definitions of innovation [76]. The concept of ‘new to
whom?’ is presented in the context of radical vs. incremental innovations; the authors
state that the relevant unit of adoption must be addressed to fully understand if an
innovation is new to the firm or new to the market. In other words, an incremental
innovation is one that is new to the firm, but not new to other firms. Conversely,
radical innovations are new to the market. In essence, the more broadly the unit of
adoption is defined, the more radical the innovation.
The authors state that earlier studies focused on a narrow view of innovation
and often used proxies such as total R&D expenditures, proportion of R&D scientists
and engineers and number of patents rather than explicitly measuring what is new.
Based on a review of the innovation literature, six forms of innovation are proposed:
new products, new services, new methods of production, opening new markets, new
sources of supply, and new ways of organizing. A measurement instrument was
developed and tested (see Appendix B1) based on these six forms of innovation.
Factor analysis showed that innovation could be measured as a single construct and
distinguished only by the degree of radicalness. Reliability was deemed to be
adequate given that Cronbach’s alpha was greater than the 0.70 threshold suggested by
Nunnally [69]. Hence, this result calls into question the need to measure innovation
52
via multiple dimensions – at least from the standpoint of product vs. process and
administrative vs. technical.
However, while it may be possible to measure innovation via a single
construct, researchers must determine if it is appropriate or desirable given the specific
objectives of the research at-hand. For example, if studying relationships between
management practices and innovation in general terms, it may be sufficient to simply
conceive of innovation as a single construct. However, if the objective is to examine
the correlations between specific practices and different types of innovation, a single
construct for innovation would make this impossible.
The authors also discuss important external factors influencing innovation that
include customer-supplier relations and internal factors such as information and
communication. Further research is suggested to consider how innovation is related to
internal and external factors.
Strengths of the measurement instrument developed by Johannessen et al.
include that it is both simple and comprehensive. With regards to simplicity, response
rate might be better in that respondents would not be overwhelmed by the number of
questions. Comprehensiveness is evident in that the dimensions of product, process
and business system are all addressed to some extent. At the same time, one might
question as to whether the instrument is too simple, i.e., is a single question on product
innovation sufficient to capture the many nuances of this form of innovation? In that

53
same regard, is the instrument truly comprehensive with only six questions to cover
the many facets of innovation?
Diaz-Balteiro et al. explored productive efficiency and innovation activity in
the Spanish wood products industry [81]. Innovation output was measured as number
of patents, number of product innovations and number of process innovations.
Product innovation included “…introduction of new and significantly improved goods
and/or services with respect to their fundamental characteristics, technical
specifications, incorporated software or other immaterial components, intended uses,
or user friendliness.” Process innovation was a variable equal to two, one, or zero -
two if the firm adopted both types of process innovation (introduction of new and
significantly improved production technologies or new and significantly improved
organizational and managerial changes); one if the firm adopted one of the two types
of process innovation; and zero if the firm did not adopt any process innovation. The
inclusion of ‘organizational and managerial changes’ indicates these authors view
administrative/ business system innovations as a type of process innovation. The
article does not mention testing the constructs for reliability. As the authors used DEA
as their research method, this article will be addressed in greater detail in the
appropriate section below.
Prajogo and Sohal [25, 30, 35, 82] developed innovation performance metrics
to explore the correlation between quality management and innovation performance.
Constructs for measuring product and process innovation were developed based on a

54
review of the literature discussing empirical studies of innovation. Reliability of the
constructs was found to be adequate in that Cronbach’s alpha was greater than the 0.70
threshold suggested by Nunnally [69]. The criteria developed are shown in Table 2
below.
Table 2. Scales to Measure Product and Process Innovation Performance [25] Product innovation Process innovation
• The level of newness (novelty) of new products
• The use of latest technological innovations in new product development
• The speed of new product development
• The number of new products introduced to the market
• The number of new products that are first-to-market (early market entrants)
• The technological competitiveness • The updated-ness or novelty of
technology used in processes • The speed of adoption of the latest
technological innovations in processes
• The rate of change in processes, techniques and technology
These scales were used to acquire perceptual data from survey respondents.
Personnel in manufacturing and non-manufacturing firms were asked to evaluate their
company’s performance with respect to each of the items in Table 2 against the major
competitor in the industry. Several of these questions (e.g., level of newness and first-
to-market) were included to specifically address radical forms of innovation. A
strength of the instrument is measuring both product and process innovation via
multiple perspectives, for example number of products, speed of new product
development, and level of newness. This is a strength in comparison to the
Johannessen et al. instrument described above. At the same time, a limitation is that
the instrument does not address administrative or business systems innovations. As
the authors used the instrument to assess the impact of TQM on quality and innovation
55
performance, the article will be discussed in greater detail in the appropriate section
below.
Singh and Smith developed four measures for innovation [33]:
• innovative processes/ products/ services have been commercialized; • R&D leads to development of world-class techniques/ technologies; • the rate of innovation of new operational processes; and • the rate of introduction of new products and services.
As these authors used these measures in a study exploring the relationships
between TQM and innovation, the paper will be explored in more detail in the
appropriate section below.
Thus, in comparison to quality performance, there are fewer instruments to
choose from to evaluate innovation performance. However, two of the instruments
described above (Johannessen et al. and Prajogo and Sohal) have been found to be
reliable instruments for measuring innovation performance. To measure innovation
performance from multiple dimensions (e.g., product/ process/ business system and
radical/ incremental) and multiple perspectives (e.g., number of products developed
and speed of product development), it seems that some combination of the two
instruments is needed.
The review of the literature to this point has emphasized the varying
definitions, dimensions, and measurement instruments for determining the extent of
implementation of TQM (i.e., the inputs an organization invests into their quality
56
management system) and quality and innovation performance (i.e., outputs). To
determine the ‘benchmark’ organizations – those that are most efficient at converting
inputs into outputs – an analytical tool is needed that can account for multiple inputs
and outputs simultaneously, and further, for systems for which no pre-defined
production function exists. Data Envelopment Analysis (DEA) is an approach that
fulfills these requirements. And further, to enable detailed descriptions of best
practices, the results of DEA analysis can be used for identification of target
organizations for case study research. In this regard overviews of DEA and the case
study method will be presented prior to a discussion of the literature describing
relationships between quality management and organizational performance.
Data Envelopment Analysis (DEA)
Presented here is an introduction to Data Envelopment Analysis (DEA). The
focus is on describing DEA, how it works, and to describe its applicability and
advantages for exploring the impact of quality management on performance.
Applications of DEA to efficiency measurement in quality management and
innovation will be discussed in a separate section.
Charnes, Cooper, and Rhodes [83] authored the seminal paper on Data
Envelopment Analysis (DEA) in 1978. DEA provides a measure of efficiency via
simultaneous comparison of multiple inputs and multiple outputs. This issue of
multiple inputs and outputs is a key advantage of DEA. Efficiency is a well-
established concept of the ratio of one output measure (such as profit) to one input

57
measure (such as total labor). However, in situations where there are multiple inputs
and multiple outputs with no production function to describe the relationships between
values, there can be an overwhelming number of efficiency ratios. In short, it
becomes exceedingly difficult to determine efficiency of a system as a whole. Such is
the case for the topics of discussion here – quality and innovation – that are
represented by multiple inputs and outputs with no clear production function
describing the relationship.
For purposes of discussion here, the various principles and practices of TQM
can be seen as the inputs. It would seem obvious that the primary desired output of a
quality management system is quality performance. However, as will be discussed
below, research has shown the fundamental principles of TQM (process focus/
continuous improvement, customer focus, and participation and teamwork) also
impact innovation performance. Thus, both quality and innovation performance are
reasonable outputs for TQM. At the same time, such efficiency analyses could benefit
from also taking into account the practices organizations invest in with the specific
intent of achieving innovation performance, i.e., practices related to R&D and
technology management.
DEA uses linear programming (LP) to determine the relative efficiency of
decision making units (DMUs, e.g., companies, departments, etc.). Unlike regression
analysis, DEA is an extreme point method. The goal is to identify those DMUs that
‘set the benchmark’ by demonstrating, with actual production and performance data,
58
the maximum production of outputs given inputs (what is termed output-oriented in
DEA), or conversely, the minimum usage of inputs, given outputs (input-oriented).
Analysis of productive efficiency via DEA provides both an efficiency score as
well as data to enable inefficient DMUs (those that could obtain more output with the
same input or vice-versa, the same output could be obtained with less input) to
determine which aspects of the business require attention to improve efficiency. Thus,
DEA serves a dual role as an analytical tool for benchmarking as well as a tool to
enable decision makers to determine leverage points for improvement.
There are numerous models by which DEA analyses are implemented as well
as extensions to the traditional approaches. For example, models may be either input-
or output-oriented as described above, may emphasize constant or varying returns to
scale, and may consider the slack values in the LP such that ‘weakly efficient’ DMUs2
may be identified (see the figure in Appendix C). One such model is CCR (Charnes,
Cooper, and Rhodes model) [83] shown in ratio form in Equation 1:
2 Weakly efficient DMUs have non-zero slack whereas the slack values are zero for ‘strongly efficient’ DMUs. In other words, a weakly efficient DMU is one that is on the efficiency frontier, however from an output perspective, other DMUs exist with the same level of inputs, but more outputs. See the figure in Appendix C for a graphical view of the concept.
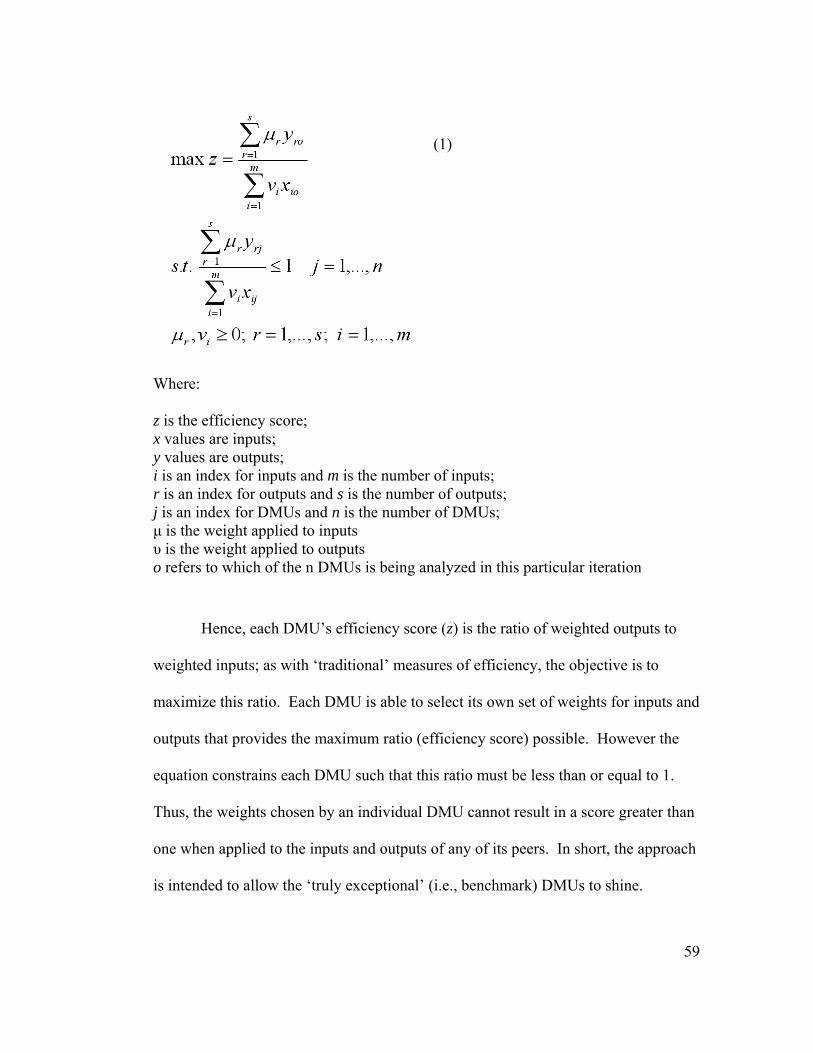
59
Where:
z is the efficiency score; x values are inputs; y values are outputs; i is an index for inputs and m is the number of inputs; r is an index for outputs and s is the number of outputs; j is an index for DMUs and n is the number of DMUs; μ is the weight applied to inputs υ is the weight applied to outputs o refers to which of the n DMUs is being analyzed in this particular iteration
Hence, each DMU’s efficiency score (z) is the ratio of weighted outputs to
weighted inputs; as with ‘traditional’ measures of efficiency, the objective is to
maximize this ratio. Each DMU is able to select its own set of weights for inputs and
outputs that provides the maximum ratio (efficiency score) possible. However the
equation constrains each DMU such that this ratio must be less than or equal to 1.
Thus, the weights chosen by an individual DMU cannot result in a score greater than
one when applied to the inputs and outputs of any of its peers. In short, the approach
is intended to allow the ‘truly exceptional’ (i.e., benchmark) DMUs to shine.
(1)
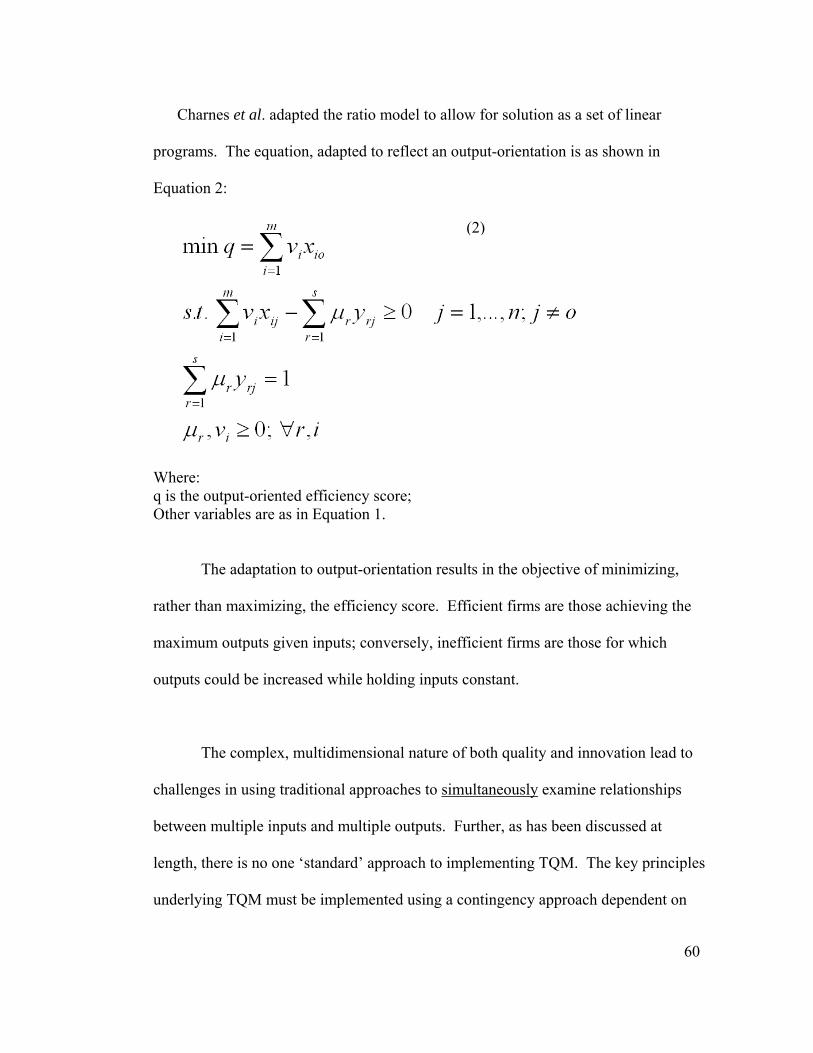
60
Charnes et al. adapted the ratio model to allow for solution as a set of linear
programs. The equation, adapted to reflect an output-orientation is as shown in
Equation 2:
Where: q is the output-oriented efficiency score; Other variables are as in Equation 1. The adaptation to output-orientation results in the objective of minimizing,
rather than maximizing, the efficiency score. Efficient firms are those achieving the
maximum outputs given inputs; conversely, inefficient firms are those for which
outputs could be increased while holding inputs constant.
The complex, multidimensional nature of both quality and innovation lead to
challenges in using traditional approaches to simultaneously examine relationships
between multiple inputs and multiple outputs. Further, as has been discussed at
length, there is no one ‘standard’ approach to implementing TQM. The key principles
underlying TQM must be implemented using a contingency approach dependent on
(2)
61
the firm’s strategy, objectives, and context. DEA allows for individual DMUs to
select the best ‘mix’ of inputs to achieve a given level of outputs. This is quite
appropriate for TQM given the mix of hard and soft factors, internal and external
focus, etc. DEA will enable the exploration of how TQM is currently being
implemented in actual firms in light of the firm’s performance.
Lastly, the principle of benchmarking within TQM is in direct agreement with
DEA given that DEA is a key tool for identifying benchmark firms and benchmark
targets. In fact, there is precedence in the literature for such alignment. The two
studies the author could locate on application of DEA to examine TQM practices
include a study by Forker et al. and Yoo. Forker et al. used DEA to evaluate the TQM
practices of supplier firms as a means of benchmarking best peer suppliers [84]; Yoo
used DEA to examine the impact of specific TQM principles and practices on quality
performance [85]. Each of these studies is examined below in the section related to
‘Relationships between Quality and Performance – Studies using DEA.’
In summary, DEA is well suited to the identification of best quality
management practices for achieving quality and innovation performance. The method
allows for simultaneous consideration of the multiple quality management inputs and
the multiple outputs inherent to both quality and innovation performance. With
respect to examining TQM practices, DEA would enable identification of firms that
have focused on specific practices rather than those taking more of a ‘shotgun’
approach (i.e., emphasizing all practices). The latter firms would be excluded from
62
the efficient set to the extent that competitors are able to achieve similar or better
results by emphasizing fewer practices (and presumably investing fewer resources).
In short, as a benchmarking tool, DEA is ideal for identifying ‘best practice’ firms –
those that are focused and achieving results. However, more in-depth analysis is
needed to provide detailed descriptions, and specific examples, of these practices. In
this regard, the case study method is well-suited for use as a follow-up to DEA.
Case Study Method
Eisenhardt defines the case study method as a research strategy which
“…focuses on understanding the dynamics present within single settings” [86].
Similarly, Yin states that case study research focuses on investigation of contemporary
phenomena in their real-life context [87]. Hence, setting or context is crucial in case
study research; the strength of the method lies in obtaining detailed data about a timely
topic in the context in which the topic occurs.
There are multiple potential sources of data for case studies; information can
be acquired from sources including archives, interviews, observations, or simulations
[88]. Case study data can be both qualitative and quantitative, although, qualitative
data are widely used. Given the importance of context discussed above, data are
typically collected in the field, i.e., from visits to case organizations.
63
Glaser and Strauss state that the case study method (or grounded theory – an
outcome of case study research) is useful in areas that are not yet well-explored, i.e.,
where theory is not yet well developed [89]. Further, case studies are likely to provide
well-grounded and detailed descriptions of the situation being studied [86]. Yin
describes several situations where case studies are applied [88]. One such application
is to explain causal links in situations that are too complex for other research methods
such as surveys or designed experiments.
Many authors have proposed a step-by-step approach to case study research,
although the process is typically iterative. Eisenhardt [86], for example, describes in
some detail eight steps involved in case study research. These steps may be
summarized as follows:
1. Getting started – describe the factors and guiding propositions (expected relationships) among them and propose research questions.
2. Selecting cases – ‘theoretical sampling’, rather than random sampling is preferred – cases should be selected to replicate previous cases, extend emergent theory, represent theoretical categories, or polar opposites; multiple cases are preferred to provide deeper understanding and the chance to test propositions.
3. Crafting instruments and protocols – data are typically gathered using a
number of different methods including quantitative as well as qualitative and through using multiple investigators where possible.
4. Entering the field – researchers visit case firms to gather data; detailed record-
keeping is crucial in this step; analysis should occur simultaneously with data collection via addressing questions such as “what am I learning” or “how does this case differ from the last”; further, a key hallmark of the case method is in the flexibility – the researcher is encouraged to make adjustments to measurement instruments and methods during data collection to explore emerging themes or take advantage of special opportunities.
64
5. Analyzing data – triangulation is conducted to compare data collected by various researchers and methods (e.g., interview, archive, etc.) to discover the extent to which there is convergence among different sources; data are analyzed both within-case as well as cross-case:
a. Within-case – develop detailed case study reports for each case; code and tabulate data.
b. Cross-case – select categories or dimensions, pairs of cases, and/or varying data sources and look for similarities and differences between them; the ‘chain of evidence’ is crucial in being able to document links between questions asked, data collected, analysis, and conclusions.
6. Shaping propositions – again, the process is iterative – initial propositions are
compared with data and new propositions often emerge; the process of proposition formation and data collection and analysis continues until there is a close fit with the data; each case serves as replication in that each case may confirm or disconfirm the proposition; these processes sharpen the definition, validity, and measurability of the constructs and build internal validity.
7. Enfolding literature – given the typically small number of cases, comparison
of results with existing literature (both similar and conflicting) is done to ensure reliability and validity of findings; generalizability of results occurs when findings are confirmed by a broad range of literature on the topic.
8. Reaching closure – the researcher must determine when to stop adding cases
(although number of cases is usually predetermined and four to ten cases usually work well) and when to stop iterating between data collection and theory development; the ‘stop point’ is usually when theoretical saturation occurs, i.e., when incremental improvement to the theory is minimal.
Case study research has several advantages including applicability to new
areas where theory development is in the early stages and in tightly linking theory
with real-world data. Further, the method allows for in-depth analyses and detailed
descriptions of the underlying reasons behind the phenomena being examined. Also,
the process is flexible and allows for ‘real time adjustments’ to the method to explore
concepts revealed during the study.
65
However the approach is not without disadvantages as well. There is often an
enormous amount of data collected which can result in development of an overly
complex theory in an effort to incorporate all the information. Field work has risks in
the researcher being ‘too close to the situation’, that is, allowing the situation to guide
data collection rather than the research objectives. There are also risks from
respondent bias in that responses from personnel with higher status in an organization
might receive higher weight or credibility than those of lower status (regardless of the
accuracy of the comments). Similarly, there are risks of respondents ‘guarding’ or
inaccurately relaying sensitive information. As has often been said, the most
interesting information is often the most difficult to obtain. Finally, and significantly,
methods for analyzing qualitative data are not yet well established and thus the
findings often do not carry the weight of statistical evidence reported using more
traditional, quantitative approaches.
Perhaps one of the greatest challenges with case research is related to case
selection, that is, how the researcher goes about selecting the individual cases to be
explored [90]. There has not been a great deal of attention given to this topic in the
literature. For example, Yin devotes only one page (p. 78) to the topic in his text Case
Study Research [88]. He suggests that when there are a small number of candidates,
the researcher may screen candidates by querying people knowledgeable about each
candidate and/or collecting limited documentation about each candidate. Researchers
are encouraged to, “…have defined a set of operational criteria whereby candidates
will be deemed qualified to serve as cases. Then you should select randomly from the
66
qualified candidates…” If the set of candidates is larger, Yin suggests that a two-stage
screening procedure may be needed. The first stage consists of collecting relevant
quantitative data about the entire pool from some archival source to screen the group
down to 20 to 30 candidates; stage two is the same as described previously for smaller
groups.
Eisenhardt also addresses case selection [86]. As stated above in step 2,
‘theoretical sampling’, rather than random sampling is preferred. That is, cases are
chosen for theoretical not statistical reasons. As she states, cases should be selected to
replicate previous cases, extend emergent theory, represent theoretical categories, or
polar opposites. She then provides several examples of how other researchers have
selected case firms. For example, one researcher wanting to develop theories on
success and failure selected four markets and then polar examples from each market,
i.e., “…one case of clearly successful firm performance and one unsuccessful case.”
Such an approach may work in situations where ‘successful’ and ‘unsuccessful’ are in
fact clear. The challenge is in situations where such distinctions are not clear; even as
with Yin’s suggestions, when a priori data on candidate firms are not readily
available.
Seawright and Gerring propose seven quantitative methods for case selection
[90]. As these authors state, “…choosing good cases for extremely small samples is a
challenging endeavor… the question of case selection has received relatively little
attention from scholars…” The proposed methods include several approaches for
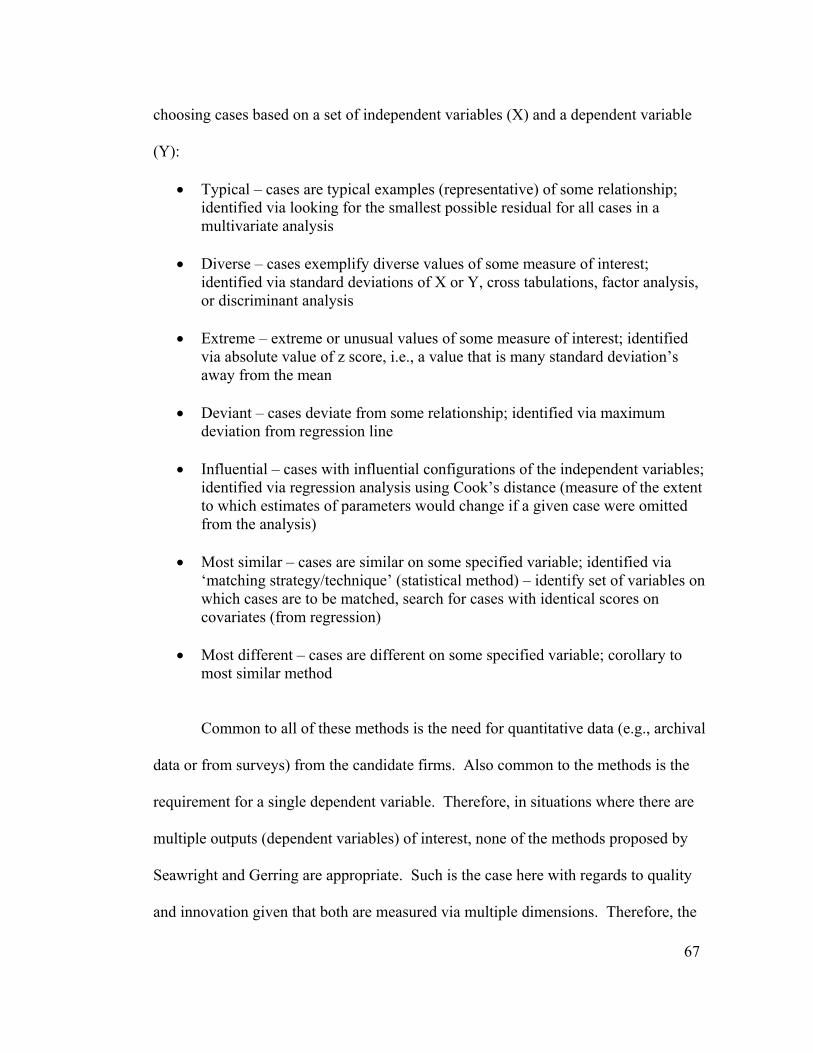
67
choosing cases based on a set of independent variables (X) and a dependent variable
(Y):
• Typical – cases are typical examples (representative) of some relationship; identified via looking for the smallest possible residual for all cases in a multivariate analysis
• Diverse – cases exemplify diverse values of some measure of interest;
identified via standard deviations of X or Y, cross tabulations, factor analysis, or discriminant analysis
• Extreme – extreme or unusual values of some measure of interest; identified
via absolute value of z score, i.e., a value that is many standard deviation’s away from the mean
• Deviant – cases deviate from some relationship; identified via maximum
deviation from regression line
• Influential – cases with influential configurations of the independent variables; identified via regression analysis using Cook’s distance (measure of the extent to which estimates of parameters would change if a given case were omitted from the analysis)
• Most similar – cases are similar on some specified variable; identified via
‘matching strategy/technique’ (statistical method) – identify set of variables on which cases are to be matched, search for cases with identical scores on covariates (from regression)
• Most different – cases are different on some specified variable; corollary to
most similar method
Common to all of these methods is the need for quantitative data (e.g., archival
data or from surveys) from the candidate firms. Also common to the methods is the
requirement for a single dependent variable. Therefore, in situations where there are
multiple outputs (dependent variables) of interest, none of the methods proposed by
Seawright and Gerring are appropriate. Such is the case here with regards to quality
and innovation given that both are measured via multiple dimensions. Therefore, the
68
need remains for a method to select the case firms in situations with multiple inputs
and outputs.
An analog to Seawright and Gerring’s approach for ‘diverse’ case firm
selection would be to use cluster analysis on either inputs or outputs to aggregate cases
on some variable of interest and thereby facilitate case selection. Such an approach
was used by Campbell and Ahrens to select case firms [91]. The authors used cluster
analysis to organize communities into three groups with respect to the support the
communities provided for victims of rape. Case firms were then selected from the
high and low extremes of support. Such an approach appears to be the best available
option for situations where the criteria for case selection are multidimensional.
In summary, case study research is applicable to exploring timely topics in the
context of the case firm. The method is often used for areas where the underlying
theory is not yet well-established. The results can be novel, and rich descriptions of
underlying causes and relationships for situations too complex for the use of other
research methods. The process of conducting case study research is iterative where
data collection, analysis, and theory development occur simultaneously. Case firms
are chosen by theoretical, rather than random sampling, and polar opposites with
regards to a specific phenomenon can be selected to provide a diversity of examples.
The combination of DEA, cluster analysis, and case studies provides distinct
advantages for identification of best practices. DEA can be used to identify firms that
are efficient with respect to some multidimensional performance measure of interest

69
(e.g., quality and innovation performance); cluster analysis can be used to group firms
with respect to these measures of performance to thereby facilitate case firm selection.
Case studies can be then used to explore in greater depth the key practices that
differentiate firms, verify results, and add deeper insights and detail to the best
practices.
To this point, the review of the literature has focused on the varying
definitions, dimensions, and measurement instruments for determining the extent of
implementation of TQM and quality and innovation performance. DEA followed by
cluster analysis was presented as a method to determine the ‘benchmark’ organizations
– those that are most efficient at converting quality management inputs into either
quality or quality and innovation performance outputs. And finally, the case study
method was presented as an approach to confirm and add depth to the best practices.
The review of the literature continues with an analysis of studies that have examined
relationships between quality management and organizational performance.
Relationships between Quality Management and Organizational Performance
As discussed previously, the development of instruments to evaluate the extent
of implementation of TQM principles and practices was inspired in part to respond to
conflicting accounts of TQM to generate significant positive impacts on organizational
performance. Following the development of such instruments, researchers were better
able to assess correlations between firm performance and the extent to which TQM
70
was implemented in the firm. Relationships between TQM and general organizational
performance (including quality) using a variety of research methods have been
explored via various approaches, including a limited number of studies using DEA.
More recently, relationships between quality management and innovation performance
have been explored. The literature in each of these areas will be explored in turn.
General Organizational performance
As stated in the introduction, results of studies exploring the impact of TQM
on performance have been mixed. While the literature on this topic within the last 10
to 15 years is vast, some of the key studies are presented here.
Garvin conducted one of the earliest comprehensive studies to address the
question of the impact of quality on corporate performance [57]. The study was
limited to an examination of product quality as opposed to the much broader
conception of TQM. Regardless, the results paved the way for other research
exploring this critical connection. Garvin examined quality and productivity for air
conditioner manufacturers in the U.S. and Japan. Quality was measured as the
incidence of internal failures (defects observed during fabrication or in assembly) and
external failures (i.e., field failures, measured as service calls recorded during the first
year of warranty coverage). The results showed that the failure rate for the worst
Japanese company was less than half that of the best U.S. manufacturer. Total costs of
quality incurred by Japanese producers were less than half the failure costs incurred by
the best U.S. companies. Highest quality producers also had the highest productivity

71
(output per man-hour). The conclusion is thus that quality adds to the bottom line by
significantly reducing failure costs and increasing productivity (quality professionals
have often had to argue the case that productivity must be defined as good output
divided by total input and not simply total output divided by input [92]).
Adam studied the correlation between quality improvement approaches and
operating and financial performance [4]. The correlation between quality
improvement and productivity improvement approaches and performance quality
(defined as average percent items defective, cost of quality as percent of sales, and
customer satisfaction) was strong whereas the relationship between these approaches
and operating or financial performance was significant, but weaker. The authors state
that given the low R2 values, “…TQM and other commonly promoted practices have
little practical influence on the performance variables reported in this study… A case
can be made from this study that TQM is a failure.” The author suggests a
contingency approach to quality and productivity based on the strategic objectives of
performance quality, operating improvement, or financial performance. Other authors
have suggested that the absence of a strong relationship in this research was due to an
inappropriate model used for examining the quality management – quality
performance relationship [38].
Flynn et al. used the quality management measurement instrument they
developed (discussed above and shown in Appendix A2) to link specific practices for
high- and low-quality firms [93]. Quality performance was defined as the percentage
72
of products that pass final inspection without requiring rework. The authors
acknowledge this narrow definition as a significant limitation for the research and
suggest future research to examine a broader definition of quality performance
measures including measures taken from the customer viewpoint. High-quality firms
(i.e., those with a high percentage of products that pass final inspection) could be
differentiated from low-quality firms based on employee involvement, process control,
new-product quality practices, concurrent engineering, feedback, maintenance,
supplier relationship, labor skill level and selection for teamwork potential. Customer
interaction and design characteristics did a poor job of differentiation. One surprising
result was that both high- and low-quality groups used more progressive quality
management practices (i.e., those measured in the study) while the intermediate group
used less progressive practices (or simply used the same practices to a much lesser
degree). The authors hypothesized that this unexpected outcome may be due to low-
quality firms just beginning to adopt a broader set of quality practices and not yet
reaping the results. The intermediate firms may simply be content with the status quo
of quality in their firm and thus continue to use outdated practices.
Forker et al. examined how each of the functional areas of a firm addresses the
different dimensions of quality and which dimensions are important for organizational
performance [39]. The authors address one of the key limitations of prior research
examining the quality-performance relationship, namely the definition of quality as
conformance to specifications. This definition of quality is but one of Garvin’s five
definitions of quality [55]. Forker et al. examined quality using Garvin’s eight
73
dimensions: conformance to specifications, product reliability, product durability,
design quality, product improvement, brand image, company reputation, and customer
service [55]. Interview respondents in the furniture industry were asked to rank the
strategic importance of each of these eight dimensions. Respondents were also asked
to indicate percent responsibility of manufacturing, marketing, and product design &
development for each dimension. Organizational performance was measured as return
on assets (ROA), return on investment (ROI), growth in ROI, sales growth, market
share, growth in market share, return on sales (ROS), and growth in return on sales.
These values were measured both subjectively (the firm’s perception of performance
relative to major competitors on a seven-point scale) and objectively (actual data for
companies willing to provide the information). Only about one third of respondents
were willing to provide the financial measures. However, subjective and objective
measures were sufficiently correlated such that subjective measures could be used for
the analyses. Simple regression analysis followed by stepwise regression was used to
examine the contribution of the different quality dimensions to performance. Results
showed that quality viewed as conformance to specifications is significantly related to
ROI growth, sales growth, and ROS growth. Reliability is related to ROA and
durability is related to ROA, ROI growth, and ROS. Design quality and product
improvement are the most consistent predictors of overall organizational performance.
This is an intriguing result in that these activities would traditionally be viewed as
more closely related to product innovation than quality management. Stepwise
regression revealed that design quality, product improvement, company reputation,
product reliability and conformance to specifications are all important to bottom-line
74
organizational performance. An interesting result was the ‘perception gap’ between
importance and performance. The results suggest that furniture industry managers
should place greater emphasis on design quality and product improvement and less on
product durability, company reputation, reliability, and conformance quality, and
much less to brand image and customer service. These results agree with current
research in the forest products industry suggesting this sector place much greater
emphasis on innovation (specifically new product development) [94, 95].
Additionally, design quality and product improvement also involved the greatest
number of functions lending further support to the need for a systems-focus to quality
management programs.
Forker et al. also conducted research assessing the impact of TQM on supply
chain performance [38]. This study was one of the first to use DEA for such research.
This paper will be discussed below in the literature review section on research using
DEA for measuring quality performance.
Anderson and Sohal studied the relationship between quality management
practices and performance in small businesses [96]. Their quality management
measurement instrument was based primarily on the principles of the Deming Prize in
Japan and the MBNQA. Performance was measured via respondents’ perceptual
measures of firm performance with respect to sales, exports, cash flow, employment
levels, overall competitiveness and market share. A number of significant
relationships were identified between TQM practices and performance, for example,
75
leadership practices are particularly important for companies focused on quality rather
than flexibility in delivery. A key finding from their research was in the need to
capture data on needs and expectations of customers. This result appears to highlight
that ‘customer focus’ is still seen by many firms to mean quick response to customer
complaints rather than proactively seeking input and feedback from customers.
Samson and Terziovski also explored the relationships between TQM practices
and operational performance [46]. The authors stated that exploring the effectiveness
of TQM implementation was a key gap in the literature. The seven criteria of the
MBNQA served as the TQM model elements; specifically, the authors aimed to
develop constructs based on the first six criteria related to TQM practices. The
measurement instrument is shown in Appendix A5. The research sought to explore
the relationship of the six practices (i.e., ‘inputs’) to the seventh MBNQA criteria
related to performance outcomes (i.e., the ‘outputs’). The outcomes measured were
customer satisfaction, employee morale, productivity, quality of output, and delivery
performance. Factor analysis was conducted on the six practices constructs; factor
scores were used as independent variables in a multiple regression analysis with the
performance construct as the dependent variable. Results showed that TQM practice
intensity explains a significant proportion of variance in performance. Leadership,
management of people and customer focus were the strongest predictors of operational
performance. The authors noted that these so called ‘soft’ factors were the strongest
predictors of performance. It is possible that as TQM programs have evolved, the
hard factors are now simply qualifying criteria; those firms able to successfully
76
implement the softer factors of TQM are thus able to achieve higher levels of
performance.
Hendricks and Singhal examined stock price performance of firms with
effective TQM programs [41]. Winning a quality award (~140 different awards were
chosen) served as a proxy for effective TQM programs. Stock price performance was
examined for five years before winning the awards and compared with performance
the first five years after winning the award. There was no difference in stock price
performance for the firms (and a control group) in the period before receiving the
award. However after winning the award, firms significantly outperform firms in the
control groups; mean buy-and-hold abnormal returns (BHARs) range from 38 percent
to 46 percent. Thus, the research showed a positive correlation between quality and
profitability.
Prajogo and Brown examined the relationship between TQM practices and
quality performance for firms that have adopted formal quality programs vs. firms
without formal quality programs [20]. In essence, TQM firms were separated from
non-TQM firms based on respondents reporting whether or not they had pursued a
formal TQM program. The authors used the framework developed by Samson and
Terziovski (discussed above) for TQM measures and added items to the section on
Benchmarking to address the company’s strategy in measuring performance,
availability of data and information about performance, and the use of information in
decision-making processes conducted by senior management. Quality performance
measures selected for the study were those developed by Ahire et al. which included

77
four self-reported perceptual measures of product quality (product performance,
reliability, conformance to specifications, and durability). An interesting finding in
this research is that process management (composed of primarily ‘hard’ factors of
TQM) appears to have the strongest correlation with quality performance for TQM
firms, however customer focus, people management, and leadership are shown to have
the strongest correlation for non-TQM firms (i.e., the ‘soft’ factors). These results
may suggest that firms inclined to implement formal TQM programs are also more
inclined to the hard factors; this further suggests the effect of organizational culture on
how TQM is implemented. Further, the authors found that the lack of a formal
program (as declared by survey respondents) did not necessarily equate to the absence
of TQM principles. This result was somewhat unexpected in that prior studies have
shown that a formal TQM campaign leads to a more organized implementation of the
key elements. While there were strong links between TQM practices and quality
performance, there was no significant difference between firms with formal TQM
programs and those that simply adopted TQM practices (without attaching the ‘label’).
In short, it is the practices not the program that matter. This is further justification to
study the extent to which specific practices are implemented rather than an
organization’s declaration of using (or not using) TQM.
In summary, numerous researchers have explored the relationships between
quality and performance and most have found positive correlations. Quality inputs
have been both narrowly defined (e.g., the winning of a quality award as a proxy for
an effective TQM program), as well as broadly defined (e.g., the elements of the
78
MBNQA). Similarly, performance has included both narrow views (e.g., percentage
of parts to pass inspection) as well as broad views of performance (e.g., quality and
financial metrics). Several researchers have found varying correlations between the
so-called hard and soft factors of TQM and organizational performance. For example,
Samson and Terziovski found that the soft factors were stronger predictors of
organizational performance than hard factors. Prajogo and Brown also found that soft
factors predicted performance in firms that did not identify themselves as having a
formal TQM program whereas hard factors were better predictors of performance in
TQM firms. In addition, these authors emphasized that the principles and practices of
TQM were more important as predictors of performance than the presence or absence
of the ‘TQM label.’ Forker et al. found that quality management practices that might
also be considered to be associated with innovation (design quality and product
improvement) were the most consistent predictors of organizational performance;
further, these functions involve multiple functions in an organization and hence
require a holistic approach, or systems-focus, for quality management. Hence, the
literature exploring the relationships between quality management and organizational
performance lends support to positive correlations between quality and performance
and the contingency approach to the application of quality management practices with
respect to hard and soft tools and scope of implementation.
However, none of the literature discussed thus far has sought to identify best
quality management practices via simultaneous consideration of multiple inputs and
multiple outputs. Given the suitability of DEA for such an objective, a review follows
79
of studies that have used DEA in some fashion to examine impacts of quality on
various measures of performance. Although few of these studies have considered
quality management practices as inputs, the literature reviewed is intended primarily
to present how DEA has been used in the context of research in the field of quality
management.
Relationships between Quality and Performance – Studies using DEA
There are few papers reporting on the use of DEA to explore the relationships
between quality and performance. Following is a summary of the papers that have
explored this approach to examining quality management systems.
Mathiyalakan and Chung used DEA to evaluate the efficiency and
effectiveness of quality circles [97]. They used a three-input, two-output model.
Output (or what they termed effectiveness) measures included the quality circles’
contribution toward organizational goals and satisfaction with quality circles; these
values were perceptual data from survey respondents. Inputs (what they termed
efficiency) included operating cost, quantity of presentations, and productivity. DEA
analysis provided measures of relatively efficient quality circles. The authors then
defined (admittedly somewhat arbitrarily) ‘effective’ quality circles as those with
‘contribution to organizational goals’ scores greater than six (based on a seven-point
Likert scale). The efficient (DEA score = 1.0) and effective (high score on
‘contribution to organizational goals’) quality circles could then be identified and used
80
as benchmarks. The study is primarily exploratory in nature and intended to serve as a
proposed approach to simultaneously considering efficiency and effectiveness. While
the inputs and outputs have no direct application to the research proposed here, the
study is presented primarily as an example of one approach to exploring efficiency and
effectiveness simultaneously. However, it is not clear why the additional step of
defining effectiveness is needed if the outputs are properly chosen for the DEA model.
DEA has also been used by Triantis and McNelis to evaluate quality and
productivity in the pulp and paper industry [98]. With respect to quality, the
association between quality costs and quality (measured as conformance and
performance) was examined. Quality costs were computed as total failure costs,
which are a function of prevention and appraisal costs; prevention costs include
quality planning costs, employee training, supplier certification, new product reviews,
etc. Appraisal costs include inspection, test and equipment calibration, evaluation of
inventories, etc. The authors provide the details of the specific inputs and outputs
based on data from a case firm. For example, prevention costs = scheduled down time
* tons/hour (of production) * profit/ton. The two measures of quality – conformance
and performance – were chosen as most relevant to the case firm (as opposed to
broader conceptions of quality). Data were monthly costs and quality metrics from a
single manufacturing facility over a two-year period (thus the DMUs were monthly
data from the same firm). The article provides only sparse details, however it appears
that several separate DEA analyses were conducted such as quality performance as the

81
output; inputs were labor, raw material, energy, and capital. It is unclear why a DEA
model was not constructed that simply compared quality costs with quality
conformance and performance as this would seem to be the most useful comparison.
That is, what do you get (in terms of quality output) based on costs incurred to assure
quality?
Suk used DEA to measure the impact of TQM on hospital efficiency [99].
There were two outputs (inpatients and outpatients) and seven inputs (facilities and
beds as capital resources, supply costs as material resources, and senior managers/
physicians/ registered nurses, and other FTEs as labor costs). The model used was
input-oriented variable-returns-to-scale. Rather than considering TQM principles and
practices as inputs, the approach taken was to first determine efficient hospitals in
conventional terms (cost inputs and ‘product’ outputs) and then to use a factorial
experimental design with DEA efficiency as the dependent variable and hospital
characteristics (1 measure) and TQM implementation score as the two independent
variables. The measurement instruments developed by Saraph et al., Flynn et al., and
Ahire et al. (see Appendix A) were adapted for use in a questionnaire for calculating a
‘TQM score’ for each hospital (DMU). Results were analyzed via ANOVA. As with
the Mathiyalakan and Chung article described above, this research is presented here
primarily as an example of DEA studies related to TQM. The specific model tested
while of interest due to the use of DEA for examining TQM, is not directly relevant to
the research proposed here; the study examined the impact of ‘degree of TQM
implementation’ (conceived as a single measure) on efficiency as opposed to
82
examining the impact of extent of usage of specific TQM principles and practices on
quality and innovation performance. Thus the model tested is fundamentally different
than what is proposed here. Suk essentially asked what relation exists between
efficient firms (by traditional economic measures) and TQM. What is proposed here
asks, in essence, how efficiently organizations use quality inputs to generate quality
and innovation outputs.
Yoo published one of the few papers to use DEA to examine the impact of
specific TQM principles and practices on quality performance [85]. Nine TQM
critical success factors (i.e., TQM constructs) were considered for inputs: leadership
and organization for quality, strategic quality planning, information analysis, new
product development, process management, human resource management,
organizational involvement, environmental and safety management, and customer
satisfaction management. The output was quality performance (quality improvement
level compared to domestic companies and compared to foreign companies). The
Analytic Hierarchy Process (AHP) was used to assign relative importance weights to
the critical success factors (both input and outputs). Based on the results, strategic
quality planning, information analysis, organizational involvement, and environmental
and safety management were excluded due to having relatively small weights.
The AHP analysis was based on survey responses from the firms. The survey
questions were not provided in the paper and thus it is difficult to determine if the
weights reflect extent of use of TQM in each DMU or the respondent’s perception of
83
the importance of each principle. If it is the latter, this would be a significant
weakness to the paper; there could be a significant gap in what a firm states is the
importance of a TQM principle and the intensity or commitment to the use of that
principle. From the standpoint of assessing impact of TQM principles/ practices on
performance, it would be far more valuable to measure actual use of the principles and
practices within a company as inputs as opposed to perceptions of importance.
Aside from the limitations already discussed, another significant limitation for
this study was the author’s choice of output. ‘Improvement level’ says very little
about quality in the sense of conformance to specifications, durability, reliability, etc.
In fact, a company with very poor quality might report a large marginal gain in
improvement and yet still to have a long way to go. Conversely, for a company that
had already made great strides with past efforts might have a low improvement level.
Further, the choice to eliminate constructs that had small AHP weights seems
questionable. One must consider if the fact that a firm either places little emphasis on
an input (or perceives it as of minor importance) is cause for rejecting an input that
other research has validated as a key principle of TQM.
These limitations aside, a strength of the article is in using DEA to determine
efficient firms and then using the practices of these firms (i.e., their AHP weight on
each practice) as benchmarks for firms that were deemed ‘inefficient’ in their use of
TQM. Unfortunately, the authors do not discuss specific best practices; the primary
84
focus of the paper is on the appropriateness of the methodology for evaluating
efficiency of TQM implementation rather than the results of the analysis.
Forker et al. also used DEA to evaluate the impact of TQM on performance
[38]. Specifically, the research examined the impact of TQM on supply chain
performance. The researchers used a unique approach to examine a supply chain –
one customer firm was examined along with all of its major suppliers. Inputs were the
extent of implementation of TQM (using the instrument developed by Saraph et al.
described above and shown in Appendix A1) based on self-reported data related to
eight management practices (management leadership and quality policy, training,
product/ service design, supplier quality management, process management, quality
data and reporting, employee relations, and role of the quality department) for the
supplier firms. Five-point Likert scale input data for each of the eight constructs is
averaged to provide a single measure for each construct. The output for the model is
defective parts per million; these data are the actual quality performance data for each
supplier as reported by the customer firm. This use of objective data is a key strength
of the study. These data are inverted and normalized to values from zero to one to
avoid scaling issues.
Results of analysis via a simple linear model showed no significant
relationship between the extent of TQM implementation and quality performance.
The authors theorized that the small range of responses might have led to inability to
distinguish among firms. The authors proposed that structural (i.e., contextual)
85
differences between firms might lead to variation in efficiency in how TQM was
implemented in each of the firms. This hypothesis led to the decision to use DEA to
analyze the data. No details are provided on the DEA model chosen such as returns-
to-scale or input/ output orientation.
Large variations in relative efficiency appeared to confirm the results of the
regression analysis; there is a wide range in the efficiency values and thus perhaps
gaps in how TQM practices are implemented among differing supplier firms.
Stepwise regression was then used to examine the significance of TQM practices on
performance (defects) as well as interaction terms between the practices and a DMU’s
efficiency score. Results of this phase of the analysis showed that the quality
department had the largest role in assuring quality. The authors state that this finding
contradicts the exhortations of such quality gurus as Ishikawa and Crosby and state
that, “…these experts have claimed that quality is every employee’s responsibility and
that once that responsibility is adopted, the need for a quality department will
disappear. Even in an industry as advanced as electronics, the quality department is of
primary importance in assuring quality performance” [38]. Further, the significance of
interaction terms reinforced the notion that TQM practices vary from firm to firm.
The strengths of this article are in the broad conception of TQM practices and
consideration of the extent of use of these practices as inputs as well as on the use of
objective data (defects) for outputs. By that same token, a key weakness lies in the
narrow conception of quality performance. While the author recognizes that TQM
86
practices will vary firm to firm, a key source of this variability is likely differing
emphases on achieving specific quality outcomes (conformance, performance,
durability, customer satisfaction, etc.). With a one-output model like this, it is not
possible to identify benchmark firms and hence ‘best practices’ for anything beyond a
single measure of quality performance (defects).
Forker et al. also published a paper describing the use of DEA as an analytical
tool for benchmarking peer suppliers [84]. TQM practices, as quantified using the
measurement instrument developed by Saraph et al. (see Appendix A1) served as the
inputs. As with the previous study (discussed above), defective parts per million
served as the output measure. This paper also does not explicitly mention details of
the DEA model selected, though it appears the model was input-oriented. Results
were then tallied such that DMUs referenced most often by other DMUs were
determined to have the most broadly applicable TQM programs and thus could serve
as good benchmarks. This is a valuable conclusion given the wide variety of
approaches to implementing TQM. A firm looking for a good, ‘well rounded’ firm
could thus benefit from this approach. The authors suggest using cluster analysis to
examine the groupings to perhaps identify ‘niche’ approaches to implementing TQM.
This suggestion has merit in that this approach could be used when studying the
outputs of quality and innovation and thus testing the hypothesis that the approach to
implementing TQM will vary for firms emphasizing quality performance as opposed
to innovation performance and a ‘best practice’ cluster may well emerge for firms able
to do well on both measures. One result of the research is stated as, “…many
87
suppliers… achieved zero defects but with excessive expenditures on TQM inputs.
‘Best peer’ suppliers were able to achieve zero defects or very nearly zero
defects…with minimal outlays on quality management, producing high DEA
scores.” Hence the method was successful in identifying those firms able to focus
their TQM efforts vs. taking a ‘shotgun’ approach (i.e., those with ‘excessive
expenditures on TQM inputs).
Diaz-Balteiro et al. explored productive efficiency and innovation activity in
the Spanish wood products industry using DEA [81]. While this research does not
involve quality management, it is mentioned here given that the research involves
DEA for examining innovation performance (i.e., as an output). The analysis was
conducted by first using DEA to identify efficient firms (using relatively ‘traditional’
inputs and outputs) followed by logistic regression to explore correlations between
efficient firms and measures of innovation.
Inputs included employees, shareholder’s funds, and loans; outputs included
sales and profit before taxes. Both constant returns to scale and variable returns to
scale models were used to enable examination of scale efficiency. Results were
tabulated to show the total number of efficient firms with and without the various
measures of innovation: R&D expenditures and partnerships, patents, and product &
process innovations. Thus, it appears the data allowed for segregation of firms with,
for example, zero R&D expenditures to those with at least some nominal value
expended on R&D.
88
For logistic regression, efficient firms were coded one and inefficient were
coded zero. Inputs included R&D expenditures and R&D partnerships (a qualitative
variable between zero and five depending on the number of partnerships). Outputs
included patents, product innovations and process innovations. Product innovation
included, “…introduction of new and significantly improved good and/or services
with respect to their fundamental characteristics, technical specifications, incorporated
software or other immaterial components, intended uses, or user friendliness.”
Process innovation was a qualitative variable equal to:
• 1 if the firm adopted one of the two types of process innovation (introduction of new and significantly improved production technologies or new and significantly improved organizational and managerial changes);
• 2 if the firm adopted both types of process innovation; and
• 0 if the firm did not adopt any process innovation.
Results (from both DEA and regression) showed a lack of links between
efficiency and innovation. In fact, significant correlations were negative. For
example, efficiency was inversely correlated with patents and R&D expenditures.
Again, this paper is presented here primarily because of the use of DEA for examining
innovation. However, the model tested is interesting in that the premise was to first
find firms efficient in an economic sense, and then determine correlations with
innovation. It would be interesting to conduct the analysis again but use inputs
specifically intended to lead to innovation as an output. This is not to suggest the
model chosen was inappropriate as comparing ‘innovation inputs’ to outputs was not
the authors’ intent.
89
In summary, few studies have been published exploring quality management
using DEA. Of the articles reviewed here, only two authors (Forker et al. and Yoo)
used quality management principles as the inputs; other authors have used more
‘traditional’ inputs such as costs. Outputs have included a variety of items such as
participants’ ‘satisfaction with quality circles’, number of hospital patients, or sales
and profit data (rather than quality outputs) or narrowly defined quality outputs such
as quality improvement or defect rates. The latter situation is the case even for those
authors (i.e., Forker et al. and Yoo) that modeled quality management inputs in broad
terms.
While there are clear advantages to using objective measures for inputs (e.g.,
labor and raw material costs) and outputs (e.g., product and sales revenue) when using
DEA, there are challenges with respect to accurately modeling quality management
with such measures. As has been discussed previously, quality management is
multidimensional and involves both subjective and objective measures. Further, for
the context of the research proposed here, one must consider what organizations are
aiming to achieve via investing in a quality management program; ‘quality-related’
outputs are presumably a desired output. Thus, it is suggested here that the most
appropriate input-output model for quality management considers quality management
inputs and quality outputs; and if quality management inputs are broadly defined,
quality outputs should be broadly defined as well. However, given widely varying
approaches to implementing quality management systems and overlap with certain key
principles and practices between quality management and innovation management

90
(e.g., customer focus and the use of quality tools in product design), one might also
pose the question, do organizations also achieve innovation performance, in addition
to quality performance, as an output of a quality management system? While no
studies have reported the use of DEA to address this question, there are several studies
that have explored relationships between quality management and innovation
performance.
Relationships between Quality and Innovation
The body of literature investigating the relationships between quality and
innovation is much more recent and far less extensive than the literature exploring
relationships between quality and other measures of organizational performance. As
with research examining quality and organizational performance, results have been
mixed regarding the ‘quality – innovation connection.’ Prior to discussing this
research, however, literature that has explored similarities and differences between
quality and innovation is examined.
Kanji put it most succinctly in proposing that TQM and innovation were
aligned – both are focused on delighting customers and further, suggested that
successful innovation depends on TQM [34]. Though the premises are not tested, the
author proposes that the key link may be to integrate long and short-term strategies.
In contrast, Samaha proposes that TQM will diminish avenues for innovation
given that it reinforces incremental vs. breakthrough innovation [31]. The author
91
states “Quality is doing things better; innovation is doing things differently.”
Benchmarking is seen as ‘perilous’ with respect to innovation in that benchmarking is
a means to ‘catch up’ to the competition. TQM prevents thinking outside the box and
provides negative reinforcement for risk-taking. These premises are not tested in the
paper. It is suggested that innovation be embraced as part of the quality effort.
A contingency perspective for TQM is presented by Sitkin et al. [24]. It is
proposed that differences in application of key TQM principles are based on degree of
contextual uncertainty – low levels of uncertainty are amenable to a focus on control
(i.e., TQC, Total Quality Control) in TQM whereas higher levels of uncertainty lead to
the need to emphasize TQL – Total Quality Learning. While the focus of the study is
not strictly on the relationship to innovation, the connection between innovation and
learning is alluded to by stating that firms must balance stability and reliability (i.e.,
control) with exploration and innovation (i.e., learning). The principles of TQC and
TQL are summarized in Table 3.
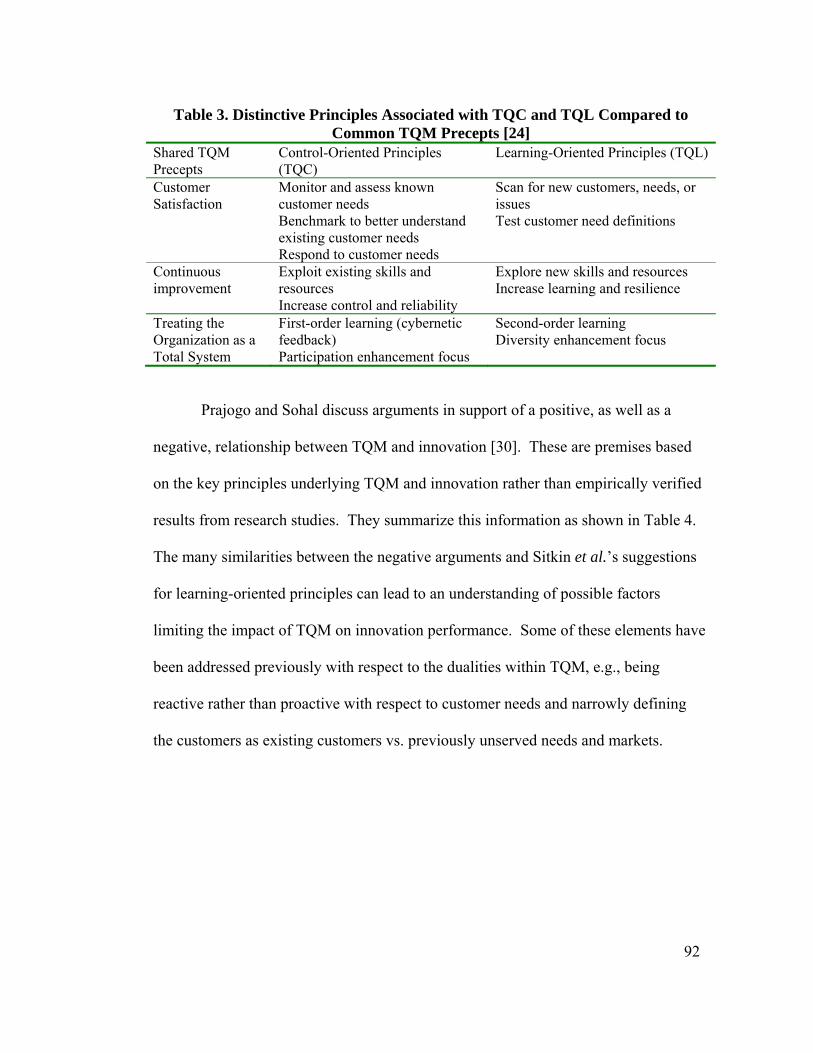
92
Table 3. Distinctive Principles Associated with TQC and TQL Compared to Common TQM Precepts [24]
Shared TQM Precepts
Control-Oriented Principles (TQC)
Learning-Oriented Principles (TQL)
Customer Satisfaction
Monitor and assess known customer needs Benchmark to better understand existing customer needs Respond to customer needs
Scan for new customers, needs, or issues Test customer need definitions
Continuous improvement
Exploit existing skills and resources Increase control and reliability
Explore new skills and resources Increase learning and resilience
Treating the Organization as a Total System
First-order learning (cybernetic feedback) Participation enhancement focus
Second-order learning Diversity enhancement focus
Prajogo and Sohal discuss arguments in support of a positive, as well as a
negative, relationship between TQM and innovation [30]. These are premises based
on the key principles underlying TQM and innovation rather than empirically verified
results from research studies. They summarize this information as shown in Table 4.
The many similarities between the negative arguments and Sitkin et al.’s suggestions
for learning-oriented principles can lead to an understanding of possible factors
limiting the impact of TQM on innovation performance. Some of these elements have
been addressed previously with respect to the dualities within TQM, e.g., being
reactive rather than proactive with respect to customer needs and narrowly defining
the customers as existing customers vs. previously unserved needs and markets.

93
Table 4. Summary of Conflicting Arguments on the Relationship Between TQM and Innovation [30]
TQM Elements Positive Arguments Negative Arguments Customer focus Customer focus:
• will encourage organizations to be innovative because they have to seek a better way to meet and exceed customers’ requirements
• will provide a clear focus for innovation by linking innovation with customers’ needs
Customer focus: • could lead organizations to be reactive in
responding to customers’ needs • may prevent organizations from exploring
unserved needs and markets • may prevent organizations from developing
radical new products (first-mover) because of its inherent risk-avoidance philosophy
• could not help organizations to cope with turbulence and discontinuity of the market
Continuous improvement
Continuous improvement: • will encourage change,
innovation, and creative thinking in how work is organized and conducted
Continuous improvement: • emphasis of efficiency would minimize, if
not eliminate, the availability of slack resources that are required for innovation
• stress on incremental improvement could lead teams to work on unambitious goals and derive solutions which are not novel
• is only workable when the underlying system of production is stable and repetitive, and not in a particular environment where there is a high degree of uncertainty
• the establishment of a regulatory standard could inhibit innovation because it reduces the ambiguity of a task that is necessitated to enforce innovation
• could also result in routinization and rigidity of activities that will cause an organization to lose its flexibility
• only supports single-loop learning and not double-loop learning
Teamwork, empowerment and involvement
• Empowerment should make people feel they have a certain degree of autonomy, are less constrained by technical or rule-bound aspects, and self-efficacious in doing their work, which will make them innovative
• Cross-functional teamwork is one of the most effective channels of communication, and communication is recognized as the primary determinant in organizational innovation
• Whilst conceptually empowerment and involvement are very much congruent with innovation, in practice, workers are usually “empowered and involved” to deal only with execution and small scale of improvement
• The cultural tendency toward group working which has contributed towards stressing total quality control to a certain degree will inhibit independent entrepreneurship and individual creativity, resulting in a detrimental effect upon radical innovations and inventions
94
There are thus, good reasons to believe there may be positive, as well as
negative correlations between quality management practices and innovation
performance. Given the importance of both quality and innovation to organizational
performance, the question of relationships between these two fields is highly relevant
for managers. Further, given the investments most organizations have made in quality
management, it would be valuable for managers to know which, if any, specific
aspects of quality management lead to enhanced innovation performance. While the
preceding studies have proposed relationships, the studies did not test these relations.
Hence, attention is now directed to the literature that has empirically examined these
relations.
Lin and Lu explored a causal relationship between quality and innovation in
examining product innovation in the automotive industry [80]. Number of patents
served as the metric for innovation and problems-per-100 vehicles served as the
measure of quality. Regression analysis was used to model product quality as the
independent variable and innovation as the dependent variable. Results showed that
automakers actively engage in product innovation if they produce high-quality
products. The authors thus proposed that product quality determines product
innovation. The key limitation to this research was the unidimensional view of both
quality and innovation.
Bossink conducted a case study to examine the use of specific quality tools for
an innovative homebuilding project in the Netherlands [100]. Results suggest a
95
supportive function of quality in the management of innovation. Further, it is
suggested that quality tools are used implicitly and sometimes explicitly to manage
innovation, for example, benchmarking, customer satisfaction measurement, and
teams are used in both quality as well as innovation management. A key finding was
that measurement of customer satisfaction contributed to the initiation of innovation;
this might be seen as more of a proactive approach to customer focus. One limitation
of the study was in accurately identifying the use of specific quality tools. That is, 29
‘quality tools’ were examined for how they were used in the innovation project. Some
of these tools were in fact ‘concepts’, as the authors acknowledge in the caption of the
table listing the items. Thus, while one may be able to state with some certainty
whether or not a specific tool was used in a situation, it is less clear how to identify the
use, or lack of, of a broad concept or philosophy. Further, the authors merely state
whether or not a tool was used and in what stage of a project (creating innovation
context, supervising innovation processes, etc.) without providing detail as to how the
tools were used.
McAdam et al. examined organizational progression from quality to
innovation [23]. The European Foundation for Quality Management’s (EFQM)
European Quality Model served as the model for quality management and the Centrim
innovation model (Centre for Research in Innovation Management, University of
Brighton) served as the model for innovation. The authors developed a list of
assumptions underlying TQM (e.g., continuous improvement, cause and effect/
enablers and results, limited empowerment, etc.) and innovation (continuous renewal,
96
new ideas not extrapolation of past, proactive activity, etc.). Using the main
categories of the EFQM and Centrim models, a matrix was developed to identify if
each category was related to TQM, innovation, or both. Fifteen firms were then
evaluated based on the EFQM (quality) and Centrim (innovation) criteria and given a
score for innovation and continuous improvement. The authors report that there were
significant similarities between firms that got high scores on both quality and
innovation. The authors state that Total Quality “…lays the foundation for a cultural
environment that encourages innovation.” A key limitation of the study was in
narrowly defining Total Quality as practices focused on continuous improvement.
Singh and Smith explored “…whether TQM can be used as a vehicle for
inculcating innovation” [33]. The authors adapted their TQM measurement
instrument (see Appendix A4, [70]) to serve as the key constructs for measuring TQM
implementation. The four measures of innovation discussed previously included:
innovative processes/ products/ services have been commercialized; R&D leads to
development of world-class techniques/ technologies; the rate of innovation of new
operational processes; and the rate of introduction of new products and services.
Firms were surveyed and asked to evaluate their performance relative to the
TQM and innovation criteria. Structural equations modeling (SEM) was used to
analyze the structural model that at its essence simply hypothesized that TQM
(conceived as a series of seven constructs) leads to innovation. The authors concluded
there was insufficient evidence to link TQM and innovation and suggested “It could
97
well be that the TQM constructs and innovation are related in a more complex way.
Indeed, business excellence frameworks… postulate that the constructs are inter-
related in complex ways.” This lends further support to the use of DEA in that these
interrelations would not impact a DEA model. Further, an unexpected result of the
test for construct validity in the research was that the construct Product/ Process
Management led to poor fit of the model; use of SPC in particular was eliminated from
the model. Given that product/ process management are key factors in TQM, and SPC
is a key tool used, the reason for this poor fit should be explored further. Lastly, the
model the authors used appears to be inconsistent in one instance with respect to
‘cause and effect.’ Specifically, the independent variables proposed are related to
quality management; however one of the dependent variables is attributed to R&D as
the cause. Perhaps the intent was to understand if TQM practices applied in R&D
enhanced innovation performance. At the least, this inconsistency may have led to
inconclusive results.
In addition to proposing a list of arguments for both positive and negative
relationships between TQM and innovation (Table 4), Prajogo and Sohal proposed
that the key differences in how TQM principles were applied in a firm were related to
differences in external context (business environment), organizational strategy, and
organizational culture [30]. For example, following arguments from Sitkin et al., a
stable external environment might lead to a control and hence ‘quality focus’ for a
firm, whereas a more volatile business environment might lead a firm to emphasize
innovation [24]. Organizational culture (e.g., mechanistic vs. organic) could be
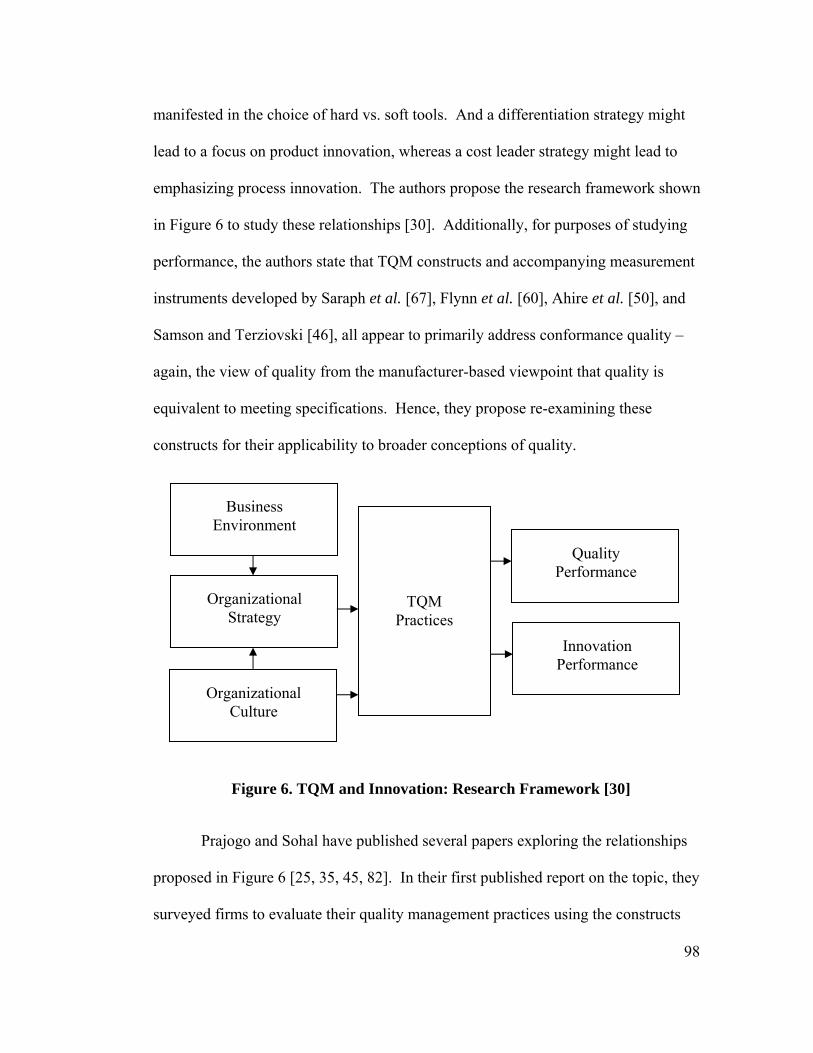
98
manifested in the choice of hard vs. soft tools. And a differentiation strategy might
lead to a focus on product innovation, whereas a cost leader strategy might lead to
emphasizing process innovation. The authors propose the research framework shown
in Figure 6 to study these relationships [30]. Additionally, for purposes of studying
performance, the authors state that TQM constructs and accompanying measurement
instruments developed by Saraph et al. [67], Flynn et al. [60], Ahire et al. [50], and
Samson and Terziovski [46], all appear to primarily address conformance quality –
again, the view of quality from the manufacturer-based viewpoint that quality is
equivalent to meeting specifications. Hence, they propose re-examining these
constructs for their applicability to broader conceptions of quality.
Figure 6. TQM and Innovation: Research Framework [30]
Prajogo and Sohal have published several papers exploring the relationships
proposed in Figure 6 [25, 35, 45, 82]. In their first published report on the topic, they
surveyed firms to evaluate their quality management practices using the constructs
Business Environment
Organizational Strategy
Organizational Culture
Quality Performance
Innovation Performance
TQM Practices
99
developed by Samson and Terziovski shown in Appendix A5 [46]; however the
Information and Analysis construct was adapted to better reflect the MBNQA
(‘Baldrige Award’) criteria for this topic. Specifically, questions were added on
company strategy in measuring performance, availability of data and information
about performance, and use of information in decision-making processes conducted by
senior management. Quality performance was measured using constructs developed
by Ahire et al. [50] and thus included multiple dimensions of quality (reliability,
performance, durability, and conformance to specifications). Innovation performance
was measured using the constructs shown in Table 2 above.
Structural equations modeling (SEM) was used to examine the simultaneous
relationship between TQM and product quality performance, product innovation
performance, and process innovation performance. Results showed that TQM
significantly and positively relates to quality performance as well as innovation
performance. As would be expected, the relation between TQM and quality was
stronger than the relation between TQM and innovation. Further, there are significant
correlations between product quality, product innovation, and process innovation;
though the relation between product quality and product innovation was weaker than
the other two correlations. The authors suggested the possibility of ‘cross-
fertilization’ between quality and process innovation performance; process innovation
may mediate the relationship between product quality and product innovation. This
suggestion seems likely in that, forest industry researchers have shown that process
automation technology such as scanning systems (i.e., one form of process innovation)
100
is often pursued with the purpose of reducing variability, i.e., improving the ‘product
conformance’ dimension of quality [52, 101, 102]. A final point is offered that,
“…care needs to be taken before claiming that TQM in its own right is sufficient for
achieving high innovation performance…” and further that “…quality management is
a prerequisite for innovation management…” This caution proved valid in that results
of this study were contradicted in a later paper by these authors [35].
Prajogo and Sohal also conducted a case study in an Australian firm to
examine the transition from TQM to ‘Total Innovation Management’ [82]. One key
finding in this study is that this transition resulted in shifting many of the tools of
quality management from downstream operations (i.e., manufacturing processes) to
upstream operations (i.e., design and development). This again addresses one of the
key principles in TQM – the emphasis on total, that is, implementing the practices
company-wide. Though this was the intent of TQM from the very beginning, the
literature seems to indicate that many companies have been slow to realize (or at least
implement) this principle. The authors further state that the transition in the case study
firm resulted in customer relationship management shifting from reactive (responding
to customer complaints) to being proactive as well as to shifting its focus from direct
customers to end users. A final conclusion of interest was the potential ‘chain
reaction’ between process innovation and product innovation; the firm implemented
automation (process innovation) to improve product quality and was then ‘forced’ to
innovate new products that were suited to the technology. The primary limitation of
101
this study was in the use of a single firm for the case study and thus no ability to use
cross-case comparisons for validation.
Prajogo and Sohal extended their research exploring relationships between
quality management and innovation performance by studying the impact of integration
of TQM and Total Innovation Management (TIM) on performance [35]. TIM is
defined to include technology management and R&D management. Citing Benner
and Tushman [103], the authors highlight the importance of organizations developing
capacities to simultaneously balance exploitation and exploration. Exploitation is
defined as an organization’s capability to maximize existing resources for efficiency
and productivity and hence is at its essence the focus of quality management.
Exploration involves maximization of capabilities to develop new skills and resources,
and hence is the focus of innovation management.
As with previous research by these authors, firms were surveyed to determine
their performance with respect to quality and innovation; the constructs used for these
measures were the same as in prior papers (described above), however new constructs
(shown in Table 5) were developed to evaluate technology and R&D management.
The new constructs were tested and shown to be reliable.
Structural equations modeling was used to examine the relationships. Findings
for relations to quality performance agreed with those from previous research by these
authors – TQM showed strong predictive power over quality performance. However,
the results contrasted with their prior research on relationships with innovation – TQM
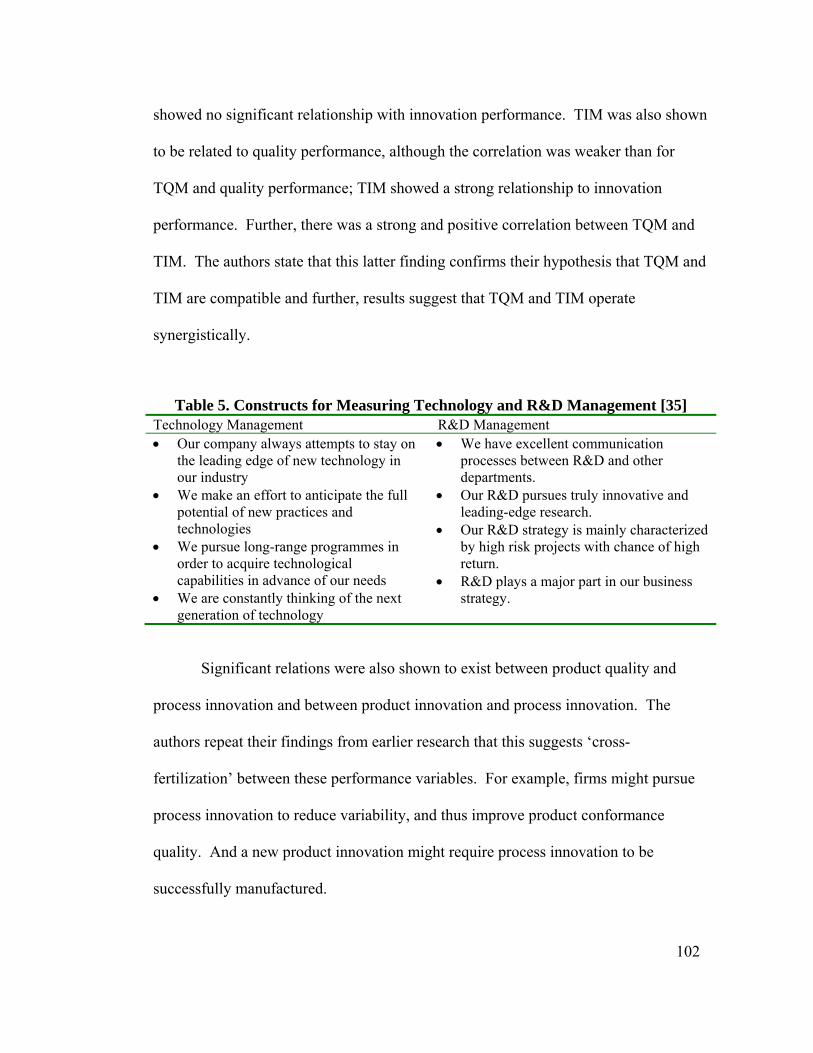
102
showed no significant relationship with innovation performance. TIM was also shown
to be related to quality performance, although the correlation was weaker than for
TQM and quality performance; TIM showed a strong relationship to innovation
performance. Further, there was a strong and positive correlation between TQM and
TIM. The authors state that this latter finding confirms their hypothesis that TQM and
TIM are compatible and further, results suggest that TQM and TIM operate
synergistically.
Table 5. Constructs for Measuring Technology and R&D Management [35] Technology Management R&D Management • Our company always attempts to stay on
the leading edge of new technology in our industry
• We make an effort to anticipate the full potential of new practices and technologies
• We pursue long-range programmes in order to acquire technological capabilities in advance of our needs
• We are constantly thinking of the next generation of technology
• We have excellent communication processes between R&D and other departments.
• Our R&D pursues truly innovative and leading-edge research.
• Our R&D strategy is mainly characterized by high risk projects with chance of high return.
• R&D plays a major part in our business strategy.
Significant relations were also shown to exist between product quality and
process innovation and between product innovation and process innovation. The
authors repeat their findings from earlier research that this suggests ‘cross-
fertilization’ between these performance variables. For example, firms might pursue
process innovation to reduce variability, and thus improve product conformance
quality. And a new product innovation might require process innovation to be
successfully manufactured.
103
Prajogo and Sohal conclude that technology/ R&D management should be
used in harmony with TQM. The authors proposed two examples where principles of
TQM might be integrated with TIM:
• Customer focus – organizations should strive to balance efforts to meet current
customer needs with R&D focused on meeting unserved needs, i.e., more of a
proactive approach to customer focus. Similarly, organizations should serve
customer needs through product innovation that is technology push rather than
market pull.
• Process management – organizations should strive to balance control and
continuous improvement with technology management that is more focused on
radical innovation. No further details are given regarding this point.
The practical implications of this research are critical to identifying best
practices for quality management that lead to both quality and innovation
performance. The authors propose two approaches to integrating TQM and
technology/ R&D management. It is important to note that the proposed changes are
seen from the perspective of the fundamental TQM principles of customer focus and
process management. This, combined with the authors’ statement that “...quality
management is the ‘pre-requisite’ of innovation management”, suggests that one may
conceive of these changes as being primarily an adaptation of the existing quality
management system. That is, assuming a firm has an existing technology
management and R&D program, these are presumed sufficient to generate innovation
104
performance; however, shifting the focus of the TQM program will serve to better
align and integrate quality management with innovation management.
Hoang et al. explored the relationships between TQM and innovation, and
went further to address the impacts of specific TQM practices [104]. Based on a
review of the literature, eleven TQM constructs were developed:
1. Top management commitment 2. Employee involvement 3. Employee empowerment 4. Education and training 5. Teamwork 6. Customer focus 7. Process management 8. Information and analysis system 9. Strategic planning 10. Open organization 11. Service culture
These constructs were selected as they, “…represent the hard and soft aspects
of TQM…”, cover quality award criteria, and are considered critical practices in TQM
for both service and manufacturing organizations. Thus for the former, there is
alignment with the idea of one of the primary dualities presented here for TQM – hard
vs. soft aspects. The authors do not explicitly define how the constructs were
operationalized, however the authors mention the use of questionnaires and references
are made to prior authors such as Samson and Terziovski and Ahire et al. Thus it
must be assumed that self-reported perceptual data, as has been done by these and
105
other researchers, were used to quantify intensity of use of specific TQM practices in
respondent firms.
Innovation was measured in terms of:
1. Number of new products/ services the firm had developed and commercialized over the last three years; share of current annual turnover that sales of these innovation products/ services had generated and
2. Level of newness using a modified version of the scale developed by
Johannessen et al. ([76], see Appendix B1). The modifications included combining new product and new service into one dimension and rewording other dimensions. The resulting constructs for innovation included: • Entirely new product or new service • Use of new materials or intermediate products • New functional solution for an existing product or additional service based
on an existing service • New method of production • Entering a new market • New source of supply • New ways of organizing (re-arranging the company’s human resource)
Respondents rated their firm on a scale from one to five to represent the degree
to which their firm had made changes within the last three years to any of these items
within their firm. By considering only changes within the firm, using the arguments
proposed by Johannessen et al., the authors implicitly considered innovations that
were more incremental in nature (i.e., by defining ‘newness’ as new to the firm) rather
than more radical innovations new to the industry.
A pilot study was conducted to ensure the internal consistency and reliability
of the constructs. Firms to be surveyed were selected based on their registration to
106
ISO 9001. This is a potential limitation of the study in that such firms may not be
representative of the broader population; thus, the results may not be generalizable.
The results of the pilot study suggested retaining all constructs with the exception of
Strategic Planning. Following the full survey, confirmatory factor analysis (CFA) was
used to examine construct validity. As a result, five items (total) in the Teamwork,
Process Management, and Information and Analysis measures were removed due to
poor loading on their respective latent variables (constructs).
CFA was also used to study the relationship between TQM and innovation.
Specifically, the relationship examined was the impact of TQM (as measured by 11
constructs) on level of newness (as measured by seven constructs), number of new
products, and share of current year sales from new products. Results showed that
TQM has a strong and positive relationship with level of newness and number of new
products and services developed. However there was no relationship between TQM
and the share of current year sales contributed by the new products.
Finally, in order to explore the relationship between specific TQM practices
and innovation, Hoang et al. used CFA to examine all possible relationships between
the 11 TQM constructs and level of newness as well as number of new products.
Results showed significant problems with multicollinearity within the TQM
constructs. To address this problem, the authors developed composite measures:
Leadership and People Management (including the constructs for top management
commitment, employee involvement, and employee empowerment) and Process and
107
Strategic Management (including the constructs for process management, information
and analysis system, and strategic planning). It is not clear if the latter construct was
an error in that the authors had stated earlier that strategic planning had been removed
following the pilot study to check for internal consistency and reliability. The authors
report that Leadership & People Management relates to the human aspects of TQM
while Process & Strategic Management reflects the mechanistic aspects of TQM.
Using the composite measures, the analysis revealed that Leadership & People
Management was significantly related to level of newness and Open Organization
(item number ten in the list of constructs, i.e., apparently not included as a composite
measure) was significantly related to number of new products and services. Only
Education & Training and Process & Strategic Management had significant
relationships with both measures of innovation. The authors concluded that not all
TQM factors have an impact on innovation performance.
In summary, several authors have proposed positive as well as negative
relations between quality and innovation based on the shared precepts of both fields
[24, 30, 31, 34]. For example, customer focus, continuous improvement, or teamwork
can either negatively or positively impact innovation performance depending on how
they are viewed by, and implemented in, an organization.
Several authors have conducted empirical research exploring relationships
between quality and innovation [23, 25, 33, 35, 45, 80, 82, 100]. Results have been
108
mixed. There are positive correlations such as a supporting role for quality in the
management of innovation, suggestions that TQM lays the foundation for innovation,
and straightforward assessments that TQM significantly and positively impact quality
and innovation performance. However, Singh and Smith reported insufficient
evidence of a relationship between quality and innovation - perhaps due to a more
complex model [33].
Prajogo and Sohal may have addressed this ‘more complex model’ by
including constructs for TIM (total innovation management – defined as technology
management and R&D) as inputs to their model [35]. In prior research, Prajogo et al.
reported that TQM significantly and positively impacted quality and innovation
performance [25, 45, 82, 105]. However, when constructs for R&D and technology
management were included in the model there were no significant correlations
between TQM and innovation performance, although there were significant
correlations between TQM and TIM. The authors describe the synergy between
quality management and innovation management and hence the importance of
integrating principles and practices within the two fields. As discussed above, the
authors’ proposed approaches to integration of TQM and TIM may be viewed from
the standpoint of how to adapt TQM principles and practices for better alignment with
existing approaches to innovation management.
Table 6 below summarizes the literature exploring relationships between
quality and innovation. Those authors that proposed relationships (Kanji [34], Samaha

109
[31], Sitkin [24], Prajogo and Sohal [30]) but did not empirically test the relationships,
are not shown in the table.

110
Table 6. Summary of Literature Exploring Relationships between Quality and Innovation
Authors Context Research method Findings Limitations
Lin and Lu [80]
Automotive (global)
Regression (innovation as dependent variable; quality as independent variable)
Automakers engage in product innovation if they produce high-quality products (i.e., product quality determines product innovation)
Uni-dimensional measures of quality and innovation
Bossink [100]
Innovative homebuilding project (Netherlands)
Case study (examination of use of quality tools in project)
Supportive function of quality in management of innovation; customer satisfaction measurement contributes to innovation
Unclear how tool usage was determined (some ‘tools’ were broader concepts); no mention of how tools were used
McAdam et al. [23]
Small organizations (Ireland)
Score firms using European Foundation for Quality Management and Centrim Innovation models
Total Quality lays foundation for innovative culture (similarities between firms getting high scores on both quality and innovation)
Total Quality narrowly defined as continuous improvement
Singh and Smith [33]
Manufacturing (Australia)
Survey, Structural Equations Modeling
Insufficient evidence to link TQM and innovation; may be more complex relations
Product/ Process Management construct led to poor fit – SPC eliminated from model (though this is a key tool of quality management); Independent variables are for quality mgmt. but one dependent variable related to R&D
Prajogo and Sohal [25]
Organizations – mfg and service (Australia)
Survey, Structural Equations Modeling
TQM significantly and positively related to quality and innovation performance; significant correlations between product quality, product innovation, and process innovation; possible ‘cross-fertilization’ between quality and process innovation performance
Focus on relationships vs. specific practices
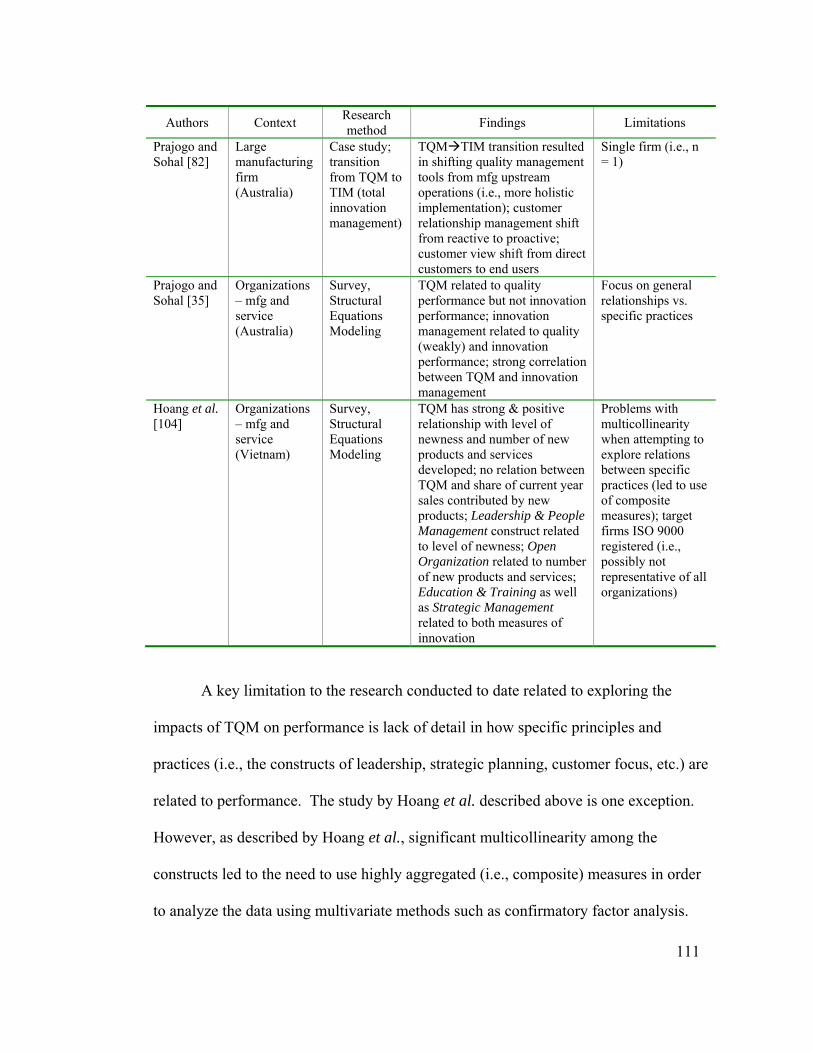
111
Authors Context Research method Findings Limitations
Prajogo and Sohal [82]
Large manufacturing firm (Australia)
Case study; transition from TQM to TIM (total innovation management)
TQM TIM transition resulted in shifting quality management tools from mfg upstream operations (i.e., more holistic implementation); customer relationship management shift from reactive to proactive; customer view shift from direct customers to end users
Single firm (i.e., n = 1)
Prajogo and Sohal [35]
Organizations – mfg and service (Australia)
Survey, Structural Equations Modeling
TQM related to quality performance but not innovation performance; innovation management related to quality (weakly) and innovation performance; strong correlation between TQM and innovation management
Focus on general relationships vs. specific practices
Hoang et al. [104]
Organizations – mfg and service (Vietnam)
Survey, Structural Equations Modeling
TQM has strong & positive relationship with level of newness and number of new products and services developed; no relation between TQM and share of current year sales contributed by new products; Leadership & People Management construct related to level of newness; Open Organization related to number of new products and services; Education & Training as well as Strategic Management related to both measures of innovation
Problems with multicollinearity when attempting to explore relations between specific practices (led to use of composite measures); target firms ISO 9000 registered (i.e., possibly not representative of all organizations)
A key limitation to the research conducted to date related to exploring the
impacts of TQM on performance is lack of detail in how specific principles and
practices (i.e., the constructs of leadership, strategic planning, customer focus, etc.) are
related to performance. The study by Hoang et al. described above is one exception.
However, as described by Hoang et al., significant multicollinearity among the
constructs led to the need to use highly aggregated (i.e., composite) measures in order
to analyze the data using multivariate methods such as confirmatory factor analysis.
112
Hence the ability to examine impact of specific TQM principles on performance is
limited. Given the multitude of demands placed on managers, it would be most useful
to know which areas of emphasis are most likely to lead to improved quality and
innovation performance as opposed to simply knowing whether or not TQM (as an
integrated set of practices), or in a best-case scenario, highly-aggregated sets of TQM
principles, positively impact performance.
Gaps in the Literature
The preceding review of the literature leads to identification of several
significant gaps, including:
1. The research exploring the impact of quality management on both quality and innovation performance is sparse;
2. Much of the published studies do not adequately address the multidimensional
nature of both quality and innovation; and
3. Research has focused on exploring relationships between TQM (often as a single construct) and organizational performance rather than the individual quality management principles and practices; further the focus has been on relationships rather than best practices.
The first point regarding the paucity of research discussing the ‘quality-
innovation connection’ is not surprising if one accepts the premise that organizations
have only recently begun to enter a transitional phase from a focus on quality to a
focus on both quality and innovation. If, as some experts have suggested, quality is a
necessary but insufficient condition for organizational competitiveness, and innovation
is the ‘next competitive frontier’, then successful organizations must focus on
113
managing for both outputs. Based on the literature reviewed here, the importance of
the topic was presented as early as 1996; however the majority of the literature
exploring the relationships between quality and innovation has been published in the
last ten years. This suggests the topic is timely and that there are opportunities for
further exploration.
Regarding the second point, many researchers have discussed the
multidimensional nature of quality and innovation. However, a significant portion of
the literature examining quality performance has conceived of quality primarily from
the perspective of conformance to specifications, e.g., product defect rates. Innovation
performance has often been measured via metrics such as number of patents or new
products released. Measuring quality and innovation too narrowly fails to account for
the contingency approach by which firms with differing strategies, cultures, and
contexts pursue the various dimensions of quality and innovation.
Further, in discussing the dualities within TQM above (Figure 3), the research
suggests that many firms have focused on a narrow conception of TQM, e.g., the use
of ‘hard’ tools for process improvement in manufacturing, rather than true Total
Quality Management. Measurement instruments developed to assess the extent of
implementation of TQM in organizations have implicitly addressed the use of both
hard and soft tools; however it is less clear if elements of internal vs. external focus or
scope of implementation are effectively addressed. In particular, customer focus has
been vaguely defined such that it is not clear if it is being addressed reactively or
114
proactively. This may be a critical distinction from the standpoint of innovation
performance.
Also with respect to exploration of relationships between quality management
and performance, there is a significant gap in connecting specific elements of quality
management to performance. TQM has often been measured as a broad construct
composed of factors related to leadership, people management, process management,
etc. Thus, researchers have been able to determine the presence and significance of
relationships between TQM (as a broad construct) and innovation, however little
attention has been given to relationships between specific TQM practices and
performance. Part of the challenge in doing so has been the limitations of the research
methods to accommodate multicollinearity among factors. A common approach to
address multicollinearity is to combine correlated factors into composite factors;
however highly-aggregated factors make it difficult to determine where to focus
efforts for improvement.
A final gap in the literature is identification of best practices. Given the
importance of benchmarking as a practice within TQM, it seems logical to benchmark
TQM practices themselves. In this case, benchmarking would be used to identify
firms that are most efficiently using quality management practices to achieve superior
quality and innovation performance. The author is not aware of any research to-date
that has sought to identify such firms and their practices. As with multicollinearity,
the research methods that have been used in existing studies have been suited to
115
testing theory and establishing relationships rather than identifying best practices.
Exceptions have been two studies discussed previously that used case studies ([82,
100]); however again, the emphasis on these studies was not explicitly in the
identification of best practices.
In summary, organizations today must manage for quality and innovation
simultaneously; quality remains a key driver of competitiveness and innovation is
widely seen as the next competitive frontier. Much of the existing literature does not
fully account for the multidimensional nature of both quality and innovation and does
not address approaches to implementing TQM (e.g., implementation company-wide
and proactive customer focus) that appears to have potential to lead to enhanced
performance, particularly with respect to innovation. Further, there is a need to
identify benchmark organizations from which managers can learn best practices for
simultaneous achievement of quality and innovation.
116
Chapter 3. Research Methods
The primary research question is: What are the best practices in quality
management that lead to quality and innovation performance? More specifically,
three propositions are presented based on the review of literature on quality and
innovation. These propositions address the TQM dualities described previously, i.e.,
how varying emphases and extent of implementation of TQM impact performance.
Specifically:
• Proposition 1: Firms that emphasize a combination of hard and soft factors of TQM outperform (with respect to quality and innovation performance) firms that emphasize primarily the hard factors.
The definitions of ‘hard’ and ‘soft’ developed and tested by Lewis et al.
[48] were used to determine varying emphases in firms studied here. A firm
may provide evidence of emphasis by being able to describe in some detail
their approach to a specific factor such as how and where they use analytical
tools related to process management (i.e., hard tools) or their approach to
obtaining customer feedback (a soft factor). Details of how these factors were
assessed are described below.
• Proposition 2: Firms that implement TQM companywide outperform (with respect to quality and innovation performance) firms that have a more narrow focus.
Evans and Lindsay [2] and McAdam [23] provide detail on how this
distinction may be evaluated. In particular, a companywide implementation of
TQM includes emphasis on all three of the fundamental principles of TQM as
presented by Evans & Lindsay: process focus/continuous improvement,
customer focus, and participation & teamwork (Figure 2). In short, absence of
117
evidence of emphasis on any of the three principles, suggests a narrower focus
and conversely, evidence of emphasis on all three principles suggests a wider
focus. As with proposition 1, a firm may provide evidence of emphasis on any
of the principles by being able to describe their approach to specific practices
within the principle. Said another way, a firm might discuss at length their
approach to process management via statistical monitoring tools. At the same
time, if the firm were unable to provide examples of practices related to
customer feedback and/or satisfaction as well as how employees participate in
decision-making, this would serve as one piece of evidence that the firm had a
narrow focus (process focus, in this case) for their TQM efforts.
• Proposition 3: Firms that have both an internal and an external focus outperform (with respect to quality and innovation performance) firms with primarily an internal focus.
As stated previously, internal vs. external focus manifests itself in how
broadly a firm envisions its context and its approach to customers. In short, a
company with an internal focus sees the firm as a closed system. The primary
concerns are related to efficiency, continuous improvement, and participation
and teamwork; customers are seen as solely those entities that purchase the
firm’s products. As described by Sitkin et al., an internally-focused firm seeks
to satisfy existing customers and is reactive with respect to customer needs
[24]. By contrast, a firm with an external focus views the firm as an open
system; customers are more broadly defined as ‘stakeholders’ and include not
merely those entities that purchase the firm’s products, but also end consumers,
the local community, and the environment. Firm that are more externally
118
focused proactively seek to educate customers about latent needs and strive to
reach new customers. As with the two previous propositions, evidence to
support whether a firm has an internal focus or both internal and external, can
be found in how the firm talks about its practices. For example, in response to
a question such as “how do you obtain feedback from customers?”, an
internally-focused firm may either be unable to answer the question or might
state something suggesting that they primarily respond to complaints. By
contrast, an externally-focused firm will be able to describe a proactive process
for maintaining contact with customers.
Figure 7 is a flow diagram for steps taken to address the research questions
above. Details of each step are described below.

119
1. Adapt measurement instrument
An existing measurement instrument that has been tested and validated was
adapted to measure both ‘inputs’ (extent of implementation of TQM) and ‘outputs’
(quality and innovation performance). Details of the measurement instrument are
described below.
Extent of implementation of TQM in a firm and performance (quality and
innovation) were measured via the instrument developed and used by Prajogo and
Sohal [35]; these authors in turn adapted the instrument originally developed and
1. Adapt measurement instrument
2. Data collection – Phase 1 Survey
4. Data collection – Phase 2 Case interviews
5. Data analysis – Phase 2 Case analysis
(identification of best practices)
3. Data analysis – Phase 1 DEA & Cluster Analysis (selection of case firms)
Figure 7. Flow Diagram for Research
120
tested by Samson and Terziovski [46], discussed previously and shown in Appendix
A5.
The Prajogo and Sohal instrument was selected based on the fact that it has
been tested and found to be reliable and valid (construct, content, and criterion); in
addition, the instrument has recently been used by other researchers exploring the
relationships between quality and innovation [20, 106].
Samson and Terziovski developed the scale for measuring extent of TQM
implementation based on the Malcolm Baldrige National Quality Award (MBNQA)
criteria. However, Prajogo and Sohal adapted the ‘Information & Analysis’ section of
the Samson and Terziovski instrument because their scale only addressed
benchmarking and the MBNQA criteria cover wider issues than benchmarking.
Therefore, in addition to benchmarking, questions on ‘the availability of data and
information about performance’, and ‘the use of information in decision-making
processes conducted by senior management’ were included as well.
The performance section of the measurement instrument includes metrics for
both quality and innovation. For quality performance, Prajogo et al. [25] reported
using the instrument developed by Ahire et al. [50] (see section 11 of Appendix A3).
This instrument measures quality as a single construct, however multiple dimensions
of quality are included within the construct.

121
By contrast, and in keeping with prior research on the topic, innovation is
measured by three separate constructs – product, process, and business systems
innovation. The Prajogo and Sohal instrument addresses product and process
innovation performance, but not business systems/ administrative innovation.
Therefore, for the research described here, three questions developed by Johannessen
et al. [76] (see Appendix B1) were added to the survey instrument to measure business
systems innovation.
In summary, the survey instrument developed and used by Prajogo and Sohal
was used nearly verbatim. The only changes made were the addition of three
questions on business systems innovation and a question on the respondent’s job title
and number of years with the organization. The final instrument used is shown in
Appendix A6.
2. Data collection – Phase 1: Survey
Given the need for a high-level perspective of the firm, target respondents for
the survey were senior managers. The target industry sector was the forest industry on
the West Coast of the U.S. (California, Washington, and Oregon). This industry and
region are desirable given the author’s experience, familiarity, and current work
responsibilities for research and outreach directed to innovation in the forest industry.
The region was limited to the three West Coast states in order to minimize travel costs
during case study interviews. Firms with 10 or more employees were included in the
survey. Such small firms were included given the author’s over 15 years of
122
experience in working with this industry sector; while one may not assume that firms
with only 10-50 employees would have the resources (financial and personnel) to
pursue a formal quality program and/or innovation, the author’s experience suggests
otherwise, hence, the inclusion of these small firms. In addition, other researchers
exploring innovation in the forest industry have explored firms this size and even
smaller; for example, Hovgaard and Hansen studied firms with one to 60 employees
[52].
The forest industry, broadly defined, includes:
• Forest Products Manufacturing firms, including: o Structures (and prefabricated structural components) – wood truss
manufacturers and prefabricated building manufacturers (e.g., mobile homes and log homes);
o Primary – sawmills and veneer/ plywood mills (i.e., firms that buy logs);
o Composite and engineered products – (1) firms that use residues from other firms to produce products such as particleboard, (2) firms that use veneer to produce laminated veneer lumber (LVL), or (3) that convert low-value logs to chips or flakes to produce products such as oriented strand board (OSB);
o Secondary – firms that buy lumber, plywood, and composite products to produce furniture, cabinets, moulding/ millwork, doors, windows, etc. and
• Equipment manufacturers (i.e., vendors to the forest industry) that manufacture logging machinery, sawmill machinery, computer-controlled routers, machine vision systems, etc.
The convention in the forest industry is to consider pulp and paper
manufacturing as separate and distinct from other sectors of the forest industry. Thus
pulp and paper firms were not included in the target sector.

123
Research has revealed little innovation, particularly product innovation, in
forest products manufacturing. For example, Hansen et al. state, “Very little is
understood about how forest sector firms approach new product development or, on
the other hand, why many apparently do not proactively develop new products” [101].
Similarly, in a study of the Spanish wood products industry, Diaz-Balteiro et al. state
that there is a “…low firm priority towards R&D as a means to achieve
competitiveness and an innovation strategy followed by many Spanish firms based on
the acquisition of embodied technology available in international markets” [81]. Thus,
there was some concern that survey results for forest products manufacturing firms
alone might provide little useful information on product innovation. Even for process
innovation, there is a greater likelihood that innovation would be accomplished via
adoption of purchased technology rather than via development of in-house
technologies. This is not surprising given that much of the forest products industry
can be considered a mature industry, i.e., in Stage III using the categories developed
by Utterback and Abernathy and discussed previously [78]. On the other hand, and in
agreement with the literature on innovation in mature industries, equipment vendors to
the industry may provide greater opportunity for witnessing depth and breadth in
innovation performance. Hence, broadly defining the industry was intended to result
in more variation in responses with respect to outputs (particularly innovation
performance) as well as inputs, with the assumption that firms take a contingency
approach to implementing TQM.
124
Questionnaires were mailed to all identified forest industry firms in the three
target states using several databases:
• Manufacturers – the author’s on-line database of the wood products industry (www.orforestdirectory.com) was combined with a purchased database from USADATA; duplicate entries were removed;
• Equipment vendors - Wood Machinery Manufacturers of America (WMMA); Wood & Wood Products magazine’s ‘Red Book’ (directory)’; and the Woodworking Machinery Industry Association
For the purchased database, Standard Industrial Classification (SIC) codes
included:
• 24 Lumber and Wood Products, Except Furniture • 2511 Wood Household Furniture • 2521 Wood Office Furniture • 25310101 Blackboards, wood • 25310202 Communion tables, wood • 2541 Wood Partitions and Fixtures • 35310103 Logging equipment • 3553 Woodworking Machinery
The final sample frame included 3305 firms. A hard copy survey and cover
letter (Appendix A7) were mailed to each firm and a second mailing was sent to all
non-respondents three weeks after the first mailing. Respondents were given the
option of responding by self-addressed stamped envelope, by fax, or via a web-based
form. Questionnaire responses were collected and tallied in an Excel spreadsheet for
subsequent analysis. Non-response bias was assessed using the ‘last respondent’
method described by Armstrong and Overton [107]. In a mail survey with more than
one ‘wave’ (i.e., separate mailings), this method assumes non-respondents are more
125
like the last respondents in the final mailing than the earlier respondents. In this
regard, the first 30 respondents (first mailing) were compared to the last 30
respondents (second mailing). Mean responses for all questions were compared using
a t-test for samples with independent means. Non-response bias is confirmed in the
event there is no statistically significant difference between the ‘early’ respondents
and ‘late’ respondents.
3. Data analysis – Phase 1: DEA and cluster analysis
The primary objective for this step was to select firms for case study
interviews. DEA combined with cluster analysis served to identify the firms
efficiently using TQM to achieve quality and/or innovation performance outcomes and
cluster analysis was used to group the efficient firms based on survey responses to
quality and innovation performance. Specifically, the combination of DEA and cluster
analysis was intended to identify efficient (i.e., ‘high-performing’) firms in two
diverse categories – those that were achieving primarily quality performance and those
achieving both quality and innovation performance. This approach was intended to
address the suggestion by Eisenhardt of selecting cases that fill “theoretical categories
and provide examples of polar types” [86]. Such a method of selecting case examples
is intended to generate wider variety in the responses. Further, results can be
compared and contrasted to determine the extent that practices are truly different
between the two groups. This distinction between firms is discussed in more detail
below.
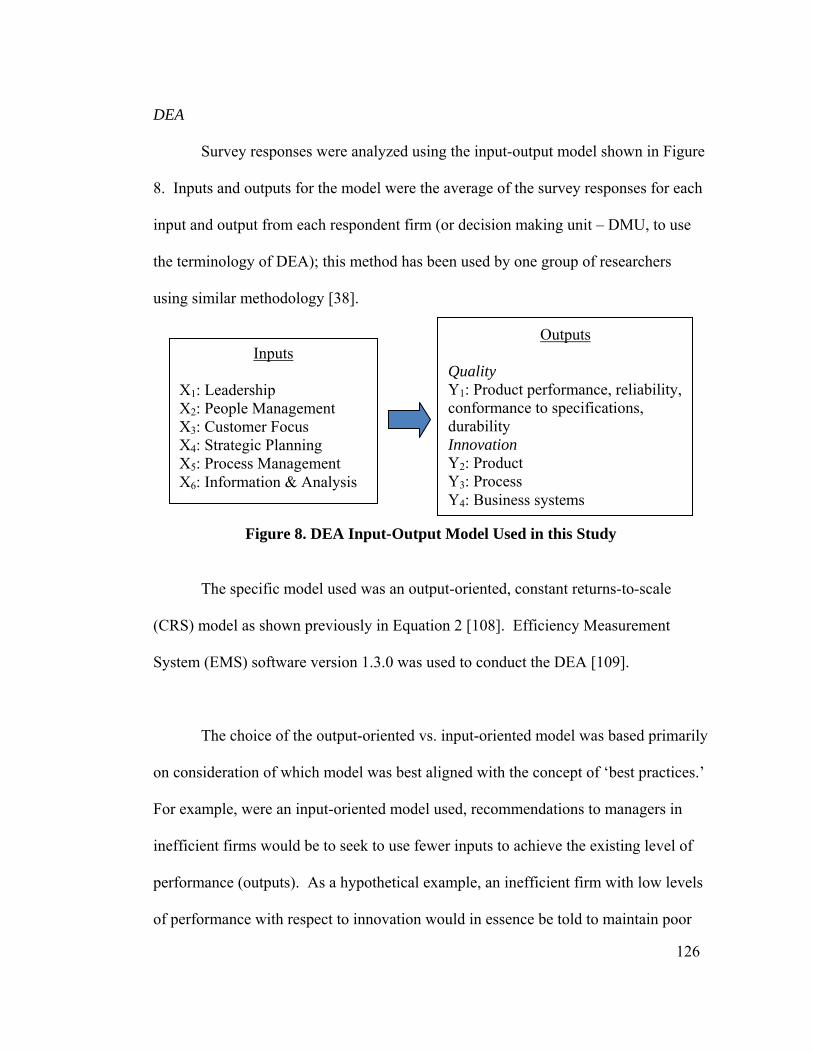
126
DEA
Survey responses were analyzed using the input-output model shown in Figure
8. Inputs and outputs for the model were the average of the survey responses for each
input and output from each respondent firm (or decision making unit – DMU, to use
the terminology of DEA); this method has been used by one group of researchers
using similar methodology [38].
Figure 8. DEA Input-Output Model Used in this Study
The specific model used was an output-oriented, constant returns-to-scale
(CRS) model as shown previously in Equation 2 [108]. Efficiency Measurement
System (EMS) software version 1.3.0 was used to conduct the DEA [109].
The choice of the output-oriented vs. input-oriented model was based primarily
on consideration of which model was best aligned with the concept of ‘best practices.’
For example, were an input-oriented model used, recommendations to managers in
inefficient firms would be to seek to use fewer inputs to achieve the existing level of
performance (outputs). As a hypothetical example, an inefficient firm with low levels
of performance with respect to innovation would in essence be told to maintain poor
Inputs X1: Leadership X2: People Management X3: Customer Focus X4: Strategic Planning X5: Process Management X6: Information & Analysis
Outputs Quality Y1: Product performance, reliability, conformance to specifications, durability Innovation Y2: Product Y3: Process Y4: Business systems
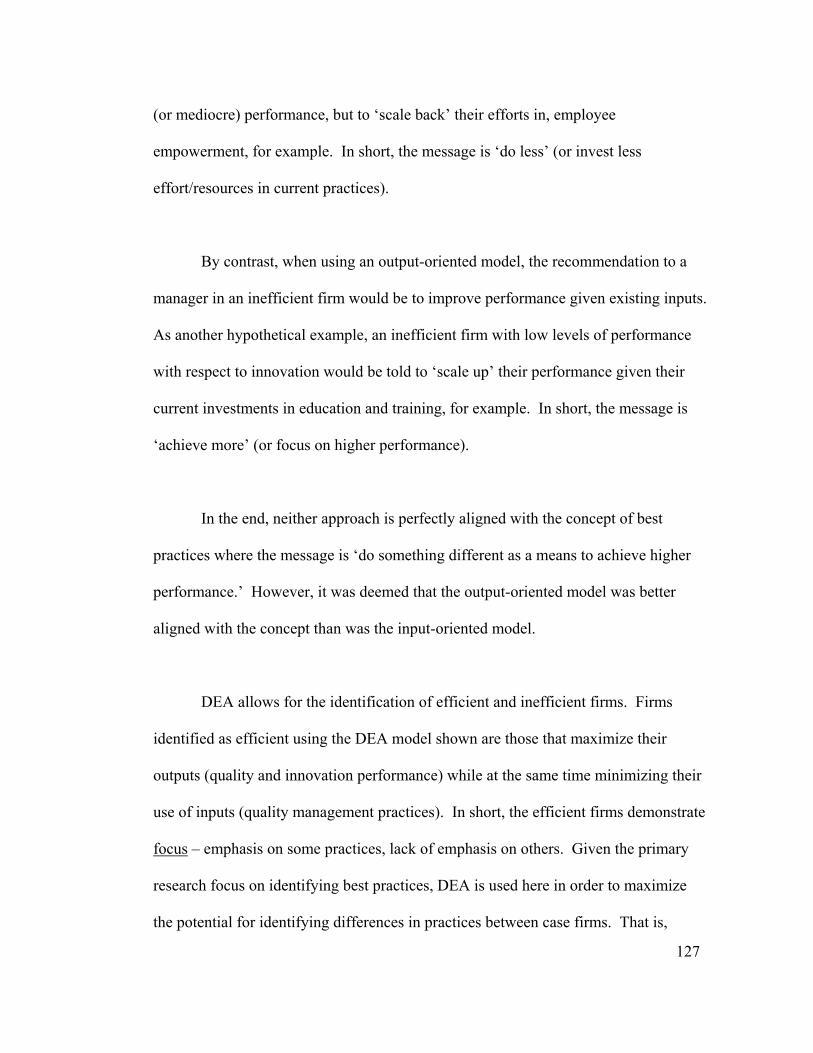
127
(or mediocre) performance, but to ‘scale back’ their efforts in, employee
empowerment, for example. In short, the message is ‘do less’ (or invest less
effort/resources in current practices).
By contrast, when using an output-oriented model, the recommendation to a
manager in an inefficient firm would be to improve performance given existing inputs.
As another hypothetical example, an inefficient firm with low levels of performance
with respect to innovation would be told to ‘scale up’ their performance given their
current investments in education and training, for example. In short, the message is
‘achieve more’ (or focus on higher performance).
In the end, neither approach is perfectly aligned with the concept of best
practices where the message is ‘do something different as a means to achieve higher
performance.’ However, it was deemed that the output-oriented model was better
aligned with the concept than was the input-oriented model.
DEA allows for the identification of efficient and inefficient firms. Firms
identified as efficient using the DEA model shown are those that maximize their
outputs (quality and innovation performance) while at the same time minimizing their
use of inputs (quality management practices). In short, the efficient firms demonstrate
focus – emphasis on some practices, lack of emphasis on others. Given the primary
research focus on identifying best practices, DEA is used here in order to maximize
the potential for identifying differences in practices between case firms. That is,
128
without some way of screening candidate firms, there is the potential for examining
firms that simply took a ‘shotgun approach’ to quality management practices. In such
a situation there is the potential for practices being more similar than different between
firms being studied. In short, regardless of the technique used, the main objective is to
somehow reduce the pool of candidate firms to those that demonstrate some diversity
in their application of the practices while simultaneously achieving high performance
with respect to the specified outputs. DEA is uniquely suited to such an objective.
Within the categories of efficient and inefficient firms, there are sub-categories
as well, such as:
1. Inefficient firms: a. the least efficient DMUs overall, b. Firms somewhere ‘in the middle’ (i.e., neither on the efficiency
frontier nor in the group above),
2. Efficient firms: a. DMUs that are efficient due to innovation performance but not
quality performance (i.e., “innovation-oriented”) b. DMUs that are efficient due to quality performance but not
innovation performance (i.e., “quality-oriented”) c. DMUs that are efficient due to both quality and innovation
performance (i.e., “balanced”)
For purposes of the research proposed here, groups 2b and 2c represent the
groups of greatest interest as these groups allow for differentiation of practices of
efficient firms (those effectively using TQM) based on a focus on quality and/or
innovation performance. In particular, the “quality-oriented” firms are those that are
reaping quality benefits from a quality management system but that presumably have
not adapted their practices to achieve innovation performance as well. By contrast, the
129
balanced firms are presumed to have made such an adaptation to their practices.
Figure 9 shows conceptually the contrast between these firms using the results of
DEA.
The square on the line (‘efficiency frontier’) in Figure 9 shows a ‘balanced’
firm; this firm is deemed efficient due to quality and innovation performance (group
2c described above). By comparison, the octagon represents a firm that is efficient,
though primarily due to innovation performance but not quality performance (group 2a
described above). For purposes of comparison to the balanced firm, the firm
represented by the triangle, the ‘quality-oriented’ firm is of the highest interest (group
2b described above). This firm is efficient due primarily to quality performance but
not innovation performance.
Figure 9. Selection of Cases
130
Unfortunately, DEA results do not lend themselves readily to such a
categorization of the efficient firms. While the results provide an efficiency score for
each firm as well as weights for each input and output, the efficiency scores are unique
solutions whereas the weights are not (i.e., reproducible if the linear program were run
on another computer). For this reason, cluster analysis was used to categorize the
firms into balanced and quality-oriented firms; as stated in the literature, a similar
approach to selecting case firms was used by Campbell and Ahrens [91].
Cluster Analysis
PASW Statistics 18 software (SPSS, 2010) was used to perform the cluster
analysis. The specific form of cluster analysis used was hierarchical cluster analysis
using the between groups linkage method to form clusters of relatively homogeneous
groups; squared Euclidean distance was used as the interval measure. Variables
selected for the cluster analysis were the individual output responses from the survey,
i.e., the responses to survey questions on quality performance (questions 30-33 in
Appendix A6), product innovation (questions 34-38), process innovation (questions
39-42) and business systems innovation (questions 43-45). The primary output of the
cluster analysis was a dendrogram, a plot which groups firms with similar values of
the selected variables. In this case, the dendrogram clustered efficient firms (as
identified previously using DEA) based on how they responded to survey questions on
quality and innovation performance.
131
“Quality-oriented” and “balanced” clusters were identified (i.e., the clusters
were ‘named’) by examining the average quality and innovation performance
responses in the questionnaire for the firms shown in the dendrogram. ‘Balanced’
firms were determined to be those with an average of five on a five-point scale for
quality performance and four or higher on innovation overall; these firms were
grouped at the top of the dendrogram. ‘Quality-oriented firms’ were determined to be
those firms with an average questionnaire response of five for quality performance and
2.1 or lower for innovation; these firms were at the bottom of the chart.
The original goal for the research was to select three firms in each category for
a total of six firms for case studies. However, the cluster analysis revealed only two
candidates in the quality-oriented category. And while there were three candidate
‘balanced’ firms, one of the firms stated that they were no longer a manufacturer but
simply served as a wholesale bark mulch supplier as a result of the economic
downturn. Hence, as with the quality-oriented firms, only two firms remained as
viable candidates for case interviews. As a result, there were four rather than six firms
selected for case interviews. Clearly, a larger number of cases is desirable. However,
the use of four or fewer case firms for a research project has precedence in the
literature. In fact, two of the articles discussed in the literature review were based on
research at a single case firm; Prajogo and Sohal present the results of a study
examining one firm in Australia [82] and Bossink examined a single home-building
project in the Netherlands [100]. In particular, in one of the most cited papers related
to case study research, Eisenhardt states, “…while there is no ideal number of cases, a
132
number between four and 10 cases usually works well” [86]. Also, in his textbook on
case study research, Yin merely states, “…if multiple candidates are qualified to serve
as cases, the larger the number you can study, the better.” [88].
4. Data Collection – Phase 2: Case interviews
While the DEA analysis of survey responses revealed firms ‘efficiently
converting TQM inputs into quality and innovation outputs’, and cluster analysis
allowed for identification of efficient firms that were balanced vs. quality-oriented,
more detailed information beyond the survey responses was needed to be able to
determine specific differences in practices between the two categories of firms. To get
such detail, in-person interviews at each case study firm were conducted. Further,
interview questions related to quality and innovation performance served to validate
the categorization of the firms. For example, if properly classified, balanced firms
should be able to provide evidence of their focus on quality as well as innovation
outputs (new products developed, new process technologies developed or adopted,
etc.). By contrast, the quality-oriented firms would be expected to provide evidence of
their focus on quality but not innovation.
Interview questions were developed with the intent to explore each of the
management practices (e.g., Leadership, People Management, Customer Focus) and
performance in greater detail as well as to address the three propositions presented
previously. To ensure questions also addressed potential areas of difference between
the two categories of firms, survey responses of the candidate case firms were
133
examined to identify these differences. For example, the firms had similar responses
to the question related to Leadership, “Senior executives share similar beliefs about
the future direction of this organization”; all four candidate firms ranked this question
a four or a five on a five-point scale. However, there were apparent differences in
questions related to People Management; for example, balanced firms gave a score of
three and four, and both quality-oriented firms gave a score of one for the question –
“We have an organization-wide training and development process, including career
path planning, for all our employees.” As another example, balanced firms ranked
question 15 on Customer Focus, “We systematically and regularly measure customer
satisfaction” at three and four whereas quality-oriented firms ranked this question a
two or one.
Draft interview questions were developed and reviewed by two of the author’s
colleagues (other faculty members at Oregon State University) with experience in case
study research. The author’s colleagues reviewed the questions for clarity and
provided suggestions for improvement. One primary suggestion was to ask ‘how’
rather than ‘yes/no’ questions. For example, “how does your company train
employees?” rather than “do you have a formal training program?” Interview
questions were revised based on these suggestions. Revised questions were then
reviewed by an expert panel of five forest industry professionals. The panel provided
suggestions such as simplifying the wording of specific questions, rewording others
that experts felt were somewhat ‘leading’, and ensuring respondents that results would

134
be confidential. The interview questions were again revised based on suggestions from
the expert panel. The final interview questions are shown in Appendix A8.
The four case interviews were conducted in-person at each company. In each
case, the interviewee was the same person as responded to the questionnaire.
Interviews lasted between approximately 60 and 140 minutes. Interviews were
recorded via digital audio recorder (with the interviewee’s permission) and then
transcribed verbatim. The results were approximately 75 pages of single-spaced
transcripts.
In addition, Internet searches were conducted to locate additional information
on each case firm. This information was used to complement the case information
from the questionnaire and interviews. Each page on the websites of the two balanced
firms was copied and pasted into a text document for analysis (described below). In
addition, there was another website that discussed the products of one of the balanced
firms; data were cut-and-paste into a text document from this site as well. However,
no additional information was located for the two quality-oriented firms.
5. Data Analysis – Phase 2: Case Analysis
Case study data (survey responses, interview transcripts, and additional
information located on the Internet) were input into NVivo software (QSR
International, version 8, 2009) and analyzed following the guidelines suggested by
Eisenhardt [86]. The first four of these steps are not involved with data analysis per
135
se, but rather establishing propositions, selecting cases, developing measurement
instruments, and collecting data. As such, the steps were described previously.
However, actions taken within these steps are repeated here for the sake of
completeness. The steps in case study research include:
1. Getting started - describe the factors and guiding propositions (expected
relationships) among them and propose research questions. The literature
review on quality and innovation and measurement instrument presented the
factors. In addition, the literature led to the three propositions listed above
related to the “TQM dualities”, i.e., use of hard vs. soft tools, scope of
implementation, and internal vs. external focus.
2. Selecting cases – significant effort has been made here to avoid researcher bias
in case selection. Cases were selected that represented balanced firms - those
efficiently using TQM to achieve quality and innovation performance – as well
as quality-oriented firms – those efficiently using TQM to achieve primarily
quality performance. In particular, DEA followed by cluster analysis was used
to select the cases. This approach is in keeping with Eisenhardt’s suggestion to
use ‘theoretical sampling’, rather than random sampling. That is, cases should
be selected to replicate previous cases, extend emergent theory, represent
theoretical categories, or polar opposites; multiple cases are preferred to
provide deeper understanding and the chance to test propositions.
136
3. Crafting instruments and protocols – details are provided above on the
development of the survey instrument to measure extent of TQM
implementation and performance as well as the interview questions.
4. Entering the field – visits to case firms to conduct interviews were described
above. In keeping with the recommendations, analysis occurred
simultaneously with data collection via addressing questions such as “what am
I learning?” or “how does this case differ from the last?” Eisenhardt states that
the researcher is ‘encouraged to make adjustments to measurement instruments
and methods during data collection.’ While no explicit changes were made to
the interview questions (i.e., none of the interview questions were reworded),
clarifying questions were asked and occasional follow-up questions based on
emergent themes developing during the interviews.
5. Analyzing data – the primary approach here is to ‘code’ the data to compare
and contrast within and between the different cases and sources (e.g., survey
responses, interview transcripts, and web-based information). As an example
of coding, one interviewee responded to the question on benchmarking, “Heck
no! I don’t care what my competitors do!” This was simply coded under
‘benchmarking.’ However, as all the cases were coded, cultural differences
between firms became apparent which were termed ‘proactive/strategic’ and
‘reactive/conservative.’ In this case, the quote above was coded as
‘reactive/conservative.’
137
Triangulation among the different sources discovers the extent to which
there is convergence; data were analyzed and coded within-case first, followed
by cross-case. And as recognized by case researchers in the literature, the
process is not linear, but iterative. This was the case in this research as well in
that emergent themes during coding resulted in the development of new codes
and thus several cycles back through the data. The analysis proceeded as
follows:
Within-case – transcripts and other data from each case firm were read through
line by line four times – the first time as they were being transcribed and then
three additional times during coding. For the interview transcripts, responses
to questions were coded by the theme of the question; for the management
practices, the themes included People Management (communication, employee
empowerment, employee satisfaction, training in general, and cross training),
Customer Focus (coded as such), and Information & Analysis (performance
measures and benchmarking). Themes related to Process Management were
primarily an indication of the extent of usage of the ‘hard’ quality tools and
thus addressed Proposition 1 described above. Details on the coding to address
the three research propositions are discussed below.
For the additional (web-based) information, transcribed information
was reviewed for themes. For the most part, the web-based information was
coded with regards to the output measures of quality and innovation
138
performance as this is what companies tend to advertise in their
communications to potential customers.
Interview questions on Leadership and Strategic Planning were difficult
to code in the first round; the responses were more indicative of company
culture rather than specific management practices. In fact, responses to
questions on Leadership and Strategic Planning (as well as all the responses,
for that matter) led to the development of emergent themes related to company
culture, as will be discussed in more detail below. Of course, the themes (e.g.,
employee empowerment, customer focus, etc.) were not limited to the
individual questions on those topics. That is, interviewees often discussed
issues related to ‘customer focus’ in the specific questions on that subject as
well as in several other questions.
In addition to coding for the input measures (management practices),
within-case analysis also involved coding for the output measures – Quality,
Product Innovation (including the approach to new product development),
Process Innovation, and Business Systems Innovation. The coding of these
output measures also served to validate the categorization of the case firms.
For example, if identified correctly, balanced firms should emphasize the
importance of quality as well as provide examples of innovations they have
either adopted or developed. By contrast, the quality-oriented case firms
139
would be similar with respect to their apparent emphases on quality, but should
not have examples of innovations.
As described above, the process of coding each case led to the
identification of ‘emergent’ themes. The general nature of emergent themes is
that they are implicit in the responses rather than an explicit answer to a
question on a topic. For example, although no interview questions directly
addressed the importance of relationships, most companies discussed this topic
in response to other questions. Further, as discussed above, many responses
provided an indication of aspects of company culture. Specifically, some firms
were risk-averse and reacted to changes in the market (e.g., “competitors were
doing it, so we figured we better get into it too…”). By contrast, other firms
discussed risks they had taken and were more proactive in general (e.g., “And I
did a lot of research on my own just saying ‘hey, can we apply this?’”).
Therefore, after the first round of coding, each case was read through a second
time and coded for the emergent themes - ‘relationships’, ‘proactive/strategic’
and ‘reactive/conservative.’
With regards to the three propositions described above, coding was
conducted with a specific intent to address these propositions. Comments
related to propositions were coded as follows:
• Proposition 1 (‘hard vs. soft’ factors of TQM) - only in select instances
were there essentially ‘yes/no’ responses that would enable coding on
140
the hard vs. soft factors. For example, question 12 in the interview
asked which of a list of tools (all of which were ‘hard’ factors) a
company used. A ‘yes’ answer to this question, combined with details
on where and how a tool or tools were used, served as one piece of
evidence of a firm’s emphasis on hard tools. By contrast, most other
instances of hard vs. soft factor emphasis were implicit in a response to
a question such, “How do you obtain input/feedback from customers?”
A detailed response to this question would serve as evidence of a firm’s
emphasis on this specific soft factor. By contrast, inability to provide
details served as evidence of lack of emphasis on this factor. In
particular, interview questions related to People Management,
Customer Focus, Process Management, and Information & Analysis
were identified as being the primary sources for evidence (or lack of) of
soft or hard factor emphasis. At the same time, ALL questions had the
potential to serve as evidence for this proposition depending on the
comments of the interviewee.
• Proposition 2 (TQM implementation companywide or more narrowly)
– As stated previously, absence of evidence of emphasis on any of the
three foundational principles of TQM (customer focus, process
focus/continuous improvement, and participation & teamwork),
suggests a narrower focus and conversely, evidence of emphasis on all
three principles suggests a wider focus. Comments related to this
proposition were more difficult to code than for Proposition 1 above. It
141
was assumed that directly asking ‘is your TQM program implemented
companywide?’ might be considered a leading question. That is,
respondents might answer ‘yes’ believing that was the ‘correct’ answer.
Therefore, as with Proposition 1, a firm may provide evidence of
emphasis on any of the principles by being able to describe their
approach to specific practices within the principle. In particular,
interview questions related to People Management, Customer Focus,
and Process Management were identified as being the primary sources
for evidence for this proposition; questions in these three areas
represent the foundational TQM principles of participation &
teamwork, customer focus, and process focus/continuous improvement,
respectively. As with Proposition 1, however, all interview questions
had the potential to serve as evidence for this proposition.
• Proposition 3 (internal vs. external focus) – As stated previously,
internal vs. external focus manifests itself in how broadly a firm
envisions its context (i.e., a closed vs. open system) and its approach to
customers (existing and new). As with the two previous propositions,
evidence to support whether a firm has an internal focus or both
internal and external, can be found in how the firm talks about its
practices. Key interview questions for this proposition included
questions related to Customer Focus, Process Management, and
Information & Analysis (the question on benchmarking in particular).
In addition, many of the questions related to innovation are likely to
142
evoke comments suggesting whether a company is focused on existing
customers or new customers. In addition, company websites may
provide indications of whether or not a firm is focused on stakeholders
beyond direct customers. Lastly, other coding related to
‘reactive/conservative’ and ‘proactive/strategic’, to the extent
comments applied to the firms’ approach to customers, also served as
evidence for this proposition.
It should be noted here that one modification to Eisenhardt’s
recommendations for this step of data analysis was related to
development of detailed case study reports for each case. While coding
was conducted in this step and summary observations noted for each
case firm, the additional step of developing detailed case reports was
deemed unnecessary in that the primary objective of determination of
best practices sought to establish differences between firms; hence,
cross-case analysis and enfolding the literature were emphasized in
establishing the chain of evidence rather than within-case analysis.
Cross-case – following the within-case coding, all the survey responses for
each case firm were examined again3 to identify key areas of similarities and
differences between case firms. Interview responses were then examined for
3 The questionnaire responses were examined the first time to develop the interview questions.
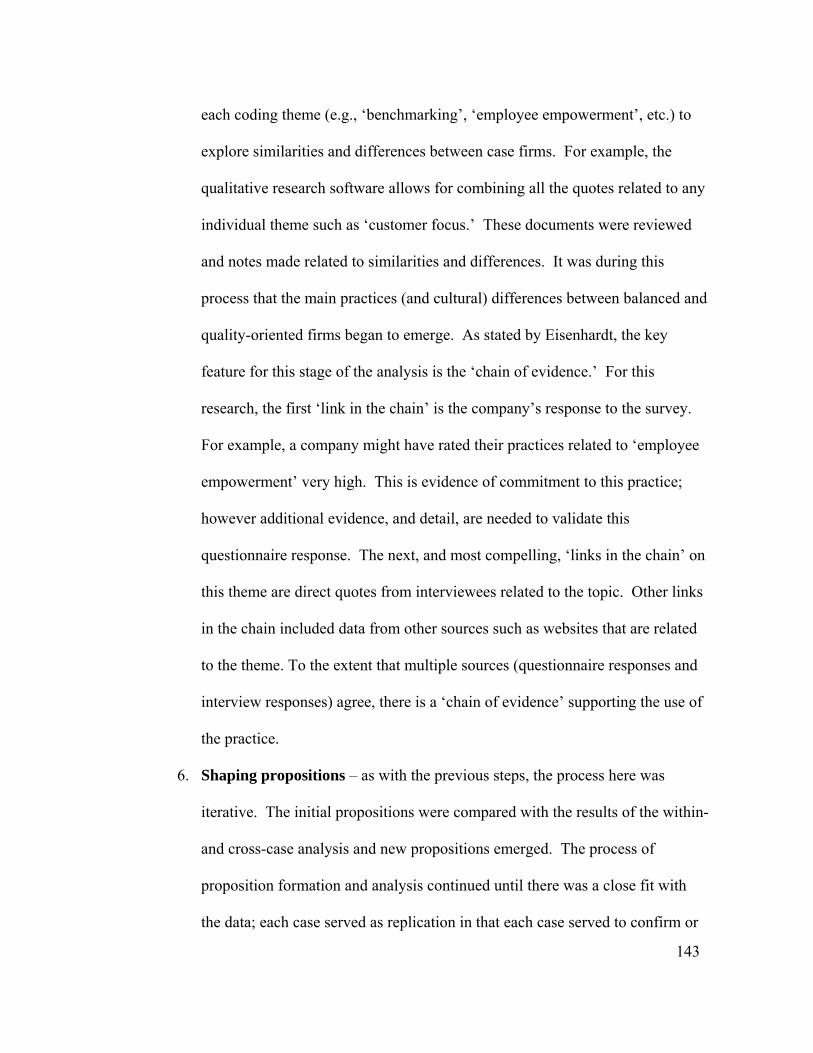
143
each coding theme (e.g., ‘benchmarking’, ‘employee empowerment’, etc.) to
explore similarities and differences between case firms. For example, the
qualitative research software allows for combining all the quotes related to any
individual theme such as ‘customer focus.’ These documents were reviewed
and notes made related to similarities and differences. It was during this
process that the main practices (and cultural) differences between balanced and
quality-oriented firms began to emerge. As stated by Eisenhardt, the key
feature for this stage of the analysis is the ‘chain of evidence.’ For this
research, the first ‘link in the chain’ is the company’s response to the survey.
For example, a company might have rated their practices related to ‘employee
empowerment’ very high. This is evidence of commitment to this practice;
however additional evidence, and detail, are needed to validate this
questionnaire response. The next, and most compelling, ‘links in the chain’ on
this theme are direct quotes from interviewees related to the topic. Other links
in the chain included data from other sources such as websites that are related
to the theme. To the extent that multiple sources (questionnaire responses and
interview responses) agree, there is a ‘chain of evidence’ supporting the use of
the practice.
6. Shaping propositions – as with the previous steps, the process here was
iterative. The initial propositions were compared with the results of the within-
and cross-case analysis and new propositions emerged. The process of
proposition formation and analysis continued until there was a close fit with
the data; each case served as replication in that each case served to confirm or
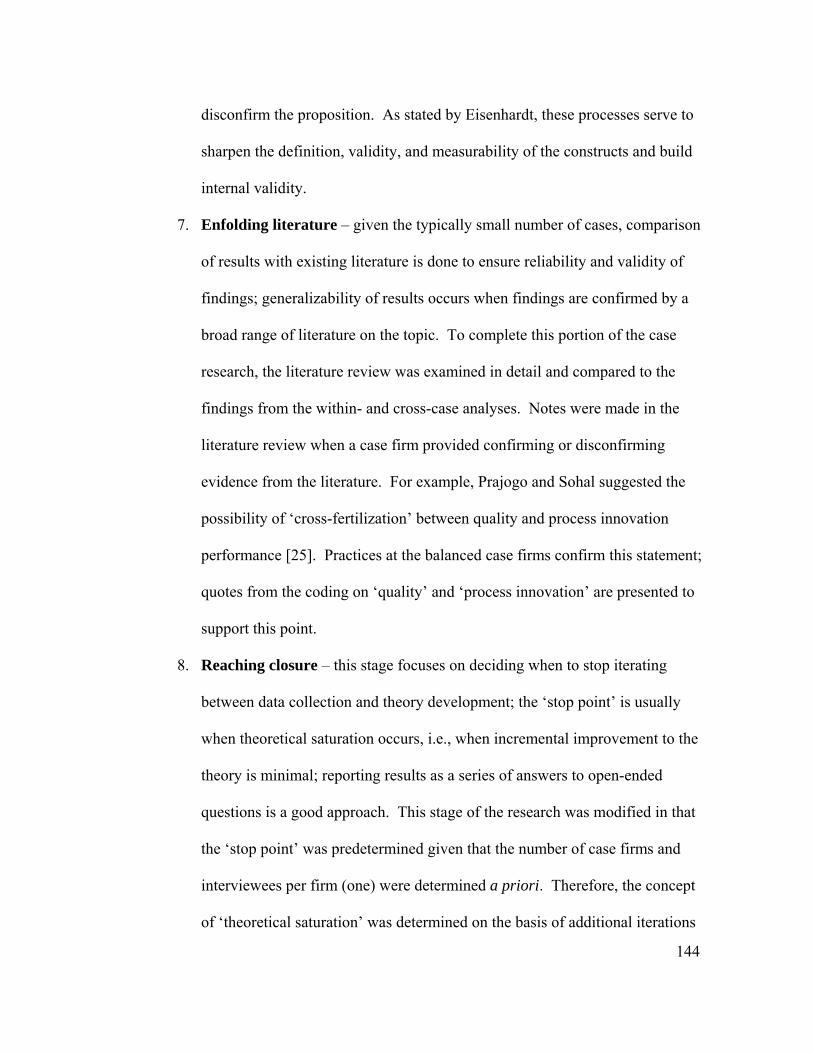
144
disconfirm the proposition. As stated by Eisenhardt, these processes serve to
sharpen the definition, validity, and measurability of the constructs and build
internal validity.
7. Enfolding literature – given the typically small number of cases, comparison
of results with existing literature is done to ensure reliability and validity of
findings; generalizability of results occurs when findings are confirmed by a
broad range of literature on the topic. To complete this portion of the case
research, the literature review was examined in detail and compared to the
findings from the within- and cross-case analyses. Notes were made in the
literature review when a case firm provided confirming or disconfirming
evidence from the literature. For example, Prajogo and Sohal suggested the
possibility of ‘cross-fertilization’ between quality and process innovation
performance [25]. Practices at the balanced case firms confirm this statement;
quotes from the coding on ‘quality’ and ‘process innovation’ are presented to
support this point.
8. Reaching closure – this stage focuses on deciding when to stop iterating
between data collection and theory development; the ‘stop point’ is usually
when theoretical saturation occurs, i.e., when incremental improvement to the
theory is minimal; reporting results as a series of answers to open-ended
questions is a good approach. This stage of the research was modified in that
the ‘stop point’ was predetermined given that the number of case firms and
interviewees per firm (one) were determined a priori. Therefore, the concept
of ‘theoretical saturation’ was determined on the basis of additional iterations
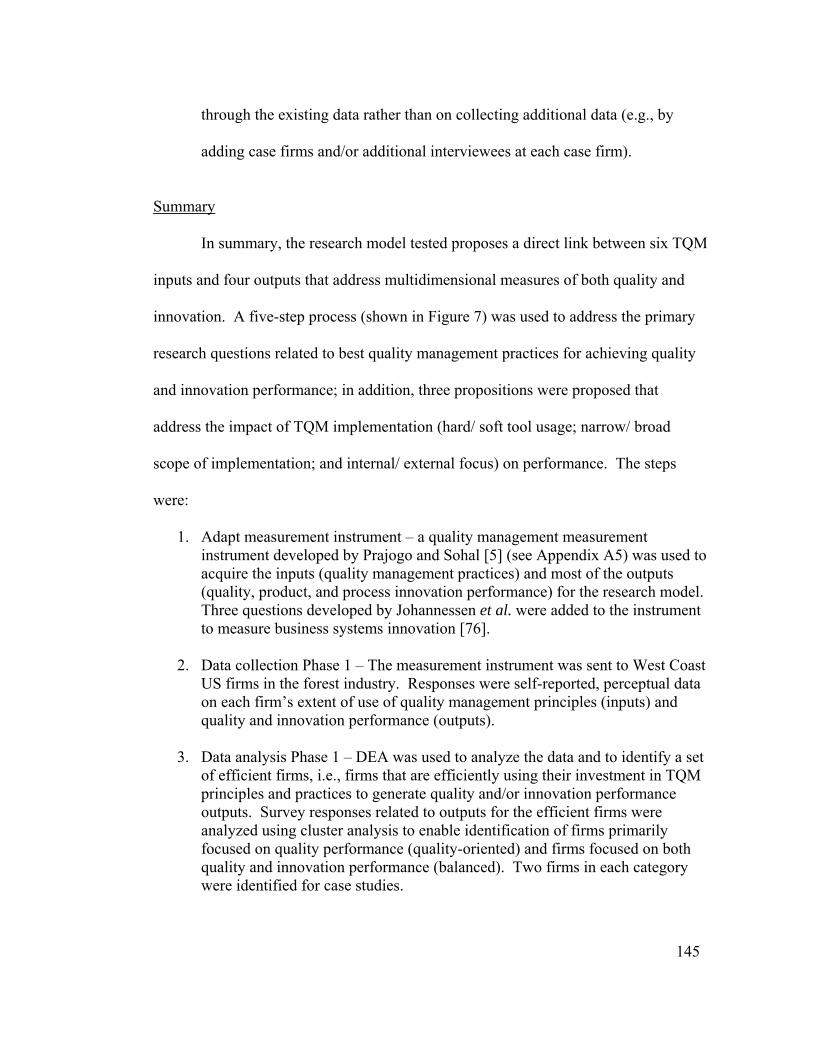
145
through the existing data rather than on collecting additional data (e.g., by
adding case firms and/or additional interviewees at each case firm).
Summary
In summary, the research model tested proposes a direct link between six TQM
inputs and four outputs that address multidimensional measures of both quality and
innovation. A five-step process (shown in Figure 7) was used to address the primary
research questions related to best quality management practices for achieving quality
and innovation performance; in addition, three propositions were proposed that
address the impact of TQM implementation (hard/ soft tool usage; narrow/ broad
scope of implementation; and internal/ external focus) on performance. The steps
were:
1. Adapt measurement instrument – a quality management measurement instrument developed by Prajogo and Sohal [5] (see Appendix A5) was used to acquire the inputs (quality management practices) and most of the outputs (quality, product, and process innovation performance) for the research model. Three questions developed by Johannessen et al. were added to the instrument to measure business systems innovation [76].
2. Data collection Phase 1 – The measurement instrument was sent to West Coast
US firms in the forest industry. Responses were self-reported, perceptual data on each firm’s extent of use of quality management principles (inputs) and quality and innovation performance (outputs).
3. Data analysis Phase 1 – DEA was used to analyze the data and to identify a set
of efficient firms, i.e., firms that are efficiently using their investment in TQM principles and practices to generate quality and/or innovation performance outputs. Survey responses related to outputs for the efficient firms were analyzed using cluster analysis to enable identification of firms primarily focused on quality performance (quality-oriented) and firms focused on both quality and innovation performance (balanced). Two firms in each category were identified for case studies.
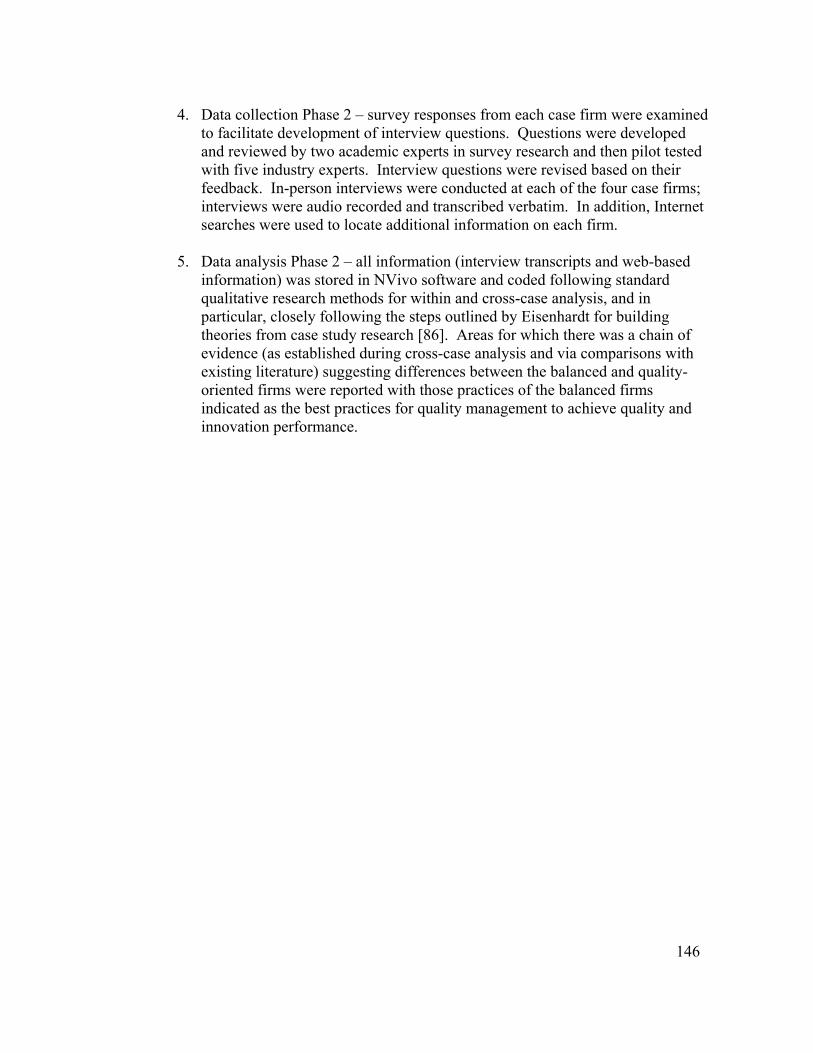
146
4. Data collection Phase 2 – survey responses from each case firm were examined to facilitate development of interview questions. Questions were developed and reviewed by two academic experts in survey research and then pilot tested with five industry experts. Interview questions were revised based on their feedback. In-person interviews were conducted at each of the four case firms; interviews were audio recorded and transcribed verbatim. In addition, Internet searches were used to locate additional information on each firm.
5. Data analysis Phase 2 – all information (interview transcripts and web-based
information) was stored in NVivo software and coded following standard qualitative research methods for within and cross-case analysis, and in particular, closely following the steps outlined by Eisenhardt for building theories from case study research [86]. Areas for which there was a chain of evidence (as established during cross-case analysis and via comparisons with existing literature) suggesting differences between the balanced and quality-oriented firms were reported with those practices of the balanced firms indicated as the best practices for quality management to achieve quality and innovation performance.

147
Chapter 4. Results & Discussion
Results from the research are presented below following the steps of the
research - 1. Adapt measurement instrument; 2. Data collection Phase 1 – survey; 3.
Data analysis Phase 1 - DEA followed by cluster analysis (selection of case firms); 4.
Data collection Phase 2 – case interviews; 5. Data analysis Phase 2 – case analysis
(identification of best practices). The chapter concludes with a summary of the key
findings.
Measurement Instrument
Results for this portion of the research were discussed in the previous section.
However the information is briefly summarized here for sake of completion. An
existing measurement instrument that had been tested and validated was adapted to
measure both ‘inputs’ (extent of implementation of TQM) and ‘outputs’ (quality and
innovation performance). Extent of implementation of TQM in a firm and
performance (quality, product and process innovation) were measured via the
instrument developed, tested, and used by Prajogo and Sohal [5] (see Appendix A5).
Three questions developed by Johannessen et al. were added to measure business
systems innovation performance [76]. The measurement instrument used in the
research is shown in Appendix A6.
148
Data Collection Phase 1 – Survey
The survey was mailed to 3305 firms and a second mailing was sent to non-
respondents after three weeks. Participants were given the option to respond by hard
copy (via postage paid envelope), fax, or by a web-based version of the survey.
A total of 298 surveys were returned as undeliverable and 146 were identified
as duplicates (surveys sent to the same company). Fifty-two firms returned the survey
saying it was not applicable to their firm, or that they had either closed, moved
(outside the three-state study region), or retired. Finally, post-survey examination of
the firms revealed an additional 155 non-respondent firms that were either closed or
not in the target industry sector (e.g., logging contractors, forestry consultants, or retail
establishments). Hence, the adjusted sample frame included 2654 firms.
There were 215 total respondents; 137 firms responded to the first mailing and
78 to the second. The majority of the questionnaires were returned via US mail - only
10 firms responded using the web-based survey and four by fax. Lastly, 11
respondents were eliminated due to incomplete sections of the survey (e.g., none of
the questions on leadership were answered, or quality performance, etc.). Hence the
response rate was 7.7 percent (204/2654).
Regarding sample size, for DEA, the heuristic established by Banker et al.
suggests that the number of decision making units (DMUs) should be greater than
149
three times the sum of the number of inputs and outputs [110]. Thus, in a model with
six inputs and four outputs a minimum of 30 DMUs are needed. Hence, from the
standpoint of DEA, the sample size is more than adequate. In addition, the number of
respondents was similar to that of the research discussed in the literature review
exploring the impact of TQM on performance – between 150 and 200; however, the
response rate in the present research is considerably lower.
Non-response Bias
Results of the t-test for non-response bias are shown in Appendix D. The test
supports the absence of a response bias (p > 0.05) for 44 of the 45 mail survey
questions. The one exception was question 44 related to ‘ability to obtain new sources
of supply.’ For this question, the t-test comparing responses of the first 30
respondents to the last 30 respondents suggests that non-respondents may be less able
to obtain new sources of supply (95 percent confidence interval for difference in
means [0.12 – 1.10]). Such bias is not thought to significantly impact the results of
the research in that both quality-oriented and balanced firms reported success in this
area, as is discussed below.
Respondents by Industry Sector and Number of Employees
The sample population was categorized into five industry sectors, as described
previously:
• Structures • Primary manufacturers
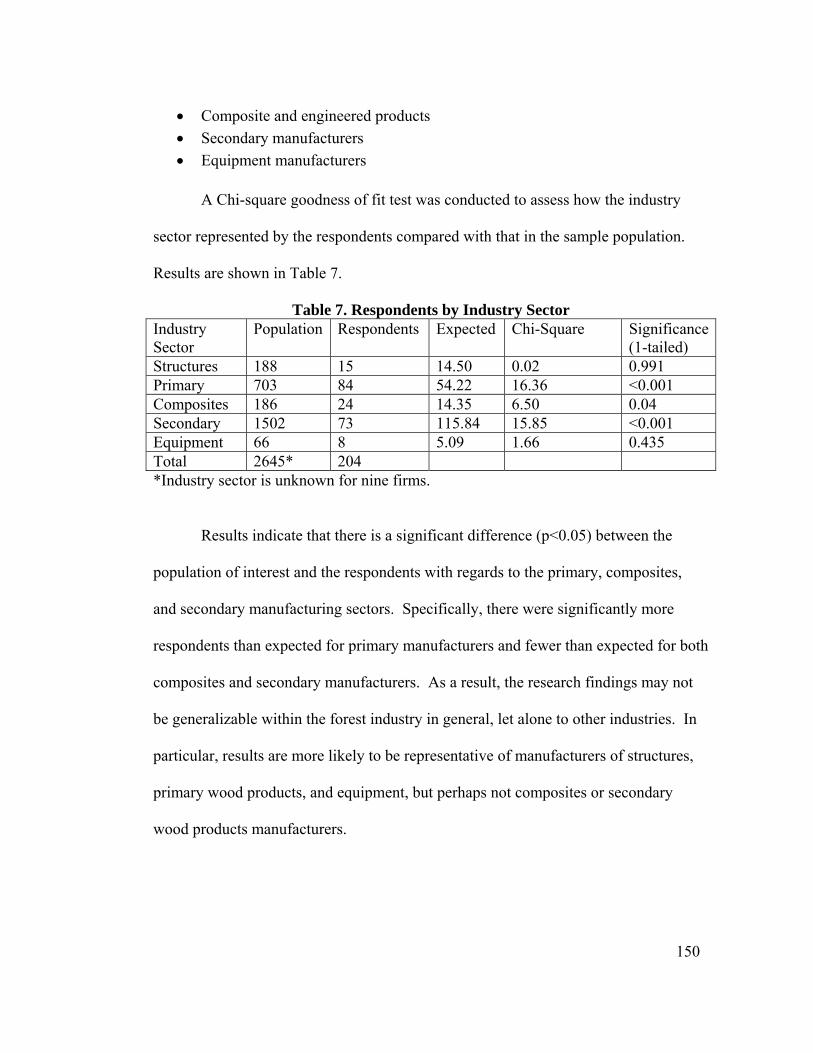
150
• Composite and engineered products • Secondary manufacturers • Equipment manufacturers
A Chi-square goodness of fit test was conducted to assess how the industry
sector represented by the respondents compared with that in the sample population.
Results are shown in Table 7.
Table 7. Respondents by Industry Sector Industry Sector
Population Respondents Expected Chi-Square Significance(1-tailed)
Structures 188 15 14.50 0.02 0.991 Primary 703 84 54.22 16.36 <0.001 Composites 186 24 14.35 6.50 0.04 Secondary 1502 73 115.84 15.85 <0.001 Equipment 66 8 5.09 1.66 0.435 Total 2645* 204 *Industry sector is unknown for nine firms.
Results indicate that there is a significant difference (p<0.05) between the
population of interest and the respondents with regards to the primary, composites,
and secondary manufacturing sectors. Specifically, there were significantly more
respondents than expected for primary manufacturers and fewer than expected for both
composites and secondary manufacturers. As a result, the research findings may not
be generalizable within the forest industry in general, let alone to other industries. In
particular, results are more likely to be representative of manufacturers of structures,
primary wood products, and equipment, but perhaps not composites or secondary
wood products manufacturers.

151
A Chi-square goodness of fit test was also conducted with respect to firm size
(number of employees). Results are shown in Table 8. As can be seen, the target
population is composed of predominantly small firms. Results indicate there were
significantly more respondents than expected for firms with more than 100 employees.
The findings may therefore be more representative of larger, rather than smaller firms.
Table 8. Number of Employees in Population vs. Survey Respondents # of Employees Population Respondents Expected
Chi-square
Significance(1-tailed)
10 – 100 2201 143 167.37 3.55 0.17100 – 500 313 42 23.80 13.91 <0.001500+ 24 8 1.83 20.89 <0.001Total 2538* 193
*Number of employees was not provided for 116 firms (and 11 respondents)
However, there are other factors that influence generalizability of the findings.
According to Eisenhardt, generalizability for case research occurs when findings are
confirmed by a broad range of literature on the topic [86]. Hence, while industry
sectors and firm size represented by the survey respondents may not fully represent the
population of interest, findings may still be generalizable within and beyond the
industry studied to the extent that findings are confirmed by other research.
Correspondence of the findings with prior research is discussed below in the
‘enfolding the literature’ phase of Data Analysis Phase 2.
Data Analysis Phase 1 – DEA and Cluster Analysis
DEA resulted in identification of 26 ‘efficient’ firms. Efficiency scores and
weights resulting from the analysis are shown in Appendix E. The dendrogram
152
resulting from the cluster analysis is shown in Figure 10 below. As discussed above,
the cluster analysis served to identify efficient firms who rated themselves high on
both quality and innovation performance (‘balanced’ firms) and those who rated
themselves high primarily on quality but not innovation (‘quality-oriented’ firms). As
can be seen from the dendrogram, there are three firms (DMUs 2740, 1235, and 1833)
in the cluster near the middle that have average quality scores of five (on a five-point
scale) and the highest average innovation scores (all above four) of all the efficient
firms. Therefore, these three firms were deemed the most appropriate candidates for
balanced firms.
By contrast, there are two firms (DMUs 2967 and 385) that also have average
quality scores of five; however these firms average innovation scores are below 2.2.
And while there are four firms that have lower innovation scores (e.g., DMUs 143,
1485, 1543, and 1508) none of these firms combine this low innovation score with an
average quality score of five. For this reason, only firms 2967 and 385 were selected
as candidates for quality-oriented firms.
Each of these five firms (three balanced and two quality-oriented) firms were
contacted and asked to participate in an interview. Two of the three balanced firms
(DMUs 1235 and 1833) agreed to participate in an interview. As discussed
previously, the third firm (DMU 2740) declined to participate in that the company was
no longer a manufacturer. The two balanced firms are highlighted with a square in

153
Figure 10. Both quality-oriented candidate firms (DMUs 385 and 2967) agreed to
participate; these firms are highlighted with an oval in Figure 10.
Figure 10. Cluster Analyis Dendrogram and Average Performance Responses for DEA-Efficient Firms
Table 9 shows the characteristics of the case firms and interviewees at each
firm.
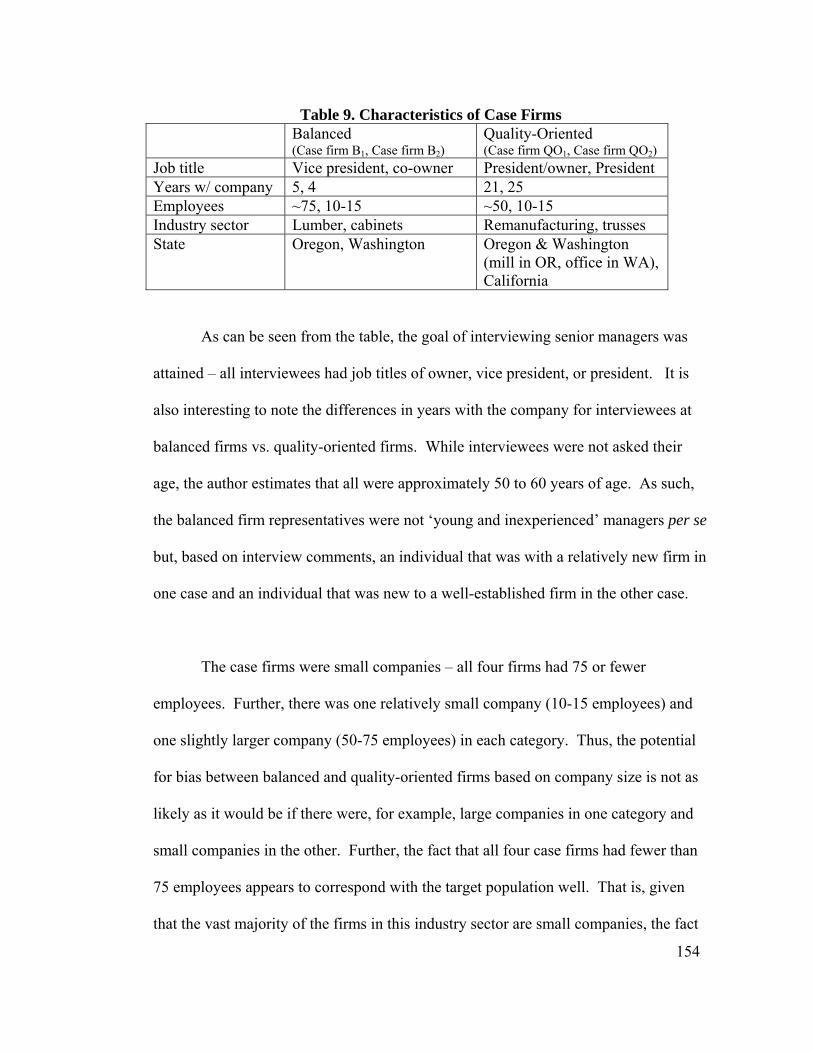
154
Table 9. Characteristics of Case Firms Balanced
(Case firm B1, Case firm B2) Quality-Oriented (Case firm QO1, Case firm QO2)
Job title Vice president, co-owner President/owner, President Years w/ company 5, 4 21, 25 Employees ~75, 10-15 ~50, 10-15 Industry sector Lumber, cabinets Remanufacturing, trusses State Oregon, Washington Oregon & Washington
(mill in OR, office in WA), California
As can be seen from the table, the goal of interviewing senior managers was
attained – all interviewees had job titles of owner, vice president, or president. It is
also interesting to note the differences in years with the company for interviewees at
balanced firms vs. quality-oriented firms. While interviewees were not asked their
age, the author estimates that all were approximately 50 to 60 years of age. As such,
the balanced firm representatives were not ‘young and inexperienced’ managers per se
but, based on interview comments, an individual that was with a relatively new firm in
one case and an individual that was new to a well-established firm in the other case.
The case firms were small companies – all four firms had 75 or fewer
employees. Further, there was one relatively small company (10-15 employees) and
one slightly larger company (50-75 employees) in each category. Thus, the potential
for bias between balanced and quality-oriented firms based on company size is not as
likely as it would be if there were, for example, large companies in one category and
small companies in the other. Further, the fact that all four case firms had fewer than
75 employees appears to correspond with the target population well. That is, given
that the vast majority of the firms in this industry sector are small companies, the fact

155
that the case firms are also small companies is desirable from the standpoint of
generalizability of research findings to this industry sector.
From the standpoint of industry sectors, three of the five industry sectors are
represented by the case firms – primary (lumber and remanufacturing), secondary
(cabinets), and structures (trusses). The fact that none of the case firms represent
composite products and equipment may limit the generalizability of the findings.
Lastly, from the standpoint of representation of West Coast U.S. states, as can
be seen from the table, two of the case firms’ mills were located in Oregon (1 of which
had its sales office in Washington), one of the case firms was located in Washington,
and the other in California. Therefore, even with a small sample number of case
firms, each of the West Coast states from the sample population is represented.
Data Collection Phase 2 – Case Interviews
As discussed above, interview questions were developed with the intent to
explore each of the management practices (e.g., Leadership, People Management,
Customer Focus) and performance in greater detail, to address the three propositions
presented previously, and to validate the categorization of the firms. To ensure
questions also addressed potential areas of difference between the two categories of
firms, survey responses of the candidate case firms were examined to identify these
differences. For example, there were apparent differences in questions related to
156
People Management; balanced firms gave a score of three and four, and quality-
oriented firms gave a score of one for the question – “We have an organization-wide
training and development process, including career path planning, for all our
employees.”
Draft interview questions were developed and reviewed by two of the author’s
colleagues (other faculty members at Oregon State University) with experience in case
study research. Interview questions were revised based on their suggestions. Revised
questions were then reviewed by an expert panel of five forest industry experts. The
interview questions were again revised based on suggestions from the expert panel.
The four case interviews were conducted in-person at each company with the
person that responded to the questionnaire. Interviews were recorded via digital audio
recorder and then transcribed verbatim. In addition, Internet searches were conducted
to locate additional information on each case firm. Each page on the websites of the
two balanced firms was copied and pasted into a text document. No additional
information was located for the two quality-oriented firms.
With respect to categorization of the firms (balanced vs. quality-oriented)
quotes from interviews with the firms and web-based information for the balanced
firms provide evidence that the case firms were properly categorized.
157
With respect to quality, all four firms were expected to be able to provide
evidence of focus on quality. Examples of quotes from interviews related to quality
include:
“So I think that the quality again, is in the eyes… the beauty is in the eyes of the beholder, it’s in the eyes of the consumer.” Case firm QO1 “Quality control is just something that the business was built on…” Case firm QO2 “I mean we are very very quality conscious and when we’re putting out the best product in the game, you’ve got to be the best.” Case firm B1 “If anybody is eyeing quality and not just low-bid, I think we are by far the best value.” Case firm B2
Web-based information for the balanced firms provides additional evidence of
the firms’ emphasis on quality:
“to further ensure the quality of the product, [product trade name] are checked for quality, grade and moisture content before and after they are dried” Case firm B1 (from 3rd party website) “[Company name] set themselves apart from the competition with quality, craftsmanship & service.” Case firm B2 (from company’s website)
As expected, the balanced firms also provided evidence of innovation
performance. Examples of quotes from interviews include:
“We spent a lot of money so far developing a two-head CNC machine that will automatically put that look on.”

158
Case firm B1 – response to question about new product development; indicative of process innovation as a prerequisite for product innovation. “We started out with a 1-1/8 [inch] exterior grade particleboard and then we bonded a backer sheet and a top laminate sheet; we used the type two water resistant PVA, polyvinyl acetate glue, and tried to make it as waterproof as possible.” Case firm B2 – discussing new product development to ensure product durability.
Websites for the balanced firms provide additional evidence of the firms’
emphasis on quality and/or innovation:
“Our dedication to using the latest technologies to improve our products and processes makes us a market leader in high quality [product line]. With innovations such as [product trade name 1] and [product trade name 2] we lead the high-quality market with products and service.” Case firm B1 (from company website) “[company name] uses their [process trade name] to produce the finest quality dry timbers on the market. The [technology] is the only method…” Case firm B1 (from forest industry trade magazine website). Note: most of the quote cannot be shown without violating confidentiality. “Using exterior-grade board and water-resistant glue provides an added measure of long-term durability rarely found in plastic laminate counters.” Case firm B2 (from company website) - discussion of product innovations for the purpose of ensuring product quality (durability). “…field measurements are taken, relevant appliance specs are received and the job is laid out in our [software]. Computer renderings are provided to the customer/ builder/designer/ architect for review and revision, as necessary. Once the layout has been finalized… machine codes are created and sent over the computer network to the shop floor for production.” Case firm B2 (from company website)
In addition, the balanced firms appeared to view innovation as a means to an
end. For example, the quotes above indicate these firms pursued product innovation
159
as a means to improving product quality or process innovation to improve efficiency
and/or as a prerequisite for product innovation.
In contrast, the quality-oriented firms provided evidence of a lack of focus
and/or interest in innovation. Examples of quotes from interviews include:
“I think our actual technology is probably behind our competitors. You know from the standpoint of degree of automation it probably is… So our kind of belief is why let yourself fall into a trap like that? When it’s not a proven technology – in other words, technology is wonderful when it’s proven.” Case firm QO1 – response to question about the processing technology the firm uses “We really don’t. Outside of, like I say if there’s stuff other companies are providing that our customers are asking about... There’s nothing that we have developed along those lines. It’s the industry standard type stuff.” Case firm QO2 – response to question about how new products are developed
Given that the two quality-oriented firms did not have websites, no additional
information is available for these firms beyond their responses to the questionnaire
and interviews. In fact, the fact that the firms do not have websites may serve as
additional evidence of their lack of emphasis on innovation (business systems
innovation in particular). Lastly, and in contrast to the balanced firms, the quality-
oriented firms appeared to view innovation simply as ‘technology’ rather than as a
means to some other goal. The statement, “technology is wonderful – when it’s
proven” made by firm QO1 captures this sentiment well.
Data Analysis Phase 2 – Case Analysis
As described in the chapter on Research Methods, case study data (survey
responses, interview transcripts, and additional information located on the Internet)

160
were analyzed following the guidelines suggested by Eisenhardt [86]. Specifically the
steps taken included:
• Analyzing Data – examining and coding data within and between cases;
• Shaping Propositions - further analyzing the initial propositions and proposing and exploring new propositions that emerged during the analysis (for internal validity);
• Enfolding Literature - comparing findings with existing literature (for external
validity/generalizability); and
• Reaching closure – determining when to stop collecting data and presenting results. Results are presented below following each of these steps.
Data Analysis: Within-Case
Within-case analysis involved reading through the interview transcripts and
web-based information several times and coding comments by theme. For example,
specific quotes of interest within the answer to the question “Describe the modes of
communication in your company…” were coded under the theme ‘communication.’
However, when the interviewee discussed aspects related to communication in
responses to other questions, those quotes were coded under ‘communication’ as well.
The primary intent of the within-case analysis was to code the data in preparation for
the cross-case analysis that followed, including coding related to the three
propositions. In addition, during the coding process, general observations (e.g.,
phrases that were repeated, indications of aspects of company culture, etc.) were made
about each of the firms.

161
Rather than present detailed information on the coding for each firm, general
observations are presented here for each of the case firms. More in-depth analysis is
given below in the section on cross-case data analysis; results of the analysis related to
the propositions are discussed in the section on Shaping Propositions that follows.
Quality-Oriented Firm 1 (QO1):
• Leadership – senior managers’ role is “…accurately defining a business environment today and in five years and being able to integrate the two.”
• ‘Hands-on management’ – the interviewee said this phrase nine times during
the interview. This company president firmly believes in being directly involved in all operations of his business. For example, he worked on the production floor two days a week. As a corollary, the view on employees was “…I don’t believe in employees doing their own thing.”
• People vs. technology – the interviewee stated that companies should “…put
your time and money and effort in your people rather than a computer.” However, other comments such as the comment above related to employee empowerment demonstrated that the primary driver here was not the value placed on the individual but rather that during a down market you have to keep making payments on ‘technology’ whereas employees can be let go.
• Reactive/market-driven – the primary focus was on reacting to what the
market was doing rather than trying to drive the market (i.e., market-driven vs. market-driving). For example, the preference was to use existing processing capacity to react to market opportunities rather than taking the risk to introduce new products. As stated, “…what that comes down to is matching the markets with your technological capacity.”
• Risk-averse – With regards to new product development, the view was,
“…we’d just as soon pass up that quote unquote opportunity …let somebody else break trail.”
• Quality is defined by the customer – “I think quality is perceived… it is
perceived by the customer as to whether or not they buy your product and how much they buy.”
162
Quality-Oriented Firm 2 (QO2):
• ‘Do it right the first time.’ – The interviewee said this phrase four times during the interview (related to strategic planning, process management, and business systems innovation). This was one ‘link in the chain of evidence’ of the firm’s emphasis on quality.
• Emphasis on long-term relationships – with regards to customer satisfaction,
the interviewee simply stated, “We have real good relationships with our customers. Word gets back fast.” And with respect to suppliers, he told a detailed story about how they maintained a relationship with an individual lumber broker; after the broker was unfairly terminated by the broker’s employer, the case firm stayed with the individual in his new employer (i.e., they switched suppliers, in order to maintain the relationship with the same individual broker).
• People vs. technology – as with the other quality-oriented firm, there was an
emphasis on employees using well-established (and perhaps outdated) technology and doing things by hand. And just as with the other quality-oriented firm, this was not an indication of the value placed on employees. For example, when asked about employee involvement in a recent change in the company the response was, “they were simply trained to use the technology.”
• Reactive/market-driven – as the interviewee stated, “We had all the work we
could handle come through the door… of course when things crashed now we’re like OK, time to learn how to go out and sell.” Similarly, the company avoided one particular product line but began to offer the product because 1) competitors were offering it and 2) the market ‘crashed’ so they needed the business.
• Quality as defined by the firm (vs. the customer) – aside from ‘do it right the
first time’, the firm also emphasized using the highest quality raw materials, even when competitors were cutting costs by using lower quality material. In that regard, he stated, “I wouldn’t put something like that out but they [competitors] do it routinely. And so, customer doesn’t know, the average guy doesn’t know.”
• Customer service – the company had a strong focus on serving the end
customer (in their case, the homeowner) rather than just the homebuilder. The
163
interviewee told several stories related to how they would find mistakes on drawings brought in by a homeowner (vs. the contractor who was paying for the product).
Balanced Firm 1 (B1):
• ‘Balance’ on several dimensions – there were several aspects where this firm demonstrated balance, beyond quality and innovation performance:
o People and technology – in the question about employee satisfaction,
the interviewee told a story about their production manager being frustrated by being unable to keep one of their key process innovations operating at full capacity. As the interviewee stated, keeping the innovation running was, “the most important thing”, he also stated, “…my job is balance…to communicate to them that I understand your job, I understand your issues, but here’s why it is how it is.”
o Quality and customer service – the interviewee relayed the story of a
customer complaint - “…out of the 400,000 feet of wood you’ve bought so far this year you’ve got 10 pieces with skip [lumber surfacing defect]. We’re going to try harder but…it’s easier for me to talk to a customer than to go and ratchet down our QC a little bit more. It’s that balance…”
o Structure and flexibility – the interviewee described their process
improvements and innovations as being very structured and rigorous with the use of advanced statistical tools. However, NPD processes were described as being “loosey-goosey” in that he would simply try things in such a way as to not interfere with production.
• Proactive/market-driving – this company purchased another firm that
developed and patented a lumber processing innovation and, then with in-house efforts had “..been able to double the throughput and reduce the capital costs.” Given that the finished product was new to the industry, the firm then worked to train architects (those that specified their products in a structure) about the quality benefits the innovation provided. As such, the firm essentially worked to drive change in the market and thereby generate demand for their product.
164
• Risk-takers – the preceding point as well as several others related to process and product development provided evidence that the firm was amenable to taking risk in developing new technologies, entering new markets, etc.
Balanced Firm 2 (B2):
• ‘Balance’ on several dimensions – as with the other balanced firm, this firm demonstrated balance, although the outcomes and focus were different:
o People then technology - like the other balanced firm, the interviewee
talked about how they had tried to involve and empower employees and create a family atmosphere (e.g., by celebrating employee birthdays during the lunch hour) but struggled to get good employees. As a result, they invested in processing technology to circumvent the need for skilled, dedicated employees.
o Quality and customer service – the company recognized that many of
their customers (contractors) were often too busy to sort through dozens of potential product combinations (wood species, color, finish type, etc.) even while still desiring custom cabinets. So they created four product lines and visited new home construction sites to proactively provide bids.
o Process efficiency and quality – the use of state-of-the art technology
enabled both process efficiencies (“you press a button and it sends it out to the CNC and it’s nested-based, flat table, it just cuts all the pieces”) while also enabling the firm to maintain consistent product quality.
• Proactive/market-driving - the firm felt that durability of existing products
(theirs and their competitors’) was quite poor. So they developed more durable products, which required process innovations as well. They offered a 10-year warranty – something unheard of in the industry - and then tried to educate customers about the benefits of this product in an effort to drive demand. In short, this was not something customers were asking for but rather a product innovation they introduced to the market.
165
• Risk-takers – several of the examples above are evidence of the firm being amenable to risk. One key example is in their proactively providing drawings and bids to contractors. As the interviewee acknowledged, they were assuming a risk here by providing non-copyrighted drawings that could be used by competitors to offer counter-bids.
As can be seen from even this brief summary of each of the case firms, some
themes are beginning to emerge related to similarities and difference between the
firms. These distinctions are explored in greater detail below in the cross-case
analysis.
Data Analysis: Cross-Case
Results are presented here first by areas of similarity between the categories of
firms. Similarities in questionnaire responses are presented first followed by quotes
from interviews that either serve to confirm or disconfirm the questionnaire responses.
This comparison of questionnaire responses with interview comments is one aspect of
triangulation – where multiple sources of evidence converge to either confirm or
disconfirm findings.
The cross-case analysis concludes with a presentation of areas that were either
mixed or different, again beginning with questionnaire responses and concluding with
quotes from interviews. Table 10 presents the cross-case summary of questionnaire
responses with respect to management practices (inputs) and Table 11 presents a
similar summary for performance (outputs).
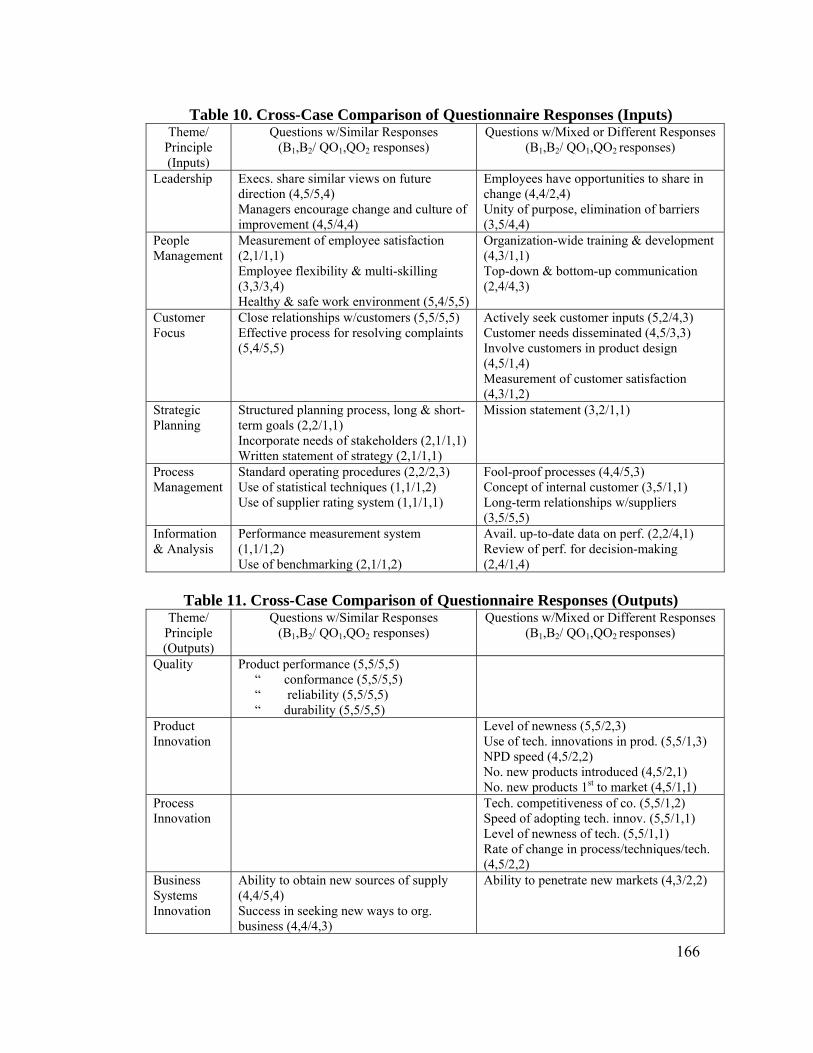
166
Table 10. Cross-Case Comparison of Questionnaire Responses (Inputs) Theme/
Principle (Inputs)
Questions w/Similar Responses (B1,B2/ QO1,QO2 responses)
Questions w/Mixed or Different Responses (B1,B2/ QO1,QO2 responses)
Leadership Execs. share similar views on future direction (4,5/5,4) Managers encourage change and culture of improvement (4,5/4,4)
Employees have opportunities to share in change (4,4/2,4) Unity of purpose, elimination of barriers (3,5/4,4)
People Management
Measurement of employee satisfaction (2,1/1,1) Employee flexibility & multi-skilling (3,3/3,4) Healthy & safe work environment (5,4/5,5)
Organization-wide training & development (4,3/1,1) Top-down & bottom-up communication (2,4/4,3)
Customer Focus
Close relationships w/customers (5,5/5,5) Effective process for resolving complaints (5,4/5,5)
Actively seek customer inputs (5,2/4,3) Customer needs disseminated (4,5/3,3) Involve customers in product design (4,5/1,4) Measurement of customer satisfaction (4,3/1,2)
Strategic Planning
Structured planning process, long & short-term goals (2,2/1,1) Incorporate needs of stakeholders (2,1/1,1) Written statement of strategy (2,1/1,1)
Mission statement (3,2/1,1)
Process Management
Standard operating procedures (2,2/2,3) Use of statistical techniques (1,1/1,2) Use of supplier rating system (1,1/1,1)
Fool-proof processes (4,4/5,3) Concept of internal customer (3,5/1,1) Long-term relationships w/suppliers (3,5/5,5)
Information & Analysis
Performance measurement system (1,1/1,2) Use of benchmarking (2,1/1,2)
Avail. up-to-date data on perf. (2,2/4,1) Review of perf. for decision-making (2,4/1,4)
Table 11. Cross-Case Comparison of Questionnaire Responses (Outputs)
Theme/ Principle (Outputs)
Questions w/Similar Responses (B1,B2/ QO1,QO2 responses)
Questions w/Mixed or Different Responses (B1,B2/ QO1,QO2 responses)
Quality Product performance (5,5/5,5) “ conformance (5,5/5,5) “ reliability (5,5/5,5) “ durability (5,5/5,5)
Product Innovation
Level of newness (5,5/2,3) Use of tech. innovations in prod. (5,5/1,3) NPD speed (4,5/2,2) No. new products introduced (4,5/2,1) No. new products 1st to market (4,5/1,1)
Process Innovation
Tech. competitiveness of co. (5,5/1,2) Speed of adopting tech. innov. (5,5/1,1) Level of newness of tech. (5,5/1,1) Rate of change in process/techniques/tech. (4,5/2,2)
Business Systems Innovation
Ability to obtain new sources of supply (4,4/5,4) Success in seeking new ways to org. business (4,4/4,3)
Ability to penetrate new markets (4,3/2,2)
167
Similarities between Firms – Management Practices
As shown in Table 10, there is no broad management practice for which both
categories of firms responded similarly to all the questions. In general questions
related to Leadership were rated relatively high (three to 5) and either similar or
mixed. The interviews appear to disconfirm the quality-oriented firms’ responses to
the question about ‘managers encouraging a culture of change and improvement…’
This could be a case of a poorly-worded question in that multiple concepts were
embedded in a single question. That is, it is possible that these managers rated
themselves highly on a culture of improvement; and there was some evidence of that
fact, e.g., “do it right the first time”. However there was no evidence of encouraging
change or a culture of improvement in these two firms.
For People Management, the case firms all rated themselves quite low on
measuring employee satisfaction; interviews confirmed this fact. However, there were
apparent differences in how firms viewed the importance of employee satisfaction
(regardless of whether or not it was actually measured). For example:
“We don’t assess employee satisfaction. They either like it or don’t like it.” Case firm QO1 “We communicate well and we’re hoping in this market anyway that job satisfaction goes a long way. And job satisfaction is being open and heard and respected and all the things that anybody would want.… and knowing when someone’s frustration is actually resulting in lost production, in lost opportunity, in loss of quality.” Case firm B1
Interviews confirmed the fact that all the firms had some approach to employee
flexibility and multi-skilling (i.e., cross-training).
168
Lastly with regards to People Management, it is not surprising that all firms
rated themselves highly for having a safe and healthy work environment given that
this is a key area of concern in manufacturing, wood products manufacturing in
particular. Further, one would not expect a senior manager to report on a survey that
they did not focus on employee safety and health.
With regards to Customer Focus, the case firms rated themselves highly in
having close relationships with customers and in having effective processes for
resolving complaints. No questions were asked during the interviews on these topics,
however all of the firms made comments about the importance of close relationships
with customers and hence there is evidence to validate the respondents’ high ratings
for this practice.
There was very close agreement in the low scores given for Strategic Planning.
Given that all four case firms were small companies (all had 75 or fewer employees),
low emphasis in this area is not surprising. In general, the interviews for the two
quality-oriented firms confirm these low ratings in that the firms responded to the
question about long-term planning with statements such as:
“Which way is the wind blowing? I think what you’ve got to do is you’ve got to sit back, take a look at the economic environment that you’re in, take a look at the markets you’re in, which do you focus on, which do you not focus on.” Case firm QO1 “To try and survive, we just cut costs everywhere we can.” Case firm QO2
169
However, one of the balanced firms made statements that appear to disconfirm
the low rating they gave themselves on the questionnaire for activities related to
Strategic Planning:
“…where we want to be in three years, five years, and once we decide, our vision statement now is we want to be the number one place in North America to come to for any type of [product line]. When somebody thinks [product line], we want them to call us first… We focus on facility development, what services and products to provide, market development, developing strategic partnerships with clients,… financial planning, business control procedures.” Case firm B1
Case firm B2 was not able to articulate how they approached strategic
planning. As such, perhaps their questionnaire responses were accurate. However,
the interviewee talked about proactively seeking new customers, developing new
products, etc. that demonstrates the firm had an approach that was perhaps more
implicit than explicit.
For Process Management, all the case firms rated themselves quite low on the
use of standard operating procedures (SOPs), statistical techniques, and a supplier
rating system. While no interview questions addressed SOPs or supplier rating
systems, there were questions about quality tools, including statistical tools. For three
of the firms, the low rating on the questionnaire was confirmed in that interviewees
did not use the majority of the quality tools listed such as statistical process control,
design of experiments, etc. However, case firm B1’s response to this question
disconfirms the low rating they gave this item:
“And that’s why we can get to our operating results we do out of those [equipment] because it’s statistics statistics statistics… Statistical Process Control, we do that in
170
our QC. We keep track of all sorts of things. Checksheets – when I said that we had fairly strong procedures, once we decide to make a procedure change, and that gets into checksheets. Cause and effect diagrams – not so much for the production, but [manager name] and I use them a lot. … Histograms – pages and pages from all sorts of departments…” Case firm B1
In general, case firms rated themselves relatively low on management practices
related to Information & Analysis. The use of an effective performance measurement
system and benchmarking in particular were rated quite low. Interview responses
appear to confirm the lack of emphasis on a performance measurement system. And
the quality-oriented firms confirmed their lack of emphasis on benchmarking:
“Absolutely not. I don’t care what my competitors do. I don’t look at them. I don’t think about them. Fifteen years ago I did. And that was a mistake. I think that you do what you do and you run hard.” Case firm QO1 “For the most part when you hear feedback it’s after you’ve done the job and they say well you were $2000 cheaper than this guy” Case firm QO2 – interviewee stated that they benchmarked competitors; however quote suggests that at best, the efforts are passive
However, the balanced firms’ responses to the interviews suggest that they do
in fact benchmark competitors, firm B1 in particular:
“We try and benchmark our uptime for an industrial… for a complex industrial process. We compare very well. We’re running around 98.5 percent of total available time in a day those machines are running. So we’ve got a really really good technology and we find ways to keep it running continually. And so we benchmark ourselves against other industries.” Case firm B1
171
“… our main competitor was [company name]…they dial in things better, they have economies of scale, better purchasing, more efficient… if you go into our jobs and our competitor jobs, I think ours stand out. I think almost all the time very few competitors met our quality.” Case firm B2 – suggests knowledge of competitors only obtainable via active benchmarking
Similarities between Firms – Performance
Given that the two categories of firms were established via cluster analysis on
the survey responses related to quality and innovation performance (outputs), most of
the similarities and differences shown in Table 11 are to be expected. In particular,
the similarity in responses with respect to quality and differences with respect to
innovation are to be expected given the definitions of the ‘balanced’ vs. ‘quality-
oriented’ categories. As stated previously, the interviews confirmed that all four firms
were focused on quality.
However, the firms were far more similar than anticipated with respect to two
questions related to business systems innovation. Specifically, firms responded
similarly on questions related to ‘ability to obtain new sources of supply’ and their
‘success in seeking new ways to organize their business.’ Interviews confirmed these
responses in that all interviewees were able to describe how they had sought and
located new suppliers and how they had reorganized their businesses due to the
ongoing recession at the time of the interviews.
In summary, many of the apparent similarities between case firms with respect
to quality management practices identified in the examination of questionnaire
172
responses were confirmed by the interviews. However, there are a few practices
where the interviews served to disconfirm the questionnaire responses. These
practices merit further exploration in that they may be added to the list of those in the
following section - practices that serve to differentiate between the two categories of
firms. These practices are included in the summary of apparent differences in
practices in Table 12 at the end of this section.
Differences between Firms – Management Practices
The previous section emphasized areas where the case firms responded
similarly to the questionnaire and to interview questions. However, of perhaps greater
interest for addressing the research questions here is where the firms were either
mixed or differ in their practices. Again, questionnaire responses are examined first,
followed by interview data.
With regards to Leadership, questionnaire responses (Table 10) suggest that
the results were ‘mixed’ with respect to the quality-oriented firms’ responses to the
question about ‘employees having opportunities to share in change.’ Specifically,
QO1 rated themselves a two on this question whereas QO2 rated themselves a four.
However, evidence was found to suggest that a much lower rating was warranted for
case firm QO2. For example, in response to the interview question of what role
employees played in the most recent change the company had experienced, the
interviewee stated (without any further elaboration):
173
“Employees were simply trained to use the new technology.” Case firm QO2
Similarly, case firm QO1 stated:
“So, the question is to lead change, I think the employees have got to follow my change. That’s the role of employees – to get someone that can sit back and will do what you tell them to do and not get fancy.” Case firm QO1
Therefore, it appears that this is in fact a practice where the difference between
balanced and quality-oriented firms is more pronounced than was indicated by the
questionnaire responses. In contrast, balanced firms addressed this question with
responses such as:
“And that’s typically how, in our company, we innovate. We rely on our supervisors and our sub-managers and frankly our employees to tweak what’s there and to figure out… here we’ve got this equipment, but if we use it this way we could do better. We encourage them to look at what we’ve got. How do we make what we’ve got a little bit better? …And we really rely on them for that.” Case firm B1
With regards to the Leadership practice of ‘unity of purpose, elimination of
barriers’, results were mixed in that all firms ranked themselves high (four and five)
with the exception of B1 that rated their firm a three. Unfortunately, no interview
questions were asked on this topic. Therefore differences or similarities in this
practice can neither be confirmed nor disconfirmed.
With regards to People Management, balanced firms rated themselves a three
or four on the question related to ‘organization-wide training & development’ whereas
both quality-oriented firms rated themselves one. However, interview comments do
174
not appear to confirm this difference. In fact, it appeared that the results were mixed -
one firm in each category (QO1 and B1) provided evidence of organization-wide
training whereas the other firms in each category (QO2 and B2) did not. For example,
the firms that appeared to have a commitment to training stated:
“we do an enormous amount of in-house training. We do an enormous amount of [lumber] grading... So we start teaching everybody and we cross-train by having not just the graders but the graders and cutters will flip-flop constantly so that they’re constantly being upgraded because that’s such a critical method… for our equipment, we’ll send them to different classes that they have on keeping them up-to-speed on that...” Case firm QO1 “There is a formal training program in all the key areas and just typically - they are started off at a fairly low-risk position… to make sure that we’re training 2, 3, four other guys in a very deliberate way to keep bringing up their level of knowledge.” Case firm B1
Whereas the firms lacking such a commitment stated:
“On-the-job” Case firm QO2 – This was the answer (without elaboration) to the question, “How are new employees trained?” “We didn’t have a formal training process. Which I know, that’s what I always felt - we’d try and get somebody trained in certain areas - yeah, all on the job training. The training, I think if we had better structure...” Case firm B2
Also with regards to People Management, questionnaire responses to the
question related to ‘top-down and bottom-up communication’ were mixed in that case
firm B1 rated themselves relatively low (two) whereas the others rated themselves a
three or four. The interviews did not appear to confirm this assessment by B1. For
example, the interviewee stated:
175
“They all know that they can come and talk to me and it’s not going to go on deaf ears, it’s not going to result in me lashing out or something like that. It’s OK, let’s hear it! And they know that my job is to listen…we flow fairly openly with ideas and communication and all that.” Case firm B1
For Customer Focus, responses were mixed with regards to ‘actively seeking
customer input.’ Case firm B1 rated their firm a five whereas B2 rated themselves a
two; QO1 and QO2 rated themselves a four and three respectively. However, the
interviews did not appear to confirm this difference between balanced firms in that
case firm B2 stated:
“we meet with customers and it’s one to two months by the time you meet with them initially, give them a drawing, bids, go back-and-forth, and revisions by the time they get competitive bids.” Case firm B2
In hindsight, it appears that the nature of firm B2’s business (custom cabinets)
was such that ‘actively’ seeking customer was not needed; products could not be
produced without active customer input. Therefore, evidence suggests the case firms
are more similar than different with respect to ‘actively seeking customer input.’ In
addition, there was little evidence that the quality-oriented firms actively sought
customer input. On the contrary, most evidence suggested these firms relied on
customers to provide them input, as confirmed by comments related to ‘measuring
customer satisfaction’ discussed below.
With respect to the questionnaire responses related to ‘customer needs
disseminated’, balanced firms rated their firms higher on this activity than did quality-
176
oriented firms. Interview responses appear to confirm this difference in that quality-
oriented firms weren’t able to address the practice. In contrast, firm B1 stated:
“It will go first through the account rep to the person that’s handling that account, the specific account. And typically it comes through me. And this customer said this this this. If it’s just anecdotal or if it’s just a one-off frustration, I typically won’t get involved. If it’s something that I sense is substantial or worthy of communication I’ll just talk to the customers directly, I know them all… And if there’s things that we can change, communicate that…. [employees hear about these sorts of things] when it’s an event or an issue that effects our production.” Case firm B1
However, B2’s response did not seem to address the question:
“Since we’re a custom shop – what kind of wood do you want, do you want alder, cherry, maple, hickory, whatever. So go through that, drawer guides, materials, hinges, interior species of the, and all that, color, go through and get all the stuff, the customers to the showroom, here’s all the different alternatives, and it got, so they’d come in – oooh, it’s like a kid in a candy shop.” Case firm B2
The implication of this response could be similar to the previous question – as
a custom shop, disseminating customer input on the product is simply ‘standard
operating procedure’ as it is required to be able to produce the product. Hence, where
firm B1 assumed ‘customer input/feedback’ referred to customer complaints, firm B2
assumed it referred to product design details (wood species, color, etc.).
Results were mixed for the question related to ‘involving customers in product
design.’ Firms B1, B2, and QO2 rated themselves either a four or five on this question,
however QO1 rated their firm a one. Comments from the three firms (B1, B2, and
QO2) provide evidence that these firms involve customers in product design.
However, given that the interviewee at QO1 did not address the question directly, it is

177
hard to say if his comments support the low rating. At the same time, the response to
the question on R&D provides no evidence of involving customers in design:
“We don’t do anything formal. We turn around and take a look and see what’s there and take a look and see what’s in the marketplace and we try to adapt.” Case firm QO1
Finally, with regards to Customer Focus, with respect to ‘measuring customer
satisfaction’, the balanced firms rated themselves slightly higher (three and four) on
this practice than quality-oriented firms (one and two). While none of the firms
provided evidence of actually measuring customer satisfaction (e.g., with formal
questionnaires), the interviewees did provide evidence of a difference between firms:
“I’ll just talk to the customers directly, I know them all.” Case firm B1 “A lot of times it is tracking them down trying to not talk to them on the phone so much but meet them face-to-face… If someone did a formal thing on our customers I think they would rate us very high on customer service. I think extremely high. We tried to use the best products and I think we were always very customer oriented.” Case firm B2 “It’s real simple – if they keep buying from you, they’re satisfied.” Case firm QO1 “Word gets back quickly.” Case firm QO2
In addition, the balanced firms’ websites (and perhaps the mere fact that they
had websites) also provided evidence of a proactive focus on customer
interaction/customer service. For example, B1’s website includes links to CAD
details and specifications for use by architects; the firm also provides an on-line

178
continuing education course certified by the American Institute of Architects. Other
examples include statements on their websites:
“Custom milling services… allow us to produce the product you need, when you need it. We will pull your order to the piece; we will mill and package to your specifications...” Case firm B1 – company website
“[company name] has proudly taken customer service to the next level, providing customers with complimentary cabinet drawings WITHOUT copyright restrictions. Potential customers can have [company name] custom design their cabinet layout, and they are free to show our designs to our competitors to get comparison bids...” Case firm B2 – company website
The bottom line for this topic (‘measuring customer satisfaction’) combined
with the findings above for ‘actively seeking customer input’ appears to be that while
none of the firms actually described a process for measuring customer satisfaction, the
balanced firms were proactive in their approach to interacting with customers whereas
the quality-oriented firms appeared to be far more reactive or passive.
For Strategic Planning, while all firms rated themselves low here, the balanced
firms rated having a mission statement at three and two whereas both quality-oriented
firms rated themselves a one. Interview comments simply supported the notion that
none of the firms placed much emphasis in this area. For example, comments
included:
“Not formal ones no. But we know where we want to go.” Case firm B1 – response to question, “Do you have mission and vision statements?” “I don’t really believe in a mission statement. I think the function of a business is real simple – your job is to make money.” Case firm QO1
179
With regards to Process Management, questionnaire responses were mixed
with respect to ‘fool-proof processes’ in that firm QO2 rated their company a three on
this practice and the other firms rated themselves four and five. Unfortunately, none
of the interview questions directly addressed this practice. Therefore, similarities or
differences between firms cannot be confirmed or disconfirmed.
With respect to firms’ understanding of the ‘concept of the internal customer’
in their firm, balanced firms rated their firms either neutral or high (three and five)
with regards to the concept, whereas both quality-oriented firms rated their firms a
one. Interviews with the quality-oriented firms confirmed their lack of emphasis on
this concept. However, the interviews with the balanced firms provided mixed results.
In fact, B1 that rated their firm a three on the concept provided evidence of
understanding of the concept whereas firm B2 that rated their firm a five, did not
provide evidence indicating their understanding of the concept:
“the core of our business is our [trade name] technology. And in that aspect, that department very much looks at the rest of the company as their customer. For everything after [trade name], the planing, the detailing, the finishing, the texturing, that aspect is… the customer there are our traders, our salesmen, which are also by extension our customers. So I guess you can say from our production… when you step out of just the drying to our next level, we do have that to where they’re serving our traders needs, our salesmen’s needs as well as our customers.” Case firm B1
“…we have better equipment than many companies 10 or 20 times our size. We have good equipment and a high production, high quality… to me a nested base flat table machine makes so much more sense than a beam saw and a point-to-point machine or something like that.” Case firm B2 – response to question about ‘emphasis of internal customer concept’ (response suggests lack of understanding of the concept)
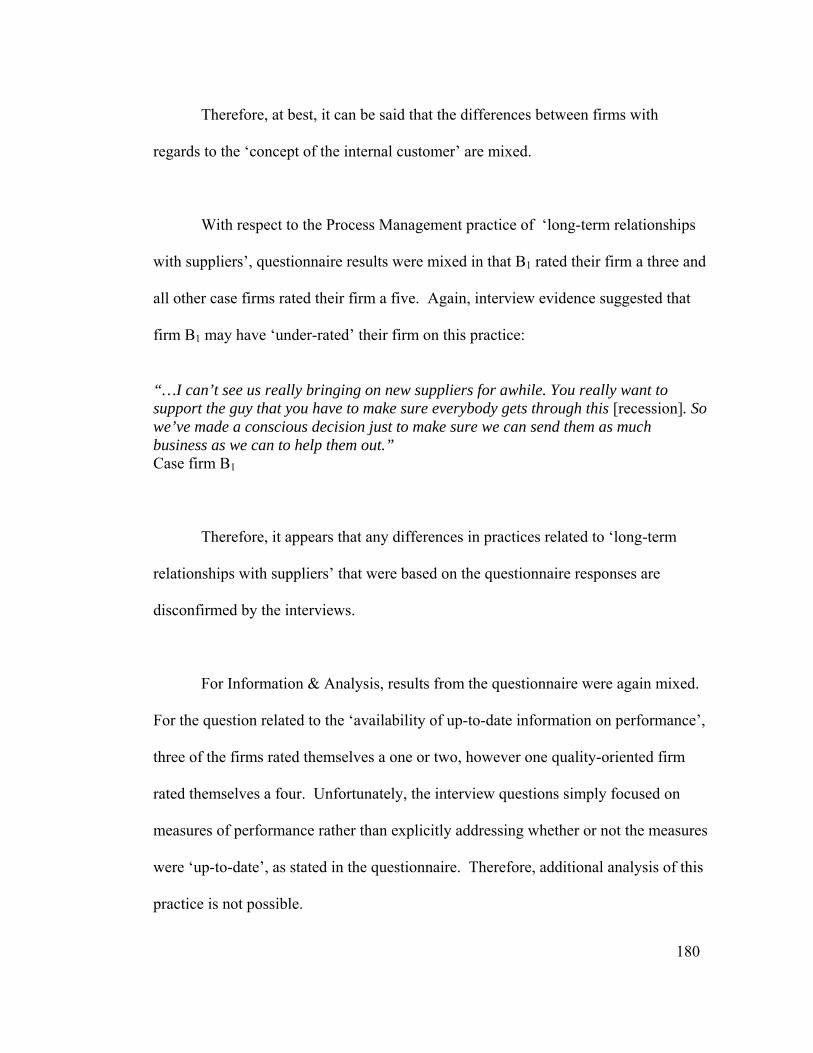
180
Therefore, at best, it can be said that the differences between firms with
regards to the ‘concept of the internal customer’ are mixed.
With respect to the Process Management practice of ‘long-term relationships
with suppliers’, questionnaire results were mixed in that B1 rated their firm a three and
all other case firms rated their firm a five. Again, interview evidence suggested that
firm B1 may have ‘under-rated’ their firm on this practice:
“…I can’t see us really bringing on new suppliers for awhile. You really want to support the guy that you have to make sure everybody gets through this [recession]. So we’ve made a conscious decision just to make sure we can send them as much business as we can to help them out.” Case firm B1
Therefore, it appears that any differences in practices related to ‘long-term
relationships with suppliers’ that were based on the questionnaire responses are
disconfirmed by the interviews.
For Information & Analysis, results from the questionnaire were again mixed.
For the question related to the ‘availability of up-to-date information on performance’,
three of the firms rated themselves a one or two, however one quality-oriented firm
rated themselves a four. Unfortunately, the interview questions simply focused on
measures of performance rather than explicitly addressing whether or not the measures
were ‘up-to-date’, as stated in the questionnaire. Therefore, additional analysis of this
practice is not possible.
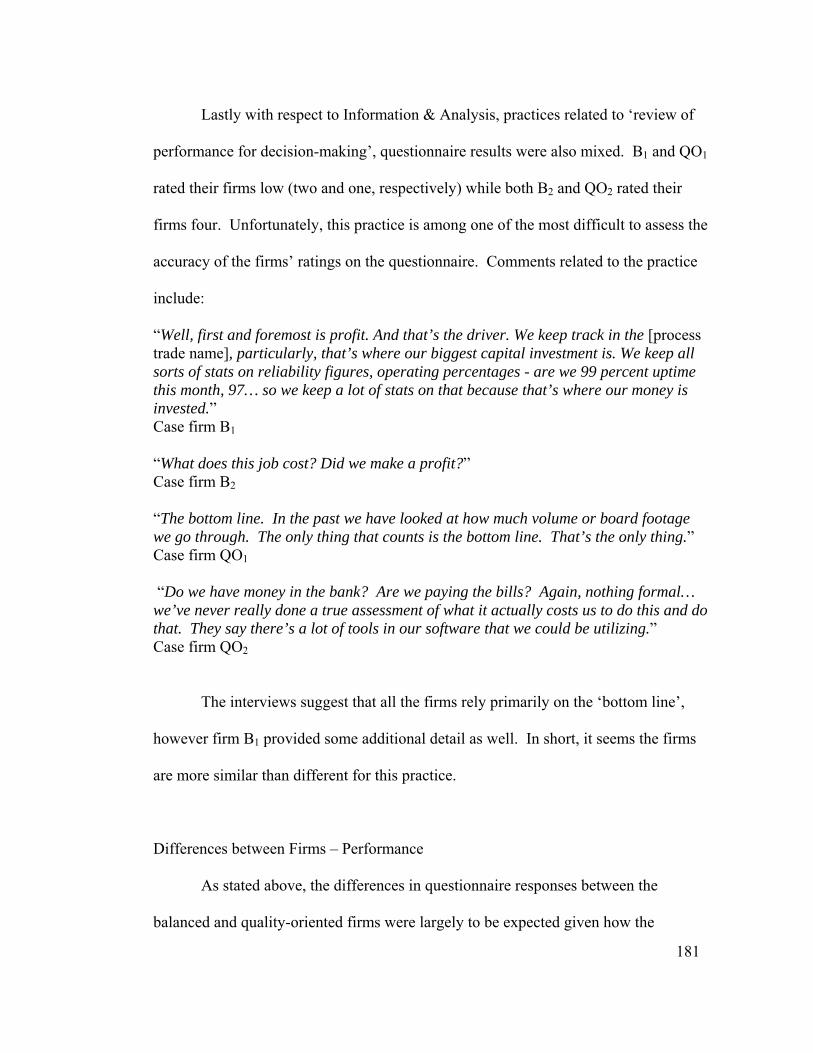
181
Lastly with respect to Information & Analysis, practices related to ‘review of
performance for decision-making’, questionnaire results were also mixed. B1 and QO1
rated their firms low (two and one, respectively) while both B2 and QO2 rated their
firms four. Unfortunately, this practice is among one of the most difficult to assess the
accuracy of the firms’ ratings on the questionnaire. Comments related to the practice
include:
“Well, first and foremost is profit. And that’s the driver. We keep track in the [process trade name], particularly, that’s where our biggest capital investment is. We keep all sorts of stats on reliability figures, operating percentages - are we 99 percent uptime this month, 97… so we keep a lot of stats on that because that’s where our money is invested.” Case firm B1 “What does this job cost? Did we make a profit?” Case firm B2 “The bottom line. In the past we have looked at how much volume or board footage we go through. The only thing that counts is the bottom line. That’s the only thing.” Case firm QO1 “Do we have money in the bank? Are we paying the bills? Again, nothing formal… we’ve never really done a true assessment of what it actually costs us to do this and do that. They say there’s a lot of tools in our software that we could be utilizing.” Case firm QO2
The interviews suggest that all the firms rely primarily on the ‘bottom line’,
however firm B1 provided some additional detail as well. In short, it seems the firms
are more similar than different for this practice.
Differences between Firms – Performance
As stated above, the differences in questionnaire responses between the
balanced and quality-oriented firms were largely to be expected given how the
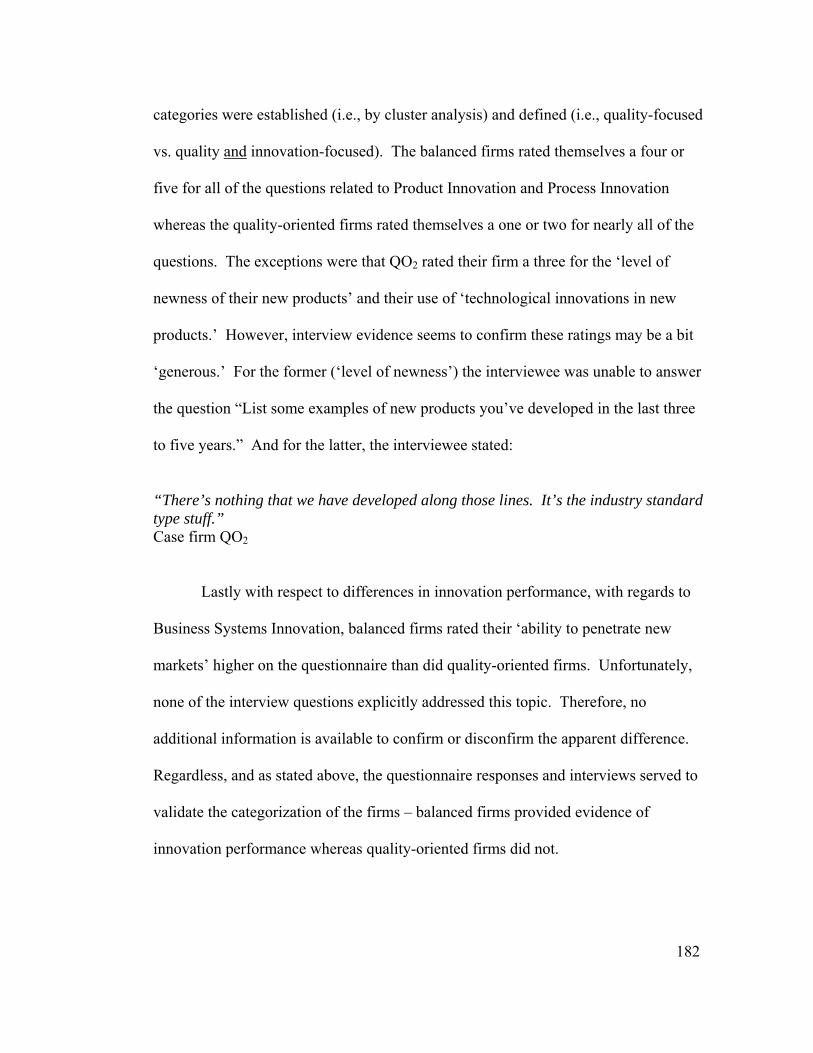
182
categories were established (i.e., by cluster analysis) and defined (i.e., quality-focused
vs. quality and innovation-focused). The balanced firms rated themselves a four or
five for all of the questions related to Product Innovation and Process Innovation
whereas the quality-oriented firms rated themselves a one or two for nearly all of the
questions. The exceptions were that QO2 rated their firm a three for the ‘level of
newness of their new products’ and their use of ‘technological innovations in new
products.’ However, interview evidence seems to confirm these ratings may be a bit
‘generous.’ For the former (‘level of newness’) the interviewee was unable to answer
the question “List some examples of new products you’ve developed in the last three
to five years.” And for the latter, the interviewee stated:
“There’s nothing that we have developed along those lines. It’s the industry standard type stuff.” Case firm QO2
Lastly with respect to differences in innovation performance, with regards to
Business Systems Innovation, balanced firms rated their ‘ability to penetrate new
markets’ higher on the questionnaire than did quality-oriented firms. Unfortunately,
none of the interview questions explicitly addressed this topic. Therefore, no
additional information is available to confirm or disconfirm the apparent difference.
Regardless, and as stated above, the questionnaire responses and interviews served to
validate the categorization of the firms – balanced firms provided evidence of
innovation performance whereas quality-oriented firms did not.

183
The results of the cross-case analysis are summarized in Table 12. For each
practice, balanced firms placed either greater or similar (shown as ‘mixed’) emphasis
than quality-oriented firms on the quality management practice listed. The table
summarizes practices that differ between balanced and quality-oriented firms in that
these practices may serve to differentiate between the categories. As such, these
practices are presented as an initial set of potential ‘best practices’ for firms wishing to
adapt their quality management practices in order to achieve innovation performance
in addition to quality performance. Validating these practices based on findings from
existing research may serve to narrow the list.
Also, there were several practices for which the questionnaire responses
suggested a difference between firms. However, these differences were not able to be
confirmed or disconfirmed in that interview questions did not explicitly address the
practices. Therefore, the most that can be said is that there are potential differences in
these practices and further examination is suggested. The practices are:
• There is a high degree of unity of purpose in our company, and we have eliminated barriers between individuals and/or departments.
• We design processes in our plant to be 'fool-proof' (preventive-oriented)
. • Up-to-date data and information of company performance are always readily
available for those who need them.
The first and third points in particular are interesting in that they are the only
practices for which quality-oriented firms may have placed higher emphasis than did
the balanced firms.
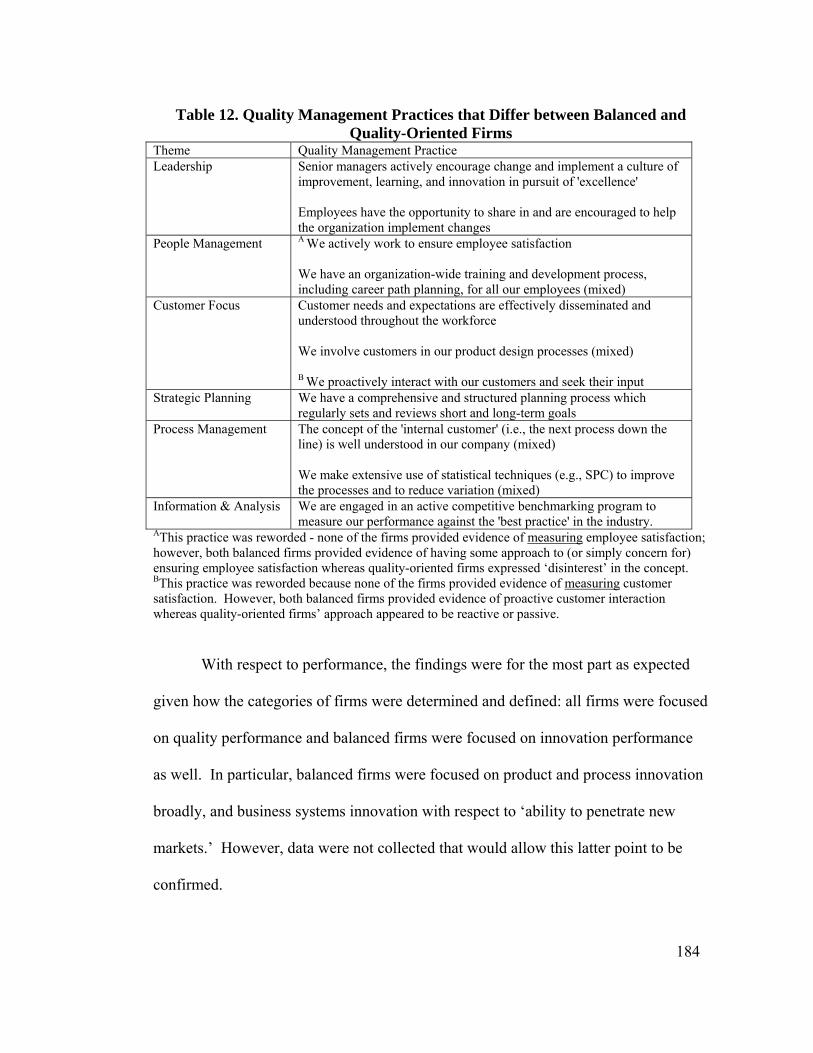
184
Table 12. Quality Management Practices that Differ between Balanced and Quality-Oriented Firms
Theme Quality Management Practice Leadership Senior managers actively encourage change and implement a culture of
improvement, learning, and innovation in pursuit of 'excellence' Employees have the opportunity to share in and are encouraged to help the organization implement changes
People Management A We actively work to ensure employee satisfaction We have an organization-wide training and development process, including career path planning, for all our employees (mixed)
Customer Focus Customer needs and expectations are effectively disseminated and understood throughout the workforce We involve customers in our product design processes (mixed)
B We proactively interact with our customers and seek their input Strategic Planning We have a comprehensive and structured planning process which
regularly sets and reviews short and long-term goals Process Management The concept of the 'internal customer' (i.e., the next process down the
line) is well understood in our company (mixed) We make extensive use of statistical techniques (e.g., SPC) to improve the processes and to reduce variation (mixed)
Information & Analysis We are engaged in an active competitive benchmarking program to measure our performance against the 'best practice' in the industry.
AThis practice was reworded - none of the firms provided evidence of measuring employee satisfaction; however, both balanced firms provided evidence of having some approach to (or simply concern for) ensuring employee satisfaction whereas quality-oriented firms expressed ‘disinterest’ in the concept. BThis practice was reworded because none of the firms provided evidence of measuring customer satisfaction. However, both balanced firms provided evidence of proactive customer interaction whereas quality-oriented firms’ approach appeared to be reactive or passive.
With respect to performance, the findings were for the most part as expected
given how the categories of firms were determined and defined: all firms were focused
on quality performance and balanced firms were focused on innovation performance
as well. In particular, balanced firms were focused on product and process innovation
broadly, and business systems innovation with respect to ‘ability to penetrate new
markets.’ However, data were not collected that would allow this latter point to be
confirmed.
185
The fact that the balanced and quality-oriented firms may be similar with
respect to two aspects related to business systems innovation (‘ability to obtain new
sources of supply’ and ‘success in seeking new ways to organize their business’) was
not expected. At the same time, given that raw material supply is one of the key
challenges for the forest industry (and something at which all successful firms must
become adept) and the fact that the nation was in a recession when this research was
being conducted, perhaps it should not be surprising that there were similarities among
case firms in these areas.
Shaping Propositions
Within- and cross-case analysis also included a focus on addressing the three
propositions stated in the Research Methods section as well as ‘shaping’ and
examining new propositions that emerged from the data. The initial propositions are
repeated here followed by confirming or disconfirming evidence and the conclusions.
Finally, a new emergent proposition is stated along with supporting evidence.
• Proposition 1: Firms that emphasize a combination of hard and soft factors of TQM outperform (with respect to quality and innovation performance) firms that emphasize primarily the hard factors.
• Proposition 2: Firms that implement TQM companywide outperform (with
respect to quality and innovation performance) firms that have a more narrow focus.
• Proposition 3: Firms that have both an internal and an external focus
outperform (with respect to quality and innovation performance) firms with primarily an internal focus.
186
Proposition 1 – Hard vs. Soft Factors/Tools
Based on the distinctions between the categories of firms (balanced vs. quality-
oriented), this proposition may be restated as:
• Proposition 1 (restated) – balanced firms emphasize both hard and soft factors of TQM whereas quality-oriented firms emphasize primarily hard factors.
The first approach taken to address this proposition was to examine Table 11
(revised with the summary results shown in Table 12) to look for indications that the
firms are different with respect to the ‘soft’ factors (and in particular, that balanced
firms place greater emphasis in these practices) and at the same time, that the firms
were similar with respect to the ‘hard’ factors. The first three rows in the table
(Leadership, People Management, and Customer Focus) represent the soft factors and
the last three rows (Strategic Planning, Process Management, and Information &
Analysis) represent the hard factors. Therefore, strong evidence in support of this
proposition would be: 1) the table cells for the soft factors were empty in the
“Questions w/ Similar Responses” column and 2) the table cells for the hard factors
were empty in the “Questions w/Mixed or Different Responses” column. Statement 1
would provide evidence that balanced firms place greater emphasis on the soft factors
and Statement 2, that all firms place similar emphasis on the hard factors.
A limitation of the approach just described is that it assumes the practices are
equally important. That is, from the standpoint of impact on quality and/or innovation
performance, perhaps the Customer Focus practice of ‘actively seeking customer
input’ should receive twice the ‘weight’ as having an ‘effective process for resolving
187
complaints.’ Unfortunately, the literature does not provide such a weighting scheme.
Therefore, the assumption is made that the practices are equal in importance, with the
acknowledgment that this is likely not strictly accurate.
Examination of Table 11 shows that no such clear distinctions existed. In fact,
on the contrary, the cross-case analysis shows that there are apparent differences in
practices within each of the themes regardless of the ‘hard/soft’ factor distinction.
Hence, this first ‘link’ in the chain-of-evidence suggests that the proposition is not
supported.
A second approach to evaluation of the evidence was stated in the chapter on
Research Methods – particular attention was given during coding to practices related
to People Management (soft), Customer Focus (soft), Process Management (hard), and
Information & Analysis (hard). However the entire transcripts were coded for
statements that reflected emphasis on either a hard or a soft factor. The number of
comments that were related to a hard factor and those related to a soft factor were then
tallied for each case firm. Many of the quotes in the previous section would serve as
examples of such coding. For example, a statement related to the use of statistical
process control would be coded as a hard factor and a statement related to efforts made
to interact with customers would be coded as a soft factor. Table 13 below shows the
results of this tally.
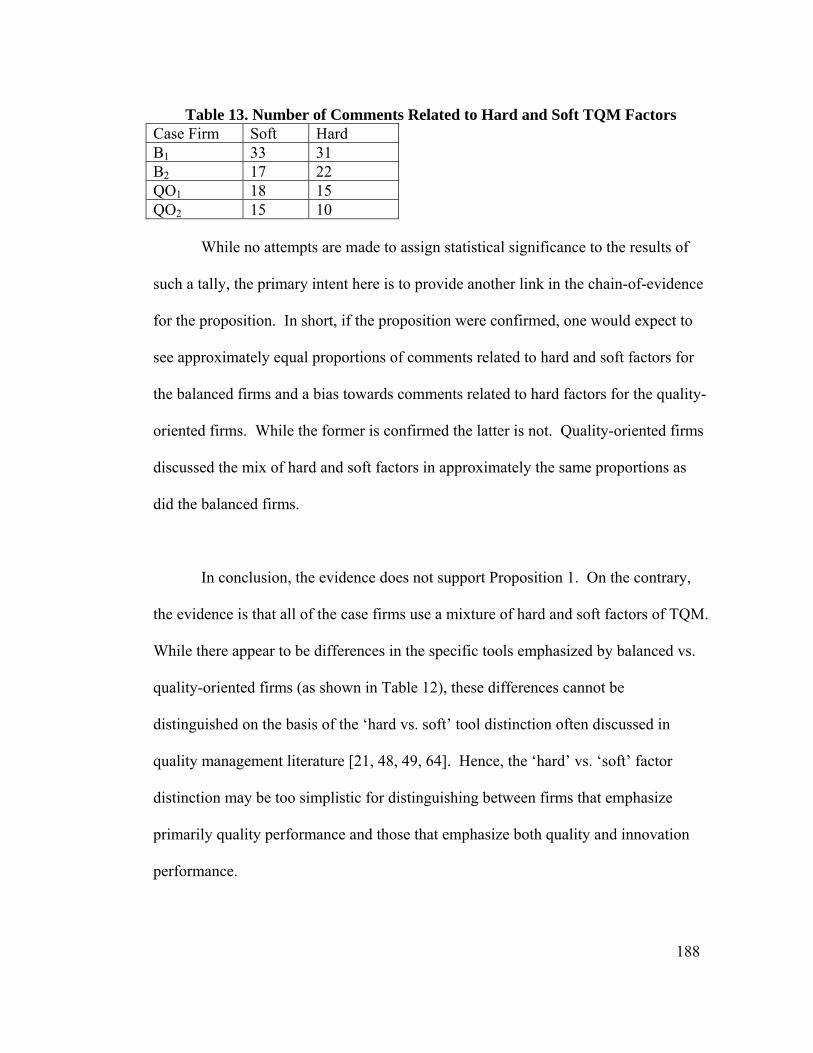
188
Table 13. Number of Comments Related to Hard and Soft TQM Factors Case Firm Soft Hard B1 33 31 B2 17 22 QO1 18 15 QO2 15 10
While no attempts are made to assign statistical significance to the results of
such a tally, the primary intent here is to provide another link in the chain-of-evidence
for the proposition. In short, if the proposition were confirmed, one would expect to
see approximately equal proportions of comments related to hard and soft factors for
the balanced firms and a bias towards comments related to hard factors for the quality-
oriented firms. While the former is confirmed the latter is not. Quality-oriented firms
discussed the mix of hard and soft factors in approximately the same proportions as
did the balanced firms.
In conclusion, the evidence does not support Proposition 1. On the contrary,
the evidence is that all of the case firms use a mixture of hard and soft factors of TQM.
While there appear to be differences in the specific tools emphasized by balanced vs.
quality-oriented firms (as shown in Table 12), these differences cannot be
distinguished on the basis of the ‘hard vs. soft’ tool distinction often discussed in
quality management literature [21, 48, 49, 64]. Hence, the ‘hard’ vs. ‘soft’ factor
distinction may be too simplistic for distinguishing between firms that emphasize
primarily quality performance and those that emphasize both quality and innovation
performance.
189
Proposition 2 – Narrow vs. Wide Scope of TQM Implementation
Based on the definitions of the categories of firms, this proposition may be
restated as:
• Proposition 2 (restated) – balanced firms emphasize practices in the three fundamental TQM principles of People Management, Process Management and Customer Focus while quality-oriented firms lack emphasis in at least one of these areas.
As with Proposition 1, the most straightforward approach to address this
proposition is to examine Table 11 (revised with the summary results shown in Table
12) to look for indications of differences in the main categories of People
Management, Process Management, and Customer Focus. In particular, an extreme
example would be if balanced firms placed greater emphasis in all of the practices
related to any of the three themes4. Conversely, the proposition would be
disconfirmed in the event that 1) all of the practices were similar between the firms or
2) quality-oriented firms placed greater emphasis on some of the practices. In short,
the more practices that receive greater emphasis in balanced firms, the more evidence
there is to support the proposition.
The cross-case analysis provides evidence that balanced firms place greater
emphasis in specific practices in all three of the areas. The evidence is strongest for
Customer Focus – balanced firms emphasized two practices (‘dissemination of
customer needs’ and ‘proactively interacting with customers/ actively seeking
customer input’) to a greater extent than did quality-oriented firms. Also for Customer 4 As with Proposition 1, the same limitation of assuming equal importance for the practices is acknowledged.
190
Focus, one additional practice (‘involving customers in product design’) was identified
as ‘mixed’, i.e., one of the balanced firms emphasized the practice more than the
quality-oriented firms, whereas the other balanced firm did not. With regards to
People Management, balanced firms emphasized one practice (‘ensuring employee
satisfaction’) to a greater extent than quality-oriented firms and another practice
(‘organization-wide training & development’) was mixed. Lastly, for Process
Management, the results are ‘mixed’ for two practices (‘concept of the internal
customer’ and ‘use of statistical techniques’) Further, none of the firms placed much
emphasis on two practices in this area (‘standard operating procedures’ and ‘supplier
rating system.’). Hence, the evidence is the weakest for differences related to Process
Management. Taken together, there is evidence in support of the proposition.
Unlike with Proposition 1, simply tallying comments related to each of the
themes (People Management, Process Management, and Customer Focus) may be
misleading for this proposition. For example, knowing that a firm made ‘25
comments related to Process Management’ whereas another made ‘16 comments’ does
not reveal the breadth or depth of the content of the comments. That is, the firm that
made 16 comments may have been discussing a wide variety of Process Management
practices in use by the firm whereas the other may have made all 25 comments about
the same practice. Therefore, the cross-case analysis stands alone as the available
evidence for this proposition.
191
In conclusion, there is moderate evidence to support Proposition 2. In
particular, there is evidence that balanced firms have a wider scope of implementation
of TQM, particularly with regards to practices related to Customer Focus, and to a
lesser extent People Management. The evidence related to emphasis on Process
Management practices is mixed and in fact, there is evidence to suggest none of the
firms placed much evidence on several of the practices.
Proposition 3 – Internal vs. External Focus
As with the other propositions, rewording this proposition to reflect the terms
used in the research helps to more effectively address the proposition. Further, given
that the proposition contains several distinct facets, it is divided into three components
to simplify analysis:
• Proposition 3a – Both quality-oriented and balanced firms emphasize People Management and Process Management (internal focus)
• Proposition 3b – Quality-oriented firms’ approach to customer interaction as
well as to understanding competitors is primarily reactive or passive (internal focus); balanced firms take a more proactive approach to customer interaction and to their competitors (external focus).
• Proposition 3c – Quality-oriented firms view customers narrowly, i.e., ‘direct’
customers – the entities to whom they sell their products (internal focus); balanced firms view customers more broadly to include end users (whether or not they are direct customers), other stakeholders, their communities, and the environment (external, ‘systems’ focus).
Each ‘sub-proposition’ is examined separately followed by the overall
conclusion related to the proposition.
192
The results of the cross-case analysis again serve as the evidence to examine
proposition 3a. Strong evidence in support of the proposition exists to the extent that
the firms all place similar emphasis on the two themes listed – People Management
and Process Management. Conversely, the proposition would be disconfirmed in the
event that one category of firm placed greater emphasis on all the practices in People
Management and/or Process Management.
The cross-case analysis suggests that both categories of firms emphasized
People Management and Process Management, at least to some extent. While
balanced firms placed greater emphasis on one practice in People Management
(‘employee satisfaction’) the results are mixed for the other practice in this theme
(‘organization-wide training & development’) and for two practices in Process
Management. And as stated previously, there were several practices in Process
Management for which neither category of firm placed much emphasis.
As a result, there is moderate support for Proposition 3a indicating that both
balanced and quality-oriented firms have an internal focus with respect to People
Management and Process Management.
The cross-case analysis as reported above (and shown in Tables 11 and 12) is
less helpful with respect to evaluating Proposition 3b. For this proposition, coding
was conducted to 1) directly examine whether a firms’ approach to customer
interaction was reactive or proactive and 2) in general, how a firm talked about its
193
competitors. For the latter point, comments about benchmarking were particularly
relevant. For the former point, it was noted previously (and shown in Table 12) that
‘proactive interaction with customers…’ emerged as a slight revision to the results of
the cross-case analysis on the Customer Focus practices of ‘actively seeking customer
inputs’ and ‘measuring customer satisfaction.’ Additional evidence in support of this
proposition includes statements from the balanced firms indicating these firms took
the initiative to interact with their customers:
“our main customers, we try to get them out here once a year and let them tour the facility. No matter how many times customers come and visit, every time… a guy could be here four or five years in a row and say the 5th year he comes, ‘I didn’t know you had that!’” Case firm B1 “we really spend a lot of time making sure our website is updated, it’s full, it’s complete, so they can learn about any product and any process in the company. So we do… we use it a lot.” Case firm B1 “What that allowed us to do is basically… to be able to, if we saw sticks in the air type of thing we could stop by, measure it up…” Case firm B2 – ‘sticks in the air’ refers to the wall studs and trusses of a new home being built. Reference is with regards to proactively offering bids to customers. “We contacted a couple, an architect and a couple design guys there in [city] and, hey we think this would be a good service for your customers.” Case firm B2
By contrast, in general, quality-oriented firms indicated more of a passive
interaction with customers:
“You have to have a sound business model. And I think what that comes down to is matching the markets with your technological capacity.” Case firm QO1 – implication appears to be that the firm is focused on reacting to what customers (the markets) are demanding.
194
“The R&D comes in what the marketplace will take today that it didn’t take a year or two years or three years or four years ago. Herein lies the difference and for us, that’s the R&D. Have we looked at a few new products? Sure.” Case firm QO1 – in particular, the ‘what the marketplace will take’ statement suggests a passive or reactive approach. “Business is nearly entirely from word-of-mouth.” Case firm QO2
“they found us to be a little more responsive to call us say there’s a problem and we’d get on it and take care of it.” Case firm QO2
With regards to benchmarking, this practice was addressed in the cross-case
analysis and highlighted in Table 12 as a practice for which balanced firms placed
greater emphasis than did quality-oriented firms. Therefore, the evidence supports
Proposition 3b.
With respect to Proposition 3c, again, coding specific to this proposition was
required. In particular, the coding examined 1) if firms discussed customers beyond
the entities to whom they sold their products and 2) the extent to which companies
discussed other stakeholders such as their communities and the environment. The fact
that both categories of firms provided evidence of these activities indicates a lack of
support for this proposition. Examples of statements from the websites and interviews
include:
“…a dynamic company, that cares about its products, service, and community. [Company name] employees regularly participate in community events, and raise money for charities... [patented process] is efficient, uses clean electricity, and releases zero negative emissions.” Case firm B1 (from company website)

195
“We thought it [proactive bid process] was good for the design guy because… And we thought it was good for the homeowners because… And we thought it was good for the contractors because… And we thought it was even good for our competitors because they wouldn’t have to do design.” Case firm B2 – Broad focus on customers; justifications for the first three stakeholders are not shown to save space. “Maybe a better example I can give you is SFI vs. FSC certification. We’re both.” Case firm QO1 – both these certifications are intended to ensure consumers that products were sourced sustainably from ‘well-managed forests’ – evidence of concern for the environment. “The homeowner had made a comment when he dropped these off about it in his mind the beams were going to be the same as his walls on the house. So I said, no he’s showing 10-foot plates and now they’re going to be nine-foot plates. And I said you want your beams even with that nine-foot plate, and he said yeah. So I said, OK, I’ll design it that way. Even though my design isn’t going to match the plan it’s what the homeowner wants.” Case firm QO2 – reference to focus on end ‘user’ (homeowner) vs. direct customer (contractor/builder)
In conclusion, there is evidence in support of two of the three sub-elements of
Proposition 3. Specifically, evidence indicates that both balanced and quality-oriented
firms have an ‘internal’ focus as reflected by emphases on People Management and
Process Management. Also, there is evidence that balanced firms take a more
proactive approach to customers and competitors (benchmarking). However, the
evidence suggests that both categories of firms see their firm in the broader systems
context that includes direct and final customers, as well as their communities and the
environment.
While the preceding propositions were those that were developed based on the
review of the literature and prior to data collection, one additional proposition
emerged during the data collection and analysis. As the interviews were being

196
conducted, during interview transcription, and during coding, apparent differences in
company culture emerged. While company culture was not explicitly examined in the
research (aside from passing reference in a question on Leadership), it was difficult
not to notice the differences while talking with interviewees at their place of work.
The proposition may be stated as:
Proposition 4: Companies that are more proactive/strategic will achieve greater performance with respect to quality and innovation than firms that are more reactive/conservative.
Again, the proposition may be reworded to fit the terms used in the research:
• Proposition 4 (restated): Balanced firms will be more proactive/strategic while quality-oriented firms will be more reactive/conservative.
This proposition is deliberately vague with respect to the specific practices or
areas (e.g., strategic planning, customer interaction, supplier relations, etc.) where a
firm may be considered either proactive or reactive. The evidence will show that the
differences exist in several areas and as such appear to be more overarching, i.e.,
‘cultural.’
Several of the quotes presented above provide evidence of the ‘proactive vs.
reactive’ distinction. For example, for Proposition 3b above, the evidence suggested
that the balanced firms proactively interacted with customers whereas quality-oriented
firms were more reactive in this regards. Other evidence in support of the
proactive/strategic emphasis for balanced firms includes:
197
“like I came across the [ultrasound technology]. And I did a lot of research on my own, just saying ‘hey could we ever apply this to [our product line]?’… out of the 100 ideas that I bounce off people in the company, 90 of them don’t go anywhere. Ten of them go far enough that I’ll actually do something. And maybe only one or two will stick.” Case firm B1 – exploration of new technology; willingness to experiment and take risk “we try a lot of… different things around here... There’s nothing we won’t consider.” Case firm B1 – culture of experimentation “one of the challenges we have is when you get a twisted beam… What we’ve done is we’ve found a manufacturer in Ontario Canada who had this particular horizontal saw that they used for logs… So we were able to use the [trade name] and we got them to adapt it for our beams.” Case firm B1 – working with equipment vendors to develop process innovations “So I wanted to get a good showing on this commercial… so that’s when we bought a new edgebander for that project. We saw houses were starting to slow down some. Well, if we get into this commercial…” Case firm B2 – shift in business strategy to enter new market segment “We talked to the two different vendors over in Seattle, hitting the whole area up there. And no one was doing a type two PVA glue…” Case firm B2 – efforts to identify new suppliers for new product line “So he [employee] spent the next year, probably 60 to 80 and even up to 90 hours a week developing the software program. And it worked pretty good. We still… to try and get it out on the market and sell the program we’d have to create a whole Help section but…So anyhow we developed the whole software too for doing this counter program.” Case firm B2 – efforts to develop software for product innovation
Evidence in support of the more reactive and conservative culture in quality-
oriented firms includes:
“when we were busy we were just buried, I mean bring in a complicated job we ain’t got time to mess with it - just take it somewhere else… of course when things crashed now we’re like OK, time to learn how to go out and sell.” Case firm QO2 – reactive approach to changes in the market “...we’ve never really done a true assessment of what it actually costs us to do this and do that. They say there’s a lot of tools in our software that we could be utilizing.” Case firm QO2 – passive or conservative approach to process management
198
“[How do you conduct R&D?] We really don’t. Outside of, like I say if there’s stuff other companies are providing that our customers are asking about.” Case firm QO2 – Reactive business strategy
In short, the initial propositions and the emergent proposition suggest the
following general distinctions between the categories of firms:
• Balanced: These firms are proactive and strategic. They are amenable to risk
and experimentation. As noted previously, the firms appear to view innovation as a means to achieve some other goal such as product quality, improved process efficiency, etc.
• Quality-oriented: These firms are reactive and conservative. They are risk-
averse and focused on meeting present needs or ‘catching up’ to the competition. Innovation is viewed as an expense or simply as ‘technology’; and “technology is wonderful when it’s proven.”
Enfolding Literature
As stated by Eisenhardt [86], this phase of the research is particularly
concerned with testing the reliability and external validity of the findings. Greater
generalizability is attained to the extent that findings concur with existing literature.
Given the focus of the research on relations between quality management and
innovation, particular emphasis is given to the existing literature related to this topic.
This literature was discussed in the review of the literature and summarized in Table 6.
The approach here is to restate the key findings from each study described in Table 6
(as well as several others that are relevant to the topic of quality management as it
relates to innovation) and to then compare and contrast the findings presented in the
current research.

199
The section concludes with a discussion of the context of the forest industry
and how this industry’s structure and current context may influence the findings.
Attention is given as well to findings in the literature related to innovation in the forest
industry that either serve to confirm or disconfirm the present findings.
Literature Related to Relationships between Quality and Innovation
Sitkin et al. were among the earliest authors to discuss possible linkages
between quality management and innovation [24]. While the focus of their study is
not strictly on the relationship to innovation, the connection between innovation and
learning is alluded to by stating that firms must balance stability and reliability (i.e.,
control) with exploration and innovation (i.e., learning). These authors presented a
contingency approach to implementing TQM by proposing that Total Quality Control
(TQC) firms emphasize satisfying existing customers and exploiting existing skills
and Total Quality Learning (TQL) firms emphasize scanning for new customers and
exploring new skills and resources. Findings here confirm these authors’ assertions in
that both quality-oriented firms (which may be analogous to TQC firms) emphasized
satisfying existing customers and only expressed interest in identifying new customers
or markets to the extent that “when things crashed” (quoting case firm QO2) the firm
then recognized it needed to find new customers. Similarly, firm QO1 talked about
new product development in the context of ‘matching the market’ to their existing
production capacity and distribution system.
200
However, Sitkin et al. also stated that ‘benchmarking’ was a practice
emphasized by TQC firms to the extent that it is geared to better understanding
existing customer needs. Findings of the present research disagree with these findings
in that the TQL (balanced) firms emphasized benchmarking whereas the TQC
(quality-oriented) firms did not. This disagreement may well be in how the authors
define the term and the specific focus of benchmarking. Rather than being focused on
identifying industry best practices (as done by TQL/balanced firms), the authors are
referring to identification of customer needs.
In discussing “Overcoming the TQM barrier to innovation”, Samaha states that
“Quality is doing things better; innovation is doing things differently” [31]. In
particular, the author sees benchmarking as ‘perilous’ with respect to innovation in
that benchmarking is a means to ‘catch up’ to the competition. Again this assertion
disagrees with the present research in that both balanced firms emphasized
benchmarking. The distinction may be in the specific focus of the benchmarking
efforts – benchmarking firms within the industry may lead to this ‘catch up’ mentality,
whereas benchmarking best-in-class outside one’s industry may lead to greater
innovation performance. In that the case firms were not asked explicit questions about
whom they benchmark, it is not possible to hypothesize further.
Based on an extensive review of the quality and innovation literature, Prajogo
and Sohal proposed several areas where TQM may have either a positive or negative
impact on innovation performance [30]. Several of these arguments are presented
201
below followed by a brief discussion of how the present research either agrees or
disagrees. With regards to customer focus, the authors state:
• Positive – TQM will encourage organizations to be innovative because they have to seek a better way to meet and exceed customers’ requirements.
o This statement is confirmed to the extent that the balanced case firms proactively sought to interact with their customers.
• Negative – TQM could lead organizations to be reactive in responding to
customers’ needs; may prevent organizations from exploring unserved needs and markets; and may prevent organizations from developing radical new products because of its inherent risk-avoidance philosophy.
o All three of these assertions are confirmed by the quality-oriented case firms; evidence for this was presented above in the section on Shaping Propositions.
With respect to continuous improvement, Prajogo and Sohal state:
• Positive – TQM will encourage change, innovation, and creative thinking in
how work is organized and conducted. o This statement is confirmed with regards to the Leadership practice
emphasized by balanced firms - “Senior managers actively encourage change and implement a culture of improvement, learning, and innovation…”
• Negative – the establishment of a regulatory standard could inhibit innovation because it reduces the ambiguity of a task that is necessitated to enforce innovation.
o Findings of the present research are ‘mixed’ on this point. In contradiction to this statement, in spite of a regulatory standard, one balanced firm sought to differentiate itself from competitors by developing a process innovation that would enable the firm to exceed the standard. And in concurrence with the statement, one quality-oriented firm stated that their quality efforts were simply geared to meeting the standard.
Lastly, with respect to continuous improvement, Prajogo and Sohal state:
• Positive – employee empowerment should make people feel they have a
certain degree of autonomy, are less constrained by technical or rule-bound aspects, and self-efficacious in doing their work, which will make them innovative.
o This was confirmed by firm B1 by the comment, “We rely on our supervisors to tweak what’s there…” Further, there was little evidence
202
that the quality-oriented firms empowered their employees thus demonstrating that lack of empowerment may be correlated with lack of innovation performance.
• Negative – while conceptually empowerment and involvement are very much
congruent with innovation, in practice, workers are usually “empowered and involved” to deal only with execution and small scale of improvement.
o This statement is disconfirmed by the present research in that case firm B1 limited empowerment to a worker’s immediate sphere of influence. Regardless, the firm found that workers’ ideas for improvement were not limited to ‘small scale improvement.’
In short, Prajogo and Sohal’s pro and con arguments for how TQM may
impact innovation are mostly confirmed by the case firms. The fact that it is possible
that both of their pro and con arguments for how TQM may impact innovation could
be confirmed is testament to the fact that specifically how a company implements
TQM can significantly influence the performance outcomes with respect to quality
and/or innovation.
While the literature discussed above emphasized hypothesized relationships
between quality management and innovation, several authors have also conducted
research to test these relationships. For example, Lin and Lu explored a causal
relationship between quality and innovation in examining product innovation in the
automotive industry [80]. Results showed that “automakers actively engage in
product innovation if they produce high-quality products”, or more simply that
“product quality determines product innovation.” Both balanced case firms confirm
this finding in that the firms developed product innovations as a means to improve
product quality. For example, case firm B1 developed a new product line by
203
guaranteeing certain aspects of product grade5 and similarly, case firm B2 developed a
new countertop with a 10-year warranty (durability dimension of quality).
Bossink conducted a case study to examine the use of specific quality tools for
an innovative homebuilding project in the Netherlands for which results suggest a
supportive function of quality in the management of innovation [100]. Further, it is
suggested that quality tools are used implicitly and sometimes explicitly to manage
innovation, for example, benchmarking and customer satisfaction measurement are
used in both quality as well as innovation management; a key finding was that
customer satisfaction measurement contributed to the initiation of innovation. The
finding with respect to benchmarking is confirmed in that benchmarking was
identified as a practice emphasized by both balanced case firms but not by the quality-
oriented firms. However, as stated previously, while none of the case firms explicitly
measured customer satisfaction, the balanced firms took a more proactive approach to
interacting with customers. And given that this interaction was often discussed in the
context of discussions about customer feedback, perhaps ‘proactive interaction with
customers’ may be conceived as a ‘low-intensity form’ of customer satisfaction
measurement. And by contrast, one may speculate that ‘reactive customer interaction’
does not have the same impact on innovation to the extent that the relationship is
driven by the customer rather than the firm. This may be an area where further
research is warranted.
5 Unfortunately, it is difficult to be more explicit here about the features without risking violation of confidentiality assured to respondents/interviewees.

204
McAdam et al. examined the organizational progression from quality to
innovation in 15 small (fewer than 100 employees) firms in Ireland [23]. The firms
were evaluated based on quality and innovation award criteria and given a score for
innovation and continuous improvement. The authors report that there were
significant similarities between firms that got high scores on both quality and
innovation. The authors state that Total Quality “…lays the foundation for a cultural
environment that encourages innovation.” It is difficult to determine if this finding is
confirmed by the present research in that cause and effect are not clear. While there
were apparent cultural differences between the balanced and quality-oriented case
firms, it is not clear if Total Quality ‘laid the foundation’ for the culture that
encouraged innovation in the firms or if the culture influenced how the firms
implement quality management.
Singh and Smith explored “…whether TQM can be used as a vehicle for
inculcating innovation” in Australian manufacturing firms [33]. The authors
concluded there was insufficient evidence to link TQM and innovation and suggested
“It could well be that the TQM constructs and innovation are related in a more
complex way.” Further, an unexpected result of the test for construct validity in the
research was that the construct Product/ Process Management led to poor fit of the
model; use of SPC in particular was eliminated from the model. These authors’
findings are confirmed by the present research in that all four case firms used the
TQM constructs with varying levels of emphasis, however the mix of practices and
emphases that differ between the firms attaining innovation performance and those
205
that do not is quite complex. See for example the discussion of Proposition 1 above
related to the use of hard and soft factors of TQM. Further, the authors’ findings with
regards to Process Management are confirmed as well in that specific practices in this
area received little emphasis by the case firms and the practices that did appear to
differ were ‘mixed’, i.e., one balanced firm emphasized the practice whereas the other
did not.
In addition to proposing pro and con arguments for how TQM might impact
innovation, Prajogo and Sohal took the additional step of conducting research to study
the nature of the relationship; firms studied include manufacturing and non-
manufacturing firms in Australia. In one of their first papers [25], results showed that
TQM significantly and positively relates to quality performance as well as innovation
performance. Further, they found significant correlations between product quality,
product innovation, and process innovation. Similar to Lin and Lu’s findings in the
automotive industry, Prajogo and Sohal suggested the possibility of ‘cross-
fertilization’ between quality and innovation performance. Specifically, they found
that process innovation may mediate the relationship between product quality and
product innovation. The findings of the present research confirm this concept of
‘cross-fertilization’ in that, as stated previously, the balanced case firms pursued
innovation as a means to achieve quality. For example, case firm B2 developed a
product innovation to improve quality (durability); further, this product innovation
required the firm to develop process innovations in order to be able to manufacture the
new product.

206
In another study, Prajogo and Sohal conducted a case study in an Australian
automotive components manufacturer to examine the transition from TQM to ‘Total
Innovation Management’ [82]. One key finding was that the transition in the case
study firm resulted in customer relationship management shifting from reactive
(responding to customer complaints) to being proactive. Further, the firm shifted its
focus from direct customers to end users. While the finding of proactive customer
relationship management is confirmed by the present research, the latter finding
related to focus on end users is not. Case firm QO2 demonstrated significant
investment in working with end users (homeowners in their case) even though the
direct customers were contractors/homebuilders. A final conclusion of interest was
reinforcement of the ‘chain reaction’ (what these authors termed ‘cross-fertilization’ in
a previous article) between process innovation and product innovation; the case firm
implemented automation (process innovation) to improve product quality and was
then ‘forced’ to innovate new products that were suited to the technology. Again, this
finding is confirmed by both balanced case firms in the present research – the firms
pursued both product and process innovation as a means to improve quality
performance.
And finally, with respect to research conducted by Prajogo and Sohal, these
authors extended their research to study the impact of integration of TQM and the
concept they described as Total Innovation Management (TIM) on performance in
Australian manufacturing and service firms [35]. TIM is defined to include
technology management and R&D management. The authors highlight the
207
importance of organizations developing capacities to simultaneously balance
exploitation (maximizing existing resources for efficiency and productivity) and
exploration (maximization of capabilities to develop new skills and resources). The
results contrasted with these authors’ prior research on relationships with innovation –
TQM showed no significant relationship with innovation performance. However,
there was a strong and positive correlation between TQM and TIM. Significant
relations were also shown to exist between product quality and process innovation and
between product innovation and process innovation. The authors state again that these
findings suggest ‘cross-fertilization’ between these performance variables. Given the
strong correlations between TQM and TIM, the authors proposed integrating TQM
and TIM principles and offered two specific areas where this might be achieved:
• Customer focus – organizations should strive to balance efforts to meet current customer needs with R&D focused on meeting unserved needs. Similarly, organizations should serve customer needs through product innovation that is technology push rather than market pull.
o The present research confirms these findings and the author’s choice of verb ‘balance’ is particularly germane here. Both balanced case firms exhibited such efforts to proactively serve existing customers while at the same time, developing new products to exceed customer needs and attract new customers. Also, their technologies were ‘pushed’ in that both case firms described how they worked to educate customers (existing and new) about the benefits of their new products.
• Process management – organizations should strive to balance control and
continuous improvement with technology management that is more focused on radical innovation.
o Unfortunately, the authors provide no further details regarding this point. Therefore, it is difficult to evaluate how findings of the present research may agree or disagree. Case firm B1’s differing approaches to process management and product innovation may serve to confirm the point. Specifically, the interviewee described their approach to process management as quite rigorous whereas product innovation that, in the interviewee’s words was more “loosey-goosey”, indicating that at a
208
minimum, the firm recognized the need to adapt the approach to the goal.
Lastly, with regards to the literature exploring relationships between TQM and
quality and/or innovation, Hoang et al. also tested these relationships; however, these
authors took the additional step of attempting to address the impacts of specific TQM
practices on innovation [104]. The authors studied manufacturing and service firms in
Vietnam. Study results showed that TQM has a strong and positive relationship with
two measures of innovation – 1) level of newness and 2) number of new products and
services developed. However, as there were significant problems with
multicollinearity within the TQM constructs, the authors developed composite
measures for several of the constructs including: Leadership & People Management
(including the constructs for Top Management Commitment, Employee Involvement,
and Employee Empowerment) and Process & Strategic Management (including the
constructs for Process Management, Information & Analysis, and Strategic Planning).
Using the composite measures, results showed that Leadership & People Management
was significantly related to level of newness; only Education & Training and Process
& Strategic Management had significant relationships with both measures of
innovation. The authors concluded that not all TQM factors have an impact on
innovation performance.
Findings of the present research confirm Hoang et al.’s findings in several
ways. At a minimum, their finding that “not all TQM factors have an impact on

209
innovation performance” validates the main thesis of the present research in
attempting to identify those specific practices that do impact innovation performance.
And with respect to the positive impact of Leadership & People Management, the
present research identified specific practices within these areas receiving greater
emphasis by balanced case firms vs. quality-oriented firms. However, Hoang et al.’s
findings with regards to the positive impacts on innovation of Education & Training
and Process & Strategic Management are generally not confirmed by the present
research. Results of the cross-case analysis were mixed with regards to ‘organization-
wide training & development.’ Further, while the practice of ‘structured planning,
long and short-term goals’ was one for which there were apparent differences between
balanced and quality-oriented firms, in general, the practices related to Process
Management and Strategic Planning received little emphasis by any of the case firms.
Forest Industry – Structure, Current Context, and Innovation
The preceding section addressed ‘enfolding the literature’ from the viewpoint
of relationships between quality and innovation without consideration of industry
sector. The author is not aware of any research on this topic specific to the forest
industry however the topic of innovation in the forest industry is receiving increasing
attention from the research community in recent years. In fact, several university
centers and research institutes have been created since 2005 with a focus on
innovation in the forest industry. Examples in North America alone include:
• the Oregon Wood Innovation Center at Oregon State University, created in 2005 (for which the author serves as Director);
210
• change in name, and research focus, of a Canadian forest industry research institute from Forintek Canada to FP Innovations in 2007;
• creation of the Center for Wood Innovation & Sustainability at the
Pennsylvania State University in 2009; and most recently,
• formation of the Wood Innovation Research Group at Virginia Polytechnic Institute & State University in 2010.
Therefore, a more thorough examination of the findings of the present research
must include some discussion of the structure and context of the forest industry and
research related to innovation in the forest industry as well.
The forest industry includes a wide variety of firms that either use wood as
their primary raw material or firms that provide manufacturing equipment to this
industry. The general nature of all of these firms is that the markets for finished
products are very closely linked to new home construction and/or remodeling. Case
firms here were no exception; all four firms produced products for new home
construction and remodeling; products included:
• B1 – large beams and timbers for high-end homes • B2 – custom kitchen and bath cabinets • QO1 – remanufactured products such as door and window trim, interior
paneling and exterior siding • QO2 – roof and floor trusses
Like most industry sectors, significant restructuring has occurred in the forest
industry as a result of globalization. For example, prior to the early 1990s, much of
the pine lumber used by U.S. wood window and door manufacturers came from
ponderosa pine forests in the western U.S. [111]. Beginning in the mid-1990s, an

211
increasing share of this lumber now comes from radiata pine plantations in the
southern hemisphere, with New Zealand and Chile being the leading exporters [111].
As another example, the eastern U.S. was at one time a leader in furniture
production. Hardwood lumber (e.g., oak, maple, walnut, cherry, etc.) for furniture was
sourced from hardwood sawmills located in the eastern U.S. Today the majority of
furniture sold in the U.S. is imported, and a large share comes from China and other
Asian nations. For example, in 1992, 19 percent of furniture sold in the U.S. was
imported; by 2008 that value had risen to 64 percent [112]. Further, the dollar value
of Chinese furniture imports in the U.S. increased from $4.9 billion in 2000 to $14.0
billion in 2008; in the same time period, imports from Vietnam increased from $13.3
million to $1.4 billion [113]. Raw materials (lumber, plywood, etc.) for the furniture
come from eastern U.S. hardwood sawmills as well as from other mills all around the
globe [112].
As previously discussed, the case firms for the present research were small
firms. None were ‘global players’ in the market with respect to product sales; all four
case firms sold either locally or within North America. However two of the firms (B2
and QO2) discussed sourcing their raw materials from global sources, e.g., hardwood
plywood from China and pine lumber from Chile, respectively.
Of particular relevance to the present research is the impact of the ongoing
global recession at the time the data were being collected. Industry analysts have
212
stated that this was one of the worst recessions to impact the forest industry in decades
[114]. Housing starts are often used as an indicator of demand for forest products.
According to the U.S. Census Bureau, housing starts declined from a peak of 1.4
million in 2004 to a record low of 445,000 in 2009 [115]. Reports were widespread in
2008 and 2009 of impacts the decline in the housing market was having on the forest
industry. For example, in April of 2009, Portland, Oregon-based Hampton Affiliates
announced:
“Continuation of the global financial recession, the severe housing market decline, and the resulting impact on Hampton's businesses make it prudent for us to make these adjustments in our operating plans. Customer demand and lumber prices are at historically low levels and most forecasts predict it may be several years before normal housing markets return. Hampton's sawmills at Tillamook, Oregon, and Darrington, Washington, will drop to 60% of normal operating hours…” [116]
The segment of the forest industry that was the target population for this
research was clearly impacted by the recession. While it is unknown how many of the
surveys (298 out of 3305) were returned as undeliverable due to companies going out
of business, in the efficient set (following cluster analysis) at least one of the three
candidate balanced case firms had shifted its operations from manufacturing to
wholesale between when they responded to the questionnaire and when they were
contacted to request an interview. Thus, at the least, the recession likely impacted
response rate as firms were struggling to remain in operation as well as the direct
reduction in the pool of candidates for case studies.

213
Further, all four case firms discussed the impacts the recession was having on
their businesses. In fact, while no explicit attempts were made to examine case firms’
performance with respect to profitability, all of the firms made statements related to
their success in the present economy. For example:
“As residential slowed down and we’ve got this $200,000 cabinet job and counter job, we think that will get our foot in the door to bigger commercial and so that’s why we were willing, even though the slow down, to go ahead and get this edgebander.” Case firm B2 – investment in new technology/equipment for new market “I think our actual technology is probably behind our competitors. You know from the standpoint of degree of automation it probably is. The difference is that we’re making money while our competitors aren’t.” Case firm QO1 – justification for not investing in technology
Therefore, in some way, the recession may have served as a ‘proxy’ of sorts
for profitability and validation of the efficacy each case firm’s business strategy in that
the firms were still operating at the time of the research whereas so many of their
competitors had either curtailed operations (e.g., gone from three shifts to one) or gone
out of business altogether. These comments also further serve to validate the
categorization of the case firms – the balanced firms provided evidence of their
strategy to innovate (or at least adopt innovations) to remain competitive whereas the
quality-oriented firms discussed the fact that not investing in innovation (primarily
process innovations) was a key factor in their success.
With the preceding as a brief overview of the forest industry and how the
context at the time of the research may have impacted findings, attention is now turned
214
to the literature exploring innovation in the forest industry. In particular, literature is
examined with respect to how past findings relate to that of the present research.
As discussed previously, research has revealed little innovation, particularly
product innovation, in forest products manufacturing. Hovgaard and Hansen state
that, despite the fact that innovation has “long been accepted in the business literature
as instrumental to company success, very little research has been done specific to the
forest products industry” [52]. These authors conducted qualitative research to
examine small forest products firms (one to 60 employees) in Alaska and Oregon to
examine how these firms viewed innovation. Although the authors examined
innovation in three categories (product, process, and business systems), the most
common concept of innovation by study respondents was “having a unique product or
process.” The results of the present research confirm this finding to the extent that
product and process innovation distinguished the balanced case firms from the quality-
oriented firms whereas performance related to business systems innovation was
similar between the two categories of firms.
Further, Hovgaard and Hansen identified six steps in the product development
process practiced by respondents; however, respondents did not generally undertake
consistent, structured processes for product development. This finding is also
confirmed by the present research in that the balanced case firms, although involved in
new product development (NPD), could not describe a structured process. Further,
215
one case firm explicitly described the NPD process as “loosey-goosey” in contrast to
the rigorous approach the firm used with respect to process innovation.
Crespell et al. examined innovativeness in the sawmilling sector of the North
American forest industry [117]. The authors state that the forest industry has
traditionally maintained a focus on a low-cost strategy concentrating on wood fiber
recovery (i.e., yield). The present research confirms this statement in that all of the
firms discussed the importance of fiber recovery. For example,
“…the software was working great, the CNC the nested base, minimal waste, maximum yield.” Case firm B2 – discussing computer numerically controlled (CNC) equipment using optimization techniques (‘nesting’) to maximize yield of cabinet parts from each panel (plywood or fiberboard). “The mainstream products are not what you make money at; you make money on what you do with your downfall.” Case firm QO1 – ‘downfall’ is waste; implication is that firms must maximize yield by finding markets for, or producing products from, the waste.
These comments further solidify the distinction between balanced and quality-
oriented case firms; while both firms focus on yield (‘fiber recovery’), balanced firms
do so via processing innovations to minimize waste and maximize yield, quality-
oriented firms emphasize yield via finding markets for waste.
Crespell et al. surveyed sawmills regarding their practices related to
innovativeness and found that respondents rated themselves more innovative with
respect to manufacturing processes as compared to product and business systems
216
innovations. These findings are also confirmed in the present research with respect to
the balanced case firms focus on process innovations and the lack of business systems
innovation as being a distinguishing factor. However, in contrast to these authors’
findings, balanced case firms emphasized product innovation as well. This latter
finding is likely influenced by the fact that Crespell et al. focused on sawmills whereas
the present research focused on the forest industry more broadly (only one of which
would be characterized as a sawmill, and certainly not a ‘traditional’ sawmill).
Peters et al. investigated characteristics of recent technology innovations in
particleboard and composite materials [102]. The authors identified four major
clusters of technology innovations – manufacturing, high technology, materials
processing, and new products; equipment makers dominated innovation in all of these
clusters. Further, “improved product quality” was the predominant source of
economic benefits identified. Findings from the present research confirm these
findings as well, in that balanced case firms discussed either purchasing (i.e.,
adopting) process innovations and/or working directly with equipment producers to
refine the equipment to suit their specific needs. Further, the finding of “improved
product quality” as the principal economic benefit is particularly relevant to the
present research and further supported by the general literature on quality and
innovation with respect to ‘cross-fertilization’ between innovation and product quality
[25, 80]. That is, innovation (both product and process) is often the means by which
higher product quality is achieved, as was the case in both balanced case firms.
217
Lastly, in a study of the Spanish wood products industry, Diaz-Balteiro et al.
examined correlations between firm efficiency and innovation. The authors found
little correlation between efficiency and innovation. Further, they report that there is a
“…low firm priority towards R&D as a means to achieve competitiveness and an
innovation strategy followed by many Spanish firms based on the acquisition of
embodied technology available in international markets” [81]. These findings may be
confirmed to the extent that the balanced case firms are unique in their emphasis on
innovation and therefore valid case candidates. Further the statement about ‘embodied
technology’, referring to innovation via adopting/acquiring processing technology, is
confirmed by the present research and by that of Peters et al. above in that firms in the
forest industry rely on equipment vendors; balanced case firms here were no exception
to this principle. However, the balanced case firms also worked closely with these
vendors to adapt the equipment to their needs.
Conclusions that may be drawn from the ‘enfolding the literature’ phase of the
analysis are that there is significant support in the literature for many of the findings of
the present research. Such support is found in literature related to the forest industry
in North America and other nations as well. Further, the findings are supported by
existing literature related to other manufacturing sectors in nations around the globe.
Hence, there is significant support for the generalizability of many of the findings
beyond the context of the West Coast U.S. forest industry.
In particular, there is support in existing literature for the findings related to:
218
• Proactive interaction with customers/actively seeking customer input; • Encouraging change and implementing a culture of improvement;
• Giving employees opportunities to share in change;
• Viewing innovation as a ‘means to an end’; and • Benchmarking
Details on each of these points are addressed in the concluding section on
Reaching Closure.
Findings in a few prior studies served to confirm the need for the present
research. In particular, other researchers have discovered difficulties in quantifying
the quality management-innovation relationship due to what are presumed to be
complex relationships between the two. Hence, more in-depth comparison of specific
practices as can be done via case research is needed to delve deeper into these
relationships. One example of such a finding in the present research is related to
Proposition 1 regarding the hard and soft factor distinction. As stated in the analysis
of the proposition, such a distinction is likely too simple to capture the complex
relationships between TQM practices and quality and innovation performance.
Prior research confirms the findings of this research on either the low emphasis
placed on process management or simply the need for firms to balance their approach.
Case firm B1’s rigorous approach to process management/process innovation
contrasted with the firm’s much less structured (“loosey-goosey”) approach to product
innovation may serve as a good case-in-point. At the same time, this suggestion
219
contradicts recommendations by forest industry experts regarding the industry’s need
to use a structured approach to NPD.
Examination of the case firms in light of the forest industry structure and
current context shows good correspondence – the case firms’ markets are similar to
those of the broad forest industry (home construction and remodeling), the firms are
‘global’ to the extent that two of the firms import raw materials from suppliers outside
North America, and all firms were impacted by the recession. However on the latter
point, the case firms’ responses to the recession differed significantly. In fact, their
responses serve to further validate the balanced/quality-oriented distinction and hence
categorization of the firms. Balanced firms emphasized technology as one means to
pursue new market opportunities beyond those most severely impacted by the
recession whereas quality-oriented firms reported that their long-term strategy of
avoiding investment in technology is what had allowed them to continue to be
profitable.
Reaching Closure
As discussed in the chapter on Research Methods, this final stage of the
research focuses on 1) when to stop iterating between data collection and theory
development with the stop point generally being when it is determined that theoretical
‘saturation’ has been reached and 2) reporting results. The term ‘saturation’ indicates
the point at which incremental improvement to the theory is minimal and therefore
there is little point in collecting additional data. However, a modified approach was

220
used here given that the ‘stop point’ was predetermined; the number of case firms
(four) and interviewees per firm (one) were determined in advance. Therefore,
‘saturation’ was only achieved to the extent that additional cycles of within- and cross-
case analysis revealed minimal additional insights.
With regards to reporting results, Yin recommends presenting results as
responses to a series of open-ended questions [88]. Such an approach is well-suited to
this research in that the title of this research can easily be stated in the form of an
open-ended question:
What are the best practices in quality management for achieving quality and innovation performance in the forest products industry?
However, this question is perhaps too open-ended to be addressed in a practical
manner. Addressing each of the research propositions (reworded to be stated as open-
ended questions) is the approach taken here. Each question along with the answer is
presented below.
1. What mix of ‘hard’ and ‘soft’ TQM factors should a firm use to achieve both quality and innovation performance?
While it appeared from the literature that this might be a reasonable
approach to address the question, results from the research showed that this is
not a useful distinction for determination of best practices. It is perhaps, overly
simplistic for the complex relations being examined here. Case firms used a
mix of all of the hard and soft factors. Therefore it is not whether a practice is
analytical (hard) or human-centered (soft) that is important, but rather the
221
specific nature of the practices themselves. Hence, we must look beyond this
distinction.
2. How widespread do TQM practices need to be implemented within a firm in order to achieve both quality and innovation performance?
Note: this proposition was originally worded as ‘wide vs. narrow’
scope of implementation. This question was addressed not by looking at
specific functional groups within a firm (in part due to the fact that the case
firms were quite small) but rather from the perspective of fundamental
principles of TQM - People Management, Process Management, and Customer
Focus. It is assumed that practices within each fundamental principle will
involve different areas and individuals within the firm, for example Human
Resources for People Management, operations personnel for Process
Management, and Sales & Marketing for Customer Focus. In general, results
showed that practices related to Customer Focus, and to a lesser extent People
Management, were emphasized most by balanced firms. The evidence related
to emphasis on Process Management practices is mixed and in fact, there is
evidence to suggest none of the firms placed much emphasis on several of the
practices. Of course, this is not to say firms should neglect Process
Management, but rather that the areas of emphasis in seeking to adapt
management practices should be those related to Customer Focus and People
Management. Which specific practices should be emphasized and how is
addressed in the succeeding propositions.
222
3. What balance should firms seek with regards to “internal vs. external” focus with respect to:
a. People Management and Process Management (internal focus) b. Interaction with customers (reactive = internal focus, proactive =
external focus) and competitors (external)
c. How they view customers (direct customers = internal, final users and other stakeholders = external) As stated above, it is important that firms continue to maintain a focus
on all three fundamental principles of TQM – including practices related to
People Management and Process Management. While there was little evidence
in the research for changes firms might make with respect to Process
Management, one practice related to People Management that is worthy of
emphasis is ensuring employees have opportunities to share in change and are
encouraged to help the organization to implement change. This research as
well as prior studies pointed to the importance of the TQM practice of
employee empowerment and involvement with regards to innovation
performance. And the present research indicated that this practice can even be
effective in cases where empowerment and involvement are limited to
workers’ immediate sphere of influence.
Perhaps the most widely supported finding from the research is related
to how firms interact with their customers. In this regard, the recommendation
is to ensure that interaction with customers is proactive. Firms must strive to
balance satisfying existing customers with seeking to identify new customers
and explore unserved needs. Several authors have characterized this approach

223
as balancing exploitation and exploration, where exploitation focuses on
maximizing existing resources for efficiency and productivity (a key focus for
the forest industry) and exploration focuses on maximizing capabilities to
develop new skills and resources. While much of the research suggests that
customer satisfaction measurement is a key factor, the present research
indicates that simply taking a proactive rather than reactive or passive
approach to customer interaction distinguishes balanced from quality-oriented
firms.
Practices used by the two balanced case firms can be used to provide
additional detail on ‘proactive customer interaction.’ These practices are
discussed below in the conclusion to this section.
In addition, while some authors theorized that benchmarking may be
‘perilous’ to innovation due to inculcating a culture of playing ‘catch up’ to
competitors, the key point here may be in how one defines benchmarking and
in what the specific targets are for benchmarking. As defined here, the
recommendation is to engage in an active competitive benchmarking program
to measure performance against the ‘best practice’ in the industry.
With regards to how firms define their customers (as direct customers
or more broadly), the evidence suggests that, as with the hard vs. soft factor
distinction, this practice is not critical.

224
4. What aspects of company culture may influence quality and innovation performance?
An emergent theme related to differences between balanced and
quality-oriented case firms was related to organizational culture. Further the
Leadership practice requiring that “senior managers actively encourage change
and implement a culture of improvement, learning, and innovation in pursuit of
‘excellence’” emerged as a practice emphasized more by balanced than
quality-oriented firms. Many studies have pointed to the importance of top
management commitment and the relationship to organizational culture.
However, cause-and-effect is unclear here. Does culture influence how firms
implement TQM? Or does the implementation of TQM positively influence
the culture towards innovation performance? In general, the culture of
balanced firms can be summarized as proactive and strategic; these firms are
amenable to risk and experimentation.
Further, at the most fundamental level, how a firm views innovation
may be a key factor related to organizational culture. Several authors
discussed the concept of ‘cross-fertilization’ between quality and innovation.
In particular, this concept is manifested in how firms may pursue product
quality via product innovation. Further, process innovation may mediate the
relationship by, for example, a process innovation may be required to enable a
product innovation. Therefore, if senior managers in a firm view innovation as
a ‘means to an end’, they may be likely to manage in such a way, even

225
redirecting the company’s strategy, such that the organization’s culture reflects
the shift.
Interview data and website information enable identification of more detail on
specific areas of focus related to ‘proactive customer interaction.’ These areas can be
summarized as focusing on: customer convenience/service and customer success.
With respect to customer convenience, as stated previously, both of the
balanced firms had websites whereas neither quality-oriented firm had a website.
While this fact alone may say little about the firms, it is their apparent views of the
purpose or function of a website that helps shed light on their differences. Both
quality-oriented firms stated that they did not have a website since they did not have
the capacity to take on new business (at least prior to the current recession):
“We’ve always been local and had all the work we could handle with local. So why would we want a website?” Case firm QO2
Hence, the quality-oriented firms appeared to view the purpose of a website as
primarily focused on attracting new customers. Of course, the two balanced firms also
viewed their websites as a means to attract new customers. However, this was not the
sole purpose for the website. Balanced firms’ websites also served as a place for
existing customers to be able to download documents such as architectural drawings,
see videos of the firm’s processes, enable contact with company personnel (outside

226
normal business hours), etc. While neither balanced firm provided for ‘e-commerce’
(i.e., allowing customers to order products on their websites), they both talked about
adding such capability. In short, in addition to serving as a tool to acquire new
business, the balanced firms also used their websites as a proactive means to allow
their customers “24-7” access. For example, case firm B1 stated:
“It [the website] is a really useful tool for us - after you have a conversation on the phone, have a look at our website. And we really spend a lot of time making sure our website is updated, it’s full, it’s complete, so they can learn about any product and any process in the company. So we do… we use it a lot.” Case firm B1
Also within the area of ‘customer convenience’ is the practice of developing
standardized product lines. Both balanced firms talked about developing standard
product lines. Of course, such standardization is commonplace in that it can lead to
streamlined production and lower costs; and viewed from the company’s point of
view, it is difficult to make a case that such practices are a service to the customer.
However, both balanced firms discussed how such standardization makes it easier for
their customers to specify and order products:
“…we also have some equipment that makes [product lines] and we’ve got a group of customers that rely on us for those and it’s working with them getting a standardized list… a list of standard products that we sell and a standard cost so they don’t have to keep coming back to us for quotes. They just have a price list and then also communicating that, just because we’ve got the standard list, we can do anything in that realm. So, it’s certainly customer-driven.” Case firm B1 “On initial bids, [company] will provide customers with four different price-level bids in three different wood species. These packages (our Bronze, Silver, Gold, and Platinum Packages) bundle materials and options in various price-points, better showing relative pricing of popular alternatives.” Case firm B2 – from company website
227
Also within the area of ‘proactive customer interaction’ is the balanced firms’
focus on their customers’ success, in addition to their own success. Balanced firms
developed new products with the explicit goal of helping their customers to increase
profits, gain market share, solve challenges, etc. And in addition to these emphases
for new product development, balanced firms emphasized customer service with a
focus on helping their customers be successful. Examples of quotes to support this
idea of ‘focusing on customer success’ include:
“we solicited a lot of opinion from our [customers] – will you be able to sell more wood? It’s one thing to say this is a great feature and our customers are going to love it. But if there wasn’t a strong link to being able to sell more wood, then we’ve just added costs...” Case firm B1 “we spent a lot of time going through the communication and understanding what our customers were saying, that did it… were these changes going to actually allow them to compete better and gain more market share?” Case firm B1 “we gave them [dentists – a new customer segment] a presentation earlier on the solid surface counter because it’s nonporous, it won’t support bacterial growth.” Case firm B2 – discussion of product innovation to help reduce a costly customer challenge “when we deliver cabinets, we deliver a counter right there. The contractor doesn’t have the lead time, he’s not wasting 2 to 3 weeks or, when we’re busy, 4 weeks.” Case firm B2 – helping customers shorten lead times
Before summarizing the principal research findings, there are two additional
points to be addressed. The first is related to the issue of causality. Causality is
implied in any discussions of ‘best practices.’ That is, it is implicit that
implementation of the practices in a firm will cause improvement in performance.
However, no such assurance can be made based on this research. The research is
228
descriptive rather than prescriptive in that it merely examined practices in use by
different firms and reported on apparent differences assuming that those practices
receiving more emphasis from balanced firms are the ‘best practices.’ There are
certainly innumerable practices in use by these firms beyond those described here that
have led to their differences in performance. In fact, key among these differences
appears to be the differences in strategy (discussed below). In the absence of a
longitudinal experiment where performance is examined before-and-after
implementation of practices in an organization, appeals must be made to the strength
of the ‘chain-of-evidence.’ Such evidence includes the findings from within- and
cross-case analysis combined with support from the literature. In that regard, one
additional appeal is made to the literature as evidence that practices described here are
in fact ‘best practices’ that are likely to lead to improved performance. The specific
quality management practices explored here came from the Malcolm Baldrige
National Quality Award (MBNQA) criteria. These criteria are widely recognized as
leading practices for high-performing organizations. And in fact, the stated purposes
for the criteria are [61]:
• “to help improve organizational performance practices, capabilities, and results
• to facilitate communication and sharing of information on best practices among U.S. organizations of all types
• to serve as a working tool for understanding and managing performance and
for guiding organizational planning and opportunities for learning”
229
Therefore, while no explicit claims of causality can be made, there is strong
evidence from theory and practice to suggest that the best practices reported here are
likely to contribute to improved quality and innovation performance.
The second point is related to the author’s expectation going into this research.
That expectation was that there would be essentially two kinds of firms – 1) those that
were successfully achieving innovation performance (in addition to quality) and 2)
those that were striving to (i.e., ‘wished they were’) achieve innovation performance.
However in hindsight this was a naïve assumption. It was quite apparent that it was no
accident or oversight that resulted in the quality-oriented firms’ lack of focus on
innovation. Interviewees at the quality-oriented case firms had nearly 50 years of
combined managerial experience. Both these gentlemen discussed how they had let
many so-called ‘opportunities’ related to innovation pass them by. Further, both
professed that their low-tech, and low-risk, approach was critical to their success.
While their competitors (those still in business) were struggling to pay off debt, these
firms stated that, times were hard, but they were profitable and they believed they
would remain so.
In conclusion the primary research findings may be stated as follows:
The first step a firm should take is to ensure it includes innovation performance
as part of its competitive strategy. In short, a firm must first want to pursue
innovation. If this is the case, findings of this research, which are supported by a
230
diverse cross-section of the literature, suggest that the following are best practices in
quality management for achieving quality and innovation performance:
• Strive to ensure proactive interactions with customers • Senior managers should actively encourage change and implement a culture of
improvement, learning, and innovation in pursuit of ‘excellence’; innovation must be seen as a means to some other goal such as improved product quality.
• Ensure employees have opportunities to share in, and are encouraged to, help
the organization implement changes
• Engage in an active competitive benchmarking program to measure performance against the ‘best practice’ in the industry.
From the most pragmatic standpoint, if a manager were to pose the question,
“What one thing can we do to adapt our quality management practices so that we
achieve innovation performance as well?”, the strongest evidence appears to be related
to customer relationship management practices. Specifically, the evidence suggests
that practices that emphasize proactive interaction with customers are a good place to
focus. Table 14 presents several specific practices related to ‘proactive customer
interaction’ based on the firms examined in this research.
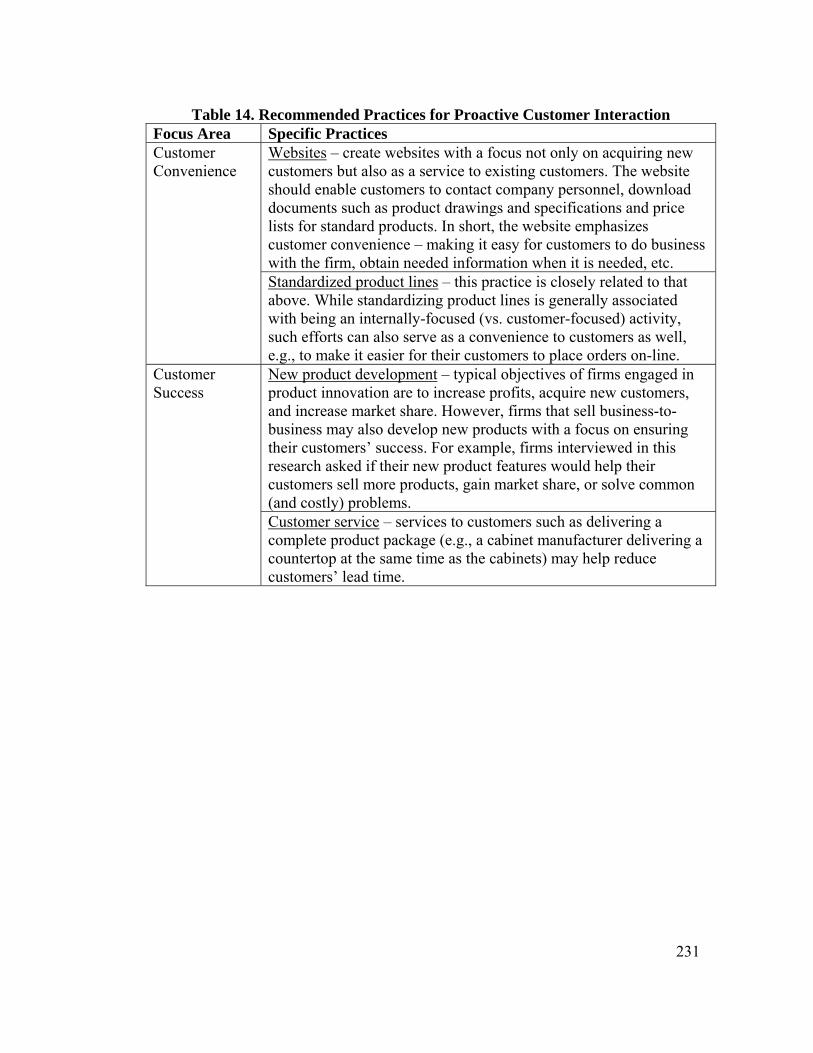
231
Table 14. Recommended Practices for Proactive Customer Interaction Focus Area Specific Practices Customer Convenience
Websites – create websites with a focus not only on acquiring new customers but also as a service to existing customers. The website should enable customers to contact company personnel, download documents such as product drawings and specifications and price lists for standard products. In short, the website emphasizes customer convenience – making it easy for customers to do business with the firm, obtain needed information when it is needed, etc. Standardized product lines – this practice is closely related to that above. While standardizing product lines is generally associated with being an internally-focused (vs. customer-focused) activity, such efforts can also serve as a convenience to customers as well, e.g., to make it easier for their customers to place orders on-line.
Customer Success
New product development – typical objectives of firms engaged in product innovation are to increase profits, acquire new customers, and increase market share. However, firms that sell business-to-business may also develop new products with a focus on ensuring their customers’ success. For example, firms interviewed in this research asked if their new product features would help their customers sell more products, gain market share, or solve common (and costly) problems. Customer service – services to customers such as delivering a complete product package (e.g., a cabinet manufacturer delivering a countertop at the same time as the cabinets) may help reduce customers’ lead time.
232
Chapter 5. Contributions
This chapter presents a summary of the contributions of this research to the
bodies of knowledge related to methods for case firm selection, quality management,
engineering management, and systems science. These contributions are followed by a
discussion of contributions with respect to managerial practice. The chapter concludes
with a summary of the strengths and limitations of the research as well as suggestions
for future research.
Contributions to Research
The research has contributed to methods used for case firm selection.
Specifically, to the author’s knowledge, it is the first study to use DEA to aid in case
firm selection. The literature related to case firm selection is sparse; and several
experts have noted the challenges related to selecting case firms. For example, as
stated in the literature review, Yin simply encourages researchers to, “…have defined
a set of operational criteria whereby candidates will be deemed qualified to serve as
cases. Then you should select randomly from the qualified candidates…” [88] And
Eisenhardt recommends that ‘theoretical sampling’ (vs. random sampling) is preferred.
She provides several examples of how other researchers have selected case firms such
as selecting polar examples, i.e., “…one case of clearly successful firm performance
and one unsuccessful case” [86]. Such an approach is challenging in situations where
‘successful’ and ‘unsuccessful’ are not clear. Lastly, as recently as 2008, Seawright
and Gerring state that “…choosing good cases for extremely small samples is a
challenging endeavor… the question of case selection has received relatively little
233
attention from scholars…” These authors propose several quantitative methods for
case selection [90]. However, common to all of the approaches (Seawright and
Gerring’s as well as Yin’s and Eisenhardt’s) is the need for quantitative data on the
target audience.
While collection of such data (i.e., surveying the target audience) is not a novel
contribution of the present research, nor perhaps is the use of cluster analysis to
organize respondents into groups with similar responses, the author is not aware of
any other research where the combination of DEA and cluster analysis has been used
to aid in the selection of case firms. In that regard, DEA served both as a data
reduction technique (in this case, from 204 case firm candidates to 26) as well as to
identify a unique sector of the respondents. For the latter point, firms identified as
efficient by DEA are those that maximize their outputs (quality and innovation
performance) while at the same time using the minimum inputs (quality management
practices). In short, the efficient firms demonstrate focus – emphasis on some
practices, lack of emphasis on others. Given the primary research focus on identifying
best practices, without DEA, there was greater risk of failing to identify differences in
practices. That is, the potential for examining firms that took a ‘shotgun approach’ to
quality management practices was greater and therefore the potential for studying case
firms that were more similar than different with respect to quality management
practices.
234
In short, regardless of the technique used, the main objective is to somehow
reduce the pool of candidate firms to those that demonstrate some diversity in their
application of the practices while simultaneously achieving high performance with
respect to the specified outputs. DEA is uniquely suited to such an objective. And
from the author’s knowledge of the forest industry, there is some evidence that the
technique was successful in case firm selection. Specifically, one of the balanced case
firms is quite well known in the forest industry as an innovative firm.
With respect to quality management, the research has contributed to the body
of knowledge by exploring one of the apparent next steps in the field. In particular,
the literature suggests that the progression in quality-related research has been to:
1. Define the multiple dimensions of quality; 2. Describe the specific principles and practices of quality management;
3. Develop and validate constructs and instruments to measure extent of
implementation of the principles and practices; and
4. Use these instruments to explore correlations between quality management and performance.
Hence, this research went beyond exploring correlations and examined the
potential contributions of specific quality management practices to both quality and
innovation performance. Findings have confirmed prior researchers’ suggestions that
specifically how a company implements TQM will influence the type of performance
achieved; further, as discussed below, the findings here agree with those of prior
research in some areas and disagree in others with respect to which practices may lead
to innovation performance.
235
With regards to engineering management, the primary contribution to the body
of knowledge of this research has been to provide new insights into how practices
generally associated with innovation management may be integrated with quality
management practices. In particular, because the target industry sector (the forest
industry) is composed primarily of small firms, and not generally known for
innovation performance, the emphasis of the research was on how these firms might
adapt existing quality management practices. This is especially the case given that it
is very unlikely that a small wood products firm would establish an R&D department
or any such entity focused on innovation. Hence, the question is really, how can small
firms manage innovation? And the answer to that question assumed by the present
research is - by adapting practices they already have in place related to quality
management. The question is therefore, which practices and how? The research has
confirmed and provided new insights into prior researchers’ findings related to the
importance of top management ensuring company strategy and culture are aligned
with goals, as well as the correlations between customer focus, employee
empowerment, and innovation performance. At the same time, the research has called
into question other researchers’ findings (or speculations), e.g., that benchmarking is
‘perilous’ to innovation performance. Other findings that conflict with prior research
include those suggesting that ‘education & training’, as well as ‘process & strategic
management’ are positively correlated with innovation performance; at least one
balanced case firm placed little emphasis on employee training, and none of the firms
emphasized strategic management or process management.
236
This research has also confirmed prior researchers’ findings regarding the
‘cross-fertilization’ of quality and innovation and has gone further to describe how
such interactions are manifested in two case firms. Specifically, the research has
provided some specific examples of how firms may pursue product innovation in an
effort to improve product quality and then pursue a process innovation as well to
enable the manufacture of the product. Further, the process innovation may in turn
lead to additional product innovations that capitalize on the firm’s investment in new
processing capabilities.
With respect to systems science, the ‘systems approach’ is foundational to the
main topic of this research – quality management. In fact, one author defines TQM as
“…an integrated system of principles and procedures whose goal is to improve the
quality of an organization’s goods and services” [38]. The research explored
companies’ quality management practices via a questionnaire developed based on the
criteria from the Malcolm Baldrige National Quality Award (MBNQA). As shown in
Figure 1, the MBNQA conceives of quality management using a ‘systems
perspective.’ As stated in the award criteria:
“The Criteria have continually progressed toward a comprehensive, integrated systems perspective of overall organizational performance management… A systems perspective includes your senior leaders’ focus on strategic directions and on your customers… A systems perspective also includes using your measures, indicators, core competencies, and organizational knowledge to build your key strategies…Thus, a systems perspective means managing your whole organization, as well as its components, to achieve success.” (emphasis added) [61]

237
In fact, one could argue that the practices described in criteria for the MBNQA
extend well beyond quality management to general management. However again, the
criteria are intended to examine organizations as systems – their management
practices, the integration of these practices, and the firm’s interaction with other
entities. The research has been conducted with these principles in mind in that the
firms’ overall management practices (organization as an integrated system) and
performance served in the selection of case firms. Then several research propositions
examined the practices from the viewpoint of integration of practices within the
organization (Proposition 2) as well as the firms’ interactions with customers,
competitors and other entities (Proposition 3).
The research contributed to the systems science body of knowledge by
demonstrating how data envelopment analysis (DEA) may be used to examine
organizations from a systems perspective. DEA allowed for simultaneous
consideration of firms’ inputs and outputs, i.e., examining the organizations’ practices
and performance holistically. Given that there were multiple inputs (quality
management practices) and multiple outputs (quality and innovation – both of which
were multi-dimensional), DEA enabled identification of case firms by considering the
organization as a complex system. Most of the prior research has examined quality
performance from the perspective of conformance to specifications, e.g., product
defect rates; innovation performance has often been measured via metrics such as
number of patents or new products released. Measuring quality and innovation too
narrowly fails to account for the contingency approach by which firms with differing
238
strategies, cultures, and contexts pursue the various dimensions of quality and
innovation, i.e., how the organization as an integrated system achieves a complex
array of performance outputs.
The findings also contribute to the systems science body of knowledge with
respect to the dynamics inherent in complex systems. Specifically, the finding related
to ‘cross-fertilization’ between quality and innovation suggests the possibility of
multiple feedback loops and interactions between endogenous and exogenous factors.
In fact, this finding is a contribution related to both systems science and engineering
management, as discussed above. From a systems science perspective, this finding
provides insights into how practices related to product development and process
improvement, combined with feedback from customers and company personnel may
interact. For example one could conceive of a causal loop diagram linking the
inspiration for a product quality improvement (i.e., from customer feedback), to an
innovation in product design that addresses this need, to a process innovation required
to produce the new product, to additional new products that capitalize on the process
innovation. The ‘exogenous feedback loop’ (customers) may result in modifications
to the product design, whereas endogenous feedback (e.g., from operating personnel)
may result in modifications to the process (i.e., continuous process improvement – a
foundational principle of TQM).
Lastly, it is interesting to note that the key findings strongly reinforce the
notion of organizations as complex systems. In particular, most if not all functional

239
areas of a firm (e.g., sales, finance, production, management, etc.) are impacted by the
findings. The findings relate to a broad array of elements internal and external to the
firm – how leaders work to influence company culture, the degree to which employees
are empowered, and how the firm interacts with external audiences such as customers
and competitors.
Contributions to Practice
The research questions proposed and addressed here were developed based on
the author’s experience providing technical assistance to wood products manufacturers
in the area of quality management. Further, the author’s role as director of the Oregon
Wood Innovation Center (OWIC) at Oregon State University is to provide technical
assistance, training, and publications that help foster innovation in the forest industry.
As such, the focus on contributing to managerial practice has existed from the onset of
the project. In fact, the key findings were disseminated to the industry via short
‘research briefs’ on the OWIC website and professional society presentations prior to
the formal completion of the dissertation. And there are plans to present the findings
via educational publications and workshops as part of the author’s work assignment.
The primary contributions to practice are to provide managers with
recommendations for adapting current quality management systems to have greater
impact on both quality and innovation performance. These recommendations are
supported by theory and based on practices used by actual companies. The use of case
studies has enabled the accumulation of ‘real-world’ information on companies’
240
practices and as such, should be very relevant and practical for industry managers.
The author’s experience working with industry audiences is that busy managers need
practical advice, ‘step-by-step instructions’, and place high emphasis on practices
grounded in real-world experience. While much of the findings aren’t readily
transferable as simple step-by-step instructions, they do provide guidance to managers
to know where to focus their efforts. Further, the findings suggest opportunities for
further case research exploring some of the practices (e.g., ‘proactive customer
interaction’) to provide additional details and examples on what specific actions
companies can take.
Last but not least, given the critical importance of quality and innovation in
today’s competitive business environment, the results of this research will fill an
important niche in the current management practices in these areas.
Strengths and Limitations
A key strength of this research is related to the timeliness and relevance of the
topic. While there is significant research exploring connections between quality
management and quality performance or general business performance, the research
on connections to innovation performance is in its infancy. In fact, during the time
when this research was being conducted, the American Society for Quality (ASQ - the
leading professional society for quality professionals) titled its 2007 World
Conference on Quality Improvement “Fueling Innovation through People and
Quality.” Furthermore, a new international journal was established on the topic; in
241
2009, the first edition of the International Journal of Quality and Innovation was
published. And as further evidence of the timeliness of the topic, the majority of the
research that has empirically tested relationships between quality and innovation has
been published in the last 10 years (which is ironically, when the author began this
research). This research has helped to further our knowledge of not simply whether or
not quality and innovation are related, but on which of the many quality management
practices may be related to innovation performance.
While many of the strengths and limitations of the research have been
addressed previously, the information is briefly summarized here. Strengths of the
research include:
• The topic is timely as evidenced by the increasing attention given in the literature to studies exploring the relationships between quality management and innovation performance. And as stated above, the creation of a journal specifically focused on the topic International Journal of Quality and Innovation) provides additional justification for the timeliness of the subject matter.
• The research takes a broad, systems-based view of quality management
practices. Much of the prior research on the topic continues to view quality management primarily from the standpoint of continuous improvement.
• Quality management, quality performance, and innovation performance are all
addressed via multiple dimensions. This approach is well-grounded in the literature – experts have stated consistently that quality and innovation are inherently multidimensional. Even so, much prior research has perceived of the constructs narrowly such as defect rates as the proxy for quality and number of new products released for innovation.
• The proposed approach is based on a comprehensive review of the literature on
quality management and measurement of performance.
• The establishment of best practices is the natural next step to be taken in the field. Several researchers have documented positive correlations between
242
quality management and quality and innovation performance. However, there has been very little work focused on describing the specific practices that lead to superior performance.
• The combined use of quantitative analysis (DEA followed by cluster analysis)
combined with qualitative analysis capitalizes on the strengths of both forms of research. DEA and cluster analysis aid in the selection of case firms and the quantitative approach overcomes issues related to researcher bias in case firm selection. This combined with the case study method adds breadth and depth to the findings and ensures the findings are grounded in actual practice.
• The use of DEA to aid in case firm selection is not only a unique contribution
of the research, but is also aligned well with the subject matter of TQM. DEA is a valuable tool used in benchmarking. Given that benchmarking is a key quality management (and innovation) practice, it seems natural to use DEA to identify best practices within TQM.
Limitations of the research include:
• Descriptive vs. prescriptive – as discussed in the Results chapter, the research is descriptive in nature and thus no claims can be made that the best practices presented here will ‘cause’ improved performance. However, the strongest appeal that can be made is to the fact that the practices were derived from the Malcolm Baldrige National Quality Award criteria and as such are well-established in theory and in practice by high-performing organizations.
• Low response rate to the questionnaire – like many other research projects
involving surveys, this project suffered from the continuing decline in response rate. Declining response rates are a recognized challenge in the research literature. Further compounding this issue however was the ongoing global recession at the time of data collection and the particular impact on the target industry. A few survey respondents returned uncompleted surveys and included a letter saying they were no longer in business due to the economy; many other surveys were returned as undeliverable (reason unknown). And as one potential interviewee stated in declining to be interviewed, “You couldn’t have picked a worse time to do research in this industry; we’re scrambling just to keep the doors open.”
• Focus on single industry sector and region – limitations to generalizability to a
broad manufacturing sector are acknowledged given the focus on a single industry sector, and even a limited region of the U.S. (West Coast). Further, there was lack of adequate representation from some of the sub-sectors (e.g., composites and secondary manufacturers). However, comparison of results to
243
existing literature served to confirm many of the findings thus providing some assurance of generalizability.
• Small firms – all of the case firms had 75 or fewer employees. While these
small firms are quite representative of the target industry, it is likely that the findings may not be applicable to larger firms.
• Narrow definition of ‘performance’ – there were no explicit steps taken to
ensure the firms were actually successful in terms of profitability. This was by design in that the focus was on quality and innovation performance, not financial performance. However, the reported ‘best practices’ are not directly linked to profitability. Although, as previously stated, all of the firms discussed how challenging it was to stay in business and cited reasons they felt they were currently remaining competitive (e.g., focus on new markets, choosing not to invest in technology, etc.)
• Subjective data – with any survey data, there is the risk of respondents not
reporting things accurately. Even with the interviews, respondents may tell you what they think you want to hear, i.e., give the ‘textbook response’ to a question on employee empowerment, for example. Hence, there can be challenges with internal validity. Steps taken to overcome this limitation include using DEA and use of multiple sources (triangulation) in the cases. DEA served to filter out those respondents that circled “all 5’s” (high emphasis/performance on everything) in that such firms were not deemed efficient. And the interviews served to validate the questionnaire responses – which in some cases, were not validated (e.g., no evidence found to support a respondent’s high score on a certain practice).
Finally, with regards to DEA, an additional limitation of the research is related
to the relatively non-traditional approach to the use of DEA. Rather than more
conventional cost inputs and product outputs, ‘extent of TQM implementation’ served
as the inputs and perceptual measures of quality and innovation performance as the
outputs. The author was only able to identify such an approach for using DEA by two
other researchers – Forker et al. [38, 84] and Yoo [85]. Therefore, despite being ‘non-
traditional’ with respect to DEA, there is support in the literature for such an approach.
244
However, the most appropriate model for assessing the impact of TQM on
performance is to consider actual TQM inputs. Ideally, these inputs would involve
objective quantities such as ‘dollars spent on the TQM program.’ Of course, such data
are not available as TQM is not a ‘line-item expense’ but rather is intended to be
integrated throughout the operations of an organization. The literature review
demonstrates that numerous researchers have come to the conclusion that subjective
measures of TQM principles and practices are the only effective means to measure
extent of TQM implementation [46, 50, 60, 67, 70].
Suggestions for Future Research
This research has revealed several topics where additional research is
recommended based on either key findings of the present research and/or the
limitations discussed above. Each topic is presented below.
As is always the case for descriptive research, additional studies should be
conducted to validate the findings presented here. In particular, the research would
involve a longitudinal study of a case firm (or firms) that are currently identified as
quality-oriented, but which desire to improve their innovation performance. The study
would measure their performance before and after implementation of several of the
best practices reported here.
One of the key findings of the research is related to the importance of proactive
customer interaction. While the case firms provided some details and examples of
245
how to implement this practice, more research is needed to validate this finding and to
provide greater depth. For example, validation may occur by comparing customer
relationship management practices between innovative and non-innovative firms.
Questions that may be addressed include, what is the nature of the proactive
interaction, how do different companies acquire information from customers and how
and to whom is it communicated within the firm? In fact, such research is currently
underway in that at the time of this writing, the author has a graduate student
exploring precisely these questions.
One finding that was not presented above, but for which further research is
suggested, is with regards to how the firms defined quality. Based on Garvin’s five
definitions of quality [55], there were indications that the quality-oriented firms
viewed quality based on either the product-based (e.g., some measurable product
attribute such as QO2’s emphasis on using the highest lumber grade) or user-based
definition (such as QO1’s statement that quality is perceived by the customer).
However, both balanced firms appeared to use the value-based definition of quality;
interestingly, the value-based definition is essentially one that balances excellence at a
fair price (the customer view) with conformance to specifications at a reasonable cost
(the firm view). Additional research may reveal the extent to which a company’s
conception of quality correlates to their focus on innovation.
In addition, given that many equate TQM with process management and
continuous improvement, or even more narrowly as synonymous with the use of

246
statistical process control (SPC), one surprising finding of the research is in the low
emphasis all the case firms placed on these practices, and in particular the lack of use
of tools such as SPC. This finding begs the question – “how exactly are these firms
focused on product quality if not through such methods?” Additional research may
shed light on this question.
Another potential area of additional research is related to financial
performance of the firms. A study similar to this one could be conducted that also
takes into account financial performance of the firms to ensure that the ‘best practices’
are in fact in some way also related to firm profitability.
Experts in innovation in the forest industry have recommended that firms focus
more on product and business systems innovation, and less on process innovation
[101]. Therefore, the findings regarding similarities in practices related to business
systems innovation between the quality-oriented and balanced case firms was
unexpected. Based on the interviews, it seems there may be some confusion on what
specifically qualifies as a business systems innovation; interviewees generally needed
little additional explanation to discuss product or process innovation, however most
interviewees required clarification to understand what was meant by the questions
related to business systems innovation. Also, it could be that the questionnaire items
related to business systems innovation were too generic and thus did not differentiate
between firms. Further research specifically focused on this form of innovation may
help to confirm or disconfirm the findings of the present research.
247
One final area where additional research is recommended is with regards to the
finding related to ‘cross-fertilization’ between quality and innovation. Such research
might focus on developing a system dynamics model showing the interrelationships
between product quality, process innovation, and product innovation, while also taking
into account internal (to the firm) influences such as related to process
management/improvement and external influences such as customer feedback.
248
References
[1] E. L. Grant and R. S. Leavenworth, Statistical Quality Control, Sixth ed. NY:
McGraw-Hill, 1988.
[2] J. R. Evans and W. M. Lindsay, The Management and Control of Quality,
Fifth ed. Cincinnati: South-Western Publishing, 2002.
[3] "Quality programs show shoddy results," in Wall Street Journal, ed. New
York, 1992.
[4] E. E. Adam Jr., "Alternative quality improvement practices and organization
performance," Journal of Operations Management, vol. 12, pp. 27-44, October
1994.
[5] O. Harari, "Ten reasons TQM doesn't work," Management Review, vol. 86, pp.
38-44, January 1997.
[6] K. McManus, "Is quality dead?," IIE Solutions, vol. 31, pp. 32-35, July 1999.
[7] U. Nwabueze, "An industry betrayed: The case of total quality management in
manufacturing," The TQM Magazine, vol. 13, pp. 400-408, 2001.
[8] P. M. Senge, "Quality management: Current state of the practice," presented at
the American Quality Congress, 1993.
[9] M. Hammer and J. Champy, Reengineering the Corporation: A Manifesto for
Business Revolution. New York, NY: HarperCollins, 2001.
[10] H. J. Harrington, "Performance improvement: the rise and fall of
reengineering," The TQM Magazine, vol. 10, pp. 69-71, 1998.
249
[11] H. D. Allender, "Is reengineering compatible with total quality management?,"
Industrial Engineering, vol. 26, pp. 41-44, 1994.
[12] Y. F. Jarrar and E. M. Aspinwall, "Integrating total quality management and
business process re-engineering: is it enough?," Total Quality Management &
Business Excellence, vol. 10, pp. 584-593, 1999.
[13] K. R. Bhote, The Ultimate Six Sigma: Beyond Quality Excellence to Total
Business Excellence. New York: AMACOM - American Management
Association, 2002.
[14] P. Pande and L. Holpp, What is Six Sigma? New York: McGraw-Hill, 2002.
[15] B. Klefsjö, H. Wiklund, and R. L. Edgeman, "Six sigma seen as a methodology
for total quality management," Measuring Business Excellence, vol. 5, pp. 31-
35, 2001.
[16] S. L. Ahire and D. Y. Golhar, "Quality management in large vs. small firms:
An emperical investigation," Journal of Small Business Management, pp. 1-13,
April 1996.
[17] S. L. Ahire, M. A. Waller, and D. Golhar, "Quality management in TQM
versus non-TQM firms: An empirical investigation," International Journal of
Quality & Reliability Management, vol. 13, pp. 8-27, 1996.
[18] H. M. Beheshti and J. G. Lollar, "An empirical study of US SMEs using
TQM," TQM & Business Excellence, vol. 14, pp. 839-847, October 2003.
[19] G. S. Easton and S. L. Jarrell, "The effects of total quality management on
corporate performance: An empirical investigation," Journal of Business, vol.
71, pp. 253-307, 1998.
250
[20] D. I. Prajogo and A. Brown, "The relationship between TQM practices and
quality performance and the role of formal TQM programs: An Australian
empirical study," Quality Management Journal, vol. 11, pp. 31-42, 2004.
[21] C. B. Fotopoulos and E. L. Psomas, "The impact of “soft” and “hard” TQM
elements on quality management results," International Journal of Quality &
Reliability Management, vol. 26, pp. 150-163, 2009.
[22] T. Kekale and J. Kekale, "A mismatch of cultures: A pitfall of implementing a
total quality approach," International Journal of Quality & Reliability
Management, vol. 12, pp. 210-220, 1995.
[23] R. McAdam, G. Armstrong, and B. Kelly, "Investigation of the relationship
between total quality and innovation: A research study involving small
organisations," European Journal of Innovation Management, vol. 1, pp. 139-
147, 1998.
[24] S. B. Sitkin, K. M. Sutcliffe, and R. G. Schroeder, "Distinguishing control
from learning in Total Quality Management: A contingency perspective,"
Academy of Management Review, vol. 19, pp. 537-564, 1994.
[25] D. I. Prajogo and A. S. Sohal, "The relationship between TQM practices,
quality performance, and innovation performance: An empirical examination,"
International Journal of Quality & Reliability Management, vol. 20, pp. 901-
918, 2003.
[26] T. Hill, Manufacturing Strategy – The Strategic Management of the
Manufacturing Function. London: Macmillan Press, 1985.
251
[27] R. G. Cooper, "Overhauling the new product process," Industrial Marketing
Management, vol. 25, pp. 465-482, 1996.
[28] R. E. Cole and T. Matsumiya, "Too much of a good thing? Quality as an
impediment to innovation," California Management Review, vol. 50, pp. 77-
93, Fall 2007.
[29] R. E. Cole and T. Matsumiya, "When the pursuit of quality risks innovation,"
The TQM Journal, vol. 20, pp. 130-142, 2008.
[30] D. I. Prajogo and A. S. Sohal, "TQM and innovation: A literature review and
research framework," Technovation, vol. 21, pp. 539-558, 2001.
[31] H. E. Samaha, "Overcoming the TQM barrier to innovation," HR Magazine,
vol. 41, pp. 145-149, June 1996.
[32] R. Sethi and A. Sethi, "Can quality-oriented firms develop innovative new
products?," Journal of Product Innovation Management, vol. 26, pp. 206-221,
2009.
[33] P. J. Singh and A. J. R. Smith, "Relationship between TQM and innovation:
An empirical study," Journal of Manufacturing Technology Management, vol.
15, pp. 394-401, 2004.
[34] G. K. Kanji, "Can Total Quality Management help innovation?," Total Quality
Management, vol. 7, pp. 3-9, 1996.
[35] D. I. Prajogo and A. S. Sohal, "The integration of TQM and technology/ R&D
management in determining quality and innovation performance," Omega: The
International Journal of Management Science, vol. 34, pp. 296-312, 2006.

252
[36] M. Demirbag, E. Tatoglu, M. Tekinkus, et al., "An analysis of the relationship
between TQM implementation and organizational performance: Evidence from
Turkish SMEs," Journal of Manufacturing Technology Management, vol. 17,
pp. 829-847, 2006.
[37] J. Feng, D. I. Prajogo, K. C. Tan, et al., "The impact of TQM practices on
performance: A comparative study between Australian and Singaporean
organizations," European Journal of Innovation Management, vol. 9, pp. 269-
278, 2006.
[38] L. B. Forker, D. Mendez, and J. C. Hershauer, "Total quality management in
the supply chain: What is its impact on performance?," International Journal
of Production Research, vol. 35, pp. 1681-1701, 1997.
[39] L. B. Forker, S. K. Vickery, and C. L. M. Droge, "The contribution of quality
to business performance," International Journal of Operations & Production
Management, vol. 16, pp. 44-62, 1996.
[40] K. B. Hendricks and V. R. Singhal, "Does implementing an effective TQM
program actually improve operating performance? Empirical evidence from
firms that have won quality awards," Management Science, vol. 43, pp. 1258-
1274, September 1997.
[41] K. B. Hendricks and V. R. Singhal, "The long-run stock price performance of
firms with effective TQM programs," Management Science, vol. 47, pp. 359-
368, March 2001.
253
[42] H. Kaynak, "Measuring organisational effectiveness and business performance
in firms implementing total quality management," International Journal of
Manufacturing Technology & Management, vol. 8, pp. 355-381, 2006.
[43] D. I. Prajogo, "The comparative analysis of TQM practices and quality
performance between manufacturing and service firms," International Journal
of Service Industry Management, vol. 16, pp. 217-228, 2005.
[44] D. I. Prajogo and A. Brown, "Approaches to adopting quality in SMEs and the
impact on quality management practices and performance," Total Quality
Management, vol. 17, pp. 555-566, June 2006.
[45] D. I. Prajogo and A. S. Sohal, "The relationship between organization strategy,
total quality management (TQM), and organization performance - the
mediating role of TQM," European Journal of Operational Research, vol. 168,
pp. 35-50, 2006.
[46] D. Samson and M. Terziovski, "The relationship between total quality
management practices and operational performance," Journal of Operations
Management, vol. 17, pp. 393-409, 1999.
[47] R. L. Shrivastava, R. P. Mohanty, and R. R. Lakhe, "Linkages between Total
Quality Management and organisational performance: An empirical study for
Indian industry," Production Planning and Control, vol. 17, pp. 13-30, January
2006.
[48] W. G. Lewis, K. F. Pun, and T. R. M. Lalla, "Exploring soft versus hard
factors for TQM implementation in small and medium-sized enterprises,"
254
International Journal of Productivity and Performance Management, vol. 55,
pp. 539-554, 2006.
[49] W. G. Lewis, K. F. Pun, and T. R. M. Lalla, "Empirical investigation of the
hard and soft criteria of TQM in ISO 9001 certified small and medium-sized
enterprises," International Journal of Quality & Reliability Management, vol.
23, pp. 964-985, 2006.
[50] S. L. Ahire, D. Golhar, and M. A. Waller, "Development and validation of
TQM implementation constructs," Decision Sciences, vol. 27, pp. 23-56,
Winter 1996.
[51] P. G. Benson, J. V. Saraph, and R. G. Schroeder, "The effects of organizational
context on quality management: An empirical investigation," Management
Science, vol. 37, pp. 1107-1124, September 1991.
[52] A. Hovgaard and E. Hansen, "Innovativeness in the forest products industry,"
Forest Products Journal, vol. 54, pp. 26-33, January 2004.
[53] T. R. Anderson and G. P. Sharp, "A new measure of baseball batters using
DEA," Annals of Operations Research, vol. 73, pp. 141-155, 1997.
[54] Anonymous. (2006, October 11). Quality Glossary. Available:
http://www.asq.org/glossary/q.html
[55] D. A. Garvin, "What does "product quality" really mean?," Sloan Management
Review, pp. 25-43, 1984.
[56] W. A. Shewhart, Economic Control of Quality of Manufactured Product, 50th
Anniversary Commemorative Reissue (ASQC 1980) ed. Milwaukee, WI:
American Society for Quality Control, 1931.
255
[57] D. A. Garvin, "Quality on the line," Harvard Business Review, pp. 64-75,
September-October 1983.
[58] NBC, "If Japan Can, Why Can't We?," in NBC White Paper, ed: CC-M, 1980.
[59] H. H. Goldman, "The origins and development of quality initiatives in
American business," The TQM Magazine, vol. 17, pp. 217-225, 2005.
[60] B. B. Flynn, R. G. Schroeder, and S. Sakakibara, "A framework for quality
management research and an associated measurement instrument," Journal of
Operations Management, vol. 11, pp. 339-366, 1994.
[61] Anonymous, "Criteria for Performance Excellence, Malcolm Baldrige National
Quality Program," National Institute of Standards and Technology2009.
[62] S. Black and L. J. Porter, "An empirical model for total quality management,"
Total Quality Management, vol. 6, pp. 149-164, 1995.
[63] S. L. Ahire, R. Landeros, and D. Y. Golhar, "Total quality management: A
literature review and an agenda for future research," Production and
Operations Management, vol. 4, pp. 277-306, Summer 1995.
[64] A. Wilkinson, "The other side of quality: 'soft' issues and the human resource
dimension," Total Quality Management, vol. 3, pp. 323-329, May 1992.
[65] D. Dow, D. Samson, and S. Ford, "Exploding the myth: Do all quality
management practices contribute to superior quality performance?,"
Production and Operations Management, vol. 8, pp. 1-27, Spring 1999.
[66] Anonymous, "Criteria for Performance Excellence, Malcolm Baldrige National
Quality Program," National Institute of Standards and Technology2006.
256
[67] J. V. Saraph, P. G. Benson, and R. G. Schroeder, "An instrument for measuring
the critical factors of quality management," Decision Sciences, vol. 20, pp.
810-829, 1989.
[68] J. F. Hair Jr., W. C. Black, B. J. Babin, et al., Multivariate Data Analysis, 6th
ed. Upper Saddle River, NJ: Pearson Prentice Hall, 2006.
[69] J. C. Nunnally, Psychometric Theory. New York, NY: McGraw-Hill, 1967.
[70] P. J. Singh and A. Smith, "An empirically validated quality management
measurement instrument," Benchmarking: An International Journal, vol. 13,
pp. 493-522, 2006.
[71] J. Motwani, "Critical factors and performance measures of TQM," The TQM
Magazine, vol. 13, pp. 292-300, 2001.
[72] J. R. Cooper, "A multidimensional approach to the adoption of innovation,"
Management Decision, vol. 36, pp. 493-502, 1998.
[73] F. Betz, Managing Technological Innovation: Competitive Advantage from
Change. New York: John Wiley & Sons, Inc., 1998.
[74] F. Damanpour, "Organizational complexity and innovation: Developing and
testing multiple contingency models," Management Science, vol. 42, pp. 693-
716, 1996.
[75] E. M. Rogers, Diffusion of Innovations, Fourth ed. New York: The Free Press,
1995.
[76] J.-A. Johannessen, B. Olsen, and G. T. Lumpkin, "Innovation as newness:
What is new, how new and new to whom?," European Journal of Innovation
Management, vol. 4, pp. 20-31, 2001.
257
[77] J. M. Utterback, Mastering the Dynamics of Innovation: How Companies Can
Seize Opportunities in the Face of Technological Change. Boston, MA:
Harvard Business School Press, 1994.
[78] J. M. Utterback and W. J. Abernathy, "A dynamic model of process and
product innovation," Omega: The International Journal of Management
Science, vol. 3, pp. 639-656, 1975.
[79] F. Damanpour, "Organizational innovation: A meta-analysis of effects of
determinants and moderators," Academy of Management Journal, vol. 34, pp.
555-590, 1991.
[80] L.-H. Lin and I.-Y. Lu, "Product quality as a determinant of product
innovation: An empirical analysis of the global automotive industry," Total
Quality Management, vol. 17, pp. 141-147, March 2006.
[81] L. Diaz-Balteiro, A. C. Herruzo, M. Martinez, et al., "An analysis of
productive efficiency and innovation activity using DEA: An application to
Spain's wood-based industry," Forest Policy and Economics, vol. 8, pp. 762-
773, 2006.
[82] D. I. Prajogo and A. S. Sohal, "Transitioning from total quality managment to
total innovation management: An Australian case," International Journal of
Quality & Reliability Management, vol. 21, pp. 861-875, 2004.
[83] A. Charnes, W. W. Cooper, and E. Rhodes, "Measuring the efficiency of
decision making units," European Journal of Operational Research, vol. 2, pp.
429-444, 1978.
258
[84] L. B. Forker and D. Mendez, "An analytical method for benchmarking best
peer suppliers," International Journal of Operations & Production
Management, vol. 21, pp. 195-209, 2001.
[85] H. Yoo, "A study on the efficiency evaluation of total quality management
activities in Korean companies," Total Quality Management, vol. 14, pp. 119-
128, 2003.
[86] K. M. Eisenhardt, "Building theories from case study research," Academy of
Management Review, vol. 14, pp. 532-550, 1989.
[87] R. K. Yin, "The case study crisis: Some answers," Administrative Science
Quarterly, vol. 26, pp. 58-65, 1981.
[88] R. K. Yin, Case Study Research: Design and Methods, Second ed. Thousand
Oaks, CA: Sage Publications Inc., 1994.
[89] B. G. Glaser and A. L. Strauss, The Discovery of Grounded Theory; Strategies
for Qualitative Research. Chicago, IL: Aldine Publishing Company, 1967.
[90] J. Seawright and J. Gerring, "Case selection techniques in case study research:
A menu of qualitative and quantitative options," Political Research Quarterly,
vol. 61, pp. 294-308, 2008.
[91] R. Campbell and C. A. Ahrens, "Innovative community services for rape
victims: An application of multiple case study methodology," American
Journal of Community Psychology, vol. 26, pp. 537-571, 1998.
[92] H. J. Harrington, "The productivity and quality connection," IEEE Journal on
Selected Areas in Communication, vol. SAC-4, pp. 1009-1014, October 1986.
259
[93] B. B. Flynn, R. Schroeder, and S. Sakakibara, "Determinants of quality
performance in high- and low-quality plants," Quality Management Journal,
vol. 2, pp. 8-25, Winter 1995.
[94] A. Schuler and U. Buehlmann, "Identifying Future Competitive Business
Strategies for the U.S. Residential Wood Furniture Industry: Benchmarking
and Paradigm Shifts," USDA Forest Service, Northeastern Research Station,
Newtown Square, PA, General Technical Report GTR-NE-304, March 2003.
[95] A. Schuler, R. Taylor, and P. Araman, "Competitiveness of U.S. wood
furniture manufacturers: Lessons learned from the softwood moulding
industry," Forest Products Journal, vol. 51, pp. 14-20, July/ August 2001.
[96] M. Anderson and A. S. Sohal, "A study of the relationship between quality
management practices and performance in small businesses," International
Journal of Quality & Reliability Management, vol. 16, pp. 859-877, 1999.
[97] S. Mathiyalakan and C. Chung, "A DEA approach for evaluating quality
circles," Benchmarking for Quality Management & Technology, vol. 3, pp. 59-
70, 1996.
[98] K. P. Triantis and R. McNelis, "The measurement and empirical evaluation of
quality productivity for a manufacturing process: A data envelopment analysis
(DEA) approach," in Flexible Automation and Intelligent Manufacturing,
Stuttgart, Germany, 1995, pp. 1134-1145.
[99] Y. K. Suk, "Measuring the impact of total quality management (TQM) on
efficiency using data envelopment analysis (DEA) in the hospital industry: The
260
case of the east south central region of the United States," Ph.D., School of
Business Administration, University of Mississippi, University, 1998.
[100] B. A. G. Bossink, "The strategic function of quality in the management of
innovation," Total Quality Management, vol. 13, pp. 195-205, 2002.
[101] E. Hansen, S. Korhonen, E. Rametsteiner, et al., "Current state-of-knowledge:
Innovation research in the global forest sector," Journal of Forest Products
Business Research, vol. 3, p. 32, 2006.
[102] J. S. Peters, D. T. Damery, and P. Clouston, "A decade of innovation in
particleboard and composite materials: A content analysis of Washington State
University’s International Particleboard/ Composite Materials Symposium
proceedings," Journal of Forest Products Business Research, vol. 3, pp. 1-16,
2006.
[103] M. J. Benner and M. L. Tushman, "Exploitation, exploration, and process
management: The productivity dilemma revisited," Academy of Management
Review, vol. 28, pp. 238-256, 2003.
[104] D. T. Hoang, B. Igel, and T. Laosirihongthong, "The impact of total quality
management on innovation: Findings from a developing country,"
International Journal of Quality & Reliability Management, vol. 23, pp. 1092-
1117, 2006.
[105] D. I. Prajogo and A. S. Sohal, "The multidimensionality of TQM practices in
determining quality and innovation performance - an empirical examination,"
Technovation, vol. 24, pp. 443-453, 2004.

261
[106] D. I. Prajogo and P. Ahmed, K., "The relationships between quality, innovation
and business performance: An empirical study," International Journal of
Business Performance Management, vol. 9, pp. 380-405, 2007.
[107] J. S. Armstrong and T. S. Overton, "Estimating nonresponse bias in mail
surveys," Journal of Marketing Research, vol. 14, pp. 396-402, 1977.
[108] R. D. Banker, A. Charnes, and W. W. Cooper, "Some models for estimating
technical and scale inefficiencies in data envelopment analysis," Management
Science, vol. 30, pp. 1078-1092, 1984.
[109] H. Scheel. (2000). Efficiency Measurement System (Version 1.3.0). Available:
http://www.holger-scheel.de/ems/
[110] R. D. Banker, A. Charnes, W. W. Cooper, et al., "An introduction to data
envelopment analysis with some of its models and their uses," in Research in
Governmental and Nonprofit Accounting. vol. 5, J. L. Chan and J. Patton, Eds.,
ed Greenwich, CT: JAI Press, 1989, pp. 125-163.
[111] S. Sherrill. (2009, August 16th). Radiata Pine imports from New Zealand
threatened. Available: http://www.risiinfo.com/blogs/Radiata-Pine-imports-
from-New-Zealand-threatened.html?source=rss
[112] U. Buehlmann and A. Schuler, "The U.S. household furniture industry: Status
and opportunities," Forest Products Journal, vol. 59, pp. 20-28, 2009.
[113] Anonymous. (2010, August 16th). Furniture and Related Products: Customs
Value by Customs Value for ALL Countries. Available:
http://ita.doc.gov/td/ocg/imp337.htm
262
[114] B. Jacklet. (2010, August 16). Hard times for the big boys. Available:
http://www.oregonbusiness.com/ben/3746-hard-times-for-the-big-boys
[115] Anonymous. (2010, August 16). New Privately Owned Housing Units Started
in the United States, by Intent and Design. Available:
http://www.census.gov/const/startsusintenta.pdf
[116] S. Zika. (2009, August 16). Available:
http://www.hamptonaffiliates.com/ArDisplay.aspx?ID=94&SecID=47
[117] P. Crespell, C. Knowles, and E. Hansen, "Innovativeness in the North
American softwood samilling industry," Forest Science, vol. 52, pp. 568-578,
2006.

263
Appendix A – Quality Constructs and Measurement Instruments
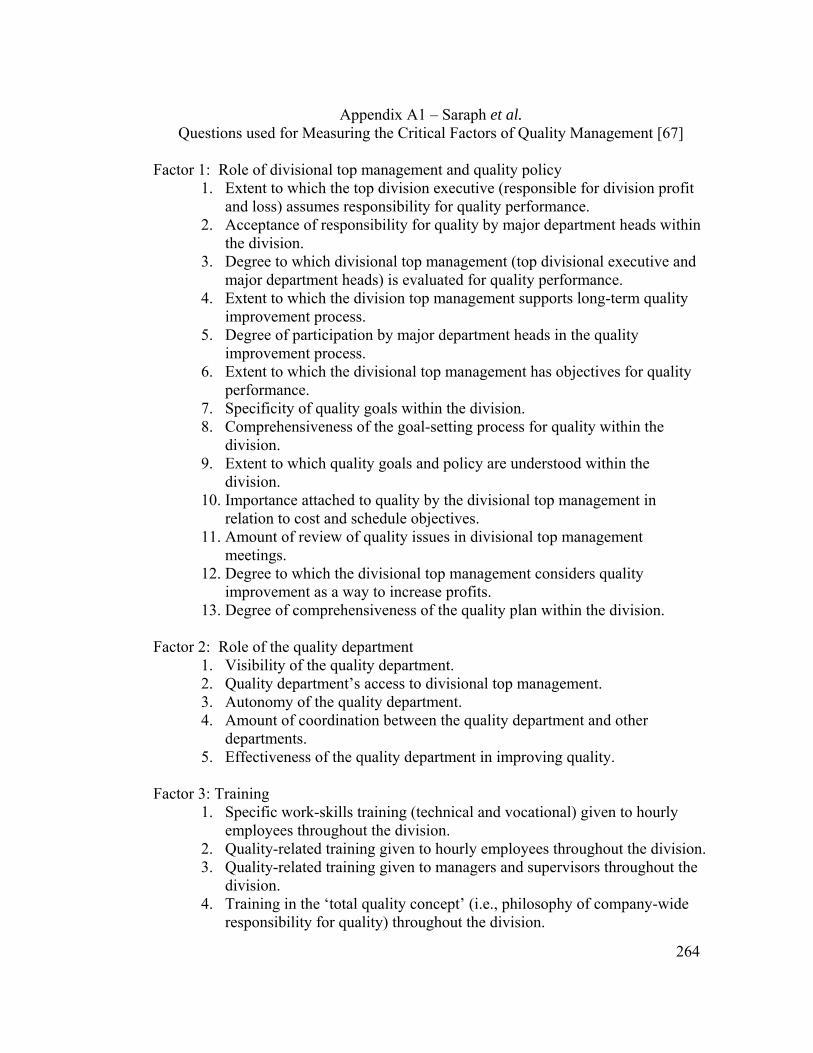
264
Appendix A1 – Saraph et al. Questions used for Measuring the Critical Factors of Quality Management [67]
Factor 1: Role of divisional top management and quality policy
1. Extent to which the top division executive (responsible for division profit and loss) assumes responsibility for quality performance.
2. Acceptance of responsibility for quality by major department heads within the division.
3. Degree to which divisional top management (top divisional executive and major department heads) is evaluated for quality performance.
4. Extent to which the division top management supports long-term quality improvement process.
5. Degree of participation by major department heads in the quality improvement process.
6. Extent to which the divisional top management has objectives for quality performance.
7. Specificity of quality goals within the division. 8. Comprehensiveness of the goal-setting process for quality within the
division. 9. Extent to which quality goals and policy are understood within the
division. 10. Importance attached to quality by the divisional top management in
relation to cost and schedule objectives. 11. Amount of review of quality issues in divisional top management
meetings. 12. Degree to which the divisional top management considers quality
improvement as a way to increase profits. 13. Degree of comprehensiveness of the quality plan within the division.
Factor 2: Role of the quality department
1. Visibility of the quality department. 2. Quality department’s access to divisional top management. 3. Autonomy of the quality department. 4. Amount of coordination between the quality department and other
departments. 5. Effectiveness of the quality department in improving quality.
Factor 3: Training
1. Specific work-skills training (technical and vocational) given to hourly employees throughout the division.
2. Quality-related training given to hourly employees throughout the division. 3. Quality-related training given to managers and supervisors throughout the
division. 4. Training in the ‘total quality concept’ (i.e., philosophy of company-wide
responsibility for quality) throughout the division.
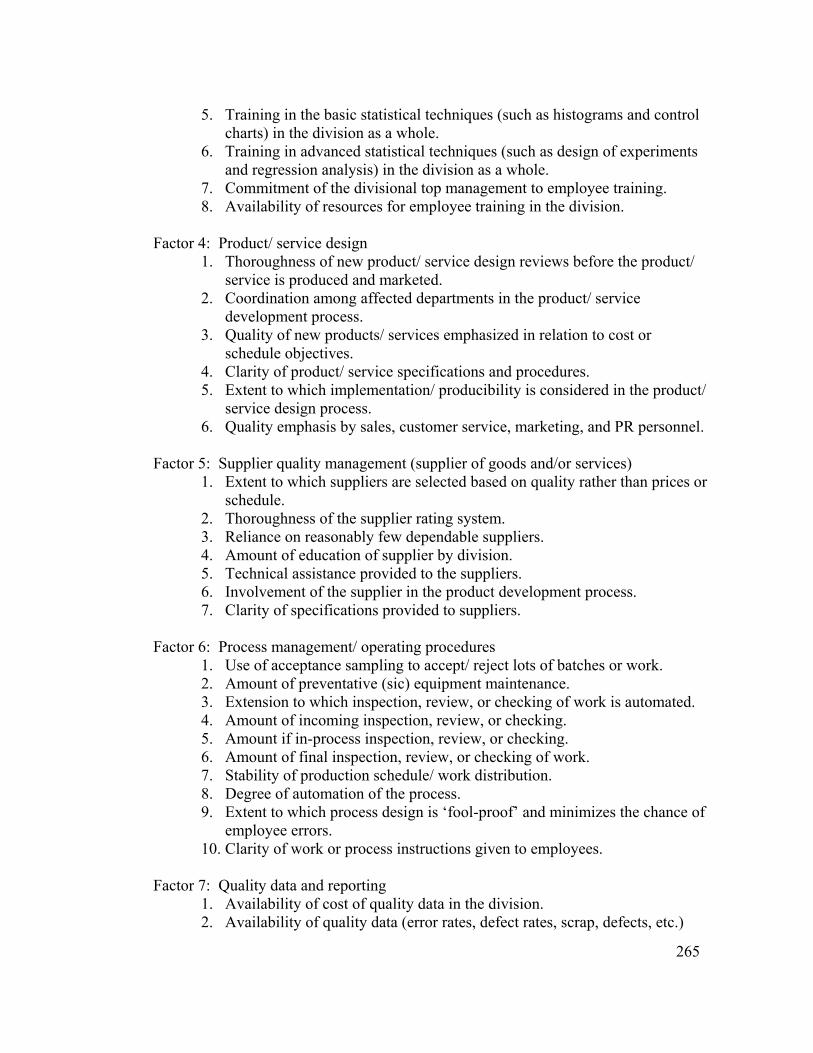
265
5. Training in the basic statistical techniques (such as histograms and control charts) in the division as a whole.
6. Training in advanced statistical techniques (such as design of experiments and regression analysis) in the division as a whole.
7. Commitment of the divisional top management to employee training. 8. Availability of resources for employee training in the division.
Factor 4: Product/ service design
1. Thoroughness of new product/ service design reviews before the product/ service is produced and marketed.
2. Coordination among affected departments in the product/ service development process.
3. Quality of new products/ services emphasized in relation to cost or schedule objectives.
4. Clarity of product/ service specifications and procedures. 5. Extent to which implementation/ producibility is considered in the product/
service design process. 6. Quality emphasis by sales, customer service, marketing, and PR personnel.
Factor 5: Supplier quality management (supplier of goods and/or services) 1. Extent to which suppliers are selected based on quality rather than prices or
schedule. 2. Thoroughness of the supplier rating system. 3. Reliance on reasonably few dependable suppliers. 4. Amount of education of supplier by division. 5. Technical assistance provided to the suppliers. 6. Involvement of the supplier in the product development process. 7. Clarity of specifications provided to suppliers.
Factor 6: Process management/ operating procedures
1. Use of acceptance sampling to accept/ reject lots of batches or work. 2. Amount of preventative (sic) equipment maintenance. 3. Extension to which inspection, review, or checking of work is automated. 4. Amount of incoming inspection, review, or checking. 5. Amount if in-process inspection, review, or checking. 6. Amount of final inspection, review, or checking of work. 7. Stability of production schedule/ work distribution. 8. Degree of automation of the process. 9. Extent to which process design is ‘fool-proof’ and minimizes the chance of
employee errors. 10. Clarity of work or process instructions given to employees.
Factor 7: Quality data and reporting 1. Availability of cost of quality data in the division. 2. Availability of quality data (error rates, defect rates, scrap, defects, etc.)
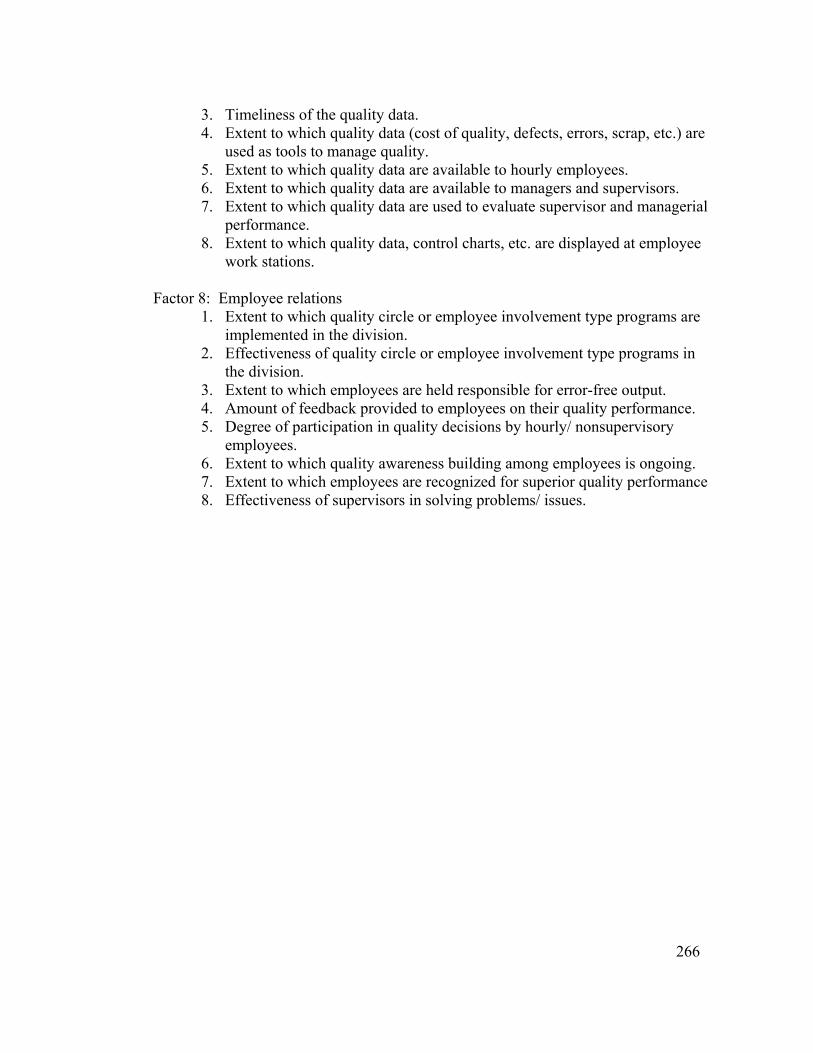
266
3. Timeliness of the quality data. 4. Extent to which quality data (cost of quality, defects, errors, scrap, etc.) are
used as tools to manage quality. 5. Extent to which quality data are available to hourly employees. 6. Extent to which quality data are available to managers and supervisors. 7. Extent to which quality data are used to evaluate supervisor and managerial
performance. 8. Extent to which quality data, control charts, etc. are displayed at employee
work stations.
Factor 8: Employee relations 1. Extent to which quality circle or employee involvement type programs are
implemented in the division. 2. Effectiveness of quality circle or employee involvement type programs in
the division. 3. Extent to which employees are held responsible for error-free output. 4. Amount of feedback provided to employees on their quality performance. 5. Degree of participation in quality decisions by hourly/ nonsupervisory
employees. 6. Extent to which quality awareness building among employees is ongoing. 7. Extent to which employees are recognized for superior quality performance 8. Effectiveness of supervisors in solving problems/ issues.
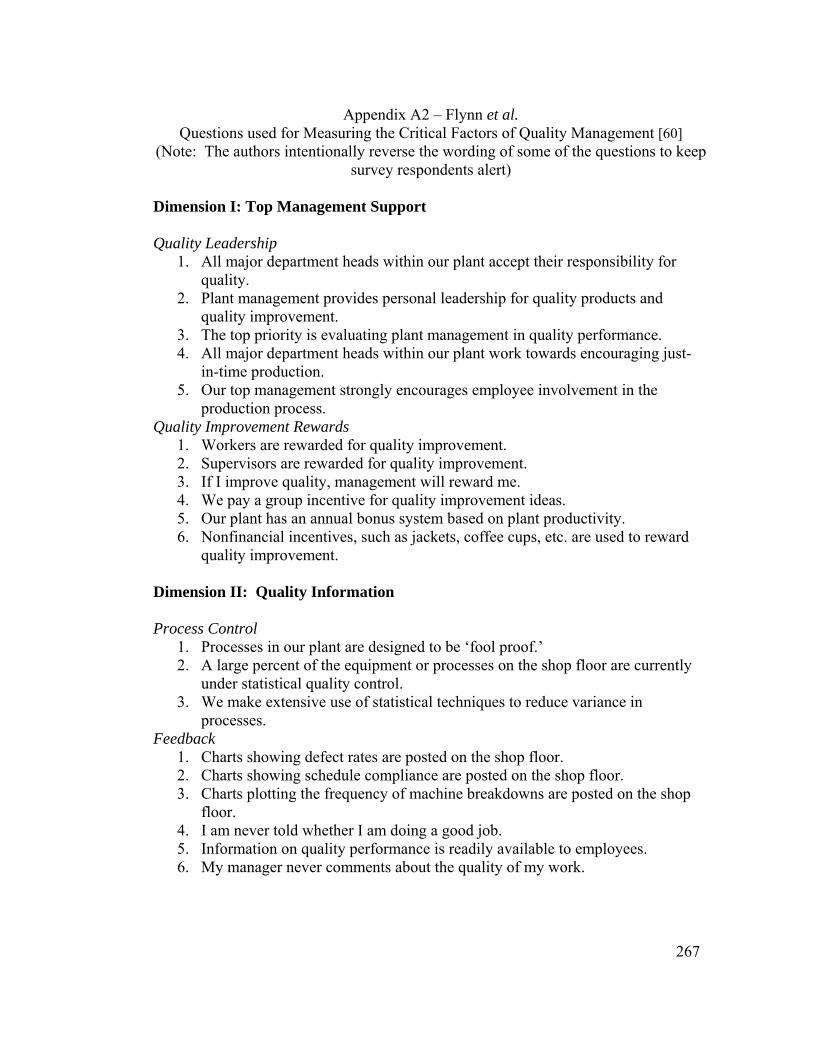
267
Appendix A2 – Flynn et al. Questions used for Measuring the Critical Factors of Quality Management [60]
(Note: The authors intentionally reverse the wording of some of the questions to keep survey respondents alert)
Dimension I: Top Management Support Quality Leadership
1. All major department heads within our plant accept their responsibility for quality.
2. Plant management provides personal leadership for quality products and quality improvement.
3. The top priority is evaluating plant management in quality performance. 4. All major department heads within our plant work towards encouraging just-
in-time production. 5. Our top management strongly encourages employee involvement in the
production process. Quality Improvement Rewards
1. Workers are rewarded for quality improvement. 2. Supervisors are rewarded for quality improvement. 3. If I improve quality, management will reward me. 4. We pay a group incentive for quality improvement ideas. 5. Our plant has an annual bonus system based on plant productivity. 6. Nonfinancial incentives, such as jackets, coffee cups, etc. are used to reward
quality improvement. Dimension II: Quality Information Process Control
1. Processes in our plant are designed to be ‘fool proof.’ 2. A large percent of the equipment or processes on the shop floor are currently
under statistical quality control. 3. We make extensive use of statistical techniques to reduce variance in
processes. Feedback
1. Charts showing defect rates are posted on the shop floor. 2. Charts showing schedule compliance are posted on the shop floor. 3. Charts plotting the frequency of machine breakdowns are posted on the shop
floor. 4. I am never told whether I am doing a good job. 5. Information on quality performance is readily available to employees. 6. My manager never comments about the quality of my work.
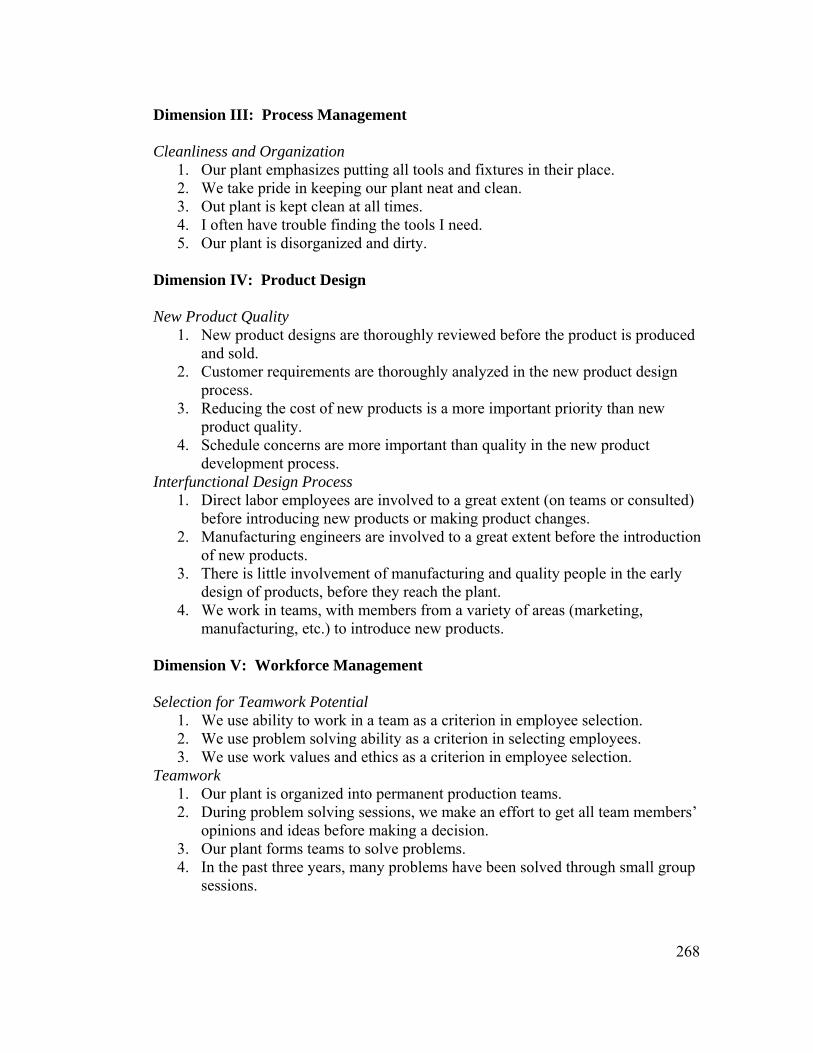
268
Dimension III: Process Management Cleanliness and Organization
1. Our plant emphasizes putting all tools and fixtures in their place. 2. We take pride in keeping our plant neat and clean. 3. Out plant is kept clean at all times. 4. I often have trouble finding the tools I need. 5. Our plant is disorganized and dirty.
Dimension IV: Product Design New Product Quality
1. New product designs are thoroughly reviewed before the product is produced and sold.
2. Customer requirements are thoroughly analyzed in the new product design process.
3. Reducing the cost of new products is a more important priority than new product quality.
4. Schedule concerns are more important than quality in the new product development process.
Interfunctional Design Process 1. Direct labor employees are involved to a great extent (on teams or consulted)
before introducing new products or making product changes. 2. Manufacturing engineers are involved to a great extent before the introduction
of new products. 3. There is little involvement of manufacturing and quality people in the early
design of products, before they reach the plant. 4. We work in teams, with members from a variety of areas (marketing,
manufacturing, etc.) to introduce new products. Dimension V: Workforce Management Selection for Teamwork Potential
1. We use ability to work in a team as a criterion in employee selection. 2. We use problem solving ability as a criterion in selecting employees. 3. We use work values and ethics as a criterion in employee selection.
Teamwork 1. Our plant is organized into permanent production teams. 2. During problem solving sessions, we make an effort to get all team members’
opinions and ideas before making a decision. 3. Our plant forms teams to solve problems. 4. In the past three years, many problems have been solved through small group
sessions.
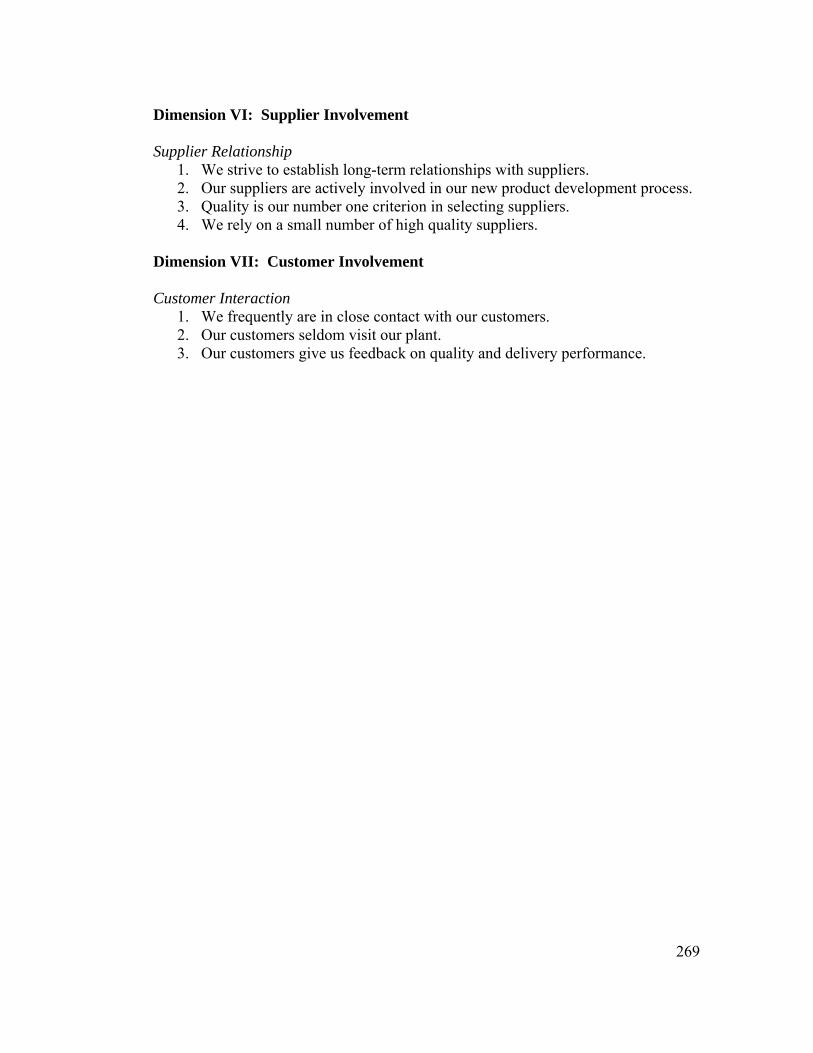
269
Dimension VI: Supplier Involvement Supplier Relationship
1. We strive to establish long-term relationships with suppliers. 2. Our suppliers are actively involved in our new product development process. 3. Quality is our number one criterion in selecting suppliers. 4. We rely on a small number of high quality suppliers.
Dimension VII: Customer Involvement Customer Interaction
1. We frequently are in close contact with our customers. 2. Our customers seldom visit our plant. 3. Our customers give us feedback on quality and delivery performance.
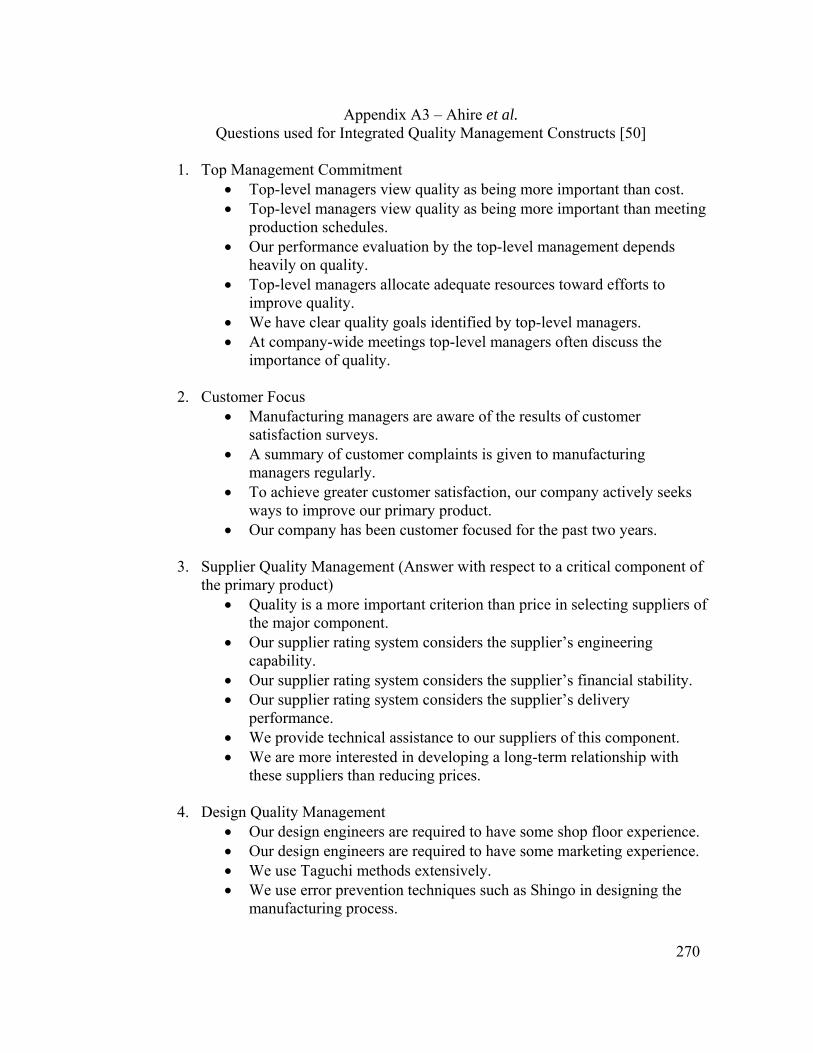
270
Appendix A3 – Ahire et al. Questions used for Integrated Quality Management Constructs [50]
1. Top Management Commitment
• Top-level managers view quality as being more important than cost. • Top-level managers view quality as being more important than meeting
production schedules. • Our performance evaluation by the top-level management depends
heavily on quality. • Top-level managers allocate adequate resources toward efforts to
improve quality. • We have clear quality goals identified by top-level managers. • At company-wide meetings top-level managers often discuss the
importance of quality. 2. Customer Focus
• Manufacturing managers are aware of the results of customer satisfaction surveys.
• A summary of customer complaints is given to manufacturing managers regularly.
• To achieve greater customer satisfaction, our company actively seeks ways to improve our primary product.
• Our company has been customer focused for the past two years.
3. Supplier Quality Management (Answer with respect to a critical component of the primary product)
• Quality is a more important criterion than price in selecting suppliers of the major component.
• Our supplier rating system considers the supplier’s engineering capability.
• Our supplier rating system considers the supplier’s financial stability. • Our supplier rating system considers the supplier’s delivery
performance. • We provide technical assistance to our suppliers of this component. • We are more interested in developing a long-term relationship with
these suppliers than reducing prices. 4. Design Quality Management
• Our design engineers are required to have some shop floor experience. • Our design engineers are required to have some marketing experience. • We use Taguchi methods extensively. • We use error prevention techniques such as Shingo in designing the
manufacturing process.
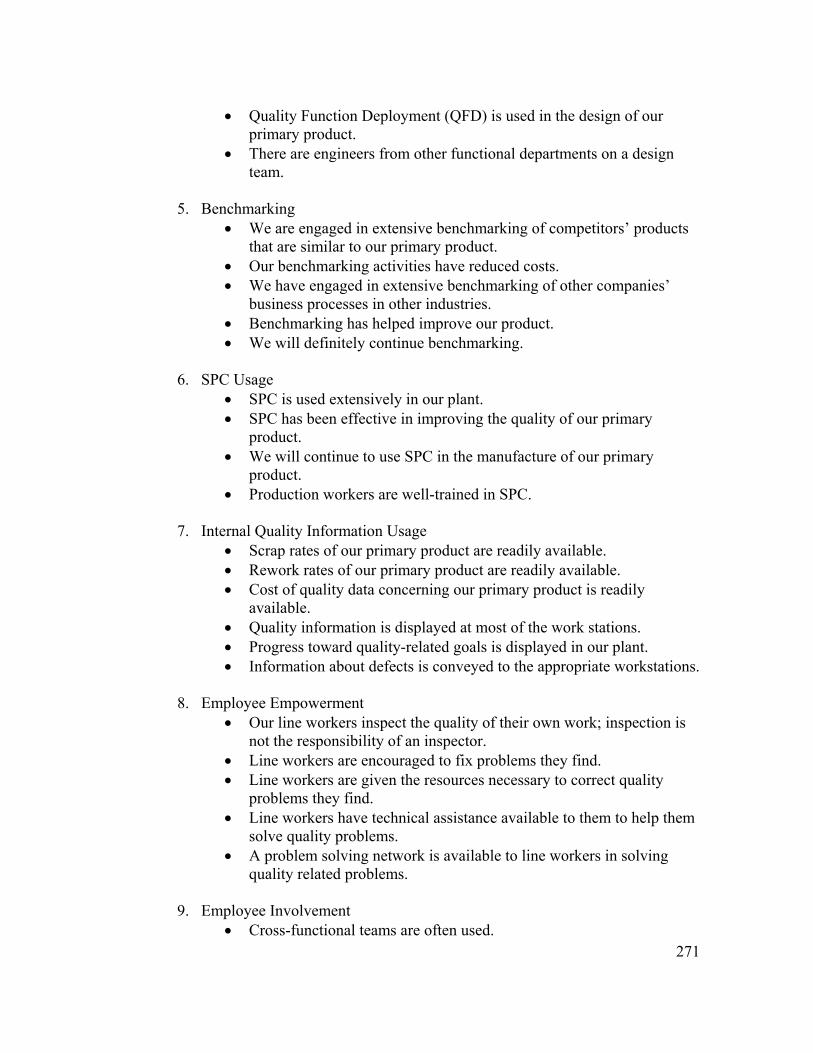
271
• Quality Function Deployment (QFD) is used in the design of our primary product.
• There are engineers from other functional departments on a design team.
5. Benchmarking
• We are engaged in extensive benchmarking of competitors’ products that are similar to our primary product.
• Our benchmarking activities have reduced costs. • We have engaged in extensive benchmarking of other companies’
business processes in other industries. • Benchmarking has helped improve our product. • We will definitely continue benchmarking.
6. SPC Usage
• SPC is used extensively in our plant. • SPC has been effective in improving the quality of our primary
product. • We will continue to use SPC in the manufacture of our primary
product. • Production workers are well-trained in SPC.
7. Internal Quality Information Usage
• Scrap rates of our primary product are readily available. • Rework rates of our primary product are readily available. • Cost of quality data concerning our primary product is readily
available. • Quality information is displayed at most of the work stations. • Progress toward quality-related goals is displayed in our plant. • Information about defects is conveyed to the appropriate workstations.
8. Employee Empowerment
• Our line workers inspect the quality of their own work; inspection is not the responsibility of an inspector.
• Line workers are encouraged to fix problems they find. • Line workers are given the resources necessary to correct quality
problems they find. • Line workers have technical assistance available to them to help them
solve quality problems. • A problem solving network is available to line workers in solving
quality related problems. 9. Employee Involvement
• Cross-functional teams are often used.
272
• All employee suggestions are evaluated. • Most employee suggestions are implemented.
10. Employee Training
• Resources are available for employee quality training in our plant. • There is almost always some kind of employee quality training going
on in our plant. • Plant managers are often involved in quality training. • Most employees in our plant are trained to use quality problem solving
techniques such as cause and effect diagrams. • Most employees in our plant do not view each new quality seminar or
training program as “just another fad.”
11. Product Quality (Answer on a scale of 1 to 7, where: 1 = worst in industry, 4 = average, 7 = best in industry)
• The performance of our primary product is… • The reliability of our primary product is… • The conformance to engineering specifications of our primary product
is… • The durability of our primary product is…
12. Supplier Performance (Answer with respect to suppliers of the critical component of the primary product)
• Suppliers send us shipments of this component that conform to specifications.
• Most quality problems in the past have easily been resolved with our suppliers.
• Our suppliers are always eager to resolve quality problems. • The critical component is durable. • The critical component’s performance is excellent. • The critical component is reliable.
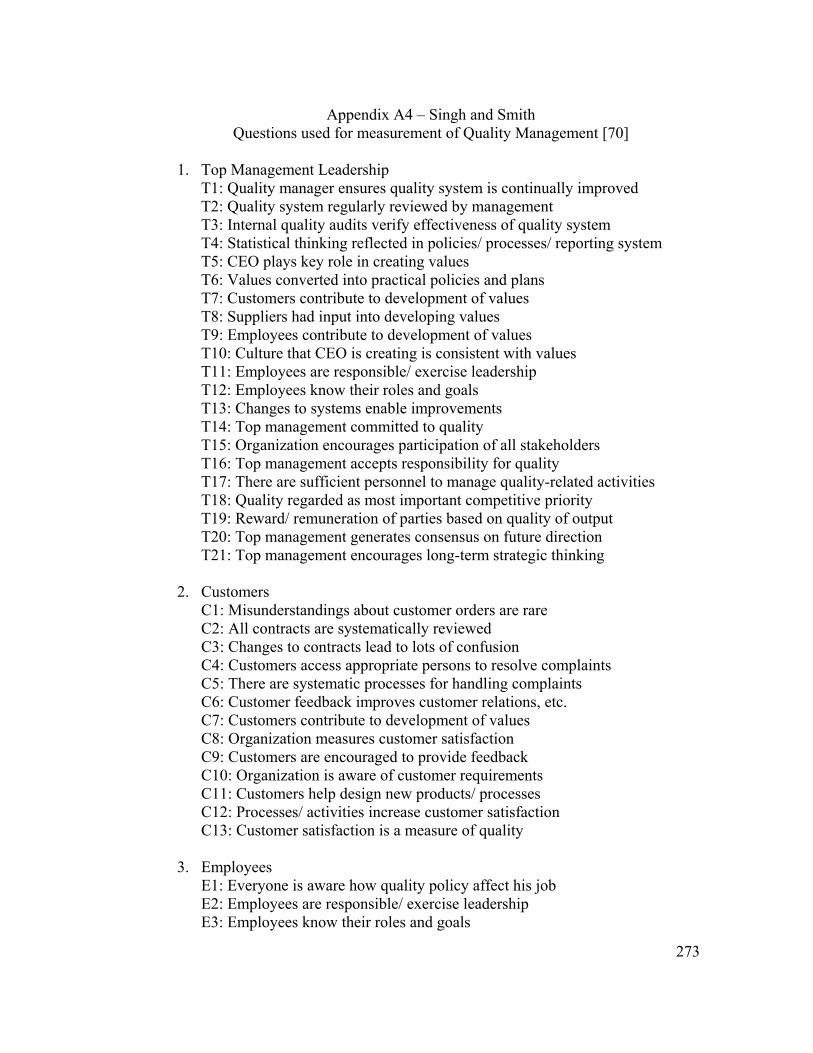
273
Appendix A4 – Singh and Smith Questions used for measurement of Quality Management [70]
1. Top Management Leadership
T1: Quality manager ensures quality system is continually improved T2: Quality system regularly reviewed by management T3: Internal quality audits verify effectiveness of quality system T4: Statistical thinking reflected in policies/ processes/ reporting system T5: CEO plays key role in creating values T6: Values converted into practical policies and plans T7: Customers contribute to development of values T8: Suppliers had input into developing values T9: Employees contribute to development of values T10: Culture that CEO is creating is consistent with values T11: Employees are responsible/ exercise leadership T12: Employees know their roles and goals T13: Changes to systems enable improvements T14: Top management committed to quality T15: Organization encourages participation of all stakeholders T16: Top management accepts responsibility for quality T17: There are sufficient personnel to manage quality-related activities T18: Quality regarded as most important competitive priority T19: Reward/ remuneration of parties based on quality of output T20: Top management generates consensus on future direction T21: Top management encourages long-term strategic thinking
2. Customers C1: Misunderstandings about customer orders are rare C2: All contracts are systematically reviewed C3: Changes to contracts lead to lots of confusion C4: Customers access appropriate persons to resolve complaints C5: There are systematic processes for handling complaints C6: Customer feedback improves customer relations, etc. C7: Customers contribute to development of values C8: Organization measures customer satisfaction C9: Customers are encouraged to provide feedback C10: Organization is aware of customer requirements C11: Customers help design new products/ processes C12: Processes/ activities increase customer satisfaction C13: Customer satisfaction is a measure of quality
3. Employees E1: Everyone is aware how quality policy affect his job E2: Employees are responsible/ exercise leadership E3: Employees know their roles and goals
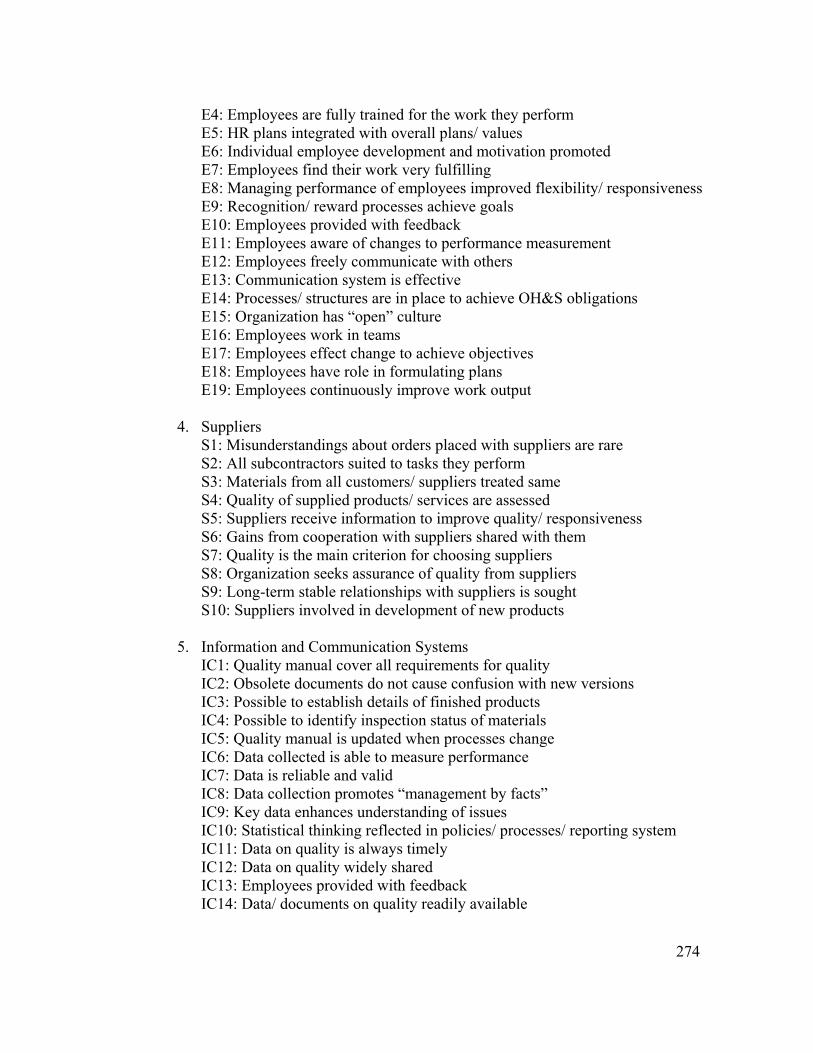
274
E4: Employees are fully trained for the work they perform E5: HR plans integrated with overall plans/ values E6: Individual employee development and motivation promoted E7: Employees find their work very fulfilling E8: Managing performance of employees improved flexibility/ responsiveness E9: Recognition/ reward processes achieve goals E10: Employees provided with feedback E11: Employees aware of changes to performance measurement E12: Employees freely communicate with others E13: Communication system is effective E14: Processes/ structures are in place to achieve OH&S obligations E15: Organization has “open” culture E16: Employees work in teams E17: Employees effect change to achieve objectives E18: Employees have role in formulating plans E19: Employees continuously improve work output
4. Suppliers S1: Misunderstandings about orders placed with suppliers are rare S2: All subcontractors suited to tasks they perform S3: Materials from all customers/ suppliers treated same S4: Quality of supplied products/ services are assessed S5: Suppliers receive information to improve quality/ responsiveness S6: Gains from cooperation with suppliers shared with them S7: Quality is the main criterion for choosing suppliers S8: Organization seeks assurance of quality from suppliers S9: Long-term stable relationships with suppliers is sought S10: Suppliers involved in development of new products
5. Information and Communication Systems IC1: Quality manual cover all requirements for quality IC2: Obsolete documents do not cause confusion with new versions IC3: Possible to establish details of finished products IC4: Possible to identify inspection status of materials IC5: Quality manual is updated when processes change IC6: Data collected is able to measure performance IC7: Data is reliable and valid IC8: Data collection promotes “management by facts” IC9: Key data enhances understanding of issues IC10: Statistical thinking reflected in policies/ processes/ reporting system IC11: Data on quality is always timely IC12: Data on quality widely shared IC13: Employees provided with feedback IC14: Data/ documents on quality readily available
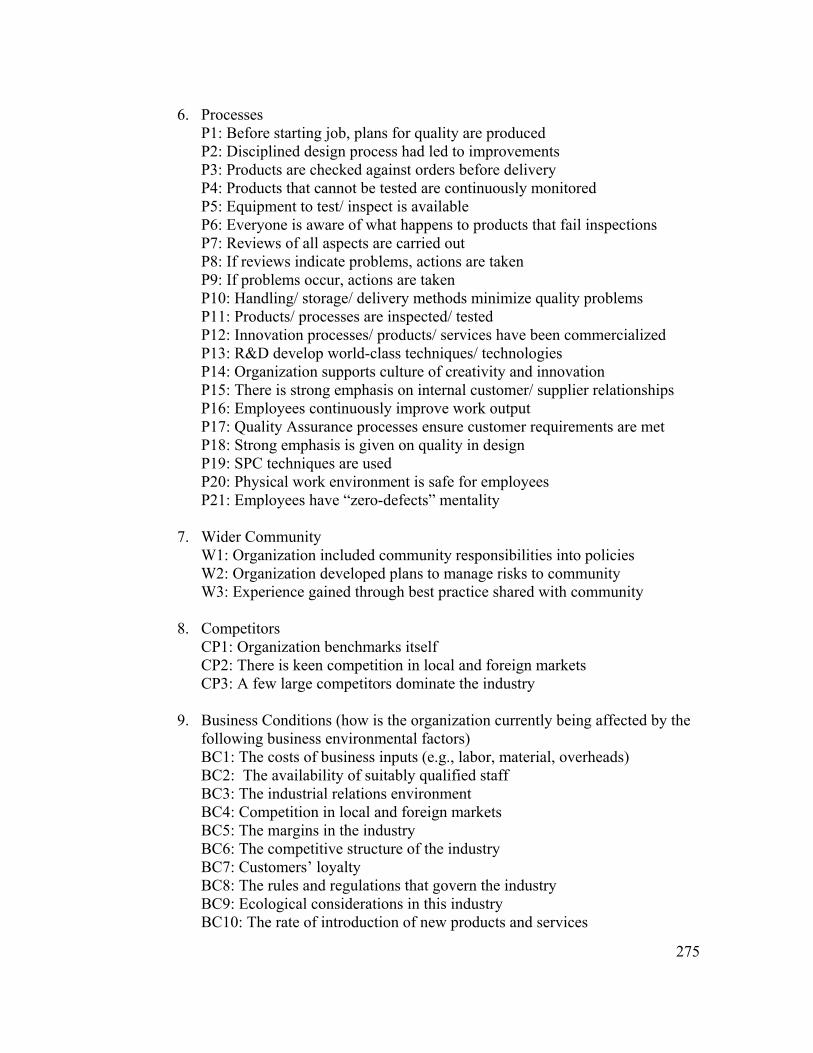
275
6. Processes P1: Before starting job, plans for quality are produced P2: Disciplined design process had led to improvements P3: Products are checked against orders before delivery P4: Products that cannot be tested are continuously monitored P5: Equipment to test/ inspect is available P6: Everyone is aware of what happens to products that fail inspections P7: Reviews of all aspects are carried out P8: If reviews indicate problems, actions are taken P9: If problems occur, actions are taken P10: Handling/ storage/ delivery methods minimize quality problems P11: Products/ processes are inspected/ tested P12: Innovation processes/ products/ services have been commercialized P13: R&D develop world-class techniques/ technologies P14: Organization supports culture of creativity and innovation P15: There is strong emphasis on internal customer/ supplier relationships P16: Employees continuously improve work output P17: Quality Assurance processes ensure customer requirements are met P18: Strong emphasis is given on quality in design P19: SPC techniques are used P20: Physical work environment is safe for employees P21: Employees have “zero-defects” mentality
7. Wider Community W1: Organization included community responsibilities into policies W2: Organization developed plans to manage risks to community W3: Experience gained through best practice shared with community
8. Competitors CP1: Organization benchmarks itself CP2: There is keen competition in local and foreign markets CP3: A few large competitors dominate the industry
9. Business Conditions (how is the organization currently being affected by the following business environmental factors) BC1: The costs of business inputs (e.g., labor, material, overheads) BC2: The availability of suitably qualified staff BC3: The industrial relations environment BC4: Competition in local and foreign markets BC5: The margins in the industry BC6: The competitive structure of the industry BC7: Customers’ loyalty BC8: The rules and regulations that govern the industry BC9: Ecological considerations in this industry BC10: The rate of introduction of new products and services

276
BC11: The rate of innovation of new operational processes BC12: The rate of change in taste and preference of customers
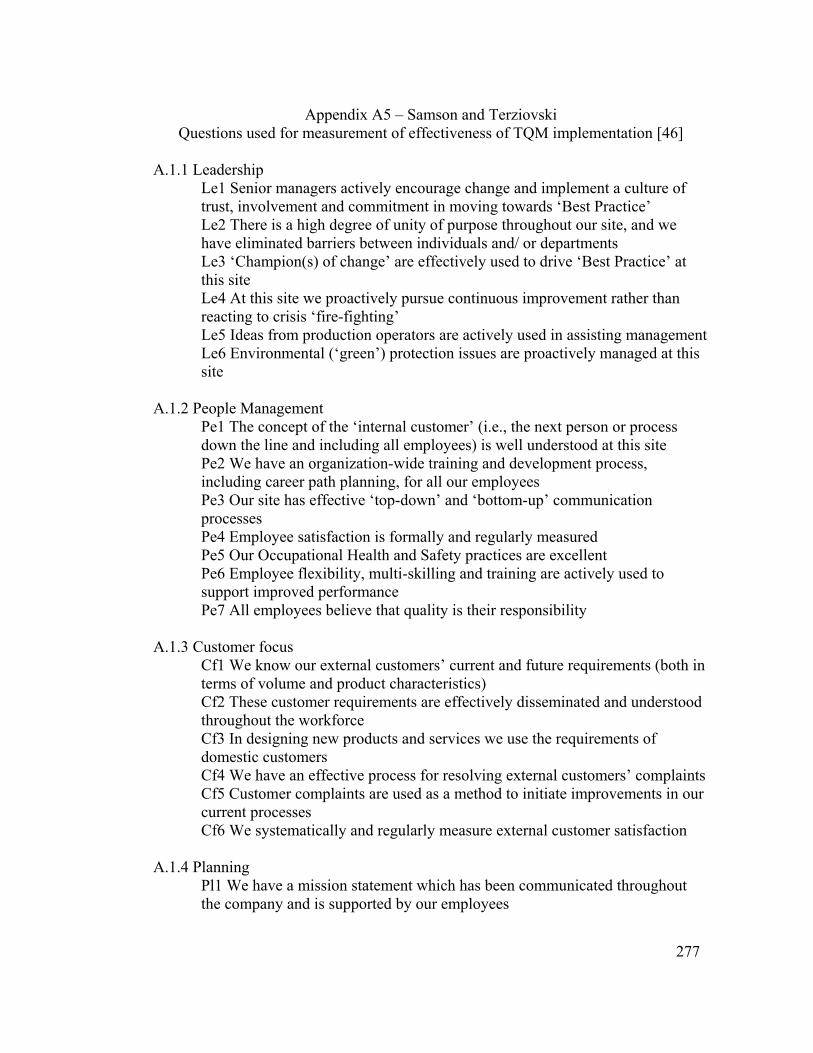
277
Appendix A5 – Samson and Terziovski Questions used for measurement of effectiveness of TQM implementation [46]
A.1.1 Leadership
Le1 Senior managers actively encourage change and implement a culture of trust, involvement and commitment in moving towards ‘Best Practice’ Le2 There is a high degree of unity of purpose throughout our site, and we have eliminated barriers between individuals and/ or departments Le3 ‘Champion(s) of change’ are effectively used to drive ‘Best Practice’ at this site Le4 At this site we proactively pursue continuous improvement rather than reacting to crisis ‘fire-fighting’ Le5 Ideas from production operators are actively used in assisting management Le6 Environmental (‘green’) protection issues are proactively managed at this site
A.1.2 People Management
Pe1 The concept of the ‘internal customer’ (i.e., the next person or process down the line and including all employees) is well understood at this site Pe2 We have an organization-wide training and development process, including career path planning, for all our employees Pe3 Our site has effective ‘top-down’ and ‘bottom-up’ communication processes Pe4 Employee satisfaction is formally and regularly measured Pe5 Our Occupational Health and Safety practices are excellent Pe6 Employee flexibility, multi-skilling and training are actively used to support improved performance Pe7 All employees believe that quality is their responsibility
A.1.3 Customer focus
Cf1 We know our external customers’ current and future requirements (both in terms of volume and product characteristics) Cf2 These customer requirements are effectively disseminated and understood throughout the workforce Cf3 In designing new products and services we use the requirements of domestic customers Cf4 We have an effective process for resolving external customers’ complaints Cf5 Customer complaints are used as a method to initiate improvements in our current processes Cf6 We systematically and regularly measure external customer satisfaction
A.1.4 Planning
Pl1 We have a mission statement which has been communicated throughout the company and is supported by our employees
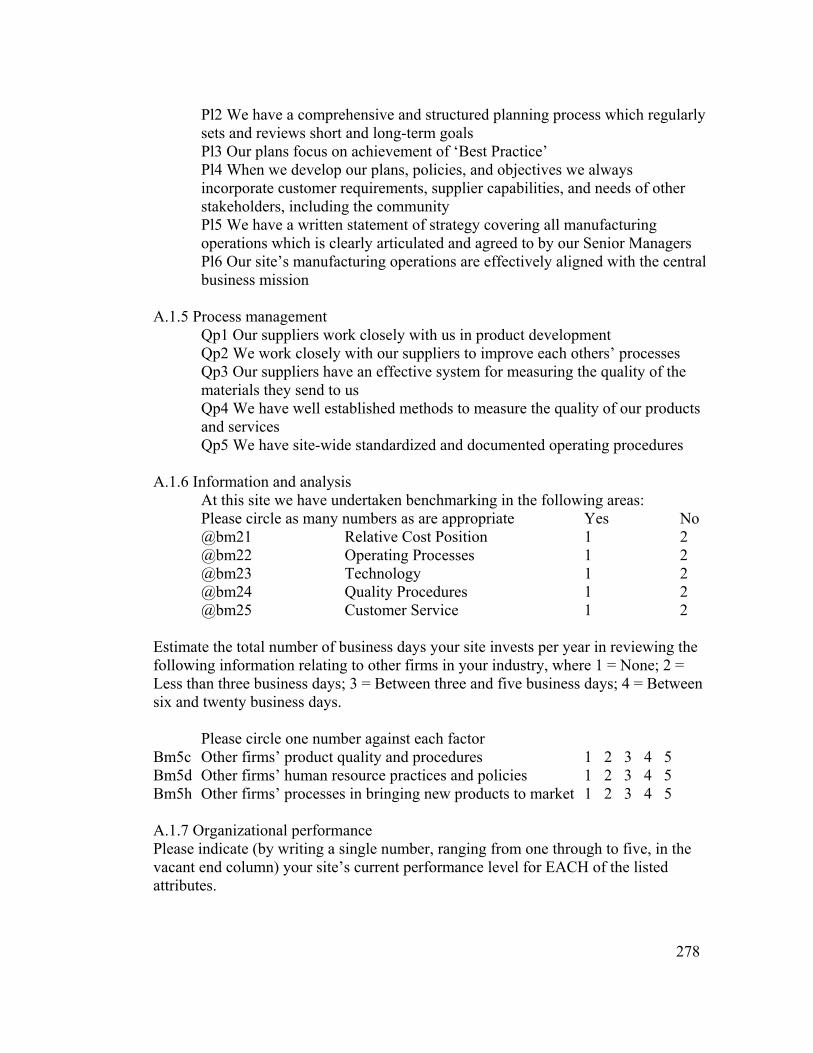
278
Pl2 We have a comprehensive and structured planning process which regularly sets and reviews short and long-term goals Pl3 Our plans focus on achievement of ‘Best Practice’ Pl4 When we develop our plans, policies, and objectives we always incorporate customer requirements, supplier capabilities, and needs of other stakeholders, including the community Pl5 We have a written statement of strategy covering all manufacturing operations which is clearly articulated and agreed to by our Senior Managers Pl6 Our site’s manufacturing operations are effectively aligned with the central business mission
A.1.5 Process management
Qp1 Our suppliers work closely with us in product development Qp2 We work closely with our suppliers to improve each others’ processes Qp3 Our suppliers have an effective system for measuring the quality of the materials they send to us Qp4 We have well established methods to measure the quality of our products and services Qp5 We have site-wide standardized and documented operating procedures
A.1.6 Information and analysis
At this site we have undertaken benchmarking in the following areas: Please circle as many numbers as are appropriate Yes No @bm21 Relative Cost Position 1 2 @bm22 Operating Processes 1 2 @bm23 Technology 1 2 @bm24 Quality Procedures 1 2 @bm25 Customer Service 1 2
Estimate the total number of business days your site invests per year in reviewing the following information relating to other firms in your industry, where 1 = None; 2 = Less than three business days; 3 = Between three and five business days; 4 = Between six and twenty business days. Please circle one number against each factor Bm5c Other firms’ product quality and procedures 1 2 3 4 5 Bm5d Other firms’ human resource practices and policies 1 2 3 4 5 Bm5h Other firms’ processes in bringing new products to market 1 2 3 4 5
A.1.7 Organizational performance Please indicate (by writing a single number, ranging from one through to five, in the vacant end column) your site’s current performance level for EACH of the listed attributes.
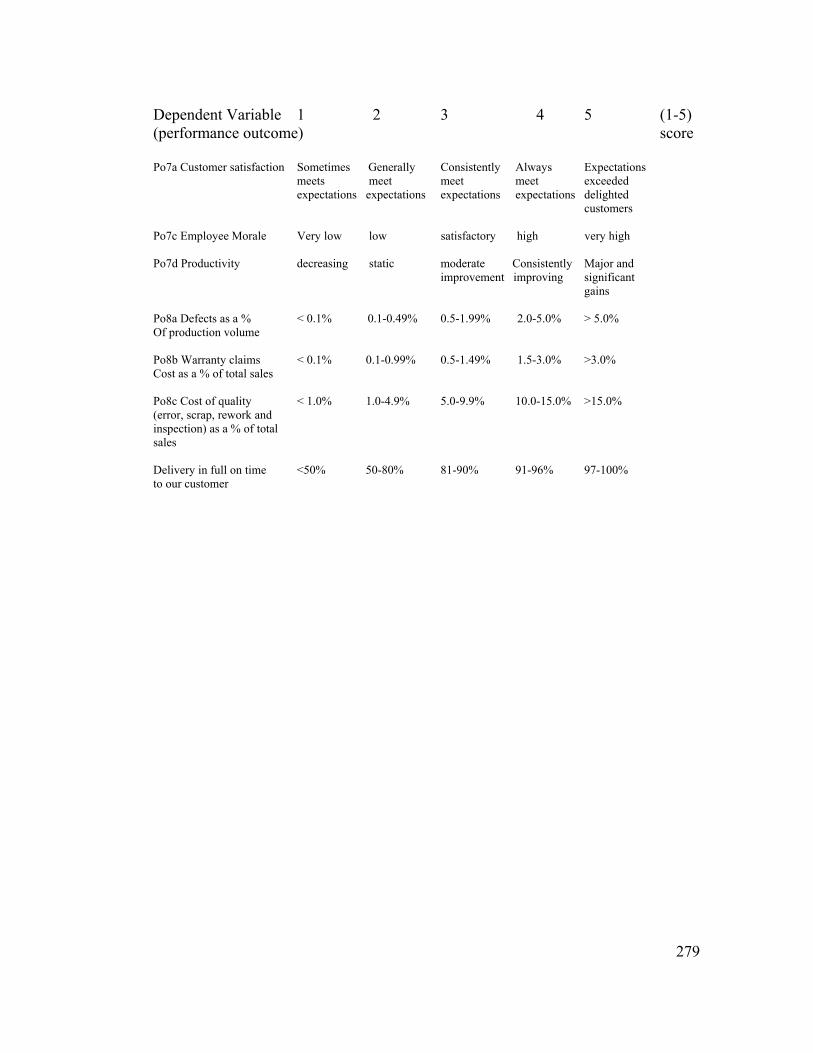
279
Dependent Variable 1 2 3 4 5 (1-5) (performance outcome) score Po7a Customer satisfaction Sometimes Generally Consistently Always Expectations meets meet meet meet exceeded
expectations expectations expectations expectations delighted customers
Po7c Employee Morale Very low low satisfactory high very high Po7d Productivity decreasing static moderate Consistently Major and improvement improving significant gains Po8a Defects as a % < 0.1% 0.1-0.49% 0.5-1.99% 2.0-5.0% > 5.0% Of production volume Po8b Warranty claims < 0.1% 0.1-0.99% 0.5-1.49% 1.5-3.0% >3.0% Cost as a % of total sales Po8c Cost of quality < 1.0% 1.0-4.9% 5.0-9.9% 10.0-15.0% >15.0% (error, scrap, rework and inspection) as a % of total sales Delivery in full on time <50% 50-80% 81-90% 91-96% 97-100% to our customer
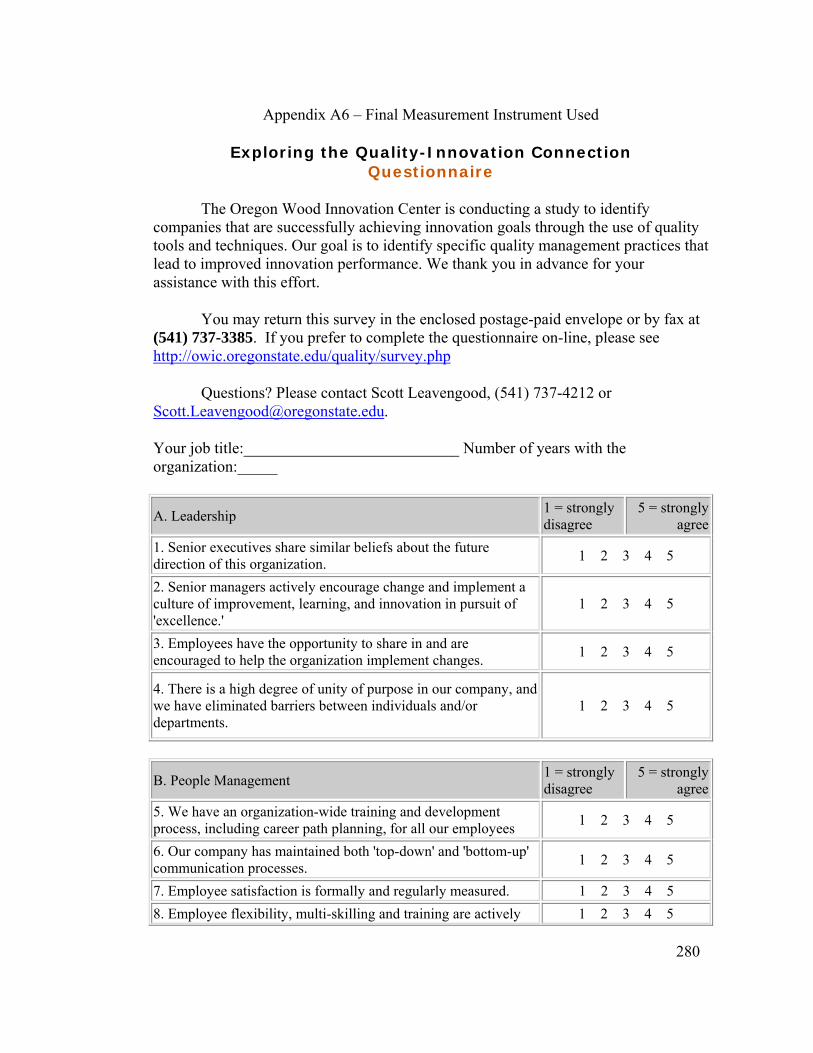
280
Appendix A6 – Final Measurement Instrument Used
Exploring the Quality-Innovation Connection Questionnaire
The Oregon Wood Innovation Center is conducting a study to identify companies that are successfully achieving innovation goals through the use of quality tools and techniques. Our goal is to identify specific quality management practices that lead to improved innovation performance. We thank you in advance for your assistance with this effort.
You may return this survey in the enclosed postage-paid envelope or by fax at (541) 737-3385. If you prefer to complete the questionnaire on-line, please see http://owic.oregonstate.edu/quality/survey.php
Questions? Please contact Scott Leavengood, (541) 737-4212 or [email protected].
Your job title:___________________________ Number of years with the organization:_____
A. Leadership 1 = strongly disagree
5 = strongly agree
1. Senior executives share similar beliefs about the future direction of this organization. 1 2 3 4 5
2. Senior managers actively encourage change and implement a culture of improvement, learning, and innovation in pursuit of 'excellence.'
1 2 3 4 5
3. Employees have the opportunity to share in and are encouraged to help the organization implement changes. 1 2 3 4 5
4. There is a high degree of unity of purpose in our company, and we have eliminated barriers between individuals and/or departments.
1 2 3 4 5
B. People Management 1 = strongly disagree
5 = strongly agree
5. We have an organization-wide training and development process, including career path planning, for all our employees 1 2 3 4 5
6. Our company has maintained both 'top-down' and 'bottom-up' communication processes. 1 2 3 4 5
7. Employee satisfaction is formally and regularly measured. 1 2 3 4 5 8. Employee flexibility, multi-skilling and training are actively 1 2 3 4 5
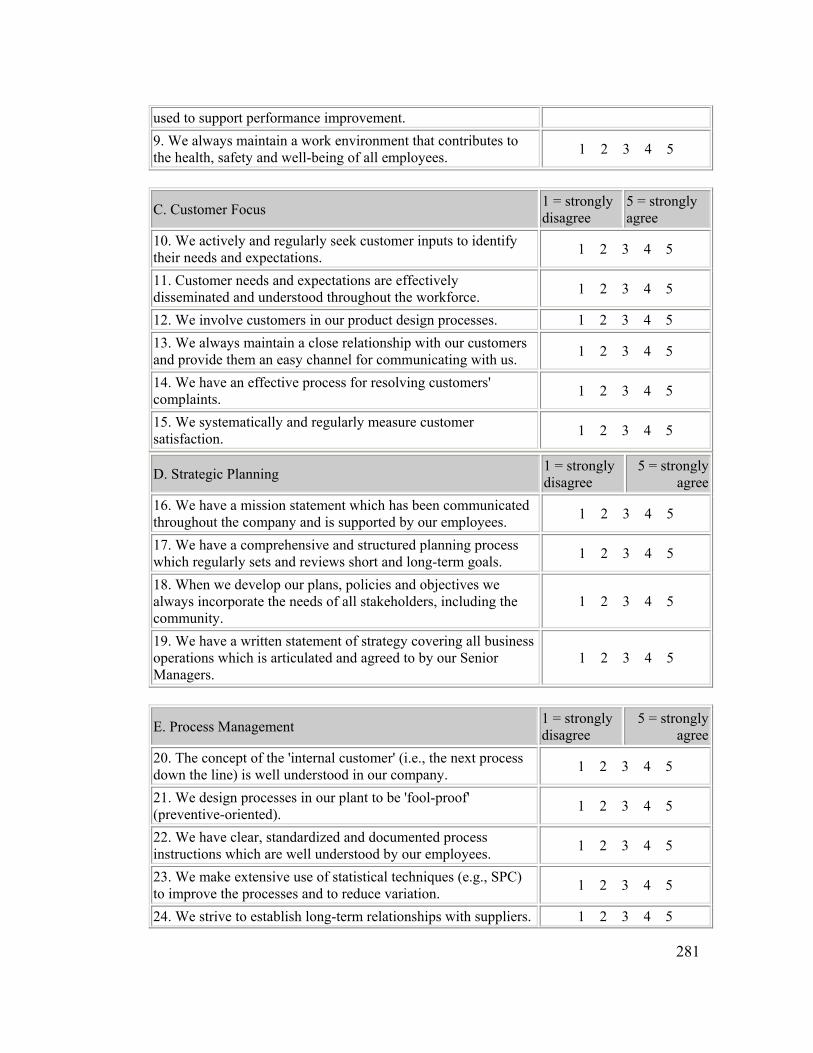
281
used to support performance improvement. 9. We always maintain a work environment that contributes to the health, safety and well-being of all employees. 1 2 3 4 5
C. Customer Focus 1 = strongly disagree
5 = strongly agree
10. We actively and regularly seek customer inputs to identify their needs and expectations. 1 2 3 4 5
11. Customer needs and expectations are effectively disseminated and understood throughout the workforce. 1 2 3 4 5
12. We involve customers in our product design processes. 1 2 3 4 5 13. We always maintain a close relationship with our customers and provide them an easy channel for communicating with us. 1 2 3 4 5
14. We have an effective process for resolving customers' complaints. 1 2 3 4 5
15. We systematically and regularly measure customer satisfaction. 1 2 3 4 5
D. Strategic Planning 1 = strongly disagree
5 = strongly agree
16. We have a mission statement which has been communicated throughout the company and is supported by our employees. 1 2 3 4 5
17. We have a comprehensive and structured planning process which regularly sets and reviews short and long-term goals. 1 2 3 4 5
18. When we develop our plans, policies and objectives we always incorporate the needs of all stakeholders, including the community.
1 2 3 4 5
19. We have a written statement of strategy covering all business operations which is articulated and agreed to by our Senior Managers.
1 2 3 4 5
E. Process Management 1 = strongly disagree
5 = strongly agree
20. The concept of the 'internal customer' (i.e., the next process down the line) is well understood in our company. 1 2 3 4 5
21. We design processes in our plant to be 'fool-proof' (preventive-oriented). 1 2 3 4 5
22. We have clear, standardized and documented process instructions which are well understood by our employees. 1 2 3 4 5
23. We make extensive use of statistical techniques (e.g., SPC) to improve the processes and to reduce variation. 1 2 3 4 5
24. We strive to establish long-term relationships with suppliers. 1 2 3 4 5
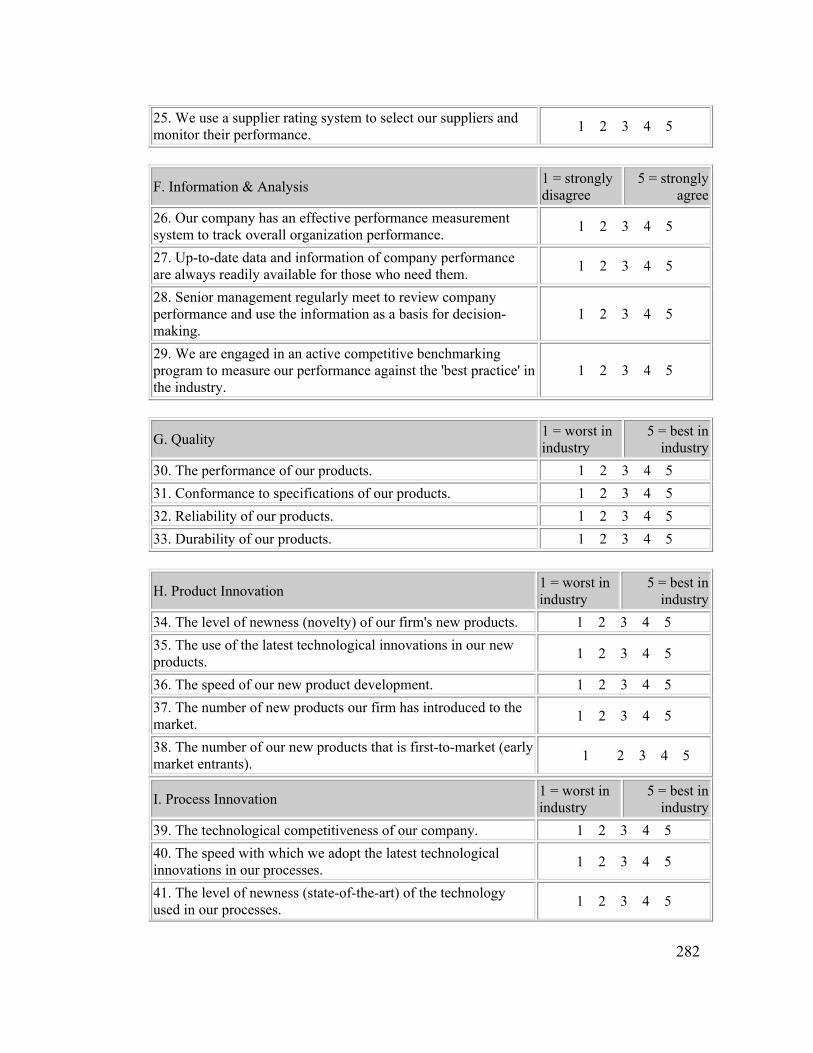
282
25. We use a supplier rating system to select our suppliers and monitor their performance. 1 2 3 4 5
F. Information & Analysis 1 = strongly disagree
5 = strongly agree
26. Our company has an effective performance measurement system to track overall organization performance. 1 2 3 4 5
27. Up-to-date data and information of company performance are always readily available for those who need them. 1 2 3 4 5
28. Senior management regularly meet to review company performance and use the information as a basis for decision-making.
1 2 3 4 5
29. We are engaged in an active competitive benchmarking program to measure our performance against the 'best practice' in the industry.
1 2 3 4 5
G. Quality 1 = worst in industry
5 = best in industry
30. The performance of our products. 1 2 3 4 5 31. Conformance to specifications of our products. 1 2 3 4 5 32. Reliability of our products. 1 2 3 4 5 33. Durability of our products. 1 2 3 4 5
H. Product Innovation 1 = worst in industry
5 = best in industry
34. The level of newness (novelty) of our firm's new products. 1 2 3 4 5 35. The use of the latest technological innovations in our new products. 1 2 3 4 5
36. The speed of our new product development. 1 2 3 4 5 37. The number of new products our firm has introduced to the market. 1 2 3 4 5
38. The number of our new products that is first-to-market (early market entrants). 1 2 3 4 5
I. Process Innovation 1 = worst in industry
5 = best in industry
39. The technological competitiveness of our company. 1 2 3 4 5 40. The speed with which we adopt the latest technological innovations in our processes. 1 2 3 4 5
41. The level of newness (state-of-the-art) of the technology used in our processes. 1 2 3 4 5

283
42. The rate of change in our processes, techniques and technology. 1 2 3 4 5
J. Business Systems Innovation 1 = worst in industry
5 = best in industry
43. Our ability to penetrate new markets. 1 2 3 4 5 44. Our ability to obtain new sources of supply. 1 2 3 4 5 45. Our success in seeking new ways of organizing our business. 1 2 3 4 5 Thank you for your time!
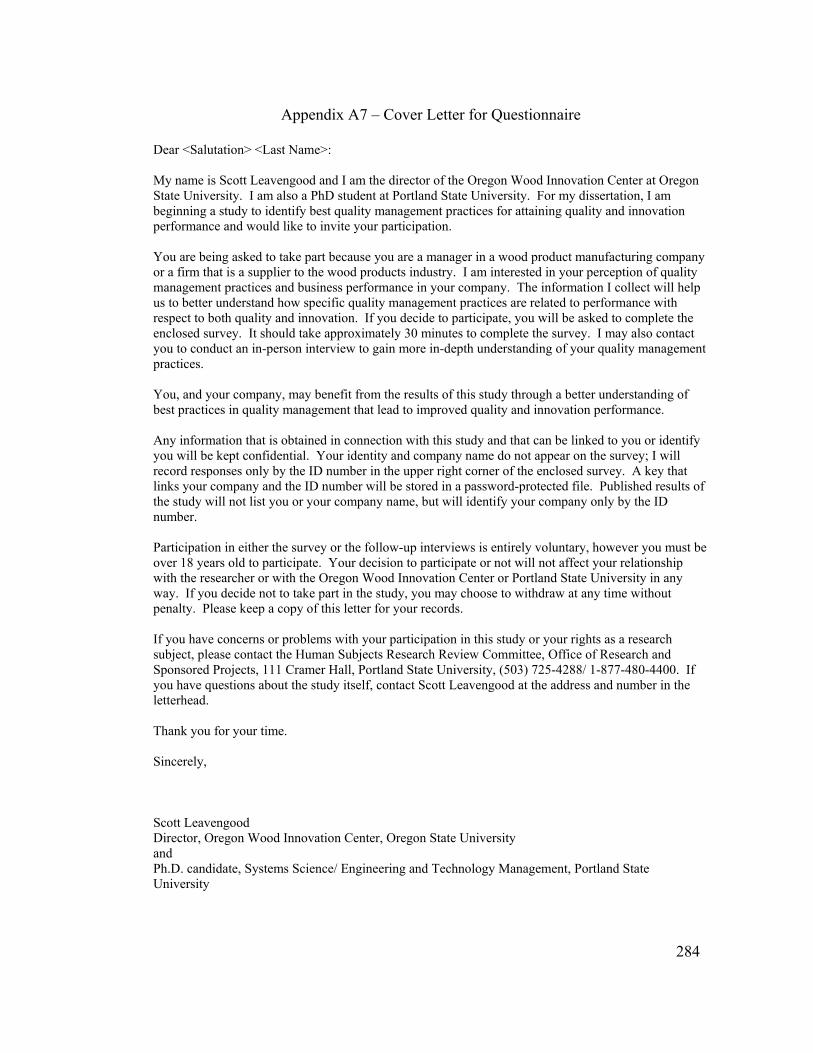
284
Appendix A7 – Cover Letter for Questionnaire Dear <Salutation> <Last Name>: My name is Scott Leavengood and I am the director of the Oregon Wood Innovation Center at Oregon State University. I am also a PhD student at Portland State University. For my dissertation, I am beginning a study to identify best quality management practices for attaining quality and innovation performance and would like to invite your participation. You are being asked to take part because you are a manager in a wood product manufacturing company or a firm that is a supplier to the wood products industry. I am interested in your perception of quality management practices and business performance in your company. The information I collect will help us to better understand how specific quality management practices are related to performance with respect to both quality and innovation. If you decide to participate, you will be asked to complete the enclosed survey. It should take approximately 30 minutes to complete the survey. I may also contact you to conduct an in-person interview to gain more in-depth understanding of your quality management practices. You, and your company, may benefit from the results of this study through a better understanding of best practices in quality management that lead to improved quality and innovation performance. Any information that is obtained in connection with this study and that can be linked to you or identify you will be kept confidential. Your identity and company name do not appear on the survey; I will record responses only by the ID number in the upper right corner of the enclosed survey. A key that links your company and the ID number will be stored in a password-protected file. Published results of the study will not list you or your company name, but will identify your company only by the ID number. Participation in either the survey or the follow-up interviews is entirely voluntary, however you must be over 18 years old to participate. Your decision to participate or not will not affect your relationship with the researcher or with the Oregon Wood Innovation Center or Portland State University in any way. If you decide not to take part in the study, you may choose to withdraw at any time without penalty. Please keep a copy of this letter for your records. If you have concerns or problems with your participation in this study or your rights as a research subject, please contact the Human Subjects Research Review Committee, Office of Research and Sponsored Projects, 111 Cramer Hall, Portland State University, (503) 725-4288/ 1-877-480-4400. If you have questions about the study itself, contact Scott Leavengood at the address and number in the letterhead. Thank you for your time. Sincerely, Scott Leavengood Director, Oregon Wood Innovation Center, Oregon State University and Ph.D. candidate, Systems Science/ Engineering and Technology Management, Portland State University

285
Appendix A8 – Case Study Interview Questions Leadership 1. Describe a significant change your company has recently experienced - for example, a shift to serve a new market, use of e-commerce, launch of a new product line, implementation of lean manufacturing, etc.
a. What was the role of senior managers in the change process? b. What was the role of employees?
2. In what way do senior managers work to create a culture conducive to innovation? People Management 3. How do you assess employee satisfaction?
a. Describe the process (e.g., questionnaires, focus groups, interviews, etc.) b. How often do you assess it? c. How do you use the information obtained?
4. Regarding employee training & development: a. How are new employees trained? b. How do you identify training needs? c. How do you organize/offer training courses? d. Do you practice cross-training (multi-skilling)? If yes, how is this done?
5. Describe the modes of communication in your company - How do managers communicate to employees and vice-versa? Customer Focus 6. How do you obtain input/feedback from customers?
a. How is the input communicated within the company? 7. How do you involve customers in the design process? 8. How do you measure customer satisfaction?
a. Describe the process – who is responsible for collecting the information? How is it done - questionnaires, interviews, etc? b. How often is it measured? c. How do you use the information?
Strategic Planning 9. Do you have mission and vision statements? If so, how are these communicated and to whom? 10. What sort of high-level planning do you do?
a. Who is involved? b. How often is it done? c. Do you compare results to plan?
Process Management 11. Is the concept of the ‘internal customer’ (next process down the line) something you emphasize?
a. If so, how?
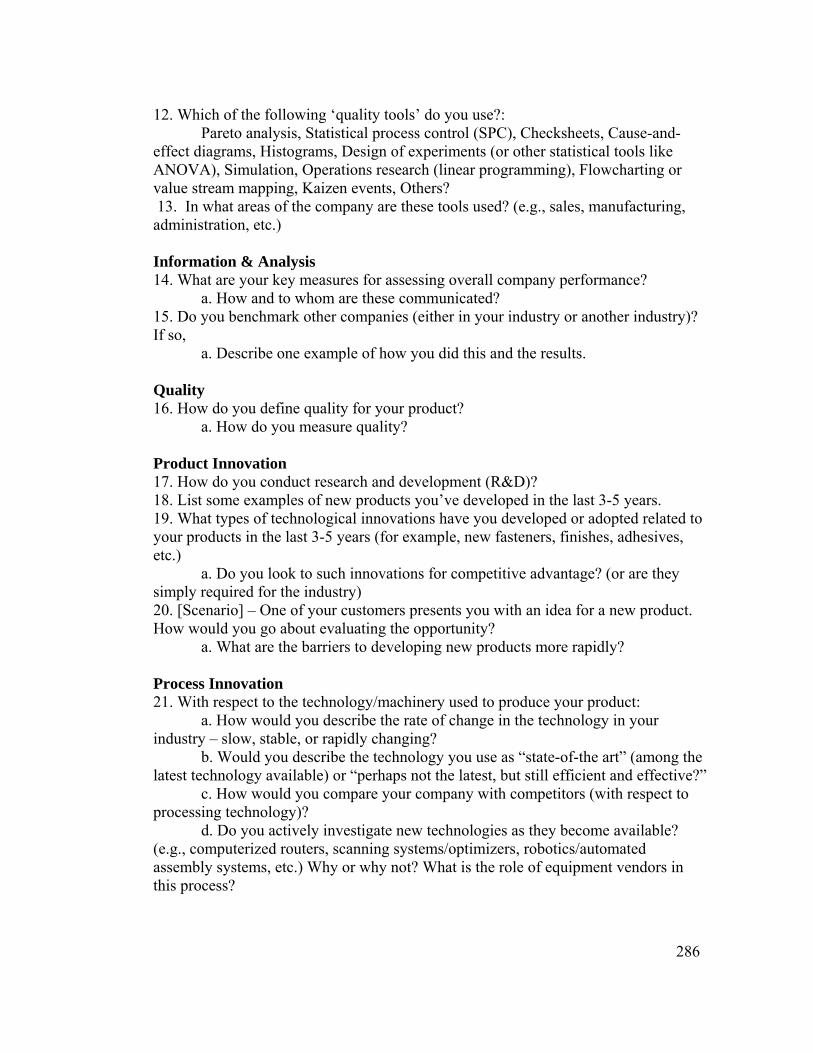
286
12. Which of the following ‘quality tools’ do you use?: Pareto analysis, Statistical process control (SPC), Checksheets, Cause-and-effect diagrams, Histograms, Design of experiments (or other statistical tools like ANOVA), Simulation, Operations research (linear programming), Flowcharting or value stream mapping, Kaizen events, Others? 13. In what areas of the company are these tools used? (e.g., sales, manufacturing, administration, etc.) Information & Analysis 14. What are your key measures for assessing overall company performance?
a. How and to whom are these communicated? 15. Do you benchmark other companies (either in your industry or another industry)? If so,
a. Describe one example of how you did this and the results. Quality 16. How do you define quality for your product?
a. How do you measure quality? Product Innovation 17. How do you conduct research and development (R&D)? 18. List some examples of new products you’ve developed in the last 3-5 years. 19. What types of technological innovations have you developed or adopted related to your products in the last 3-5 years (for example, new fasteners, finishes, adhesives, etc.)
a. Do you look to such innovations for competitive advantage? (or are they simply required for the industry) 20. [Scenario] – One of your customers presents you with an idea for a new product. How would you go about evaluating the opportunity?
a. What are the barriers to developing new products more rapidly? Process Innovation 21. With respect to the technology/machinery used to produce your product:
a. How would you describe the rate of change in the technology in your industry – slow, stable, or rapidly changing?
b. Would you describe the technology you use as “state-of-the art” (among the latest technology available) or “perhaps not the latest, but still efficient and effective?”
c. How would you compare your company with competitors (with respect to processing technology)?
d. Do you actively investigate new technologies as they become available? (e.g., computerized routers, scanning systems/optimizers, robotics/automated assembly systems, etc.) Why or why not? What is the role of equipment vendors in this process?
287
Business Systems Innovation 22. What about new or innovative ways for managing your business:
a. Do you have any examples of new ways you have developed or adopted to manage your business?
b. Has the way you market your products changed in a significant way in the past 3-5 years? How about the way you distribute/deliver products?
c. Do you have a company website? If so, do you use it to sell products (e-commerce)? Do you use it as a way to obtain input from customers & suppliers?
d. Have you sought new sources of supply recently? If so, what prompted you to do so? How did you find the new supplier?

288
Appendix B – Innovation Constructs and Measurement Instruments

289
Appendix B1– Johannessen et al. Questions used for measurement of innovation [76]
Has your company made changes during the last three years that were perceived to be new for
the company, within the following areas? (Please circle one number in each row)
To no extent To a little extent
To some extent
To a great extent
To a very great extent
New products 1 2 3 4 5 New services 1 2 3 4 5 New methods of production 1 2 3 4 5
Opening new markets 1 2 3 4 5
New sources of supply 1 2 3 4 5
New ways of organizing 1 2 3 4 5
Note: The instrument could be repeated with ‘new to the industry’ (vs. company) to address
the issue of radical vs. incremental forms of innovation.
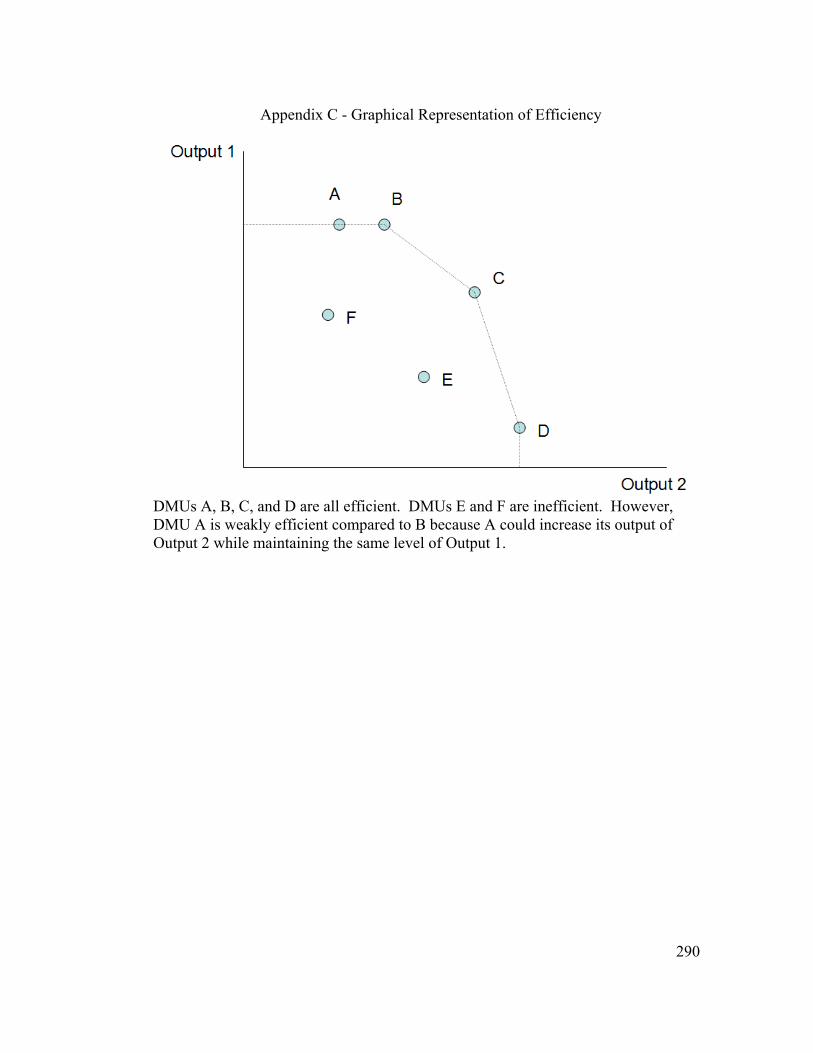
290
Appendix C - Graphical Representation of Efficiency
DMUs A, B, C, and D are all efficient. DMUs E and F are inefficient. However, DMU A is weakly efficient compared to B because A could increase its output of Output 2 while maintaining the same level of Output 1.

291
Appendix D – Results of Test for Non-response Bias
Tested first 30 responses vs. last 30 responses for all questions in each category
Leadership Question Mean (sd) Std. Error mean Sig. (2-tailed) A1 - first 30 A1 - last 30
4.03 (1.129) 4.13 (0.937)
0.206 0.171
0.710
A2 - first 30 A2 – last 30
4.07 (0.868) 4.00 (1.203)
0.159 0.220
0.807
A3 - first 30 A3 – last 30
3.83 (1.117) 3.87 (0.900)
0.204 0.164
0.899
A4- first 30 A4 - last 30
3.67 (0.884) 3.67 (1.093)
0.161 0.200
1.00
People Management Question Mean (sd) Std. Error mean Sig. (2-tailed) B5 - first 30 B5 – last 30
2.66 (0.974) 2.50 (1.253)
0.181 0.229
0.598
B6 - first 30 B6 – last 30
3.83 (1.020) 3.41 (1.053)
0.186 0.195
0.126
B7 - first 30 B7 - last 30
2.77 (1.305) 2.90 (1.348)
0.238 0.246
0.698
B8 - first 30 B8 – last 30
3.47 (1.137) 3.70 (0.952)
0.208 0.174
0.392
B9 - first 30 B9 - last 30
4.13 (1.106) 4.23 (1.104)
0.202 0.202
0.727
Customer Focus Question Mean (sd) Std. Error mean Sig. (2-tailed) C10 - first 30 C10 – last 30
3.83 (0.950) 3.87 (0.900)
0.173 0.164
0.889
C11 - first 30 C11 - last 30
3.70 (0.837) 3.63 (0.850)
0.153 0.155
0.761
C12 - first 30 C12 – last 30
3.55 (1.183) 3.63 (1.033)
0.220 0.189
0.779
C13 - first 30 C13 – last 30
4.27 (0.785) 3.97 (0.890)
0.143 0.162
0.171
C14 - first 30 C14 – last 30
4.00 (1.050) 3.97 (0.850)
0.192 0.155
0.893
C15 – first 30 C15 – last 30
2.90 (1.242) 3.10 (1.205)
0.227 0.224
0.526
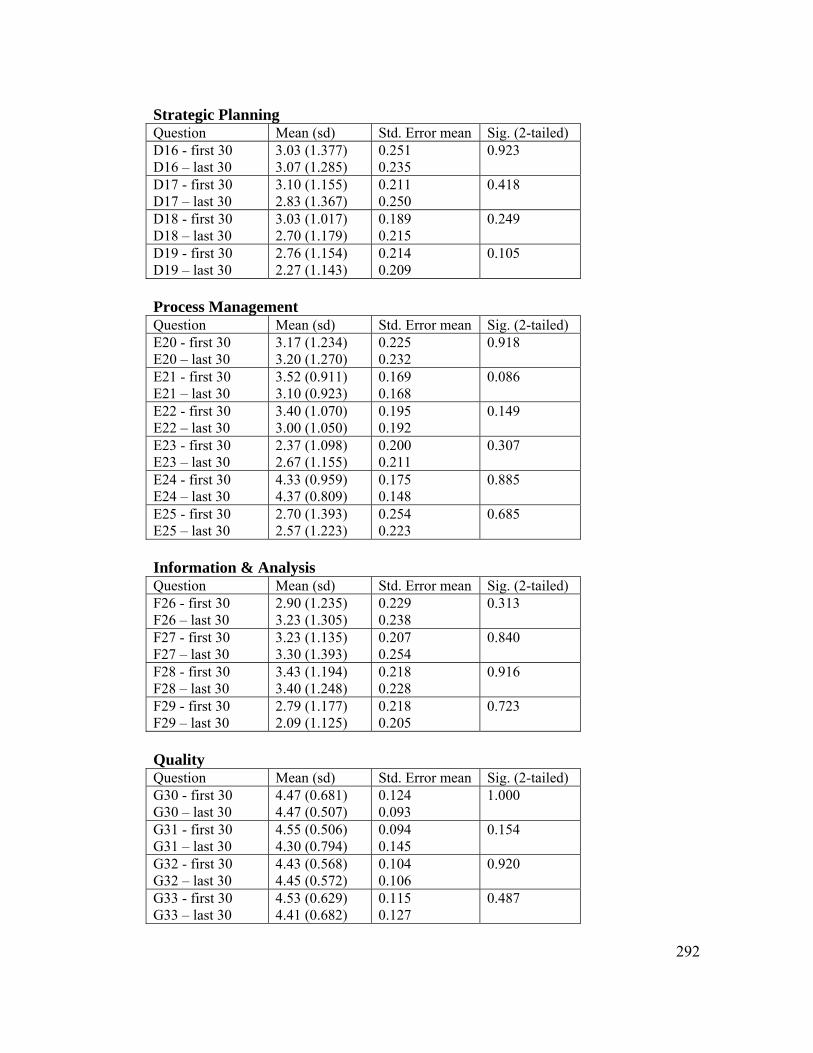
292
Strategic Planning Question Mean (sd) Std. Error mean Sig. (2-tailed) D16 - first 30 D16 – last 30
3.03 (1.377) 3.07 (1.285)
0.251 0.235
0.923
D17 - first 30 D17 – last 30
3.10 (1.155) 2.83 (1.367)
0.211 0.250
0.418
D18 - first 30 D18 – last 30
3.03 (1.017) 2.70 (1.179)
0.189 0.215
0.249
D19 - first 30 D19 – last 30
2.76 (1.154) 2.27 (1.143)
0.214 0.209
0.105
Process Management Question Mean (sd) Std. Error mean Sig. (2-tailed) E20 - first 30 E20 – last 30
3.17 (1.234) 3.20 (1.270)
0.225 0.232
0.918
E21 - first 30 E21 – last 30
3.52 (0.911) 3.10 (0.923)
0.169 0.168
0.086
E22 - first 30 E22 – last 30
3.40 (1.070) 3.00 (1.050)
0.195 0.192
0.149
E23 - first 30 E23 – last 30
2.37 (1.098) 2.67 (1.155)
0.200 0.211
0.307
E24 - first 30 E24 – last 30
4.33 (0.959) 4.37 (0.809)
0.175 0.148
0.885
E25 - first 30 E25 – last 30
2.70 (1.393) 2.57 (1.223)
0.254 0.223
0.685
Information & Analysis Question Mean (sd) Std. Error mean Sig. (2-tailed) F26 - first 30 F26 – last 30
2.90 (1.235) 3.23 (1.305)
0.229 0.238
0.313
F27 - first 30 F27 – last 30
3.23 (1.135) 3.30 (1.393)
0.207 0.254
0.840
F28 - first 30 F28 – last 30
3.43 (1.194) 3.40 (1.248)
0.218 0.228
0.916
F29 - first 30 F29 – last 30
2.79 (1.177) 2.09 (1.125)
0.218 0.205
0.723
Quality Question Mean (sd) Std. Error mean Sig. (2-tailed) G30 - first 30 G30 – last 30
4.47 (0.681) 4.47 (0.507)
0.124 0.093
1.000
G31 - first 30 G31 – last 30
4.55 (0.506) 4.30 (0.794)
0.094 0.145
0.154
G32 - first 30 G32 – last 30
4.43 (0.568) 4.45 (0.572)
0.104 0.106
0.920
G33 - first 30 G33 – last 30
4.53 (0.629) 4.41 (0.682)
0.115 0.127
0.487
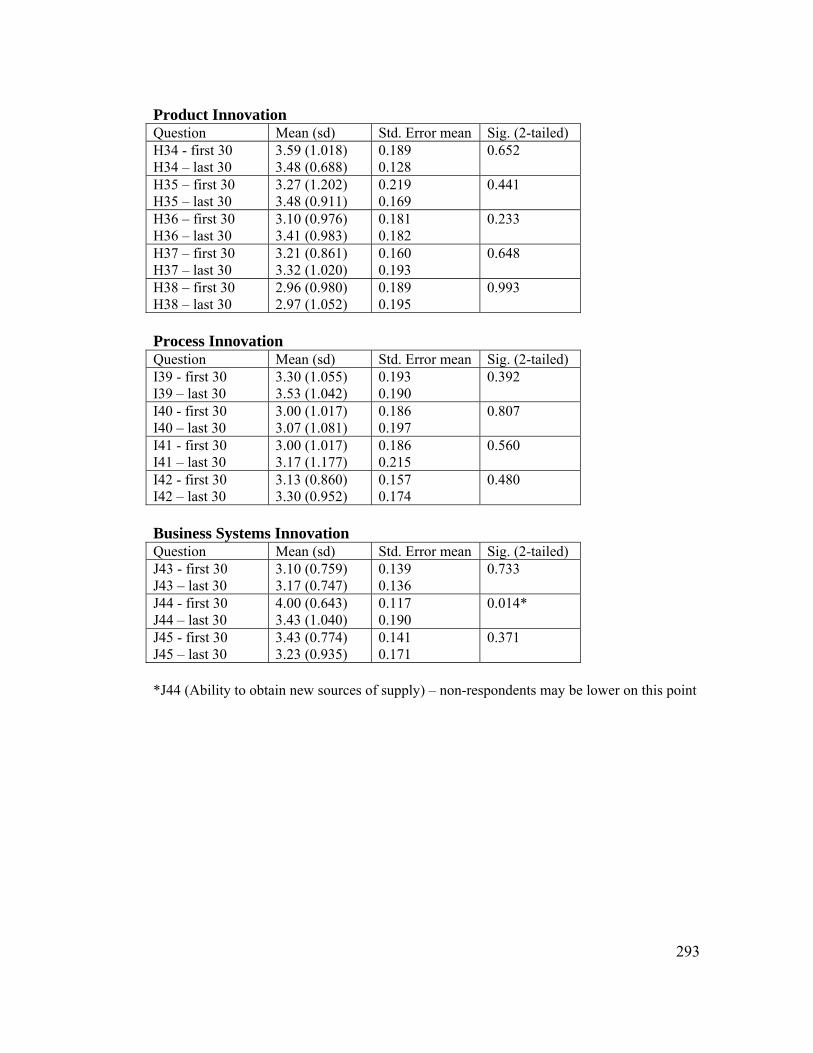
293
Product Innovation Question Mean (sd) Std. Error mean Sig. (2-tailed) H34 - first 30 H34 – last 30
3.59 (1.018) 3.48 (0.688)
0.189 0.128
0.652
H35 – first 30 H35 – last 30
3.27 (1.202) 3.48 (0.911)
0.219 0.169
0.441
H36 – first 30 H36 – last 30
3.10 (0.976) 3.41 (0.983)
0.181 0.182
0.233
H37 – first 30 H37 – last 30
3.21 (0.861) 3.32 (1.020)
0.160 0.193
0.648
H38 – first 30 H38 – last 30
2.96 (0.980) 2.97 (1.052)
0.189 0.195
0.993
Process Innovation Question Mean (sd) Std. Error mean Sig. (2-tailed) I39 - first 30 I39 – last 30
3.30 (1.055) 3.53 (1.042)
0.193 0.190
0.392
I40 - first 30 I40 – last 30
3.00 (1.017) 3.07 (1.081)
0.186 0.197
0.807
I41 - first 30 I41 – last 30
3.00 (1.017) 3.17 (1.177)
0.186 0.215
0.560
I42 - first 30 I42 – last 30
3.13 (0.860) 3.30 (0.952)
0.157 0.174
0.480
Business Systems Innovation Question Mean (sd) Std. Error mean Sig. (2-tailed) J43 - first 30 J43 – last 30
3.10 (0.759) 3.17 (0.747)
0.139 0.136
0.733
J44 - first 30 J44 – last 30
4.00 (0.643) 3.43 (1.040)
0.117 0.190
0.014*
J45 - first 30 J45 – last 30
3.43 (0.774) 3.23 (0.935)
0.141 0.171
0.371
*J44 (Ability to obtain new sources of supply) – non-respondents may be lower on this point

294
Appendix E – DEA Results
DMU Sc
ore
Lead
ersh
ip
{I}{
W}
Peop
le M
gmt
{I}{
W}
Cus
tom
er F
ocus
{I
}{W
}
Stra
t. Pl
anni
ng
{I}{
W}
Proc
ess M
gmt
{I}{
W}
Info
. & A
naly
sis
{I}{
W}
Qua
lity
{O}{
W}
Prod
uct I
nn.
{O}{
W}
Proc
ess
Inn.
{O
}{W
}
Bus
. Sys
. Inn
{O
}{W
}
Ben
chm
arks
D2740 46.05% 0.46 0 0 0 0 0 0 0.07 0.14 0 151 D712 63.49% 0 0.63 0 0 0 0 0.16 0 0 0.1 30 D526 65.60% 0.16 0 0 0.38 0 0 0 0.15 0.04 0.1 67
D1485 66.40% 0 0 0 0 0.66 0 0.21 0 0.06 0 22 D143 69.89% 0.08 0 0 0 0.32 0.1 0 0 0 0.3 98
D1508 75.49% 0 0 0.37 0.39 0 0 0 0.38 0 0 8 D947 75.88% 0 0 0 0.18 0.38 0 0.09 0.2 0 0 90 D519 77.25% 0 0 0 0.16 0 0.57 0 0.13 0.02 0.18 3
D1467 79.70% 0 0 0 0.12 0.22 0.19 0.2 0 0.03 0 47 D305 82.95% 0 0 0.08 0.18 0.15 0 0 0 0.2 0 58
D1006 83.36% 0 0 0 0.26 0 0.29 0 0 0.16 0.04 4 D1833 84.64% 0 0 0 0.21 0.12 0.09 0 0.13 0.07 0 17 D1261 85.80% 0 0.31 0.17 0.15 0 0 0 0 0 0.33 20 D1235 86.44% 0 0 0 0.05 0.24 0.11 0 0.06 0.07 0.1 62 D1343 87.72% 0 0 0 0.88 0 0 0.14 0.09 0 0 1 D385 88.04% 0 0 0.01 0.53 0.01 0.17 0.17 0 0 0.04 16
D2113 90.97% 0 0.13 0 0.12 0.25 0 0.05 0.05 0.05 0.14 84 D243 91.56% 0 0 0 0 0.39 0.11 0.12 0.08 0.02 0.02 1
D1543 92.42% 0.17 0 0 0.22 0.34 0 0.31 0.03 0 0 10 D1431 92.71% 0 0.08 0 0 0.35 0 0 0.11 0 0.15 46 D471 93.10% 0 0.27 0 0.17 0 0.02 0 0 0 0.21 2 D958 93.61% 0 0.15 0 0 0 0.44 0.16 0.05 0 0 1 D54 96.32% 0 0 0.04 0.05 0.31 0.04 0.12 0.04 0.07 0 8 D940 98.00% 0 0 0 0.25 0.31 0 0.01 0.07 0 0.22 0
D2967 98.29% 0 0 0 0.54 0.18 0 0.18 0.02 0.03 0 2 D758 98.43% 0 0 0 0.98 0 0 0 0.05 0.22 0 0
Note: DMU: “Decision making unit”, i.e., individual companies Score: Output-oriented super-efficiency score; values of 100% or less are considered efficient. (I)(W): optimal weighted inputs (vx) from Equations 1 and 2. (O)(W): optimal weighted outputs (μy) from Equations 1 and 2. Benchmarks: number of times this company was used in setting performance targets for the other firms in the DEA set.