Embed Size (px)
Citation preview

Identifying and reaching Japanese tourists coming to
Finland.
Case: Forenom Oy
Tomoka Watanabe
Bachelor’s Thesis
Degree Programme in
International Business
2017

Abstract
Date 1.5.2017
Author(s) Tomoka Watanabe
Degree programme International business
Report/thesis title Identifying and reaching Japanese tourists coming to Finland.
Number of pages and appendix pages 51+5
Finland is booming in Asia. In 2015, the number of nights spent by Asian visitors in almost exceeded the number of nights spent by Russian tourists, who have been the biggest cus-tomer group for companies in tourism industry in Finland. Therefore, marketing to Asian tour-ists is becoming more and more important. This thesis will focus on Japanese tourists, who are the seventh biggest target group for Finland in terms of the number of nights spent. The main objectives of this study are to define the target market and find the best marketing channels to reach and attract them for the commissioning company, Forenom Oy, a leading temporary accommodation provider of the Nordics, founded in 2001 in Helsinki, Finland. The knowledge base of the thesis covers literature reviews, theories and models related to services marketing, market segmentation, market targeting and buyer personas. The knowledge was gathered from books, articles, reports and online sources. The research includes two main phases, based on primary and secondary research. A quan-titative research method was used for the primary research. The author conducted a survey among Japanese tourists in Finland for four months starting in October 2016. The secondary research sources, statistical information on tourism originating from Finland and Japan, were gathered next. By analyzing the results of primary and secondary research, the author pre-sented the key findings on Japanese tourists in Finland. As outcomes of the study, the characteristics of trips by Japanese tourists, the most typical customer type among Japanese tourists visiting Finland and the preferred marketing chan-nels for the most typical customer type were defined. The favorite seasons of Japanese tourists visiting Finland are summer and winter. The length of their trip is usually less than a week, however, a majority of them travel to multiple cities in Finland during the stay. Many Japanese tourists reserve their accommodation through travel agencies, but young generations also use online travel agencies as well. The recommendations for the commissioning company are presented at the end of this thesis based on the research analysis. Forenom Oy should start marketing to Asia as soon as pos-sible. Japanese tourists are not familiar with serviced apartments’ concept yet, however, there are many female travelers who would like to travel like a local. Therefore, Forenom Oy could have a strong position in the market because of its outstanding knowledge of consumer demand in the niche by providing serviced apartments.
Keywords Serviced marketing, market research, marketing research, buyer personas, Japanese, tour-ism.

Table of contents
1 Introduction ................................................................................................................... 1
Background ........................................................................................................... 1
Research Question ............................................................................................... 3
Demarcation ......................................................................................................... 4
International Aspect .............................................................................................. 4
Benefits ................................................................................................................. 5
Key Concepts ....................................................................................................... 5
Case Company ..................................................................................................... 6
2 Knowledge base for target marketing in service industry ............................................... 9
Services marketing ............................................................................................... 9
2.1.1 Destination marketing .............................................................................. 10
2.1.2 Three types of Service Marketing ............................................................. 10
2.1.3 Service marketing mix .............................................................................. 11
Market segmentation and market targeting ......................................................... 13
2.2.1 Market segmentation ................................................................................ 13
2.2.2 International markets ................................................................................ 16
2.2.3 Market targeting ....................................................................................... 17
Buyer personas ................................................................................................... 19
2.3.1 Why buyer personas are important .......................................................... 20
2.3.2 How to create buyer personas.................................................................. 20
3 Research Methods ...................................................................................................... 23
Marketing research ............................................................................................. 24
3.1.1 The function of marketing research .......................................................... 24
3.1.2 Elements of marketing research ............................................................... 25
3.1.3 The marketing research process .............................................................. 25
3.1.4 Qualitative and Quantitative market research ........................................... 26
3.1.5 International marketing research .............................................................. 27
Questionnaire design .......................................................................................... 28
Data collection analysis ....................................................................................... 29
3.3.1 Primary data ............................................................................................. 29
3.3.2 Secondary data ........................................................................................ 31
4 Results and key findings ............................................................................................. 32
Japanese travelers and Finnish market ............................................................... 32
Discovery from the survey ................................................................................... 37
5 Conclusions ................................................................................................................ 44
Answers to the investigative questions ................................................................ 44
5.1.1 What are the characteristics of the travel of Japanese tourists? ............... 44

5.1.2 What is the most typical customer type visiting Finland? .......................... 44
5.1.3 What are the preferred marketing channels of the target customers?....... 45
Recommendation ................................................................................................ 46
5.2.1 Start promotions to Asia now ................................................................... 46
5.2.2 Cooperate with organizations ................................................................... 47
5.2.3 Marketing in Japanese ............................................................................. 47
Evaluation and my learnings through this project ................................................ 48
References ...................................................................................................................... 49
Appendices ...................................................................................................................... 52
Appendix 1. Nights spent by country of residence 2009-2015 (Visit Finland 2016) ...... 52
Appendix 2. Nights spent by non-residents and annual change (%) in all
establishments in 2016 (Statistics Finland 2017) ......................................................... 53
Appendix 3. The survey questionnaire (translated into English) .................................. 54
1
1 Introduction
For companies in tourism industry in Finland, marketing to Japanese tourists is becoming
more and more important. This chapter will provide the readers with basic information on
the thesis: background information and the need for the study, several key concepts relat-
ed to the research questions, and brief introduction to the case company, Forenom Oy,
what the case company and their stakeholders will benefit from this thesis study, and risks
in the research.
Background
Finland has been more and more popular among Japanese tourists in the past decade. In
2015, a total of 108,106 Japanese tourists arrived and spent 203,411 nights in Finland.
(Visit Finland Statistics Service Rudolf 2016, Visit Finland 2016a)
As stated by Good news from Finland, “Japanese tourists are particularly keen on getting
to know the capital: almost two-thirds of the overnight stays by travelers from Japan were
in Helsinki” (Good news from Finland 2017).
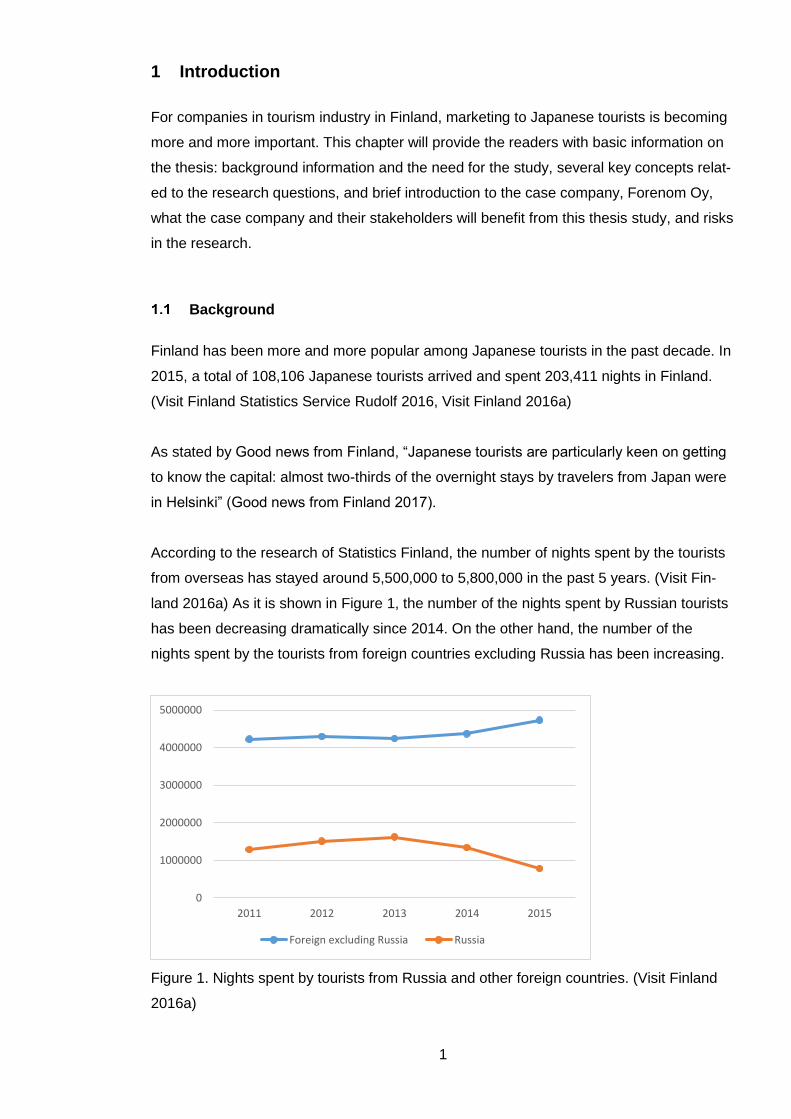
According to the research of Statistics Finland, the number of nights spent by the tourists
from overseas has stayed around 5,500,000 to 5,800,000 in the past 5 years. (Visit Fin-
land 2016a) As it is shown in Figure 1, the number of the nights spent by Russian tourists
has been decreasing dramatically since 2014. On the other hand, the number of the
nights spent by the tourists from foreign countries excluding Russia has been increasing.
Figure 1. Nights spent by tourists from Russia and other foreign countries. (Visit Finland
2016a)
0
1000000
2000000
3000000
4000000
5000000
2011 2012 2013 2014 2015
Foreign excluding Russia Russia

2
Looking into the details of the number of the nights spent by regions, as shown in Figure
2, it is revealed that the number of the nights spent by Asian tourists has grown dramati-
cally while by other regions have been decreasing. In 2015, the number of the nights
spent by Asian tourists is almost exceeding the number of nights spent by Russian tour-
ists.
In addition, in 2016, “most foreign visitors came from Germany, Sweden, the US, Russia,
the UK, Japan, and China. The number grew most among US tourists, followed by Japan,
China, Spain and Sweden” (Good news from Finland 2017)
Figure 2. The number of nights spent by region 2011-2015 (Visit Finland 2016a)
The biggest foreign customer has been Russian tourists for accommodation providers,
however, the number of the nights spent by them has decreased to half of its peak in
2015. (See the appendix 1) On the other hand, as it is mentioned in the previous para-
graph, the number of nights spent by Asian tourists is growing fast and is almost as much
as the one by Russian tourists.
In Finland, hotels usually charge the accommodation fee per room, therefore, for the
companies providing accommodation service like Forenom Oy, the number of the nights
spent is much more valuable than the number of the tourists visiting. Since Asian tourists
are taking over Russian tourists’ place, marketing to Asian tourists will be the key to
growth in the near future.
0
1,000,000
2,000,000
3,000,000
4,000,000
5,000,000
2011 2012 2013 2014 2015
Europe Asia Oceania
Africa America Russian Federation
3
The number of nights spent by Japanese tourists has grown year by year, and has stayed
stably high (See appendix 1). For Forenom Oy, it will surely be very beneficial to define
who to, how to and when to market to Japanese tourists.
This bachelor thesis is a compilation of my studies in international business. This will sup-
port my further development as a marketer in the future. To develop my competences in
market research through this thesis, I will put much effort into this final project of my busi-
ness student life.
Research Question
This thesis aims to find the most effective ways to market to Japanese tourists to attract
more of them, which will result in a big future development opportunity for Forenom Oy.
The research question can be worded as:
How can Forenom Oy market to Japanese tourists effectively?
It is divided into investigative questions (IQ) as follows:
IQ 1. What are the characteristics of the travel of Japanese tourists?
IQ 2. What is the most typical customer type visiting Finland?
IQ 3. What are the preferred marketing channels of the target customers?
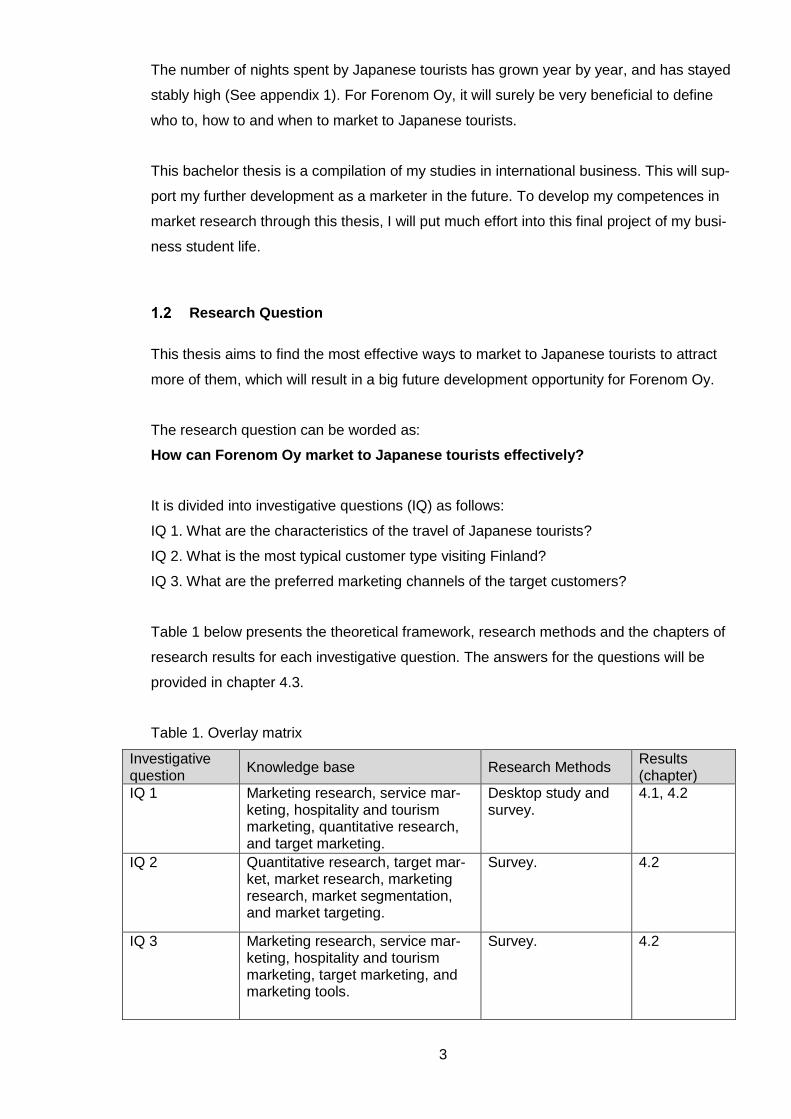
Table 1 below presents the theoretical framework, research methods and the chapters of
research results for each investigative question. The answers for the questions will be
provided in chapter 4.3.
Table 1. Overlay matrix
Investigative question
Knowledge base Research Methods Results (chapter)
IQ 1 Marketing research, service mar-keting, hospitality and tourism marketing, quantitative research, and target marketing.
Desktop study and survey.
4.1, 4.2
IQ 2 Quantitative research, target mar-ket, market research, marketing research, market segmentation, and market targeting.
Survey. 4.2
IQ 3 Marketing research, service mar-keting, hospitality and tourism marketing, target marketing, and marketing tools.
Survey. 4.2

4
Demarcation
This thesis will focus on market research of Japanese tourists and define:
Target market
Customer profile
Their needs for accommodation
Their traveling habits o Purpose of the trip o Length of the trip o Timing of the trip o Budget for accommodation
Marketing channels used by them when finding accommodation
Based on the defined target market and most used marketing channels, I will give Fore-
nom Oy a recommendation how to, who to, when to, what to market to them.
Figure 3 below shows the demarcation of the market and marketing study covered in this
study. Both of them will be briefly explained in the key concepts, section 1.6.
Figure 3. Demarcated elements of the market and marketing study.
International Aspect
Forenom Oy operates not only in Finland, but also in other Nordic countries. This thesis
will be done for a company which already has internationalized, and furthermore, the re-
search will be used to market to Japanese tourists, to expand their customer base to Asia.
With this topic, it will perfectly fulfill the international aspect.
Market research
• Market trend
• Market size
• Market tradition
• Market competition
Marketing research
• Marketing trend
• Marketing tools
• Marketing channels

5
Benefits
Forenom Oy will be provided with a recommendation with detailed potential customer pro-
file, target group, their needs and habits, and which marketing channels should be used.
Based on the research result, Forenom Oy will be able to start creating a marketing plan
to attract more Japanese and Asian customers who will lead Forenom to construct a
strong, new customer base and to grow their sales which will benefit also their stakehold-
ers.
The result of the survey also might reveal new potential partners of Forenom Oy in Japan,
such as travel agencies and corporate customers having offices in Finland.
Also, for myself, this thesis is a great opportunity to demonstrate and develop my compe-
tencies in market research. By a successful completion of the thesis, this project may re-
sult in a creation of marketing plan and put the plan into practice, which could be my task
in the future in Forenom Oy.
Key Concepts
”Marketing research is the process of designing, gathering, analyzing, and reporting
information that may be used to solve a marketing problem such as pricing or identifying
the most efficient marketing media and tools” (Burns, Veeck & Bush 2017, 37).
Market research is “a process used to define the size, location, and/or makeup of the
market for a product or service” (Burns & al. 2017, 37).
Quantitative market research is a research method which is conducted to a large num-
ber of answerers with a set of structured questions with response options planned in ad-
vance (Burns & al. 2017, 143).
Services marketing is a kind of marketing style used for service products, which is
intangible, inseparable, variable and perishable (Kotler & Armstrong 2012, 260-270).
Market segmentation is to divide a market into smaller segments by its needs, character-
istics, or behavior that might require different marketing strategies or mixes (Kotler & Arm-
strong 2012, 214).
6
Market targeting is “the process of evaluating each market segment’s attractiveness and
selecting one or more segments to enter” (Kotler & Armstrong 2012, 214).
“Buyer personas are research-based archetypal (modeled) representations of who buy-
ers are, what they are trying to accomplish, what goals drive their behavior, how they
think, how they buy, and why they make buying decisions” (Tony Zambito 2013).
Case Company
Forenom Oy is a small and medium-sized enterprise which specializes in temporary ac-
commodation solutions and relocation services mainly for corporate customers, however,
the number of private customers has been growing very fast in the past years. (Forenom
2016c)
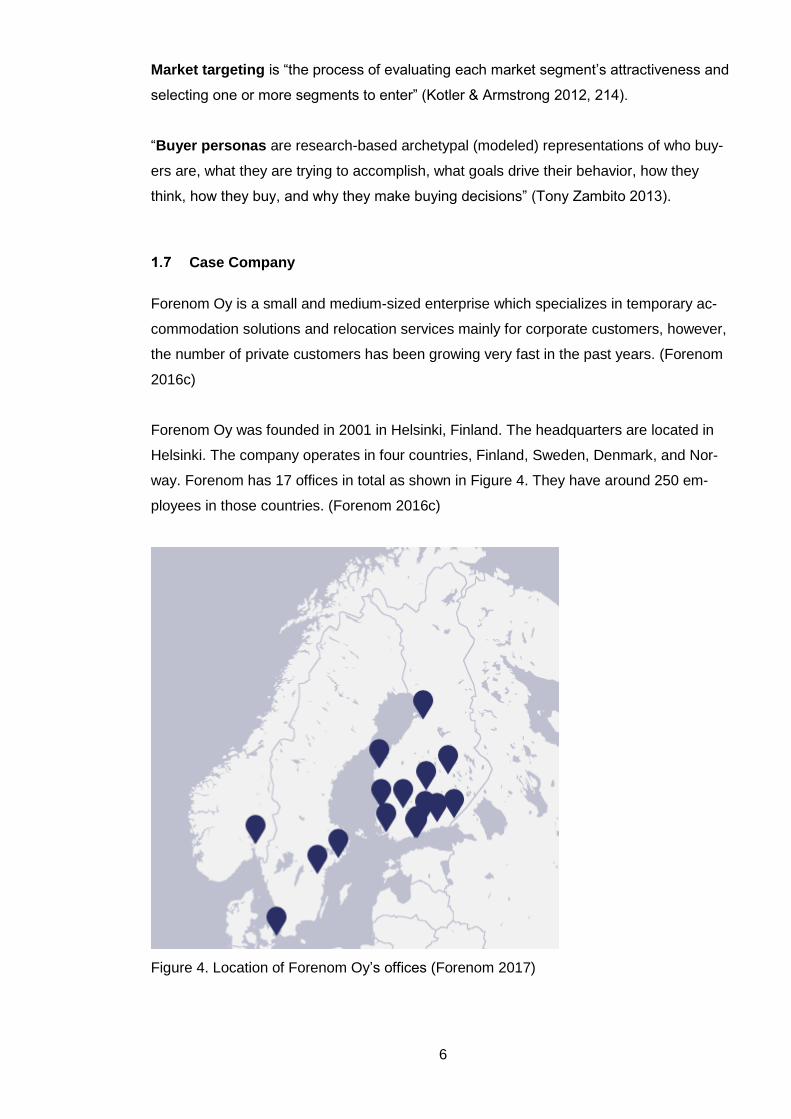
Forenom Oy was founded in 2001 in Helsinki, Finland. The headquarters are located in
Helsinki. The company operates in four countries, Finland, Sweden, Denmark, and Nor-
way. Forenom has 17 offices in total as shown in Figure 4. They have around 250 em-
ployees in those countries. (Forenom 2016c)
Figure 4. Location of Forenom Oy’s offices (Forenom 2017)
7
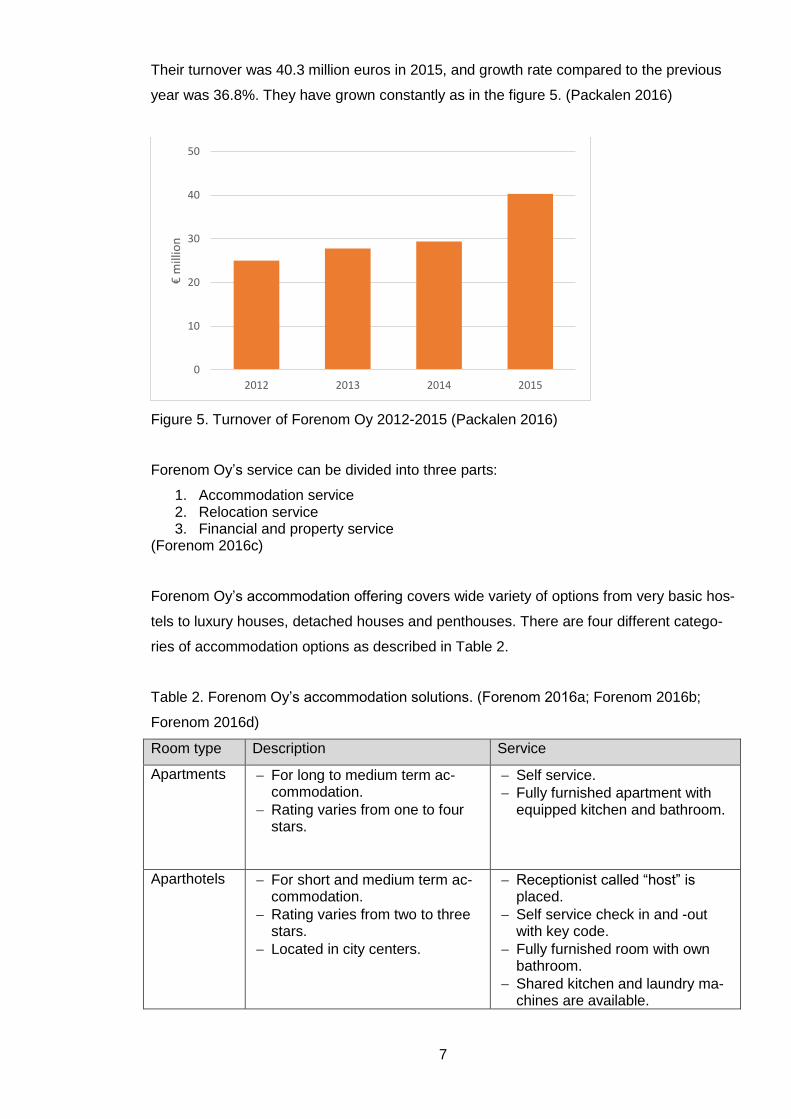
Their turnover was 40.3 million euros in 2015, and growth rate compared to the previous
year was 36.8%. They have grown constantly as in the figure 5. (Packalen 2016)
Figure 5. Turnover of Forenom Oy 2012-2015 (Packalen 2016)
Forenom Oy’s service can be divided into three parts:
1. Accommodation service 2. Relocation service 3. Financial and property service
(Forenom 2016c)
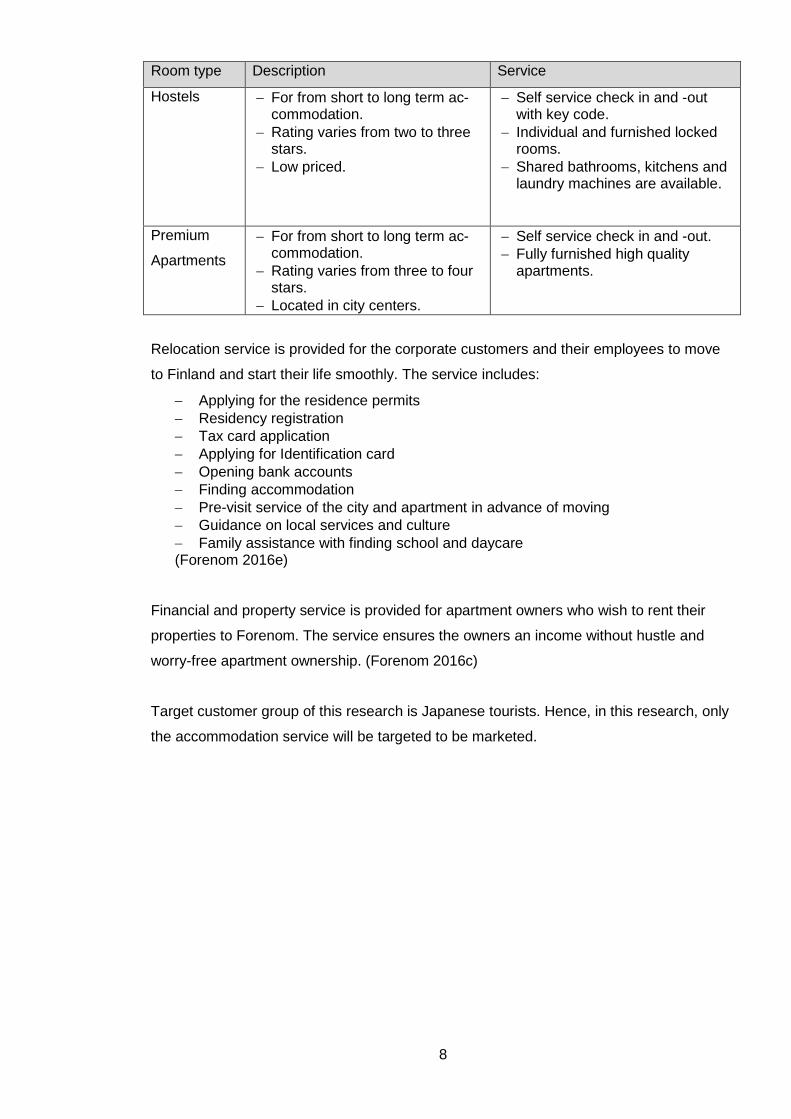
Forenom Oy’s accommodation offering covers wide variety of options from very basic hos-
tels to luxury houses, detached houses and penthouses. There are four different catego-
ries of accommodation options as described in Table 2.
Table 2. Forenom Oy’s accommodation solutions. (Forenom 2016a; Forenom 2016b;
Forenom 2016d)
Room type Description Service
Apartments For long to medium term ac-commodation.
Rating varies from one to four stars.
Self service.
Fully furnished apartment with equipped kitchen and bathroom.
Aparthotels For short and medium term ac-commodation.
Rating varies from two to three stars.
Located in city centers.
Receptionist called “host” is placed.
Self service check in and -out with key code.
Fully furnished room with own bathroom.
Shared kitchen and laundry ma-chines are available.
0
10
20
30
40
50
2012 2013 2014 2015
€ m
illio
n
8
Room type Description Service
Hostels For from short to long term ac-commodation.
Rating varies from two to three stars.
Low priced.
Self service check in and -out with key code.
Individual and furnished locked rooms.
Shared bathrooms, kitchens and laundry machines are available.
Premium
Apartments
For from short to long term ac-commodation.
Rating varies from three to four stars.
Located in city centers.
Self service check in and -out.
Fully furnished high quality apartments.
Relocation service is provided for the corporate customers and their employees to move
to Finland and start their life smoothly. The service includes:
Applying for the residence permits
Residency registration
Tax card application
Applying for Identification card
Opening bank accounts
Finding accommodation
Pre-visit service of the city and apartment in advance of moving
Guidance on local services and culture
Family assistance with finding school and daycare (Forenom 2016e)
Financial and property service is provided for apartment owners who wish to rent their
properties to Forenom. The service ensures the owners an income without hustle and
worry-free apartment ownership. (Forenom 2016c)
Target customer group of this research is Japanese tourists. Hence, in this research, only
the accommodation service will be targeted to be marketed.

9
2 Knowledge base for target marketing in service industry
This chapter will introduce the knowledge base and concepts applied to carry out the mar-
ket research on Japanese tourist for Forenom Oy.
Services marketing
Services marketing requires a different perspective from product marketing, as what ser-
vice providers delivering are something that is intangible, inseparable, variable and per-
ishable. Therefore, they might face special difficulty in marketing without it.
When a company designs a marketing plan, these four special service characteristics in
figure 6 must be taken into consideration (Kotler & Armstrong 2012, 261.)
Figure 6. Four service characteristics (Kotler & Armstrong 2012, 261)
Services intangibility means that services cannot be visible, tasted, felt, heard, or
smelled before they are purchased (Kotler & Armstrong 2012, 262.) For example, you
cannot taste the food before actually visiting the restaurant and ordering it.
As stated by Kotler and Armstrong (2012, 161), Service insurability denotes “services
are produced and consumed at the same time and cannot be separated from their provid-
ers”. For instance, when a customer goes to get a massage, the masseuse provides the
service, massage, and at the same time, the customer is consuming the service by getting
a massage.
“Service variability means that the quality of service depends on who provides them as
well as when, where and how they are provided” (Kotler & Armstrong 2012, 262). An ex-
ample of this can be seen at hair salons. Depending on the hair dresser’s skills, moods
and the way of communication, the impression customers get varies.
Service
Perishability
Inseperability Intangibility
Variability
10
Service perishability is that the services are unable to be stored to be sold and used
later (Kotler & Armstrong 2012, 262.) Kotler and Armstrong (2012, 262) give an example;
“Some doctors charge patients for missed appointments because the service value exist-
ed only at that point and disappeared when the patient did not show up”.
2.1.1 Destination marketing
“Events and attractions are the two primary strategies used by tourist destinations to at-
tract visitors” (Kotler and al. 2014, 541).
Attractions can be natural like Grand Canyon or man-made such as the Louvre. Events
gather people. For example, sports events such as the Olympics have a great impact on
visitors in the time to the particular area. In tourism marketing, the timing of marketing and
the collaboration with events and attractions in the destination may affect the result a lot.
(Kotler and al. 2014, 539-543.)
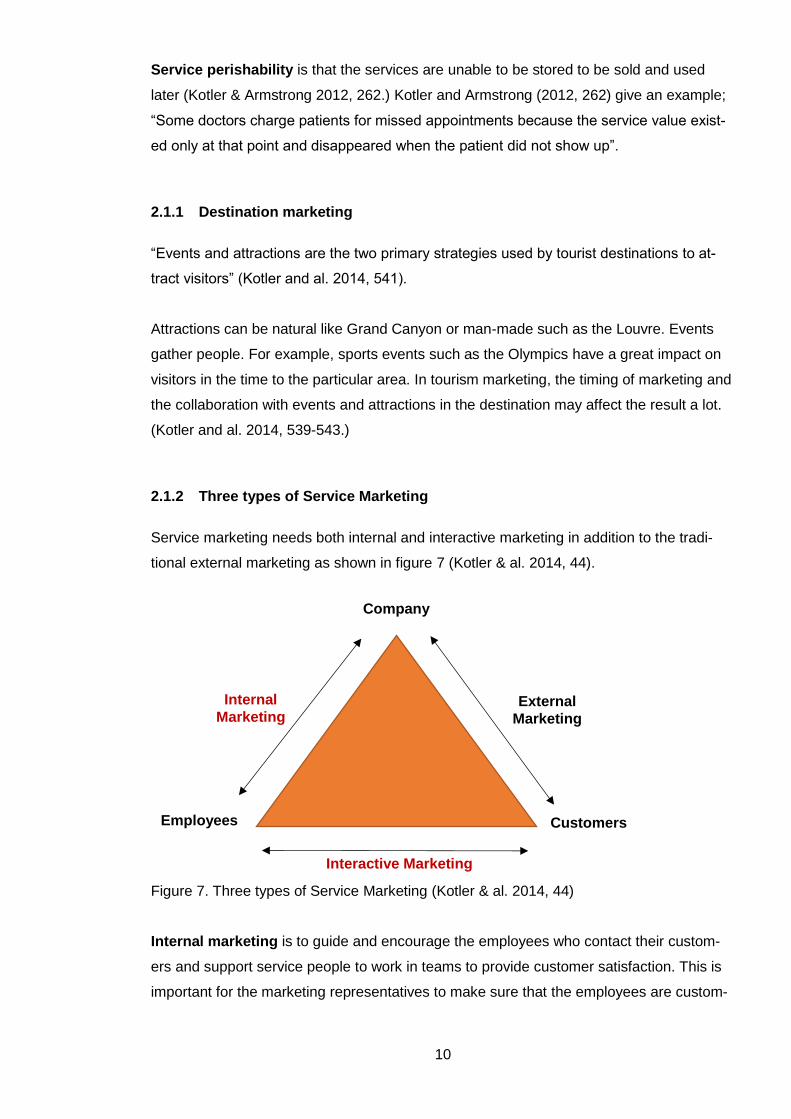
2.1.2 Three types of Service Marketing
Service marketing needs both internal and interactive marketing in addition to the tradi-
tional external marketing as shown in figure 7 (Kotler & al. 2014, 44).
Figure 7. Three types of Service Marketing (Kotler & al. 2014, 44)
Internal marketing is to guide and encourage the employees who contact their custom-
ers and support service people to work in teams to provide customer satisfaction. This is
important for the marketing representatives to make sure that the employees are custom-
Company
Customers Employees
Internal
Marketing External
Marketing
Interactive Marketing

11
er centered. Ideally, internal marketing should come before external marketing. (Kotler &
Armstrong 2012, 264.)
According to Kotler & Armstrong (2012, 264), interactive marketing can be defined as
“training service employees in the fine art of interreacting with customers to satisfy their
needs”. This is very important because the service quality greatly relies on the quality of
the interaction between the consumer and service provider. (Kotler & al. 2014, 45).
2.1.3 Service marketing mix
As shown in figure 8, “the service marketing mix is also known as an extended marketing
mix and is an integral part of a service blueprint design. The service marketing mix con-
sists of 7 P’s as compared to the 4 P’s of a product marketing mix”. In addition to the 4Ps:
Product, Pricing, Promotion and Place, the new 3Ps: People, Process and Physical evi-
dence are very important to optimize service delivery. (Bhasin 31 March 2017.)
Figure 8. Services Marketing Mix. (Bhasin 31 March 2017)
Product is the combination of the goods-and-services the provider offers to the target
market (Kotler & Armstrong 2012, 75).
Pricing shows the value of the product, amount of money consumers need to pay to have
the service or product (Kotler & Armstrong 2012, 76).
“Promotion plays a role in the perception the possible target audience may have about
your service” (Kar 2 April 2010).
Product Pricing Promotions Placement
Product Markting Mix
People Process Physical evidence
Services Marketing Mix

12
Place means where the product or the service is offered and how it is delivered to the
customers (Kar 3 March 2011).
People are crucial for business. No companies can exist without people who run the
firm. It is important to hire right people since they are as much a part of the business
offering as the products or services companies are providing. (Professional Academy
2017.)
Process is how the product or service is delivered to the customer. “Processes are
important to deliver a quality service” (Kar 2 April 2010).
Physical evidence takes a great role in customer’s satisfaction especially in service
offerings because service is intangible. (Professional Academy 2017.)
Figure 9. The 7 Ps of service marketing. (Marketing mix 2017)
As shown in figure 9, what service providers should aim for is providing a right product in
the right place at the right time with the right price, and to attract and satisfy their custom-
ers, they should have the right promotion, people, and physical evidence/environment.
13
Market segmentation and market targeting
Companies nowadays know that it is impossible to appeal to all the customers in the mar-
ketplace in the same way, because customers are too numerous and scattered too widely,
and their purchasing process and needs are too different. Therefore, many companies
have shifted from mass marketing to target marketing. (Kotler & al. 2014, 221.)
Kotler and Armstrong (2012, 214) has defined target marketing as “identifying market
segments, selecting one or more of them, and developing products and marketing pro-
grams tailored to each”.
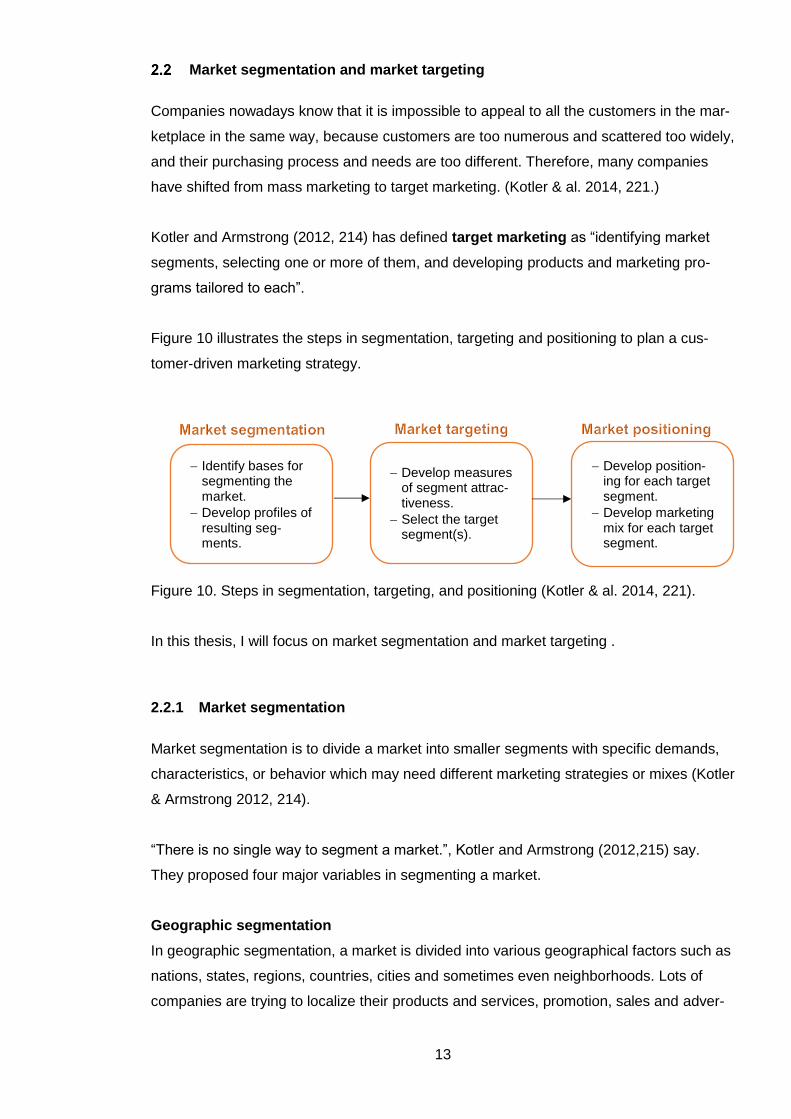
Figure 10 illustrates the steps in segmentation, targeting and positioning to plan a cus-
tomer-driven marketing strategy.
Figure 10. Steps in segmentation, targeting, and positioning (Kotler & al. 2014, 221).
In this thesis, I will focus on market segmentation and market targeting .
2.2.1 Market segmentation
Market segmentation is to divide a market into smaller segments with specific demands,
characteristics, or behavior which may need different marketing strategies or mixes (Kotler
& Armstrong 2012, 214).
“There is no single way to segment a market.”, Kotler and Armstrong (2012,215) say.
They proposed four major variables in segmenting a market.
Geographic segmentation
In geographic segmentation, a market is divided into various geographical factors such as
nations, states, regions, countries, cities and sometimes even neighborhoods. Lots of
companies are trying to localize their products and services, promotion, sales and adver-
Identify bases for segmenting the market.
Develop profiles of resulting seg-ments.
Develop measures of segment attrac-tiveness.
Select the target segment(s).
Develop position-ing for each target segment.
Develop marketing mix for each target segment.

14
tising to meet the needs of the area. Knowing geographic customer preferences lets com-
panies modify their offerings. (Kotler & Armstrong 2012, 215; Kotler & al. 2014, 221-223.)
Figure 11. Geographic segmentation (Kotler & Armstrong 2012, 215; Kotler & al. 2014,
221-223.)
Demographic segmentation
As stated by Kotler and al. (2014, 223), “demographic segmentation consists of dividing
the marketing into groups based on demographic variables such as age, life cycle, gen-
der, income, occupation, education, religion, race, and nationality”.
Companies change their offerings according to customers’ age, life process, gender, fi-
nancial situation, occupation, educational background, religion, race. nationalities, etc.
however they can categorize them because the needs of the customers vary with what
kind of person they are.
Geographic segmentation
Nations
States
Regions
Countries
Cities
Population

15
Figure 12. Demographic segmentation (Kotler & Armstrong 2012, 215; Kotler & al. 2014,
223-224)
Demographic factors are the most favorited bases for segmenting customers mainly for
the following reasons:
Customer needs and usage frequency are usually affected by demographic varia-bles.
It is relatively easier to measure and analyze demographic factors than many other variable types.
(Kotler & Armstrong 2012, 215; Kotler & al. 223-224)
Psychographic segmentation
Psychographic segmentation divides buyers into different segments based on social
class. lifestyle, or personality characteristics” (Kotler & Armstrong 2012, 218). This seg-
mentation goes very closely with demographical segmentation.
However, customers are different individuals, so they can be very different from each oth-
er even they are in the same demographic groups (Kotler & Armstrong 2012, 218; Kotler
& al. 2014,226.)
People’s preferences are greatly affected by the social class they belong to. There are
many companies have products or services aimed for a particular social class. Life style of
Demographic segmentaion
Age
Life cycle
Gender
Income
OccupationEducation
Religion
Race
Nationality

16
customers is also a big impact to the companies. For example, many trendy bars are de-
signed for young single people looking for dates. Personality is often used for experiential
products or services, for instance, cruise ships target those people who like adventures.
(Kotler & Armstrong 2012, 218-220; Kotler & al. 2014, 226-227.)
Behavioristic segmentation
Dividing customers into segments based on their behavior, such as awareness, reaction,
and use or response is called behavioral segmentation (Kotler and Armstrong 2012, 221).
There are mainly five different factors in behavioral segmentation as described in figure 13
below (Kotler & Armstrong 2012, 220-221; Kotler & al. 2014, 227-230):
Figure 13. Behavioral segmentation (Kotler & Armstrong 2012, 220-221; Kotler & al. 2014,
227-230)
2.2.2 International markets
When it comes to segmenting international markets, there are some more factors that
companies may use in segmentation. Countries, even those countries are next to each
other, can be very different in many ways such as economic situations, culture, language,
and politics. Therefore, it is recommended to have a combination of several factors when
segmenting the market. (Kotler & Armstrong 2012, 223.)
•When the customer gets the idea of purchasing and using the product or service?
Occasions
•What kind of benefit are the customers looking for from the product or service?
Benefits sought
•What kind of users are they; non-user, formar user, regular user, potential user or the user who is trying the product for the first time?
User status
•Are they; a light user, a medium user or a heavy user?
User rate
•How much are they loyal to the products (services), brands, stores or companies?
Loyalty status

17
Economic factors
Countries may be categorized by population income levels or by their overall economic
development level, such as GDP. The need for a product or a service is shaped by the
country’s economic structure and population, therefore, the economy of the target market
will indeed affect the marketing opportunities. (Kotler & Armstrong 2012, 233.)
Political and legal factors
Kotler and Armstrong (2012, 233) expound that political and legal variables like the type of
the government and how stable it is, financial regulations, receptivity to foreign compa-
nies, and the level of bureaucracy.
Cultural factors
Main cultural factors which may be utilized when grouping markets are common lan-
guages, values and attitudes, customs, religions, and patterns of behaviors (Kotler & Arm-
strong 2012, 223).
2.2.3 Market targeting
As a result of market segmentation, various markets are proposed for the companies, and
one of the main tasks in market targeting is to evaluate and select which market to target.
(Kotler & al. 2014, 231.)
Evaluating
Companies must focus on following three factors in the evaluation of different market
segments to take a further step to the selection of the target marketing.
1. Segment size and growth Companies should collect data on current sales growth rates and expected profit of many different segments and analyze them. What is important here is to select markets which have the “right size and growth” that fits with the company’s opera-tion, growth rate and sales. (Kotler & Armstrong 2012, 225; Kotler & al. 2014, 231.)
2. Segment structural attractiveness Attractive profit the segment brings and the size and growth of the segment do not always correspond to each other. Companies should test some main structural variables that may affect long term segment attractiveness, such as competition, buyer power, suppliers and substitute products and services. For instance, if there are big competitors, they might not get profit as they plan. (Kotler & Armstrong 2012,225; Kotler & al. 2014, 231-232.)
3. Company objectives and resources Companies should take into consideration whether its goals, value, and resources meet the segment. If the segment meets what the company is aiming for, then the next step is to see if the company and its resources are capable of doing the work.

18
Company’s and the employees’ skills should meet the requirements to maximize the profit. (Kotler & Armstrong 2012, 225; Kotler & al. 2012,232.)
Selecting
Companies have to determine which and how many segments to operate in. This step is
called target market selection. (Kotler & Armstrong 2012, 225; Kotler & al. 2014, 232.)
“A target market consists of a set of buyers who share common needs or characteristics
that the company decides to serve” (Kotler & Armstrong 2012, 225; Kotler & al. 2014,
232).
According to Kotler and Armstrong (2012, 225), market targeting may be performed at
some different levels as illustrated in figure 14.
Figure 14. Market targeting strategies (Kotler & Armstrong 2012, 225-231)
Undifferentiated marketing can be referred to as mass marketing strategy. It means that
a company does not take market segment differences into consideration, and target the
whole market with the same condition. This strategy focuses more on the common needs
of the markets than differences. (Kotler & Armstrong 2012, 225; Kotler & al. 2014, 233.)
In differentiated marketing strategy, as known as segmented marketing, companies
target several market segments and plan different offers for each segment. Commonly,
companies get more sales with differentiated marketing strategy than with undifferentiated
marketing strategy. (Kotler & Armstrong 2012, 225; Kotler & al. 2014, 233.)
Micromarketing
Concentrated marketing
Differentiated marketing
Undiffrentiated marketing
Targeted narrowly
Targeted broadly

19
Concentrated marketing or niche marketing strategy means “instead of going after a
small share of a large market, a firm goes after a large share of one or a few smaller seg-
ments or niches” (Kotler & Armstrong 2012, 226-227). This strategy is good for companies
which have limited resources. Companies could have a strong position in the market
thanks to its outstanding knowledge of consumer demand in the niche it services and
great reputation they get. (Kotler & Armstrong 2012, 226-227; Kotler & al. 2014, 233-234.)
Kotler and Armstrong (2012, 228) define micromarketing as “tailoring products and mar-
keting programs to the needs and wants of specific individuals and local customer seg-
ments; it includes local marketing and individual marketing”. Local marketing means
companies provide brands and promotions to the demand of local customer groups, for
example, customers in the city, village, town, and even specific shops. Individual market-
ing is to provide a tailored product or service and promotion to individual customers. It is
also known as one-to-one marketing. With using this strategy, companies will be required
to communicate with customers a lot to provide the customized and personalized products
or services. (Kotler & Armstrong 2012, 228-229.)
Buyer personas
Buyer personas, also referred to as customer personas or customer profiles, are fictional
and generalized representations of typical customer types of a product or a service.
(Vaughan 28 May 2015; experienceux 2017.) It is “based on real data and some select
educated speculation about customer demographics, behavior patterns, motivations, and
goals” (Hubspot 2014, 3).
Hubspot (2014, 3-4) points out common misunderstanding of buyer persona as described
in table 3.
Table 3. What is buyer personas? (Hubspot 2014, 3-4).
Buyer personas
are… not…
Typical customers with
Common patterns of behaviors
Shared professional and personal pain points
Common goals, wishes and dreams
Shared general demographic and biographic information
Target markets
Job titles, roles or occupations
Dependent on specific tools or tech-nology
Specific real people
20
2.3.1 Why buyer personas are important
The purpose of creating buyer personas is to gain a deeper understanding of customers
and their purchasing behaviors (Tony Zambio 2013). Revella (2015, 11) claims that “the
Buyer Profile creates a sense of the human connection with people whom we have never
face-to-face”. Via buyer personas, companies may adjust their product or service, promo-
tion, and customer communication to meet the customers’ needs.
Zambito (20 October 2014) explains six reasons why buyer personas are important today:
They inform marketing and sales strategies. Many B2B organizations are struggling with how to understand the new buy-ing behaviors of today. And, how to keep up with how fast they are chang-ing. When researched adequately, buyer personas can illuminate who buy-ers are, the situations they are faced with, how they have changed, and most important – what goals they are attempting to accomplish.
Develop a common language about buyers. Understanding of buyers can vary among different silos. Alignment still plagues many organizations. Buyer personas provide a common language and communications platform about buyers. Helping to overcome silo barri-ers and create the focus where it should be – on helping buyers and cus-tomers fulfill their goals.
Inform market and customer strategies. Decision-making relative to go-to-market strategies, marketing, and sales can amount to a guessing game. Buying behaviors are changing every month. Best practicing executive teams seek qualitative understanding of buyers as well as quantitative.
Design thinking is more prominent. Personas are ideally suited to address design issues – including design thinking. The design of marketing and sales will become more prominent in the next two years. At this date, technologies used by B2B companies are focused on what to say. Giving inadequate amount of focus to the user-friendliness of the delivery.
Better performance results expected. According to several studies, B2B companies who have implemented best practices on becoming customer and buyer focused have consistently out-performed their competitors. In their efforts, buyer personas were a crucial component of an overall plan to guide their enterprise towards customer centricity.
Globalization is now a must for all organizations. When buyer personas were first introduced in 2002, globalization was a strategy reserved for large enterprises. Much has changed with the introduc-tion of technologies making barriers of entries fall like the Berlin Wall. Com-panies are entering new markets with little knowledge of regional buying be-haviors and little room for errors.
2.3.2 How to create buyer personas
Hubspot (2014, 15) gives three points to note when creating buying personas:
1. It is critical to take a thorough look at details about the ideal customers. 2. Start with the existing information. There is no need to have an answer for every
question in advance. 3. Personas do not have to be finished. What important is to continue to tweak and
iterate on them as needed.
21
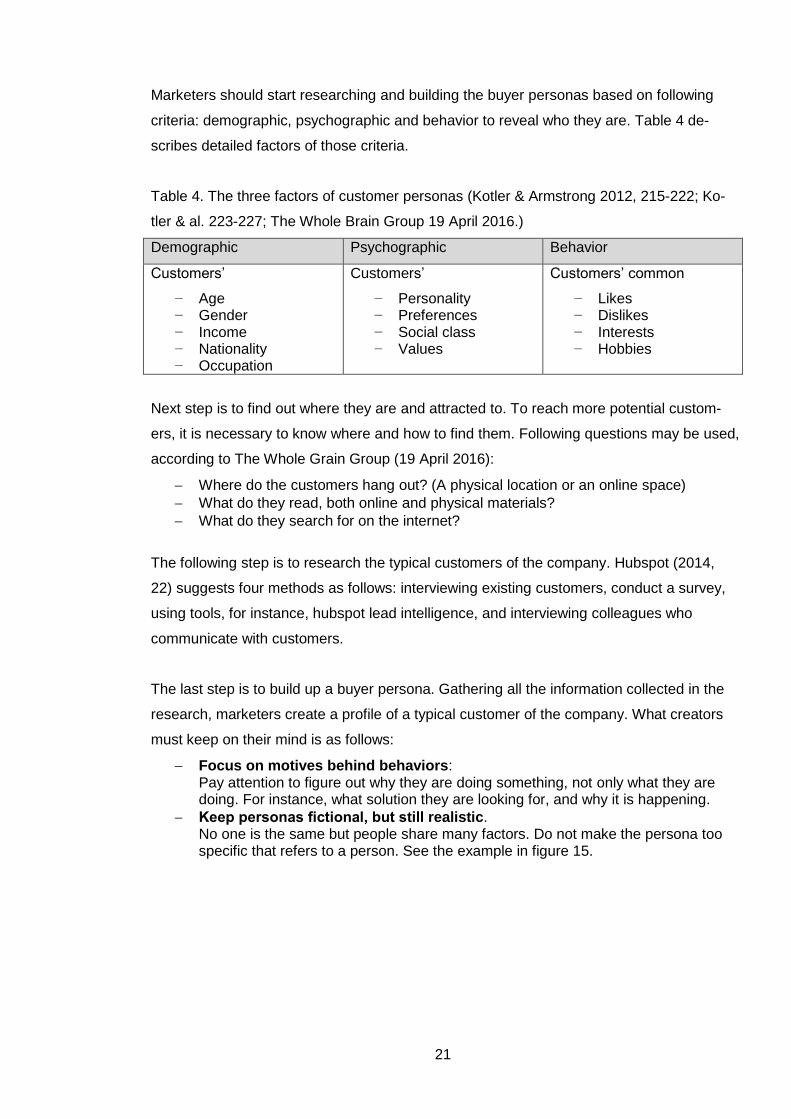
Marketers should start researching and building the buyer personas based on following
criteria: demographic, psychographic and behavior to reveal who they are. Table 4 de-
scribes detailed factors of those criteria.
Table 4. The three factors of customer personas (Kotler & Armstrong 2012, 215-222; Ko-
tler & al. 223-227; The Whole Brain Group 19 April 2016.)
Demographic Psychographic Behavior
Customers’
− Age − Gender − Income − Nationality − Occupation
Customers’
− Personality − Preferences − Social class − Values
Customers’ common
− Likes − Dislikes − Interests − Hobbies
Next step is to find out where they are and attracted to. To reach more potential custom-
ers, it is necessary to know where and how to find them. Following questions may be used,
according to The Whole Grain Group (19 April 2016):
Where do the customers hang out? (A physical location or an online space)
What do they read, both online and physical materials?
What do they search for on the internet?
The following step is to research the typical customers of the company. Hubspot (2014,
22) suggests four methods as follows: interviewing existing customers, conduct a survey,
using tools, for instance, hubspot lead intelligence, and interviewing colleagues who
communicate with customers.
The last step is to build up a buyer persona. Gathering all the information collected in the
research, marketers create a profile of a typical customer of the company. What creators
must keep on their mind is as follows:
Focus on motives behind behaviors: Pay attention to figure out why they are doing something, not only what they are doing. For instance, what solution they are looking for, and why it is happening.
Keep personas fictional, but still realistic. No one is the same but people share many factors. Do not make the persona too specific that refers to a person. See the example in figure 15.

22
Figure 15. Buyer personas example (Hubspot 2014, 38)
Choose one primary persona It is important to focus on the most common customer type first, and continue to less common ones.
Tell your persona’s story A story provides deep understanding and context of the person, customer(s), so it tells more than just a list of their characteristics.
(Hubspot 2014, 35-40.)
In this thesis, I will focus on the buyer personas of Japanese travelers who comes to Fin-
land to define typical Japanese traveler types. Therefore, the buyer persona will not com-
pletely meet the commissioning company’s customers.
23
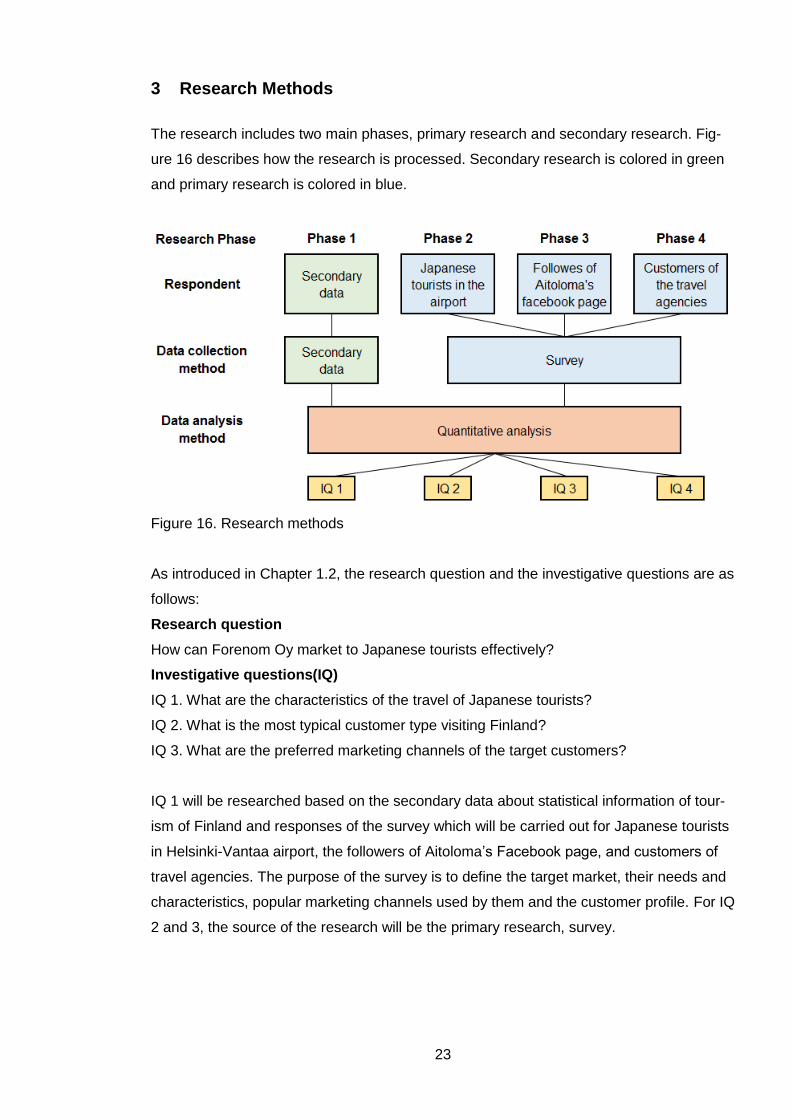
3 Research Methods
The research includes two main phases, primary research and secondary research. Fig-
ure 16 describes how the research is processed. Secondary research is colored in green
and primary research is colored in blue.
Figure 16. Research methods
As introduced in Chapter 1.2, the research question and the investigative questions are as
follows:
Research question
How can Forenom Oy market to Japanese tourists effectively?
Investigative questions(IQ)
IQ 1. What are the characteristics of the travel of Japanese tourists?
IQ 2. What is the most typical customer type visiting Finland?
IQ 3. What are the preferred marketing channels of the target customers?
IQ 1 will be researched based on the secondary data about statistical information of tour-
ism of Finland and responses of the survey which will be carried out for Japanese tourists
in Helsinki-Vantaa airport, the followers of Aitoloma’s Facebook page, and customers of
travel agencies. The purpose of the survey is to define the target market, their needs and
characteristics, popular marketing channels used by them and the customer profile. For IQ
2 and 3, the source of the research will be the primary research, survey.

24
Statistical information of tourism of Finland and Japan, such as nights spent, visited area
and number of the arrival will be researched and analyzed from secondary research. The
statistical information will be collected mainly from Statistics Finland and Visit Finland.
Marketing research
Before starting marketing, it is necessary to research who to and how to market. The very
first step of marketing is to research the market.
According to Burns and al. (2017,37), marketing research consists of four key elements:
designing, collecting, analyzing, and reporting information that can be used to solve a
specific marketing problem.
“Marketing research is a process that identifies and defines marketing opportunities and
problems, monitors and evaluates marketing actions and performance, and communicates
the findings and implications to management.” (Kotler, Bowen & Makens 2014, 137)
Marketing research is needed to persuade managers why and how to start marketing to
the market and let them realize what the company will get by doing it.
3.1.1 The function of marketing research
As stated by Burns and al. (2017,37), “The function of marketing research is to link the
consumer to the marketer by providing information that can be used in marketing deci-
sions”.
Burn and Bush advocates that having the connection with the customer by marketing re-
search is becoming more important today than ever, and it is crucial if companies are to
provide them with the value they expect in the marketplace. Due to the fact that now cus-
tomers have more choice, more information, and more power to speak others in the mar-
ket than it used to be because of globalization, online shopping, and social media. (Burns
& al. 2017, 38.)
To define what the demand of the customers is and what the company can provide at the
moment and what is still needed, and it is also crucial to plan the company’s development
in the future as well.

25
3.1.2 Elements of marketing research
What are usually researched in marketing research? According to Burns and al. (2017,
38), “marketing research can also be used to generate, refine and evaluate a potential
marketing action”. Burns and al. provided four elements to conduct the research:
Figure 17. Elements of marketing research (Burns & al. 38-40)
Target market selection can be reworded as “who to market”. According to the selection
of the target market, companies should plan “what to sell/market” and “how much it should
be”. These are set up by the result of product research and pricing research. It is re-
quired what people in the target market need and what the value of the product is. To sell
the product or service, companies must promote it. Promotion research is to figure out
“how to promote the product or the service”, for example, what kind of marketing channels
would be the most effective to reach the target market. It is also important to find the best
channels to deliver the product or service to the customers, and how to evaluate the per-
formance to keep developing in the target market. (Burns & al. 2017, 39-40.)
3.1.3 The marketing research process
Burns and al. (2017, 68-74) identified the 11 steps in the marketing research as below:
1. Establish the need for marketing research The need for marketing research comes up when managers must make decisions, however, the information they have is imperfect. Marketing research takes time and costs money, therefore, managers should consider carefully whether or not they should invest in market research.
Marketing research
Selecting target market
Product research
Pricing research
Promotion research
Distribution research

26
2. Define the problem As a result of this stage, a problem statement which summarizes the problem briefly should be developed. Bush and al. consider this is the most important step since all the upcoming steps will be meaningless if the problem is wrongly defined.
3. Establish research objectives Research objectives illustrates what information must be collected and analyzed for managers to make a decision to find solutions to solve the problem.
4. Determine research design The main task of this stage is to select which research approach to take to meet the research objectives, for example, there are three well known research designs: exploratory, descriptive and casual research. Exploratory research is a form of informal research used to obtain more knowledge about the research problems, or identify research priorities. In descriptive research, the description of the phe-nomena of interest is researched. Often, many surveys are undertaken. Casual research is archived by experiments. It is usually used to define the factors that cause events.
5. Identify information types and sources Researchers must choose which types of source of information they use. Primary source is the information gathered for the problem by the researcher. On the other hand, secondary source is the information that is already gathered.
6. Determine methods of accessing data Secondary data are easier to get compared to primary data. In many cases, multi-ple methods are used in this phase.
7. Design data collection forms There are mainly two forms of data collection; questionnaire and focus group guide. In questionnaire, the researchers communicate with respondents. In focus group guide, the researchers ask questions in a focus group, the people chosen by certain criteria for the problem. In either case, the designing of the form should be done with great care.
8. Determine sample plan and size Before gathering the data, researchers should test the data collection. This is called sampling. As a result of the sampling, the researchers will be able to define which type of samples can represent the population.
9. Collect data The researchers gather data. In data collection, it is highly possible to have errors intentionally and unintentionally, therefore, researchers should be able to know where the error can occur and control to minimize its risk.
10. Analyze data The data gathered in step 9 will be analyzed.
11. Prepare and present the final research report After analysis, the researcher will report the result of the research.
3.1.4 Qualitative and Quantitative market research
As Burns & al. (2017, 143) states, “quantitative research is defined as research involving
the administration of a set of structured questions with predetermined response options to
a large number of respondents”. This method is also known as a survey. The analysis of
this method is usually systematic.
On the other hand, Burns & al. (2017, 144) define qualitative research as “qualitative
research involves collecting, analyzing, interpreting data by observing what people do and

27
say”. In qualitative analysis, it is highly possible that researcher’s personal interpretation
can affect the result.
In this thesis, both primary and secondary data are conducted and analyzed by using
quantitative research method.
3.1.5 International marketing research
The steps the international marketing researchers should follow in the research are the
same as what domestic researchers do, however, international researchers often tend to
face more and a variety of problems. (Kotler and al. 2014,156)
First, Kotler and Armstrong (2012, 147) say:
Whereas domestic researchers deal with fairly homogeneous markets within a single country,
international researchers deal with diverse markets in many different countries. These markets
often vary greatly in their levels of economic development, cultures and customs, and buying
patterns.
Second, international marketing researchers often face a challenge finding adequate and
suitable data in many foreign markets. Due to the lack of good secondary data, interna-
tional researchers have to gather their own primary data in many cases. (Kotler & Arm-
strong 2012, 147.)
Third, in collecting data phase, reaching the respondents can be very challenging in other
parts of the world. In some countries, not so many people have phones or internet. In Bra-
zil, only about 70% of mail is delivered correctly. Moreover, in many developing countries,
reaching certain areas is very challenging due to the bad condition of roads and poor
transportation system, and it is very expensive to visit those places. (Kotler & Armstrong
2012, 147.)
Fourth, the cultural difference can affect the research much.
For example, in some places, it would be unacceptable for women to conduct personal inter-
views with men, or vice versa. Another challenge is that during religious holidays, like Rama-
dan for Muslims, research must be suspended. Cultural taboos, like revealing your wealth to
one another in certain parts of Africa, can stop the data gathering process. (Research Optimus
21 Mar 2013.)

28
Fifth, in conducting research in foreign countries, it is highly recommended to translate the
questionnaire into the language spoken in the country to avoid unintentional errors of re-
spondents. Translating a questionnaire to another language is challenging. Lots of points
can be lost because idioms, phrases, and statements can be interpreted differently in dif-
ferent culture. (Kotler & al. 2014, 156.)
In this thesis, since the target group is Japanese tourists, the survey is carried out only in
Japanese and all the communication with respondents are also in Japanese.
Questionnaire design
Designing the questionnaire started with defining questions which may answer the inves-
tigative questions and reveal respondents’ profile, for example, gender and age.
As the target of the survey is strictly limited, there was no need of setting a screening
question such as “Are you a Japanese traveler coming to Finland?”. To save the respond-
ents’ trouble and time, open questions were avoided.
The questionnaire was made in Surveypal, and translated version with the answer options
are attached as appendix 3.
Question 1 and question 2 are designed to reveal respondents’ demographic characteris-
tics. Questions 3 to 8 specifically about their trip to Finland. In the last two questions, their
general behavior in traveling will be figured out.
Table 5 shows which question corresponds to which investigative questions and answer
types. MO stands for multiple choice with one answer and MM is multiple choice with mul-
tiple answers.
Table 5. Questions and IQs
Question
number Question
Question
type
Investigative
question
1 Gender? MO IQ 1, 2
2 Age? MO IQ 1, 2
3 What is the purpose of your travel? MO IQ 1, 2
4 How long will you stay in Finland? MO IQ 1, 2
5 Where in Finland will you stay? MM IQ 1, 2

29
Question
number Question
Question
type
Investigative
question
6 What is your accommodation type? MO IQ 1, 2
7 How did you find your accommodation? MO IQ 2,3
8 What is your budget for your accommodation per
night? MO IQ 1,2
9 How do you find information of your travel desti-
nation? MM IQ 3
10 What is the most important factor when deciding
your accommodation? MO IQ 1, 2
Data collection analysis
In this study, two different kinds of data are collected and analyzed. One is the primary
data that I am collecting and another one is the secondary data which I could find online.
3.3.1 Primary data
As for the primary data, survey data collection method was taken. The target of the survey
is Japanese tourists in Finland, in other words, Japanese tourists who have visited, is
coming to, and in Finland when the survey is conducted. The data collection started on 26
December 2016 and ended on 26 April 2017. A total of 71 responses were gathered.
The survey was conducted to three different targets:
1. Japanese tourist at Helsinki-Vantaa airport 2. The followers of Aitoloma’s Facebook page 3. Customers of travel agencies or coordinators
Most of the Japanese tourists coming to Finland arrive at Helsinki-Vantaa airport. And, at
the airport, at least two flights depart to Japan and two arrive every day. Since an airport
is a general place where every traveler come, the risk of choosing certain types of re-
spondents can be decreased. Hence, I made a judgment that that is the best place to
conduct a face to face survey.
At the airport, I handed out a piece of a paper with a QR code (see figure 18) to the re-
spondents, and asked them to answer the questionnaire online. There are two reasons I
chose face to face but online questionnaire at the airport. One is that the travelers have a
lot of luggage and I thought it would be hard to keep them in safe if they are writing some-

30
thing on paper somewhere. Another reason is I found it difficult to find a good place to fill
in the paper form because the airport can get very crowded.
Figure 18. QR code for the survey.
For The followers of Aitoloma’s Facebook page and the customers of travel agencies or
coordinators, the online survey was carried out. Aitoloma is a small Finnish company
which offers tour guide and coordinate service for Japanese tourists. Its Facebook page
has 758 followers, and Ms. Uehara, the owner of the company was very nice to help this
study with sharing the questionnaire on the Facebook page. I contacted many travel
agencies both in Japan and Finland, only one company replied and accepted to help the
study.
I faced a few major challenges in data collection process.
First, travelers are often pressed for time, so many potential respondents denied to an-
swer the questionnaire because of lack of time. Some travelers told that they will do after
checking into their accommodation or arriving in Japan, however, it was impossible to
know if they completed the questionnaire.
Second, the flight schedules were between 14:00 to 17:00, for both departures and arri-
vals, so it was hard to be there when travelers are still in the common area where I could
go due to work and school. Therefore, the survey at the airport was mostly carried out on
weekends.
Third, travel agencies were not cooperative for the research. It probably because in Ja-
pan, bachelor theses are usually desktop research based, therefore, companies are not
used to working with students for their research and are not willing to waste their time for
it.

31
All the answers from the respondents are collected and stored automatically in Surveypal,
an online survey platform. It also creates a report with numbers and graphs. Based on the
report, I will generate a new report in excel by entering the results manually and it will be
used in the analysis.
3.3.2 Secondary data
As mentioned in the previous section, the secondary data that are used in this thesis is
the statistical background information of Finland’s and Japan’s tourism. These secondary
data were collected from online pages providing statistical data such as Statistics Finland
(Tilastokeskus) and Visit Finland. Collecting secondary data is crucial for the study to un-
derstand the overview of the Japanese and Finnish market in tourism.
Secondary data will be analyzed by the given numbers and graphs on the data in the
chapter 4.1. Some of the data will also be analyzed by generating a report in excel based
on the provided numbers.

32
4 Results and key findings
In this chapter, the outcomes and key findings of the research are presented. The re-
search was carried out based on two different data: the secondary data and the primary
data.
Table 6 describes the content and analyzed data for each subchapter.
Table 6. Content of each subchapter
Subchapter Content Data used
4.1 Overview of the market: Japan and Finland Secondary
4.2 Results of the survey Primary
Japanese travelers and Finnish market
Figure 19 illustrates the change in overnight stays from 2015 to 2016. Compared to 2015,
the total of nights spent in Finland grew by 3%. Nights spent by foreign resident grew by
5%, as well as by Japanese travelers. As mentioned in Chapter 1.1, the number of nights
spent by Japanese tourists has grown year by year until 2015 (See appendix 1), and still
growing continuously. The biggest growth was recorded by Chinese, which was plus 27%.
(Statistics Finland 2017a)
Figure 19. Change in overnight stays 2016 / 2015, %. (Statistics Finland 2017a)

33
Figure 20. Number of nights spent by Japanese visitors and share of foreign overnights
(Visit Finland 2016b, 4).
Figure 20 describes the number of nights spent by Japanese visitors and share of foreign
overnights. Including same day visitors, 454 000 people visited Finland from Japan in
2015. A total of 203 400 nights were spent by Japanese visitors, and it covers 4% of total
nights spent by foreign residents in Finland in 2016. That makes Japan is the 7th biggest
market for Finland by the number of overnights. (Visit Finland 2016b, 4-5.)
Figure 21. Japanese overnight, summer and winter 2015. (Visit Finland 2016b, 6)
The number of overnight by Japanese visitors from 2006 to 2015 is shown in figure 21. In
2015, 60% of total nights spent by Japanese travelers were registered in summer, and
40% were registered in winter. The number of overnight in summer is growing again from
2012, and in 2015, the growth was plus 15% compared to 2014. As for the winter season,

34
the number of the nights spent was constantly growing from 2006 to 2012, but it started
decreasing from 2013. In 2015, it declined by 11% from what it was in 2014. (Visit Finland
2016b, 6.)
Figure 22. Nights spent of Japanese travelers by month 2014 and 2015 (Visit Finland
2016b, 7)
The most visited month is August, followed by September and July in 2015 (see figure
22). The growth of autumn was significant. (Visit Finland 2016,7.) This supports the idea
that Finnish autumn season is getting popular among Japanese tourists.
In 2015, approximately 450 000 trips were made from Japan to Finland, and 90% was
from Kantō, Chūbu and Kinki regions. The three biggest cities in Japan, Tokyo, Osaka,
and Nagoya are located in those areas. (Visit Finland 2016b, 14.)

35
Figure 23. Overnights by region in summer and winter season from Japan. (Visit Finland
2016b, 10)
Figure 23 illustrates overnights by region in summer and winter season from Japan. Al-
most 70% of visitors from Japan stayed in Helsinki throughout the year in 2015. In sum-
mer, the difference between the overnight of Uusimaa and Lapland was tremendous,
however, they did not look very different in winter. (Visit Finland 2016b, 10.)
Figure 24. Top 10 cities in overnight spent growth rate (Statistics Finland 2017)
Figure 24 shows the 10 cities which had the biggest growth rates in the night spent in
2016. The number of nights spent by Japanese in Helsinki grew by 5.3% and in Rovanie-
mi increased by 13.7% from 2015 to 2016 along with the growth of overnight stay in the
whole country (See appendix 2). Figure 22 below provides the 10 best cities in terms of
the nights spent growth rate. The biggest change was Jyväskylä, which recorded 94.8%.
Even though the number of visitors decreased in Lapland in 2016, 13.7% more tourists
are visiting Rovaniemi compared to 2015.
0% 20% 40% 60% 80% 100%
Jyväskylä
Kuusamo
Pori
Mikkeli
Hämeenlinna
Turku
Lappeenranta
Kuopio
Rovaniemi
Helsinki
36
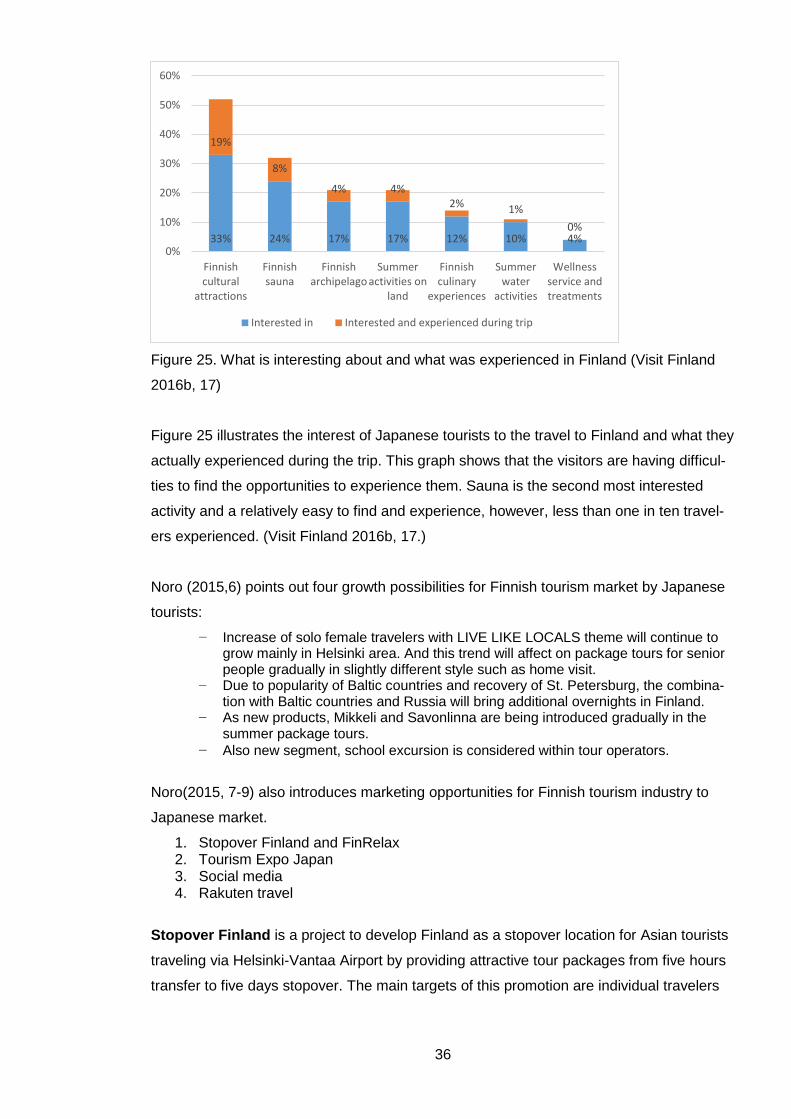
Figure 25. What is interesting about and what was experienced in Finland (Visit Finland
2016b, 17)
Figure 25 illustrates the interest of Japanese tourists to the travel to Finland and what they
actually experienced during the trip. This graph shows that the visitors are having difficul-
ties to find the opportunities to experience them. Sauna is the second most interested
activity and a relatively easy to find and experience, however, less than one in ten travel-
ers experienced. (Visit Finland 2016b, 17.)
Noro (2015,6) points out four growth possibilities for Finnish tourism market by Japanese
tourists:
− Increase of solo female travelers with LIVE LIKE LOCALS theme will continue to grow mainly in Helsinki area. And this trend will affect on package tours for senior people gradually in slightly different style such as home visit.
− Due to popularity of Baltic countries and recovery of St. Petersburg, the combina-tion with Baltic countries and Russia will bring additional overnights in Finland.
− As new products, Mikkeli and Savonlinna are being introduced gradually in the summer package tours.
− Also new segment, school excursion is considered within tour operators.
Noro(2015, 7-9) also introduces marketing opportunities for Finnish tourism industry to
Japanese market.
1. Stopover Finland and FinRelax 2. Tourism Expo Japan 3. Social media 4. Rakuten travel
Stopover Finland is a project to develop Finland as a stopover location for Asian tourists
traveling via Helsinki-Vantaa Airport by providing attractive tour packages from five hours
transfer to five days stopover. The main targets of this promotion are individual travelers
33% 24% 17% 17% 12% 10% 4%
19%
8%
4% 4%2% 1%
0%
0%
10%
20%
30%
40%
50%
60%
Finnishcultural
attractions
Finnishsauna
Finnisharchipelago
Summeractivities on
land
Finnishculinary
experiences
Summerwater
activities
Wellnessservice andtreatments
Interested in Interested and experienced during trip

37
from Japan, China, and South Korea who have transits at Helsinki-Vantaa airport to reach
their travel destination in other European countries. (Visit Finland 2017a)
FinRelax is a promotion project targeted to travelers from Japan, Russia and Germany to
make Finland the leading well-being travel nation. Unlike Stopover Finland, FinRelax’s “is
aimed at companies, whose travel products are well-suited or which have a readiness to
develop well-being travel products for international travellers” (Visit Finland 2017b).
Tourism Expo Japan is the biggest travel fair in Asia today. In this event, workshop ses-
sions for consumer promotion opportunity is held, therefore, it is highly recommended for
companies having or hoping to have many Japanese clients. (Noro 2015, 7.)
As for social media, LINE and Instagram are very effective to approach younger genera-
tions. To attract senior people, Facebook promotion is recommended (Noro 2015, 7.)
Rakuten Travel, one of the subordinate companies of Rakuten, Inc., is the biggest online
travel agency in Japan. They have a very systematic and complicated logistic chain, how-
ever, it seems that the way of cooperation with suppliers and tourism organization they
have is out of date. Therefore, it could be better to propose a new promotion to them. (No-
ro 2015,9.)
Discovery from the survey
The survey was conducted face to face and online from 26 December 2016 to 26 April
2017. A total of 187 people opened the questionnaire, however, I could collect 71 re-
sponses. The completion rate was 38%.
Figure 26. Response rate of the survey (n=187)
71
116
Completed Opened but did not complete

38
Figure 27. Gender of the respondents (n=68)
The number of valid response for question 1 was 68. As shown in figure 27, 82% of the
respondents were female. This implies that women are more interested in traveling to Fin-
land than men in Japan.
Figure 28. The distribution of age of respondents (n=68)
A total of 68 valid answers were collected for this question. 72% of the respondents were
20 to 39 years old. Finland seems to be popular especially among people in their 30’s. In
this survey, no answers were collected from travelers who are over 60 years old (see fig-
ure 28).
18%
82%
Male Female
1%
33%
39%
20%
7%
0%
under 20 20 - 29 30 - 39 40 - 49 50 - 59 over 60

39
Figure 29. Purpose of the trip (n=71)
Figure 29 shows the responses to question 3, which allowed respondents to select multi-
ple answers. There were 71 respondents answered to this question and the total response
was 77. Putting individual and tour tourists together, 67 of respondents, answered that the
purpose of their trip is sightseeing. Individual travelers constitute about 90% of them. The
respondents who visited Finland with a tour package were mostly 50 to 59 years old. All
the business travelers also selected individual sightseeing.
There were 6 comments that say the purpose of their travel was to visit the Moomin world
in Naantali.
Figure 30. Length of stay in Finland (n=68)
Figure 30 presents the length of their stay in Finland. There were 68 valid responses for
this question. 71% of the respondents answered that the length of their stay in Finland is
less than a week.
0
10
20
30
40
50
60
70
Sightseeing(individual)
Study Business trip Sightseeing(tour)
Other
0
5
10
15
20
25
less than 3days
4 - 5 days 6 - 7 days 8 - 10 days 11 - 14days
15 - 20days
more than20 days

40
Figure 31. Cities the respondents stayed (n=71)
71 respondents answered and a total 131 responses were gathered for this question. This
implies that many of visitors from Japan visit multiple cities during the trip. 67 of 71 re-
spondents, which is 94% of them answered that they are staying in Helsinki metropolitan
area. A total of 9 answers collected to “other”, and 6 of them commented Inari or Kemi,
which are in Lapland (see figure 31).
Figure 32. The type of accommodation (n=69)
Figure 32 describes the type of accommodation the respondents chose. 71% of 69 valid
responses collected for this question were for Hotel. This also showed that Japanese
travelers are not so familiar with the concept of serviced apartments which Forenom Oy
provides. However, there are 13% of respondents who selected either serviced apart-
ments or apartments rented out by individuals, and most of them were female in their 20s.
0
10
20
30
40
50
60
70
80
Helsinkimetropolitan
area
Turku Naantali Tampere Jyväskylä Rovaniemi Saariselkä Other
71%
6%
7%
6%7%
3%
Hotel Hostel
Serviced apartment Apartment (rented out by indivisuals)
Somebody's home Other

41
Figure 33. Channels used for accommodation reservation (n=69)
69 valid responses were gathered for this question. As shown in figure 33, 41% of the
answerers said that they found their accommodation via travel agency. In Japan, many
travel agencies provide a travel package called “free plan tour”, that allows travelers to
select the length of the stay, flights, and hotels from several choices but there are no trav-
el guiding services in the destination. This result reflects the special characteristics of pur-
chasing behavior of Japanese travelers. On the other hand, 35% of the respondents said
they reserved their accommodation through online travel agencies, such as booking.com
and Expedia. It seems that younger travelers prefer to travel independently, by selecting
flights and accommodation of their choices.
Figure 34. Budget for per night (n=70)
41%
35%
3%
4%6%
11%
Travel Agency Online travel agency
Guidebook Airbnb
Recommendation from people Other
0
10
20
30
40
under5000
5000 -10000
10000 -15000
15000 -20000
20000 -30000
over 30000

42
The number of valid answer for this question was 70. A total of 31 respondents budgeted
5000 to 10000 yen which is about 40 to 80 euro per night, and 24 of them did 80 to 120
euro (see figure 34).
Figure 35. Information sources for travel destination (n=71)
A total of 198 responses were provided by 71 respondents. As described in figure 35, the
most preferred information source among Japanese tourist was travel guidebooks which
80% of them answered they use them. For young generations, Instagram is very popular
as Noro(2015, 7) stated in his research as well. The comments collected for other online
sites were very interesting. 14 comments out of 29 mentioned that they read blogs to get
the information of the destinations, and those blogs were written by Japanese residents in
Finland, not by travelers. This supports the idea that Japanese travelers are interested in
“live like local” theme trip.
Figure 36. The first criteria choosing accommodation (n=71)
0
10
20
30
40
50
Price Location Design Accommodationfacilities
Other

43
There were 71 valid responses to this question. Figure 36 illustrates what criteria is the
most important for Japanese travelers when choosing where to stay. 68% of the respond-
ents answered that location is the most important factor, followed by price. The length of
their trip tends to be very short, so this may affect the accommodation selection to be lo-
cated in a convenient area in terms of transportation to save their time.

44
5 Conclusions
In this chapter, I will conclude my thesis project by answering to the investigative ques-
tions, presenting my recommendation how Forenom Oy can market to Japanese tourists
effectively, and evaluating the study.
Answers to the investigative questions
The purpose of this research is to find answers to the research and investigation ques-
tions of the thesis. In this chapter, I will provide my answers to the questions which were
discovered by analyzing the research results.
5.1.1 What are the characteristics of the travel of Japanese tourists?
The favorite seasons of Japanese tourists visiting Finland are summer and winter. The
most visited season is summer, and popular months are August, September, and July. In
summer, most of the visitors travel to Helsinki, but not to northern Finland. However, in
winter, their favorite destination changes to Lapland. The number of visitors in autumn is
also growing year by year. Throughout a year, most of the travelers coming to Finland
stay in Helsinki area, therefore, it can be said that Helsinki is the most popular city in Fin-
land among them.
The length of their trip is usually less than a week, however, a majority of them travel to
multiple cities in Finland during the stay. The typical combination is Helsinki and
Rovaniemi in winter time.
Their purpose of travel is sightseeing, and young generations prefer to travel individually,
but older generations prefer guided tours. Most of them stay in Hotels, but younger gener-
ations started to use serviced apartments. The budget for accommodation is around 80
euro. They attach importance to the location when selecting where to stay.
5.1.2 What is the most typical customer type visiting Finland?
As a result of the research and the analysis, a buyer persona is generated. The buyer
persona is created according to the criteria below, that are also explained in chapter 2.3.2:
Focus on motives behind behaviors:
Keep personas fictional, but still realistic.
Choose one primary persona
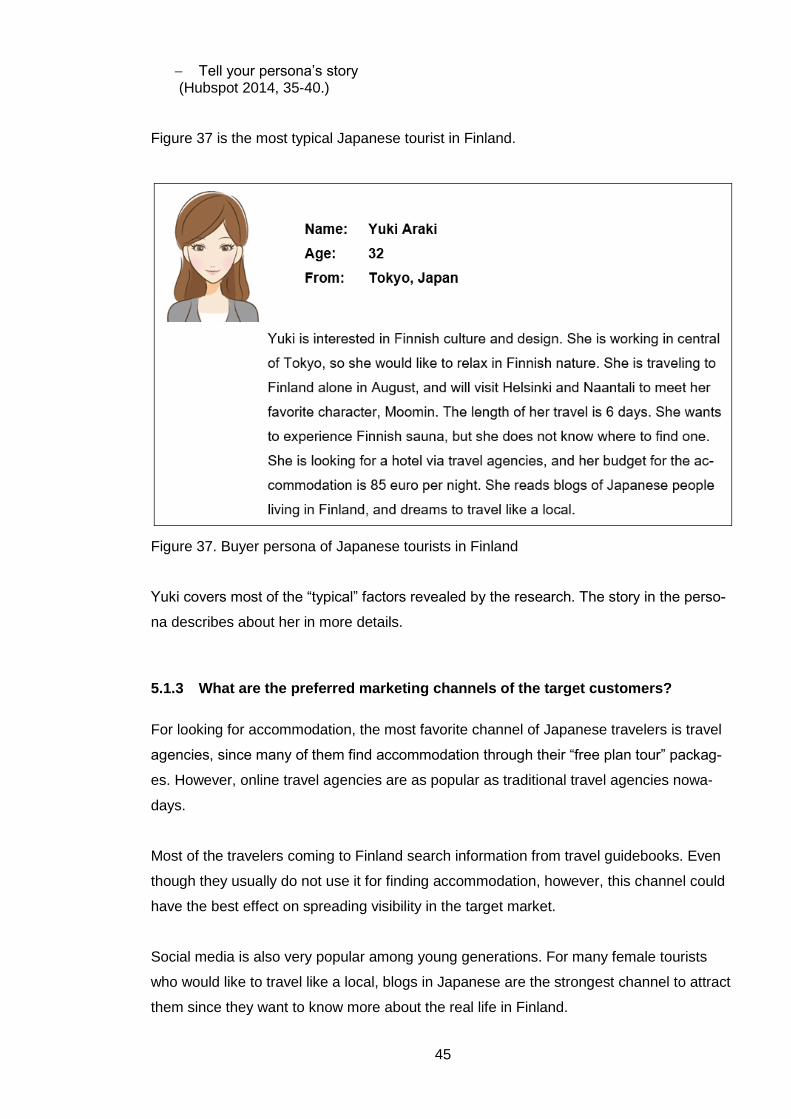
45
Tell your persona’s story (Hubspot 2014, 35-40.)
Figure 37 is the most typical Japanese tourist in Finland.
Figure 37. Buyer persona of Japanese tourists in Finland
Yuki covers most of the “typical” factors revealed by the research. The story in the perso-
na describes about her in more details.
5.1.3 What are the preferred marketing channels of the target customers?
For looking for accommodation, the most favorite channel of Japanese travelers is travel
agencies, since many of them find accommodation through their “free plan tour” packag-
es. However, online travel agencies are as popular as traditional travel agencies nowa-
days.
Most of the travelers coming to Finland search information from travel guidebooks. Even
though they usually do not use it for finding accommodation, however, this channel could
have the best effect on spreading visibility in the target market.
Social media is also very popular among young generations. For many female tourists
who would like to travel like a local, blogs in Japanese are the strongest channel to attract
them since they want to know more about the real life in Finland.

46
At last, the word of mouth is always effective in marketing, both in good and bad ways.
Therefore, providing a great service is also a very important and the most basic factor in
marketing.
Recommendation
Here are my recommendations to Forenom Oy.
5.2.1 Start promotions to Asia now
As an outcome of this thesis project, I would like to recommend Forenom Oy to start mar-
keting to Asia, especially Japan and China as soon as possible. I focused on the Japa-
nese market in this thesis, however, the growth rate of overall of Asian tourists in the trav-
el industry in Finland is enormous.
Japanese people have difficulties of having long vacations due to working culture of Ja-
pan, therefore, they plan their trip many months in advance. The typical holidays they
travel are in early May, middle of August, middle of September and Christmas to the New
Years. If Forenom Oy could start marketing already now, they may be able to catch the
biggest holiday season in August.
Japanese tourists are not familiar with serviced apartments’ concept yet, however, there
are many female travelers who would like to travel like a local. Forenom Oy could be a
pioneer in the Japanese market by reacting to the demand of their “live like a local”
themed trips. Forenom Oy could have a strong position in the market because of its out-
standing knowledge of consumer demand in the niche that they want to travel like a local.
(Kotler & Armstrong 2012, 226-227; Kotler & al. 2014, 233-234.)
“Events and attractions are the two primary strategies used by tourist destinations to at-
tract visitors”, Kotler and al. say (2014, 541). Many Japanese tourists want to experience
Finnish sauna, however, they do not have many opportunities during their stay in Finland.
Forenom can fulfill their demand by promoting their apartments with sauna.
Since Forenom Oy has many properties all over Finland, making a campaign, for exam-
ple, providing 10% of discount for the second accommodation in other cities in Finland, for
the travelers who visits multiple cities would be appreciated.
47
5.2.2 Cooperate with organizations
Finnish organizations are already working on getting more Asian tourists by creating pro-
jects such as Stopover Finland and FinRelax. Fortunately, Japan is included in both pro-
jects as one of the main target markets. Cooperating with them could bring us a great
brand image and visibility among Japanese tourists who are traveling not only to Finland
but also to Europe.
Cooperating with Japanese travel agencies, both traditional ones and online ones, may be
the most effective way of marketing. Many Japanese travelers make reservations through
them, therefore, listing Forenom properties there would bring us a great impact. Often,
Japanese travel agencies organize business trips as well, therefore, there is also a great
chance to find cooperate customers through them. There are many companies in Finland
that have offices in Japan, and vice versa. This also is a great opportunity for Forenom to
be a pioneer in the market that provides accommodation and relocation solutions for their
workers by fulfilling the consumer demand in the niche. (Kotler & Armstrong 2012, 226-
227; Kotler & al. 2014, 233-234.)
Considering most of the Japanese uses guidebooks when looking for information, Fore-
nom Oy should put an advertisement on travel guidebooks to get more visibility. Cooperat-
ing and planning a tour with travel guidebook publishers would be fantastic.
To widen the possibility of finding cooperation partners, it may be a great opportunity to
attend the Tourism Expo Japan 2017 which will be held in September. As this is the big-
gest travel fair in Asia, Forenom Oy can benefit a lot not only from Japanese companies
but also other Asian companies in the tourism industry.
5.2.3 Marketing in Japanese
Many solo female travelers to Finland want to know more about Finnish style of living and
its culture, so they read blogs of Japanese residents living in Finland. They appreciate the
contents of the blogs. Forenom Oy could provide them local news from different offices in
Finland to let them know real Finland. There are still many Japanese who are not com-
fortable with English, marketing should be done in Japanese.
If it is difficult to create a content in Japanese, Forenom Oy could invite some of the Japa-
nese bloggers who has many followers or readers for marketing events or as test sleepers
and cooperate with them.

48
Evaluation and my learnings through this project
My personal goal for this thesis was to gain a deeper understanding of Japanese tourism
market and find possibilities to develop Forenom Oy’s business in the area.
I faced the biggest difficulties in finding respondents for the survey. Since this survey took
a quantitative research method, I aimed for getting a total of 100 respondents, however, I
could only get 71 responses and it took for four months. The target for the survey was
travelers, so many of them were pressed in time and could not complete the survey. I was
hoping to get some help from Japanese travel agencies, but as mentioned earlier in this
thesis, Japanese companies are not used to working with students for the thesis, so many
of them denied.
Even though it was very challenging to reach many respondents, I think the survey result
came out reliable. There were many similar points with the secondary source which I col-
lected from the biggest Finnish statistics researcher, Statistics Finland and the official
tourism promoter, Visit Finland. I was very relieved to find my research results correspond
to their reports. The secondary data was easy to find, and the sources provided me great
information in Japanese tourism market and Japanese tourists in Finland.
Best of all, I could learn by doing how to research a market and find the marketing oppor-
tunities. I am very grateful that I could try this thesis project. It was a wonderful learning
opportunity and what is most, I kept going because I knew I could make mistakes and
learn from them, which would not be very good in the real business world.
Lastly, I would like to thank all the respondents, companies, teachers, friends and my fam-
ily for supporting me to complete this thesis project.
49
References
Bhasin, H. 31 March 2017. Service Marketing Mix – 7 P’s of marketing. Marketing 91.
URL: http://www.marketing91.com/service-marketing-mix/. Accessed: 17 April 2017.
Burns, A., Veeck, A. & Bush, R. 2017. Marketing research. 8th ed. Pearson Education.
Harlow.
Experienceux 2017. What is customer profiling?. URL:
http://www.experienceux.co.uk/faqs/what-is-customer-profiling/. Accessed: 25 April 2017.
Forenom Oy 2016a. Aparthotels. URL: http://forenom.fi/en/aparthotels/. Accessed: 6 Oc-
tober 2016.
Forenom Oy 2016b. Apartments. URL: http://forenom.fi/en/apartments/. Accessed: 6 Oc-
tober 2016.
Forenom Oy 2016c. Forenom. URL: http://forenom.fi/en/forenom/. Accessed: 6 October
2016.
Forenom Oy 2016d. Hostels. URL: http://forenom.fi/en/hostels/. Accessed: 6 October
2016.
Forenom Oy 2016e. Relocation services. URL: http://forenom.fi/en/sales-and-
corporations/relocation/. Accessed: 6 October 2016.
Forenom Oy 2017. Offices by country. URL: https://www.forenom.com/contact/. Ac-
cessed: 29 April 2017.
Good news from Finland 2017. Helsinki tourism breaks records, too. URL:
http://www.goodnewsfinland.com/helsinki-tourism-breaks-records-too/. Accessed: 17 April
2017.
Hubspot 2014. Why you need customer personas. URL:
http://cdn2.hubspot.net/hub/137828/file-552110662-pdf/Buyer_Personas_V2_Deck.pdf.
Accessed: 26 April 2017.

50
Kar. 2 April 2010. The 7 Ps of services marketing. Business Fundas blog. URL:
http://www.business-fundas.com/2010/the-7-ps-of-services-marketing/. Accessed: 18 April
2017.
Kar. 3 March 2011. The 4 P’s of Marketing – The Marketing Mix strategies. Business Fun-
das blog. URL: http://www.business-fundas.com/2011/the-4-ps-of-marketing-the-
marketing-mix-strategies/. Accessed: 18 April 2017.
Kotler, P. & Armstrong, G. 2012. Principles of marketing. 14th ed. Pearson Education.
Upper Saddle River.
Kotler, P., Bowen, J. & Makens, J. 2014. Marketing for Hospitality and Tourism. 6th ed.
Pearson Education. Harlow.
Noro, S. 2015. Japan Market News. Visit Finland. URL: http://www.visitfinland.fi/wp-
content/uploads/2015/11/Japan-Market-News-2015-2.pdf. Accessed: 28 April 2017.
Packalen, M. 6 October 2016. CFO. Forenom Oy. Interview. Helsinki.
Professional Academy 2017. Marketing theories – The marketing mix – From 4 P’s to 7
P’s. URL: http://www.professionalacademy.com/blogs-and-advice/marketing-theories---
the-marketing-mix---from-4-p-s-to-7-p-s/. Accessed: 18 April 2017.
Research Optimus. 21 Mar 2013. Challenges to Global Market Research in Emerging
Countries. Research Optimus blog. URL:
https://www.researchoptimus.com/blog/challenges-to-global-market-research-in-
emerging-countries/. Accessed: 17 April 2017.
Revella, A. 2015. Buyer Personas. John Wiley & Sons, Inc., Hoboken.
Statistics Finland 2017a. Demand for accommodation services grew by 3 per cent in
2016. URL: http://www.stat.fi/til/matk/2016/matk_2016_2017-04-27_tie_001_en.html. Ac-
cessed: 27 April 2017.
The Whole Brain Group. 19 April 2016. Five Simple Steps To Creating An Ideal Customer
Profile. The Whole Brain Blog. URL: http://blog.thewholebraingroup.com/steps-to-creating-
an-ideal-customer-profile. Accessed: 26 April 2017.
51
Vaughan, P. 28 May 2015. How to Create Detailed Buyer Personas for Your Business
[Free Persona Template]. Marketing blog: Where marketers go to grow. Hubspot. URL:
https://blog.hubspot.com/blog/tabid/6307/bid/33491/everything-marketers-need-to-
research-create-detailed-buyer-personas-
template.aspx#sm.000001req0vq5nel7zg8741u7wsf9/. Accessed: 26 April 2017.
Visit Finland 2016a. Annual Trend. URL: http://www.visitfinland.com/travel-
trade/graph/vuositason-kehitystrendi/. Accessed: 5 October 2016.
Visit Finland 2016b. Japan. Market review 2015. URL: http://www.visitfinland.fi/wp-
content/uploads/2016/10/Market-Review-2015-Japan.pdf?dl. Accessed: 27 April 2017.
Visit Finland 2017a. StopOver Finland. URL: http://www.visitfinland.com/travel-
trade/things/stopover-finland/. Accessed: 28 April 2017.
Visit Finland 2017b. FinRelax. URL: http://www.visitfinland.com/travel-trade/things/finnish-
wellbeing/. Accessed: 28 April 2017.
Visit Finland Statistic Service Rudolf 2016. Yearly nights spent and arrivals by country of
residence by Region, Country, Data and Year. URL:
http://visitfinland.stat.fi/PXWeb/pxweb/en/VisitFinland/VisitFinland__Majoitustilastot/020_
matk_tau_312.px/table/tableViewLayout1/?rxid=4d865b4f-3690-4bf7-a9bb-
58848d24c026. Accessed: 5 October 2016.
Zambito, T. 20 October 2013. 6 reasons why buyer personas are more important than
ever. Tony Zambito Blog. URL: http://tonyzambito.com/buyer-personas-important/. Ac-
cessed: 27 April 2017.
Zambito, T. 27 May 2013. What is a buyer persona? Why the original definition still matter
to B2B. Tony Zambito Blog. URL: http://tonyzambito.com/buyer-persona-original-
definition-matters/. Accessed: 17 April 2017.

52
Appendices
Appendix 1. Nights spent by country of residence 2009-2015 (Visit Finland 2016)
Nights spent by country of residence 2009-2015
WHOLE COUNTRY, FINLAND
2009 2010 2011 2012 2013 2014 2015
Total 1856733
8 1924805
7 1998787
1 2031758
2 2024105
7 1978541
2 1973812
3
Domestic 1367733
2 1424298
9 1448040
3 1451462
3 1438061
0 1407507
2 1422777
3
Foreign 4890006 5005068 5507468 5802959 5860447 5710340 5510350
Foreign excluding Russia 3910480 3948644 4220870 4296059 4240028 4370814 4727502
Europe 4033708 4112427 4501036 4703927 4699318 4486065 4127712
EU-28 2759468 2748811 2878849 2829777 2728286 2783398 2945136
Scandina-via 740278 771678 831128 816468 796935 814064 845626
Asia 375174 406708 459446 504328 584668 591342 728806
Oceania 43679 43575 49618 52926 56356 61744 63199
Africa 20226 22169 22902 24924 23133 23844 25248
America 228390 239187 276093 275908 259675 281175 294503
Russian Federation 979526 1056424 1286598 1506900 1620419 1339526 782848
Sweden 494002 517849 552129 537002 531375 534358 549870
Germany 525880 510280 541031 534239 501650 500057 543294
United Kingdom 464292 406272 389037 405541 454604 446792 471869
France 212887 213414 213588 217886 214248 215393 230090
China and Hong Kong 73701 83037 101891 112591 142802 150271 210535
Japan 134363 136804 146433 176919 205988 192007 203411
United States 166893 178482 201854 198725 187245 204036 202546
Estonia 167816 205429 228187 235482 187295 196277 188899
Norway 149279 159377 173254 182639 174147 178956 185995
Nether-lands 169213 165779 164593 164918 158668 158801 159568
Switzerland 107621 107859 118009 132900 128771 131076 158805
Italy 151658 142389 156509 130847 115681 123145 127757
Spain 109240 113804 130046 96820 96876 104451 106477
Source: Statistics Finland / Accommodation statistics, Visit Finland 2016

53
Appendix 2. Nights spent by non-residents and annual change (%) in all estab-
lishments in 2016 (Statistics Finland 2017)
Region Japan
Whole country 214,495 5.4
Mainland Finland 214,367 5.5
Uusimaa 146,769 4.5
Espoo . .
Helsinki 133,130 5.3
Vantaa 11,148 -7.6
Varsinais-Suomi 4,791 -7.3
Turku 2,218 18.4
Satakunta 675 35.8
Pori 281 62.4
Kanta-Häme 800 24.8
Hämeenlinna 781 26
Pirkanmaa 4,008 17.7
Tampere . .
Päijät-Häme 939 -0.4
Lahti 509 -8.9
Kymenlaakso 181 -30.7
Kouvola 88 -17.8
South Karelia 257 2.8
Lappeenranta 223 15.5
Etelä-Savo 566 37
Mikkeli 277 48.1
Pohjois-Savo 562 5.8
Kuopio 471 14
North Karelia 639 -30.1
Joensuu . .
Central Finland 2,366 101.5
Jyväskylä 2,152 94.8
South Ostrobothnia 494 7.9
Seinäjoki . .
Ostrobothnia 822 50.3
Vaasa . .
Central Ostrobothnia 121 -33.1
Kokkola . .
North Ostrobothnia 3,893 32.9
Kuusamo 2,505 65.5
Oulu . .
Kainuu 1,122 10.3
Kajaani . .
Lapland 45,362 4.3
Rovaniemi 17,254 13.7
Åland 128 -28.9
Maarianhamina 110 -28.6

54
Appendix 3. The survey questionnaire (translated into English)
As a thesis project, I am researching on Japanese tourists in Finland. It would be grateful
if you could help me with the research by answering questions below.
1 Gender? Please select one option.
○ Male
○ Female
2 Age? Please select one option.
(Pull down)
○ Under 20 years old
○ 20 – 24 years old
○ 25 – 29 years old
○ 30 – 34 years old
○ 35 – 39 years old
○ 40 – 49 years old
○ 50 – 59 years old
○ Over 60 years old
3 What is the purpose of your trip? Please choose at least one option.
□ Sightseeing (Individual)
□ Study
□ Business trip
□ Sightseeing (Tour)
□ Other, please specify.
4 How long are you staying in Finland? Please select one option.
○ Less than 3 days
○ 4 – 5 days
○ 6 – 7 days
○ 8 – 10 days

55
○ 11 – 14 days
○ 15 – 20 days
○ More than 20 days, please specify.
5 Where in Finland are you staying? Please select at least one option.
□ Helsinki metropolitan area
□ Turku
□ Naantali
□ Tampere
□ Jyväskylä
□ Rovaniemi
□ Saariselkä
□ Other, please specify.
6 What is your accommodation type? Please select one option.
○ Hotel
○ Hostel
○ Serviced apartment
○ Apartment rented out by individual
○ Somebody’s home
○ Other, please specify.
7 How did you find your accommodation? Please select one option.
○ Through a travel agency
○ Through an online travel agency (i.e. booking.com, Expedia, etc.)
○ Advertisement on a travel guidebook
○ Airbnb
○ Recommendation from people
○ Other, please specify.

56
8 How much is your budget for the accommodation per night? Please select
one option.
○ Less than 5000 yen (40 €)
○ 5000 yen (40 €) – 10000 yen (80 €)
○ 10000 yen (80 €) – 15000 yen (120 €)
○ 15000 yen (120 €) – 20000 yen (160 €)
○ 20000 yen (160 €) – 30000 yen (200 €)
○ More than 30000 yen (200 €)
9 Where do you find the information of your travel destination? Please select at
least one option.
□ Travel guidebooks
□ Leaflets from travel agencies
□ Ask from people who has been there
□ Other internet sites, please specify.
□ Other, please specify.
10 What is the most important factor when choosing your accommodation?
Please select one option.
○ Price
○ Location
○ Design
○ Facilities of the accommodation
○ Other, please specify.
Thank you very much for your cooperation!
Please click “submit” button and send your response.
Submit