Embed Size (px)
Citation preview

Journal of Chemical and Petroleum Engineering, 2021, 55(2): 223-242.
Publisher: University of Tehran, College of Engineering DOI:10.22059/jchpe.2021.312133.1334
© Mohsen Shabibi, Eghbal Sahraei
Identification of Water Production Mechanism in One of Iran’s Oil Fields
and Treat it with Gel Injection
Mohsen Shabibi , Eghbal Sahraei *
1. Institute of Oil and Gas Research, Petroleum and natural gas Engineering, Sahand University of
Technology, Tabriz, Iran. E-mail: [email protected] 2. Institute of Oil and Gas Research, Petroleum and natural gas Engineering, Sahand University of
Technology, Tabriz, Iran. E-mail: [email protected]
ARTICLE INFO ABSTRACT
Article History:
Received: 19 October 2020
Revised: 17 January 2021
Accepted: 14 February 2021
Article type: Research
Keywords:
Channeling,
Diagnostic Plot,
History Matching,
Injection Gel,
Simulation,
Treatment,
Water Cut,
Water Cut Control
In this study, the problem of water production in one of Iran's oil reservoirs
will be examined. First, using the flow rate diagram of oil and water
production, the water production problem will be examined according to
time. Then, after confirming the occurrence of water production problem,
the mechanism of water production will be investigated using Chan
diagnostic diagrams and the created sector model. The results of this study
indicate that firstly, the problem of water production in the well under study
is observed, and secondly, according to the Decline-curve analysis
diagrams, Recovery plot, Chan derivative diagram and schematic shape of
the fluid flow movement, it shows the mechanism. Water production is a
channel flow process, underwater injection. A gel treatment at early time
with 25% of water cut was studied, for that it was modelled a gel treatment
after 500 days of production. The main observation is that by increasing the
concentration of injected gel, the rate of oil production increases and the
rate of water production decreases. The concentration evaluated
concentration was from 0 to 100 (lb /bbl) of solution, a stabilization
concentration was not observed. Finally, first by identifying the type of
water production mechanism for this reservoir in Iran, it has been
determined that it has water production through the canal and then by using
a simulation of gel injection, the water production rate has decreased and
the oil production rate has increased.
Introduction
To control water production, it is necessary to determine the cause and the source of the
produced water. Then the best treatment for water control is selected according to the
identification of the type of problem [1]. There are two ways to identify water production:
1-Production history
2-Production logging tools
Types of water production identification methods by production history:
* Corresponding Author: E. Sahraei (E-mail address [email protected])
Journal of Chemical and Petroleum Engineering (JChPE)
Print ISSN: 2423-673X Online ISSN: 2423-6721

224
Recovery Plot
A type of semilogarithmic graph is plotted according to the ratio of water to oil (WOR) to
the volume of cumulative oil production oil. As oil production increases, so do water
production. It reaches the economic range (WOR), and until the amount of water produced
exceeds the economic range, there is no need to control the production water, shown in Fig. 1:
Fig.1. Recovery plot [1]
Production History Plot
A logarithmic chart that is plotted in terms of oil and water production flow rate versus time.
Fig. 2. Production history plot [1]
Fig. 2 shows that when the oil flow rate decreases, the chart is downward and the water flow
rate increases, meaning that the chart is upward and increasing, indicating water production in
the production well.
Decline-Curve Analysis
A semilogarithmic graph shows the volume of oil produced by cumulative oil and water
production flow rate. In this diagram, when the production is in the form of a straight line
diagram, it is shown in Fig. 3 that the discharge from the reservoir takes place as usual, and
when there is a change in the slope of the diagram, it indicates the production of water [1].

Journal of Chemical and Petroleum Engineering 2021, 55(2): 223-242. 225
Fig. 3. Decline-curve analysis [1]
Diagnostic Plots
Diagnostic diagrams are a set of pre-prepared graphic patterns obtained by WOR versus time
in logarithmic coordinates. If these diagrams are used with the help of information received
from good drilling and well testing, the operator can understand the drastic changes in water
production and the rapid occurrence of a breakthrough in the fractures and problems of water
production. One of the benefits of this type of diagram is the recognition of water production
problems due to coning and channeling. Fig. 4 is an example of this type of chart.
Fig. 4. Diagnostic plots [2]
Fig. 4 shows that the water breakthrough earlier during coning because in the channel mode,
due to parameters such as permeability and how the fluid saturation distribution affects the
velocity of fluid flow in the channel, it delays the breakage. According to the graph lines, when
the Coning phenomenon occurs, the increase in water production is less than the channeling
mode. This is due to the radial expansion of the coning relative to its vertical expansion; that is,
when our horizontal permeability is greater than the vertical permeability, the comicality
expands radially. As a result, the water flow reaches the perforations later. However, in the
channel mode, due to the permeability parameter and the distribution of fluid saturation, the
channel's water movement speed reaches the channel more and faster. If these two types of
phenomena are plotted on a logarithmic diagram, their shape is as follows [2]:

226
Fig. 5. Diagnostic plot of water coning and channeling WOR comparison [2]
According to Fig. 5, the slope of the graph in logarithmic mode is negative for Coning and
positive for the Channel
Use Production Logging Tools (PLT)
Baldowf in 2004 [3] and Motan in 2008 [3] showed that using PLT accurately identifies
water cut and profile information. In this case, water production areas are identified using a set
of different logs. These logs detect the water production area, according to the multiphase
concept. Then, according to the holdup concept, they detect the amount of water cut by using
the principle that the higher the density, the more waste that can be. He obtained the amount of
water cut.
Due to the high penetration depth into the reservoir, chemical gels are very suitable
candidates for controlling water production from cracks and channels that transmit water flow.
Water control by the chemical method is one of the common methods that use water-based
polymer to close the flow of water produced by the formation into the well. In various forms,
gels have proven to be one of the most effective and popular ingredients for reducing water
production problems, helping to improve and treat problems by reducing permeability [4].
Fragachan [5] examined the control of extra water by mineral gels in fractured reservoirs. It
showed that to treat high temperature use mineral gel is useful in silicate gel, it is also applicable
to coning treatments. Liang et al. [6] investigated the blocking agents and observed that gels
Journal of Chemical and Petroleum Engineering 2021, 55(2): 223-242. 227
reduce the permeability to water in a higher proportion than the reduction to the permeability
to oil or gas. Gels are liquid-based systems made with solid structural properties. In other words,
most of the gel systems are fluid-based systems, where the liquid part of a solid three-
dimensional structure, the solid mass of the gel [7]. Polymer gel treatment is an effective
treatment to reduce water production. Polymer gel can flow into fractures; it can also withstand
the pressure difference near the wellbore. In the case of high permeability with high water
saturation to reduce water permeability and prevent water channels, a polymer gel when is
mixed with Cross linker agent form a solid gel [8, 9], that can block the permeable channels.
Sodium silicate is used for water control operations, and before doing so, it can be diluted to
reduce the viscosity and to increase the penetration depth in the desired area. The degree of
dilution of this fluid is the controlling factor in calculating the final strength and time of
attachment of the gel plug [10]. Silica can also be used as a polymer with other chemicals; it
comes in the form of a polymer and makes a gel plug. The silicate reacts with water and forms
suspensions. Because the silicate dissolution strength depends on the size of its components,
the particle size of this material plays an important role in forming the gel. It should be noted
that with decreasing particle size, the solubility of this material increases [11].
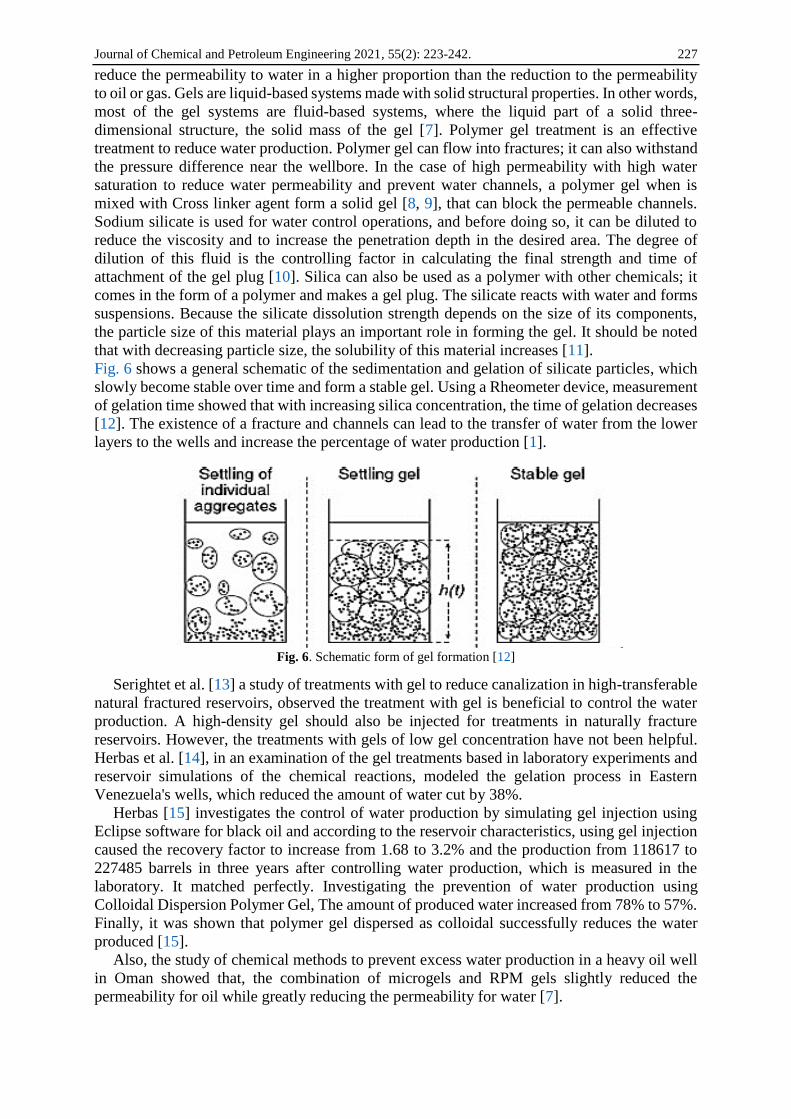
Fig. 6 shows a general schematic of the sedimentation and gelation of silicate particles, which
slowly become stable over time and form a stable gel. Using a Rheometer device, measurement
of gelation time showed that with increasing silica concentration, the time of gelation decreases
[12]. The existence of a fracture and channels can lead to the transfer of water from the lower
layers to the wells and increase the percentage of water production [1].
Fig. 6. Schematic form of gel formation [12]
Serightet et al. [13] a study of treatments with gel to reduce canalization in high-transferable
natural fractured reservoirs, observed the treatment with gel is beneficial to control the water
production. A high-density gel should also be injected for treatments in naturally fracture
reservoirs. However, the treatments with gels of low gel concentration have not been helpful.
Herbas et al. [14], in an examination of the gel treatments based in laboratory experiments and
reservoir simulations of the chemical reactions, modeled the gelation process in Eastern
Venezuela's wells, which reduced the amount of water cut by 38%.
Herbas [15] investigates the control of water production by simulating gel injection using
Eclipse software for black oil and according to the reservoir characteristics, using gel injection
caused the recovery factor to increase from 1.68 to 3.2% and the production from 118617 to
227485 barrels in three years after controlling water production, which is measured in the
laboratory. It matched perfectly. Investigating the prevention of water production using
Colloidal Dispersion Polymer Gel, The amount of produced water increased from 78% to 57%.
Finally, it was shown that polymer gel dispersed as colloidal successfully reduces the water
produced [15].
Also, the study of chemical methods to prevent excess water production in a heavy oil well
in Oman showed that, the combination of microgels and RPM gels slightly reduced the
permeability for oil while greatly reducing the permeability for water [7].

228
The purpose of this project was to help to control excess water production in a well located
in Iran. Using simulation, it was decided to use real data and identify the cause of water
production, and then to control the water produced using thcase-control method. The need to
be addressed and the results to be used for operational implementation.
Model Setting
The reservoirs in the underground have unique characteristics. Some properties may change
during the exploitation of the reservoir, as fluid compositions, pressures, and saturations.
Theoretically, if the correct information describes the characteristics of the reservoir rock
entered the simulation model, a representative history match can be achieved [7]. In this study,
to history match the reservoir numerical model, the oil-water relative permeabilities were
adjusted; initially, a model for an Iranian field was simulated considering the field parameters
obtained from wells data, cores, fluids, etc.
Due to the inconsistency observed initially history matching the production rates, the oil, and
water relative permeability parameter was adapted to the actual production flow by tuning some
water to oil relative permeability. As a result, the model calculated production that matched the
historical production data; hence, it was concluded the tuned model should be able to generate
consistent predictions. This process is described as the history matching.
The field production history and the parameters obtained with the history-matched model
are shown in Figs. 7 and 8.
Fig.7 Oil production history

Journal of Chemical and Petroleum Engineering 2021, 55(2): 223-242. 229
Fig. 8. Oil production diagram of the reservoir in History Matching mode (FOPR on the Y-axis represents the
rate of oil production vs. Time on the X-axis)
You need to mention here if the reservoir pressures were honored in the history match
process.
Relative Permeability Changes for History Matching
According to a sensitivity analysis done to history match the field data, changes in the
discharge flow are more affected by adjusting the relative permeability’s for water and oil, ;
therefore, some adjustments were incorporated before a good history match was achieved.
Before the history matching, the water, oil relative permeability curves are shown in Fig. 9,
and the modified water, oil relative permeability curves are in Fig. 10.
Fig. 9. The relative permeability diagram of the model before history matching
Sw on the X axis represents water saturation and Kro & Krw on the Y axis represent the
relative permeability of oil & water.

230
Fig. 10. The relative permeability diagram of the model after history matching
During the historical adaptation, as shown in Figs. 9 and 10, the relative permeability graph
of the reservoir has changed from oil-wet to water-wet.
Simulation Model
To simulate the gel injection to reduce water production in one of the field wells, a numeric
model was built using the Eclipse simulator, Fig. 11. The sector behaves similarly to the model
obtained from the history matching, due to having the same petro-physical and dynamic
characteristics as the model obtained from the model history matching. Thus, the accuracy and
behavior of the sector will be similar to the whole of the reservoir.
Fig. 11. Schematic Eclipse Model in 3D View
The three-dimensional structure of the model is in the form of tiny layers interstratified. In
some places, there were assigned null values due to the lack of porosity and permeability. The
Dimensions of each block grid are DX 328 ft(L), DY 328 ft (W), DZ 328 ft (H).
Journal of Chemical and Petroleum Engineering 2021, 55(2): 223-242. 231
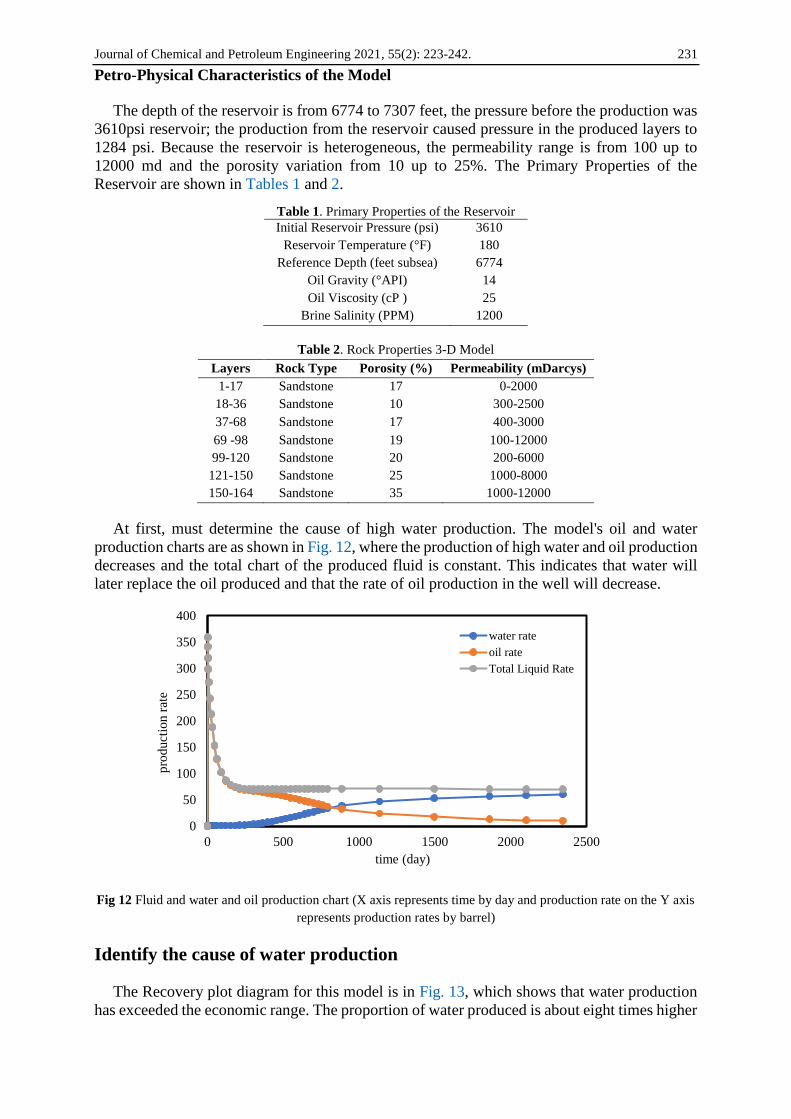
Petro-Physical Characteristics of the Model
The depth of the reservoir is from 6774 to 7307 feet, the pressure before the production was
3610psi reservoir; the production from the reservoir caused pressure in the produced layers to
1284 psi. Because the reservoir is heterogeneous, the permeability range is from 100 up to
12000 md and the porosity variation from 10 up to 25%. The Primary Properties of the
Reservoir are shown in Tables 1 and 2.
Table 1. Primary Properties of the Reservoir
Initial Reservoir Pressure (psi) 3610
Reservoir Temperature (°F) 180
Reference Depth (feet subsea) 6774
Oil Gravity (°API) 14
Oil Viscosity (cP ) 25
Brine Salinity (PPM) 1200
Table 2. Rock Properties 3-D Model
Layers Rock Type Porosity (%) Permeability (mDarcys)
1-17 Sandstone 17 0-2000
18-36 Sandstone 10 300-2500
37-68 Sandstone 17 400-3000
69 -98 Sandstone 19 100-12000
99-120 Sandstone 20 200-6000
121-150 Sandstone 25 1000-8000
150-164 Sandstone 35 1000-12000
At first, must determine the cause of high water production. The model's oil and water
production charts are as shown in Fig. 12, where the production of high water and oil production
decreases and the total chart of the produced fluid is constant. This indicates that water will
later replace the oil produced and that the rate of oil production in the well will decrease.
Fig 12 Fluid and water and oil production chart (X axis represents time by day and production rate on the Y axis
represents production rates by barrel)
Identify the cause of water production
The Recovery plot diagram for this model is in Fig. 13, which shows that water production
has exceeded the economic range. The proportion of water produced is about eight times higher
0
50
100
150
200
250
300
350
400
0 500 1000 1500 2000 2500
pro
duct
ion r
ate
time (day)
water rate
oil rate
Total Liquid Rate

232
than the oil produced. The economical range for the model is defined as the production of water
per barrel of oil produced. That is, the ratio of water to oil is equal to one. By plotting the
Production history plot according to Fig. 14, it can be seen that water production has increased
oil and production has increased over 2300 days of good production, and the model has high
water production.
Fig 13. Recovery plot for model (X axis represents the cumulative production oil and log WOR on the Y axis
represents the logarithm of the ratio of water to the produced oil, respectively)
Fig. 14. Production history plot for model (X axis represents the logarithm of time and log production rate on the
Y axis represents the logarithm of the production rate)
The Decline-curve analysis diagram, as shown in Fig. 15, shows that when production is in
the form of a straight line diagram, the discharge from the reservoir is normal, and when there
is a change in the slope of the graph, it indicates water production.
0.001
0.01
0.1
1
10
0 20000 40000 60000 80000 100000
log W
OR
CUMULATIVE OIL BBL
0.1
1
10
100
1000
1 10 100 1000 10000
log
pro
duct
ion r
ate
log time (day)
oil rate
water rate

Journal of Chemical and Petroleum Engineering 2021, 55(2): 223-242. 233
Fig. 15. Decline-curve analysis for model
By drawing the Chan plot diagram for the model's output data as shown in Fig 16, by drawing
the water-to-oil ratio, the diagram is as follows according to the timing diagram because the
ratio of water to oil has increased rapidly.
Fig. 16. Chan plot for model
Also, by drawing a diagram deriving the ratio of water to oil, the diagram is following Fig.
17, which shows that the reason for water production is related to canalization, and the sudden
chart of Saudi Arabia is due to canalization.
0.1
1
10
100
1000
0 20000 40000 60000 80000 100000
LO
G P
RO
DU
CT
ION
RA
TE
CUMULATIVE OIL BBL
OIL RATE
WATER RATE
0.001
0.01
0.1
1
10
100
1 10 100 1000 10000
log W
OR
log time (day)

234
Fig. 17. Derived from Chan plot for model (X axis represents the logarithm of time and log d(WOR)/dt on the Y
axis represents the logarithm of the ratio of water to oil Vs. Time on X axis)
The canals quickly supply water to the production well, preventing the oil from being swept
away by the water and leaving the oil inside the pores. To observe the flow of channeling in the
model, it is possible to realize the channeling of fluid flow in the model with the help of fluid
flow and fluid saturation. Fig. 18 shows the water saturation of the model that the water flow
chooses the fastest path for the flow and the other areas of the model remain intact, and the
water saturation has increased in the same direction as the water flow.
Fig. 18. Changes in water saturation in the different time steps from the injection well to production well (X axis
represents the water saturation alteration)

Journal of Chemical and Petroleum Engineering 2021, 55(2): 223-242. 235
Fig. 19 shows the oil saturation in the model that the oil saturation has only decreased in the
direction of water flow, and other areas remain intact.
Fig. 19. Changes in oil saturation in the different time step from injection well to production well (X axis
represents the oil saturation alteration)
Gel Treatment
It was modeled a gel treatment to heal the water channels, which were producing high water
cuts. The POLYMER keyword is used in the Eclipse simulation model; the properties of the
gel are according to the following Tables 3 and 4.
Table 3. Polymer Adsorption in the rock as function of concentration
Concentration of Polymer
Absorbed by the Rock (lb/lb)
Polymer Concentration
(lb/stb)
0 0
0 7.01
0.000005 8.011
0.0000051 40
Table 4. Change in polymer viscosity as function of concentration
Rate of Viscosity Change (cps) Polymer Concentration (lb/stb)
1
1 0

236
1.00001
1.00001 40
A flow resistance factor (RRF) of 10,000, was applied, to create high resistance to (against)
water flow. The Fig. 20 shows the injection of the gel and illustrate the gel propagation in the
reservoir (blue is zero gel concentration, and red maximum gel concentration 50 lb/STB). The
gel injection was initiated in the model, at 410 days when the reservoir started water production;
the injection gel rate is 3500 (lb/day) diluted in the injection water, Fig. 21.
Fig. 20. Injection Gel, blocking the cells in the direction of injection wells
Fig. 21. Injectable Polymer Rate (FCIR on the Y axis represents the mass of polymer produced Vs. Time on X
axis)

Journal of Chemical and Petroleum Engineering 2021, 55(2): 223-242. 237
Fig. 22. Bottom hole pressure for injection well (WBHP on the Y axis represents the bottom pressure of the
well)
The bottom hole pressure in the injector well before and after injection of gel, Fig. 22,
showed increases from 1600 to 2000 Psi.
The water cut in the producer well was substantially reduced. That's why if on the 500th day
of production, the injected gel reduces the water production; on the 1400th day of production,
the water cut is 45%, and the gross water cut reduced is 30%, Fig. 23.
Fig. 23. Percentage of water produced before and after gel injection (The FWCT on the Y axis represents the
produced water)
The reason for the decrease in oil before gel injection is the increase in water cut, which
is rapidly transferred to the production well by the channels in the reservoir layers.
The amount of oil in place in the model was decreased before the gel injection and after the
injection of the gel. Because the gel is injected into the pores and canals of the water transducer
and prevents the flow of water in these channels, then the water is forced to pass through other
finer pores and undisturbed areas, which will sweep the oil into untapped areas, which results
in a reduction in water production and an increase in oil production and a reduction in the
amount of oil left underground.
In the case of gel injection, the field oil in place (FOIP) after 2300 days of production
decreases from 300000 barrels for the water injection case to 280000 barrels that mean 20,000
barrels of oil incremental production, Fig. 24.

238
Fig 24. Indicator of the amount of oil in place before and after gel injection (The FOIP on the Y axis represents
the amount of oil in place)
Additionally, and more importantly, the oil production rate will increase by 5% after 2300
days of production, Fig. 25.
Fig. 25. Efficiency of oil produced before and after gel injection (FOE on the Y axis represents the efficiency of
oil production)
Comparing the water produced in the cases of water injection and the gel injection, Fig. 26,
it shows 94,000 barrels of producing water for the water injection and 72,000 barrels of water
for the gel injection that means a total of 22,000 barrels of water production has been reduced.

Journal of Chemical and Petroleum Engineering 2021, 55(2): 223-242. 239
Fig. 26. Compare the water produced before and after gel injection (FWPT on the Y axis represents the rate
of produced water)
The pressure variation, Fig. 27, shows that with increasing fluid production, pore pressure
decreases, with the injection of gel, the pressure graph has increased. The gel is placed inside
the pore instead of water, and it prevents the pore pressure drop and reservoir. The Simulation
results of gel injection on the oil production efficiency and Reduction of water production for
gel injection are according to Tables 5 and 6.
Fig. 27. Chart of reservoir pressure changes before and after gel injection (The FPR on the Y axis represents the
reservoir pressure)
Table 5. Simulation results of gel injection on oil production efficiency
Oil
Recovery%
Oil cumulative
production (bbl.)
Oil in situ
(bbl.)
Injected volume
of gel (bbl.) Well
21% 80000 300000 ------- New well
27% 100000 280000 25550 Gel Injector
6% 20000 Incremental produced oil
Table 6. Reduction of water production for gel injection
Produced Water (bbl.) Injected volume
of gel (bbl.) Well
Gel Injection Water Injection
72000 94000 25550 Gel Injector

240
22000 Reduction in produced water
Gel Injection with different concentrations
The gel was injected at various concentrations of 10, 20, 50, and 100 (lb/STB).Comparing
the efficiency of oil production for these concentrations, it can be seen that increasing the
concentration of injected polymer also increases the oil production efficiency, Fig. 28,
maximum concentration was 100 (lb/STB).
The reason for injecting gels with concentrations of 10, 20, 50 and 100 is to increase the
concentration of the gel step by step to show The higher the concentration of the gel, the greater
its effectiveness due to the large channels in the reservoir.
Fig. 28. Diagram of oil production efficiency for different concentrations (FOE on the Y axis represents the
efficiency of oil production)
The predicted water production rate is different for different gel concentrations. By
increasing the concentration of injectable polymer, the resistance of the gel to flow is increased,
and as a result, the water production rate decreases Fig. 29. The Effect of Different
Concentrations on Water Cut and Production Efficiency is shown in Table 7.

Journal of Chemical and Petroleum Engineering 2021, 55(2): 223-242. 241
Fig. 29. Water Percentage Graph for Different Concentrations (The FWPT on the Y axis represents the total rate
of produced water)
Table. 7 Effect of Different Concentrations on Water Cut and Production Efficiency
Oil recovery
factor (%)
Produced water (bbl) Injected volume
of gel (bbl)
Well and gel
concentration After
Injection Gel
Before
Injection Gel
21% ------- 94000 ------- NEW WELL
22% 89000 94000 25550 Gel inj 10 (lb/stb)
23% 86000 94000 25550 Gel inj 20 (lb/stb)
27% 72000 94000 25550 Gel inj 50 (lb/stb)
29% 60000 94000 25550 Gel inj 100 (lb/stb)
Conclusion
By history matching and changing parameters of reservoir properties, including relative
permeability, we achieved a representative model of the reservoir.
The model made according to the fluid production rate charts has a high water production
compared to oil.
Oil production is done in the model, but then the production of water breaks down rapidly.
As water production increases, oil production decreases, and the fluid outflow rate is higher
than the oil outflow rate.
The problem of water production, according to Chan's diagnostic diagram, is related to
canalization. Because the ratio of water to oil and its derivative has increased rapidly.
According to Chan's diagnostic chart, the problem of water production is related to
channeling. Because the ratio of water to oil and its derivative has increased rapidly.
Depending on the model's fluid saturation and flow direction, the percentage of water
saturation in the direction of flow increases and oil saturation remains constant in other areas.
This is the reason why there is a channel.

242
Gel injection reduces water production and increases oil production. By injecting the gel,
the amount of oil in place dropped from 300,000 barrels to 280,000 barrels after 2,300 days of
production. That means 20,000 barrels of incremental oil are predicted to be produced.
After 1400 days, the percentage of water production has dropped by 30%.
By increasing gel concentration, the rate of water production decreases, and oil production
efficiency increases.
From different gel concentrations modeled, the gel concentration of 100 (lb/STB) showed
the best results.
References
[1] Bailey B, Crabtree M, Tyrie J, Elphick J, Kuchuk F, Romano C, Roodhart L. Water control.
Oilfield review. 2000 Jan;12(1):30-51.
[2] Chan KS. Water control diagnostic plots.1995.
[3] Nawawi H, Al-Shabibi H, Zeybek M, Malik SH. Comprehensive diagnostic and water shut-off
in open and cased hole carbonate horizontal wells. 2012, SPE162287.
[4] Pritchett J, Frampton H, Brinkman J, Cheung S, Morgan J, Chang KT, Williams D, Goodgame
J. Field application of a new in-depth waterflood conformance improvement tool. InSPE
international improved oil recovery conference in Asia Pacific 2003 Oct 20. OnePetro.
[5] Fragachan FE, Robles FC, Gutierrez JJ, Herrera G. Controlling Water Production in Naturally
Fractured Reservoirs with Inorganic Gel. 1996, SPE 35325.
[6] Seright RS, Liang J. A comparison of different types of blocking agents. InSPE European
Formation Damage Conference 1995 May 15. OnePetro.
[7] Dupuis G, Bouillot J, Templier A, Zaitoun A. Successful chemical water shut-off treatment in
an Omani field heavy-oil well. InAbu Dhabi International Petroleum Exhibition and Conference
2015 Nov 9. OnePetro.
[8] Shahab U, Dolan J-D, Chona R-A, Gazi N, Monteiro K, Al-Rubaiyea J, Al- Sharqawi A.
Lessons Learned from the First Openhole Horizontal Well Water Shutoff Job Using Two New
Polymer Systems— A Case History from WafraRatawi Field Kuwait. 2003, SPE 81447.
[9] Miller MJ, Chen KS. Water and gas control gel placement. InSPE Western Regional Meeting
1997 Jun 25. OnePetro.
[10] CEES. Soluble Silicates: Chemical, toxicological, ecological and legal aspects of production,
transport, handling and application: Centre Europeend'Etude des Silicates, 2013.
[11] Hatzignatiou DG, Helleren J, Stavland A. Numerical Evaluation of Dynamic Core-Scale
Experiments of Silicate Gels for Fluid Diversion and Flow-Zone Isolation. SPE Production &
Operations. 2014 May 15;29(02):122-38.
[12] Metin CO, Rankin KM, Nguyen QP. Phase behavior and rheological characterization of silica
nanoparticle gel. Applied Nanoscience. 2014 Jan;4(1):93-101.
[13] Seright RS, Lee RL. Gel treatments for reducing channeling in naturally fractured reservoirs.
SPE Production & Facilities. 1999 Nov 1;14(04):269-76.
[14] Lashari ZA, Memon A, Ansari U, Memon HU, Tunio AH. Simulating the Effects of Water
Shut-off Treatment by Polymer Gel Injection. InPAPG/SPE Pakistan section Annual Technical
Conference 2014 Nov 24. OnePetro.
[15] Mattax CC, Dalton RL. Reservoir Simulation. 1990, SPE 21606 and 21620.
How to cite: Shabibi M, Sahraei E. Identification of Water Production Mechanism in One
of Iran’s Oil Fields and Treat it with Gel Injection. Journal of Chemical and Petroleum
Engineering. 2021; 55(2): 223-242.