Embed Size (px)
Citation preview
Identification of ten loci associated with height highlightsnew biological pathways in human growthGuillaume Lettre1,2, Anne U Jackson3,25, Christian Gieger4,5,25, Fredrick R Schumacher6,7,25, Sonja I Berndt8,25,Serena Sanna3,9,25, Susana Eyheramendy4,5, Benjamin F Voight1,10, Johannah L Butler2, Candace Guiducci1,Thomas Illig4, Rachel Hackett1, Iris M Heid4,5, Kevin B Jacobs11, Valeriya Lyssenko12, Manuela Uda9,The Diabetes Genetics Initiative24, FUSION24, KORA24, The Prostate, Lung Colorectal and Ovarian CancerScreening Trial24, The Nurses’ Health Study24, SardiNIA24, Michael Boehnke3, Stephen J Chanock13,Leif C Groop12,14, Frank B Hu6,7,15, Bo Isomaa16,17, Peter Kraft7, Leena Peltonen1,18,19, Veikko Salomaa20,David Schlessinger21, David J Hunter1,6,7,15, Richard B Hayes8, Goncalo R Abecasis3, H-Erich Wichmann4,5,Karen L Mohlke22 & Joel N Hirschhorn1,2,23
Height is a classic polygenic trait, reflecting the combined influence of multiple as-yet-undiscovered genetic factors. We carriedout a meta-analysis of genome-wide association study data of height from 15,821 individuals at 2.2 million SNPs, and followed upthe strongest findings in 410,000 subjects. Ten newly identified and two previously reported loci were strongly associated withvariation in height (P values from 4 � 10�7 to 8 � 10�22). Together, these 12 loci account for B2% of the population variationin height. Individuals with r8 height-increasing alleles and Z16 height-increasing alleles differ in height by B3.5 cm. The newlyidentified loci, along with several additional loci with strongly suggestive associations, encompass both strong biologicalcandidates and unexpected genes, and highlight several pathways (let-7 targets, chromatin remodeling proteins and Hedgehogsignaling) as important regulators of human stature. These results expand the picture of the biological regulation of human heightand of the genetic architecture of this classical complex trait.
The advent of genome-wide association studies1, made possibleby knowledge gained from the HapMap Consortium2 and recentadvances in genome-wide genotyping technologies and analyticmethods, have had a dramatic impact on the field of human genetics.Recent genome-wide studies have led to the identification of commongenetic variants reproducibly associated with complex human dis-eases3. Genome-wide association (GWA) studies have also been used
successfully to identify genetic variation associated with quantitativetraits, such as lipid levels4 and body mass index5,6. These dis-coveries, through the identification of previously unknown and oftenunanticipated genes, have opened an exciting period in the study ofhuman complex traits and common diseases.
The small effect sizes that have characterized most of the variantsrecently identified present a challenge to the study of polygenic
Received 15 November 2007; accepted 12 February 2008; published online 6 April 2008; doi:10.1038/ng.125
1Program in Medical and Population Genetics, Broad Institute of MIT and Harvard, Cambridge, Massachusetts 02142, USA. 2Divisions of Genetics and Endocrinologyand Program in Genomics, Children’s Hospital, Boston, Massachusetts 02115, USA. 3Center for Statistical Genetics, Department of Biostatistics, University ofMichigan, Ann Arbor, Michigan 48109, USA. 4Institute of Epidemiology, GSF National Research Center for Environment and Health, 85764 Neuherberg, Germany.5Department of Epidemiology, Institute of Medical Informatics, Biometry and Epidemiology, University of Munich, 81377 Munich, Germany. 6Channing Laboratory,Department of Medicine, Brigham and Women’s Hospital and Harvard Medical School, Boston, Massachusetts 02115, USA. 7Program in Molecular and GeneticEpidemiology, Department of Epidemiology, Harvard School of Public Health, Boston, Massachusetts, USA. 8Occupational and Environmental Epidemiology Branch,Division of Cancer Epidemiology and Genetics, National Cancer Institute (NCI), National Institutes of Health (NIH), Department of Health and Human Services (DHHS),Bethesda, Maryland 20892, USA. 9Istituto di Neurogenetica e Neurofarmacologia (INN), Consiglio Nazionale delle Ricerche, c/o Cittadella Universitaria di Monserrato,Monserrato, Cagliari 09042, Italy. 10Center for Human Genetic Research, Massachusetts General Hospital, Boston, Massachusetts 02114, USA. 11BioinformedConsulting Services, Gaithersburg, Maryland 20877, USA. 12Department of Clinical Sciences, Diabetes and Endocrinology, University Hospital Malmo, LundUniversity, 205 02 Malmo, Sweden. 13Laboratory of Translational Genomics, Division of Cancer Epidemiology and Genetics, NCI, NIH, DHHS, Bethesda, Maryland20892, USA. 14Department of Medicine, Helsinki University Central Hospital, and Research Program for Molecular Medicine, University of Helsinki, Helsinki, Finland.15Department of Nutrition, Harvard School of Public Health, Boston, Massachusetts, USA. 16Malmska Municipal Health Center and Hospital, Jakobstad, Finland.17Folkhalsan Research Center, Helsinki, Finland. 18Wellcome Trust Sanger Institute, Hinxton CB10 1SA, UK. 19Department of Molecular Medicine, National PublicHealth Institute and Department of Medical Genetics, University of Helsinki, FI-00014 Helsinki, Finland. 20Department of Epidemiology and Health Promotion.National Public Health Institute, FI-00300 Helsinki, Finland. 21Gerontology Research Center, National Institute on Aging, 5600 Nathan Shock Drive, Baltimore,Maryland 21224, USA. 22Department of Genetics, University of North Carolina, Chapel Hill, North Carolina 27599, USA. 23Department of Genetics, Harvard MedicalSchool, Boston, Massachusetts 02115, USA. 24A full list of authors and affiliations appears in the Supplementary Note online. 25These authors contributed equally tothis work. Correspondence should be addressed to J.N.H. ([email protected]).
5 84 VOLUME 40 [ NUMBER 5 [ MAY 2008 NATURE GENETICS
ART I C LES©
2008
Nat
ure
Pub
lishi
ng G
roup
ht
tp://
ww
w.n
atur
e.co
m/n
atur
egen
etic
s
diseases and traits, as large sample sizes have generally been requiredto identify associated common variants. It is not yet known whetherincreasing sample size further will accelerate the pace of discovery, andto what extent multiple loci with modest effect will reveal previouslyunsuspected biological pathways. To begin to answer these importantquestions, we used adult height as a model phenotype. Adult height isa complex trait with high heritability (h2 B0.8–0.9 within individualpopulations)7,8. Furthermore, height is accurately measured andrelatively stable over a large part of the lifespan9, and data is availablefor very large numbers of individuals. Thus, the study of height is anideal opportunity to dissect the architecture of a highly polygenic traitin humans. In addition, because height is associated with severalcommon human diseases (for example, cancers)10, loci associatedwith height may be pleiotropic, influencing the risk or severityof other diseases11.
Using data from GWA studies, we and our colleagues identified thefirst two common variants to be robustly associated with adult heightvariation: a SNP in the 3¢ UTR of the HMGA2 gene12 and a SNP at theGDF5-UQCC locus11. The overall variation in height explained bythese two polymorphisms is small (0.3–0.7% of the total variance),suggesting that most common variants that influence height will havea small effect. The modest effects observed also highlight the impor-tance of using large datasets to identify ‘true’ stature variants: theHMGA2 SNP was first found in a combined analysis of the DGI andWellcome Trust Case Control Consortium UKT2D datasets (n ¼4,921 individuals), and the GDF5-UQCC finding was identifiedinitially in an analysis of the SardiNIA and FUSION results(n ¼ 6,669 individuals). As these findings are likely to be amongthe upper range of effect sizes for common variants associated withheight, we considered the likely possibility that progressively largersample sizes would be required to identify additional height loci.
Encouraged by these earlier successes, we proceeded to carry out alarger meta-analysis of six GWA datasets, including height associationresults for 15,821 individuals at B2.2 million SNPs, to find additionalloci associated with height. Here we report the identification and
validation of ten newly identified associations between common SNPsand height variation (each with P o 5 � 10�7), and an additionalfour associations with strongly suggestive evidence (each with P o 5� 10�6). We also confirm the two previously reported associations(HMGA2 and GDF5-UQCC). The newly identified loci associatedwith height implicate several biological pathways or gene sets—including targets of the let-7 microRNA, chromatin remodelingproteins and Hedgehog signaling—as important regulators ofhuman stature. Finally, we examine the interaction with gender, testfor epistatic interactions between loci, and estimate the explanatorypower of each locus individually and in combination. These resultsbroaden our understanding of the biological regulation of humangrowth and set the stage for further genetic analysis of this classicalcomplex trait.
RESULTSIdentification of loci associated with heightWe carried out a meta-analysis of GWA data for height that included15,821 individuals from six studies: two type 2 diabetes case-controldatasets (DGI4, n ¼ 2,978; FUSION13, n ¼ 2,371), two nested cancercase-control datasets (NHS14, n ¼ 2,286; PLCO15, n ¼ 2,244) and twodatasets from population-based cohorts (KORA16, n ¼ 1,644; Sardi-NIA17, n ¼ 4,305)(Supplementary Table 1 online). All participantswere of European ancestry. Because genome-wide genotyping in thesestudies was done on different platforms (Affymetrix 500K for DGI,KORA, and SardiNIA, Illumina 317K for FUSION and Illumina 550Kfor NHS and PLCO), we imputed genotypes for all polymorphicmarkers in the HapMap Phase II CEU reference panel in each GWAscan using the program MACH (Y. Li and G.R.A., unpublished data),thereby generating compatible datasets of 2,260,683 autosomal SNPs.Adult height was tested for association with these SNPs in each studyunder an additive genetic model, and association results were com-bined by meta-analysis using a weighted Z-score method (Methods).Whereas the distribution of test statistics for each individual GWAstudy was consistent with the expectation under the null hypothesis
7 DGIa b c d
e f
FUSION KORA
PLCO SardiNIA
NHS
6
5
4
Obs
erve
d –l
og10
(P v
alue
)
3
2
1
00 1 2
Expected –log10(P value)
3 4 5 6 7
7
6
5
4
Obs
erve
d –l
og10
(P v
alue
)
3
2
1
00 1 2
Expected –log10(P value)
3 4 5 6 7
7
6
5
4
Obs
erve
d –l
og10
(P v
alue
)
3
2
1
00 1 2
Expected –log10(P value)
3 4 5 6 7
7
6
5
4
Obs
erve
d –l
og10
(P v
alue
)
3
2
1
00 1 2
Expected –log10(P value)
3 4 5 6 7
7
6
5
4
Obs
erve
d –l
og10
(P v
alue
)
3
2
1
00 1 2
Expected –log10(P value)
3 4 5 6 7
7
6
5
4
Obs
erve
d –l
og10
(P v
alue
)
3
2
1
00 1 2
Expected –log10(P value)
3 4 5 6 7
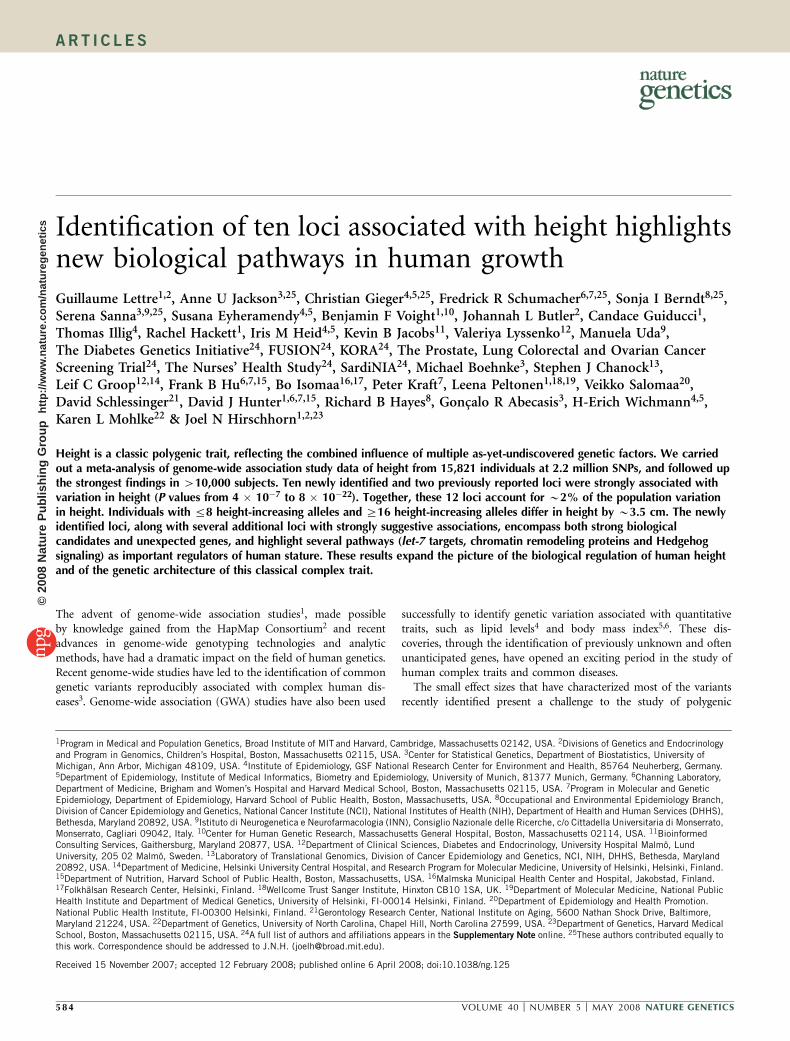
Figure 1 Quantile-quantile plot of B2.2 million SNPs for each of the
six genome-wide association scans meta-analyzed. (a) DGI (n ¼ 2,978).
(b) FUSION (n ¼ 2,371). (c) KORA (n ¼ 1,644). (d) NHS (n ¼ 2,286).
(e) PLCO (n ¼ 2,244). (f) SardiNIA (n ¼ 4,305). Each black circle
represents an observed statistic (defined as the –log10(P)) versus the
corresponding expected statistic. The gray line corresponds to the
null distribution.
NATURE GENETICS VOLUME 40 [ NUMBER 5 [ MAY 2008 58 5
ART I C LES©
2008
Nat
ure
Pub
lishi
ng G
roup
ht
tp://
ww
w.n
atur
e.co
m/n
atur
egen
etic
s
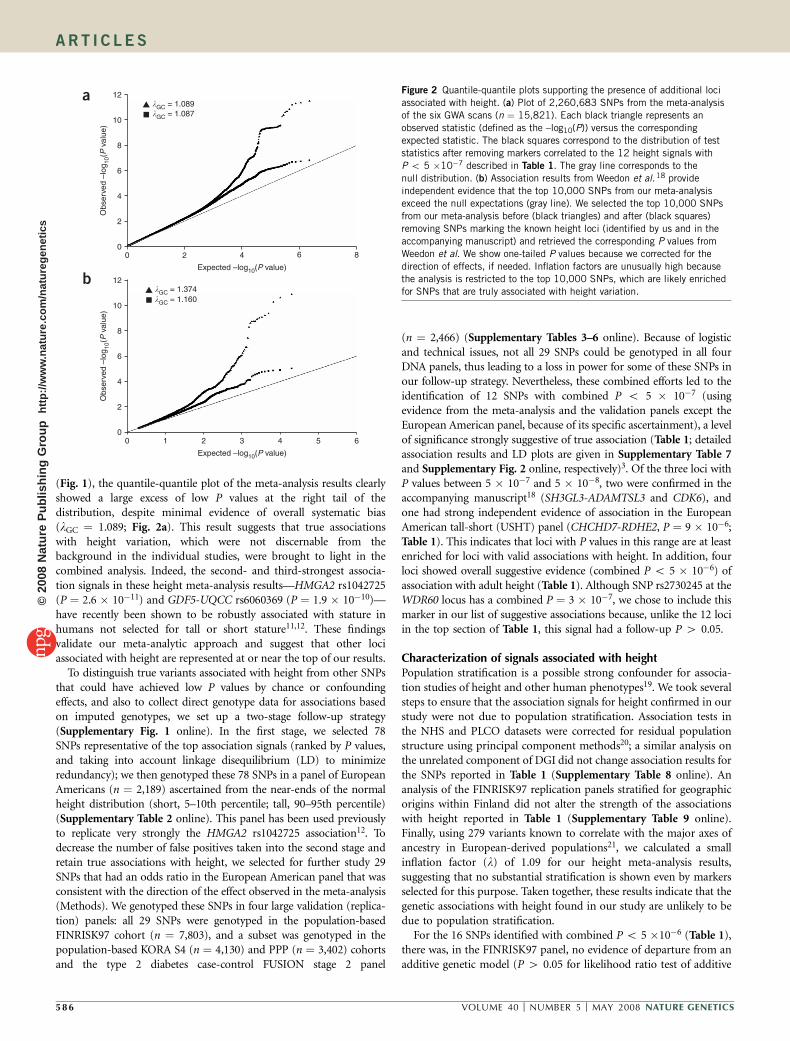
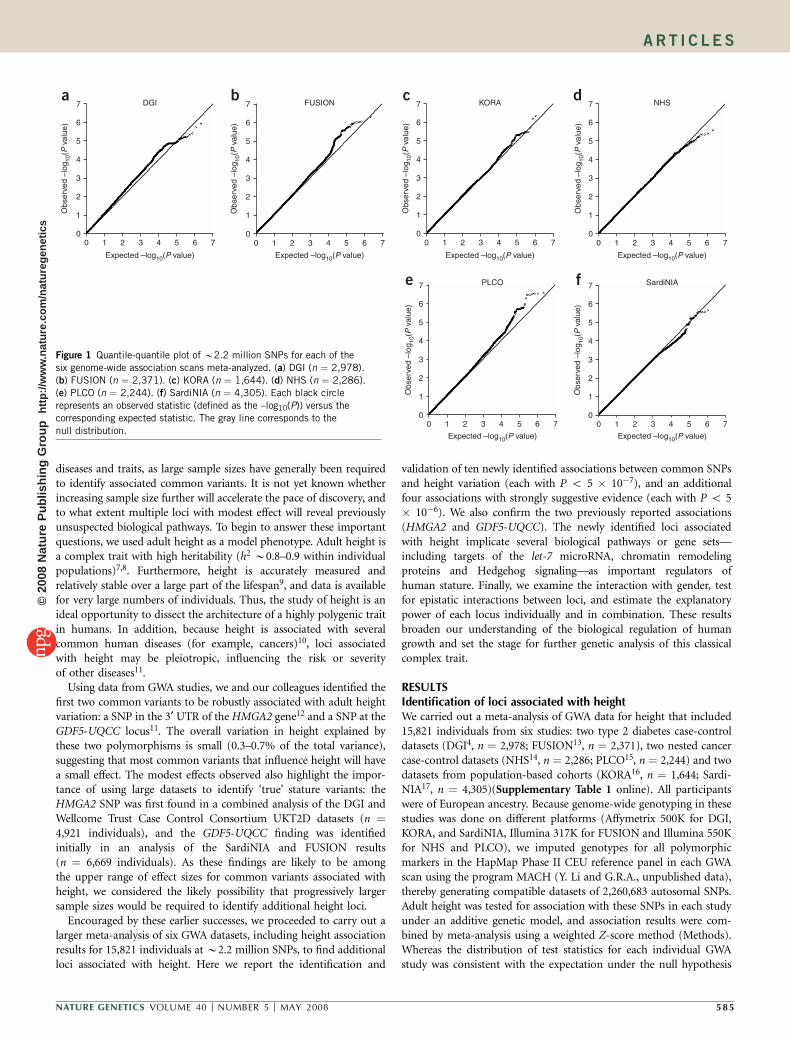
(Fig. 1), the quantile-quantile plot of the meta-analysis results clearlyshowed a large excess of low P values at the right tail of thedistribution, despite minimal evidence of overall systematic bias(lGC ¼ 1.089; Fig. 2a). This result suggests that true associationswith height variation, which were not discernable from thebackground in the individual studies, were brought to light in thecombined analysis. Indeed, the second- and third-strongest associa-tion signals in these height meta-analysis results—HMGA2 rs1042725(P ¼ 2.6 � 10�11) and GDF5-UQCC rs6060369 (P ¼ 1.9 � 10�10)—have recently been shown to be robustly associated with stature inhumans not selected for tall or short stature11,12. These findingsvalidate our meta-analytic approach and suggest that other lociassociated with height are represented at or near the top of our results.
To distinguish true variants associated with height from other SNPsthat could have achieved low P values by chance or confoundingeffects, and also to collect direct genotype data for associations basedon imputed genotypes, we set up a two-stage follow-up strategy(Supplementary Fig. 1 online). In the first stage, we selected 78SNPs representative of the top association signals (ranked by P values,and taking into account linkage disequilibrium (LD) to minimizeredundancy); we then genotyped these 78 SNPs in a panel of EuropeanAmericans (n ¼ 2,189) ascertained from the near-ends of the normalheight distribution (short, 5–10th percentile; tall, 90–95th percentile)(Supplementary Table 2 online). This panel has been used previouslyto replicate very strongly the HMGA2 rs1042725 association12. Todecrease the number of false positives taken into the second stage andretain true associations with height, we selected for further study 29SNPs that had an odds ratio in the European American panel that wasconsistent with the direction of the effect observed in the meta-analysis(Methods). We genotyped these SNPs in four large validation (replica-tion) panels: all 29 SNPs were genotyped in the population-basedFINRISK97 cohort (n ¼ 7,803), and a subset was genotyped in thepopulation-based KORA S4 (n ¼ 4,130) and PPP (n ¼ 3,402) cohortsand the type 2 diabetes case-control FUSION stage 2 panel
(n ¼ 2,466) (Supplementary Tables 3–6 online). Because of logisticand technical issues, not all 29 SNPs could be genotyped in all fourDNA panels, thus leading to a loss in power for some of these SNPs inour follow-up strategy. Nevertheless, these combined efforts led to theidentification of 12 SNPs with combined P o 5 � 10�7 (usingevidence from the meta-analysis and the validation panels except theEuropean American panel, because of its specific ascertainment), a levelof significance strongly suggestive of true association (Table 1; detailedassociation results and LD plots are given in Supplementary Table 7and Supplementary Fig. 2 online, respectively)3. Of the three loci withP values between 5 � 10�7 and 5 � 10�8, two were confirmed in theaccompanying manuscript18 (SH3GL3-ADAMTSL3 and CDK6), andone had strong independent evidence of association in the EuropeanAmerican tall-short (USHT) panel (CHCHD7-RDHE2, P ¼ 9 � 10�6;Table 1). This indicates that loci with P values in this range are at leastenriched for loci with valid associations with height. In addition, fourloci showed overall suggestive evidence (combined P o 5 � 10�6) ofassociation with adult height (Table 1). Although SNP rs2730245 at theWDR60 locus has a combined P ¼ 3 � 10�7, we chose to include thismarker in our list of suggestive associations because, unlike the 12 lociin the top section of Table 1, this signal had a follow-up P 4 0.05.
Characterization of signals associated with heightPopulation stratification is a possible strong confounder for associa-tion studies of height and other human phenotypes19. We took severalsteps to ensure that the association signals for height confirmed in ourstudy were not due to population stratification. Association tests inthe NHS and PLCO datasets were corrected for residual populationstructure using principal component methods20; a similar analysis onthe unrelated component of DGI did not change association results forthe SNPs reported in Table 1 (Supplementary Table 8 online). Ananalysis of the FINRISK97 replication panels stratified for geographicorigins within Finland did not alter the strength of the associationswith height reported in Table 1 (Supplementary Table 9 online).Finally, using 279 variants known to correlate with the major axes ofancestry in European-derived populations21, we calculated a smallinflation factor (l) of 1.09 for our height meta-analysis results,suggesting that no substantial stratification is shown even by markersselected for this purpose. Taken together, these results indicate that thegenetic associations with height found in our study are unlikely to bedue to population stratification.
For the 16 SNPs identified with combined P o 5 �10�6 (Table 1),there was, in the FINRISK97 panel, no evidence of departure from anadditive genetic model (P 4 0.05 for likelihood ratio test of additive
12a
b
10
8
Obs
erve
d –l
og10
(P v
alue
)
6
6 8
4
4
2
20
12
10
8
Obs
erve
d –l
og10
(P v
alue
)
6
4
2
0
0
Expected –log10(P value)
5 63 41 20
Expected –log10(P value)
�GC = 1.089�GC = 1.087
�GC = 1.374�GC = 1.160
Figure 2 Quantile-quantile plots supporting the presence of additional loci
associated with height. (a) Plot of 2,260,683 SNPs from the meta-analysis
of the six GWA scans (n ¼ 15,821). Each black triangle represents an
observed statistic (defined as the –log10(P)) versus the corresponding
expected statistic. The black squares correspond to the distribution of test
statistics after removing markers correlated to the 12 height signals with
P o 5 �10�7 described in Table 1. The gray line corresponds to the
null distribution. (b) Association results from Weedon et al.18 provide
independent evidence that the top 10,000 SNPs from our meta-analysis
exceed the null expectations (gray line). We selected the top 10,000 SNPs
from our meta-analysis before (black triangles) and after (black squares)
removing SNPs marking the known height loci (identified by us and in the
accompanying manuscript) and retrieved the corresponding P values from
Weedon et al. We show one-tailed P values because we corrected for the
direction of effects, if needed. Inflation factors are unusually high becausethe analysis is restricted to the top 10,000 SNPs, which are likely enriched
for SNPs that are truly associated with height variation.
5 86 VOLUME 40 [ NUMBER 5 [ MAY 2008 NATURE GENETICS
ART I C LES©
2008
Nat
ure
Pub
lishi
ng G
roup
ht
tp://
ww
w.n
atur
e.co
m/n
atur
egen
etic
s
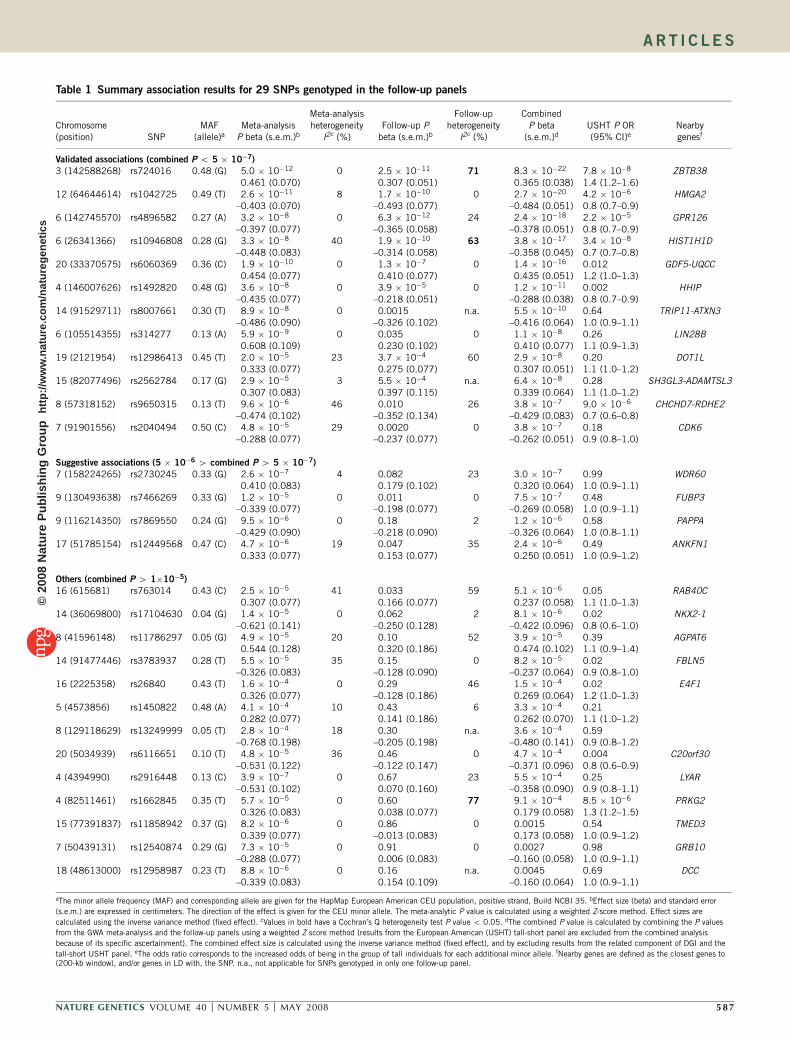
Table 1 Summary association results for 29 SNPs genotyped in the follow-up panels
Chromosome(position) SNP
MAF(allele)a
Meta-analysisP beta (s.e.m.)b
Meta-analysisheterogeneity
I2c (%)Follow-up P
beta (s.e.m.)b
Follow-upheterogeneity
I2c (%)
CombinedP beta
(s.e.m.)dUSHT P OR(95% CI)e
Nearbygenesf
Validated associations (combined P o 5 � 10�7)
3 (142588268) rs724016 0.48 (G) 5.0 � 10�12 0 2.5 � 10�11 71 8.3 � 10�22 7.8 � 10�8 ZBTB380.461 (0.070) 0.307 (0.051) 0.365 (0.038) 1.4 (1.2–1.6)
12 (64644614) rs1042725 0.49 (T) 2.6 � 10�11 8 1.7 � 10�10 0 2.7 � 10�20 4.2 � 10�6 HMGA2–0.403 (0.070) –0.493 (0.077) –0.484 (0.051) 0.8 (0.7–0.9)
6 (142745570) rs4896582 0.27 (A) 3.2 � 10�8 0 6.3 � 10�12 24 2.4 � 10�18 2.2 � 10�5 GPR126–0.397 (0.077) –0.365 (0.058) –0.378 (0.051) 0.8 (0.7–0.9)
6 (26341366) rs10946808 0.28 (G) 3.3 � 10�8 40 1.9 � 10�10 63 3.8 � 10�17 3.4 � 10�8 HIST1H1D–0.448 (0.083) –0.314 (0.058) –0.358 (0.045) 0.7 (0.7–0.8)
20 (33370575) rs6060369 0.36 (C) 1.9 � 10�10 0 1.3 � 10�7 0 1.4 � 10�16 0.012 GDF5-UQCC0.454 (0.077) 0.410 (0.077) 0.435 (0.051) 1.2 (1.0–1.3)
4 (146007626) rs1492820 0.48 (G) 3.6 � 10�8 0 3.9 � 10�5 0 1.2 � 10�11 0.002 HHIP–0.435 (0.077) –0.218 (0.051) –0.288 (0.038) 0.8 (0.7–0.9)
14 (91529711) rs8007661 0.30 (T) 8.9 � 10�8 0 0.0015 n.a. 5.5 � 10�10 0.64 TRIP11-ATXN3–0.486 (0.090) –0.326 (0.102) –0.416 (0.064) 1.0 (0.9–1.1)
6 (105514355) rs314277 0.13 (A) 5.9 � 10�9 0 0.035 0 1.1 � 10�8 0.26 LIN28B0.608 (0.109) 0.230 (0.102) 0.410 (0.077) 1.1 (0.9–1.3)
19 (2121954) rs12986413 0.45 (T) 2.0 � 10�5 23 3.7 � 10�4 60 2.9 � 10�8 0.20 DOT1L0.333 (0.077) 0.275 (0.077) 0.307 (0.051) 1.1 (1.0–1.2)
15 (82077496) rs2562784 0.17 (G) 2.9 � 10�5 3 5.5 � 10�4 n.a. 6.4 � 10�8 0.28 SH3GL3-ADAMTSL30.307 (0.083) 0.397 (0.115) 0.339 (0.064) 1.1 (1.0–1.2)
8 (57318152) rs9650315 0.13 (T) 9.6 � 10�6 46 0.010 26 3.8 � 10�7 9.0 � 10�6 CHCHD7-RDHE2–0.474 (0.102) –0.352 (0.134) –0.429 (0.083) 0.7 (0.6–0.8)
7 (91901556) rs2040494 0.50 (C) 4.8 � 10�5 29 0.0020 0 3.8 � 10�7 0.18 CDK6–0.288 (0.077) –0.237 (0.077) –0.262 (0.051) 0.9 (0.8–1.0)
Suggestive associations (5 � 10�6 4 combined P 4 5 � 10�7)
7 (158224265) rs2730245 0.33 (G) 2.6 � 10�7 4 0.082 23 3.0 � 10�7 0.99 WDR600.410 (0.083) 0.179 (0.102) 0.320 (0.064) 1.0 (0.9–1.1)
9 (130493638) rs7466269 0.33 (G) 1.2 � 10�5 0 0.011 0 7.5 � 10�7 0.48 FUBP3–0.339 (0.077) –0.198 (0.077) –0.269 (0.058) 1.0 (0.9–1.1)
9 (116214350) rs7869550 0.24 (G) 9.5 � 10�6 0 0.18 2 1.2 � 10�6 0.58 PAPPA–0.429 (0.090) –0.218 (0.090) –0.326 (0.064) 1.0 (0.8–1.1)
17 (51785154) rs12449568 0.47 (C) 4.7 � 10�6 19 0.047 35 2.4 � 10�6 0.49 ANKFN10.333 (0.077) 0.153 (0.077) 0.250 (0.051) 1.0 (0.9–1.2)
Others (combined P 4 1�10�5)
16 (615681) rs763014 0.43 (C) 2.5 � 10�5 41 0.033 59 5.1 � 10�6 0.05 RAB40C0.307 (0.077) 0.166 (0.077) 0.237 (0.058) 1.1 (1.0–1.3)
14 (36069800) rs17104630 0.04 (G) 1.4 � 10�5 0 0.062 2 8.1 � 10�6 0.02 NKX2-1–0.621 (0.141) –0.250 (0.128) –0.422 (0.096) 0.8 (0.6–1.0)
8 (41596148) rs11786297 0.05 (G) 4.9 � 10�5 20 0.10 52 3.9 � 10�5 0.39 AGPAT60.544 (0.128) 0.320 (0.186) 0.474 (0.102) 1.1 (0.9–1.4)
14 (91477446) rs3783937 0.28 (T) 5.5 � 10�5 35 0.15 0 8.2 � 10�5 0.02 FBLN5–0.326 (0.083) –0.128 (0.090) –0.237 (0.064) 0.9 (0.8–1.0)
16 (2225358) rs26840 0.43 (T) 1.6 � 10�4 0 0.29 46 1.5 � 10�4 0.02 E4F10.326 (0.077) –0.128 (0.186) 0.269 (0.064) 1.2 (1.0–1.3)
5 (4573856) rs1450822 0.48 (A) 4.1 � 10�4 10 0.43 6 3.3 � 10�4 0.210.282 (0.077) 0.141 (0.186) 0.262 (0.070) 1.1 (1.0–1.2)
8 (129118629) rs13249999 0.05 (T) 2.8 � 10�4 18 0.30 n.a. 3.6 � 10�4 0.59–0.768 (0.198) –0.205 (0.198) –0.480 (0.141) 0.9 (0.8–1.2)
20 (5034939) rs6116651 0.10 (T) 4.8 � 10�5 36 0.46 0 4.7 � 10�4 0.004 C20orf30–0.531 (0.122) –0.122 (0.147) –0.371 (0.096) 0.8 (0.6–0.9)
4 (4394990) rs2916448 0.13 (C) 3.9 � 10�7 0 0.67 23 5.5 � 10�4 0.25 LYAR–0.531 (0.102) 0.070 (0.160) –0.358 (0.090) 0.9 (0.8–1.1)
4 (82511461) rs1662845 0.35 (T) 5.7 � 10�5 0 0.60 77 9.1 � 10�4 8.5 � 10�6 PRKG20.326 (0.083) 0.038 (0.077) 0.179 (0.058) 1.3 (1.2–1.5)
15 (77391837) rs11858942 0.37 (G) 8.2 � 10�6 0 0.86 0 0.0015 0.54 TMED30.339 (0.077) –0.013 (0.083) 0.173 (0.058) 1.0 (0.9–1.2)
7 (50439131) rs12540874 0.29 (G) 7.3 � 10�5 0 0.91 0 0.0027 0.98 GRB10–0.288 (0.077) 0.006 (0.083) –0.160 (0.058) 1.0 (0.9–1.1)
18 (48613000) rs12958987 0.23 (T) 8.8 � 10�6 0 0.16 n.a. 0.0045 0.69 DCC–0.339 (0.083) 0.154 (0.109) –0.160 (0.064) 1.0 (0.9–1.1)
aThe minor allele frequency (MAF) and corresponding allele are given for the HapMap European American CEU population, positive strand, Build NCBI 35. bEffect size (beta) and standard error
(s.e.m.) are expressed in centimeters. The direction of the effect is given for the CEU minor allele. The meta-analytic P value is calculated using a weighted Z-score method. Effect sizes are
calculated using the inverse variance method (fixed effect). cValues in bold have a Cochran’s Q heterogeneity test P value o 0.05. dThe combined P value is calculated by combining the P values
from the GWA meta-analysis and the follow-up panels using a weighted Z score method (results from the European American (USHT) tall-short panel are excluded from the combined analysis
because of its specific ascertainment). The combined effect size is calculated using the inverse variance method (fixed effect), and by excluding results from the related component of DGI and the
tall-short USHT panel. eThe odds ratio corresponds to the increased odds of being in the group of tall individuals for each additional minor allele. fNearby genes are defined as the closest genes to(200-kb window), and/or genes in LD with, the SNP. n.a., not applicable for SNPs genotyped in only one follow-up panel.
NATURE GENETICS VOLUME 40 [ NUMBER 5 [ MAY 2008 58 7
ART I C LES©
2008
Nat
ure
Pub
lishi
ng G
roup
ht
tp://
ww
w.n
atur
e.co
m/n
atur
egen
etic
s

versus unconstrained two degree-of-freedom test), no significantdifference in effect size between males and females (P 4 0.05), andno strong epistatic interactions between loci (the most significantinteraction was observed between SNP rs1492820 and SNPrs10946808 (P ¼ 0.001), which is not significant after correcting forthe 120 pairwise tests of interaction done).
Explanatory power of loci associated with heightEach of the common height SNPs reported here explains a smallfraction of the residual phenotypic variation in height (0.1–0.8%;Supplementary Table 7). When analyzed together, the additive effectsof the 12 SNPs with combined P o 5 � 10�7 only contribute 2.0% ofthe height variation in the FINRISK97 panel, far from the estimatedB80–90% attributable to genetic variation. To assess the cumulativepredictive value of this initial set of variants, we created a ‘height score’by counting the number of height-increasing alleles (12 SNPs; heightscore 0–24) in each participant with complete genotype for these12 SNPs in the FINRISK97 panel (n ¼ 7,566). On average, males andfemales with r8 ‘tall’ alleles (4.7% of FINRISK97) are 3.5 cm and3.6 cm shorter than males and females with Z16 ‘tall’ alleles (7.1% ofFINRISK97), respectively (Fig. 3). Individual effect sizes range from0.3 cm per T allele for CDK6 rs2040494 to 0.5 cm per C allele forHMGA2 rs1042725 (Table 1).
DISCUSSIONSome of the SNPs reported here fall in or near strong candidateheight genes, such as the recently described associations with HMGA2(ref. 12) and GDF5-UQCC11, whereas others identify previouslyunsuspected loci. Together, these associations highlight biologicalpathways that are important in regulating human growth.
Hedgehog-interacting protein (HHIP; rs1492820) is a transcrip-tional target and an antagonist of Hedgehog signaling; it binds withhigh affinity to the three mammalian Hedgehog proteins22. Themouse homolog, Hhip, is expressed in the perichondrium, includingregions flanking Indian hedgehog (Ihh) expression in the appendicularand axial skeleton. Ectopic overexpression of Hhip in mouse cartilagecauses severe skeletal defects, including short-limbed dwarfism, afeature reminiscent of the phenotype observed in Ihh null mice22,23.
We identified several associated SNPs in or near genes related tochromatin structure. In addition to HMGA2, which encodes achromatin-binding protein, we found associations with a SNP(rs10946808) in a histone cluster on chromosome 6, a SNP(rs12986413) in the histone methyltransferase DOT1L gene and aSNP (rs724016) in an intron of the methyl-DNA–binding transcrip-tional repressor gene ZBTB38. It is currently unclear how geneticvariation at these loci modulate height, but there is a precedent for aconnection between regulation of chromatin structure and stature:Sotos syndrome (MIM117550), characterized by extreme tall stature,is caused by mutations and deletions in the histone methyltransferasegene NSD1. It would be interesting to test whether the height variantsat HMGA2, the chromosome 6 histone cluster, DOT1L and ZBTB38modify clinical outcome in Sotos syndrome, or whether severemutations in these genes, particularly DOT1L, could cause a Sotossyndrome–like phenotype.
That the variant rs1042725, strongly associated with adult andchildhood height12, falls in the 3¢ UTR of HMGA2 is notable in partbecause HMGA2 is the human gene with the greatest number ofvalidated let-7 microRNA binding sites24,25. In fact, rs1042725 is 13base pairs away from a let-7 site, suggesting a possible mechanism ofaction whereby the SNP alters microRNA binding and thereforeexpression of HMGA2. When we examined our list of 12 heightloci, we were somewhat surprised to find three additional previouslydescribed targets of let-7: the cell cycle regulator CDK6 (ref. 26), thehistone methyltransferase DOT1L27 and the gene LIN28B28. PAPPA, alocus with a combined P ¼ 1.2 � 10�6 in our study, also contains apredicted let-7 binding site27. Thus, genes that influence height seemto be enriched for validated or potential let-7 targets: 5 of the 16(31%) confirmed or suggestive loci associated with height have let-7binding sites, compared with 2% of the genes in the human genome(Fisher’s exact test P ¼ 3 � 10�5). Because microRNAs can co-regulate genes involved in the same biological process, it will beinteresting to test whether the other targets of let-7, or let-7 itself, areregulators of adult height.
There were also noteworthy candidate genes among the variantsthat showed strong but as yet less conclusive levels of significance forassociation with height in our meta-analysis of GWA studies andreplication cohorts. A SNP 28 kb upstream of PRKG2 (rs1662845),which encodes the cGMP-dependent protein kinase II (cGKII),showed strong association with height in our meta-analysis of GWAscans (P ¼ 5.7 � 10�5), and in the same direction in the EuropeanAmerican height panel (P ¼ 8.5 � 10�6) and the FUSION stage 2sample (P ¼ 0.001), but not in the FINRISK97 (P ¼ 0.93, oppositedirection) and PPP (P ¼ 0.16, opposite direction) panels. This locus isa very strong candidate for a role in height variation. First, Prkg2�/�
mice developed dwarfism that is caused by a severe defect in
179MenWomen
178
177
176
166
165
164
163
162
Height w
omen (cm
)
Hei
ght m
en (
cm)
161
160
159
175
174
173
172
≤8 9 10 11 12 13 14 15 ≥16
Height score
Figure 3 Analysis of combined effects. For each participant in the
FINRISK97 panel with complete genotype at the 12 SNPs with P o5 � 10�7 in Table 1 (n ¼ 7,566), we counted the number of height-
increasing alleles to create a height score. Individuals with r8 or Z16
‘tall’ alleles were grouped. For each height score group, in men and women
separately, the mean ± 95% confidence interval is plotted. The axis for
men is on the left and the axis for women is on the right (same scale). The
regression line in dark gray indicates that, for both men and women, each
additional ‘tall’ allele increases height by 0.4 cm. The light gray histogram
in the background represents the relative fraction of individuals in each
height score group (height score r8: 4.7%; height score 9: 6.2%;
height score 10: 11.1%; height score 11: 15.5%; height score 12: 17.5%;
height score 13: 15.6%; height score 14: 13.7%; height score 15: 8.6%;
height score Z16: 7.1%).
5 88 VOLUME 40 [ NUMBER 5 [ MAY 2008 NATURE GENETICS
ART I C LES©
2008
Nat
ure
Pub
lishi
ng G
roup
ht
tp://
ww
w.n
atur
e.co
m/n
atur
egen
etic
s

endochondral ossification at the growth plates29. Second, the naturallyoccurring Komeda miniature rat Ishikawa mutant, which has generallongitudinal growth retardation, results from a deletion in the rat geneencoding cGKII30. Therefore, in rodents, it is clear that cGKII has arole in skeletal growth, acting as a molecular switch between chon-drocyte proliferation and differentiation. We predict that largerreplication studies will demonstrate that common genetic variationat the PRKG2 locus does contribute to height variation in humans, butit seems possible that there will also be heterogeneity among studies.
Several newly identified loci associated with height are located neargenes with less immediately apparent connections to stature, includingthe G protein–coupled receptor gene GPR126, a locus that encom-passes the thyroid hormone receptor interactor TRIP11 and the ataxinATXN3 genes, a locus with the Huntingtin-interacting gene SH3GL3and the glycoprotein metalloprotease gene ADAMTSL3 (the later oftenmutated in colon cancer31), a locus with gene CHCHD7, frequentlyfused to the PLAG1 oncogene in salivary gland adenomas32, and theepidermal retinal dehydrogenase 2 gene RDHE2. Because of LD(Supplementary Fig. 2), it is possible that the causal alleles at theseloci are not located in these genes; fine-mapping in larger cohorts or inpopulations of different ancestry may be required to pinpoint therelevant gene and functional variant(s). Alternatively, these genes maythemselves influence height, and further work will be needed toelucidate the relevant pathways and mechanisms.
We note that the accompanying manuscript by Weedon et al.18
identifies association with height for several of the loci reported in ourstudy (ZBTB38, HMGA2, GDF5-UQCC, HHIP, SH3GL3-ADAMTSL3,CDK6), and reports, as we do, a suggestive association for a SNP at theFUBP3 locus (P ¼ 7.5 � 10�7 in our study; P ¼ 2.0 � 10�5 inWeedon et al.). FUBP3, a gene implicated in c-myc regulation, istherefore likely to represent an additional locus associatedwith height.
The variants associated with height that we validated do not havestrong enough effects to generate detectable linkage signals33. Three ofour loci lie under previously reported height linkage peaks8: ZBTB38,lod score 2.03; TRIP11-ATXN3, lod score 2.01; and CDK6, lod score2.26. However, because 17.6% of the genome overlaps with a heightlinkage peak with lod score 42, the number of such co-localizations isnot greater than expected by chance (3 observed versus 2.12 expected).It remains possible that some genes harbor both common and rarevariants that influence height, so some overlaps may yet emergebetween associated and linked loci that have a real genetic basis.Furthermore, regions of linkage may indicate the locations of rarevariants or other types of genetic variation that are not well capturedby our current association methods.
As expected, the estimated effect sizes in the GWA meta-analysiswere generally larger than the effect sizes observed in replicationsamples, because of the well-known ‘winner’s curse’ phenomenon34.Perhaps less well appreciated is that the magnitude of the winner’scurse effect depends on the underlying distribution of effect sizes: thegreater the number of variants with small effects, the more likely it isthat one or more of these variants will approach genome-widesignificance even in a study that is not well powered to detect thesevery modest effects35. Such variants will then prove difficult toconvincingly replicate, unless very large replication cohorts are used.Thus, it is possible that even some of the initial associations that wefailed to replicate will eventually be validated.
Given the modest effect sizes observed for the validated variantsassociated with height (Table 1; average ¼ 0.4 cm per additionalallele), it is not surprising that the quantile-quantile plots for theindividual GWA studies are essentially indistinguishable from the null
expectation (Fig. 1). Indeed, we calculate that a study of 3,000unrelated individuals has 1% power to detect a variant (minor allelefrequency 10%) that increases height by 0.4 cm at a statistical thresh-old of P ¼ 1 � 10�5. In comparison, a study of 16,000 individuals has72% power to identify the same variant (in fact, there is a slight loss inpower when using meta-analytic methods to combine results). Ourdiscovery of valid associations by combining individual studieswith nearly null P-value distributions highlights the importance ofusing large datasets to find common variants with small effects. Whenwe remove the 12 validated height variants (and nearby correlatedSNPs) from the meta-analysis results, the number of low P values stillexceeds the null expectation (Fig. 2a, filled squares). Furthermore, the10,000 SNPs with the best P values also showed excess evidence ofassociation in an independent meta-analysis18, even when all lociknown to be associated with height were excluded (Fig. 2b). Theseresults indicate that there are other associations with common allelesyet to be discovered, but that our meta-analysis is not sufficientlypowered to identify these associations because the effect sizesare small.
Our results have several implications. First, they outline a role formultiple genes and biological pathways that were previously notknown to regulate height, substantiating the ability of unbiased geneticapproaches to yield new biological insights. The identification of thesegenes not only expands our knowledge of human growth but alsopromotes these genes as candidates for as yet unexplained syndromesof severe tall or short stature. Second, these findings convincinglyconfirm the polygenic nature of height, a classic complex trait, anddemonstrate that, at least for this trait, increasingly large GWA studiescan uncover increasing numbers of associated loci. Third, each variantmakes only a small contribution to phenotypic variation (althoughdetermining the total contribution of each of the loci reported hererequires much more comprehensive resequencing and genotyping);thus, either many hundreds of common variants influence complextraits such as height and/or other genetic contributors (for example,gene–gene or gene–environment interactions, rare variants with largeeffects, or uncaptured genomic features such as structural polymorph-isms) will play a significant role. In particular, because the quality-control criteria used in the GWA studies analyzed here would haveremoved SNPs affected by copy number polymorphisms, we cannotconclude anything regarding the role of these variants on adult height.With the development of new platforms and improved analytical toolsapplicable to large cohorts, it is likely that the role of commonstructural variants on human complex traits such as adult heightwill soon be elucidated. Finally, if height is indeed a good model forother complex traits, these results suggest that large meta-analyses ofGWA studies will provide insights not only into human growth butalso into the underlying biological mechanisms of common disease.
METHODSDescription of genome-wide association study samples. The individuals
analyzed by the Diabetes Genetics Initiative (DGI) have been described else-
where4. In total, there were 1,464 type 2 diabetes cases and 1,467 matched
controls of European ancestry from Finland and Sweden. The Finland–United
States investigation of non-insulin-dependent diabetes mellitus genetics
(FUSION) GWA study included 1,161 Finnish type 2 diabetes (T2D) cases,
1,174 normal glucose tolerant (NGT) controls, and 122 offspring of case-
control pairs13. Cases and controls were matched as previously described,
taking into account age, sex and birth province within Finland. The KORA
genome-wide association study samples were recruited from the KORA S3
survey, which is a population-based sample from the general population living
in the region of Augsburg, Southern Germany. The 1,644 study participants
had a German passport and were of European origin16. The Nurses’ Health
NATURE GENETICS VOLUME 40 [ NUMBER 5 [ MAY 2008 58 9
ART I C LES©
2008
Nat
ure
Pub
lishi
ng G
roup
ht
tp://
ww
w.n
atur
e.co
m/n
atur
egen
etic
s
Study (NHS) GWA scan included DNA from 2,286 registered nurses of
European ancestry: 1,145 postmenopausal women with invasive breast cancer
and 1,142 matched controls14. The Prostate, Lung, Colorectal and Ovarian
Cancer Screening Trial (PLCO) GWA scan included 1,172 non-Hispanic
prostate cancer cases of European ancestry and 1,105 matched controls15.
The SardiNIA GWAS examined a total of 4,305 related individuals participating
in a longitudinal study of aging-related quantitative traits in the Ogliastra
region of Sardinia, Italy17. More details can be found in the Supplementary
Methods online.
Description of follow-up samples. The European American (n ¼ 2,189)
sample is a tall-short study with subjects ranking in the 5–10th percentiles in
adult height (short women, 152–155 cm; short men, 164–168 cm) and in the
90–95th percentiles in adult height (tall women, 170–175 cm; tall men,
185–191 cm)19. All individuals were self-described ‘white’ or ‘of European
descent’. All subjects were born in the United States, and all of their grand-
parents were born in either the United States or Europe. Using the Genetic
Power Calculator36 and assuming a purely additive genetic effect across the
whole phenotypic distribution, we calculated that the study design of the
European American tall-short panel provides 33.0, 79.0 and 98.6% power to
detect variants that explain Z0.1, 0.25 and 0.5% of the phenotypic variation in
height, respectively (at an a-threshold of 0.01), and power was greater to meet
our less stringent screening criteria of any odds ratio in the same direction than
the effect observed in the meta-analysis. FINRISK 1997 is one of the popula-
tion-based risk factor surveys carried out by the National Public Health
Institute of Finland every five years37, and was approved by the Ethical
Committee of the National Public Health Institute (decision number 38/96).
The sample was drawn from the National Population Register for five
geographical areas. The FUSION stage 2 study includes a series of cases and
controls matched to take into account age, sex, and birth province within
Finland13. The KORA S4 samples were recruited from Augsburg, Southern
Germany, and do not overlap with the KORA S3 population. Prevalence,
Prediction and Prevention of Diabetes (PPP) in the Botnia study is a
population-based study started in 2004 to study the epidemiology of type 2
diabetes. More details can be found in the Supplementary Methods. These
studies were approved by the appropriate ethical review boards.
Genotype imputation. Because the GWA scans used different genotyping
platforms, we imputed genotypes for all polymorphic HapMap SNPs
in each scan, using a hidden Markov model as implemented in MACH
(Y. Li and G.R.A., unpublished data). This approach allowed us to evaluate
association at the same SNPs in all scans. The imputation method combines
genotype data from each sample with the HapMap CEU samples (July
2006 phased haplotype release) and then infers the unobserved genotypes
probabilistically. The inference relies on the identification of stretches of
haplotype shared between study samples and individuals in HapMap CEU
reference panel. For each SNP in each individual, imputation results are
summarized as an ‘allele dosage’ defined as the expected number of copies of
the minor allele at that SNP (a fractional value between 0.0 and 2.0). As
previously described, r2 between each imputed genotype and the true under-
lying genotype is estimated and serves as a quality-control metric (rsq_hat in
Supplementary Table 7). We chose an estimated r 2 40.3 as a threshold to flag
and discard low-quality imputed SNPs (ref. 13 and Y. Li and G.R.A.,
unpublished data).
Association analyses. For all studies, except for the European American height
panel, we converted height to Z score, taking into account sex, age and disease
status when appropriate. For the DGI, KORA S3, NHS, PLCO, FINRISK97,
KORA S4 and PPP cohorts, we carried out association testing using a regression
framework implemented in PLINK38 for genotyped markers, and in MACH2QTL
(Y. Li and G.R.A., unpublished data), which takes into account dosage
information (0.0–2.0), for imputed SNPs. For DGI, we used a genomic control
method to correct for the presence of related individuals. Association testing in
the FUSION and SardiNIA datasets was done for both genotyped and imputed
SNPs using a method that allows for relatedness, estimating regression coefficients
in the context of a variance components model39. Statistical analysis for the
European American tall-short panel was done using a Cochran-Mantel-Haenszel
(CMH) test38 stratified by the European region of origin of the grandparents.
Meta-analysis. Association results presented in this manuscript take into
account the posterior probability on each imputed genotype. To combine
results, we used a weighted Z-score method:
zw ¼ zi�ffiffiffiffiffiffiffiffiffiffiffiffiffiffiffiNi=Ntot
p
zw is the weighted Z score from which the meta-analytic two-tailed P value is
calculated, zi is the Z score from study i (calculated as the cumulative normal
probability density for the corresponding one-tailed P value, adjusted if needed
by subtracting the P value from one when the direction of the effect is
reversed), Ni is the sample size of study i and Ntot is the total sample size. In
total, we combined association results at 2,260,683 autosomal SNPs in 15,821
individuals (DGI, n ¼ 2,978; FUSION, n ¼ 2,371; KORA, n ¼ 1,644; NHS,
n ¼ 2,286; PLCO, n ¼ 2,244; SardiNIA, n ¼ 4,305). The I2 statistic40 and
Cochran’s Q test were used to assess heterogeneity.
Genotyping and quality control. Genotyping of the initial GWA studies is
described elsewhere4,11,13–15, except for KORA, which is described in the
Supplementary Methods. Genotyping in the European American height panel
and the replication panels FINRISK97, PPP, FUSION stage 2 and KORA S4 was
done using the Sequenom MassARRAY iPLEX platform. From the meta-
analysis, we selected 78 SNPs (three iPLEX pools; six SNPs failed) for
genotyping in the European American tall-short panel (n ¼ 2,189): SNPs were
first ranked using their meta-analytic P values, and then binned using the LD
pattern from the HapMap Phase II CEU population (SNPs with r 2 40.5 to a
SNP with a lower P value were binned together with that SNP). When a locus
had more than one high-ranking bin, we only genotyped the most significant
SNP such that only one SNP per locus or gene was genotyped. Because of the
specific design of this DNA panel (near-ends of the height distribution) but also
because effect sizes on height are small (and were inflated by the winner’s curse
in the meta-analysis), we promoted for genotyping in larger follow-up cohorts
markers that had an odds ratio consistent with the direction of the effect
observed in the meta-analysis (without considering the magnitude of the
European American CMH P values). For the FINRISK97 panel, 29 SNPs were
attempted and two failed. For the PPP panel, 23 SNPs were attempted and two
failed. For the FUSION stage 2 panel, 27 SNPs were attempted and one failed.
For the KORA S4 panel, five SNPs were attempted and one failed. For all
passing SNPs, the genotyping success rate was 496% and the consensus error
rate, estimated from replicates, was o0.1%.
Accession numbers. Genbank Entrez Gene: data for validated loci associated
with height are available with accession codes 253461 (ZBTB38), 8091
(HMGA2), 57211 (GPR126) 3007 (HIST1H1D), 8200 (GDF5), 55245 (UQCC),
64399 (HHIP), 9321 (TRIP11), 4287 (ATXN3), 389421 (LIN28B), 84444
(DOT1L), 6457 (SH3GL3), 57188 (ADAMTSL3), 79145 (CHCHD7), 195814
(RDHE2), 1021 (CDK6).
URLs. DGI GWA study, http://www.broad.mit.edu/diabetes/; Markov Chain
Haplotyping Package, http://www.sph.umich.edu/csg/abecasis/MaCH.
Note: Supplementary information is available on the Nature Genetics website.
ACKNOWLEDGMENTSWe thank members of our laboratories for helpful discussion, and gratefullyacknowledge all of the participants in the studies. Contributing members for theDGI, FUSION, KORA and SardiNIA GWA scans are listed in the SupplementaryNote. The authors acknowledge C. Chen of Bioinformed Consulting Services Inc.for expert programming, and L. Qi for his assistance. The authors thank C. Bergand P. Prorok, Division of Cancer Prevention, National Cancer Institute, theScreening Center investigators and staff of the Prostate, Lung, Colorectal, andOvarian (PLCO) Cancer Screening Trial, T. Riley and staff, InformationManagement Services, Inc., and B. O’Brien and staff, Westat, Inc. KORAgratefully acknowledges the contribution of T. Meitinger and all other membersof the GSF genotyping staff in generating the SNP dataset. We thank the Mayorand the administration in Lanusei for providing and furnishing the clinic site;and the mayors of Ilbono, Arzana and Elini, the head of the local Public HealthUnit ASL4. Support for this work was provided by the following: US NationalInstitutes of Health grants 5P01CA087969 and CA49449 (S.E. Hankinson),5UO1CA098233 (D.J.H.), DK62370 (M.B.), DK72193 (K.L.M.), HG02651 andHL084729 (G.R.A.); Novartis Institutes for BioMedical Research (D. Altshuler);
5 90 VOLUME 40 [ NUMBER 5 [ MAY 2008 NATURE GENETICS
ART I C LES©
2008
Nat
ure
Pub
lishi
ng G
roup
ht
tp://
ww
w.n
atur
e.co
m/n
atur
egen
etic
s
March of Dimes grant 6-FY04-61 (J.N.H.); EU Projects GenomEUtwin grantQLG2-CT-2002-01254 and the Center of Excellence in Complex Disease Geneticsof the Academy of Finland (L.P.); the Sigrid Juselius Foundation (L.C.G., V.S. andPPP); the Finnish Diabetes Research Foundation and the Folkhalsan ResearchFoundation and Clinical Research Institute HUCH (L.C.G.); this research wassupported (in part) by the intramural Research Program of the NIH, NationalInstitute on Aging; the PLCO research was supported by the Intramural ResearchProgram of the Division of Cancer Epidemiology and Genetics and by contractsfrom the Division of Cancer Prevention, National Cancer Institute, NIH, DHHS;KORA/MONICA Augsburg studies were financed by the GSF-National ResearchCenter for Environment and Health, Munich/Neuherberg, Germany andsupported by grants from the German Federal Ministry of Education andResearch (BMBF); part of this work by KORA was supported by the GermanNational Genome Research Network (NGFN), the Munich Center of HealthSciences (MC Health) as part of LMUinnovativ, and a subcontract of the 5 R01DK 075787 by the NIH/NIDDK to the GSF-National Research Center forEnvironment and Health (to J.N.H.).
AUTHOR CONTRIBUTIONSG.L., A.U.J., C. Gieger., F.R.S., S.I.B., S.S., S.E. and B.F.V. performed analyses.G.L. performed the meta-analysis and selected markers for follow-up. J.L.B.,C. Guiducci, T.I. and R.H. genotyped markers in some of the follow-up panels.G.L. and J.N.H. wrote the manuscript, with inputs from the other authors,especially M.B. and S.I.B. V.L., L.C.G., B.I. and J.N.H. are investigators of the DGIand Botnia studies. L.P. and V.S. are investigators of the FINRISK97 study.M.U., D.S. and G.R.A. are investigators of the SardiNIA study. K.B.J., S.J.C. andR.B.H. are investigators of the PLCO study. I.M.H. and H.-E.W. are investigatorsof the KORA study. M.B. and K.L.M. are investigators of the FUSION study.F.B.H., P.K. and D.J.H. are investigators of the NHS. D.J.H, R.B.H., G.R.A.,H.-E.W., K.L.M. and J.N.H. led this study. All authors read and approvedthe final manuscript.
Published online at http://www.nature.com/naturegenetics
Reprints and permissions information is available online at http://npg.nature.com/
reprintsandpermissions
1. Hirschhorn, J.N. & Daly, M.J. Genome-wide association studies for common diseasesand complex traits. Nat. Rev. Genet. 6, 95–108 (2005).
2. The International HapMap Consortium. A haplotype map of the human genome. Nature437, 1299–1320 (2005).
3. Wellcome Trust Case Control Consortium. Genome-wide association study of 14,000cases of seven common diseases and 3,000 shared controls. Nature 447, 661–678(2007).
4. Saxena, R. et al. Genome-wide association analysis identifies loci for type 2 diabetesand triglyceride levels. Science 316, 1331–1336 (2007).
5. Frayling, T.M. et al. A common variant in the FTO gene is associated with body massindex and predisposes to childhood and adult obesity. Science 316, 889–894(2007).
6. Scuteri, A. et al. Genome-wide association scan shows genetic variants in the FTO geneare associated with obesity-related traits. PLoS Genet. 3, e115 (2007).
7. Fisher, R.A. The correlation between relatives on the supposition of Mendelianinheritance. Transactions of the Royal Society of Edinburgh 52, 399–433 (1918).
8. Perola, M. et al. Combined genome scans for body stature in 6,602 European twins:evidence for common Caucasian loci. PLoS Genet. 3, e97 (2007).
9. Mathias, R.A. et al. Comparison of year-of-exam- and age-matched estimates of heri-tability in the Framingham Heart Study data. BMC Genet. 4 (Suppl 1), S36 (2003).
10. Gunnell, D. et al. Height, leg length, and cancer risk: a systematic review. Epidemiol.Rev. 23, 313–342 (2001).
11. Sanna, S. et al. Common variants in the GDF5-UQCC region are associated withvariation in human height. Nat. Genet. 40, 198–203 (2008).
12. Weedon, M.N. et al. A common variant of HMGA2 is associated with adult andchildhood height in the general population. Nat. Genet. 39, 1245–1250 (2007).
13. Scott, L.J. et al. A genome-wide association study of type 2 diabetes in Finns detectsmultiple susceptibility variants. Science 316, 1341–1345 (2007).
14. Hunter, D.J. et al. A genome-wide association study identifies alleles in FGFR2associated with risk of sporadic postmenopausal breast cancer. Nat. Genet. 39,870–874 (2007).
15. Yeager, M. et al. Genome-wide association study of prostate cancer identifies a secondrisk locus at 8q24. Nat. Genet. 39, 645–649 (2007).
16. Wichmann, H.E., Gieger, C. & Illig, T. KORA-gen–resource for population genetics,controls and a broad spectrum of disease phenotypes. Gesundheitswesen 67
(Suppl. 1), S26–S30 (2005).17. Pilia, G. et al. Heritability of cardiovascular and personality traits in 6,148 Sardinians.
PLoS Genet. 2, e132 (2006).18. Weedon, M.N. et al. Genome-wide association analysis identifies 20 loci that influence
adult height. Nat. Genet. advance online publication, doi: 10.1038/ng.121 (6 April2008).
19. Campbell, C.D. et al. Demonstrating stratification in a European-American population.Nat. Genet. 37, 868–872 (2005).
20. Price, A.L. et al. Principal components analysis corrects for stratification in genome-wide association studies. Nat. Genet. 38, 904–909 (2006).
21. Price, A.L. et al. Discerning the ancestry of European Americans in genetic associationstudies. PLoS Genet. 4, e236 (2008).
22. Chuang, P.T. & McMahon, A.P. Vertebrate Hedgehog signalling modulated by inductionof a Hedgehog-binding protein. Nature 397, 617–621 (1999).
23. St-Jacques, B., Hammerschmidt, M. & McMahon, A.P. Indian hedgehog signalingregulates proliferation and differentiation of chondrocytes and is essential for boneformation. Genes Dev. 13, 2072–2086 (1999).
24. Mayr, C., Hemann, M.T. & Bartel, D.P. Disrupting the pairing between let-7 and Hmga2enhances oncogenic transformation. Science 315, 1576–1579 (2007).
25. Lee, Y.S. & Dutta, A. The tumor suppressor microRNA let-7 represses the HMGA2oncogene. Genes Dev. 21, 1025–1030 (2007).
26. Johnson, C.D. et al. The let-7 microRNA represses cell proliferation pathways in humancells. Cancer Res. 67, 7713–7722 (2007).
27. Krek, A. et al. Combinatorial microRNA target predictions. Nat. Genet. 37, 495–500(2005).
28. Guo, Y. et al. Identification and characterization of lin-28 homolog B (LIN28B) inhuman hepatocellular carcinoma. Gene 384, 51–61 (2006).
29. Pfeifer, A. et al. Intestinal secretory defects and dwarfism in mice lacking cGMP-dependent protein kinase II. Science 274, 2082–2086 (1996).
30. Chikuda, H. et al. Cyclic GMP-dependent protein kinase II is a molecular switch fromproliferation to hypertrophic differentiation of chondrocytes. Genes Dev. 18,2418–2429 (2004).
31. Sjoblom, T. et al. The consensus coding sequences of human breast and colorectalcancers. Science 314, 268–274 (2006).
32. Asp, J., Persson, F., Kost-Alimova, M. & Stenman, G. CHCHD7-PLAG1 and TCEA1-PLAG1 gene fusions resulting from cryptic, intrachromosomal 8q rearrangements inpleomorphic salivary gland adenomas. Genes Chromosom. Cancer 45, 820–828(2006).
33. Hirschhorn, J.N. et al. Genomewide linkage analysis of stature in multiple populationsreveals several regions with evidence of linkage to adult height. Am. J. Hum. Genet.69, 106–116 (2001).
34. Lohmueller, K.E., Pearce, C.L., Pike, M., Lander, E.S. & Hirschhorn, J.N. Meta-analysis of genetic association studies supports a contribution of common variantsto susceptibility to common disease. Nat. Genet. 33, 177–182 (2003).
35. Zollner, S. & Pritchard, J.K. Overcoming the winner’s curse: estimatingpenetrance parameters from case-control data. Am. J. Hum. Genet. 80, 605–615(2007).
36. Purcell, S., Cherny, S.S. & Sham, P.C. Genetic Power Calculator: design of linkage andassociation genetic mapping studies of complex traits. Bioinformatics 19, 149–150(2003).
37. Vartiainen, E. et al. Cardiovascular risk factor changes in Finland, 1972–1997. Int.J. Epidemiol. 29, 49–56 (2000).
38. Purcell, S. et al. PLINK: a tool set for whole-genome association and population-basedlinkage analyses. Am. J. Hum. Genet. 81, 559–575 (2007).
39. Chen, W.M. & Abecasis, G.R. Family-based association tests for genomewide associa-tion scans. Am. J. Hum. Genet. 81, 913–926 (2007).
40. Higgins, J.P., Thompson, S.G., Deeks, J.J. & Altman, D.G. Measuring inconsistency inmeta-analyses. Br. Med. J. 327, 557–560 (2003).
NATURE GENETICS VOLUME 40 [ NUMBER 5 [ MAY 2008 59 1
ART I C LES©
2008
Nat
ure
Pub
lishi
ng G
roup
ht
tp://
ww
w.n
atur
e.co
m/n
atur
egen
etic
s