Embed Size (px)
Citation preview
Identification of Lead Users for Consumer Products via Virtual Stock Markets
Martin Spanna Holger Ernstb Bernd Skierac
Jan Henrik Sollb
This is a preprint of an Article accepted for publication in the Journal of Product Innovation Management
© 2009 Product Development & Management Association Acknowledgements: We thank the two anonymous reviewers as well as Arina Soukhoroukova, Agnieszka Wolk and the participants of the “DIMACS Workshop on Markets as Predictive Devices (Information Markets)” at Rutgers University for their valuable feedback. Contact Information: a School of Business and Economics, University of Passau, Innstr. 27, 94032 Passau, Germany, Phone: +49-851-509-2421, Fax: +49-851-509-2422, email: [email protected]. b Chair for Technology and Innovation Management, WHU-Otto Beisheim School of Management, Burgplatz 2, 56179 Vallendar, Germany, Phone +49-261-6509-241, Fax: +49-261-6509-249, email: [email protected], [email protected] c School of Business and Economics, Johann Wolfgang Goethe-University, Mertonstr. 17, 60054 Frankfurt am Main, Germany, Phone: +49-69-798-22377, Fax: +49-69-798-28973, email: [email protected]

2
Identification of Lead Users for Consumer Products via Virtual Stock Markets
Abstract
Newly launched products in the consumer goods and services markets show high failure rates. In order to reduce the failure rates, companies can integrate innovative and knowledgeable customers, the so called ‘lead users’, into the new product development process. However, the detection of such lead users is difficult, especially in consumer product markets with very large customer bases. A new and potentially valuable approach towards the identification of lead users involves the use of Virtual Stock Markets, which have been proposed and applied for political and business forecasting, but not for the identification of experts such as lead users.
The basic concept of Virtual Stock Markets is bringing a group of participants together via the Internet and allowing them to trade shares of virtual stocks. These stocks represent a bet on the outcome of future market situations and their value depends on the realization of these market situations. In this process, a Virtual Stock Market elicits and aggregates the assessments of its participants concerning future market developments. Virtual Stock Markets might also serve as a feasible instrument to filter out lead users, primarily for the following two reasons. Firstly, a "self-selection effect" might occur because sophisticated consumers with a higher involvement in the product of interest decide to participate in Virtual Stock Markets. Secondly, a "performance effect" is likely to arise because well-performing participants in Virtual Stock Markets show a better understanding of the market than their (already self-selected) fellow participants. So far, only limited information exists about these two effects and their relation to lead user characteristics.
The goal of this article is to analyze the feasibility of Virtual Stock Markets for the identification of lead users. The results of our empirical study show that Virtual Stock Markets can be an effective instrument to identify lead users in consumer products markets. Furthermore, the results show that not all lead users perform well in Virtual Stock Markets. Hence, Virtual Stock Markets allow identifying lead users with superior abilities to forecast market success.
Keywords: Virtual Stock Markets, lead user, innovation, expert identification new product development, internet.
3
Introduction Empirical research has shown the importance of constantly introducing new products to
sustain the financial success of companies (Debruyne et al., 2002; Han, Kim and Srivastava,
1998). Thus, companies face the challenge of balancing their product portfolios between older
and newly introduced products. However, this task does not only imply maintaining an efficient
process for the development of new products and allocating substantial resources to this process,
but most importantly requires the successful introduction of a sufficient number of new products
into the market. This is a great challenge for consumer goods and services markets. Companies
operating in these markets face a serious problem: newly launched products have shown
notoriously high failure rates over the years, up to 50% in several cases (Urban and Hauser,
1993). One way to reduce the failure rates would be to try to cope better with the needs of the
market. Research in the past has intensively examined the effects of market orientation on the
company's success (e.g., Jaworski and Kohli, 1993). One particular form of market orientation is
to integrate customers into the product development (Gruner and Homburg, 2000; Khurana and
Rosenthal, 1998). The selection of the right customers for successful integration is vital, since the
contribution of customers to the development of new products varies significantly (Nambisan,
2002).
The focus of the previous literature was on the type of customer, who can best be
integrated into the new product development process for industrial markets. Von Hippel proposed
the concept of the so-called ‘lead users’ in this regard. As a matter of fact, this kind of a customer
faces the need for future products, months or even years before a normal customer actually does
(Urban and von Hippel, 1988; von Hippel, 1986; von Hippel, 1988). Moreover, lead users often
try to find solutions to these needs making them a potential source for innovative product ideas.

4
Companies can hence detect the future needs and trends in the market at an earlier stage and
procure newer product ideas to satisfy these needs, by systematically analyzing lead users and
tapping their knowledge.
Applying the lead user concept to the development of consumer products should enhance
the success rate of new consumer products. However, when trying to do so, consumer product
companies face major obstacles. Customer bases, especially in the field of fast moving consumer
products, are often in the 100,000s or even millions; and they usually have no direct contact with
their customers, who are attended to in most cases by intermediaries. This means that traditional
methods like survey research might lack the capability of efficiently identifying lead users, under
given resource and time constraints. This implies that finding lead users in a traditional way
might seem applicable only to a small number of consumer products companies – mainly to those
operating in smaller markets or those having direct access to a majority of their customers.
Hence, a central problem in consumer products markets is to identify these innovative customers
and to integrate them into the new product development process.
The Internet provides new tools for the integration of customers into the new product
development process, because it has great advantages against traditional means of
communication in terms of cost, speed and flexibility (Dahan and Hauser, 2002; Ogawa and
Piller, 2006). Moreover, the Internet provides a new way of direct communication of consumer
products companies with their customers, bypassing intermediaries such as retailers or market
research companies.
The application of Virtual Stock Markets (VSMs) (or “prediction markets”, “information
markets”) to gather and evaluate information is based on the notion of market efficiency (Fama,
1991). Efficient markets reflect their traders’ information; they immediately react to new

5
information and possess the ability to practically incorporate an unlimited number of participants
(Spann and Skiera, 2003). VSMs have demonstrated their ability to solve information problems
in the area of political forecasting (e.g., Forsythe et al., 1992, 1999), business forecasting (e.g.,
Spann and Skiera, 2003; Gruca et al. 2003) and as a tool for concept evaluation in the new
product development process (Dahan and Hauser, 2002; Dahan et al., 2008; Dahan,
Soukhoroukova and Spann, 2009). The growing interest in VSMs and a number of other related
applications (e.g. the Hollywood Stock Exchange, Yahoo!’s Tech Buzz Market, various markets
at Newsfutures.com) additionally provide existing data sources for further applications.
VSMs might also serve as a feasible instrument to filter out lead users, primarily for the
following two reasons. Firstly, a "self-selection effect" might occur because sophisticated
consumers with a higher involvement in the product of interest decide to participate in VSMs.
Secondly, a "performance effect" is likely to arise because well-performing participants in VSMs
show a better understanding of the market than their (already self-selected) fellow participants.
So far, only limited information exists about these two effects and their relation to lead user
characteristics.
The goal of this article is to analyze the feasibility of Virtual Stock Markets to identify
lead users. The article particularly analyzes if Virtual Stock Markets in a consumer products
scenario attract more than an average number of lead users and if those lead users outperform
other users. Thereby, it broadens the applicability of Virtual Stock Markets that have been
previously used for forecasting the probability of future events or the success of product
innovations. This identification of lead users is advantageous for at least two reasons. Firstly, it
represents a completely new alternative method and secondly, it makes use of the results of
existing Virtual Stock Markets with almost no additional costs.

6
The rest of the article is organized as follows: Section 2 describes the motivation behind
identifying lead users in consumer products markets; Section 3 explains how VSMs work and
discusses their feasibility for lead user identification, Section 4 describes the design and results of
our empirical study, and Section 5 discusses the results, i.e., the managerial implications as well
as the limitations of our research.
Lead users in new product development
Lead users as innovators
The lead user concept is based upon extensive research in the origin of ideas for new
products and the distribution of activities between manufacturer and customer. This branch of
research was pioneered by Von Hippel (von Hippel, 1976; von Hippel, 1978). He observed that
the product ideas for many industrial products originated from customer input and that these
customers often dominated the new product development process. He came to the conclusion that
companies should integrate lead users into their new product development processes, in order to
enhance the success of new products. He was able to show that lead users provided precise
information for the development of new products and were willing to participate in joint projects
(von Hippel, 1978; von Hippel, 1986).
Lilien et al. (2002) confirmed these findings by showing that the annual sales of products
based on the idea of lead user generation were on an average much higher than for products
developed using traditional methods. Moreover, products based on lead user ideas had a higher
degree of novelty, could address original customer needs much better and thereby outperformed
other new products, in view of both financial and non-financial criteria. Gruner and Homburg
(2000) also showed that the integration of lead users, particularly in the early phases of the new
product development, has a positive impact on the performance of new products.

7
While these studies focused on B2B-markets, several studies also outlined the advantages
that lead users pose for consumer products companies (Sawhney and Prandelli, 2001; Thomke
and von Hippel, 2002; von Hippel and Katz, 2002). They argue that lead users also exist in
consumer products markets and enhance the success rate of new products (Franke and Shah,
2003; Lüthje, 2004). However, the identification of lead users in consumer products markets is
much more challenging than in B2B markets because of the large customer base and the greater
distance between consumer products manufacturers and their customers. This typically results in
an increased difficulty to interact with consumers for the development of new products in a B2C
setting (Lüthje, 2004; Sawhney and Prandelli, 2001).
Characteristics of lead users in consumer products markets
Von Hippel (1986) established the following basic characteristics of lead users in
industrial markets. Lead users face needs that will be general in the marketplace, but they face
them months or even years before the bulk of that marketplace encounters them. They benefit
significantly by obtaining a solution to these needs. This expected level of benefit motivates lead
users to innovate (von Hippel, 1986). Lead users further have the competence or knowledge to
innovate. Lead users possess important knowledge, especially market-related knowledge, which
is either not available or cannot be made available to the manufacturer at acceptable costs (von
Hippel, 1994).
Based on a large-scale empirical study, Lüthje (2004) has identified two independent
dimensions of characteristics for lead users in consumer product markets: ‘commitment to the
product field’ and ‘innovation-related benefit’. The first dimension contains items that measure
the level of user expertise and the degree of knowledge possessed by a consumer in a certain
product field, because lead users need to be knowledgeable in order to understand the specific

8
product well enough to come up with practical improvements (Lüthje, 2004). Furthermore, lead
users need to understand the benefits of a new product’s innovative features, when approached by
companies to assess the viability of a new product concept. The second dimension contains items
that measure the level of dissatisfaction with existing products and the level of new consumer
needs (Lüthje, 2004). Lüthje (2004) showed that these two dimensions help predict the level of
lead user innovation.
Our study makes use of the above mentioned two dimensions – ‘expertise in the
respective product field’ and the ‘level of innovation-related benefits’ – as the first two
characteristics for lead user identification. Compared to alternative measures based on the level
of innovation output, e.g., number of ideas, prototypes or new products (Morrison, Roberts and
Midgley, 2004), this approach has the advantage that it is more flexible in the number of
potentially identifiable lead users. Restricting the number of lead users to those that have
innovation outcomes is rather problematic in consumer markets, because consumers are less
likely to develop innovations, compared to industrial markets (Lüthje, 2004). In addition, the
level of innovation represents only one way of how lead users contribute to new product
development. They might also provide rich and valuable information for new product
development – for example, through the assessment of ideas or new product concepts (Lilien et
al., 2002; Lüthje, 2004). This contribution of lead users to new product development plays a vital
role in consumer markets (Sawhney and Prandelli, 2001).
A further important characteristic of lead users is that they face needs earlier than the rest
of the market and that these needs will eventually become common for the rest of the market (von
Hippel, 1986). This characteristic of lead users is the essence of opinion leadership. Opinion
leaders are the first to buy new products and to communicate user experiences as regards the new

9
product in their social network (Childers, 1986). This helps building up the consumer knowledge
required for a fast diffusion of the new product in the rest of the market (Thomke and von Hippel,
2002). Opinion leaders therefore influence the needs and requirements of the rest of the market
over time. Our study therefore uses 'opinion leadership' as the third dimension for lead user
identification.
The following section explores if consumers who possess the above-mentioned three
characteristics of a lead user can be effectively identified using VSMs.
Virtual Stock Markets
Theoretical foundation of Virtual Stock Markets
The fundamental concept of Virtual Stock Markets (VSMs) is based on the idea that
markets can solve information problems (Hayek, 1945). The hypothesis of efficient markets
posits that prices always fully reflect all information that is available (Fama, 1970). Market
efficiency is attained in a competitive market through the price mechanism, which Hayek (1945)
considers as the most efficient instrument to aggregate the asymmetrically dispersed information
of market participants (Hayek, 1945; Smith, 1982). Hence, if an information problem is traded in
a competitive market, the price can serve as the aggregate reflection of all participants’ public
and private information on this information problem. As a result, markets possess the positive
characteristics of information elicitation and aggregation, immediate reaction to new information
and scalability with respect to participants (Oliven and Rietz, 2004; Dahan and Hauser, 2002),
which make them potentially promising instruments in solving managerial information problems.
Applying VSMs to the prediction of managerially relevant forecasting problems, a
researcher’s task involves making an information problem (e.g. a future market situation)
expressible and tradable using virtual stocks (Spann and Skiera, 2003). Therefore, a VSM is

10
created, in which participants can trade virtual stocks related to these future market situations.
The cash dividend (payoff) of such shares of virtual stocks depends on the market outcome; that
is, the actual outcome of the market situation of interest. Hence, the price of one share of a virtual
stock should correspond to the VSM's aggregate expectations of the event outcome and therefore
to the discounted expected cash dividend of a share of the stock.
Participants of the VSM use their (individual) assessment of the market outcome to derive
an (individual) expectation of the cash dividend of the related share of virtual stock. Accordingly,
they compare their expected cash dividend with the VSM's aggregate expectation, which is a
function of the stock price, thereby trading their individual assessment. For example, a participant
of the VSM anticipates sales of 100 units during the next month for a specific product. The cash
dividend of the related share of virtual stock would consequently be $100, in such a case each
unit of sales would correspond to $1. If the current price is $95 ($105), i.e., an aggregate
expectation of 95 (105) units, then the stock would be undervalued (overvalued) according to the
estimates of this participant. The individual could try to attain an expected profit of $5 by buying
(selling). If the potential gains in the virtual portfolio value create a sufficiently high incentive for
participants to perform well in the VSM, then it becomes their best strategy to commit
transactions according to their individual assessments. In this way, the participants reveal their
true assessments of future market situations through their buying and selling of stocks (Spann and
Skiera, 2003).
Since individual assessments are tradable using the shares of virtual stocks, it can be said
that VSMs help create a market for the prediction of a future market situation, in which the
participants compete based on their individual assessments. Thus, the participants’ aggregated
information is reflected in the stock prices. Extensive studies using empirical data as well as

11
laboratory experiments support this kind of informational efficiency of financial markets (see the
overviews of Fama, 1970, Fama, 1991). The good results of political stock markets add strength
to this notion (Forsythe et al., 1999).
The ability of VSMs to reflect the participants' information in the stock prices depends on
several conditions (Spann and Skiera, 2003). First, the future market situations need to be
tradable using shares of virtual stocks, meaning that the actual future market situation is the basis
for the cash dividend of the shares, i.e., the determination of the cash dividend is a clear process
for the participants. Second, the participants need to have some knowledge about the future
market situation, otherwise the stock prices will be set randomly, and markets cannot make use of
the information, as stated by the Hayek hypothesis. Third, the incentive created by the payoff-
mechanism has to be high enough, so that the experts decide to participate and reveal their true
evaluations.
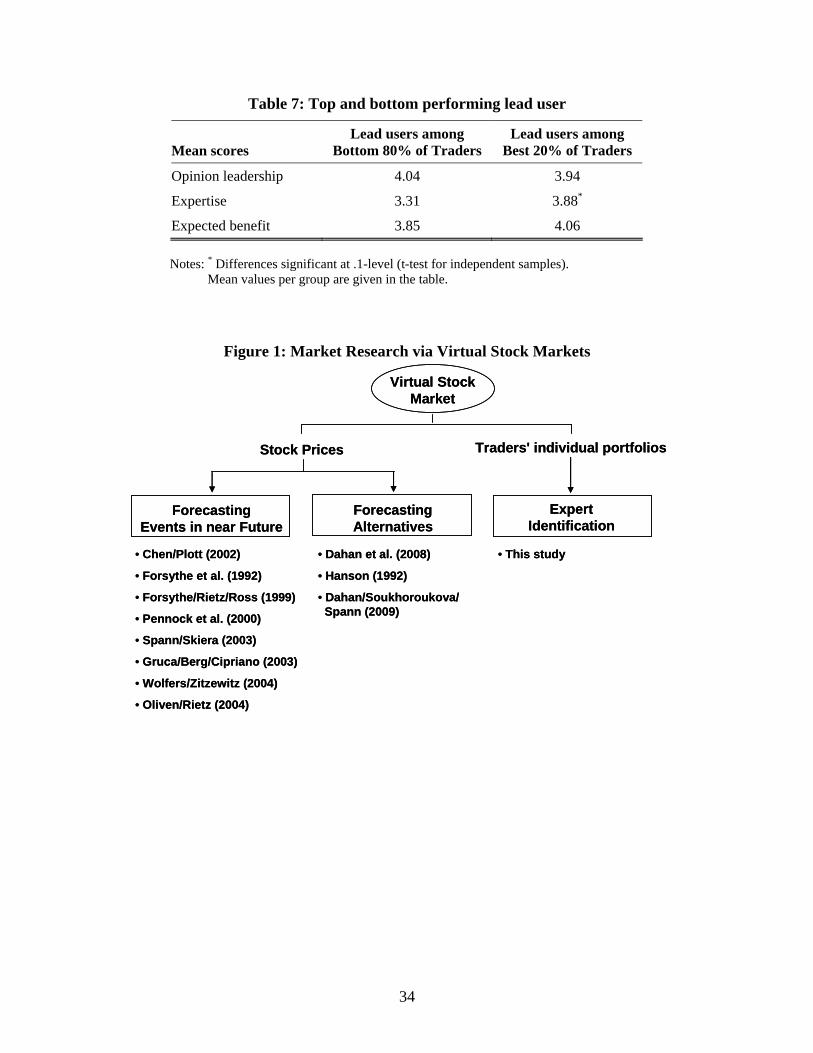
Three main areas can be identified for the application of VSMs to solve managerial
information problems (see Figure 1). The first area is the forecasting of future events that will
occur in the short future. The second area is the evaluation and forecasting of alternatives (e.g.,
product concepts), which will occur in the distant future or may never occur at all (e.g., product
concepts that are not introduced). Both areas use the stock prices in a VSM to draw forecasts. The
third area of application is the use of VSMs to detect the knowledgeable experts or consumers or
the identification of lead users, which will be analyzed in the rest of the article. The performance
of individual traders, reflected by the value of their portfolio, is used here for lead user
identification.
INSERT FIGURE 1 HERE

12
The forecasting of actual events requires that the true outcome of this event will
eventually be known, in order to determine the cash dividend of the respective stock. Thus, the
cash dividend is determined by the actual outcome and the market participants can trade their
individual assessments accordingly. So far, most of the studies on VSMs have focused on
forecasting future events, whose outcome was eventually known (e.g., Chen and Plott, 2002;
Chen et al., 2004; Pennock et al., 2000; Spann and Skiera, 2003; Wolfers and Zitzewitz, 2004;
Ostrover, 2005). The same applies for political stock markets, that were initially used to predict
the outcome of the Bush vs. Dukakis US presidential election in 1988 (Forsythe et al., 1992). In
case of political stock markets, the participants usually trade their assessments of the fraction of
votes a particular candidate or a party gets in an election (refer Forsythe et al., 1999).
The application of VSMs to predict events in the distant future is the focus of Robin
Hanson's Ideafutures (Hanson, 1992). Dahan et al. (2008) proposed the use of VSMs to evaluate
product concepts. In this approach, the participants are presented with different design concepts
for a new product and have to trade these different designs in the form of different securities in a
VSM (Dahan et al., 2008). Dahan, Soukhoroukova and Spann (2009) generalize this approach.
The outcome of this type of VSM could provide the company with vital information regarding
the optimal design of products and the predicted market success.
Lead user identification using Virtual Stock Markets
In addition to using VSMs to predict future events, VSMs can also be used to identify
lead users. There are two reasons behind this idea. Firstly, VSMs have interesting characteristics,
which can be beneficial for the identification of lead users from a large customer base in
consumer markets. The scalability of the markets allows a virtually unlimited number of
participants with negligible costs for additional participants, once the market is set up.

13
Furthermore, VSMs focus on the central, yet personal interest of the lead user, appealing to their
intrinsic properties. Therefore, participation in a VSM can be attractive for lead users. Secondly,
the growing interest in VSMs and related applications can virtually provide the information
needed for lead user identification, as a “secondary data” application, for e.g., internet
communities related to product themes and comprising a VSM (e.g. the Hollywood Stock
Exchange, Yahoo!’s Tech Buzz Market, various markets at Newsfutures.com; Mangold et al.,
2005; Servan-Schreiber et al., 2004).
The underlying idea is that consumers who choose to participate in a VSM display a
higher involvement in the product, whose market success is predicted in this VSM ("self-
selection effect") than the average consumer. Usually, self-selection effects have had a negative
impact on the external validity and thus have to be avoided in market research. However, in the
context of lead user detection, the aim is to attract lead users who are by definition not
representative of the entire consumer population. Thus, self-selection in VSMs will have a
positive effect on the participants' involvement, since participation in a VSM requires that
consumers commit a larger amount of time here, than in partaking in other market-research
activities. Usually these consumers tend to possess a higher degree of information, making them
more sophisticated than the average users (Mittal, 1989; Bloch et al., 1989). This also enables
them to come up with new ideas and to assess the market success of consumer products (Ram and
Hyung-Shik, 1989).
Furthermore, well-performing participants in a VSM might show a better understanding
of the market than their (already self-selected) fellow participants ("performance effect"). The
relation between the performance and the knowledge of participants is a product of the theory of
VSMs, i.e. the efficient market hypothesis and the Hayek hypothesis. If the price in an efficient

14
VSM reflects all the information and thereby serves as a good predictor of the future market
situations, then successful participants should be better informed than less successful ones
(Forsythe et al., 1992). The superior information of successful participants is due to the fact that
successful trading (i.e., increasing one's virtual portfolio value) requires the detection and
exploitation of inefficient prices. Inefficient prices in VSMs are incorrect predictions of future
market states. This means that successful participants in a VSM can detect and exploit such
incorrect predictions, which in turn requires them to possess superior knowledge about the future
market state (e.g., new product success) that needs prediction. By selecting the top x-percent of
participants in a VSM, the initiator of this VSM should arrive at a sample comprising expert
participants.
Development of hypotheses
In order to study the feasibility of VSMs for the identification of lead users, the main
question is whether a significant portion of lead users are among the well-performing participants
in a VSM. For this, our study assesses the lead user characteristics of VSM participants in an
additional survey based on our lead user theory and compares the survey results with the
participants’ performance and trading behavior in the VSM.
Our research question is tested via two hypotheses which are formulated based on the
discussions in the previous sections. The first hypothesis assumes that lead users are attracted to
and perform well in a VSM. It assumes further that the self-selection effect described earlier
attracts a large percentage of lead users among the participants, because the participants of a
VSM might be more sophisticated and show a higher interest than average consumers in the
product, the market success of which is to be predicted. To this extent, the participants of a VSM
15
are analyzed according to their lead user criteria, and the results are compared in a consumer
products environment to those of other lead user studies (Lüthje, 2004):
H1: A Virtual Stock Market (VSM) attracts a substantial percentage of lead users.
Lead users possess great knowledge about the traded product and have good insight into
the success potential of the products traded in a VSM. This is also due to their much earlier
realization of unsatisfied needs, as compared to the average consumer. The characteristics that
make lead users a valuable source for new product ideas and concepts also cause them to analyze
the traded products thoroughly.
They can detect and exploit inefficient prices, i.e., incorrect predictions, and therefore are
expected to perform better than the rest of the participants (performance effect):
H2: Among the top performers of the Virtual Stock Market (VSM), there is a considerably high number of lead users.
If the results of our empirical study comply with our hypotheses, then VSMs could be
used for the identification of lead users. For this, the rest of this article will analyze if well-
performing participants in a VSM have an above average share of lead user properties.
Empirical study
Study design
For the purpose of this study, a VSM was created and the results of its participants were
analyzed according to their performance. Further, participants’ lead user characteristics were
assessed via an additional survey. This study is set in the product category ‘movies’. Movies
share many common characteristics with other consumer products. First, the failure rates of new
products introduced are high: many movies fail at the box office (Eliashberg and Shugan, 1997).
The product development risk is quite high, since movie production costs can easily total over

16
100 million USD (Eliashberg, Elberse and Leenders, 2006). Second, the movie industry and the
consumer products industry largely focus on tools such as concept tests, in which the consumers
play a more or less passive role (Sawhney and Prandelli, 2001). A third common characteristic is
that consumers have little scope to come up with products entirely developed on their own.
Fourth, moviemakers increasingly rely on branding. In the recent years, marketing budgets for
movies have grown significantly in order to create strong brands. The increasing trend of sequels
is a consequence – just as other consumer products producers, movie makers try to establish an
existing strong brand, because the consumers satisfied by a movie might be more likely to watch
the sequel as well (Sawhney and Eliashberg, 1996). Often, this strategy is extended to movie
merchandise, which can contribute significantly to a movie's overall revenue. Fifth, box-office
results have a huge impact not only on merchandise sales but also on subsequent DVD and video
rentals and the sales of a movie (Lehmann and Weinberg, 2000). Both DVDs and videos are
consumer products. The lead user approach appears to be applicable to movies since they share
important characteristics with consumer products. Conceptual and empirical research shows that
lead users can also be found in consumer products markets (Lüthje, 2004; Sawhney and
Prandelli, 2001).
Lead users can potentially lead to innovations in the movie industry, for example, by
coming up with new ideas for new movies. There are various examples of screenwriting and
short film communities on the Internet such as Triggerstreet, Zoetrope and Project Greenlight.
Even if lead users do not innovate directly, they can provide valuable information for the
development of new movies, for example, through the assessment or refinement of ideas for new
movie concepts (Lilien et al., 2002; Sawhney and Prandelli, 2001).

17
The empirical study was divided into two distinct phases. In the first phase, a VSM was
set up focusing on the topic of movies. In the second phase, participants were asked to answer an
online-survey some weeks after the final round of the VSM.
Description of the virtual stock market
Participants of this VSM called "Movie Exchange" were attracted through a pop-up
window and other advertisements on the website of a leading movie theater operator. Participants
at this VSM could trade (and predict) the nationwide box-office success (number of visitors). The
VSM was conducted in six consecutive rounds, each round lasting about a month. Virtual stocks
for ten to fifteen movies were traded in each round. In total, virtual stocks were traded for seventy
movies. New participants could register anytime, subsequently leading to a larger number of
participants.
Each participant at the movie exchange received an initial endowment of 1,000 shares of
movie stock in each round, $250,000 (virtual) and the provision of an interest free loan of up to
$250,000 (virtual). The portfolio value of previous rounds could not be transferred. Hence, each
participant had the same starting conditions in each round. Stocks were traded at the movie
exchange with a double-auction market mechanism, similar to the one used in the New York
Stock Exchange. No trade fees were imposed and trading could be done twenty-four hours a day
during the time of the VSM.
At the end of the VSM, each share of movie stock received a cash dividend (payoff)
according to the total number of visitors of the respective movie until the end of the specific
round. The cash dividend consisted of one virtual dollar for every 1,000 visitors:
(1) , ,0.001m T m Td Z= ⋅ (m∈M),

18
where: ,m Td : Cash dividend of the m-th movie stock at time T (T = end of round),
TmZ , : Total number of visitors of the m-th movie to model the outcome at time T (T = end of round),
M: Index set of movies.
The incentives provided in the VSM were an annual ticket for the movie theater, for the
participant with the highest (virtual) portfolio value in each round; the participants with the
second and third highest portfolio values received ten free movie tickets and a set of movie
merchandise each. Table 1 provides details about the design of the "Movie Exchange".
INSERT TABLE 1 HERE
The performance of the participants in the VSM for each round is simply measured as the
terminal value of participant’s portfolio divided by its initial portfolio.
(2) , ,,
, ,
T i ji j
B i j
Vr
V= (i∈I, j∈J),
where: ri,j: Portfolio return in round i of jth participant, VT,i,j: Absolute terminal value of portfolio in round i of jth participant, VB,i,j: Absolute initial value of portfolio in round i of jth participant, I: Index set of rounds, J: Index set of participants.
To account for the fact that the participants could choose to remain inactive without losing
their chances to win a prize in subsequent rounds, our overall performance measure is defined as
the mean performance per active round, i.e. a round in which the participant made at least one
trade:
(3) , ,1
1 jn
M j i jij
r rn =
= ∑ (j∈J),
19
where: rM,j: Mean performance per active round of jth participant, nj: Total number of active rounds of jth participant.
Description of the survey
The participants were invited by email to participate in the survey. The questionnaire set
was based on various lead user criteria and the previous experiences of consumers with being
involved in the new product development in the movie industry. In order to increase the response
rate, a lottery of three gift vouchers with a face value of USD 50 provided an extrinsic incentive.
The field time of the survey was four weeks. The response rate was 29.2% among participants of
the Virtual Stock Market, leading to a sample of n = 102. The internal validity of results is
assessed with the help of web-surveying technology, by analyzing the log files of the surveying
server. This technology helps identify user responses that have an improbable response behavior
such as responding too fast.
The lead user identification criteria were based on the characteristics of lead users in the
consumer products market as discussed above. They consist of: "expertise", "expected benefit"
and "opinion leadership". In contrast to other lead user research (Morrison, Roberts and Midgley,
2004), this study lets all three dimensions capture unique information and does not combine them
into a one-dimensional construct. Due to the attributes of the product category "movies", the
well-established "opinion leadership" construct developed by Childers (1986) was selected,
which is based on King and Summers (1970), to measure if the consumers have innovative and
trendsetting characteristics. The other two lead user characteristics, "expertise" and "expected
benefit", are based on the results of Lüthje (2004). Table 2 provides a detailed overview of the
items used to measure the three constructs of lead user characteristics and Table 3 provides the
descriptive statistics for the variables used in this study.

20
INSERT TABLE 2 AND TABLE 3 HERE
Results
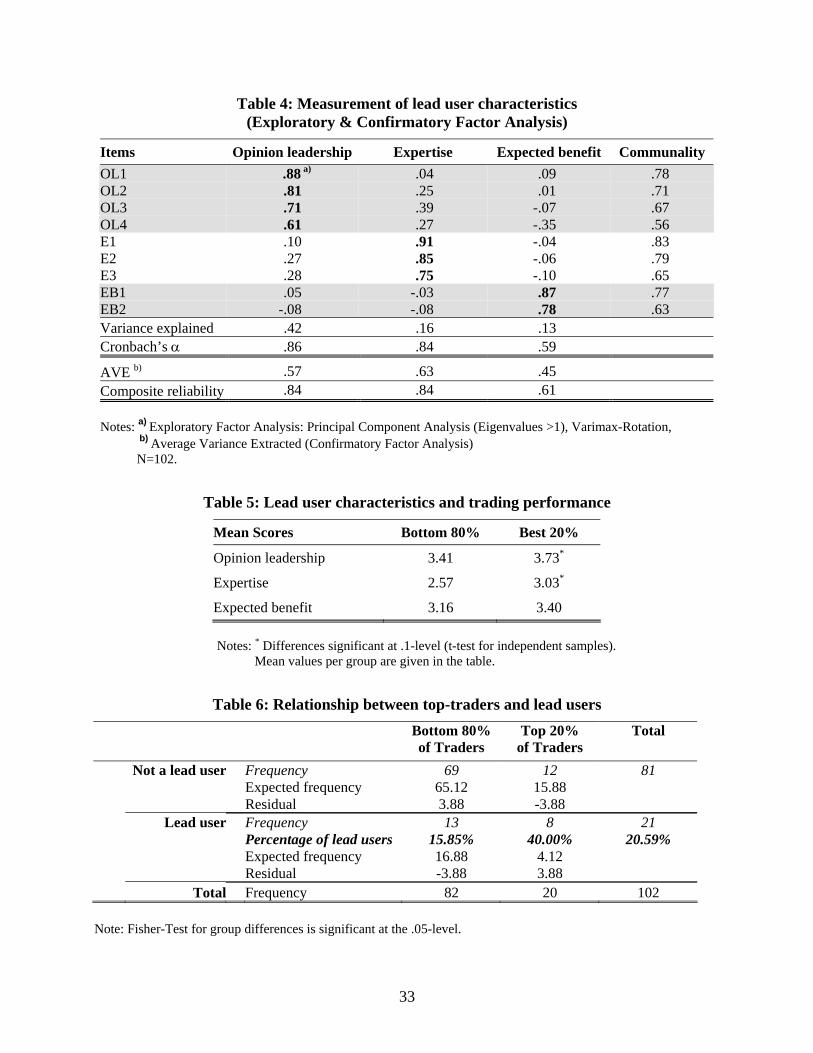
Table 4 gives the results of the lead user characteristics analysis. The analysis helps to
calculate the suggested three dimensions of lead user characteristics. As noted before, the studies
of Morrison, Roberts and Midgley (2004) and Lüthje (2004) differ with respect to the number of
dimensions for lead user characteristics. Our study supports the results of Lüthje (2004), meaning
that the constructs ‘expertise’ and ‘expected benefit’ are independent and are important
characteristics of lead users in consumer products markets. The construct ‘opinion leadership’ is
the third, yet unique characteristic of lead users, which describes an important additional facet of
lead users in this study. The construct reliability is sufficient for all three factors as indicated by
the levels of Cronbach’s alpha (Peterson, 1994). The reliability and validity of these results is
further tested via a confirmatory factor analysis. The model fit is satisfactory (GFI = .88, CFI =
.89, RMSEA = .13) with GFI and CFI at about .9, although RMSEA is above the commonly
accepted criterion, which may be explained by our sample size (Hu and Bentler, 1998). The
composite reliabilities of our constructs are 83.88% for opinion leadership, 83.56% for expertise
and 61.12% for expected benefit, which are above the commonly accepted criteria of 60% (e.g.,
Fornell and Larcker, 1981). The average variances extracted (AVE) are 56.86% for opinion
leadership, 63.25% for expertise and 45.32% for expected benefit. All constructs meet the
restrictive criterion suggested by Fornell and Larcker (1981), which requires the explained
variance of two constructs to be higher than the variance shared between the constructs. This
leads to the conclusion that our measures of lead user characteristics are reliable and valid.
INSERT TABLE 4 HERE

21
Subsequently, the lead users in the sample are identified based on these three constructs.
The threshold level is the sample mean for each construct, being 3.48 for the construct ‘opinion
leadership’, 2.66 for ‘expertise’ and 3.21 for ‘expected benefit’. This step-by-step screening using
the means as threshold levels has been used in other lead user studies in the consumer products
field (Lüthje, 2004) which allows us to compare our findings with those of other studies. In our
case, this procedure yields a total of 21 (= 20.6%) respondents fulfilling the required levels of
lead user criteria. This percentage of lead users is much higher than in two of the three consumer
products industries (board games and local transport, both less than 10%), as previously
researched (Lüthje, 2004). The third category, outdoor sport equipment, yields a share of lead
user of slightly less than 30%. Hence, the results comply with our first hypothesis in two of the
three categories. However, the lack of comparable studies in consumer products markets
prohibits a more detailed analysis. Nevertheless, VSMs seem to be a suitable tool to attract a
large number of lead users.
The test of the second hypothesis analyzes the top performers in the VSM, i.e. the best
20% of traders, as regards to their fulfillment of lead user criteria. The cut-off value for this group
of traders is a mean performance value for each actively traded round of 5.4% (due to high
starting values for the stock prices, the whole sample of actively trading participants has a
negative mean performance of -27.9%). An examination of the mean values of the lead user
criteria clearly shows that they are increasing with performance (see Table 5). The differences for
"opinion leadership" and "expertise" are significant at the 10%-level.
INSERT TABLE 5 HERE
Furthermore, our study analyzed whether there is a considerably high percentage of lead
users among the top performers of the VSM. For this purpose, the percentage of lead users

22
among the top 20% of traders is compared with the one of the bottom 80% of traders (see Table
6). The group of top 20%-traders contains 20 users of which eight are lead users (40.00%). The
other group includes 82 users of which only 13 are lead users (15.85%). Thus, the percentage of
lead users in the group of top 20%-traders is almost double compared to the whole sample of
VSM participants with a lead user percentage of 20.59%. Applying a VSM for lead user
identification based on the top 20% of traders leads to an overall hit ratio of 75.5% ((69+8)/102)
of correctly classified participants. The Fisher-Test shows a significant relationship between the
trade performance and the frequency of lead users at the 5%-level. Thus, our results are
consistent with the second hypothesis. Top traders in a VSM are more likely to have lead user
characteristics than the average trader.
INSERT TABLE 6 HERE
However, not every lead user is among the top performers in our sample. Therefore, the
lead users among the best 20% of traders are compared to those among the bottom 80% of traders
according to their values of the lead user criteria. Top performing lead users have a significantly
higher value of "expertise" (at the 10%-level), as well as a higher (but not significant) value of
"expected benefit" (see Table 7). The value for "opinion leadership" is lower (however not
significantly) for top performing participants. Thus, top performing lead users are characterized
by a significantly higher level of expertise for the product being traded, displaying their superior
ability to forecast the market success of the new product.
INSERT TABLE 7 HERE

23
Discussion The results of our empirical study permit the conclusion that VSMs can identify lead users
in consumer products markets. Due to their special characteristics, lead users perform better than
the average participants in a VSM. Our empirical study finds a substantial amount of lead users
among the best performing traders. The percentage of lead users among top 20%-performers is at
least as high as the one found in a study using a traditional survey-based research approach to
identify lead users in consumer markets (Lüthje, 2004). Hence, using VSMs for screening
purposes can be an efficient alternative to survey-based screening. Given the growing interest and
applications of VSMs in business forecasting, VSMs can also be used to identify lead users, with
almost no additional costs. These identified lead users might be invited to contribute to a
company's new product development process.
Another interesting implication is that obviously not all lead users perform well in the
VSM. Apparently, not every lead user possesses a superior ability to forecast the market success
of new products. A reason for this might be that some lead users cannot translate their assessment
of unsatisfied needs to an assessment of a new product's success in the marketplace. VSMs can
have the advantage of selecting those lead users who have a better understanding of the market,
besides fulfilling the lead user criteria. They are probably the ones, who can be easily integrated
into the new product development process, because they experience market needs earlier than
others and can evaluate the success of new products that try to meet these needs.
These results are very encouraging for the new product development in consumer
products markets, because lead users can be efficiently identified by means of VSMs and
subsequently integrated into the new product development process. These lead users provide their
own ideas for new products; they make suggestions for improving existing products and are

24
valuable consultants during the new product development process for refining, assessing and
choosing the best product design. The integration of lead users into the new product development
process in consumer product markets can be performed through the Internet because of its
inherent advantages (Dahan and Hauser, 2002; Nambisan, 2002). In addition, it is possible to
combine off-line with on-line lead user integration. The continuous and systematic integration of
lead users into the new product development should help to reduce the high failure rates of new
products in consumer markets.
Our study has various implications for producers, exhibitors and service providers in the
movie industry. Firstly, market research service providers in the movie industry may apply VSMs
not only for prediction, but also for lead user identification purposes. This implication is directly
applicable to the Hollywood Stock Exchange, which conducts such a VSM for movie predictions,
comparable to the one applied in this study. However, other market research companies as well as
studios can reassess the benefits of VSMs, i.e., prediction and lead user identification. Secondly,
the identified lead users can be used by studios for testing the concepts of new storyboards,
casting decisions and pre-screening of movies in order to decide on the final cut of movies. While
deciding on the marketing plan, lead users can support studios in testing different trailers and
commercials as well as the exhibitors’ screen allocation decision.
In other industries, consumer product companies may set up a VSM as part of their
community websites (e.g. www.pampers.com), where participants can trade the market share of
different products or the attractiveness of new product concepts (e.g. Dahan, Soukhoroukova and
Spann (2009)). Such a VSM can be an attractive feature of the community website and may
provide information on the evaluation of different product concepts. The identification of lead
users has almost no additional costs if it simply exploits the results of existing Virtual Stock

25
Markets. If a VSM needs to be set up and run for lead user identification purposes alone, its cost-
benefit ratio has to be compared to other methods. Apart from one-time software development
costs, the costs for VSMs are incurred for setup (layout and design modification, introduction of
stocks and background information), monitoring during the trading period, termination (payoff of
stocks, winner determination), and incentives for participation. Our experience shows that these
costs are about 3,000 USD for a VSM that runs for four weeks. The costs for a comparable web
survey including the costs for setup (layout and design of questionnaire), incentives for
participation and analysis should be about 2,500 to 3,000 USD. Hence, there is no major cost
advantage for any of these two methods.
Our research also has some limitations, thereby indicating the need and venues for further
research. Firstly, our empirical study analyzed only one product category, although at multiple
points of time. Future research should apply VSMs for lead user identification in other consumer
product categories and compare those results to the ones of other methods. Such an extension
would permit comparisons across product categories with respect to the percentage of lead users
and the ability of different methods to identify those. Secondly, the limited availability of other
studies in the field of lead user identification in consumer products markets prohibits a more
quantitative assessment of the performance of VSMs compared to survey-based identification.
Thirdly, besides attracting rather sophisticated consumers with a greater involvement in the
product of interest, a VSM might attract consumers with a tendency towards gambling. However,
the incentives in a VSM – if provided – are linked to performance in the VSM. This means that
successful participation requires knowledge about the product being predicted and cannot be
achieved by gambling alone. Hence, the self-selection effect should still work mainly towards
involved consumers, even if some of them have an additional tendency towards gambling.

26
Our conclusion is that VSMs are an effective means to attract and filter large numbers of
anonymous customers for the identification of lead users on the Internet. The process of
identifying lead users may become more efficient, as further initiatives such as screening surveys
or even workshops can be targeted to the fairly small group of top performers in a VSM, that
already contains a large amount of lead users.

27
References Bloch, Peter H., Nancy M. Ridgway, and Daniel L. Sherell (1989). Extending the Concept of Shopping: An Investigation of Browsing Activity. Journal of the Academy of Marketing Science 17 (1): 13-21. Chen, Kay-Yut and Charles R. Plott (2002). Information Aggregation Mechanisms: Concept, Design and Implementation for a Sales Forecasting Problem. Pasadena: California Institute of Technology. Chen, Kay-Yut, Leslie R Fine, and Bernardo A Huberman (2004). Eliminating Public Knowledge Biases in Information-Aggregation Mechanisms. Management Science 50 (7): 983-994. Childers, Terry L. (1986). Assessment of the Psychometric Properties of an Opinion Leadership Scale. Journal of Marketing Research 23 (2): 184-188. Dahan, Ely and John R. Hauser (2002). The Virtual Customer. Journal of Product Innovation Management 19 (5): 332-353. Dahan, E., Kim, A., Lo, A.W., Poggio, T., and Chan, N.T. (2008). Securities Trading of Concepts (STOC). Working Paper, University of California at Los Angeles. Dahan, Ely, Soukhoroukova, Arina, and Spann, Martin (2009). New Product Development 2.0: Preference Markets. How Scalable Securities Markets Identify Winning Product Concepts & Attributes. Journal of Product Innovation Management. Forthcoming. Debruyne, Marion, Rudy Moenaert, Abbie Griffin, Susan Hart, Erik Jan Hultink, and Henry Robben (2002). The Impact of New Product Launch Strategies on Competitive Reaction in Industrial Markets. Journal of Product Innovation Management 19 (2): 159-170. Eliashberg, Jehoshua, Anita Elberse, and Mark A.A.M. Leenders (2006). The Motion Picture Industry: Critical Issues In Practice, Current Research, And New Research Directions. Marketing Science 25(6):638-661. Eliashberg, Jehoshua and Steven M. Shugan (1997). Film Critics: Influencers or Predictors? Journal of Marketing 61 (2): 68-78. Fama, Eugene F. (1970). Efficient Capital Markets: A Review of Theory and Empirical Work. Journal of Finance 25 (2): 383-417. Fama, Eugene F. (1991). Efficient Capital Markets: II. Journal of Finance 46 (5): 1575-1617. Fornell, Claes and David F Larcker (1981). Evaluating Structural Equation Models with Unobservable Variables and Measurement Error. Journal of Marketing Research 18 (1): 39-50. Forsythe, Robert, Forrest Nelson, George R. Neumann, and Jack Wright (1992). Anatomy of an Experimental Political Stock Market. American Economic Review 82 (5): 1142-1161. Forsythe, Robert, Thomas A. Rietz, and Thomas W. Ross (1999). Wishes, Expectations and Actions: A Survey on Price Formation in Election Stock Markets. Journal of Economic Behavior & Organization 39 (1): 83-110.

28
Franke, Nikolaus and Sonali Shah (2003). How Communities Support Innovative Activities: An Exploration of Assistance and Activities Among Innovative Users of Sporting Equipment. Research Policy 32 (1): 157-178. Gruca, Thomas S., Joyce Berg, and Michael Cipriano (2003). The Effect of Electronic Markets on Forecasts of New Product Success. Information Systems Frontiers 5 (1): 95-105. Gruner, Kjell and Christian Homburg (2000). Does Customer Interaction Enhance New Product Success. Journal of Business Research 49 (1): 1-14. Han, Jin K., Namwoon Kim and Rajendra K. Srivastava (1998). Market Orientation and Organizational Performance: Is Innovation a Missing Link? Journal of Marketing 62 (4): 30-45. Hanson, Robin (1992). Idea Futures: Encouraging an Honest Consensus. Extropy 3(2): 7-17. Hayek, Friedrich August von (1945). The Use of Knowledge in Society. American Economic Review 35 (4): 519-530. Hu, Li-tze and Peter M. Bentler (1998). Fit Indices in Covariance Structure Modeling: Sensitivity to Underparameterized Model Misspecification. Psychological Methods 3 (4): 424-453. Jaworski, Bernard J. and Ajay K. Kohli (1993). Market Orientation: Antecedents and Consequences. Journal of Marketing 57 (3): 53-70. Khurana, Anil and Stephen R. Rosenthal (1998). Towards Holistic 'Front Ends' In New Product Development. Journal of Product Innovation Management 15 (1): 57-74. King, Charles W. and John O. Summers (1970). Overlap of Opinion Leadership Across Product Categories. Journal of Marketing Research 7 (1): 43-50. Lehmann, Donald R. and Charles B. Weinberg (2000). Sales Through Sequential Distribution Channels: An Application to Movies and Videos. Journal of Marketing 64 (3): 18-33. Lilien, Gary L., Pamela D. Morrison, Kathleen Searls, Mary Sonnack, and Eric von Hippel (2002). Performance Assessment of the Lead User Idea-Generation Process for New Product Development. Management Science 48 (8): 1042-1059. Lüthje, Christian (2004). Characteristics of Innovating Users in a Consumer Goods Field. Technovation 24 (9): 683-695. Mangold, Bernard, Mike Dooley, Rael Dornfest, Gary W. Flake, Havi Hoffman, Tejaswi Kasturi, and David M. Pennock (2005). The Tech Buzz Game. IEEE Computer 38(7): 94-97. Mittal, Banwari (1989). Must Consumer Involvement Always Imply More Information Search? Advances in Consumer Research 16 (1): 167-72. Morrison, Pamela D., John H. Roberts and David F. Midgley (2004). The Nature of Lead Users and Measurement of Leading Edge Status. Research Policy 33 (2): 351-362. Nambisan, Satish (2002). Designing Virtual Customer Environments for New Product Development: Toward a Theory. Academy of Management Review 27 (3): 392-413.

29
Ogawa, Susumu and Frank T. Piller (2006). Reducing the Risks of New Product Development. MIT Sloan Management Review 47 (2): 65-71. Oliven, Kenneth and Thomas A Rietz (2004). Suckers Are Born but Markets Are Made: Individual Rationality, Arbitrage, and Market Efficiency on an Electronic Futures Market. Management Science 50 (3): 336-351. Ostrover, Steven (2005). Employing Information Markets to Achieve Truly Colloborative Sales Forecasting. Journal of Business Forecasting 24 (1): 9-12. Peterson, Robert A. (1994). A Meta-Analysis of Cronbach's Coefficient Alpha. Journal of Consumer Research 21 (2): 381-391. Pennock, David M., Steve Lawrence, Lee C. Giles, and Finn Arup Nielsen (2000). The Power of Play: Efficiency and Forecast Accuracy in Web Market Games. Princeton: NEC Research Institute. Ram, S. and Jung Hyung-Shik (1989). The Link Between Involvement, Use Innovativeness and Product Usage. Advances in Consumer Research 16 (1): 160-66. Sawhney, Mohanbir S. and Jehoshua Eliashberg (1996). A Parsimonious Model for Forecasting Gross Box-Office Revenues of Motion Pictures. Marketing Science 15 (2): 113-31. Sawhney, Mohanbir S. and Emanuela Prandelli (2001). Beyond Customer Knowledge Management: Customers as Knowledge Co-Creators, In: Knowledge Management and Virtual Organization, Yogesh Malhotra (ed). Hershey: Idea Group Publishing, 258-281. Servan-Schreiber, E., David Pennock, Justing Wolfers, and Brian Galebach (2004). Prediction markets: Does money matter? Electronic Markets 14 (3): 1-10. Smith, Vernon L. (1982). Microeconomic Systems as an Experimental Science. American Economic Review 72 (5): 923-955. Spann, Martin and Bernd Skiera (2003). Internet-Based Virtual Stock Markets for Business Forecasting. Management Science 49 (10): 1310-1326. Thomke, Stefan and Eric von Hippel (2002). Customers as Innovators. Harvard Business Review 80 (April): 74-81. Urban, Glen I. and Eric von Hippel (1988). Lead User Analyses for the Development of New Industrial Products. Management Science 34 (5): 569-582. Urban, Glen I. and John R. Hauser (1993). Design and Marketing of New Products (2nd edition): Prentice Hall. Von Hippel, Eric (1978). Successful Industrial Products From Customer Ideas. Journal of Marketing 42 (1): 39-49. Von Hippel, Eric (1976). The Dominant Role of Users in the Scientific Instrument Innovation Process. Research Policy 5 (3): 212-239.

30
Von Hippel, Eric (1986). Lead Users: A Source of Novel Product Concepts. Management Science 32 (7): 791-805. Von Hippel, Eric (1988). The Sources of Innovation. Oxford: Oxford University Press. Von Hippel, Eric (1994). Sticky Information and the Locus of Problem Solving: Implications for Innovation. Management Science 40 (4): 429-439. Von Hippel, Eric and Ralph Katz (2002). Shifting Innovation to Users via Toolkits. Management Science 48 (7): 821-833. Wolfers, Justin and Eric Zitzewitz (2004). Prediction Markets. Journal of Economic Perspectives 18 (2): 107-126.

31
Table 1: Design of the "Movie Exchange"
Step Decisions Choice of forecasting goal
• Forecasting the number of movie visitors • Payoff function: one virtual dollar for every 1,000 movie visitors • Duration: Duration of one month for each of six rounds between
May and October 2001 • Open to the public; participants can join at any time
Incentives for participation and information revelation
Composition of Initial Portfolios / Endowment: • Endowment of 100 shares of each type of movie stock and $250,000
(virtual) per participant • Provision of loans up to $250,000 (virtual) at no interest rate per
participant Remuneration / Incentive Mechanism: • Non-monetary rewards • Rank-order tournament: Rewards for participants with the highest,
second highest and third highest increase in (virtual) portfolio value • Time interval: Whole virtual stock market duration • Incentives not based on performance: None
Financial market design • Double auction trading mechanism with open order book • Trading times: Twenty-four hours a day, seven days a week • No short trading • Order types: Limit and market without temporal restriction • No position limits, maximum price limit of 3,500 • No trading fee

32
Table 2: Items used to measure lead user characteristics
Construct Measurement item Opinion leadership:
- In a discussion of movies, you would most likely: listen to your friends' ideas – convince your friends of your ideas (OL1)
- When you talk to your friends about movies, do you give: very little information – a great deal of information (OL2)
- In discussions of movies, which of the following happens most often? Your friends tell you about movies – you tell your friends about movies (OL3)
- Overall in all of your discussion with friends and neighbors, are you: not used as a source of advice – often used as a source of advice (OL4)
Expertise: - Movies consume a large portion of my free time in relation to other hobbies. (E1) - Movies are very important to me compared to my other hobbies. (E2) - I frequently go to the movies. (E3) Expected - I am dissatisfied with the movies screened recently at theatres. (EB1) benefit: - I would go to the movies more frequently if they would better meet my
expectations. (EB2) Note: All items except for the opinion leadership construct are Likert-type five point scales using "fully agree" and "do not agree" as anchors. The individual anchors for the opinion leadership scale are listed above.
Table 3: Descriptive statistics
Variable Mean SD OL1 a) OL2 a) OL3 a) OL4 a) E1 a) E2 a) E3 a) EB1 a) EB2 a) OL a) E a) EB a)
OL1 3.29 0.80 OL2 3.63 1.10 0.59OL3 3.38 0.90 0.57 0.57OL4 3.60 0.97 0.41 0.49 0.45E1 2.49 1.20 0.18 0.25 0.41 0.40E2 3.07 1.27 0.28 0.52 0.44 0.37 0.75E3 2.41 1.00 0.28 0.38 0.56 0.31 0.57 0.58EB1 3.07 1.01 0.15 -0.02 -0.04 -0.27 -0.04 -0.07 -0.13EB2 3.34 1.17 -0.10 -0.03 -0.15 -0.17 -0.13 -0.18 -0.15 0.42OL 3.48 0.75 0.78 0.85 0.80 0.75 0.39 0.51 0.48 -0.07 -0.14E 2.66 1.01 0.28 0.44 0.53 0.42 0.90 0.91 0.80 -0.08 -0.17 0.53EB 3.21 0.92 0.02 -0.03 -0.12 -0.26 -0.10 -0.15 -0.16 0.82 0.87 -0.12 -0.16MP -0.28 0.30 0.01 0.11 0.07 0.28 0.09 0.07 0.16 0.04 0.25 0.15 0.12 0.18 Notes: a) Correlations.
Notation: items are labelled according to Table 2: OL1-OL4, E1-E3, EB1-EB2; Constructs are labelled OL (Opinion Leadership), E (Expertise), EB (Expected Benefit). MP indicates the 'mean performance'.
33
Table 4: Measurement of lead user characteristics (Exploratory & Confirmatory Factor Analysis)
Items Opinion leadership Expertise Expected benefit Communality OL1 .88 a) .04 .09 .78 OL2 .81 .25 .01 .71 OL3 .71 .39 -.07 .67 OL4 .61 .27 -.35 .56 E1 .10 .91 -.04 .83 E2 .27 .85 -.06 .79 E3 .28 .75 -.10 .65 EB1 .05 -.03 .87 .77 EB2 -.08 -.08 .78 .63 Variance explained .42 .16 .13 Cronbach’s α .86 .84 .59
AVE b) .57 .63 .45 Composite reliability .84 .84 .61 Notes: a) Exploratory Factor Analysis: Principal Component Analysis (Eigenvalues >1), Varimax-Rotation, b) Average Variance Extracted (Confirmatory Factor Analysis) N=102.
Table 5: Lead user characteristics and trading performance
Mean Scores Bottom 80% Best 20%
Opinion leadership 3.41 3.73*
Expertise 2.57 3.03*
Expected benefit 3.16 3.40 Notes: * Differences significant at .1-level (t-test for independent samples).
Mean values per group are given in the table.
Table 6: Relationship between top-traders and lead users
Bottom 80% of Traders
Top 20% of Traders
Total
Not a lead user Frequency 69 12 81 Expected frequency 65.12 15.88 Residual 3.88 -3.88
Lead user Frequency 13 8 21 Percentage of lead users 15.85% 40.00% 20.59%
Expected frequency 16.88 4.12 Residual -3.88 3.88
Total Frequency 82 20 102 Note: Fisher-Test for group differences is significant at the .05-level.
34
Table 7: Top and bottom performing lead user
Mean scores Lead users among
Bottom 80% of Traders Lead users among
Best 20% of Traders
Opinion leadership 4.04 3.94
Expertise 3.31 3.88*
Expected benefit 3.85 4.06
Notes: * Differences significant at .1-level (t-test for independent samples). Mean values per group are given in the table.
Figure 1: Market Research via Virtual Stock Markets
Virtual Stock Market
Traders' individual portfoliosStock Prices
Expert Identification
• This study• Chen/Plott (2002)
• Forsythe et al. (1992)
• Forsythe/Rietz/Ross (1999)
• Pennock et al. (2000)
• Spann/Skiera (2003)
• Gruca/Berg/Cipriano (2003)
• Wolfers/Zitzewitz (2004)
• Oliven/Rietz (2004)
Forecasting Events in near Future
ForecastingAlternatives
• Dahan et al. (2008)
• Hanson (1992)
• Dahan/Soukhoroukova/ Spann (2009)