Embed Size (px)
Citation preview

Primary Mufson Howe Hunter Contacts:
Anthony J. Lopez-Ona Managing Director 215.399.5405 [email protected] Michael J. Mufson Managing Director 215.399.5410 [email protected] Brandon K. Eck Managing Director 215.399.5411 [email protected] Michael J. Howe Managing Director 215.399.5413 [email protected] Joseph M. Manko, Jr. Managing Director 215.399.5402 [email protected]
Consumer Products Update October 2021 The Mufson Howe Hunter Consumer Products Update is designed to update business leaders, investors and industry professionals on current market trends and important developments within the consumer products sector of the economy. This report contains information on select companies in various subsectors within consumer products emphasizing financial performance, stock performance and M&A transactions.
p
\
Mufson Howe Hunter & Company LLC is a middle-market focused investment bank providing M&A, capital raising and financial advisory services. Member SIPC | FINRA

0
MHH Sectors
Cleaning and Bath Products
Décor
Furniture
Hardware and Outdoor
Household Appliances
Housewares
MHH’s coverage of the Consumer Products Sector spans companies in the following six sub-segments for each
of which our index has been calculated as follows:
The MHH Cleaning and Bath Products Index is currently comprised of Church & Dwight Co., Inc., Colgate-
Palmolive Company, Kimberly-Clark Corporation, McBride plc, Prestige Brands Holdings, Inc., PZ Cussons Plc,
Reckitt Benckiser Group plc, The Clorox Company and The Procter & Gamble Company.
The MMH Décor Index is currently comprised of Armstrong World Industries, Inc., Colefax Group plc, Culp, Inc.,
Fortune Brands Home & Security, Inc., Interface, Inc., Masco Corporation, Mohawk Industries, Inc., RPM
International Inc., The Dixie Group, Inc. and The Sherwin-Williams Company
The MHH Furniture Index is currently comprised of Bassett Furniture Industries, Incorporated, Crown Crafts,
Inc., Flexsteel Industries, Inc., Herman Miller, Inc., HNI Corporation, Hooker Furniture Corporation, Kimball
International, Inc., Leggett & Platt, Incorporated, Steelcase Inc., Tempur Sealy International, Inc. and Unifi, Inc.
The MHH Hardware and Outdoor Index is currently comprised of Central Garden & Pet Company, Einhell
Germany AG, Husqvarna AB (publ), P&F Industries, Inc., Spectrum Brands Holdings, Inc., Techtronic Industries
Company Limited, The Toro Company and WD-40 Company.
The MMH Household Appliance Index is currently comprised of AB Electrolux, De'Longhi S.p.A., Fiskars Oyj,
iRobot Corporation, NACCO Industries, Inc., Stanley Black & Decker, Inc. and Whirlpool Corporation.
The MHH Housewares Index is currently comprised of Churchill China plc, Duni AB (publ), Helen of Troy Limited,
Henkel AG & Co. KGaA, Leifheit AG, Lifetime Brands, Inc., Newell Brands Inc., Portmeirion Group plc, SEB SA and
Tupperware Brands Corporation.
The companies that comprise each Index can change periodically as a result of a variety of reasons, including
mergers, acquisitions, initial public offerings and other transactions; therefore, comparisons to historical time
periods and historical performance for each Index may not entirely correspond and correlate to the Index’s
current performance. In addition, historical performance is not a guarantee or prediction of future results.
The information and statistical data contained herein have been obtained from sources that Mufson Howe
Hunter believes are reliable, but Mufson Howe Hunter makes no representation or warranty as to the accuracy
or completeness of any such information and data and expressly disclaims any and all liability relating to or
resulting from your use of these materials. The information and data contained herein are current and only as
of the date(s) indicated and Mufson Howe Hunter has no intention, obligation or duty to update these materials
after such date(s). These materials do not constitute an offer to sell or the solicitation of an offer to buy any
securities. Copyright © 2021 Mufson Howe Hunter & Company LLC. All rights reserved. The Consumer Products
Update is produced by Mufson Howe Hunter. Mufson Howe Hunter provides a full range of investment banking
services to consumer and retail companies. For more information, visit www.mhhco.com.
TABLE OF CONTENTS
Consumer Products Group Summary ................................................................... 1
Cleaning and Bath Products .................................................................................. 5
Décor .................................................................................................... 9
Furniture .................................................................................................. 13
Hardware and Outdoor ...................................................................................... 17
Household Appliances ........................................................................................ 21
Housewares .................................................................................................. 25
5

Consumer Products Group Summary
1
Public Comp Group Valuation Metrics
($ in millions, except per share data) Market & Capitalization LTM Performance Valuation MarginsEquity Enterprise Price/ Gross
Company Price (1)
Value Value (2)
Revenue EBITDA EPS Revenue EBITDA EPS Profit EBITDA
Cleaning and Bath Products
The Procter & Gamble Company (NYSE:PG) $139.80 $338,308.7 $361,641.7 $77,138.0 $21,568.0 $5.47 4.69 x 16.8 x 25.5 x 50.5% 27.5%
Colgate-Palmolive Company (NYSE:CL) 79.37 66,949.7 74,306.7 17,081.0 4,629.0 3.20 4.35 x 16.1 x 24.8 x 60.7% 26.0%
Reckitt Benckiser Group plc (LSE:RKT) 78.71 56,223.7 68,923.1 18,893.7 4,466.5 (3.19) 3.65 x 15.4 x NM 58.8% 23.1%
Kimberly-Clark Corporation (NYSE:KMB) 132.44 44,594.8 53,511.8 19,311.0 4,288.0 5.88 2.77 x 12.5 x 22.5 x 32.9% 19.6%
The Clorox Company (NYSE:CLX) 165.61 20,339.1 23,387.1 7,341.0 1,542.0 5.58 3.19 x 15.2 x 29.7 x 43.6% 19.4%
Church & Dwight Co., Inc. (NYSE:CHD) 82.57 20,274.5 22,256.3 5,046.3 1,159.4 3.21 4.41 x 19.2 x 25.7 x 44.1% 22.2%
Prestige Consumer Healthcare Inc. (NYSE:PBH) 56.11 2,808.9 4,225.3 983.2 392.3 3.53 4.30 x 10.8 x 15.9 x 58.9% 34.5%
PZ Cussons Plc (LSE:PZC) 2.75 1,150.4 1,239.2 857.1 121.2 0.12 1.45 x 10.2 x 23.2 x 39.3% 12.7%
McBride plc (LSE:MCB) 0.80 139.3 303.0 942.3 60.2 0.11 0.32 x 5.0 x 7.4 x 34.7% 5.8%
Mean $61,198.8 $67,754.9 $16,399.3 $4,247.4 $2.66 3.24x 13.5x 21.8x 47.1% 21.2%
Median 20,339.1 23,387.1 7,341.0 1,542.0 3.21 3.65x 15.2x 24.0x 44.1% 22.2%
Décor
The Sherwin-Williams Company (NYSE:SHW) $279.73 $72,780.9 $83,276.7 $19,671.3 $4,038.4 $7.30 4.23 x 20.6 x 38.3 x 44.7% 17.5%
Masco Corporation (NYSE:MAS) 55.55 13,729.9 16,311.9 7,992.0 1,292.5 1.99 2.04 x 12.6 x 27.9 x 36.3% 15.4%
Fortune Brands Home & Security, Inc. (NYSE:FBHS) 89.42 12,329.1 14,497.5 7,353.1 1,281.0 5.42 1.97 x 11.3 x 16.5 x 36.4% 17.5%
Mohawk Industries, Inc. (NYSE:MHK) 177.40 12,245.8 13,911.7 10,839.5 2,138.1 14.53 1.28 x 6.5 x 12.2 x 29.5% 17.9%
RPM International Inc. (NYSE:RPM) 77.65 10,072.4 12,554.4 6,150.0 910.8 3.52 2.04 x 13.8 x 22.1 x 38.5% 13.4%
Colfax Corporation (NYSE:CFX) 45.90 6,533.5 8,280.1 3,499.2 602.3 0.79 2.37 x 13.7 x 58.1 x 42.7% 15.8%
Armstrong World Industries, Inc. (NYSE:AWI) 95.47 4,532.5 5,104.6 1,062.8 348.1 3.70 4.80 x 14.7 x 25.8 x 36.3% 24.3%
Interface, Inc. (NasdaqGS:TILE) 15.15 894.7 1,450.8 1,103.6 176.5 0.81 1.31 x 8.2 x 18.6 x 36.5% 13.4%
The Dixie Group, Inc. (NasdaqGM:DXYN) 4.86 75.0 172.0 365.7 26.0 0.12 0.47 x 6.6 x 38.9 x 24.7% 5.7%
Culp, Inc. (NYSE:CULP) 12.88 157.2 129.2 318.3 23.9 0.66 0.41 x 5.4 x 19.5 x 16.5% 6.5%
Mean $13,335.1 $15,568.9 $5,835.6 $1,083.8 $3.88 2.09x 11.3x 27.8x 34.2% 14.7%
Median 8,303.0 10,417.2 4,824.6 756.6 2.75 2.01x 12.0x 23.9x 36.4% 15.6%
Furniture
Tempur Sealy International, Inc. (NYSE:TPX) $46.41 $9,119.4 $11,376.9 $4,628.2 $1,087.8 $2.85 2.46 x 10.5 x 16.3 x 44.2% 20.3%
Leggett & Platt, Incorporated (NYSE:LEG) 44.84 5,977.1 7,943.9 4,810.1 809.2 3.00 1.65 x 9.8 x 15.0 x 21.7% 15.4%
Herman Miller, Inc. (NasdaqGS:MLHR) 37.66 2,853.6 4,497.2 2,628.0 357.0 0.63 1.71 x 12.6 x 59.7 x 37.2% 10.9%
Steelcase Inc. (NYSE:SCS) 12.68 1,438.2 1,798.7 2,576.0 161.1 0.04 0.70 x 11.2 x NM 28.6% 4.0%
HNI Corporation (NYSE:HNI) 36.72 1,611.1 1,756.1 2,143.6 211.7 1.70 0.82 x 8.3 x 21.6 x 36.0% 8.5%
Unifi, Inc. (NYSE:UFI) 21.93 406.1 450.1 722.1 91.9 1.82 0.62 x 4.9 x 12.1 x 14.5% 12.1%
Kimball International, Inc. (NasdaqGS:KBAL) 11.20 412.7 447.6 569.0 34.4 0.20 0.79 x 13.0 x 56.0 x 32.1% 4.6%
Hooker Furnishings Corporation (NasdaqGS:HOFT) 26.99 320.1 310.4 630.3 60.1 2.98 0.49 x 5.2 x 9.1 x 21.0% 8.0%
Flexsteel Industries, Inc. (NasdaqGS:FLXS) 30.88 209.9 283.5 511.4 35.2 3.24 0.55 x 8.1 x 9.5 x 19.0% 5.9%
Bassett Furniture Industries, Incorporated (NasdaqGS:BSET) 18.11 176.7 257.8 475.0 75.3 1.97 0.54 x 3.4 x 9.2 x 56.3% 8.9%
Crown Crafts, Inc. (NasdaqCM:CRWS) 7.40 74.2 73.5 81.7 13.0 0.75 0.90 x 5.6 x 9.9 x 29.1% 13.7%
Mean $2,054.5 $2,654.2 $1,797.8 $267.0 $1.74 1.02x 8.4x 21.8x 30.9% 10.2%
Median 412.7 450.1 722.1 91.9 1.82 0.79x 8.3x 13.5x 29.1% 8.9%
(continued on next page)
Enterprise Value/

Consumer Products Group Summary
2
Public Comp Group Valuation Metrics (cont’d.)
($ in millions, except per share data)
Equity Enterprise Price/ Gross
Company Price (1)
Value Value (2)
Revenue EBITDA EPS Revenue EBITDA EPS Profit EBITDA
Hardware and Outdoor
Techtronic Industries Company Limited (SEHK:669) $19.92 $36,538.1 $37,494.8 $12,000.0 $1,327.9 $0.54 3.12 x 28.2 x 36.9 x 38.5% 10.3%
The Toro Company (NYSE:TTC) 97.41 10,368.8 10,600.4 3,839.9 652.1 3.87 2.76 x 16.3 x 25.2 x 35.1% 16.2%
Husqvarna AB (publ) (OM:HUSQ B) 12.01 6,879.8 6,911.8 5,201.9 $864.2 $0.71 1.33 x 8.0 x 16.9 x 33.3% 15.7%
Spectrum Brands Holdings, Inc. (NYSE:SPB) 95.67 4,068.5 6,739.9 4,628.1 706.4 4.40 1.46 x 9.5 x 21.7 x 35.9% 14.4%
Central Garden & Pet Company (NasdaqGS:CENT) 48.00 2,673.9 3,496.9 3,240.5 395.5 3.06 1.08 x 8.8 x 15.7 x 29.4% 10.5%
WD-40 Company (NasdaqGS:WDFC) 231.48 3,173.4 3,212.1 488.1 98.6 5.09 6.58 x 32.6 x 45.5 x 54.0% 19.6%
Einhell Germany AG (XTRA:EIN3) 192.40 726.2 800.6 1,005.0 98.9 15.93 0.80 x 8.1 x 12.1 x 36.2% 9.3%
P&F Industries, Inc. (NasdaqGM:PFIN) 6.63 21.1 23.4 51.8 (0.0) 0.10 0.45 x NM 69.7 x 31.2% -1.8%
Mean $8,056.2 $8,660.0 $3,806.9 $517.9 $4.21 2.20x 15.9x 30.5x 36.7% 11.8%
Median 3,620.9 5,118.4 3,540.2 523.8 3.46 1.39x 9.5x 23.5x 35.5% 12.4%
Household & Family Electonics / Appliances
Stanley Black & Decker, Inc. (NYSE:SWK) $175.31 $28,568.9 $32,677.2 $17,168.8 $3,336.6 $11.24 1.90 x 9.8 x 15.6 x 35.7% 19.1%
Whirlpool Corporation (NYSE:WHR) 203.86 12,383.1 15,757.1 21,968.0 3,405.5 31.35 0.72 x 4.6 x 6.5 x 21.5% 14.4%
AB Electrolux (publ) (OM:ELUX B) 23.12 6,646.0 6,648.8 14,192.7 1,575.2 2.35 0.47 x 4.2 x 9.8 x 20.5% 10.5%
De'Longhi S.p.A. (BIT:DLG) 36.02 5,401.2 5,197.7 3,415.3 579.8 2.63 1.52 x 9.0 x 13.7 x 44.6% 16.3%
iRobot Corporation (NasdaqGS:IRBT) 78.50 2,202.0 1,999.3 1,654.4 108.2 2.63 1.21 x 18.5 x 29.8 x 38.7% 5.8%
Fiskars Oyj Abp (HLSE:FSKRS) 22.18 1,807.3 1,985.2 1,410.2 245.6 1.31 1.41 x 8.1 x 17.0 x 42.5% 15.4%
NACCO Industries, Inc. (NYSE:NC) 29.84 213.7 171.2 146.4 50.0 2.53 1.17 x 3.4 x 11.8 x 16.9% -8.5%
Mean $8,174.6 $9,205.2 $8,565.1 $1,328.7 $7.72 1.20x 8.2x 14.9x 31.5% 10.4%
Median 5,401.2 5,197.7 3,415.3 579.8 2.63 1.21x 8.1x 13.7x 35.7% 14.4%
Housewares
Henkel AG & Co. KGaA (XTRA:HEN3) $92.93 $40,334.6 $41,679.2 $23,347.2 $3,692.2 $4.30 1.79 x 11.3 x 21.6 x 46.8% 15.1%
Newell Brands Inc. (NasdaqGS:NWL) 22.14 9,418.4 14,931.4 10,385.0 1,678.5 1.68 1.44 x 8.9 x 13.2 x 32.9% 14.2%
SEB SA (ENXTPA:SK) 141.28 7,789.7 10,334.9 9,052.9 1,192.3 10.06 1.14 x 8.7 x 14.0 x 13.3% 12.1%
Helen of Troy Limited (NasdaqGS:HELE) 224.68 5,421.0 5,905.7 2,163.6 314.6 8.67 2.73 x 18.8 x 25.9 x 43.9% 14.1%
Tupperware Brands Corporation (NYSE:TUP) 21.12 1,053.7 1,671.4 1,891.8 426.2 2.53 0.88 x 3.9 x 8.4 x 68.6% 18.4%
Lifetime Brands, Inc. (NasdaqGS:LCUT) 18.19 400.3 726.0 856.2 114.1 1.78 0.85 x 6.4 x 10.2 x 34.9% 10.6%
Duni AB (publ) (OM:DUNI) 11.57 543.7 701.4 536.1 53.3 0.25 1.31 x 13.2 x 47.1 x 18.1% 8.6%
Leifheit Aktiengesellschaft (XTRA:LEI) 40.39 384.2 339.3 352.8 36.9 2.00 0.96 x 9.2 x 20.2 x 44.2% 10.2%
Churchill China plc (AIM:CHH) 13.55 149.3 131.0 57.2 0.3 0.12 2.29 x NM NM 90.4% 0.1%
Portmeirion Group PLC (AIM:PMP) 5.07 69.7 78.8 136.7 13.0 0.26 0.58 x 6.1 x 19.3 x 53.0% 7.6%
Mean $6,556.5 $7,649.9 $4,878.0 $752.1 $3.16 1.40x 9.6x 20.0x 44.6% 11.1%
Median 798.7 1,198.7 1,374.0 214.4 1.89 1.22x 8.9x 19.3x 44.0% 11.3%
NA = Not Available; NM = Not Meaningful; LTM = Latest Twelve Months (1) As of close September 30, 2021
‡ = excluded from Mean and Median calculations (2)
Source: Public Filings, Press Releases and Published Research Reports.
Enterprise value is defined as equity value plus net debt, preferred stock and minority interests. Net Debt includes long
term debt, short term debt, postretirement benefits and unfunded pensions, if applicable, less cash and cash equivalents.
Enterprise Value/
LTM PerformanceMarket & Capitalization Valuation Margins

Consumer Products Group Summary
3
Residential Construction Trend
1) Source: US Census Bureau
500
700
900
1,100
1,300
1,500
1,700
1,900
2,100
Oct
20
19
No
v 2
01
9
Dec
20
19
Jan
20
20
Feb
20
20
Mar
20
20
Ap
r 2
02
0
May
20
20
Jun
20
20
Jul 2
02
0
Au
g 2
02
0
Sep
20
20
Oct
20
20
No
v 2
02
0
Dec
20
20
Jan
20
21
Feb
20
21
Mar
20
21
Ap
r 2
02
1
May
20
21
Jun
20
21
Jul 2
02
1
Au
g 2
02
1
Sep
20
21
New Residential Construction (1)
Permits Starts Completions

Consumer Products Group Summary
4
Public Comp Group – Operating Performance vs. EBITDA Multiple Analysis (1)
1) Companies with statistically significant outliers for EBITDA multiples are not included in graphs
16.8x15.4x 15.4x
12.5x
15.2x
19.2x
10.8x 11.2x
5.7x
0.0x
5.0x
10.0x
15.0x
20.0x
25.0x
0.0%
10.0%
20.0%
30.0%
40.0%
50.0%
60.0%
70.0%
EBIT Margin EBITDA Margin Gross Margin EBITDA Multiple
Source: CapitalIQ and MHH
Operating Performance vs. EBITDA Multiple - Cleaning & Bath Products
NY
SE
:PG
NY
SE
:CL
LSE
:RK
T
NY
SE
:KM
B
NY
SE
:CLX
NY
SE
:CH
D
NY
SE
:PB
H
LSE
:PZ
C
LSE
:MC
B
20.6x
12.6x
10.9x
6.0x
13.8x 13.7x14.7x
8.2x6.6x
5.4x
0.0x
5.0x
10.0x
15.0x
20.0x
25.0x
0.0%
5.0%
10.0%
15.0%
20.0%
25.0%
30.0%
35.0%
40.0%
45.0%
50.0%
EBIT Margin EBITDA Margin Gross Margin EBITDA Multiple
Source: CapitalIQ and MHH
Operating Performance vs. EBITDA Multiple - Decor
NY
SE
:SH
W
NY
SE
:MA
S
LSE
:FB
HS
NY
SE
:MH
K
NY
SE
:RP
M
NY
SE
:CF
X
Na
sda
qG
S:T
ILE
NY
SE
:CU
LP
Na
sda
qG
M:D
XY
N
NY
SE
:AW
I
10.5x9.8x
12.6x
8.3x
11.2x
4.9x
13.0x
5.2x
8.1x
3.4x
5.6x
0.0x
2.0x
4.0x
6.0x
8.0x
10.0x
12.0x
14.0x
0.0%
10.0%
20.0%
30.0%
40.0%
50.0%
60.0%
EBIT Margin EBITDA Margin Gross Margin EBITDA Multiple
Source: CapitalIQ and MHH
Operating Performance vs. EBITDA Multiple - Furniture
NY
SE
:TP
X
Na
sda
qG
S:M
LHR
NY
SE
:SC
S
NY
SE
:HN
I
Na
sda
qG
S:K
BA
L
NY
SE
:UF
I
Na
sda
qG
S:H
OF
T
NY
SE
:Le
g
Na
sda
qG
S:B
SE
T
Na
sda
qG
M:F
LXS
Na
sda
qC
M:C
RW
S
28.2x
16.3x
8.0x9.5x 8.8x
32.6x
8.1x
0.0x
5.0x
10.0x
15.0x
20.0x
25.0x
30.0x
35.0x
0.0%
10.0%
20.0%
30.0%
40.0%
50.0%
60.0%
EBIT Margin EBITDA Margin Gross Margin EBITDA Multiple
Source: CapitalIQ and MHH
Operating Performance vs. EBITDA Multiple - Hardware
SE
HK
:66
9
OM
:HU
SQ
B
NY
SE
:SP
B
Na
sda
qG
S:W
DF
C
Na
sda
qG
S:C
EN
T
XT
RA
:EIN
3
NY
SE
:TT
C
9.8x
4.6x4.2x
9.0x 8.1x
18.5x
0.0x
2.0x
4.0x
6.0x
8.0x
10.0x
12.0x
14.0x
16.0x
18.0x
20.0x
0.0%
10.0%
20.0%
30.0%
40.0%
50.0%
60.0%
EBIT Margin EBITDA Margin Gross Margin EBITDA Multiple
Source: CapitalIQ and MHH
Operating Performance vs. EBITDA Multiple - Household Appliances
NY
SE
:SW
K
OM
:ELU
X B
BIT
:DLG
Na
sda
qG
S:I
RB
T
HLS
E:F
SK
RS
OM
:WH
R
11.3x
8.9x 8.7x
18.8x
3.9x
13.2x
6.4x
9.2x
0.0x
2.0x
4.0x
6.0x
8.0x
10.0x
12.0x
14.0x
16.0x
18.0x
20.0x
0.0%
10.0%
20.0%
30.0%
40.0%
50.0%
60.0%
70.0%
80.0%
EBIT Margin EBITDA Margin Gross Margin EBITDA Multiple
Source: CapitalIQ and MHH
Operating Performance vs. EBITDA Multiple - Housewares
XT
RA
:HE
N3
EN
XT
PA
:SK
NY
SE
:TU
P
OM
:DU
NI
XT
RA
:LE
I
NY
SE
:NW
L
Na
sda
qG
S:L
CU
T
Na
sda
qG
S:H
ELE

Cleaning and Bath Products
5
Comparative Index Performance (Three-year and One-year)
Last Three Years
Last Twelve Months
Source: CapitalIQ
-40.00%
-20.00%
0.00%
20.00%
40.00%
60.00%
80.00%
100.00%
9/28
/18
12/2
8/18
3/28
/19
6/28
/19
9/28
/19
12/2
8/19
3/28
/20
6/28
/20
9/28
/20
12/2
8/20
3/28
/21
6/28
/21
9/28
/21
MHH Cleaning & Bath Index S&P 500 NASDAQ Composite Index
-20.00%
-10.00%
0.00%
10.00%
20.00%
30.00%
40.00%
50.00%
9/30
/20
12/3
1/20
3/31
/21
6/30
/21
9/30
/21
MHH Cleaning & Bath Index S&P 500 NASDAQ Composite Index

Cleaning and Bath Products
6
Valuation Trend
Enterprise Value/LTM Revenue
Enterprise Value/LTM EBITDA
Source: CapitalIQ
3.70x 3.78x 3.89x
3.35x 3.28x3.53x 3.57x
3.67x
3.49x3.68x
3.98x 3.99x4.41x 4.28x
3.91x 3.89x 3.96x
0.00x
1.00x
2.00x
3.00x
4.00x
5.00x
Q2
'17
Q3
'17
Q4
'17
Q1
'18
Q2
'18
Q3
'18
Q4
'18
Q1
'19
Q2
'19
Q3
'19
Q4
'19
Q1
'20
Q2
'20
Q3
'20
Q4
'20
Q1
'21
Q2
'21
Quarterly Median EV/ REV 1 Yr. Moving Average
15.6x 15.0x 14.6x
12.7x 12.6x13.8x 13.2x
15.2x14.0x
13.9x14.6x 14.1x
16.1x
17.2x
15.9x14.5x 13.7x
0.0%
5.0%
10.0%
15.0%
20.0%
25.0%
30.0%
0.0x
2.0x
4.0x
6.0x
8.0x
10.0x
12.0x
14.0x
16.0x
18.0x
20.0x
Q2
'17
Q3
'17
Q4
'17
Q1
'18
Q2
'18
Q3
'18
Q4
'18
Q1
'19
Q2
'19
Q3
'19
Q4
'19
Q1
'20
Q2
'20
Q3
'20
Q4
'20
Q1
'21
Q2
'21
Qtrly Median EV / LTM EBITDA 1 Yr. EV/EBITDA Moving Avg Qtrly Median LTM EBITDA Margin

Cleaning and Bath Products
7
Valuation and Operating Performance Matrices Graphs adjusted to eliminate statistical outliers.
NYSE:PGNYSE:CLLSE:RKT
NYSE:KMB
NYSE:CLX
NYSE:CHD
NYSE:PBH
0.0x
2.0x
4.0x
6.0x
8.0x
10.0x
12.0x
14.0x
16.0x
18.0x
20.0x
-5.0% -2.5% 0.0% 2.5% 5.0% 7.5% 10.0%
EBIT
DA
Mu
ltip
le
3-Yr Revenue CAGRSource: CapitalIQ and MHH
3-Yr Revenue CAGR vs. EBITDA Multiple
NYSE:PGNYSE:CL
LSE:RKT
NYSE:KMB
NYSE:CLX
NYSE:CHD
NYSE:PBH
LSE:MCB
0.0x
2.0x
4.0x
6.0x
8.0x
10.0x
12.0x
14.0x
16.0x
18.0x
20.0x
0.0% 2.0% 4.0% 6.0% 8.0% 10.0% 12.0% 14.0% 16.0%
EBIT
DA
Mu
ltip
le
3-Yr EBITDA CAGR
Source: CapitalIQ and MHH
3-Yr EBITDA CAGR vs. EBITDA Multiple
NYSE:PG
NYSE:CL
LSE:RKT
NYSE:KMB
NYSE:CLX
NYSE:CHD
NYSE:PBHLSE:PZC
LSE:MCB
0.0x
2.0x
4.0x
6.0x
8.0x
10.0x
12.0x
14.0x
16.0x
18.0x
20.0x
0.0% 10.0% 20.0% 30.0% 40.0% 50.0%
EBIT
DA
Mu
ltip
le
LTM EBITDA MarginSource: CapitalIQ and MHH
EBITDA Margin vs. EBITDA Multiple
NYSE:PG
NYSE:CL
NYSE:KMB
NYSE:CLX
NYSE:CHD
NYSE:PBHLSE:PZC
0.0x
2.0x
4.0x
6.0x
8.0x
10.0x
12.0x
14.0x
16.0x
18.0x
20.0x
(60.0) (10.0) 40.0 90.0 140.0
EBIT
DA
Mu
ltip
le
Cash Conversion Cycle (Days)Source: CapitalIQ and MHH CCC = DIO + DRO + DPO
Cash Conversion Cycle vs. EBITDA Multiple
NYSE:PG
NYSE:CL
LSE:RKT
NYSE:KMB
NYSE:CLX
NYSE:CHD
NYSE:PBHLSE:PZC
LSE:MCB
0.0x
1.0x
2.0x
3.0x
4.0x
5.0x
6.0x
7.0x
8.0x
0.0% 10.0% 20.0% 30.0% 40.0% 50.0%
Inve
nto
ry T
urn
ove
r R
atio
LTM EBITDA MarginSource: CapitalIQ and MHH
EBITDA Margin vs. Inventory Turn Ratio
NYSE:PG
NYSE:CLLSE:RKT
NYSE:KMB
NYSE:CLX
NYSE:CHD
NYSE:PBHLSE:PZC
LSE:MCB
0.0x
2.0x
4.0x
6.0x
8.0x
10.0x
12.0x
14.0x
16.0x
18.0x
20.0x
0.0% 10.0% 20.0% 30.0% 40.0%
EBIT
DA
Mu
ltip
le
LTM Free Cash Flow Margin
FCF Margin = (EBITDA - Capex) / RevSource: CapitalIQ and MHH
Free Cash Flow Margin vs. EBITDA Multiple

Cleaning and Bath Products
8
Valuation and Operating Performance Matrices (cont.)
Graphs adjusted to eliminate statistical outliers
NYSE:PG
NYSE:CL
LSE:RKT
NYSE:KMB
NYSE:CLX
NYSE:CHD
NYSE:PBH
LSE:PZC
LSE:MCB
0.0x
2.0x
4.0x
6.0x
8.0x
10.0x
12.0x
14.0x
16.0x
18.0x
20.0x
0.0% 5.0% 10.0% 15.0% 20.0% 25.0% 30.0% 35.0% 40.0%
EBIT
DA
Mu
ltip
le
Capital Intensity Ratio
Source: CapitalIQ and MHH Capital Intensity = (NWC - Cash + PP&E) / Revenue
Capital Intensity vs. EBITDA Multiple
NYSE:PG
NYSE:CL
LSE:RKT
NYSE:KMB
NYSE:CLX
NYSE:CHD
NYSE:PBH
LSE:PZC
LSE:MCB
0.0x
2.0x
4.0x
6.0x
8.0x
10.0x
12.0x
14.0x
16.0x
18.0x
20.0x
0.0% 5.0% 10.0% 15.0% 20.0%
EBIT
DA
Mu
ltip
le
Return on AssetsSource: CapitalIQ and MHH
Return on Assets vs. EBITDA Multiple
Selected M&A Transactions: 09/01/21 - 09/30/21
No Selected Transactions for the Month of September
Selected News Announcements
The Clorox Company (NYSE:CLX) declared a quarterly cash dividend payable November 10, 2021
Kimberly-Clark Corporation (NYSE:KMB) has appointed Deirdre Mahlan and Jaime Ramirez to its Board of Directors
Colgate-Palmolive Company (NYSE:CL) declared a quarterly cash dividend payable November 15, 2021
The Procter & Gamble Company (NYSE:PG) has appointed Carolyn Tastad to the position of CEO of its Global Health Care Business

Décor
9
Comparative Index Performance (Three-year and One-year)
Last Three Years
Last Twelve Months
Source: CapitalIQ
-40.00%
-20.00%
0.00%
20.00%
40.00%
60.00%
80.00%
100.00%
9/28
/18
12/2
8/18
3/28
/19
6/28
/19
9/28
/19
12/2
8/19
3/28
/20
6/28
/20
9/28
/20
12/2
8/20
3/28
/21
6/28
/21
9/28
/21
MHH Comp Group Décor Index S&P 500 NASDAQ Composite Index
-10.00%
-5.00%
0.00%
5.00%
10.00%
15.00%
20.00%
25.00%
30.00%
35.00%
40.00%
45.00%
9/30
/20
12/3
1/20
3/31
/21
6/30
/21
9/30
/21
MHH Comp Group Décor Index S&P 500 NASDAQ Composite Index

Décor
10
Valuation Trend
Enterprise Value/LTM Revenue
Enterprise Value/LTM EBITDA
Source: CapitalIQ
1.97x 1.95x 2.00x1.76x 1.78x 1.77x
1.39x
1.69x 1.86x 1.89x2.11x
1.41x
1.77x
2.15x2.26x
2.41x2.26x
0.00x
1.00x
2.00x
3.00x
Q2
'17
Q3
'17
Q4
'17
Q1
'18
Q2
'18
Q3
'18
Q4
'18
Q1
'19
Q2
'19
Q3
'19
Q4
'19
Q1
'20
Q2
'20
Q3
'20
Q4
'20
Q1
'21
Q2
'21
Quarterly Median EV/ REV 1 Yr. Moving Average
11.9x12.4x
12.9x
11.5x11.2x
12.3x
9.6x
11.4x
12.5x12.5x 12.3x
8.2x
10.6x10.6x 11.5x
13.2x 12.4x
0.0%
2.0%
4.0%
6.0%
8.0%
10.0%
12.0%
14.0%
16.0%
18.0%
0.0x
2.0x
4.0x
6.0x
8.0x
10.0x
12.0x
14.0x
Q2
'17
Q3
'17
Q4
'17
Q1
'18
Q2
'18
Q3
'18
Q4
'18
Q1
'19
Q2
'19
Q3
'19
Q4
'19
Q1
'20
Q2
'20
Q3
'20
Q4
'20
Q1
'21
Q2
'21
Qtrly Median EV / LTM EBITDA 1 Yr. EV/EBITDA Moving Avg Qtrly Median LTM EBITDA Margin

Décor
11
Valuation and Operating Performance Matrices Graphs adjusted to eliminate statistical outliers.
NYSE:SHW
NYSE:MAS
NYSE:FBHS
NYSE:MHK
NYSE:RPMNYSE:CFX
NYSE:AWI
NasdaqGS:TILE
NasdaqGM:DXYN
NYSE:CULP
0.0x
5.0x
10.0x
15.0x
20.0x
25.0x
-10.0% -7.5% -5.0% -2.5% 0.0% 2.5% 5.0% 7.5% 10.0% 12.5% 15.0% 17.5%
EBIT
DA
Mu
ltip
le
3-Yr Revenue CAGRSource: CapitalIQ and MHH
3-Yr Revenue CAGR vs. EBITDA Multiple
NYSE:SHW
NYSE:MAS
NYSE:FBHSNYSE:MHK
NYSE:RPM
NYSE:CFXNYSE:AWI
NasdaqGS:TILENasdaqGM:DXYN
0.0x
5.0x
10.0x
15.0x
20.0x
25.0x
-10.0% -5.0% 0.0% 5.0% 10.0% 15.0% 20.0% 25.0%
EBIT
DA
Mu
ltip
le
3-Yr EBITDA CAGR
Source: CapitalIQ and MHH
3-Yr EBITDA CAGR vs. EBITDA Multiple
NYSE:SHW
NYSE:MAS
NYSE:FBHS
NYSE:MHK
NYSE:RPMNYSE:CFX
NasdaqGS:TILE
NasdaqGM:DXYN
NYSE:CULP
0.0x
5.0x
10.0x
15.0x
20.0x
25.0x
0.0% 5.0% 10.0% 15.0% 20.0% 25.0%
EBIT
DA
Mu
ltip
le
LTM EBITDA MarginSource: CapitalIQ and MHH
EBITDA Margin vs. EBITDA Multiple
NYSE:SHW
NYSE:MAS
NYSE:FBHS
NYSE:MHK
NYSE:RPM
NYSE:CFXNYSE:AWI
NasdaqGS:TILE
NasdaqGM:DXYNNYSE:CULP
0.0x
5.0x
10.0x
15.0x
20.0x
25.0x
- 20.0 40.0 60.0 80.0 100.0 120.0 140.0 160.0
EBIT
DA
Mu
ltip
le
Cash Conversion Cycle (Days)Source: CapitalIQ and MHH CCC = DIO + DRO + DPO
Cash Conversion Cycle vs. EBITDA Multiple
NYSE:SHWNYSE:MAS
NYSE:FBHS
NYSE:MHKNYSE:RPM
NYSE:CFX
NYSE:AWI
NasdaqGS:TILENasdaqGM:DXYN
NYSE:CULP
0.0x
1.0x
2.0x
3.0x
4.0x
5.0x
6.0x
7.0x
8.0x
9.0x
0.0% 5.0% 10.0% 15.0% 20.0% 25.0% 30.0% 35.0%
Inve
nto
ry T
urn
ove
r R
atio
LTM EBITDA MarginSource: CapitalIQ and MHH
EBITDA Margin vs. Inventory Turn Ratio
NYSE:SHW
NYSE:MAS
NYSE:FBHS
NYSE:MHK
NYSE:RPM
NYSE:CFX
NYSE:AWI
NasdaqGS:TILENasdaqGM:DXYN
NYSE:CULP
0.0x
5.0x
10.0x
15.0x
20.0x
25.0x
0.0% 5.0% 10.0% 15.0% 20.0% 25.0% 30.0%
EBIT
DA
Mu
ltip
le
LTM Free Cash Flow Margin
FCF Margin = (EBITDA - Capex) / RevSource: CapitalIQ and MHH
Free Cash Flow Margin vs. EBITDA Multiple

Décor
12
Valuation and Operating Performance Matrices (cont.) Graphs adjusted to eliminate statistical outliers.
NYSE:SHW
NYSE:MAS
NYSE:FBHS
NYSE:MHK
NYSE:RPMNYSE:CFX NYSE:AWI
NasdaqGS:TILENasdaqGM:DXYN
NYSE:CULP
0.0x
5.0x
10.0x
15.0x
20.0x
25.0x
0.0% 10.0% 20.0% 30.0% 40.0% 50.0% 60.0% 70.0%
EBIT
DA
Mu
ltip
le
Capital Intensity Ratio
Source: CapitalIQ and MHH Capital Intensity = (NWC - Cash + PP&E) / Revenue
Capital Intensity vs. EBITDA Multiple
NYSE:SHW
NYSE:MASNYSE:FBHS
NYSE:MHK
NYSE:RPMNYSE:CFXNYSE:AWI
NasdaqGS:TILE
NasdaqGM:DXYN NYSE:CULP
0.0x
5.0x
10.0x
15.0x
20.0x
25.0x
0.0% 2.0% 4.0% 6.0% 8.0% 10.0% 12.0% 14.0%
EBIT
DA
Mu
ltip
le
Return on AssetsSource: CapitalIQ and MHH
Return on Assets vs. EBITDA Multiple
Selected M&A Transactions: 09/01/21 - 09/30/21
Announced Target Target Description Acquirer Value
09/28/21 Specialty Polymers, Inc. Offers emulsion polymers for the painting and coatings industry
The Sherwin-Williams Company (NYSE:SHW)
ND
ND – Not disclosed. Transaction values in millions.
Selected News Announcements
Culp, Inc. (NYSE:CULP) has appointed John A. Baugh, Kimberly B. Gatling, and Jonathan L. Kelly to its Board of Directors
Fortune Brands Home & Security, Inc. (NYSE:FBHS) declared a quarterly cash dividend payable December 15, 2021
Culp, Inc. (NYSE:CULP) declared a quarterly cash dividend payable October 18, 2021

Décor
13
Comparative Index Performance (Three-year and One-year)
Last Three Years
Last Twelve Months
Source: CapitalIQ
-60.00%
-40.00%
-20.00%
0.00%
20.00%
40.00%
60.00%
80.00%
100.00%
9/28
/18
12/2
8/18
3/28
/19
6/28
/19
9/28
/19
12/2
8/19
3/28
/20
6/28
/20
9/28
/20
12/2
8/20
3/28
/21
6/28
/21
9/28
/21
MHH Furniture Index S&P 500 NASDAQ Composite Index
-10.00%
0.00%
10.00%
20.00%
30.00%
40.00%
50.00%
60.00%
9/30
/20
12/3
1/20
3/31
/21
6/30
/21
9/30
/21
MHH Furniture Index S&P 500 NASDAQ Composite Index
Furniture

Décor
14
Valuation Trend
Enterprise Value/LTM Revenue
Enterprise Value/LTM EBITDA
Source: CapitalIQ
0.93x 0.93x 0.90x0.84x
0.87x 0.85x
0.74x0.66x 0.72x
0.79x0.83x
0.47x0.57x
0.69x
0.77x
0.93x0.89x
0.00x
0.20x
0.40x
0.60x
0.80x
1.00x
Q2
'17
Q3
'17
Q4
'17
Q1
'18
Q2
'18
Q3
'18
Q4
'18
Q1
'19
Q2
'19
Q3
'19
Q4
'19
Q1
'20
Q2
'20
Q3
'20
Q4
'20
Q1
'21
Q2
'21
Quarterly Median EV/ REV 1 Yr. Moving Average
8.7x9.3x 9.5x
8.2x 8.5x
9.8x
7.7x6.9x
8.2x 8.3x7.8x
5.1x5.8x
7.1x 7.4x
8.9x9.1x
0.0%
2.0%
4.0%
6.0%
8.0%
10.0%
12.0%
14.0%
0.0x
2.0x
4.0x
6.0x
8.0x
10.0x
12.0x
Q2
'17
Q3
'17
Q4
'17
Q1
'18
Q2
'18
Q3
'18
Q4
'18
Q1
'19
Q2
'19
Q3
'19
Q4
'19
Q1
'20
Q2
'20
Q3
'20
Q4
'20
Q1
'21
Q2
'21
Qtrly Median EV / LTM EBITDA 1 Yr. EV/EBITDA Moving Avg Qtrly Median LTM EBITDA Margin
Furniture

Décor
15
Valuation and Operating Performance Matrices Graphs adjusted to eliminate statistical outliers.
NYSE:LEG
NasdaqGS:MLHR
NYSE:HNI
NYSE:SCS
NYSE:UFI
NasdaqGS:KBAL
NasdaqGS:HOFT
NasdaqGS:FLXS
NasdaqGS:BSET
NasdaqCM:CRWS
0.0x
2.0x
4.0x
6.0x
8.0x
10.0x
12.0x
14.0x
-10.0% -7.5% -5.0% -2.5% 0.0% 2.5% 5.0% 7.5%
EBIT
DA
Mu
ltip
le
3-Yr Revenue CAGRSource: CapitalIQ and MHH
3-Yr Revenue CAGR vs. EBITDA Multiple
NYSE:TPX
NYSE:LEG
NasdaqGS:MLHR
NYSE:HNI
NYSE:SCS
NYSE:UFI
NasdaqGS:KBAL
NasdaqGS:HOFT
NasdaqGS:FLXS
NasdaqGS:BSET
NasdaqCM:CRWS
0.0x
2.0x
4.0x
6.0x
8.0x
10.0x
12.0x
14.0x
-40.0% -30.0% -20.0% -10.0% 0.0% 10.0% 20.0% 30.0%
EBIT
DA
Mu
ltip
le
3-Yr EBITDA CAGR
Source: CapitalIQ and MHH
3-Yr EBITDA CAGR vs. EBITDA Multiple
NYSE:LEG
NasdaqGS:MLHR
NYSE:HNI
NYSE:SCS
NYSE:UFI
NasdaqGS:KBAL
NasdaqGS:HOFT
NasdaqGS:FLXS
NasdaqGS:BSET
NasdaqCM:CRWS
2.0x
4.0x
6.0x
8.0x
10.0x
12.0x
14.0x
16.0x
0.0% 5.0% 10.0% 15.0% 20.0%
EBIT
DA
Mu
ltip
le
LTM EBITDA MarginSource: CapitalIQ and MHH
EBITDA Margin vs. EBITDA Multiple
NYSE:TPX
NYSE:LEG
NasdaqGS:MLHR
NYSE:HNI
NYSE:SCS
NYSE:UFI
NasdaqGS:KBAL
NasdaqGS:HOFTNasdaqGS:FLXS
NasdaqGS:BSET
NasdaqCM:CRWS
0.0x
2.0x
4.0x
6.0x
8.0x
10.0x
12.0x
14.0x
(50.0) - 50.0 100.0 150.0 200.0
EBIT
DA
Mu
ltip
le
Cash Conversion Cycle (Days)Source: CapitalIQ and MHH CCC = DIO + DRO + DPO
Cash Conversion Cycle vs. EBITDA Multiple
NYSE:TPX
NYSE:LEG
NasdaqGS:MLHR
NYSE:HNINYSE:SCS
NYSE:UFI
NasdaqGS:KBAL
NasdaqGS:HOFT
NasdaqGS:FLXS
NasdaqGS:BSET
NasdaqCM:CRWS
0.0x
1.0x
2.0x
3.0x
4.0x
5.0x
6.0x
7.0x
8.0x
9.0x
0.0% 5.0% 10.0% 15.0% 20.0% 25.0%
Inve
nto
ry T
urn
ove
r R
atio
LTM EBITDA MarginSource: CapitalIQ and MHH
EBITDA Margin vs. Inventory Turn Ratio
NYSE:TPXNYSE:LEG
NasdaqGS:MLHR
NYSE:HNI
NYSE:SCS
NYSE:UFI
NasdaqGS:KBAL
NasdaqGS:HOFT
NasdaqGS:FLXS
NasdaqGS:BSET
NasdaqCM:CRWS
0.0x
2.0x
4.0x
6.0x
8.0x
10.0x
12.0x
14.0x
0.0% 5.0% 10.0% 15.0% 20.0% 25.0%
EBIT
DA
Mu
ltip
le
LTM Free Cash Flow Margin
FCF Margin = (EBITDA - Capex) / RevSource: CapitalIQ and MHH
Free Cash Flow Margin vs. EBITDA Multiple
Furniture

Décor
16
Valuation and Operating Performance Matrices (cont.) Graphs adjusted to eliminate statistical outliers.
Selected M&A Transactions: 09/01/21 - 09/30/21
No Selected Transactions for the Month of September
Selected News Announcements
Flexsteel Industries, Inc. (NasdaqGS:FLXS) declared a quarterly cash dividend payable October 4, 2021
Hooker Furnishings Corporation (NasdaqGS:HOFT) declared a quarterly cash dividend payable September 30, 2021
NYSE:TPXNYSE:LEG
NasdaqGS:MLHR
NYSE:HNI
NYSE:SCS
NYSE:UFI
NasdaqGS:KBAL
NasdaqGS:HOFT
NasdaqGS:FLXS
NasdaqGS:BSET
NasdaqCM:CRWS
0.0x
2.0x
4.0x
6.0x
8.0x
10.0x
12.0x
14.0x
0.0% 10.0% 20.0% 30.0% 40.0% 50.0% 60.0%
EBIT
DA
Mu
ltip
le
Capital Intensity Ratio
Source: CapitalIQ and MHH Capital Intensity = (NWC - Cash + PP&E) / Revenue
Capital Intensity vs. EBITDA Multiple
NYSE:TPX
NYSE:LEG
NasdaqGS:MLHR
NYSE:HNI
NYSE:SCS
NYSE:UFI
NasdaqGS:KBAL
NasdaqGS:HOFTNasdaqGS:FLXS
NasdaqGS:BSET
NasdaqCM:CRWS
0.0x
2.0x
4.0x
6.0x
8.0x
10.0x
12.0x
14.0x
0.0% 2.0% 4.0% 6.0% 8.0% 10.0% 12.0% 14.0%
EBIT
DA
Mu
ltip
le
Return on AssetsSource: CapitalIQ and MHH
Return on Assets vs. EBITDA Multiple
Furniture

Hardware and Outdoor
17
Furniture
Comparative Index Performance (Three-year and One-year)
Last Three Years
Last Twelve Months
Source: CapitalIQ
-40.00%
-20.00%
0.00%
20.00%
40.00%
60.00%
80.00%
100.00%
9/28
/18
12/2
8/18
3/28
/19
6/28
/19
9/28
/19
12/2
8/19
3/28
/20
6/28
/20
9/28
/20
12/2
8/20
3/28
/21
6/28
/21
9/28
/21
MHH Hardware & Outdoor Index S&P 500 NASDAQ Composite Index
-10.00%
0.00%
10.00%
20.00%
30.00%
40.00%
50.00%
60.00%
9/30
/20
12/3
1/20
3/31
/21
6/30
/21
9/30
/21
MHH Hardware & Outdoor Index S&P 500 NASDAQ Composite Index
Hardware and Outdoor

Hardware and Outdoor
18
Furniture
Valuation Trend
Enterprise Value/LTM Revenue
Enterprise Value/LTM EBITDA
Source: CapitalIQ
1.56x 1.59x1.66x
1.52x 1.48x 1.52x
1.25x
1.47x
1.36x1.21x
1.29x
0.95x
1.32x1.43x
1.52x 1.58x1.48x
0.00x
0.25x
0.50x
0.75x
1.00x
1.25x
1.50x
1.75x
2.00x
Q2
'17
Q3
'17
Q4
'17
Q1
'18
Q2
'18
Q3
'18
Q4
'18
Q1
'19
Q2
'19
Q3
'19
Q4
'19
Q1
'20
Q2
'20
Q3
'20
Q4
'20
Q1
'21
Q2
'21
Quarterly Median EV/ REV 1 Yr. Moving Average
14.3x
16.2x16.8x
14.1x 14.1x
12.7x11.4x
12.7x11.5x
9.8x 9.7x9.1x
13.0x 12.2x11.7x 11.6x
9.9x
0.0%
2.0%
4.0%
6.0%
8.0%
10.0%
12.0%
14.0%
16.0%
18.0%
0.0x
2.0x
4.0x
6.0x
8.0x
10.0x
12.0x
14.0x
16.0x
18.0x
Q2
'17
Q3
'17
Q4
'17
Q1
'18
Q2
'18
Q3
'18
Q4
'18
Q1
'19
Q2
'19
Q3
'19
Q4
'19
Q1
'20
Q2
'20
Q3
'20
Q4
'20
Q1
'21
Q2
'21
Qtrly Median EV / LTM EBITDA 1 Yr. EV/EBITDA Moving Avg Qtrly Median LTM EBITDA Margin
Hardware and Outdoor

Hardware and Outdoor
19
Furniture
Valuation and Operating Performance Matrices Graphs adjusted to eliminate statistical outliers.
SEHK:669
NYSE:TTC
OM:HUSQ B
NYSE:SPBNasdaqGS:CENT
NasdaqGS:WDFC
XTRA:EIN3
0.0x
5.0x
10.0x
15.0x
20.0x
25.0x
30.0x
35.0x
0.0% 2.5% 5.0% 7.5% 10.0% 12.5% 15.0% 17.5% 20.0%
EBIT
DA
Mu
ltip
le
3-Yr Revenue CAGRSource: CapitalIQ and MHH
3-Yr Revenue CAGR vs. EBITDA Multiple
SEHK:669
NYSE:TTC
OM:HUSQ B
NYSE:SPB
NasdaqGS:CENT
NasdaqGS:WDFC
XTRA:EIN3
0.0x
5.0x
10.0x
15.0x
20.0x
25.0x
30.0x
35.0x
-5.0% 0.0% 5.0% 10.0% 15.0% 20.0% 25.0%
EBIT
DA
Mu
ltip
le
3-Yr EBITDA CAGR
Source: CapitalIQ and MHH
3-Yr EBITDA CAGR vs. EBITDA Multiple
SEHK:669
NYSE:TTC
OM:HUSQ BNYSE:SPB
NasdaqGS:CENT
NasdaqGS:WDFC
XTRA:EIN3
0.0x
5.0x
10.0x
15.0x
20.0x
25.0x
30.0x
35.0x
0.0% 5.0% 10.0% 15.0% 20.0% 25.0%
EBIT
DA
Mu
ltip
le
LTM EBITDA MarginSource: CapitalIQ and MHH
EBITDA Margin vs. EBITDA Multiple
SEHK:669
NYSE:TTC
OM:HUSQ B
NYSE:SPBNasdaqGS:CENT
NasdaqGS:WDFC
XTRA:EIN3
0.0x
5.0x
10.0x
15.0x
20.0x
25.0x
30.0x
35.0x
40.0 60.0 80.0 100.0 120.0 140.0 160.0
EBIT
DA
Mu
ltip
le
Cash Conversion Cycle (Days)Source: CapitalIQ and MHH CCC = DIO + DRO + DPO
Cash Conversion Cycle vs. EBITDA Multiple
SEHK:669
NYSE:TTC
OM:HUSQ B
NYSE:SPBNasdaqGS:CENT
NasdaqGS:WDFC
XTRA:EIN3
0.0x
0.5x
1.0x
1.5x
2.0x
2.5x
3.0x
3.5x
4.0x
4.5x
5.0x
5.0% 10.0% 15.0% 20.0% 25.0%
Inve
nto
ry T
urn
ove
r R
atio
LTM EBITDA MarginSource: CapitalIQ and MHH
EBITDA Margin vs. Inventory Turn Ratio
SEHK:669
NYSE:TTC
OM:HUSQ B
NYSE:SPBNasdaqGS:CENT
NasdaqGS:WDFC
XTRA:EIN3
0.0x
5.0x
10.0x
15.0x
20.0x
25.0x
30.0x
35.0x
0.0% 5.0% 10.0% 15.0% 20.0%
EBIT
DA
Mu
ltip
le
LTM Free Cash Flow Margin
FCF Margin = (EBITDA - Capex) / RevSource: CapitalIQ and MHH
Free Cash Flow Margin vs. EBITDA Multiple
Hardware and Outdoor

Hardware and Outdoor
20
Furniture
Valuation and Operating Performance Matrices (cont.) Graphs adjusted to eliminate statistical outliers.
SEHK:669
NYSE:TTC
OM:HUSQ BNYSE:SPB NasdaqGS:CENT
NasdaqGS:WDFC
XTRA:EIN3
0.0x
5.0x
10.0x
15.0x
20.0x
25.0x
30.0x
35.0x
0.0% 5.0% 10.0% 15.0% 20.0% 25.0% 30.0% 35.0% 40.0%
EBIT
DA
Mu
ltip
le
Capital Intensity Ratio
Source: CapitalIQ and MHH Capital Intensity = (NWC - Cash + PP&E) / Revenue
Capital Intensity vs. EBITDA Multiple
SEHK:669
NYSE:TTC
OM:HUSQ BNYSE:SPB
NasdaqGS:CENT
NasdaqGS:WDFC
XTRA:EIN3
0.0x
5.0x
10.0x
15.0x
20.0x
25.0x
30.0x
35.0x
0.0% 5.0% 10.0% 15.0%
EBIT
DA
Mu
ltip
le
Return on AssetsSource: CapitalIQ and MHH
Return on Assets vs. EBITDA Multiple
Selected M&A Transactions: 09/01/21 - 09/30/21
Announced Target Target Description Acquirer Value
08/11/21 Hardware and Home Improvement Business of Spectrum Brands Holdings, Inc.
Comprises hardware and home improvement manufacturing business unit
ASSA ABLOY AB (publ) (OM:ASSA B)
$4,300.0
ND – Not disclosed. Transaction values in millions.
Selected News Announcements
The Toro Company (NYSE:TTC) declared a quarterly cash dividend payable October 21, 2021
Hardware and Outdoor

Hardware and Outdoor
21
Furniture
Comparative Index Performance (Three-year and One-year)
Last Three Years
Last Twelve Months
Source: CapitalIQ
-60.00%
-40.00%
-20.00%
0.00%
20.00%
40.00%
60.00%
80.00%
100.00%
9/28
/18
12/2
8/18
3/28
/19
6/28
/19
9/28
/19
12/2
8/19
3/28
/20
6/28
/20
9/28
/20
12/2
8/20
3/28
/21
6/28
/21
9/28
/21
MHH Household Appliances Index S&P 500 NASDAQ Composite Index
-5.00%
0.00%
5.00%
10.00%
15.00%
20.00%
25.00%
30.00%
35.00%
40.00%
9/30
/20
12/3
1/20
3/31
/21
6/30
/21
9/30
/21
MHH Household Appliances Index S&P 500 NASDAQ Composite Index
Household Appliances

Hardware and Outdoor
22
Furniture
Valuation Trend
Enterprise Value/LTM Revenue
Enterprise Value/LTM EBITDA
Source: CapitalIQ
1.74x
1.14x
1.98x
1.76x1.63x
1.72x
1.38x1.43x
1.28x 1.19x 1.16x
0.83x
1.11x1.18x
1.35x1.24x
1.41x
0.00x
0.50x
1.00x
1.50x
2.00x
2.50x
Q2
'17
Q3
'17
Q4
'17
Q1
'18
Q2
'18
Q3
'18
Q4
'18
Q1
'19
Q2
'19
Q3
'19
Q4
'19
Q1
'20
Q2
'20
Q3
'20
Q4
'20
Q1
'21
Q2
'21
Quarterly Median EV/ REV 1 Yr. Moving Average
13.9x13.1x 12.7x
10.6x10.3x
9.8x
8.1x
9.6x8.1x 8.3x
10.2x
6.7x
11.2x9.7x
9.9x8.8x
8.7x
0.0%
2.0%
4.0%
6.0%
8.0%
10.0%
12.0%
14.0%
16.0%
18.0%
0.0x
2.0x
4.0x
6.0x
8.0x
10.0x
12.0x
14.0x
16.0x
Q2
'17
Q3
'17
Q4
'17
Q1
'18
Q2
'18
Q3
'18
Q4
'18
Q1
'19
Q2
'19
Q3
'19
Q4
'19
Q1
'20
Q2
'20
Q3
'20
Q4
'20
Q1
'21
Q2
'21
Qtrly Median EV / LTM EBITDA 1 Yr. EV/EBITDA Moving Avg Qtrly Median LTM EBITDA Margin
Household Appliances
Appliances
Appliances

Hardware and Outdoor
23
Furniture
Valuation and Operating Performance Matrices Graphs adjusted to eliminate statistical outliers.
NYSE:SWK
NYSE:WHR
OM:ELUX B
BIT:DLG
HLSE:FSKRS
NasdaqGS:IRBT
NYSE:NC
0.0x
2.0x
4.0x
6.0x
8.0x
10.0x
12.0x
14.0x
16.0x
18.0x
20.0x
-5.0% 0.0% 5.0% 10.0% 15.0%
EBIT
DA
Mu
ltip
le
3-Yr Revenue CAGRSource: CapitalIQ and MHH
3-Yr Revenue CAGR vs. EBITDA Multiple
NYSE:SWK
NYSE:WHR
OM:ELUX B
BIT:DLG
HLSE:FSKRS
NYSE:NC
0.0x
2.0x
4.0x
6.0x
8.0x
10.0x
12.0x
-2.0% 0.0% 2.0% 4.0% 6.0% 8.0% 10.0% 12.0%
EBIT
DA
Mu
ltip
le
3-Yr EBITDA CAGR
Source: CapitalIQ and MHH
3-Yr EBITDA CAGR vs. EBITDA Multiple
NYSE:SWK
NYSE:WHR
OM:ELUX B
BIT:DLG
HLSE:FSKRS
NasdaqGS:IRBT
NYSE:NC
0.0x
2.0x
4.0x
6.0x
8.0x
10.0x
12.0x
14.0x
16.0x
18.0x
20.0x
0.0% 10.0% 20.0% 30.0% 40.0%
EBIT
DA
Mu
ltip
le
LTM EBITDA MarginSource: CapitalIQ and MHH
EBITDA Margin vs. EBITDA Multiple
NYSE:SWK
NYSE:WHR
OM:ELUX B
BIT:DLG
HLSE:FSKRS
NasdaqGS:IRBT
NYSE:NC
0.0x
2.0x
4.0x
6.0x
8.0x
10.0x
12.0x
14.0x
16.0x
18.0x
20.0x
- 50.0 100.0 150.0 200.0
EBIT
DA
Mu
ltip
le
Cash Conversion Cycle (Days)Source: CapitalIQ and MHH CCC = DIO + DRO + DPO
Cash Conversion Cycle vs. EBITDA Multiple
NYSE:SWK
NYSE:WHR
OM:ELUX B
BIT:DLGHLSE:FSKRS
NasdaqGS:IRBT NYSE:NC
0.0x
1.0x
2.0x
3.0x
4.0x
5.0x
6.0x
7.0x
5.0% 10.0% 15.0% 20.0% 25.0% 30.0% 35.0% 40.0%
Inve
nto
ry T
urn
ove
r R
atio
LTM EBITDA MarginSource: CapitalIQ and MHH
EBITDA Margin vs. Inventory Turn Ratio
NYSE:SWK
NYSE:WHR
OM:ELUX B
BIT:DLG
HLSE:FSKRS
NasdaqGS:IRBT
NYSE:NC
0.0x
2.0x
4.0x
6.0x
8.0x
10.0x
12.0x
14.0x
16.0x
18.0x
20.0x
0.0% 5.0% 10.0% 15.0% 20.0%
EBIT
DA
Mu
ltip
le
LTM Free Cash Flow Margin
FCF Margin = (EBITDA - Capex) / RevSource: CapitalIQ and MHH
Free Cash Flow Margin vs. EBITDA Multiple
Household Appliances

Hardware and Outdoor
24
Furniture
Valuation and Operating Performance Matrices (cont.) Graphs adjusted to eliminate statistical outliers.
NYSE:SWK
NYSE:WHR
BIT:DLG
HLSE:FSKRS
NasdaqGS:IRBT
0.0x
2.0x
4.0x
6.0x
8.0x
10.0x
12.0x
14.0x
16.0x
18.0x
20.0x
0.0% 5.0% 10.0% 15.0% 20.0% 25.0% 30.0% 35.0%
EBIT
DA
Mu
ltip
le
Capital Intensity Ratio
Source: CapitalIQ and MHH Capital Intensity = (NWC - Cash + PP&E) / Revenue
Capital Intensity vs. EBITDA Multiple
NYSE:SWK
NYSE:WHROM:ELUX B
BIT:DLG
HLSE:FSKRS
NasdaqGS:IRBT
0.0x
2.0x
4.0x
6.0x
8.0x
10.0x
12.0x
14.0x
16.0x
18.0x
20.0x
3.0% 4.0% 5.0% 6.0% 7.0% 8.0% 9.0%
EBIT
DA
Mu
ltip
le
Return on AssetsSource: CapitalIQ and MHH
Return on Assets vs. EBITDA Multiple
Selected M&A Transactions: 09/01/21 - 09/30/21
Announced Target Target Description Acquirer Value
09/27/21 Elica PB India Private Limited
Offers household appliances repairs services Whirlpool of India Limited (BSE:500238)
$57.5
09/13/2021 Excel Industries Inc. Manufactures and distributes outdoor commercial and residential turf power equipment solutions
Stanley Black & Decker, Inc. (NYSE:SWK)
$375.0
ND – Not disclosed. Transaction values in millions.
Selected News Announcements
No Selected News for the Month of September
Household Appliances

Housewares
25
Comparative Index Performance (Three-year and One-year)
Last Three Years
Last Twelve Months
Source: CapitalIQ
-60.00%
-40.00%
-20.00%
0.00%
20.00%
40.00%
60.00%
80.00%
100.00%
9/28
/18
12/2
8/18
3/28
/19
6/28
/19
9/28
/19
12/2
8/19
3/28
/20
6/28
/20
9/28
/20
12/2
8/20
3/28
/21
6/28
/21
9/28
/21
MHH Comp Group Housewares Index S&P 500 NASDAQ Composite Index
-10.00%
-5.00%
0.00%
5.00%
10.00%
15.00%
20.00%
25.00%
30.00%
35.00%
40.00%
9/30
/20
12/3
1/20
3/31
/21
6/30
/21
9/30
/21
MHH Comp Group Housewares Index S&P 500 NASDAQ Composite Index

Housewares
26
Valuation Trend
Enterprise Value/LTM Revenue
Enterprise Value/LTM EBITDA
Source: CapitalIQ
1.88x1.74x
1.68x
1.45x 1.40x 1.44x
1.17x
1.29x 1.38x1.27x
1.38x
0.96x
1.27x 1.28x
1.47x1.39x
1.54x
0.00x
0.50x
1.00x
1.50x
2.00x
Q2
'17
Q3
'17
Q4
'17
Q1
'18
Q2
'18
Q3
'18
Q4
'18
Q1
'19
Q2
'19
Q3
'19
Q4
'19
Q1
'20
Q2
'20
Q3
'20
Q4
'20
Q1
'21
Q2
'21
Quarterly Median EV/ REV 1 Yr. Moving Average
11.6x12.1x
11.6x
10.5x 10.8x 11.3x
9.8x10.4x
9.4x 9.4x10.1x
7.8x
8.9x
11.0x
13.2x 13.3x 12.5x
0.0%
2.0%
4.0%
6.0%
8.0%
10.0%
12.0%
14.0%
16.0%
0.0x
2.0x
4.0x
6.0x
8.0x
10.0x
12.0x
14.0x
Q2
'17
Q3
'17
Q4
'17
Q1
'18
Q2
'18
Q3
'18
Q4
'18
Q1
'19
Q2
'19
Q3
'19
Q4
'19
Q1
'20
Q2
'20
Q3
'20
Q4
'20
Q1
'21
Q2
'21
Qtrly Median EV / LTM EBITDA 1 Yr. EV/EBITDA Moving Avg Qtrly Median LTM EBITDA Margin
Housewares
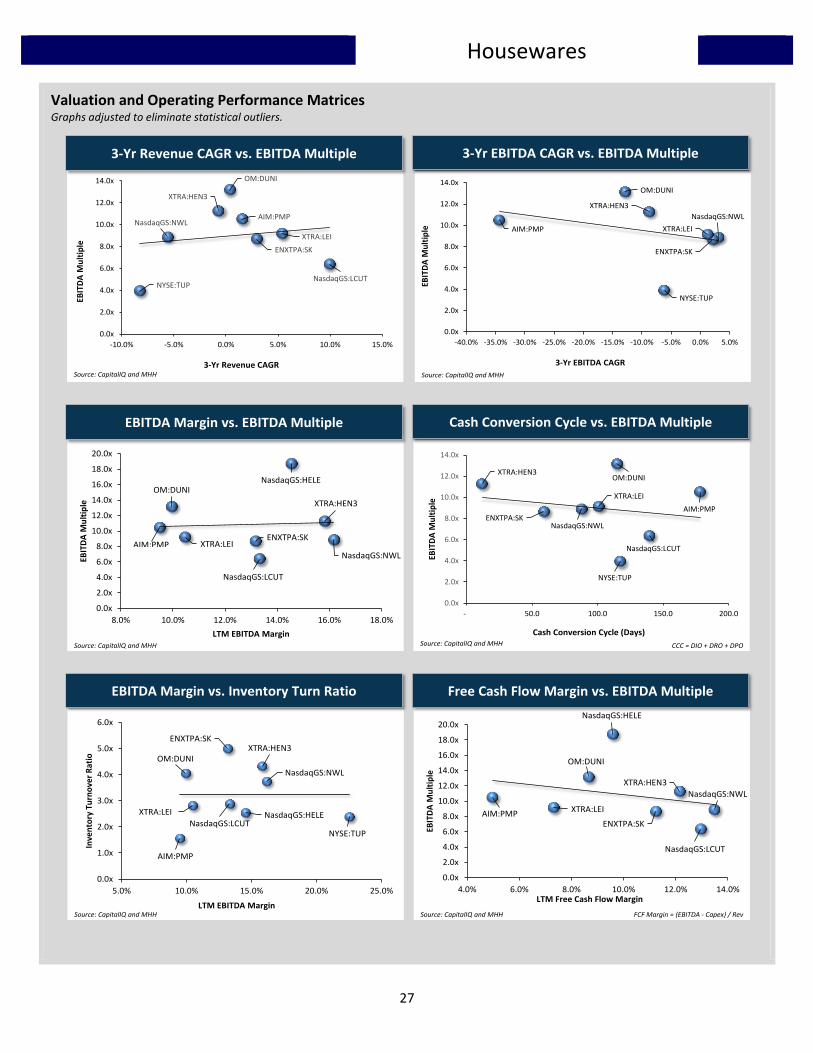
27
Valuation and Operating Performance Matrices Graphs adjusted to eliminate statistical outliers.
XTRA:HEN3
NasdaqGS:NWL
ENXTPA:SK
NYSE:TUP
OM:DUNI
NasdaqGS:LCUT
XTRA:LEI
AIM:PMP
0.0x
2.0x
4.0x
6.0x
8.0x
10.0x
12.0x
14.0x
-10.0% -5.0% 0.0% 5.0% 10.0% 15.0%
EBIT
DA
Mu
ltip
le
3-Yr Revenue CAGRSource: CapitalIQ and MHH
3-Yr Revenue CAGR vs. EBITDA Multiple
XTRA:HEN3
NasdaqGS:NWL
ENXTPA:SK
NYSE:TUP
OM:DUNI
XTRA:LEIAIM:PMP
0.0x
2.0x
4.0x
6.0x
8.0x
10.0x
12.0x
14.0x
-40.0% -35.0% -30.0% -25.0% -20.0% -15.0% -10.0% -5.0% 0.0% 5.0%
EBIT
DA
Mu
ltip
le
3-Yr EBITDA CAGR
Source: CapitalIQ and MHH
3-Yr EBITDA CAGR vs. EBITDA Multiple
XTRA:HEN3
NasdaqGS:NWL
ENXTPA:SK
NasdaqGS:HELEOM:DUNI
NasdaqGS:LCUT
XTRA:LEIAIM:PMP
0.0x
2.0x
4.0x
6.0x
8.0x
10.0x
12.0x
14.0x
16.0x
18.0x
20.0x
8.0% 10.0% 12.0% 14.0% 16.0% 18.0%
EBIT
DA
Mu
ltip
le
LTM EBITDA MarginSource: CapitalIQ and MHH
EBITDA Margin vs. EBITDA Multiple
XTRA:HEN3
NasdaqGS:NWLENXTPA:SK
NYSE:TUP
OM:DUNI
NasdaqGS:LCUT
XTRA:LEI
AIM:PMP
0.0x
2.0x
4.0x
6.0x
8.0x
10.0x
12.0x
14.0x
- 50.0 100.0 150.0 200.0
EBIT
DA
Mu
ltip
le
Cash Conversion Cycle (Days)Source: CapitalIQ and MHH CCC = DIO + DRO + DPO
Cash Conversion Cycle vs. EBITDA Multiple
XTRA:HEN3
NasdaqGS:NWL
ENXTPA:SK
NasdaqGS:HELE
NYSE:TUP
OM:DUNI
NasdaqGS:LCUT
XTRA:LEI
AIM:PMP
0.0x
1.0x
2.0x
3.0x
4.0x
5.0x
6.0x
5.0% 10.0% 15.0% 20.0% 25.0%
Inve
nto
ry T
urn
ove
r R
atio
LTM EBITDA MarginSource: CapitalIQ and MHH
EBITDA Margin vs. Inventory Turn Ratio
XTRA:HEN3
NasdaqGS:NWL
ENXTPA:SK
NasdaqGS:HELE
OM:DUNI
NasdaqGS:LCUT
XTRA:LEIAIM:PMP
0.0x
2.0x
4.0x
6.0x
8.0x
10.0x
12.0x
14.0x
16.0x
18.0x
20.0x
4.0% 6.0% 8.0% 10.0% 12.0% 14.0%
EBIT
DA
Mu
ltip
le
LTM Free Cash Flow Margin
FCF Margin = (EBITDA - Capex) / RevSource: CapitalIQ and MHH
Free Cash Flow Margin vs. EBITDA Multiple

Housewares
28
Valuation and Operating Performance Matrices (cont.) Graphs adjusted to eliminate statistical outliers.
XTRA:HEN3
NasdaqGS:NWL
ENXTPA:SK
NYSE:TUP
OM:DUNI
NasdaqGS:LCUT
XTRA:LEIAIM:PMP
0.0x
2.0x
4.0x
6.0x
8.0x
10.0x
12.0x
14.0x
0.0% 10.0% 20.0% 30.0% 40.0% 50.0% 60.0%
EBIT
DA
Mu
ltip
le
Capital Intensity Ratio
Source: CapitalIQ and MHH Capital Intensity = (NWC - Cash + PP&E) / Revenue
Capital Intensity vs. EBITDA Multiple
XTRA:HEN3
NasdaqGS:NWL ENXTPA:SK
OM:DUNI
NasdaqGS:LCUT
XTRA:LEIAIM:PMP
0.0x
2.0x
4.0x
6.0x
8.0x
10.0x
12.0x
14.0x
1.0% 2.0% 3.0% 4.0% 5.0% 6.0% 7.0%
EBIT
DA
Mu
ltip
le
Return on AssetsSource: CapitalIQ and MHH
Return on Assets vs. EBITDA Multiple
Selected M&A Transactions: 09/01/21 - 09/30/21
No Selected Transactions for the Month of September
Selected News Announcements
No Selected News for the Month of September

Housewares
29
Mufson Howe Hunter is an independent investment bank for middle-market companies. We focus on selling
businesses, buy-outs, acquisitions and raising capital. Unique to the middle market, our senior bankers have
extensive corporate finance experience and deep knowledge of the capital markets.
Mufson Howe Hunter & Company LLC
1717 Arch Street
39th Floor
Philadelphia, PA 19103
215.399.5400
Visit us at:
www.mhhco.com
Broker dealer services provided by our wholly-owned subsidiary, Mufson Howe Hunter & Partners LLC, a member
of FINRA and SIPC
Mergers & Acquisitions • Advise buyers and sellers (public and private companies)
• Sale of businesses, strategic acquisitions, management buy-outs and industry build-ups
Raise Capital • Equity (control and non-control)
• Mezzanine financing
• Senior and junior debt
• Typically raise capital from banks, finance companies, private investment funds and private
equity groups
Financial Advisory Services • Analysis of business strategies and options
• Fairness opinions
• Valuations