Embed Size (px)
Citation preview
Identification of areas with potential for promoting innovation
processes in Mexico1
Elvia Martínez-Viveros, Camilo Caudillo-Cos, Ana Bertha Coronel and Fernando López-Caloca
Centro de Investigación en Geografía y Geomática “Ing. Jorge L. Tamayo” A.C. www.centrogeo.org.mx
1. Introduction
The entry and positioning of countries and regions in the so called
‘knowledge economy’ is recognized by many field scholars by their intensive use of knowledge and technology in economic processes. “It refers to an emerging economy where productivity and growth are less
based on the abundance of natural resources than on the capacity to improve the quality of human capital and factors of production, and to
create new knowledge and ideas and incorporate them into equipment and people (David and Foray 2003 cited in Cooke et al 2007:26-27). Lundvall (1995) as cited in Hudson (1999:61) asserts that
“…contemporary capitalism has reached the stage at which knowledge is the most strategic resource and learning the most important process”. Knowledge intensive innovations are the key to the economic
success of persons, firms and places. In the past, it was thought that innovations emerged mainly from scientific and technological
institutions. Although there is a strong link between science and innovation, the translation of scientific results into innovations is not linear and it involves combinations of explicit formal knowledge and
tacit knowledge contained in people’s skills and abilities (Cooke et al 2007). Following Lundvall and OCDE, Morgan (2002: 493) describes
innovation as “an interactive process -between firms and the basic science infrastructure, between the different functions within the firm, between producers and users at the inter-firm level and between firms
and the wider institutional milieu- and this process should be conceived as a process of interactive learning in which a wide array of institutional
mechanisms can play a role” In the knowledge economy, geographic proximity is relevant. There is a
lot of literature on the role of spatial proximity in clusters of firms or industrial districts (examples may be found at Garnsey and Heffernan
2007, Rutten and Boekema 2007, Asheim et al 2006, Morosini 2004 or Lawson 1997). Also, the study of innovation has been approached through the dynamics of agglomerates that share access to skills and
resources and are supplemented by supporting institutions (Feldman 2000). At the place scale social actors share norms and values
1 This work is a first exploratory stage of a research project financed by an
Institutional Fund of the National Council of Science and Technology (CONACYT) in
Mexico. 2 These methods place each observation in a group and goes on iteratively including
nearest groups in a high order group. At each step, a level is added in the hierarchical
facilitating collaboration between persons, firms and sectors for their
mutual advantage; social capital and trust support the networks that link actors in interactive learning processes (Wolfe, 2002). From
evolutionary economics perspective, spatial proximity is a key element to explain economic activity location and agglomeration, the dynamics of development and growth processes, the reasons for the uneven
distribution of prosperity, or the role and effect of public policy (Javanovic 2009:3).
But localized innovation processes can be inserted and/or fed back into global economic processes, which in this knowledge era account for the
organization of the most strategic and profitable economic activities. The territorial articulation of global strategic activities has been described in terms of the leading role of global cities which control
strategic decisions and actions, leaving other urban spaces to specialize in different functions. Jointly they describe a new division of work and
incorporate territories in a global production process which is relatively independent from the nation states (Sassen 2001). Globalization both challenges and paves the road for regions and places to use their
unique capacities and become innovation and learning centers (Wolfe 2002). But regions and places inserted in economies of increasing returns pose a major challenge to the competitive positioning of the
peripheral or marginalized ones in knowledge intensive innovation processes.
The abundant literature about emblematic processes, products, technologies, places or regions of the knowledge economy constitutes
the empirical evidence that nourish the conceptualization of this current stage of capitalism. From this literature one main conclusion
may be derived: knowledge is concentrated in regions, cities, firms, universities or research centers. These units become involved in networks of formal or informal collaboration through which knowledge
circulates generating spillovers with regional, sectoral or global reach. But the heterogeneous distribution of knowledge gives rise to disparities in competences, productivity, income and opportunities between
regions, countries and social groups. Cooke et al assert the “…highly uneven and polarized character of knowledge generation, application
and innovation in geographical space. Innovative milieu, high-tec regions and knowledge based city regions are expressions of such asymmetries and knowledge monopolies.” (2007:46)
In less developed countries, like Mexico, evidence of intensive knowledge innovation processes is looked for in attempts to situate its
regions and places in the knowledge economy map and to identify features of its local and regional innovation systems (Corona 2005).
Case studies documented as innovations in firms, places or regions in Mexico can be related to: 1) decision and control centers localized abroad and led by transnational firms, which point to the subordinated
insertion of ‘the local’ into ‘the global’ (Carrillo and Hualde 2006 or
Casalet et al 2008,); 2) examples of success stories in the export of products manufactured by multinational corporations, such as
automobiles, where the locus of mainstream innovation lies abroad (Unger 2004); or 3) examples of success in international markets of products which market advantage is derived by the low cost of labor.
(Carrillo 2007). Maldonado explores Mexico’s place in the knowledge based economy and asserts that, since 2006, Mexico has not improved in OCDE’s, World Bank’s or UNESCO’s indicators, such as science and
technology public expenditure, number of international students attracted by the country, patents, published articles, rates of
researchers per inhabitant or internet users (Maldonado 2010). Mexico is a country characterized by inequality. The development gap
between regions, places or social groups is wide and inequalities in availability and access to all kinds of resources have prevailed over a
long period of time. Innovation processes in the country, relevant from the knowledge economy point of view, are very rare. While this situation is not encouraging, it is worth to acknowledge that the country holds
potentiality in its human resources and in the natural and cultural wealth of its many and varied regions and places. Although local or regional systems of innovation cannot be easily detected along its
territory, some authors have advanced the possibility to detect regions and places prone to innovation. For instance, Casas and Luna saw this
propensity in what they called ‘knowedge emergent spaces’ (Casas and Luna 2001).
The work we present here is a first exploratory stage of a project conducted at CentroGeo (a Mexican public research institution). This
stage was set about to integrate a comprehensive view of urban areas with potential for promoting innovation processes in Mexico. The purpose is to help incorporate a territorial view in the design of public
policies aimed to generate local or regional spatial environments prone to innovation. The relevance of this view is supported by the key role that spatial proximity plays in innovation (as has been argued above),
but also because territories provide a base for coordinating public policies that usually are sector biased. Policies and their instruments
designed from different institutional silos and aimed at different goals converge territorially. It is in territorial contexts where science and technology, competitiveness, public infrastructure investments or
industrial development, among other relevant policies can be coordinated by a territorial innovation policy and combined and synergized by emerging governance arrangements.
We characterize spaces with potential for promoting innovation
processes by the joint convergence in urban space of a dense economic activity linked to industries with a relatively high use of a knowledge base and of factors that facilitate or are building blocks of the
knowledge economy. According to Wolfe (2002) factors reinforcing local
agglomeration effects are: highly qualified local labor, unique support services for local firms, trust relationships in networks of suppliers and
buyers and the emergent interactive learning in local and regional contexts. Main among such factors are those related to human and social capital. Framed in the various angles of knowledge creation and
knowledge transfer, human and social capital have been approached as background to innovative activity (Mourad and De Clercq 2004).
Human capital expresses individuals’ abilities, skills and knowledge and is a source of competitive advantage for themselves, the organizations in
which they work and the places where they belong to (Florin and Schultze 2000). Several studies highlight the positive association between human capital and productivity, employment or innovation
(Dakhli and De Clercq 2004, Cannon 2000, Maskell and Malmberg 1999, Black and Lynch 1996, Simon 1988). Human capital can be
developed through formal education, on the job training, work experience or health care and physical training (Prais 1995). People with high educational level and wide practical experience who have invested
time, energy and resources for the improvement of their skills are able to get a better personal well being as well as for the society as a whole (Gardstein and Justman 2000).
Mourad and De Clerq assert that “the central proposition in the social
capital literature is that networks of relationships constitute, or lead to, resources that can be used for the good of the individual or the collective”. (2004:110). The social capital of an individual encompasses
personal relationships. The one of an organization implies working collaborations or collective action. At society level, the social capital is
embedded in networks, norms and confidence structures that expedite coordination and cooperation for collective benefit. Social capital is a key factor in human capital formation (Coleman 1988, Seragelding and
Dasgupta 2001). In this work, dense economic activity is represented by means of
agglomerates of industries that make a relatively high use of a knowledge base. We are aware of the difference between clustered
economies and the mere agglomerations of firms; and that mere agglomerates say very little about the networks and kinds of linkages through which knowledge may be transmitted or exchanged and
transformed into innovations. But we believe that the integration of comprehensive views of spaces with factors favoring innovation may help planning and policy processes to further local social capital and
the development and consolidation of local and regional clusters that may impinge upon the emergence of significant innovations. As it is
commonly done, we use educational level in order to measure human capital; but we also measured it by means of occupations or professions related to knowledge intensive activities; because in performing such
activities people engage in learning processes that increase their human
capital. Following Van Damme, we selected the city level “to look at the interface between human capital formation and utilization” (2009:14).
We saw each city as a market and we tried to detect the heterogeneity in the distribution of knowledge in their occupational structure, in the overall assimilation of human capital, and in the presence and
formation of people with a high educational level. Then, the differentiation of these cities’ characteristics was underpinned on indicators of the territorial structure of: 1) knowledge intensive
occupations and professional services, 2) market use of human capital, and 3) availability and formation of people with high levels of education.
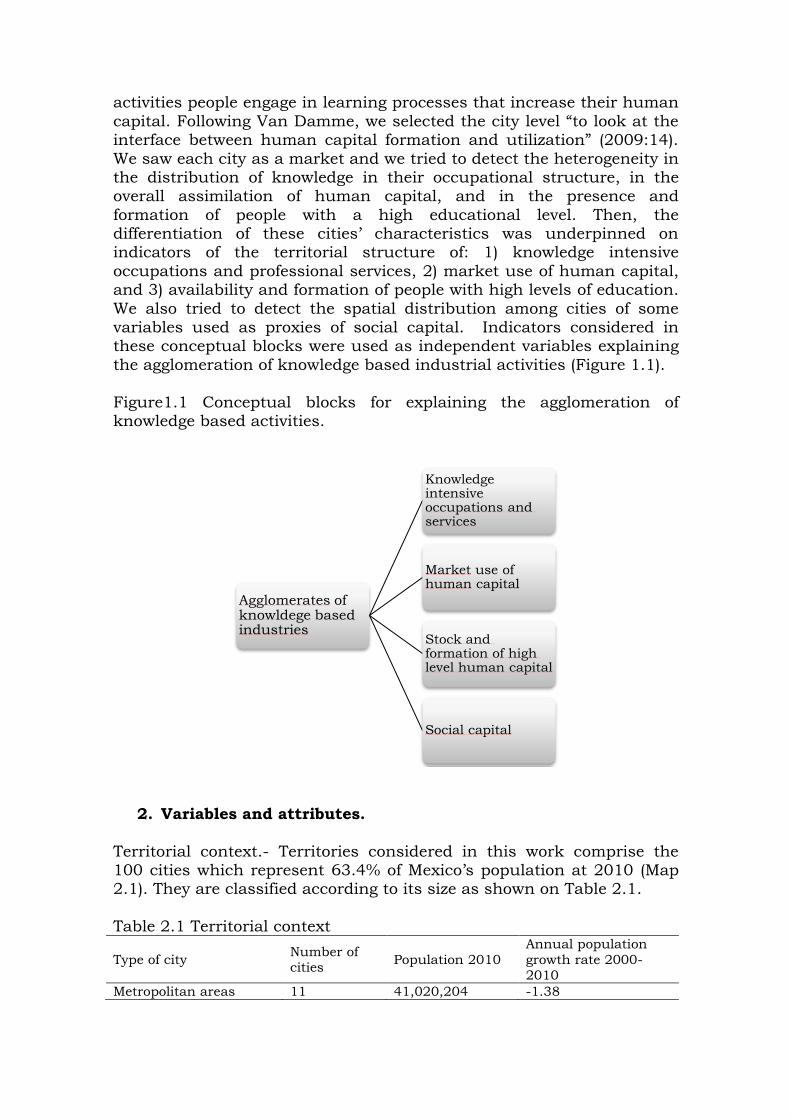
We also tried to detect the spatial distribution among cities of some variables used as proxies of social capital. Indicators considered in these conceptual blocks were used as independent variables explaining
the agglomeration of knowledge based industrial activities (Figure 1.1).
Figure1.1 Conceptual blocks for explaining the agglomeration of knowledge based activities.
2. Variables and attributes.
Territorial context.- Territories considered in this work comprise the 100 cities which represent 63.4% of Mexico’s population at 2010 (Map 2.1). They are classified according to its size as shown on Table 2.1.
Table 2.1 Territorial context
Type of city Number of cities
Population 2010
Annual population
growth rate 2000-2010
Metropolitan areas 11 41,020,204 -1.38
Agglomerates of knowldege based industries
Knowledge intensive occupations and services
Market use of human capital
Stock and formation of high level human capital
Social capital

Metropolitan cities 45 21,351,762 -1.90 Medium sized dynamic
cities
44 8,848,774 2.15
Total 100 71,220,740 Source: Cities’ classification: CONAPO, INEGI and SEDESOL 2007. Cities’ data: INEGI: 2011c)
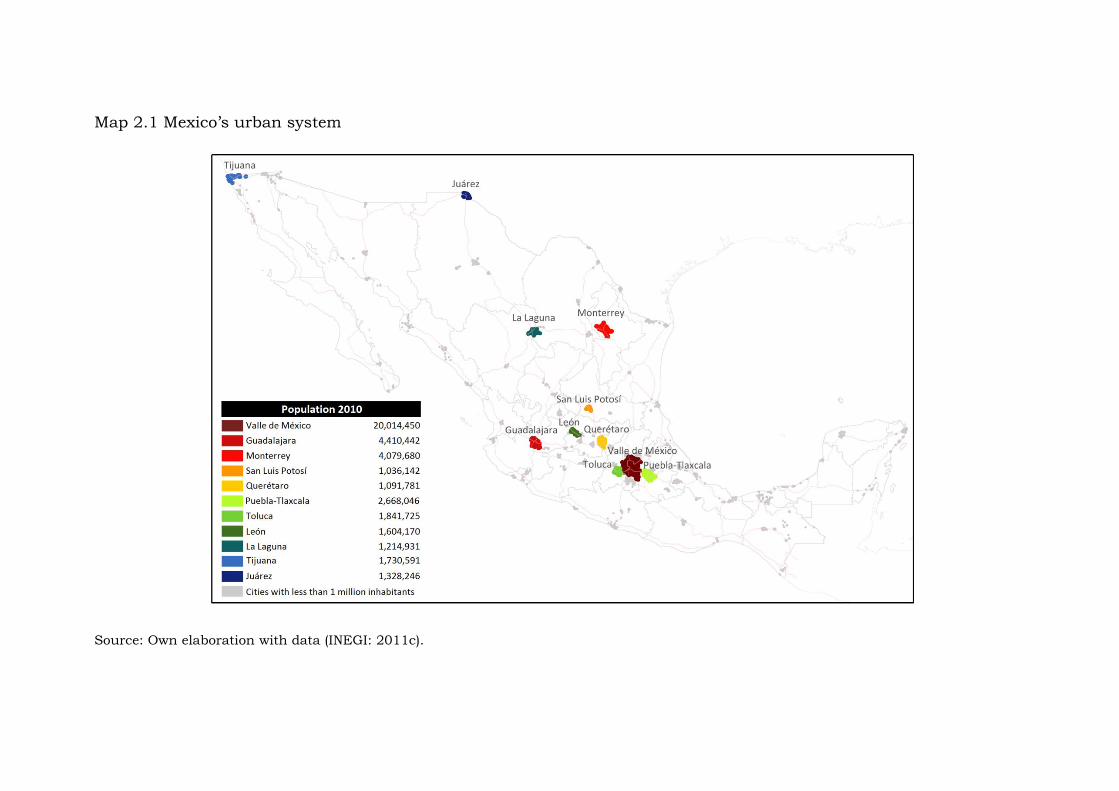
Map 2.1 Mexico’s urban system
Source: Own elaboration with data (INEGI: 2011c).
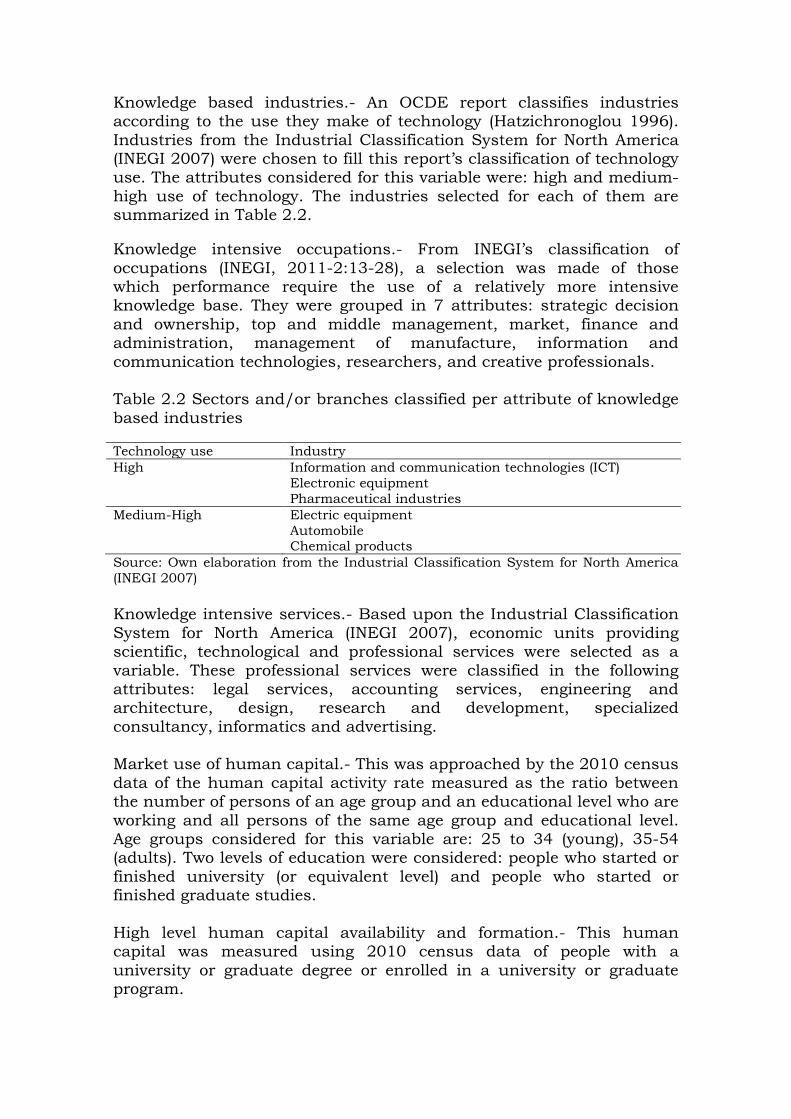
Knowledge based industries.- An OCDE report classifies industries according to the use they make of technology (Hatzichronoglou 1996).
Industries from the Industrial Classification System for North America (INEGI 2007) were chosen to fill this report’s classification of technology use. The attributes considered for this variable were: high and medium-
high use of technology. The industries selected for each of them are summarized in Table 2.2.
Knowledge intensive occupations.- From INEGI’s classification of
occupations (INEGI, 2011-2:13-28), a selection was made of those which performance require the use of a relatively more intensive knowledge base. They were grouped in 7 attributes: strategic decision
and ownership, top and middle management, market, finance and administration, management of manufacture, information and
communication technologies, researchers, and creative professionals. Table 2.2 Sectors and/or branches classified per attribute of knowledge
based industries
Technology use Industry
High Information and communication technologies (ICT)
Electronic equipment
Pharmaceutical industries
Medium-High Electric equipment
Automobile Chemical products
Source: Own elaboration from the Industrial Classification System for North America
(INEGI 2007)
Knowledge intensive services.- Based upon the Industrial Classification
System for North America (INEGI 2007), economic units providing scientific, technological and professional services were selected as a
variable. These professional services were classified in the following attributes: legal services, accounting services, engineering and architecture, design, research and development, specialized
consultancy, informatics and advertising. Market use of human capital.- This was approached by the 2010 census
data of the human capital activity rate measured as the ratio between the number of persons of an age group and an educational level who are
working and all persons of the same age group and educational level. Age groups considered for this variable are: 25 to 34 (young), 35-54 (adults). Two levels of education were considered: people who started or
finished university (or equivalent level) and people who started or finished graduate studies.
High level human capital availability and formation.- This human capital was measured using 2010 census data of people with a
university or graduate degree or enrolled in a university or graduate program.
Social capital.- Due to the lack of relevant and reliable data in Mexico, the operationalization of this concept is difficult. Here we used two
variables as proxies: 1) the percentage of civil society associations in a city as the share of the total associations of this kind in the cities included in the study. According to Industrial Classification System for
North America they can be: organizations of producers, traders and service providers, labor unions, professional associations, sports and
leisure organizations and civil associations (INEGI 2007), and 2) the activity rate of old people participating in the labor market.
3. Agglomerates The identification of spatial concentration of knowledge based economic
activity may help detecting emergence of increasing returns economies, the characteristics of the places in which they emerge and their
similarities and/or connections with other places. It also can tell us something about regional inequality.
In order to analyze if knowledge intensive productive activities tend to cluster spatially and whether this groupings associate with variables contributing to innovation prone environments, at this data exploration
stage, agglomerates of manufacturing firms classified by knowledge base and of firms that render professional, scientific and technological
services were built. We departed from a geographical data base of firms with more than 50 people working in them. We used a hierarchical agglomerative clustering algorithm from CrimeStatIII.2 The nearest
neighbor was used as a criterion for grouping firms located at a distance less than 4 or 8 kilometers. Clustering started with a minimum
of three firms and in all instances we explored, first order clusters were obtained, all of them significantly different from non random spatial arrangements. Table 3.1 summarizes these results and they can be
viewed in Maps 3.1 and 3.2.
2 These methods place each observation in a group and goes on iteratively including
nearest groups in a high order group. At each step, a level is added in the hierarchical
segmentation of data. The result is a sequence of groupings and the user chooses the
desired grouping level.
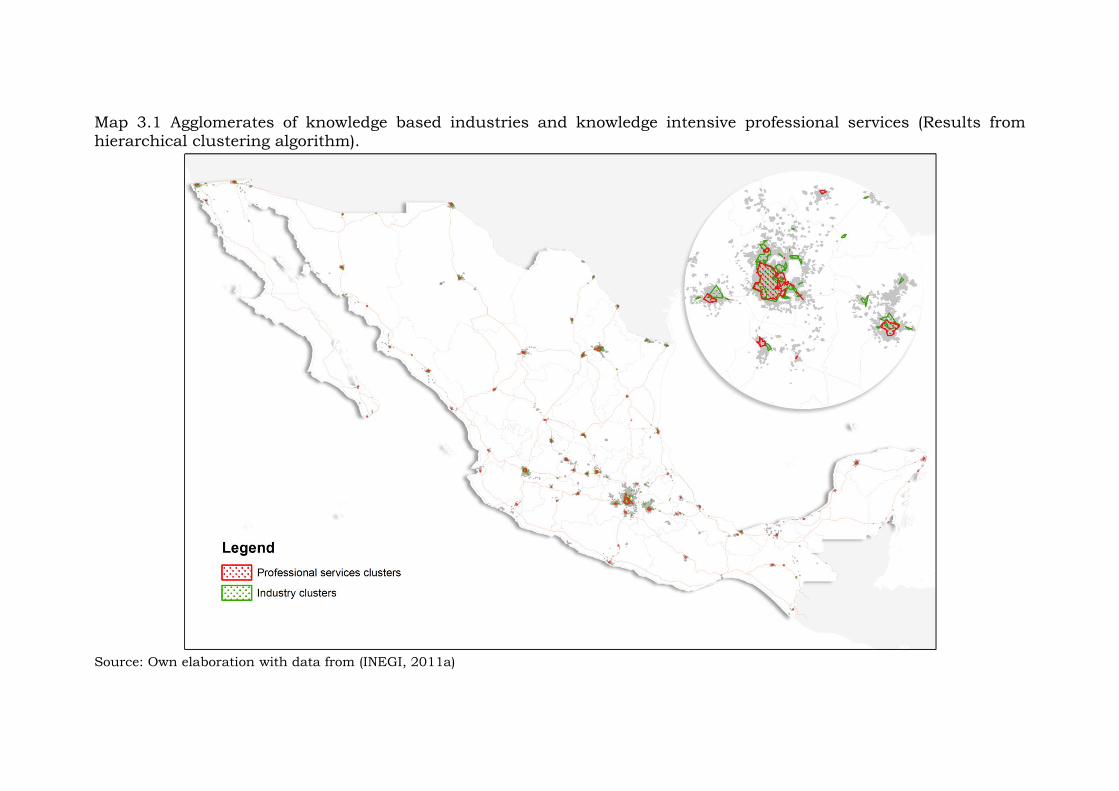
Map 3.1 Agglomerates of knowledge based industries and knowledge intensive professional services (Results from hierarchical clustering algorithm).
Source: Own elaboration with data from (INEGI, 2011a)
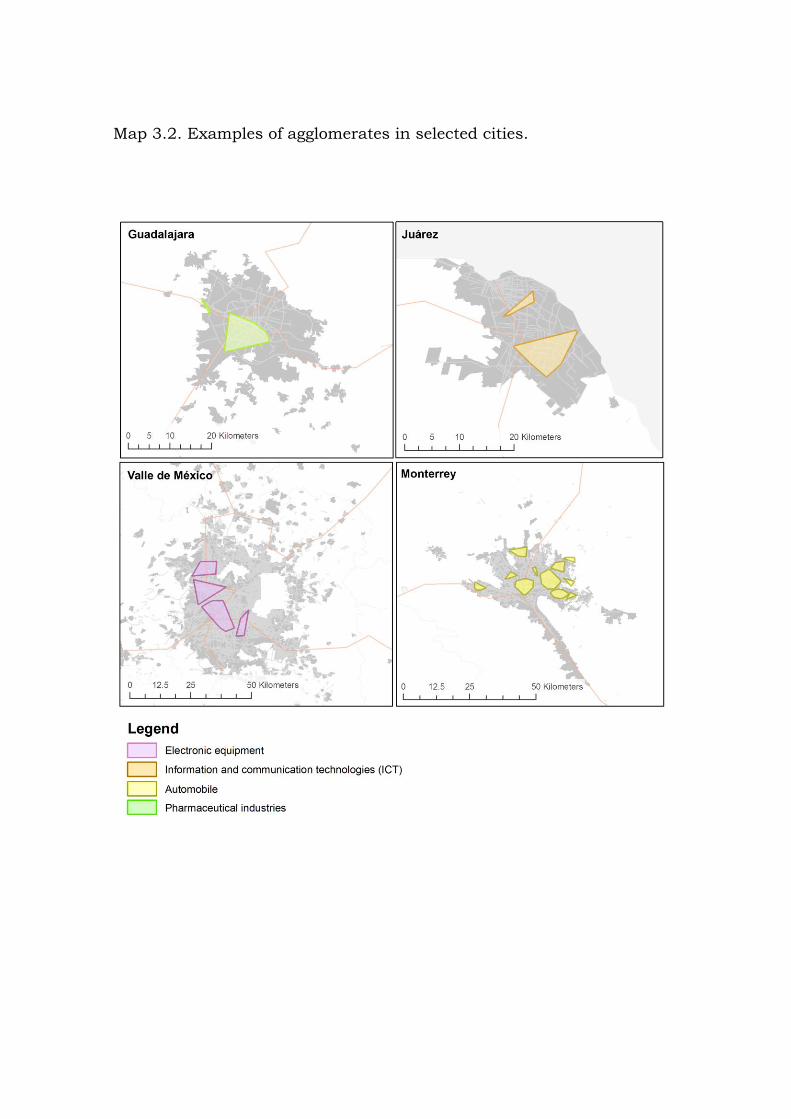
Map 3.2. Examples of agglomerates in selected cities.
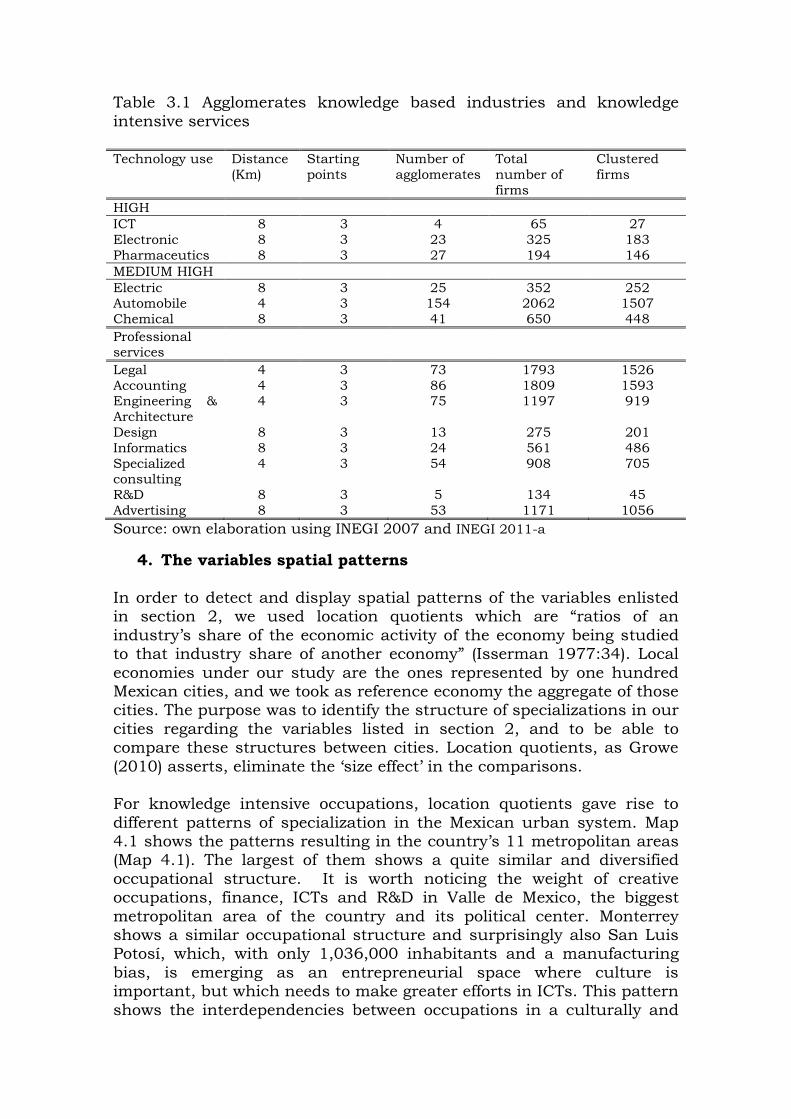
Table 3.1 Agglomerates knowledge based industries and knowledge
intensive services Technology use Distance
(Km)
Starting
points
Number of
agglomerates
Total
number of
firms
Clustered
firms
HIGH
ICT 8 3 4 65 27
Electronic 8 3 23 325 183
Pharmaceutics 8 3 27 194 146
MEDIUM HIGH
Electric 8 3 25 352 252 Automobile 4 3 154 2062 1507
Chemical 8 3 41 650 448
Professional services
Legal 4 3 73 1793 1526
Accounting 4 3 86 1809 1593 Engineering &
Architecture
4 3 75 1197 919
Design 8 3 13 275 201
Informatics 8 3 24 561 486
Specialized consulting
4 3 54 908 705
R&D 8 3 5 134 45
Advertising 8 3 53 1171 1056
Source: own elaboration using INEGI 2007 and INEGI 2011-a
4. The variables spatial patterns
In order to detect and display spatial patterns of the variables enlisted in section 2, we used location quotients which are “ratios of an
industry’s share of the economic activity of the economy being studied to that industry share of another economy” (Isserman 1977:34). Local
economies under our study are the ones represented by one hundred Mexican cities, and we took as reference economy the aggregate of those cities. The purpose was to identify the structure of specializations in our
cities regarding the variables listed in section 2, and to be able to compare these structures between cities. Location quotients, as Growe
(2010) asserts, eliminate the ‘size effect’ in the comparisons. For knowledge intensive occupations, location quotients gave rise to
different patterns of specialization in the Mexican urban system. Map 4.1 shows the patterns resulting in the country’s 11 metropolitan areas (Map 4.1). The largest of them shows a quite similar and diversified
occupational structure. It is worth noticing the weight of creative occupations, finance, ICTs and R&D in Valle de Mexico, the biggest
metropolitan area of the country and its political center. Monterrey shows a similar occupational structure and surprisingly also San Luis Potosí, which, with only 1,036,000 inhabitants and a manufacturing
bias, is emerging as an entrepreneurial space where culture is important, but which needs to make greater efforts in ICTs. This pattern
shows the interdependencies between occupations in a culturally and
economically more diversified urban environment. Deviations from such
pattern show deficits or surpluses resulting from the geographic, political or demographic positioning of each city. Guadalajara and
Querétaro deviate from the pattern in terms of the larger concentration of strategic command and control occupations, which may point to the manufacturing industries under the command and control of a local
entrepreneurship. Also, in Map 4.1 a balanced occupational pattern can be seen in some
urban concentrations with less inhabitants but lying within the limits of the largest metropolitan areas. The occupational pattern of cities
situated at the border with USA reflects the importance of the maquiladora industry and the insertion of these territories in American electronic clusters. The lack of CEO’s and management occupations
outstands, particularly in Ciudad Juárez, where violence and insecurity may be a decisive factor to move command centers to the other side of the border. Finally, it is worth mentioning that the distribution of people
occupied in research and development is relatively balanced across these 11 cities; which might be evidence of the increase in educational
opportunities in higher education and of the emergence and growth of research centers in these cities.
As a supplement of the analysis of the spatial occupational structure, we explored knowledge intensive services; particularly the ones represented by the firms lying in the agglomerates described in section
3. Here we may interpret a pattern in evolution that can be read departing from five services, that in greater or lesser extent are
clustered in the 11 cities (legal, accounting, engineering and architecture, informatics and advertising), and which are the only ones clustered in San Luis Potosí and La Laguna. Then, we can trace a first
step to specialized consulting services clustered in Querétaro, Toluca and Juárez, followed by a second step, including design services –found
in Puebla-Tlaxcala, Monterrey, Tijuana and León- and ending with research and development which only are agglomerated in Mexico and Guadalajara (Map 4.2). One could make the hypothesis that only in
these two cities specialized firms in this domain have been established as a result of both: knowledge spillovers, derived from formal universities and research and development institutions, and market
demands created by firms’ needs to outsource specialized functions.
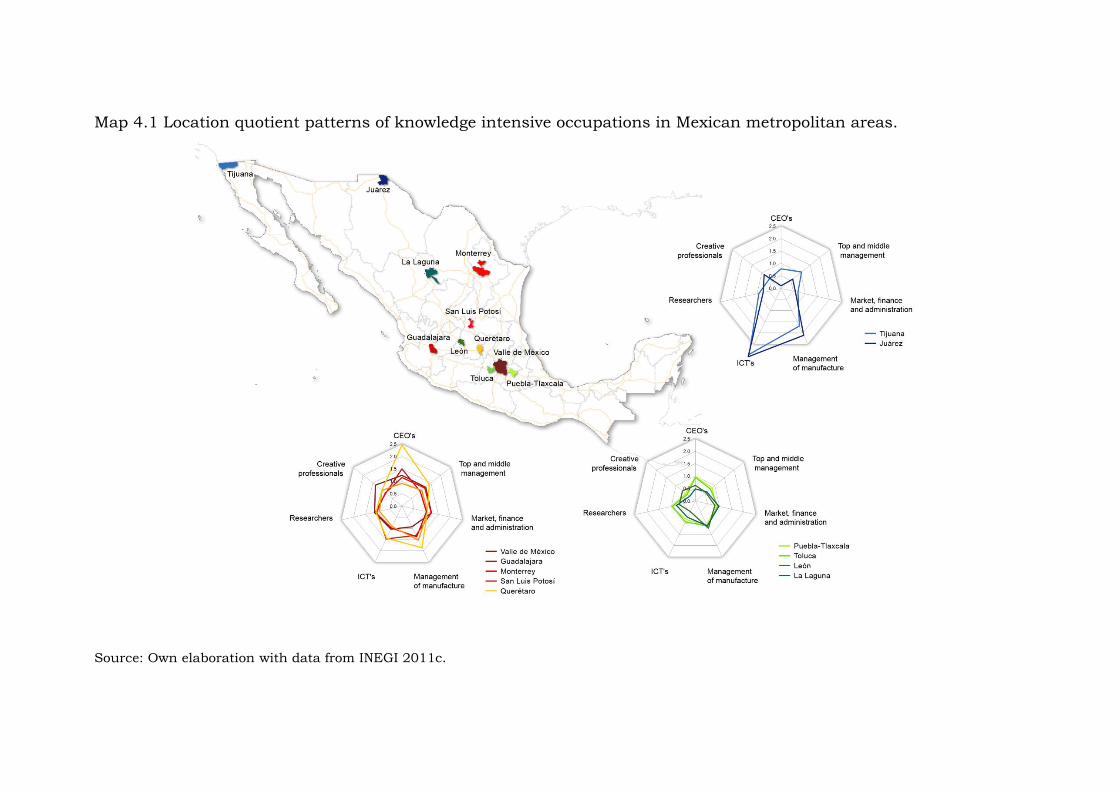
Map 4.1 Location quotient patterns of knowledge intensive occupations in Mexican metropolitan areas.
Source: Own elaboration with data from INEGI 2011c.
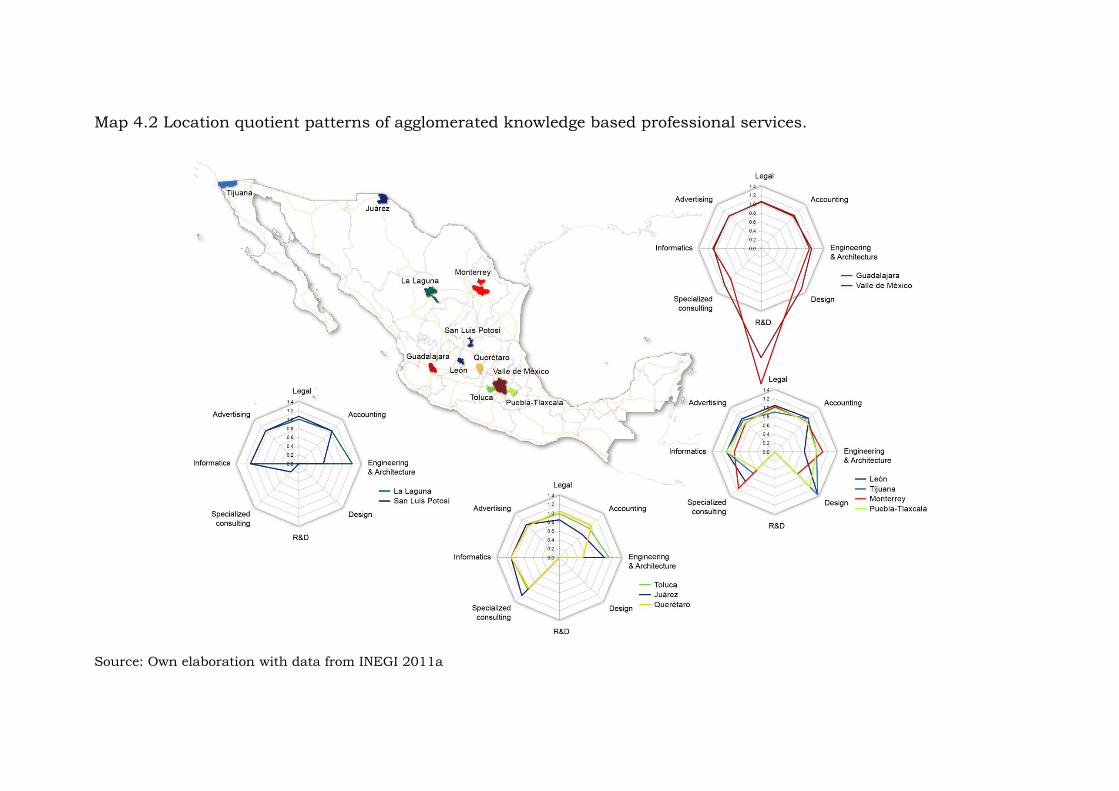
Map 4.2 Location quotient patterns of agglomerated knowledge based professional services.
Source: Own elaboration with data from INEGI 2011a
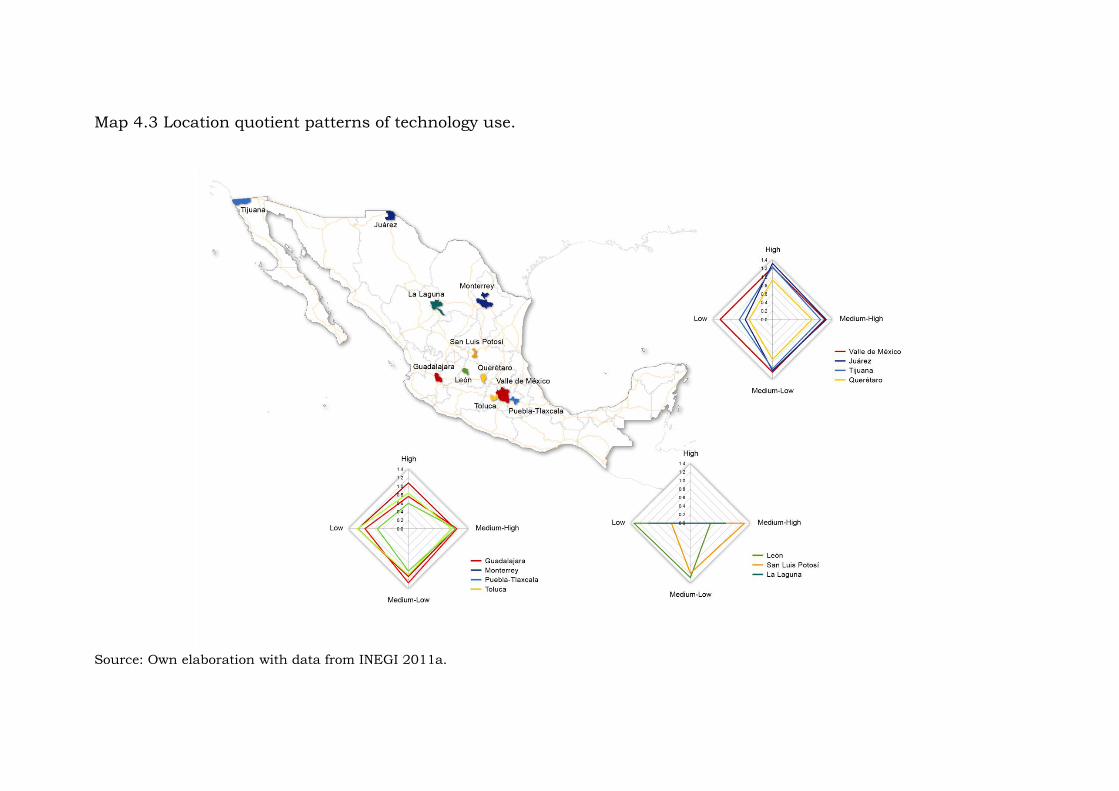
Map 4.3 Location quotient patterns of technology use.
Source: Own elaboration with data from INEGI 2011a.
Patterns derived from location quotients of knowledge intensive firms in
the eleven cities can also be described in steps, starting from cities like León, La Laguna and San Luis Potosí, where high technology industries
are absent; followed by Puebla-Tlaxcala, Toluca, Guadalajara and Monterrey where high technology industries gain relevance and concluding in cities where low technology firms lose importance in favor
of high technology ones. Mexico’s metropolitan zone displays a more balanced structure with relevant concentrations of all firms included in the knowledge use classification (Map 4.3).
Following Growe (2010) the functional importance of cities respect to
each variable was calculated as the sum of their attributes location quotients. This measure reflects the entire importance of each city in the variable. This was done for knowledge based occupations and
knowledge intensive professional services. The functional importance of the 11 cities regarding these variables is shown on Graph 4.1. They are
displayed together with the location quotients of agglomerates of high technology firms and the sum of those of medium high and high technology firms. It is worth noticing that higher values of functional
importance attach to a specialization of the variable in one or two of its attributes, while low values accrue to a more balanced or diversified structure. Hence, for example, Querétaro’s high value in the functional
importance of knowledge based occupations is derived from the fact that CEO’s concentrate the most in this city; also, Guadalajara’s high
functional importance of knowledge intensive services is due to the concentration of research and development services in this city. Meanwhile, Monterrey lies near the average of functional importance
which may be due to a more balanced pattern of knowledge based occupations and to a deficit presence of agglomerates of research and
development professional services in this city. Human capital activity rate allows answering if those who are working
have a higher educational level in their group age. In such a case one could say that the market is making good use of the available human capital. Location quotients patterns for this variable in the 11 Mexican
metropolitan areas are displayed in Graph 4.2. This graph shows the human capital contained in persons that can be situated into two
echelons of educational attainments. The first one corresponds to those who have achieved a university degree or are enrolled in a university program; the second corresponds to those who have a graduate degree
or are enrolled in a graduate program. In general terms we observe that the market assimilates more this human capital from the young generation than from the adult one. This in itself poses a situation
reflecting human capital waste. Although we deal with the same level of formal education in both age groups, it is expected that human capital
would increase with age: adults have spent more time in the labor market, therefore they have accumulated more human capital as a result of their working experience and possibly of on the job training.
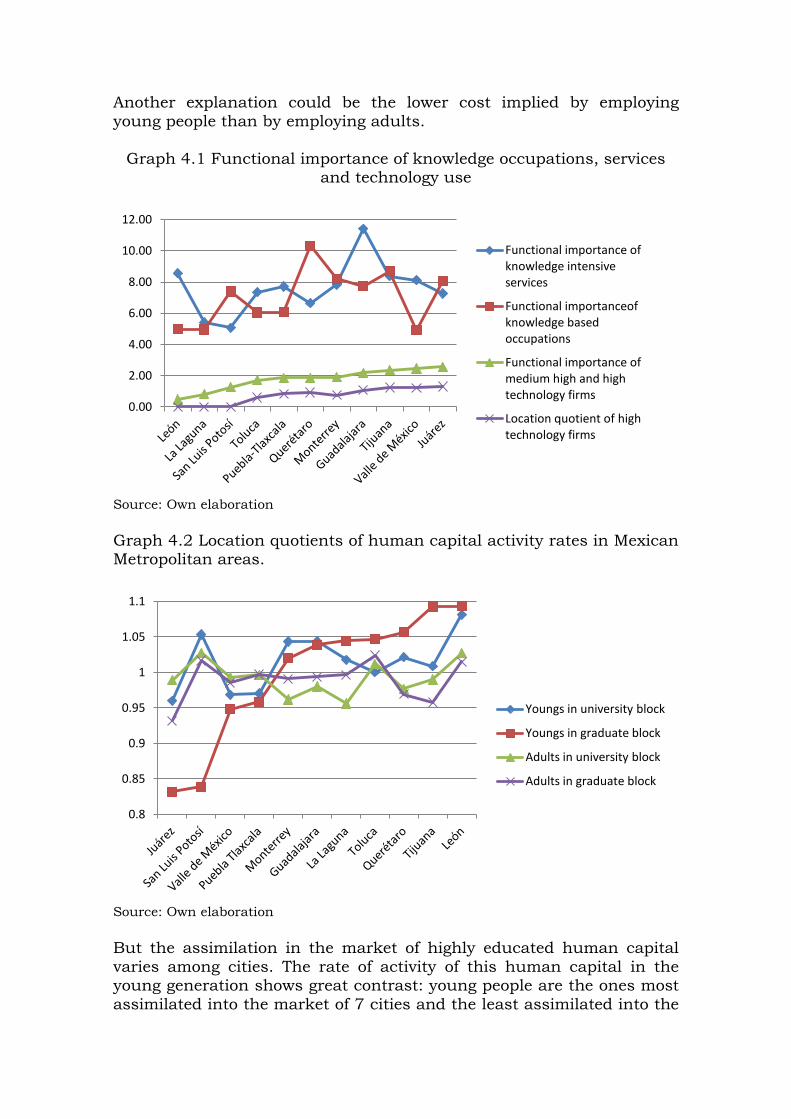
Another explanation could be the lower cost implied by employing
young people than by employing adults.
Graph 4.1 Functional importance of knowledge occupations, services and technology use
Source: Own elaboration
Graph 4.2 Location quotients of human capital activity rates in Mexican Metropolitan areas.
Source: Own elaboration
But the assimilation in the market of highly educated human capital
varies among cities. The rate of activity of this human capital in the young generation shows great contrast: young people are the ones most
assimilated into the market of 7 cities and the least assimilated into the
0.00
2.00
4.00
6.00
8.00
10.00
12.00
Functional importance of knowledge intensive services
Functional importanceof knowledge based occupations
Functional importance of medium high and high technology firms
Location quotient of high technology firms
0.8
0.85
0.9
0.95
1
1.05
1.1
Youngs in university block
Youngs in graduate block
Adults in university block
Adults in graduate block
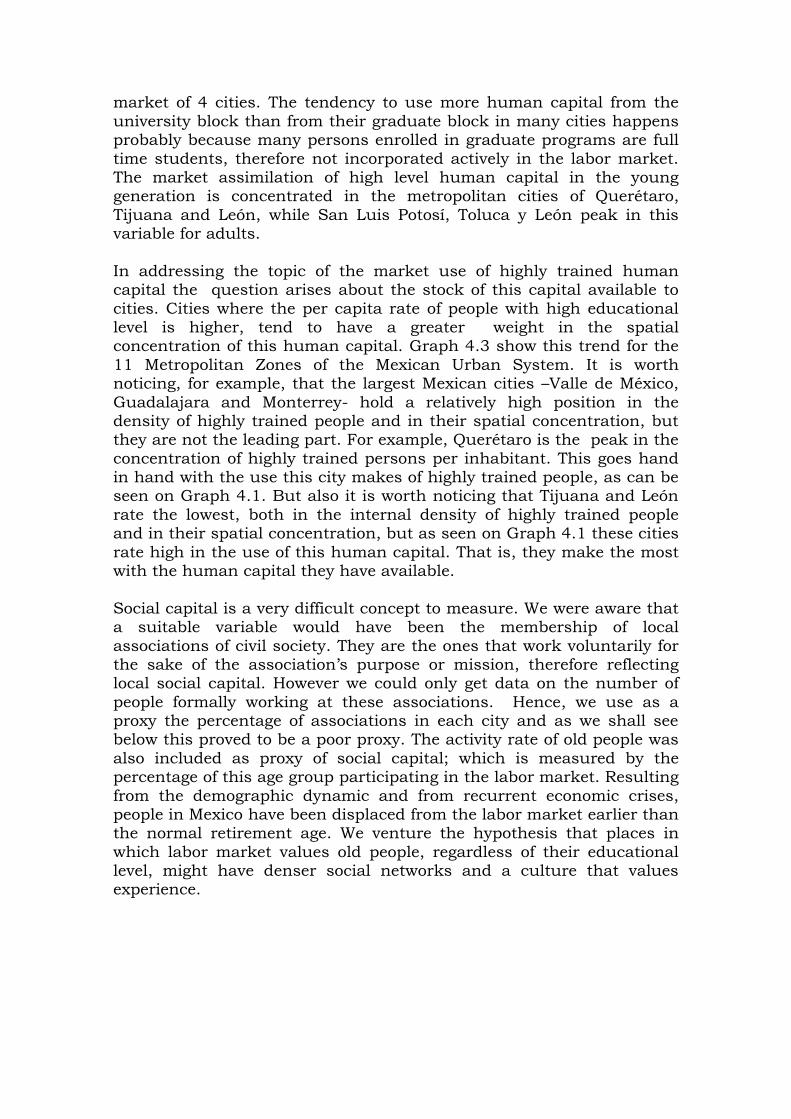
market of 4 cities. The tendency to use more human capital from the
university block than from their graduate block in many cities happens probably because many persons enrolled in graduate programs are full
time students, therefore not incorporated actively in the labor market. The market assimilation of high level human capital in the young generation is concentrated in the metropolitan cities of Querétaro,
Tijuana and León, while San Luis Potosí, Toluca y León peak in this variable for adults.
In addressing the topic of the market use of highly trained human capital the question arises about the stock of this capital available to
cities. Cities where the per capita rate of people with high educational level is higher, tend to have a greater weight in the spatial concentration of this human capital. Graph 4.3 show this trend for the
11 Metropolitan Zones of the Mexican Urban System. It is worth noticing, for example, that the largest Mexican cities –Valle de México,
Guadalajara and Monterrey- hold a relatively high position in the density of highly trained people and in their spatial concentration, but they are not the leading part. For example, Querétaro is the peak in the
concentration of highly trained persons per inhabitant. This goes hand in hand with the use this city makes of highly trained people, as can be seen on Graph 4.1. But also it is worth noticing that Tijuana and León
rate the lowest, both in the internal density of highly trained people and in their spatial concentration, but as seen on Graph 4.1 these cities
rate high in the use of this human capital. That is, they make the most with the human capital they have available.
Social capital is a very difficult concept to measure. We were aware that a suitable variable would have been the membership of local
associations of civil society. They are the ones that work voluntarily for the sake of the association’s purpose or mission, therefore reflecting local social capital. However we could only get data on the number of
people formally working at these associations. Hence, we use as a proxy the percentage of associations in each city and as we shall see below this proved to be a poor proxy. The activity rate of old people was
also included as proxy of social capital; which is measured by the percentage of this age group participating in the labor market. Resulting
from the demographic dynamic and from recurrent economic crises, people in Mexico have been displaced from the labor market earlier than the normal retirement age. We venture the hypothesis that places in
which labor market values old people, regardless of their educational level, might have denser social networks and a culture that values experience.
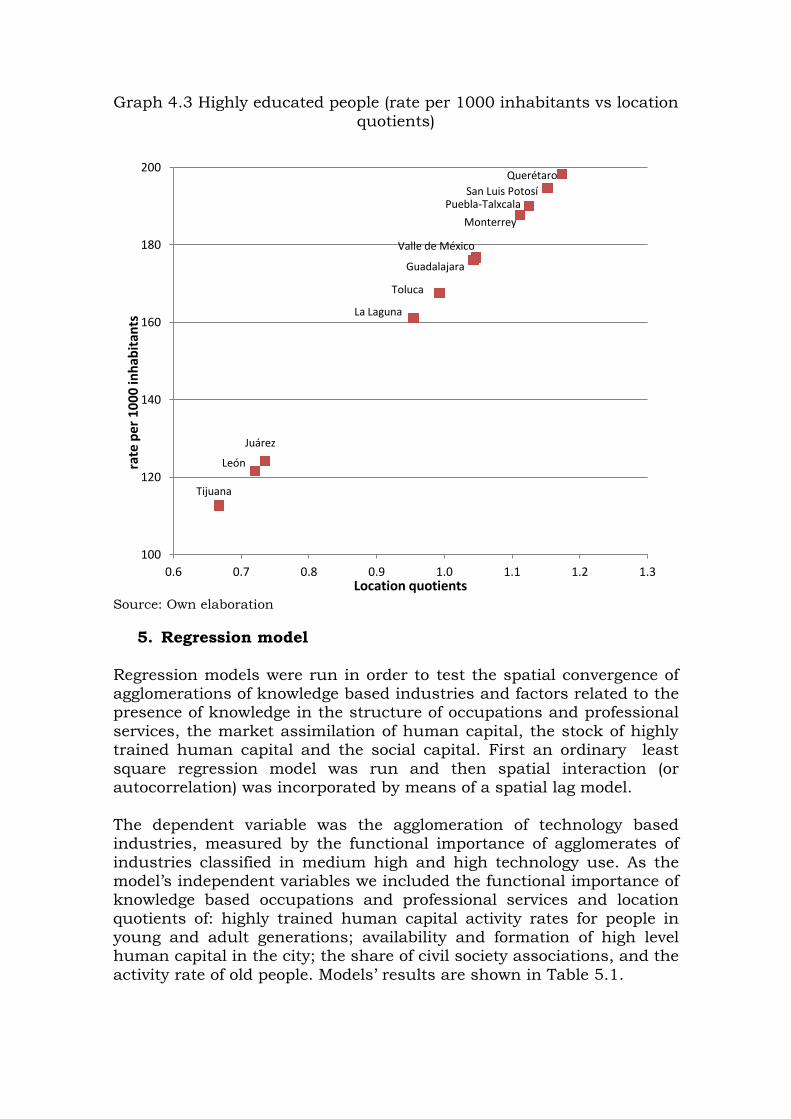
Graph 4.3 Highly educated people (rate per 1000 inhabitants vs location
quotients)
Source: Own elaboration
5. Regression model
Regression models were run in order to test the spatial convergence of agglomerations of knowledge based industries and factors related to the presence of knowledge in the structure of occupations and professional
services, the market assimilation of human capital, the stock of highly trained human capital and the social capital. First an ordinary least
square regression model was run and then spatial interaction (or autocorrelation) was incorporated by means of a spatial lag model.
The dependent variable was the agglomeration of technology based industries, measured by the functional importance of agglomerates of
industries classified in medium high and high technology use. As the model’s independent variables we included the functional importance of knowledge based occupations and professional services and location
quotients of: highly trained human capital activity rates for people in young and adult generations; availability and formation of high level human capital in the city; the share of civil society associations, and the
activity rate of old people. Models’ results are shown in Table 5.1.
Querétaro
San Luis Potosí Puebla-Talxcala
Monterrey
Valle de México
Guadalajara
Toluca
La Laguna
Juárez
León
Tijuana
100
120
140
160
180
200
0.6 0.7 0.8 0.9 1.0 1.1 1.2 1.3
rate
per
10
00
inh
abit
ants
Location quotients
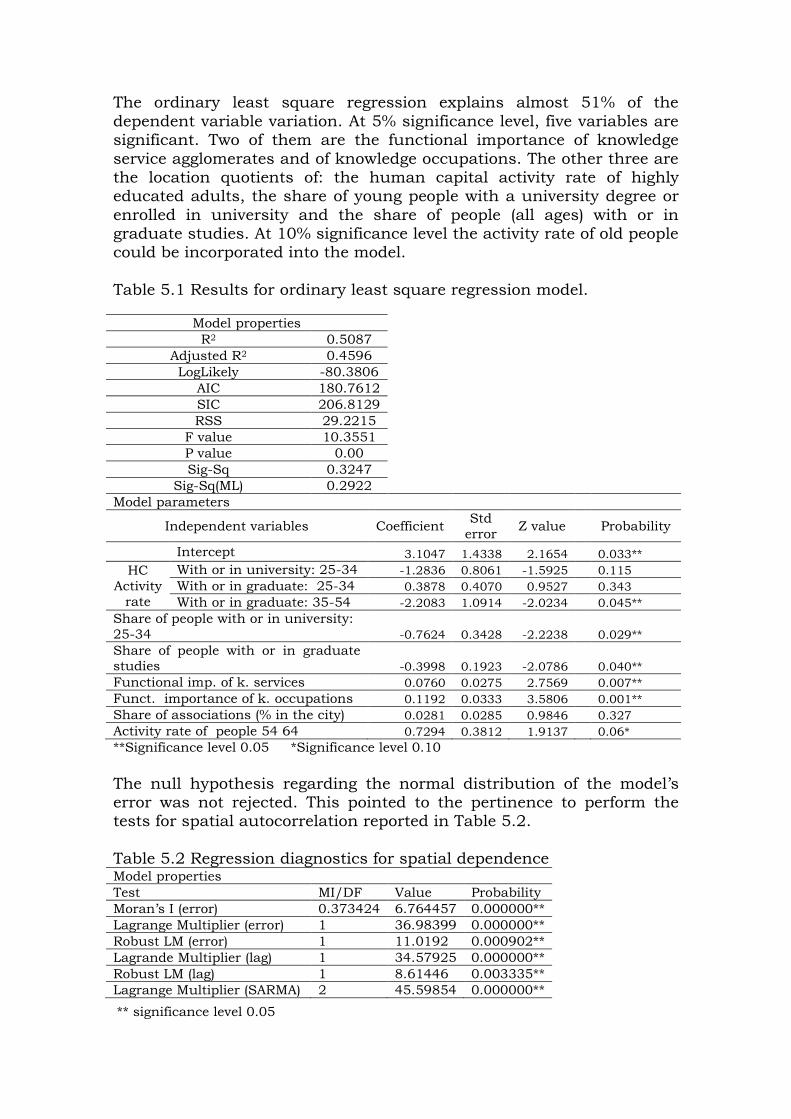
The ordinary least square regression explains almost 51% of the
dependent variable variation. At 5% significance level, five variables are significant. Two of them are the functional importance of knowledge
service agglomerates and of knowledge occupations. The other three are the location quotients of: the human capital activity rate of highly educated adults, the share of young people with a university degree or
enrolled in university and the share of people (all ages) with or in graduate studies. At 10% significance level the activity rate of old people could be incorporated into the model.
Table 5.1 Results for ordinary least square regression model.
Model properties
R2 0.5087
Adjusted R2 0.4596
LogLikely -80.3806
AIC 180.7612
SIC 206.8129
RSS 29.2215
F value 10.3551
P value 0.00
Sig-Sq 0.3247
Sig-Sq(ML) 0.2922
Model parameters
Independent variables Coefficient Std
error Z value
Probability
Intercept 3.1047 1.4338 2.1654 0.033**
HC
Activity
rate
With or in university: 25-34 -1.2836 0.8061 -1.5925 0.115
With or in graduate: 25-34 0.3878 0.4070 0.9527 0.343
With or in graduate: 35-54 -2.2083 1.0914 -2.0234 0.045**
Share of people with or in university:
25-34 -0.7624 0.3428 -2.2238
0.029**
Share of people with or in graduate studies -0.3998 0.1923 -2.0786
0.040**
Functional imp. of k. services 0.0760 0.0275 2.7569 0.007**
Funct. importance of k. occupations 0.1192 0.0333 3.5806 0.001**
Share of associations (% in the city) 0.0281 0.0285 0.9846 0.327
Activity rate of people 54 64 0.7294 0.3812 1.9137 0.06*
**Significance level 0.05 *Significance level 0.10
The null hypothesis regarding the normal distribution of the model’s error was not rejected. This pointed to the pertinence to perform the tests for spatial autocorrelation reported in Table 5.2.
Table 5.2 Regression diagnostics for spatial dependence Model properties
Test MI/DF Value Probability
Moran’s I (error) 0.373424 6.764457 0.000000**
Lagrange Multiplier (error) 1 36.98399 0.000000**
Robust LM (error) 1 11.0192 0.000902**
Lagrande Multiplier (lag) 1 34.57925 0.000000**
Robust LM (lag) 1 8.61446 0.003335**
Lagrange Multiplier (SARMA) 2 45.59854 0.000000**
** significance level 0.05

The low probability of Moran’s I error shows spatial autocorrelation in residual terms. The significance of both Lagrange multipliers would
point to the pertinence to prove spatial error models. However, Ward and Skrede assert that: “It is difficult to discriminate between spatially
lagged y and a spatial error model purely on statistical
grounds...[when].. the log likelihoods for the two models are very similar ..[and] both models entail the same number of parameters, there is no clear basis for saying that the one is more parsimonious than the other
and, hence, there is little empirical guidance to tell the two models apart in terms of fit to the data alone.” (2008:69-70). Then they conclude that the model’s choice must be framed in each research
conceptual context.
In our case, the log likelihood for the spatial error model (-68.4773) resulted very similar to the spatially lagged one (-70.5487) and both of them where run with the same number of independent variables. Then,
in order to choose a spatial model on conceptual grounds, two assumptions were opened:
1. The value of the agglomeration of medium and high technology
based industries for a city (yi) influences the value of this dependent
variable for neighboring cities and these last, in turn, feed-back on to yi. This means that industries agglomerate in one city as opposed as in one of its neighbors because of specific characteristics found in
the first one. Under this assumption the spatially lagged model is suitable.
2. A portion of the error in the dependent variable value for a city and
its neighbors is due to the value of some spatially agglomerated
unknown variable. This means that the model’s errors are spatially correlated and are due to the omission in the model of independent
variables. Under this assumption the spatial error model is suitable. Obviously we cannot entirely rule out the second assumption, as
models are almost by definition mere approximations for explaining the behavior of a dependent variable. In this case variables selected as proxies for social capital were neither significant at 5% level for the
ordinary least square nor for the spatial error model and we believe this problem arose because we could not find data for a suitable measure of
this kind of capital. But although we have to acknowledge that social capital may lie as source of error, we decided not choose this model and opt for the spatially lagged one because cities are not isolated areas;
they interact in complex ways and feedback loops are expected to be going on. What happens in one city may impact in others, being these close neighbors or distant cities.
The geographic space covered by the project considers the urban system
throughout the country and the scale and the distance between cities
gave rise to disjoint spaces. In order to implement the spatially lagged
regression model, we introduced a weight matrix. Each element of the matrix represents a neighbor. The neighbors are arranged by distance,
the first is the nearest and the last the farthest. Trials with few neighbors did not give rise to spatial dependence; but if the number of members exceeded seven, the space considered encompassed a very
large territory. Hence, we chose 6 neighbors and the result was analyzed together with a map of the centroids and we found that the resulting arrangement rendered a good approximation of regional
neighborhoods.
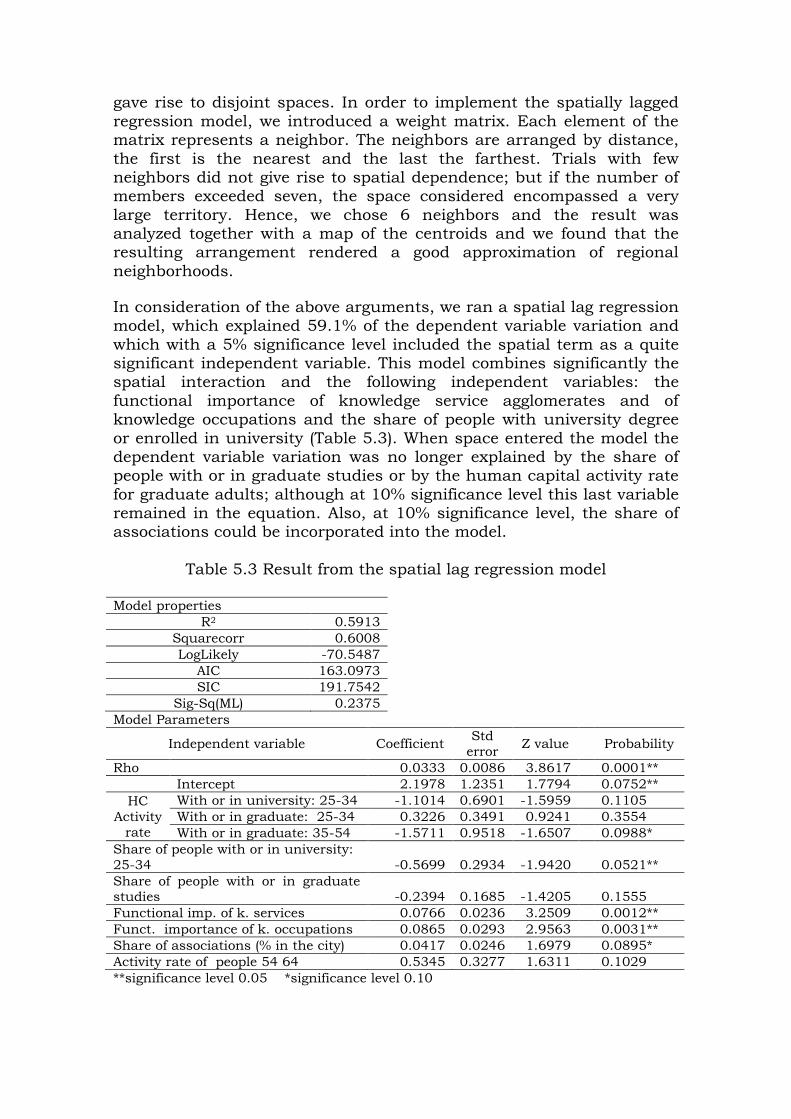
In consideration of the above arguments, we ran a spatial lag regression model, which explained 59.1% of the dependent variable variation and
which with a 5% significance level included the spatial term as a quite significant independent variable. This model combines significantly the spatial interaction and the following independent variables: the
functional importance of knowledge service agglomerates and of knowledge occupations and the share of people with university degree
or enrolled in university (Table 5.3). When space entered the model the dependent variable variation was no longer explained by the share of people with or in graduate studies or by the human capital activity rate
for graduate adults; although at 10% significance level this last variable remained in the equation. Also, at 10% significance level, the share of associations could be incorporated into the model.
Table 5.3 Result from the spatial lag regression model
Model properties
R2 0.5913
Squarecorr 0.6008
LogLikely -70.5487
AIC 163.0973
SIC 191.7542
Sig-Sq(ML) 0.2375
Model Parameters
Independent variable Coefficient Std
error Z value
Probability
Rho 0.0333 0.0086 3.8617 0.0001**
Intercept 2.1978 1.2351 1.7794 0.0752**
HC
Activity
rate
With or in university: 25-34 -1.1014 0.6901 -1.5959 0.1105
With or in graduate: 25-34 0.3226 0.3491 0.9241 0.3554
With or in graduate: 35-54 -1.5711 0.9518 -1.6507 0.0988*
Share of people with or in university:
25-34 -0.5699 0.2934 -1.9420
0.0521**
Share of people with or in graduate studies -0.2394 0.1685 -1.4205
0.1555
Functional imp. of k. services 0.0766 0.0236 3.2509 0.0012**
Funct. importance of k. occupations 0.0865 0.0293 2.9563 0.0031**
Share of associations (% in the city) 0.0417 0.0246 1.6979 0.0895*
Activity rate of people 54 64 0.5345 0.3277 1.6311 0.1029
**significance level 0.05 *significance level 0.10
Conclusions
This work departed from the purpose to integrate a comprehensive view
of areas with potential for promoting innovation in Mexican cities. This view may aid policy makers and territorial planners to tailor actions to create and synergize networks of knowledge generation and transfer,
which involve formal explicit knowledge created in science and technology institutions and tacit knowledge derived from know-how and skills from firms and relevant local stakeholders.
We explored local quotients of the variables included in this research
and used the country’s eleven largest metropolitan areas to show their trends. We found cities grouping in patterns and although groupings differ with each variable, we could trace cities that tend to group
frequently regardless of the variable.
Spaces prone to innovation were defined in places where industries using high and medium high technologies agglomerate. Then, by means of an ordinary least square regression we explained such agglomerates
by the specialization/diversification of knowledge intensive occupations and services, the labor market assimilation of highly educated adults, the availability and formation of young people in the university
educational echelon and of people in the graduate one.
Space proved to be an explaining factor of knowledge based activity agglomerates. The significance of the lag model allowed concluding that the spatial heterogeneity of the dependent variable is associated to
independent variables and to other spatial interactions (social, economic or cultural) between the cities. This model ruled out as
significant independent variables the human capital activity rate of adults in the graduate echelon and the stock and formation of graduates.
These are only preliminary results of a longer term research project. Many issues will have still to be incorporated into the study. Among
them, a more detailed analysis of the structure of specialization and diversification of occupational and services markets is still pendant.
Also, in the knowledge economy literature, innovation is equaled to products and services resulting from leading technology and frontier research. For countries like Mexico, it makes more sense to approach it
from the point of view of alternative technologies and local know-how, skills and abilities. Also, an alternative approach to innovation could include processes oriented towards the solution of social problems or
delivery of social services; hence new local processes of innovations may be incorporated in our scope.
Finally, social capital is a key factor in the knowledge economy. However the measurement of its presence and density in Mexican
spatial contexts is a challenge which still needs to be tackled, both
conceptually and empirically.
References
Asheim B., Cooke P. and Martin R. 2006, “The rise of the Cluster
Concept in Regional Analysis and Policy. A critical assessment”. B.
Asheim et al. (eds.) Clusters and Regional Development, Critical
Reflections and Explorations, Routledge. London and New York.
Black S. and Lynch L. 1996, “Human capital investments and
productivity”. American Economic Review, 86: 263-268.
Cannon E. 2000, “Human Capital: level versus growth effects”. Oxford
Economic Papers, 52:670-677.
Carrillo J. 2007, “La Industria Maquiladora en México: ¿Evolución o
Agotamiento?”. Comercio Exterior. August, 57(8): 668-681.
Carrillo J. and Hualde A. 2006, “Competitividad y Escalamiento Industrial en México: de la Televisión Análoga a la Digital”. Comercio Exterior. July, 56(7): 565-580.
Casalet M., González L. and Buenrostro E. 2008, “La Construcción de
las redes de innovación en los clusters de software”. Quivera, January-
June. 10(1): 92-115 Universidad del Estado de México.
Casas R. and Luna M. 2001, “Espacios emergentes de conocimiento en
las regiones: hacia una taxonomía”. R. Casas. (ed.) La formación de
Redes de Conocimiento. Instituto de Investigaciones Sociales. México
Coleman J. S. 1988, “Social capital in the creation of human capital”.
The American Journal of Sociology, 94: S95-S120. Supplemet:
Organization and Institutions: Sociological and Economic Approaches to
the Analysis of Social Structure. Chicago: University of Chicago Press.
CONAPO, INEGI and SEDESOL, 2007, “Delimitación de las zonas
metropolitanas de México”. México. Available at:
http://www.conapo.gob.mx/publicaciones/dzm2005/completoZM2005.
pdf Cooke P., De Laurentis C., Tödtling F. and Trippl M. 2007, “Regional
knowledge economies. Markets, clusters and innovation”. New Horizons
in Regional Science. Edward Elgar. Cheltenham UK and Northampton MA, USA.
Corona T.L. 2005, “El reto de crear ambientes regionales de innovación” Fondo de Cultura Económica. México.
Dakhli M. and De Clercq D. 2004, “Human capital, social capital and
innovation: a multicountry study”. Entrepreneurship and Regional
Development. Routledge March, 15: 107-128.
Feldman, M. 2000, “Location and innovation: The new economic
geography of innovation, Spillovers and Agglomeration”. G. Clark, M.
Feldman and M. Gertler. (eds.) The Oxford Handbook of Economic
Geography. New York: Oxford University Press.
Florin J. and Schultze W. 2000, “Social capital and fundability of high
potential new ventures”. Toronto: Academy of Management Meetings.
Garnsey E. and Heffernan P. 2007, “The Cambridge high-tech cluster:
an evolutionary perspective in Koen Frenken (ed.) “Applied evolutionary
economics and economic geography”. Edward Elgar. Chetenham, UK.
Northampton MA, USA.
Gradstein M. and Justman M. 2000, “Human capital, social capital, and
public schooling”. European Economic Review, 44: 879-891.
Growe A. 2010 “Human capital in the German urban system- Patterns of concentration and specialization”, refereed article, August. European
Journal of Spatial Development. Last accessed February 23 2012 at: http://www.nordregio.se/EJSD/Refereed40.pdf
Hatzichronoglou T. 1996 “Revision of the high-technology sector and product classification”. STI Working Papers !977/2 OECD. Paris. Last
accessed may 29 2012 at: http://www.oecd.org/officialdocuments/publicdisplaydocumentpdf/?cote=OCDE/GD(97)216&docLanguage=En
Hudson R. 1999, “The learning economy, the learning firm and the
learning región: A sympathetic critique of the limits of learning”. European Urban and RegionalStudies. SAGE Pub. London, 6(1): 59-72. INEGI 2007 “Sistema de Clasificación industrial de América del Norte”.
Mexico. Available at:
http://www.inegi.org.mx/sistemas/scian/contenidos/SCIAN%20M%C3%A9xico%202007%20(26enero2009).pdf
INEGI 2011a, “Directorio Estadístico Nacional de Unidades Económicas (DENUE)”
INEGI 2011b, “Clasificaciones del Censo de Población y Vivienda 2010”. Available at:
http://www.inegi.org.mx/est/contenidos/espanol/metodologias/censos/cpv2010_clasificaciones.pdf INEGI 2011c, “Microdatos de la muestra del Censo de Población y
Vivienda 2010”. Isserman A. 1977, “The Location Quotient Approach to Estimating
Regional Economic Impacts”. Journal of the American Institute of
Planners. 43(1): 33-41. http://www.tandfonline.com/loi/rjpa19
Javanovic M. 2009, “Evolutionary economic geography. Location of production and the European Union” Routledge. London and New York.
Lawson, C. 1997, “Territorial Clustering and High-Technology
Innovation: from Industrial Districts to Innovative Milieux”. ESRC
Center for Business Research, University of Cambridge, Working Paper
No. 54.
Maskell P. and Malmberg A. 1999, “Localized learning and Industrial
competitiveness”. Cambridge, Journal of Economics, 23: 167-185.
Morosini P. 2004, “Industrial Clusters, Knowledge Integration and
Performance”. World Development, 32(2): 305–326.
Maldonado A. 2010, “México y la economía basada en el conocimiento.
¿Jugamos como nunca, perdimos como siempre?”. Metapolítica, 70:84-
89. Morgan K. 2002, “The learning region: Innovation and regional
renewal”. Regional Studies, 31(5): 491-503. Mourad D. and De Clercq D. 2004, “Human Capital, Social Capital and
Innovation: a multi-country study”. Entrepreneurship and Regional
Development. Routledge. 16: 107-128.
Prais S. J. 1995, “Productivity, education and training: an international perspective” Cambridge: Cambridge University Press.
Rutten R. and Boekema F. 2007, “Regional innovation clusters: evaluation of the south-east Brabant cluster scheme” in ed. P. Cooke
and D. Schwartz Creative regions. Technology, culture and knowledge
entrepreneurship. Routledge. London and New York. 105-126.
Sassen S. 2001, “The Global City. New York, London and Tokyo”.
Second edition. Princeton University Press. Princeton and Oxford.
Seragelding I. and Dasgupta P. 2001, “Social capital: a multifaceted perspective”. Washington D.C.: The International Bank for Reconstruction and Development. The World Bank.
Simon C. 1988, “Human Capital and Metropolitan Employment
Growth”. Cambridge, MA: Harvard University Press.
Unger K. 2004, “La Industria Automotriz en Tres Regiones de México.
Un Análisis de Clusters”. El Trimestre Económico, Fondo de Cultura
Económica. October-December 61(284): 901-941.
Van Damme D. 2009 “Human capital development in cities and regions”. OECD. Centre for Educational Research and Innovation.
Available at http://www.oecd.org/dataoecd/14/33/43684473.pdf Ward M. and Skrede K. 2008, “Spatial regression models”. SAGE.
California.
Wolfe D. A. 2002 “Social Capital and Cluster Development in Learning
Regions” in A. Holbrook and D. Wolfe (ed.) Knowledge Clusters and
Regional Innovation. Economic Development in Canada. Mc Gill-Queens’ University Press. Montreal & Kingston. London. Ithaca