Embed Size (px)
Citation preview

2017
UNIVERSIDADE DE LISBOA
FACULDADE DE CIÊNCIAS
DEPARTAMENTO DE BIOLOGIA VEGETAL
Identification and study of lipid metabolism genes by qPCR in
Rubisco mutants of Chlamydomonas reinhardtii
Miguel Camões Fragoso Gaspar
Mestrado em Biologia Molecular e Genética
Dissertação orientada por:
Prof. Doutora Maria da Glória Esquível
Prof. Doutora Ana Rita Matos

II
Master’s thesis in Molecular Biology and Genetics, Faculdade de Ciências da Universidade de
Lisboa, held at Biosystems and Integrative Sciences Institute (BioISI) and Instituto Superior de
Agronomia (ISA), under the supervision of Doutora Maria da Glória Esquível and Doutora Ana
Rita Matos.
Most of the results described in this thesis were presented at one international scientific
meeting:
Gaspar, M, Esquível MG, Matos AR. Phenotypic characterization of Chlamydomonas
reinhardtii mutants that perform a deficient CO2 assimilation. 3rd General COST meeting
workshop 2017, ITQB NOVA.

I
I. Agradecimentos
Um grande obrigado a ambas as orientadoras pelo tempo, paciência e dedicação
demonstrados ao longo deste ano. Foram uma inspiração e uma força que me permitiram
conhecer um pouco da vida académica e ficar a saber mais sobre o que é investigação
científica.
Ao meu pai e à minha mãe, pelo tempo e energia e toda a fé que depositaram em mim não só
para o mestrado mas na vida. Pela disponibilidade em ouvir os meus desabafos sobre o tema
e pela tranquilidade que têm e me ensinaram a ter ao longo destes 23 anos.
À minha avó Zulima e tia Paula, pela preocupação pelo bem-estar das algas e do meu
trabalho. Ao Rui Pedro, que mesmo estando longe faz por estar perto. À Alicia, que apareceu
em Abril e tornou a família Gaspar mais sorridente. Que um dia consigas tudo aquilo que
queiras! O teu sorriso trouxe felicidade do Luxemburgo à Nova Zelândia.
À Dona Manuela, pela ajuda no laboratório e pelo bom ambiente criado. Sem a sua ajuda não
teria sido a mesma experiência. Aprendi muito consigo. Nunca perca essa força de vontade.
À Daniela e ao Eduardo, os meus parceiros de tese. Obrigado por tudo. Sem vocês aquele
laboratório não tinha aquele ambiente tranquilo mas divertido, de trabalhos diversos mas com
intercomunicação. Tornaram a FCUL num lugar de trabalho incrível!
Aos Professores Jorge e Andreia, pela orientação na parte estatística e pela disponibilidade
que mostraram ao longo destes meses.
Ao Bernardo, Ana, Rui, Gonçalo, Clemente, João, Bárbara, Filipa, Marco e Jesús, pelos bons
momentos no laboratório. Tornaram o processo mais fácil e calmo. Trabalhar rodeado de
energia positiva torna tudo mais simples.
À Carina, Marisa e Bárbara, obrigado pelas conversas sobre tudo e sobre nada. Sem vocês o
mestrado não tinha sido o mesmo. Obrigado por ouvirem, pelos bons momentos e pela
partilha de opiniões.
Ao Iúri, Ana, Marisa, Cláudia e Paulo pelo vosso apoio ao longo da tese. Obrigado por me
ouvirem e estarem presentes quando mais importa.
Finalmente, um obrigado ao tio Alexandre e à avó Guida. Não estão cá mas continuam
presentes na nossa mente. Obrigado pelas lições de vida.
Um especial obrigado à Rita por fazer sentido quando mais nada faz. Pelas conversas da vida,
gelados, karmas, e tudo o resto. Gracias.
Este trabalho não teria sido possível sem a ajuda e presença de todos vocês durante este ano.
A tese que se segue é fruto da vossa amizade. Portanto, tudo isto também é vosso. Obrigado
por tudo!

II
II. Abstract
Chlamydomonas reinhardtii is a unicellular, soil-dwelling green alga that has been the focus
of several studies regarding photosynthesis and biodiesel production. When grown in specific
conditions, such as sulphur or nitrogen (N) deficiency, this organism increases its H2
production as well as triacylglycerol (TAG) synthesis, which occurs as a response to lower
photosynthetic rates. In this investigation we characterize the phenotype of a C. reinhardtii
mutant that performs a deficient CO2 assimilation. This mutant, named I58W3, has three
tryptophan amino acids replacing one isoleucine amino acid in Rubisco small subunit, close
to Rubisco central channel.
Phenotypic characterization involved the growth of C. reinhardtii cultures under standard
growth condition (N-replete) and N deprivation in TAP medium for 5 days. During the
growth period cell number, dry weight, protein and chlorophyll contents and photosynthetic
rates were measured. Lipid composition of C. reinhardtii cell lines was assessed through gas
chromatography and thin layer chromatography, as well as Red Nile staining and subsequent
spectrophotometry. Photosynthetic apparatus efficiency and integrity was also evaluated by
pulse amplitude modulation (PAM) analysis. In order to compare Rubisco enzyme levels in
control and I58W3 mutants, protein gel electrophoresis and immunoblotting were performed.
Finally, quantitative PCR of several genes related to lipid metabolism and photosynthesis
was performed in order to investigate transcriptional changes between I58W3 mutants and
the control strain, under N-replete and N deprivation conditions.
Both protein and chlorophyll levels were affected under nitrogen deprivation as their
concentration is lower in both control and mutant cells. Mutant cells appear to have a
decreased photosynthetic efficiency and their photosynthetic apparatus does not function the
same way as it does in control cells. Rubisco enzyme levels decrease in I58W3 cells and the
expression of several genes, such as FAD or ω-13, is also lower in I58W3 cells in response
to nitrogen deprivation.
Overall, I58W3 cells show a promising role in subsequent biodiesel production, since they
show an increase in TAG lipid accumulation and decreased photosynthetic rates. Further
genetic analyses of other genes, regarding different photosynthetic pathways, should be made
in order to guarantee a thorough research and a complete database on I58W3 mutants.
Keywords: Chalydomonas reinhardtii, TAG, biodiesel, photosynthesis, Rubisco.

III
III. Resumo
Chlamydomonas reinhardtii é uma microalga modelo tendo sido usada para estudos da
fotossíntese e do metabolismo energético dos lípidos. É o organismo eucariótico em que pela
primeira vez foi possível modificar os genes das subunidades da enzima chave da
fotossíntese, a ribulose-1,5-bisfosfato carboxilase/oxigenase (Rubisco). A enzima, além de
assimilar o CO2 atmosférico, também funciona como oxigenase, catalisando a primeira
reação da via fotorrespiratória, o que a torna um ponto fundamental do metabolismo do
carbono.
A Rubisco é uma das mais abundantes enzimas na antureza, com uma massa molecular total
de 560 kDa. É constituída por 16 subunidades, 8 subunidades grandes (LSU, 55 kDa) e 8
subunidades pequenas (SSU, 15 kDa). Após a formação da enzima, as 8 subunidades grandes
estão dispostas em dímeros em torno de um canal central que influencia a eficiência do centro
catalítico, a especificidade CO2 / O2 e a estabilidade de toda a enzima. Contudo, pouco se
sabe sobre a expressão génica e metabolismo energético dos lípidos em organismos com uma
alteração profunda no canal central da Rubisco. A enzima também está presente no ciclo de
Calvin-Benson, onde catalisa a primeira reação da via fotorrespiratória, o que o torna um
ponto fundamental do metabolismo fotossintético do carbono. A síntese de Rubisco consome
uma parcela substancial de recursos nutricionais de plantas e a sua degradação afeta a
redistribuição de nutrientes dentro do organismo, o que significa que a Rubisco pode ter uma
função de armazenamento em condições fisiológicas específicas, como falta de enxofre (S)
ou azoto (N).
Um dos focos principais para o uso desta alga tem sido a sua capacidade de produzir H2 e
biodiesel, que ocorre especificamente em condições de stress ambiental, como por exemplo
falta de azoto. Uma das consequências deste tipo de stress em C. reinhardtii é a síntese e
acumulação de triacilglicerol (TAG), que é um precursor do biodiesel. Além disso outros
processos como a fotossíntese e a produção/concentração de proteínas e clorofilas também
sofrem alterações. Tendo tudo isto em conta, o foco desta investigação foi a caracterização
fenotípica de um mutante de C. reinhardtii, I58W3, que na cadeia polipeptídica da
subunidade pequena da Rubisco poSSUi uma mutação, três triptofanos (W) substituem uma
isoleucina (I) na posição do resíduo aminoácido 58. Pelos estudos de cristalografia da
Rubisco de Chlamydomonas o resíduo 58 localiza-se na entrada do canal central da estrutura
da holoenzima. No presente foram realizados vários testes ao longo do crescimento das
culturas controlo e I58W3 que visaram caracterizar este mutante a nível fotossintético,
através de leituras da concentração de O2 nas células e respetivas taxas fotossintéticas e de
respiração, assim como leituras acerca da eficiência do aparelho fotossintético através de
PAM; foram determinadas as concentrações de clorofilas e de proteínas ao longo do tempo
das culturas em células mutantes e no respetivo controlo, bem como a monitorização do peso
seco das culturas e do número de células ao longo dos cinco dias de crescimento; foi feita
com detalhe uma análise da composição lipídica através de cromatografia gasosa e
IV
cromatografia por camada fina, assim como leituras por espetrofotómetro de amostras das
culturas coradas com Red Nile. Os níveis de Rubisco em I58W3 foram comparados com o
controlo por eletroforese de proteínas e immunoblotting. Finalmente, alguns genes de
interesse foram estudados, tentando comparar a sua expressão em células da cultura controlo
com células da cultura I58W3. Adicionou-se mais um fator de comparação a este estudo, a
carência de azoto no meio de cultura, por ser indutor da síntese de lípidos de reserva em
microalgas.
Em situação de deficiência de azoto tanto o mutante I58W3 como o controlo diminuíram o
teor de clorofila e de proteína. A nível fotossintético, comparando o controlo com o mutante
I58W3, as taxas de fotossíntese foram menores para o mutante, o que indica alguma
dificuldade na assimilação de CO2 pela Rubisco, estando em linha com a mutação destas
células. A análise por PAM também indica possíveis danos no aparelho fotossintético nesta
estirpe mutante, o que também contribuirá para uma menor eficiência na produtividade. O
mutante I58W3 mostra uma menor capacidade de absorção de energia quando comparado
com o controlo, assim como valores inferiores de eficácia no transporte de eletrões e menos
centros de reação. Além disso também apresenta valores mais acentuados de dissipação de
energia sob forma de calor. A análise dos níveis da Rubisco mostram ser menores no mutante
I58W3 do que no controlo, o que pode indicar também que esta estirpe não só tem
dificuldades em assimilar eficientemente CO2, como este fator é agravado pelo teor baixo da
enzima Rubisco no cloroplasto das células de C. reinhardtii. Uma análise da composição
lipídica leva-nos a crer que, como resposta das células a uma fotossíntese deficiente, ocorre
uma alteração metabólica que provoca uma maior síntese e acumulação de lípidos,
principalmente TAG. A análise genética, por qPCR, de genes relacionados com a síntese
lipídica parece indicar que estes estão a ser expressos mais frequentemente na estirpe I58W3
do que em células controlo. Além disso, a expressão de um gene envolvido na fotossíntese
também parece corroborar a hipótese de que este processo não é tão eficaz em I58W3.
Uma análise genética feita a amostras controlo e I58W3 a vários genes indica que as
alterações a nível de acumulação de lípidos podem estar relacionadas com a síntese de novo
destes, ou com uma menor síntese de dessaturases de ácidos gordos. O mutante I58W3
apresenta maior expressão de DGAT1, uma proteína envolvida na síntese de TAG, que o
controlo, sendo que esse aumento é mais acentuado em condições de deficiência de azoto.
Este mutante também apresenta valores de expressão de CrDES inferiores ao controlo, o que
nos indica que existe uma acumulação de ácido linoleico em detrimento de ácido pinolénico
em I58W3. A proteína cytb6f encontra-se mais expressa em I58W3, embora a eficiência
fotossintética deste seja menor que a do controlo. A síntese da hidrogenase HydA1 não varia
significativamente em I58W3 independentemente da presença ou ausência de azoto. Os
resultados obtidos permitem-nos concluir que, dos genes estudados, existem diferenças a
nível da sua expressão devido à mutação em conjunto com a deficiência de azoto. Por outro
lado a síntese de proteínas como a hidrogenase HydA1 ou a galactolipase PGD1 parecem não
mudar com a mutação.
O fato de que esta estirpe consegue acumular lípidos neutros como resposta às consequências
da sua mutação, assim como à deficiência de azoto, é fulcral no âmbito da temática proposta.

V
A produção de biodiesel seria então possível utilizando estas algas em conjunto com um meio
cuja característica principal seria a falta de azoto. A união destes dois fatores poderá tornar
possível no futuro culturas cujo objetivo é a produção de biodiesel.
Palavras-chave: Chlamydomonas reinhardtii, TAG, biodiesel, fotossíntese, Rubisco

VI
Index
1. Introduction ..................................................................................................................... 1
1.1. Chlamydomonas reinhardtii as a model organism ...................................................... 1
1.2. Photosynthesis and Rubisco ........................................................................................ 3
1.3. Lipids Metabolism in C. reinhardtii ............................................................................ 5
1.4. Objectives .................................................................................................................... 6
2. Materials and methods .................................................................................................... 7
2.1. Cell strains and cell culture growth ............................................................................. 7
2.2. Dry weight and cell counting ....................................................................................... 7
2.3. Pigments analyses, extraction and quantification ........................................................ 7
2.4. Protein extraction and quantification ........................................................................... 7
2.5. Oxygen electrode measurements ................................................................................. 8
2.6. Pulse amplitude modulated (PAM) fluorometry ......................................................... 8
2.7. Nile Red fluorescence .................................................................................................. 9
2.8. Lipid extraction, methylation and gas chromatography (GC) analysis ..................... 10
2.9. Thin layer chromatography (TLC) ............................................................................ 10
2.10. Protein electrophoresis ........................................................................................... 11
2.11. Immunoblotting ...................................................................................................... 11
2.12. Gene expression analysis by qPCR ........................................................................ 12
2.13. Statistical analysis .................................................................................................. 12
3. Results/Discussion ........................................................................................................ 13
3.1. Changes in cell metabolism ....................................................................................... 13
3.2. Rubisco large subunit protein level decreases in I58W3 C. reinhardtii .................... 16
3.3. Lipid and fatty acid quantifications ........................................................................... 18
3.4. I58W3 cells have less efficient O2 production .......................................................... 21
3.5. Chlorophyll fluorescence analyses (PAM) ................................................................ 22
3.6. Gene expression analysis by qPCR ........................................................................... 25
4. Conclusions and perspectives ........................................................................................ 28
5. References ..................................................................................................................... 29
6. Supplements .................................................................................................................. 37

VII
Figure/ Table List
1.1 - Chlamydomonas reinhardtii cell morphology (Dent et al., 2001). N – nucleus; Nu –
nucleolus; M – mitochondria; C – chloroplast; V – vacuole; T – thylakoid membranes; S –
starch grain; P – pyrenoid; St – stroma; ES – eye spot; F – flagella.
1.2 - Light dependent and independent reactions in photosynthesis. Source: adapaproject.org
1.3 - Rubisco three dimensional model highlighting 8 large subunits (Blue) and 8 small
subunits (Red and Orange). Source: ars.usda.gov.
1.4. X-ray structures of Rubisco holoenzymes (Esquível et al., 2013). (a) Chlamydomonas
Rubisco side view. (b) Chlamydomonas Rubisco top view. The small-subunit residue that
defines the narrowest diameter of the central solvent channel is coloured red, and is where
the mutation has its effect (Chlamydomonas Ile-58).
2.1 – Representation of harvested lights 3 possible paths. The light energy absorbed by
chlorophylls associated with the PSII can be used to trigger photochemistry where an electron
(e−) is transferred from reaction centre chlorophyll, P680, to the primary quinone acceptor
of PSII, QA. Otherwise, absorbed light energy could be lost as chlorophyll fluorescence or
heat.
3.1 – Colour differences between S1-Wt and I58W3 C. reinhardtii cells grown in standard
(A and C) and under nitrogen deprivation (B and D) for 48h.
3.2 – Strain number of cells per mL in C. reinhardtii S1-Wt control and I58W3 strains
measured throughout 5 consecutive days. Values correspond to average ± standard error, n=3;
asterisks indicate significant differences (p≤0.05).
3.3 – Cell growth evolution over time of S1-Wt (upper half of the Petri dish) and I58W3
strains (lower half) under different trophic conditions.
3.4 – Total µg of protein per million cells at 48 and 96h in C. reinhardtii wild type (S1-Wt)
and I58W3 mutants grown under N-depletion and N-repletion. Values correspond to average
± standard error, n=3; asterisks indicate significant differences (p≤0.05).
3.5 – Rubisco large subunit band differences between S1-Wt and I58W3 C. reinhardtii cells
at 48 and 96 hours of culture growth. A – S1-Wt N100; B – I58W3 N100; C – S1-Wt N5; D
– I58W3 N5; E – Molecular weight protein ladder. Rubisco large subunit displays a molecular
weight of approximately 53 kDa.
3.6 – Relative TAG levels in C. reinhardtii measured by fluorescence intensity of Nile red
stained cells minus fluorescence intensity of chlorophyll (before adding the Nile red dye).
S1-Wt and I58W3 in normal TAP medium (100% N) and with deficient nitrogen regime (5%
N). The S1-Wt 100% N measurements were used as the baseline for comparison with other

VIII
cells cultures, and results were normalized per 106 cells. Values correspond to average ±
standard error, n=3; asterisks indicate significant differences (p≤0.05).
3.7 - Fatty acid composition of S1-Wt and I58W3 in N-replete and N deprived media at 48
h. Values correspond to average ± standard error, n=3; asterisks indicate significant
differences (p≤0.05).
3.8 – Total mg FA/g DW of S1-Wt control and I58W3 C. reinhardtii strains under N repletion
(N 100%) or depletion (N 5%). Measurements were made at 48h of culture growth. Values
correspond to average ± standard error, n=3; asterisks indicate significant differences
(p≤0.05).
3.9 – TAG percentage in control (S1-Wt) and mutant (I58W3) strains in N-replete (N100) or
deplete (N5) media. Measures were made with samples with 48h of cell growth and analysed
through thin layer chromatography followed by gas chromatography.
3.10 – Photosynthetic/respiratory ratio at 48h and 96h of C. reinhardtii control strain (S1-
Wt) and mutant strain (I58W3) in normal TAP medium (100% N) and with deficient nitrogen
regime (5% N). Values correspond to average ± standard error, n=3; asterisks indicate
significant differences (p≤0.05).
3.11 – Phenomenological energy fluxes in C. reinhardtii grown at 48 °C (upper graphic) and
96 h (lower graphic) under N-repletion or depletion. Absorbed energy flux per cross-section
(ABS/CS); Trapped energy flux per cross-section (TR/CS); Electron transport energy flux
per cross-section (ET/CS); dissipated energy flux per cross-section (DI/CS). Reaction
Centres per cross section (RC/CS).
3.12 – Fold change in gene expression calculated using Livak method. Actin was used as the
control housekeeping gene. Values correspond to average ± standard error, n=3; asterisks
indicate significant differences (p≤0.05). Fatty acid desaturase (CrDES and CrFAD6),
galactolipase (PGD1), diacylglycerol acyltransferase (DGAT1), hydrogenase (HydA1),
Rubisco small subunit (SSU) and cytb6f protein.
Table 1 – Dry weight (DW) and chlorophyll levels of C. reinhardtii cells, wild-type control
(Wt-S1) and I58W3 mutant strain grown in Tris-acetate phosphate (TAP) under nitrogen-
replete (100% N) or nitrogen-depleted (5%N) conditions, at 48 and 96 hours. Values
correspond to average ± standard error, n=3; asterisks indicate significant differences
(p≤0.05).
Table 2 - PAM-derived parameters obtained from C. reinhardtii grown at 48 h and 96 h under
N-repletion or depletion. Number of reduction turnovers (oxidation and re-reduction of QA)
(N); Efficiency with which an absorbed photon results in electron transport beyond QA-
(ΦEo); Efficiency or probability with which a PSII trapped electron is transferred from QA
to QB (ΨO); Density or amount or concentration of RCs per absorption energy flux
(RC/ABS); Absorbed energy flux per reaction centre (ABS/RC); Trapped energy flux per

IX
reaction centre (TRo/RC); Electron transport flux per RC (ETo/RC); Quantum yield of
energy dissipation as heat (ΦDo); Proportion of electron transport to energy dissipation as
heat (EtO/DiO). Values correspond to average, n=3; asterisks indicate significant differences
(p≤0.05).
Table 3 – Rapid Light Curve parameters in 48 and 96 h old samples of C. reinhardtii under
N deprivation and N repletion. Values correspond to average of n = 3 samples. Marked (*)
values indicate significant differences between mutant, S1 N5 and S1-Wt N100 control
strains (p ≤ 0.05). α (photosystem II efficiency), ETRmax (maximum relative electron
transport), β (photoinhibition parameter). Values correspond to average, n=3; asterisks
indicate significant differences (p≤0.05).

X
Abbreviation/Acronym list
ATP – Adenosine triphosphate
cytb6f – Cytochrome b6f complex
CCM – Carbon concentration mechanism
DAG – Diacylglycerol
FA – Fatty acid
FFA – Free fatty acids
GC – Gas chromatography
LSU – Rubisco Large subunit
MGDG - Monogalactosyldiacylglycerol
NADP - Nicotinamide adenine dinucleotide phosphate
OJIP – Chlorophyll fluorescence analysis test
PAM – Pulse amplitude modulation
PS – Photosystem
PVDF – Polyvinylidene difluoride
QA – Quinone A
QB – Quinone B
qPCR – Quantitative polymerase chain reaction
RC – Reaction Centre
RLC – Rapid Light Curve
RN – Red Nile
Rubisco – Ribulose -1,5- bisphosphate carboxylase/oxygenase
RuBP – Ribulose-1,5- bisphosphate carboxylase
SDS-PAGE - Sodium dodecyl sulphate polyacrylamide gel electrophoresis
SSU – Rubisco small subunit
TAG – Triacylglycerol
TAP – Tris-acetate-phosphate
TBS – Tris buffer saline
TLC – Thin layer chromatography
TTBS – Tween + TBS

1
1. Introduction
1.1. Chlamydomonas reinhardtii as a model organism
Chlamydomonas reinhardtii is a 10 µm diameter unicellular, soil-dwelling green alga (Fig. 1.1).
Its genome is fully sequenced and has a size of 121 Mb, corresponding to 17 chromosomes. It
has several mitochondria, two anterior flagella with motility and reproduction purposes and a
single chloroplast that holds the photosynthetic apparatus and critical metabolic pathways
(Merchant et al., 2007). Its wild type has a cell wall that contains hydroxyproline-rich
glycoproteins and is composed by 7 layers. Cell-wall deficient mutants were isolated and widely
used for genetic engineering. The single cup shaped chloroplast occupies a large part of the cell.
Inside the chloroplast is the photosynthetic apparatus, the eyespot which allows orientation
according to light sources, the pyrenoid which functions as a CO2 concentration mechanism
(CCM) and where the enzyme ribulose-1,5-bisphosphate carboxylase/oxygenase, Rubisco (EC:
4.1.1.39), is present in high concentrations. Inorganic carbon carriers responsible for seizing
carbon in the form of HCO3- and carbonic anhydrases are involved in this mechanism of micro
compartmentation, which converts the bicarbonate ion to CO2. Thus, there is a decrease in the
loss of carbon dioxide (its concentration is about 40x higher than the atmospheric
concentration), which is then fixed by Rubisco, initiating the Calvin cycle (Harris, 2001; Meyer
and Griffiths, 2013).
Figure 1.1. Chlamydomonas reinhardtii cell morphology (Dent et al., 2001).
N – nucleus; Nu – nucleolus;
M – mitochondria; C – chloroplast;
V – vacuole; T – thylakoid membranes;
S – starch grain; P – pyrenoid; St – stroma; ES – eye spot; F - flagella

2
The model algae C. reinhardtii is considered to be useful for photosynthesis and chloroplast
biogenesis studies as it is able to grow in several environmental conditions such as total light
absence or the presence of an organic carbon source, such as acetate, keeping its photosynthetic
device functional. In this situation, mutant strains of easy transformation whose photosynthetic
apparatus is compromised also show growth in heterotrophic and mixotrophic conditions. The
wild type strain is grown in liquid or solid medium at neutral pH, at an optimal temperature of
25 ᴼC. Both in mediums with acetate and in minimal mediums, the wild type grows better in
the presence of light, a doubling time of 6-8 h (Dent et al., 2001; Harris, 2001; Merchant et al.,
2007). C. reinhardtii is also used in the production of molecular hydrogen, a non-polluting
alternative energy source with a low production cost and without the need to use cultivated
land. This microalgae uses solar radiation to reduce free protons to H2 through a set of reactions
catalysed by two reduced ferredoxin-dependent hydrogenases. Biofuel production only occurs
under anaerobic conditions, as the transcription and activity of the hydrogenases is inhibited by
oxygen which is released during photosynthesis (Happe and Kaminski, 2002). On the other
hand, some strains of C. reinhardtii with certain mutations in the Rubisco enzyme have been
studied in this context, since their low photosynthetic rates increase H2 production (Rupprecht,
2009; Pinto et al., 2013;).
Another biotechnological application of this algae is bioremediation. C. reinhardtii can be used
in the treatment of wastewater rich in nutrients and heavy metals which are hazardous to human
health (Tsekova et al., 2010). Therefore this algae may be one of the solutions to solve this
problem because not only it consumes the existing nutrients and uses them to increase its
biomass but it also absorbs and accumulates heavy metals in its cell wall and vacuole (Hasan
et al., 2014; Zeraatkar et al., 2016)
In addition, this microalga is studied for its potential in the production of precursors of biodiesel
(triacylglycerol, TAG), which is a renewable and biodegradable fuel. In stress conditions the
metabolism of C. reinhardtii is affected and could induce accumulation of TAG, which are
formed by a glycerol molecule linked to three fatty acids (FAs). The response to N deficiency
changes the life cycle from vegetative to reproductive and steers C. reinhardtii metabolism
towards a path that stimulates a higher accumulation of storage compounds to prepare for
zygote formation (Johnson and Alric, 2013). N deprivation can also decrease the efficiency and
subsequent number of PSII complexes available during photosynthesis, as well as inducing the
expression of nitrogen uptake genes (Miller et al., 2010; Park et al., 2015) as well as lipid
metabolism genes (Boyle et al., 2012).

3
1.2. Photosynthesis and Rubisco
Photosynthesis is a unique process since it is through it that photosynthetic organisms
synthesize organic compounds from solar energy, and is modulated by several environmental
factors such as temperature, drought, CO2 concentration as well as quality and quantity of light
(Minagawa and Tokutsu, 2015). Photosynthesis is divided in two major stages. Photochemical
reactions, which depend directly on light, and chemical reactions that occur in the Calvin-
Benson cycle (fig. 1.2) (Taiz and Zeiger, 2014).
In the chemical phase, which occurs in the chloroplast stroma, the reactions through which
CO2 is fixed and the carbon is reduced in the Calvin-Benson cycle. In the first step, CO2 enters
the Calvin-Benson cycle by reacting with ribulose-1,5-bisphosphate, forming two molecules of
3-phosphoglycerate. The reaction is catalysed by the Rubisco enzyme (ribulose-1,5-
bisphosphate carboxylase/oxygenase.
Rubisco is one the core factors of CO2 entrance into the biosphere is the enzyme ribulose-1,5-
bisphosphate carboxylase/oxygenase (E.C. 4.1.1.39), Rubisco (Fig. 1.3). Its low affinity
towards atmospheric CO2 and the use of O2 as an alternate substrate for the competing process
of photorespiration make Rubisco an inefficient initial CO2 fixing enzyme of the photosynthetic
process. Subsequently, land plants must assign as much as 50% of their leaf nitrogen (N) to
Rubisco, making this specific enzyme one of, if not the most abundant enzymes in the world
(Ellis, 1979). In C. reinhardtii and many other species the CCM mechanism counters Rubisco
low atmospheric CO2 affinity and creates a higher concentration of CO2 around the enzyme
(Giordano et al., 2005; Jungnick et al., 2014).
Rubisco is one of the largest enzymes in nature, having a total molecular mass of 560 kDa. It
consists of 16 subunits, 8 large subunits (LSU, 55 kDa) and 8 small subunits (SSU, 15 kDa). In
plants and green algae, the large subunits of this enzyme are encoded in the rbcL gene from the
Figure 1.2. Light dependent and independent reactions in photosynthesis.
Source: adapaproject.org

4
chloroplast genome and the small subunits are encoded by a family of nuclear genes called
rbcS. After the translation process that occurs in the cytoplasm the polypeptides from the small
subunits are imported into the chloroplast, where they associate with large subunits through the
action of a chaperone and then form the Rubisco
holoenzyme (Spreitzer and Salvucci, 2002). After the
enzyme is formed the 8 large subunits are arranged in
dimers around a central channel with each dimer having two
active centres where the substrates are bound. The 8 small
subunits are arranged in two tetramers that bind to the large
subunits poles. Small subunits show greater divergence
between species than large subunits, especially in the loop
between β-A and β-B chains. This loop forms the entrance
of the Rubisco central channel and establishes contact
between the small and large subunits, influencing the
efficiency of the catalytic centre, CO2/O2 specificity and the
stability of the whole enzyme (Spreitzer and Salvucci 2002;
Esquível et al., 2006;).
Rubisco synthesis consumes a substantial portion of plant nutrient resources and its degradation
impacts the redistribution of nutrients within the organism, which means that Rubisco can have
a storage function under specific physiological conditions, such as sulphur (S) or N starvation
(Esquível et al., 2000), and these features allow for the acclimation of an organism to external
environmental conditions. Recently, since Rubisco has a predominant role in the photosynthetic
metabolism, Rubisco mutants have been studied with the aim of finding biotechnological
applications. For instance, the mutant Y67A in C. reinhardtii, where the tyrosine aminoacid
(Y) of position 67 of Rubisco small subunit was replaced by an alanine aminoacid (A), has the
ability to boost its H2 production because it presents a reduced photosynthetic rate due to the
lack of stability of the Rubisco enzyme induced by the targeted mutation (Pinto et al., 2013;)
(fig. 1.4). This mutant also produces high concentration of neutral lipids, making it a potentially
important strain for biodiesel production (Esquível et al., 2017).
Figure 1.3. Rubisco three dimensional
model highlighting 8 large subunits
(Blue) and 8 small subunits (Red and
Orange). Source: ars.usda.gov
Figure 1.4. X-ray structures of Rubisco
holoenzymes (Esquível et al., 2013). (a)
Chlamydomonas Rubisco side view. (b)
Chlamydomonas Rubisco top view. The
small-subunit residue that defines the
narrowest diameter of the central solvent
channel is coloured red, and is where the
mutation has its effect (Chlamydomonas Ile-
58).

5
1.3. Lipids Metabolism in C. reinhardtii
Nutrient limitation is an essential trigger for triacylglycerol TAG accumulation in algae, and N
deprivation is considered to be one of the best (Rodolfi et al., 2009; Schmollinger et al., 2014).
When N deprivation is carried out on a culture, photosynthetic rates are negatively affected and
carbon fixation is diverted from protein synthesis to carbohydrate or lipid synthesis, and it is
believed that increases in lipid content during N deprivation are mainly obtained at the expense
of other components, particularly starch (Rodolfi et al., 2009). While carbohydrates can reach
above 70% of the dry biomass with no reduction in productivity, lipid accumulation is often
associated to a reduction in biomass productivity. However, there are also suspicions that
cellular lipid accumulation during N deprivation may derive from newly fixed carbon in certain
green microalgae. The ability for de novo lipid synthesis seems a characteristic of some
oleaginous microalgae, which, when grown under N deprivation channel the excess of carbon
and energy into storage lipid (mainly TAG). This can due to the fact that TAG do not contain
N atoms and their accumulation diverts carbon toward storage in situations where carbon cannot
be used for cell growth and division. C. reinhardtii has been as a reference organism for
understanding TAG biosynthesis under N deprivation (Fernandez and Galvan, 2008; Wang et
al., 2009; Miller et al., 2010; Boyle et al., 2012; Blaby et al., 2013) . Nevertheless, the signalling
pathways that affect these metabolic changes are not yet understood and therefore cannot be
manipulated in order to control carbon movement toward TAG for the biodiesel industry. C.
reinhardtii can utilize a number of different N sources, both inorganic, such as nitrate, nitrite,
and ammonium, and organic, such as urea and amino acids, although ammonium is preferred
(Florencio and Vega, 1983). N deprivation has been commonly used as a standard condition to
increase neutral lipid accumulation in several microalgal species (Thompson, 1996; Merzlyak
et al., 2007; Hu et al., 2008; Philipps et al., 2011). Upon certain environmental stresses,
particularly nutrient shortage, various algae including C. reinhardtii accumulate energy-rich
storage compounds such as starch and TAG (Guschina and Harwood, 2006; Hu et al., 2008;
Rodolfi et al., 2009; Wang et al., 2009; Siaut et al., 2011). Increases in lipid content of up to
70% of the dry biomass have been reported in several species in response to limiting N supply
in batch cultures, with TAG mainly containing saturated and monounsaturated fatty acids,
which form the majority of the lipid fraction in the starved cells (Borowitzka and Borowitzka,
1988; Roessler, 1990). Esquível et al. (2017) show that C. reinhardtii Rubisco small subunit
mutants display an increase in neutral lipids, such as TAG, over polar lipids. However, some
inconsistencies are found in the response to N deprivation. Diatoms, which usually have a
relatively high exponential-phase lipid content, do not respond to N deprivation by increasing
their lipid content (Shifrin and Chisholm, 1981). Green microalgae have been reported to show
a range of responses, from several fold increases from exponential-phase values in C.
pyrenoidosa, to no changes or even a slight reduction in some Dunaliella spp. and in
Tetraselmis suecica (Borowitzka and Borowitzka, 1988). The response to N deprivation in C.
reinhardtii however seems to be consistent in that this species is able to accumulate significant
amounts of TAG under N deprivation (Wang et al., 2009; Siaut et al., 2011). As part of their
lipid composition, C. reinhardtii are also characterized by the presence of ω-3 fatty acids.

6
1.4. Objectives
In this study we have performed a phenotypic characterization of the I58W3 C. reinhardtii
mutant that has three tryptophan (Trp) residues, which replace an isoleucine amino acid in
position 58 of Rubisco small subunit amino acid chain, close to the entrance of the central
channel of the Rubisco enzyme (Taylor et al., 2001). It was found that this mutation caused a
deficient CO2 assimilation due to a great decrease in the carboxylation rate of Rubisco compared
with the control strain (Esquível et al, 2013). It seems worth to investigate if this “critical”
mutation could have effects reaching the photochemical reactions of photosynthesis, respiration
rates and the carbon routes for lipid accumulation. Since C. reinhardtii is able to accumulate
significant amounts of storage lipids particularly under N deprivation, comparative analyses
were undertaken with mutated cells grown in mixotrophic conditions in TAP – Tris, acetate
phosphate medium and in N-deficient conditions in order to assess the effects of the I58W3
mutation alongside the environmental N deficiency in lipid metabolism, photosynthesis, protein
and chlorophyll production, cell growth and biomass levels. Genetic analyses were performed
to understand the role of specific genes tied to the cells metabolism. Target genes consisted of
a housekeeping gene (Actin), hydrogenase, Rubisco small subunit, DGAT1 which is involved
in de novo synthesis of TAG (Chen and Smith, 2012), cytb6f, a protein complex involved in
photosynthesis, CrDES and CrFAD6, fatty acid desaturases important in TAG synthesis (Sato
et al., 1997; Kajikawa et al., 2006; Li-Beisson et al., 2015) and PGD1, a galactolipase (X. Li
et al., 2012).
7
2. Materials and methods
2.1. Cell strains and cell culture growth
Two wall-less C. reinhardtii lines, kindly provided by Dr. Robert Spreitzer, USA, were used.
The parental line served as the control strain (S1-Wt) and the genetically altered line had a
targeted mutation, where 3 tryptophan aminoacids replaced an isoleucine aminoacid in position
58 of Rubisco small subunit (I58W3). Cell stocks were maintained in solid Tris-Acetate-
Phosphate (TAP) media containing agar and transferred periodically to new TAP media to
guarantee their viability.
Both cell lines were grown simultaneously and were kept in 250 mL Erlenmeyer flasks in
constant lighting (35 µmol.m2.s-1) and agitation (120 rpm, Agitorb 200 IC) to guarantee oxygen
circulation and nutrient homogeneity. Five days after inoculation N-deprivation was imposed
(N 5%) (supplement 1) (Philipps et al., 2011) to S1-Wt and I58W3 strains. Each 1 L flask
contained 255 mL of media and 45 mL of the inoculated cell culture. This transfer was done by
centrifuging 45 mL of the inoculation culture (5 minutes at 500 g, Allegra 25R Centrifuge,
Beckman Coulter) then adding 60 mL of the corresponding media to the pellet, homogenising
it and adding it to the assigned Erlenmeyer flask.
2.2. Dry weight and cell counting
Spot tests were performed to characterize the growth of both strains in mixotrophic,
heterotrophic and autotrophic conditions. Equal number of cells were plated on TAP medium
in the light (under the intensity of 35 µmol.m2.s-1), in the dark and on minimal medium in the
light. The cultures were maintained at 25ºC.
Dry weight was determined using 45 mL of cell cultures after centrifugation for 5 minutes at
500 g, removal of the cell culture and incubation at 80º C for a week in pre-weighted falcon
tubes. Cell counts were made daily during five days after the transfer to new media, in a
Neubauer chamber using a Leitz Dialux 22 microscope at 100x magnification, using 20 µL of
cell culture.
2.3. Pigments analyses, extraction and quantification
Chlorophyll contents were determined using 1 mL of cell culture. After centrifugation for 5
minutes at 7500 g in the Mini Spin Plus (Sigma) cells were resuspended in 1 mL of 100% (v /
v) methanol and stored for one day at 4 ºC in the dark. The absorbances at 652.4 and 665.2 were
read in a Shimadzu UV-2100 spectrophotometer. Chlorophyll a and b contents were calculated
according to Lichtenthaler (1987) (supplement 2).
2.4. Protein extraction and quantification
To measure protein content 2 mL samples were taken from each of the liquid cultures to
eppendorf tubes. Samples were centrifuged for 4 minutes at 7500 g in the Mini spin Plus
(Sigma) centrifuge to concentrate the cells and remove the culture medium. Cells were

8
resuspended in 150 µL of sample buffer (taken from a 60 µL β-mercaptoethanol + 940 µL
Laemmli sample buffer solution). Samples were then heated to 98º C for 3 minutes and stored
at -20º C. Dilutions of bovine serum albumin were used to prepare a series of protein standards.
Protein measurements were made by following Lowry analysis using Folin phenol reagent
using a modified method (Bensadoun and Weinstein, 1976).
2.5. Oxygen electrode measurements
The oxygen electrode (Clark-type electrode) is formed by 2 electrodes immersed in an
electrolyte solution. Both oxygen electrode discs have a platinum cathode and a silver anode.
(fig. 2.1). The electrodes are protected by a thin Teflon membrane which is permeable to
oxygen. When a voltage of 700 mV is applied oxygen is reduced at the platinum surface,
initially to hydrogen peroxide (H2O2) and electrons are donated to oxygen which acts as an
electron acceptor (Walker, 1987).
2 mL samples of each culture were used to determine the oxygen production and consumption
rates. Samples were placed in the electrode chamber (Hansatech Instruments, Oxytherm) after
its calibration and were maintained in constant agitation. The measurements were made in two
phases, with the cells exposed to light, produced by a projector lamp with an intensity of 100
μmol m−2 s−1 and without being exposed (dark phase), as to mimic photosynthetic and
respiratory conditions, respectively. Each measurement lasted around 20 minutes, each with
light and dark cycles of 5 minutes. Net photosynthesis and respiration rates were then estimated
from the maximum slopes of the curves.
2.6. Pulse amplitude modulated (PAM) fluorometry
PAM fluorometry functions on a basic signal modulation in which light is delivered in a series
of signal pulses. This method can be used in photobiology and can obtain spectrofluoromic
measurements of the kinetics of fluorescence by measuring the increases and decay of the light
harvesting antennae of the thylakoid membranes (Maxwell and Johnson 2000). PAM
fluorometry provides a fast assessment of the overall photosynthetic state through comparison
of photosynthetic rates based on fluorescence. Specifically, the measurement of fluorescence is
often used as an indicator of the early effects of stress on autotroph photosystems caused by
varying environmental conditions.
Chlorophyll transient light curves were assessed by the OJIP test. The OJIP test is based on the
theory of energy flow in thylakoid membranes, therefore facilitating a better understanding of
relationships between the biophysical side of photosynthesis and the fluorescence signals
(Chernev et al., 2006). This test test also provides insight on the probability of the fate of
absorbed light energy as well as detailed information on photosynthetic apparatus structure and
function (Kalaji et al., 2011). The O level represents all the open reaction centres (RC) at the
onset of illumination with no reduction of quinone a (QA) (the fluorescence intensity lasts for
10 ms). The rise of transient fluorescence from O to J shows net photochemical reduction of
QA, which is the stable primary electron acceptor of PSII, to QA- (that lasts for 2 ms). Then, the
phase from J to I was due to reduced states of closed reaction centres (RC) such as QA- QB-, QA
QB2- and QA- QB H2 (lasts for 2-30 ms). The P level (300 ms) coincides with maximum
9
concentration of QA- QB2 with plastoquinol pool maximally reduced. This P reflects an
equilibrium between light incident at the PSII side and the rate of utilization of the chemical
(potential) energy and the rate of heat dissipation (Zhu et al. 2005). Rapid Light Curves (RLC)
were achieved using the pre-programmed light curve (LC1) protocol which performs successive
measurements of the sample photosystem II efficiency (ɸPSII) under various light intensities
(20, 50, 100, 200, 300 and 500 µmol photons m-2 s-1) of continuous illumination relating the
rate of photosynthesis to photon flux density (PAR). A list of parameters evaluated by PAM
fluorometry is available in supplement 3.
PAM chlorophyll fluorescence measurements were performed using a FluoroPen FP100 (Photo
System Instruments, Czech Republic) on samples using a 1 mL cuvette. All fluorometric
analysis were carried out at the end of the experimental period in dark-adapted samples.
2.7. Nile Red fluorescence
Spectrofluorometric analyses were performed with Red Nile (a dark-purplish-red dye) for lipids
semi-quantitative measurements in cell cultures. 1 mL samples of each culture were taken and
their fluorescence was read in a Bio-Tek Synergy HT spectrophotometer, in two different ways:
with and without Red Nile dye dissolved in methanol (1 µg/mL). Samples were excited at a
wavelength of 460 nm and emission spectra acquired over the range of 645 nm. Relative TAG
content was calculated by subtracting the fluorescence without the dye (chlorophyll
fluorescence intensity) to the fluorescence levels with the dye, where Red Nile highlights TAG
fluorescence (Alemán-Nava et al,. 2016).
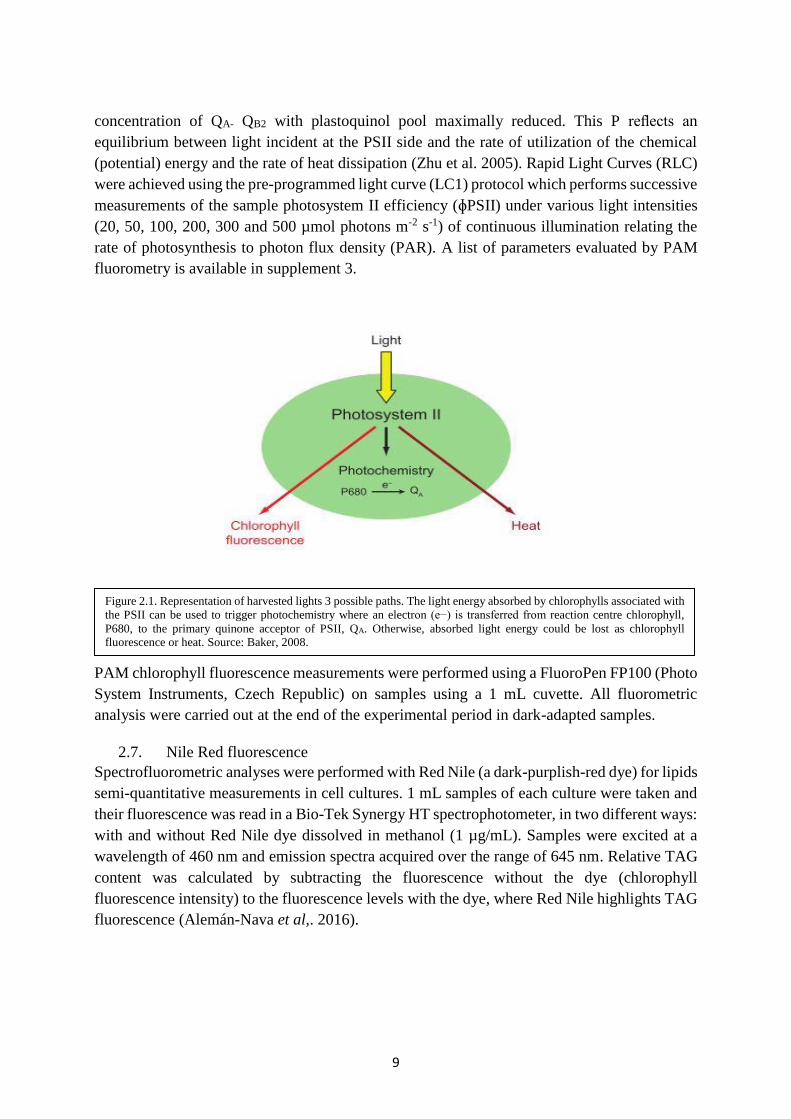
Figure 2.1. Representation of harvested lights 3 possible paths. The light energy absorbed by chlorophylls associated with
the PSII can be used to trigger photochemistry where an electron (e−) is transferred from reaction centre chlorophyll,
P680, to the primary quinone acceptor of PSII, QA. Otherwise, absorbed light energy could be lost as chlorophyll fluorescence or heat. Source: Baker, 2008.

10
2.8. Lipid extraction, methylation and gas chromatography (GC) analysis
Lipid extraction was made according to Bligh and Dyer (1959), where lipids were extracted in
the chlorophorm phase while other cell components remain in the interface or in the aqueous
phase. Lipases were inactivated at 100 ºC for 3 minutes and the lipid extracts are stored under
N atmosphere, preventing lipid degradation by oxygen.
Cell pellets corresponding to 45 mL cultures were suspended in 1 mL of boiling water and
incubated at 100 ºC for 3 minutes. The suspension was then transferred to a mortar where it was
homogenised and transferred to a glass tube. The mortar was successively washed with 7 mL
of methanol, chlorophorm and 6 mL of water, which were added to the same glass tube. After
vortexing, the extract was centrifuged for 5 minutes at 4000 g. The organic (lower) phase was
recovered with a Pasteur pipette to another tube and was evaporated at 37º C under N
atmosphere. The lipid residue was resuspended with 100 µL of ethanol-toluene solution (1/4
v/v), or 1 mL for thin layer chromatography, and preserved under N atmosphere at -20º C.
In order to obtain methyl esters, lipid saponification (fatty acid cleavage) and methylation are
simultaneously performed by using methanol and sulphuric acid. The fatty acid methyl esters
(FAME) can then be used in gas chromatography (GC) analyses. In this procedure 20 µg of
margaric acid (heptadecanoic acid, or C:17, internal standard) were added 100 µL of total lipids
and the solvents evaporated under N2 atmosphere. Three mL methanol sulphuric acid (2.4%
H2SO4 in methanol (v/v)) were added for 1 hour at 70º C. After cooling, the resulting methyl
esters are recovered by adding 3 mL of petroleum ether and 2 mL of water, followed by
vortexing and centrifuging (5 minutes at 4000 g). The upper phased was transferred to another
tube and evaporated at 37 ºC under N atmosphere.
The FAME were then suspended in 50 µL of hexane to allow GC analysis (430 Gas
Chromatograph, Varian). The chromatograph was equipped with a hydrogen flame ionization
detector set at 300 °C. The temperature of the injector was set to 270 °C, with a split ratio of
50. The fused-silica capillary column (50 m x 0.25 mm; WCOT Fused Silica, CP-Sil 88 for
FAME; Varian) was maintained at a constant nitrogen flow of 2.0 mL/min and the oven
temperature set at 190 °C. Fatty acid separation was made for 7 minutes. Fatty acid
quantification was assessed through their peak area by comparing it with C17 area. Data
analysis was done through the Galaxie software.
2.9. Thin layer chromatography (TLC)
Different lipid classes are separated by TLC, allowing the separation between polar lipids,
including galactolipids and phospholipids, and neutral lipids including free fatty acids (FFA)
diacylglycerol (DAG) and TAG. Samples were applied at the base of a silica gel plate (G 60,
Merck) and separated using a solvent system developed by Mangold (Wagener 1965).
Arabidopsis thaliana leaf lipids were used as standards for comparison with C. reinhardtii
lipids. After the solvent evaporation the plate was sprayed with primuline (0.1% in acetone
80%) and observed under UV light. Each lipids classes were then scraped into tubes containing
the internal standard and methylated as above described (2.7) before GC analysis.

11
2.10. Protein electrophoresis
One dimensional gel electrophoresis is a technique that offers information about proteins
molecular size, quantity and overall purity. It is also usually the first step in immunoblotting
and immunodetection (Gallagher, 2012).
Sodium dodecyl sulphate polyacrylamide gel electrophoresis (SDS-PAGE) is currently the
most used electrophoresis technique. At the pH at which gel electrophoresis is carried out the
SDS molecules are negatively charged and bind to proteins in a fixed ratio, approximately one
molecule of SDS for every 2 amino acids (Bhuyan 2010; Ninfa et al., 2010). This way, when a
current is applied to the gel, proteins migrate to the positive charge electrode. Due to gel matrix
properties proteins with a lower mass migrate faster than higher mass proteins (Hames, 1998).
Sample preparation - 2 mL samples were collected from the liquid cultures. The cells were
sedimented by centrifugation (7500 g for 4 minutes) with Mini spin Plus (Sigma) centrifuge
and resuspended in 125 mM Tris HCl (pH 6.8) with 4% (w/v) SDS, 20% (v/v) glycerol, 10%
(v/v) 2-mercaptoethanol, 0.004% (w/v) bromophenol blue (Laemmli solution). Samples were
then heated to 98º C for 4 minutes to promote cell lysis and protein denaturation. The samples
were stored at -20º C. Discontinuous SDS-PAGE (10% polyacrylamide in the resolving gel and
5% in the stacking gel) were prepared using Bio-Rad Mini-PROTEAN Tetra cell cassettes.
Samples were loaded into the wells and the gel was run at a constant 200 V for 1 hour. Protein
bands were stained with 0.1% (w/v) Coomasie Brilliant Blue R-250 in 20% methanol and 5%
acetic acid.
2.11. Immunoblotting
Immunoblotting, or western blotting, is an assay used for the detection and characterization of
proteins by taking advantage of the inherent specificity in antigen-antibody recognition, since
it involves electrophoretic separation of lipopolysaccharides, proteins or glycoproteins by gel
electrophoresis, which is followed by transfer and binding to nitrocellulose, polyvinylidene
difluoride (PVDF), or nylon.(S. Gallagher and Chakavarti, 2008; Mahmood and Yang, 2012).
After protein electrophoresis the gel’s contents were transferred to a PVDF membrane by using
transfer buffer (25 mM Trizma base, pH 8.3, 192 mM Glycine, 20% methanol (v/v)) The
transfer was performed overnight at a constant 20 V.
Ponceau dye was used to check if the transfer had been successful. The membrane was
developed using the buffer Tris-saline/Tween 20% TTBS (100 mM Trizma base, 0,9% (w/v)
NaCl, 0.1% (v/v) Tween 20 pH 7.5), a primary rabbit antibody raised against LSU-Rubisco
(1:1000 dilution) and a secondary goat anti-rabbit IgG antibody coupled to horseradish
peroxidase (Bio-Rad catalogue no. 170-6515) in a 1:2000 dilution. The revealing solution 4-
chloro-1-naphtol in 5 mL methanol. Gel-Doc Quantity One from Bio-Rad was used for image
analysis.

12
2.12. Gene expression analysis by qPCR
Gene expression was studied in cells collected 48 h after the beginning of the N limitation
treatment. Cells were collected by centrifugation (5 minutes at 500 g), immediately frozen in
liquid N2 and stored at -80 ºC. RNA extraction was then done with the RNeasy Mini kit
(Qiagen) according to the manufacturer instructions, with freeze and thaw cycles of samples in
the initial phase of the protocol. RNA concentration and purity was assessed using a Thermo
Fisher Scientific NanoDrop 1000, where a ratio of 2 is usually considered pure for RNA
(Matlock, 2012). RNA purity of gathered samples were reported between 2.10 and 2.15. RNA
integrity was checked by agarose gel electrophoresis (1% agarose in tris acetate EDTA (TAE)
buffer) using a Bio-Rad Mini-Sub Cell GT cell and PowerPac Basic power supply. After
migration results were observed under UV light in a Bio-Rad Molecular Imager Gel Doc XR
Imaging System.
cDNA was synthesized using Nzytech NZY M-MuLV First-Strand cDNA Synthesis Kit. qPCR
protocol was then applied, using a Bio-Rad iTaq Universal SYBR Green Supermix, in order to
assess gene expression of several target genes and compare their expression between the
samples. qPCR consisted in an initial 3 minute heating phase of 95º C, 40 cycles of denaturation
and annealing/extension (10 seconds at 95º C and 30 seconds at 60º C) and a melting curve
phase of 0-5 ºC increases from 55 to 95 ºC (in a Bio-Rad MiniOpticon Real-Time PCR System).
Primers used are shown in supplement 4. Fold change in gene expression between samples was
calculated by the Livak method (Livak and Schmittgen, 2001).
2.13. Statistical analysis
Taking into account the objectives of the study, we considered the application of the Paired
samples t-Test. Due to the small number of replicates per test (n = 3), which prevented the
normality in all samples, t-test was then replaced by a non-parametric test, the Wilcoxon
Signed-Ranks test. Using this we then proposed the following hypothesis:
H0: There are no differences between the median of the samples
H1: There are differences between the median of the samples
Statistical analysis was then performed using the Statistical Package for the Social Sciences
(SPSS). Significant differences take into account a p-value ≤ 0.05.

13
3. Results/Discussion
3.1. Changes in cell metabolism
In order to clarify the effect of the closure of the Rubisco central channel on cell growth, the
mutant I58W3 were grown in different N concentrations and the growth compared with the
control (S1-Wt). Colour differences between cultures are shown in fig. 3.1.
Cells were grown in N-depleted and N-replete liquid media. Table 1 shows the culture dry
weight (DW) and the chlorophyll levels (chlorophyll a, b and total chlorophyll) at 48 and 96 h
of culture growth. 5% N negatively affects growth. Comparing both strains at 48 h it is possible
to see that the control strain has more biomass than the mutant strain, whether in N-deplete or
N-replete media, showing that the mutated enzyme had an effect on growth. A lower biomass
productivity in algal strains used for the purpose of lipid accumulation has been previously
reported (Hu et al., 2008; Rodolfi et al., 2009; Li et al., 2010; El-Kassas, 2013). The mutant
strain (I58W3) is much less affected by the N deprivation than S1-Wt. This could be explained
by the fact that these cells grew more slowly than control cells and subsequently reach the
stationary phase later. At 48 h all cultures DW were significantly different than S1-Wt N100.
At 96 h only I58W3 N5 has a significant difference in DW. The same trend observed in dry
biomass assays can be seen in cell number per mL of culture, where the S1-Wt strain always
have more cells than the I58W3 strain (fig 3.2). A decrease in biomass, due to growth inhibition,
in fast-growing photosynthetic organisms could be linked to a decrease in chlorophyll levels,
alongside other proteins (Kraft et al., 2008; Acquisti et al., 2009; Langner et al., 2009; Huo et
al., 2011). In fact, I58W3 mutant had a lower chlorophyll a and b content per mL of culture
when compared to S1-Wt strain at 48 and 96h. However when comparing total chlorophyll
levels when cell number is equal between strains the same trend is obtained, which indicates
that I58W3 cells do not produce as much chlorophyll as S1-Wt, or that the chlorophylls degrade
faster. N deprivation seems to affect chlorophyll levels as described previously (Juergens et al.,
2015), and consequently presented yellow colour as opposed to green cultures in N replete
media.
Figure 3.1. Colour differences between S1-Wt and I58W3 C. reinhardtii cells grown in standard (A and C) and under nitrogen deprivation (B and D) for 48h.
A B C D

14
48 H 96 H
S1-Wt I58W3 S1-Wt I58W3
100% N 5% N 100% N 5% N 100% N 5% N 100% N 5% N
DW (mg
mL−1)
0.56±0.36
0.37±0.14*
0.31±0.15*
0.30±0.23*
0.32±0.08
0.32±0.13
0.39±0.21
0.30±0.08*
Chlorophyll
a (μg mL−1)
4.51±1.36
3.83±1.54
3.01±1.33
2.58±0.73
5.13±0.79
1.66±0.21
3.32±0.50
1.43±0.61
Chlorophyll
b (μg mL−1)
7.46±3.16
7.04±2.83
4.86±2.32
3.96±1.13
10.41±4.64
3.96±1.55
7.70±3.32
2.54±0.48
Total
chlorophyll
(μg
10⁶cell−1)
6.53
4.11*
6.91*
4.61*
6.78
1.76*
5.76*
1.99*
Table 1. Dry weight (DW) and chlorophyll levels of C. reinhardtii cells, wild-type control (Wt-S1) and I58W3 mutant
strain grown in Tris-acetate phosphate (TAP) under nitrogen-replete (100% N) or nitrogen-depleted (5%N) conditions, at
48 and 96 hours. Values correspond to average of n = 3 samples. Values correspond to average ± standard error, n=3;
asterisks indicate significant differences (p≤0.05).
Figure 3.2. Strain number of cells per mL in C. reinhardtii S1-Wt control and I58W3 strains measured throughout 5
consecutive days. Values correspond to average ± standard error, n=3; asterisks indicate significant differences (p≤0.05).
0,00E+00
5,00E+05
1,00E+06
1,50E+06
2,00E+06
2,50E+06
3,00E+06
24h 48h 72h 96h
Cel
ls/m
L
Culture Growth Period
S1 N100 I58 N100
*
*

15
Fig. 3.3 shows culture growth of S1-Wt and I58W3 cells in mixotrophic (under the presence of
light and acetate), autotrophic (without acetate but in the presence of light) and heterotrophic
(without the presence of light but with acetate) conditions. Mutant I58W3 displayed only a
small decrease in growth compared with the wild type under mixotrophic conditions, however
it could hardly grow at autotrophic conditions. Under heterotrophic conditions growth of the
mutants was indistinguishable from wild-type growth, indicating that the decreased growth of
the mutant under autotrophic conditions was caused by a defect in photosynthesis.
Protein levels seem to be higher in I58W3 than in S1-Wt for the same number of cells at 48 h
of growth. At 96 h of N depletion both S1-Wt and I58W3 strains show significantly less protein
content (fig. 3.4). A lower amount of proteins under N-depletion has been previously reported
in other microalgae such as the diatom Phaeodactylum tricornutum (Burcu Ak et al., 2015) and
in the green alga Picochlorum sp. (El-Kassas, 2013). In C. reinhardtii, a decrease in protein
levels under S deprivation in rubisco mutants has been reported (Pinto et al., 2013), and our N
deprivation results appear to suggest the same for I58W3 mutants.
Time (h) 0 168 240 288
Mixotroph
Autotroph
Heterotroph
Figure 3.3. Cell growth evolution over time of S1-Wt (upper half of the Petri dish) and I58W3 strains (lower half) under different trophic conditions.

16
Since N is a key element to protein synthesis the decrease in proteins at 96 h was expected, as
a prolonged exposure to an N replete media implies a quicker consumption of available N.
When this exogenous N is depleted, and in order for protein synthesis to continue, autophagic
processes may occur in order to make endogenous N available as a way of de novo synthesis so
that cells can be able to adapt, such as the Chlamydomonas sp. differentiation into sexual
gametes which grants it the ability to survive prolonged nutrient stress (Martin and
Goodenough, 1975; Wang et al., 2009; Msanne et al., 2012).
3.2. Rubisco large subunit protein level decreases in I58W3 C. reinhardtii
In order to assess and compare Rubisco levels in both strains under stress or in N replete media,
western blot analyses were performed. I58W3 strain always presents less amounts of Rubisco
large subunit than the control (fig.3.5). It is known that this mutation causes Rubisco to have a
lower CO2 / O2 specificity possibly due the closure of the central channel (Esquivel et al., 2013).
Rubisco synthesis involves the consumption of N (Evans and Seemann, 1989). It is possible
that due to a decrease in N availability these cells cannot compensate the lack of this nutrient
and therefore, alongside the mutation, I58W3 shows less Rubisco content than S1-Wt. Previous
studies using a different small subunit Rubisco mutant (Y67A) also show a decrease in Rubisco
content (Esquível et al., 2006; Esquível et al., 2017).
Figure 3.4. Total µg of protein per million cells at 48 and 96h in C. reinhardtii wild type (S1-Wt) and I58W3 mutants
grown under N-depletion and N-repletion. Values correspond to average ± standard error, n=3; asterisks indicate significant differences (p≤0.05).
0
0,2
0,4
0,6
0,8
1
1,2
1,4
1,6
1,8
48h 96h
μg
pro
tein
/10
⁶ ce
lls
S1-wt N100 S1-wt N5 I58W3 N100 I58W3 N5
* *

17
Western blot method using an initial specific anti-Rubisco antibody proved to be successful as
individual bands with Rubisco large subunit molecular mass (66 kDa) were visible for all
samples. Previous work with another Rubisco mutant, Y67A, grown under nutrient stress has
also shown a decrease in Rubisco content, which could indicate that I58W3 could have a less
stable enzyme structure, such as Y67A (Esquível et al., 2006; Pinto et al., 2013). These results
also seem to indicate that the I58W3 mutation in Rubisco small subunit also seems to affect the
large subunit
Figure 3.5. Rubisco large subunit band differences between S1-Wt and I58W3 C. reinhardtii cells at 48 and 96 hours of
culture growth. A – S1-Wt N100; B – I58W3 N100; C – S1-Wt N5; D – I58W3 N5; E – Molecular weight protein ladder.
Rubisco large subunit displays a molecular weight of approximately 53 kDa.
A A B C D B C D E

18
3.3. Lipid and fatty acid quantifications
Comparison of the storage contents between different growth conditions or different cell lines
can be obtained by Red Nile (RN) staining (Alemán-Nava et al., 2016). RN binds intracellular
neutral lipid droplets (Cooksey et al., 1987; Alemán-Nava et al., 2016). By measuring the
fluorescence of the dyed sample the value obtained is equivalent to two simultaneous reads,
chlorophyll and neutral lipid fluorescence. Using S1-Wt with N-repletion (fig. 3.6) as the
baseline for comparison, it is shown that TAG content is lower in S1-Wt N-deprived cells but
higher in both N replete medium. It is known that under N deprivation C. reinhardtii tend to
accumulate TAG (Siaut et al., 2011; Msanne et al., 2012; Yang et al., 2015) which is the case
in I58W3 cells, where at 48 and 96 h of the assay seem to have more lipids than control cells.
Although the NR test provides an indication of possible differences in storage lipid contents
between samples, thin layer and gas chromatography analyses were performed to obtain the
exact amount of fatty acids in the cells and the relative contribution of the storage and
membrane lipids.
Figure 3.6. Relative TAG levels in C. reinhardtii measured by fluorescence intensity of Nile red stained cells minus
fluorescence intensity of chlorophyll (before adding the Nile red dye). S1-Wt and I58W3 in normal TAP medium (100%
N) and with deficient nitrogen regime (5% N). The S1-Wt 100% N measurements were used as the baseline for comparison
with other cells cultures, and results were normalized per 106 cells. Values correspond to average ± standard error, n=3;
asterisks indicate significant differences (p≤0.05).
0
20
40
60
80
100
120
140
160
180
200
48h 96h
Rel
ativ
e TA
G %
/10
6ce
lls
S1-Wt 100 S1-Wt N5 I58W3 N100 I58W3 N5
* *
*
*

19
Following lipid extraction and direct methylation, which allows a quick method to assess total
lipid content from several samples, gas chromatography was conducted in order to assess fatty
acid composition of control and mutant strains (fig. 3.7). Measures taken from samples at 48 h
of culture growth show the highest concentrations to be palmitic acid (C16:0), linoleic acid
(C18:2) hexadecatrienoic acid (C16:3) and C18:1Δ12 (quantified together due to incomplete
separation of the peaks). It has been previously shown that more than 50% of these fatty acids
are stored in the TAG, which are a vital element in biodiesel production (Siaut et al., 2011;
Shen et al., 2016) Along with C16:3 there are other ω-3 fatty acids which are a part of C.
reinhardtii composition., such as α-Linolenic acid (C18:3Δ9,12,15), pinolenic acid
(C18:3Δ5,9,12) and stearidonic acid (C18:4) which establish this species as an ω-3 source.
When comparing both strains the main differences are found on some of these ω-3 fatty acids,
mainly C18:3Δ9,12,15 and C18:3Δ5,9,12. Kajikawa et al. (2006) have previously reported that
ω-13 fatty acid desaturase (FAD) was responsible for the turnover of C18:3Δ9,12,15 into
C18:3Δ5,9,12, so a genetic analysis of the gene that expresses that enzyme was performed (3.7
qPCR analysis). Cultures grown under N-repletion show a higher percentage of C16:0 than
cells grown under N depletion. Oleic acid (C18:1Δ9) has a higher percentage in N deprived
cells, and stearic acid (C18:0) percentages are lower under N stress. N-replete cultures mainly
show higher percentages of C16:3 and C18:1Δ12 whereas other fatty acids are evenly present
in both stress and normal conditions. Total FA composition per g of DW (fig. 3.8) also shows
that under N deprivation both strains have a higher FA composition, which indicates that the
lack of N can have a role in FA synthesis in C. reinhardtii. Fatty acid accumulation under N
deprivation has been vastly studied in several species including the diatom Phaeodactylum
tricornutum (Shen et al., 2016) and in C. reinhardtii itself, where it has been found that
saturated FAs are present in a higher concentration in cells grown under N deprivation (Sakurai
et al., 2014).
Figure 3.7. Fatty acid composition of S1-Wt and I58W3 in N-replete and N deprived media at 48 h. Values correspond to
average ± standard error, n=3; asterisks indicate significant differences (p≤0.05).
0,00
5,00
10,00
15,00
20,00
25,00
30,00
35,00
40,00
45,00
50,00
Fatt
y ac
id %
S1-Wt N100 S1-Wt N5 I58W3 N100 I58W3 N10
* *
*
* *

20
TLC allowed the separation of 5 lipid classes, including a mixture of polar lipids (including
membrane glycol-and phospholipids) diacylglycerol, free fatty acids, TAG, and an unidentified
lipid class X. GC analysis of the fatty acid composition of each class and subsequent class
percentage in each strain showed that, although fatty acid composition was not very diverse
(data not shown), the TAG percentage was much higher in both the control and mutant strains
under N stress, which means that the lack of nitrogen plays a role in TAG accumulation (fig.
3.9). These results are in line with previous conclusions, such as that the major effects of N
deprivation in green algae cultures can include an improved biosynthesis and accumulation of
lipids, specifically TAG. The amount of lipids in chlorophyta could be raised up to 45% of dry
weight by stress induction (Converti et al., 2009). In another study on nitrogen stress responses
of different microalgae species, all tested species showed a significant rise in lipid production.
The researchers concluded that the increase of lipid concentration in stress exposed refers
mainly to neutral lipids, TAG in particular. The observed phenomenon is a result of lipid
metabolism shift from membrane lipid synthesis to neutral lipid storage due to environmental
stress induction (Hu et al., 2008; El-Kassas, 2013; Esquível et al., 2017). A way to improve
TAG biosynthesis has been proposed. By engineering a synthetic pathway that ties N
deprivation and starch synthesis it can be possible to increase TAG synthesis, when cells are
exposed to N stress, thus prioritising it over starch production (Scaife et al., 2015).
Figure 3.8. Total mg FA/g DW of S1-Wt control and I58W3 C. reinhardtii strains under N repletion (N 100%) or depletion
(N 5%). Measurements were made at 48h of culture growth. Values correspond to average ± standard error, n=3; asterisks indicate significant differences (p≤0.05).
0,00
50,00
100,00
150,00
200,00
250,00
300,00
350,00
400,00
450,00m
g FA
/g D
W
S1-Wt N100 S1-Wt N5 I58W3 N100 I58 W3 N5
*
*

21
3.4. I58W3 cells have less efficient O2 production
O2 electrode measurements carried out at 48 and 96h indicate that I58W3 mutants have a less
effective O2 evolution over time. S1-Wt has a higher ratio of photosynthetic/respiratory activity,
which indicates that O2 production is more effective (fig. 3.10). On the other hand I58W3
spends more O2 than it produces leading to a less effective overall photosynthetic activity,
showing that the mutation induced a slightly higher respiration rate and a significantly lower
photosynthetic rate in I58W3 cells than the wild-type. The change in O2 consumption also
makes sense in the N-deprived I58W3 mutant, as a more stressful environment could lead to an
Figure 3.9. TAG percentage in control (S1-Wt) and mutant (I58W3) strains in N-replete (N100) or deplete (N5) media.
Measures were made with samples with 48h of cell growth and analysed through thin layer chromatography followed by
gas chromatography.
0,00
5,00
10,00
15,00
20,00
25,00
30,00
TAG
TAG
%
S1-Wt N100 S1-Wt N5 I58W3 N100 I58W3 N5
Figure 3.10. Photosynthetic/respiratory ratio at 48h and 96h of C. reinhardtii control strain (S1-Wt) and mutant strain
(I58W3) in normal TAP medium (100% N) and with deficient nitrogen regime (5% N). Values correspond to average ± standard error, n=3; asterisks indicate significant differences (p≤0.05).
0
0,2
0,4
0,6
0,8
1
1,2
1,4
1,6
1,8
2
48h 96h
Ph
oto
syn
thet
ic/R
esp
irat
ory
rat
io
S1 N100 S1 N5 I58W3 N100 I58W3 N5
*
*
*
*

22
initial photosynthetic overload, followed by TAG accumulation as another way of maintaining
cell functions. Previous reports of a lower CO2/O2 specificity in I58W3 cells seem to suggest
that in fact the mutation causes a less effective CO2 fixation in the photosynthetic process
(Spreitzer and Salvucci, 2002; Esquivel et al., 2013).
3.5. Chlorophyll fluorescence analyses (PAM)
The photosynthetic efficiency of C. reinhardtii has been previously reported and shows a
significant decrease under N deprivation (Valledor et al., 2014; Juergens et al., 2015; Esquível
et al., 2017). Since chlorophyll fluorescence is highly sensitive to environmental changes, a
lack of N results in reduced chlorophyll levels (Berges et al., 1996; Li et al., 2010; Blaby et al.,
2013; Juergens et al., 2015).
PAM-derived parameters of OJIP tests are shown in figure 3.11 and in Table 2. Analyses of
both strains showed that the photosynthetic processes in I58W3 cells are significantly affected
(for p≤0,05) in all conditions when compared to S1-Wt in N-replete media, except for energy
dissipation as heat (DI/CS) where it is higher in N-replete I58W3 cells for both 48 and 96 h. N-
deprived control cells also showed lower levels in all conditions (p≤0,05) except energy
transport flux (ET/CS), as it was slightly higher than the N-replete control strain in both time
periods.
According to Pinto et al. (2013), the low efficiency of PSII could be promoted by a decrease of
electron sinks and it has been shown that an inhibition of the Calvin Cycle can lead to an over-
reduced state of the photosynthetic electron transport chain, which may result in the generation
of reactive oxygen species in PSII that may cause photoinhibition (Skillman, 2008; Antal et al.,
2011). This is confirmed for the I58W3 strain, as their number of reduction turnovers (N) are
much higher than the control strain. These results, alongside the reduced efficiency with which
an absorbed photon results in electron transport beyond QA- (ΦEo), seem to explain the reduced
electron transport rate in I58W3 cells and could clarify the low photosynthetic efficiency of
I58W3 cells. When comparing control and mutant cells, it is clear that PSII is more sensitive
under N deprivation. A lower efficiency with which a PSII trapped electron is transferred from
QA to quinone B (QB) (ΨO) coupled with a lower number of QA reducing RCs per PSII antenna
chlorophyll (RC/ABS) could explain the problems I58W3 shows in the absorption energy flux
as well as in the energy flux trapped by reaction centres being less effective. This could lead to
photo oxidation processes that result in thylakoid membrane destruction. The reaction centres
are a key component for the primary events in photochemical conversion of light into chemical
energy (Allen and Williams, 1998). After light excitation, a charge separation that spans the
cell’s membrane is formed in the reaction centre. In this case, control strains have a higher
concentration of reaction centres than the mutant strain regardless of N deficiency (RC/ABS).
This could mean that, overall, mutant strains photosynthetic apparatus is not working as
intended, as the conversion of trapped light into energy is affected from the start since they
possess a lot less reaction centres, the PSII is gradually inactivated (Melis et al., 2000). Even
though the rate of photon absorption (ABS/RC) is higher due to a lower level of reaction
centres, the trapped energy and electron transport flux (TRO/RC and ETO/RC) change

23
significantly for the N deprived cells but not with the same change as ABS/RC, wich was almost
fivefold, at 48h. At 96h the control strain under N deprivation shows a higher level of electron
transport flux, which could explain the higher level of ET/CS shown in figure 3.9. Higher
energy dissipation levels for I58W3 N replete cells were also reported, and seem to suggest that
despite absorbing and utilizing light energy less efficiently than control cells, they also manage
Figure 3.11. Phenomenological energy fluxes in C. reinhardtii grown at 48 h (upper graphic) and 96 h (lower graphic)
under N-repletion or depletion. Absorbed energy flux per cross-section (ABS/CS); Trapped energy flux per cross-section
(TR/CS); Electron transport energy flux per cross-section (ET/CS); dissipated energy flux per cross-section (DI/CS).
Reaction Centres per cross section (RC/CS).
0
500
1000
1500
2000
2500
3000ABS/CS
TR/CS
ET/CSDI/CS
RC/CS
48 h
S1-Wt N100
S1-Wt N5
I58W3 N100
I58W3 N5
0
500
1000
1500
2000
2500
3000
3500ABS/CS
TR/CS
ET/CSDI/CS
RC/CS
96 h
S1-Wt N100
S1-Wt N5
I58W3 N100
I58W3 N5
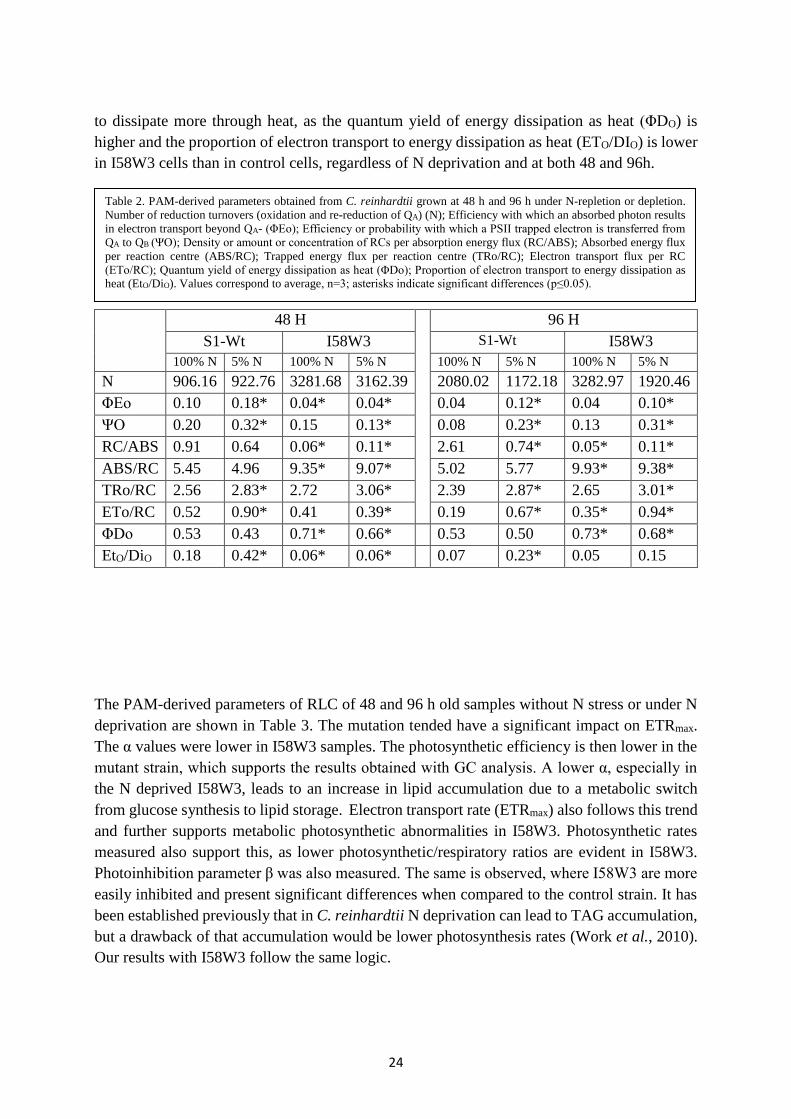
24
to dissipate more through heat, as the quantum yield of energy dissipation as heat (ΦDO) is
higher and the proportion of electron transport to energy dissipation as heat (ETO/DIO) is lower
in I58W3 cells than in control cells, regardless of N deprivation and at both 48 and 96h.
48 H 96 H
S1-Wt I58W3 S1-Wt I58W3
100% N 5% N 100% N 5% N 100% N 5% N 100% N 5% N
N 906.16 922.76 3281.68 3162.39 2080.02 1172.18 3282.97 1920.46
ΦEo 0.10 0.18* 0.04* 0.04* 0.04 0.12* 0.04 0.10*
ΨO 0.20 0.32* 0.15 0.13* 0.08 0.23* 0.13 0.31*
RC/ABS 0.91 0.64 0.06* 0.11* 2.61 0.74* 0.05* 0.11*
ABS/RC 5.45 4.96 9.35* 9.07* 5.02 5.77 9.93* 9.38*
TRo/RC 2.56 2.83* 2.72 3.06* 2.39 2.87* 2.65 3.01*
ETo/RC 0.52 0.90* 0.41 0.39* 0.19 0.67* 0.35* 0.94*
ΦDo 0.53 0.43 0.71* 0.66* 0.53 0.50 0.73* 0.68*
EtO/DiO 0.18 0.42* 0.06* 0.06* 0.07 0.23* 0.05 0.15
The PAM-derived parameters of RLC of 48 and 96 h old samples without N stress or under N
deprivation are shown in Table 3. The mutation tended have a significant impact on ETRmax.
The α values were lower in I58W3 samples. The photosynthetic efficiency is then lower in the
mutant strain, which supports the results obtained with GC analysis. A lower α, especially in
the N deprived I58W3, leads to an increase in lipid accumulation due to a metabolic switch
from glucose synthesis to lipid storage. Electron transport rate (ETRmax) also follows this trend
and further supports metabolic photosynthetic abnormalities in I58W3. Photosynthetic rates
measured also support this, as lower photosynthetic/respiratory ratios are evident in I58W3.
Photoinhibition parameter β was also measured. The same is observed, where I58W3 are more
easily inhibited and present significant differences when compared to the control strain. It has
been established previously that in C. reinhardtii N deprivation can lead to TAG accumulation,
but a drawback of that accumulation would be lower photosynthesis rates (Work et al., 2010).
Our results with I58W3 follow the same logic.
Table 2. PAM-derived parameters obtained from C. reinhardtii grown at 48 h and 96 h under N-repletion or depletion.
Number of reduction turnovers (oxidation and re-reduction of QA) (N); Efficiency with which an absorbed photon results
in electron transport beyond QA- (ΦEo); Efficiency or probability with which a PSII trapped electron is transferred from
QA to QB (ΨO); Density or amount or concentration of RCs per absorption energy flux (RC/ABS); Absorbed energy flux
per reaction centre (ABS/RC); Trapped energy flux per reaction centre (TRo/RC); Electron transport flux per RC
(ETo/RC); Quantum yield of energy dissipation as heat (ΦDo); Proportion of electron transport to energy dissipation as heat (EtO/DiO). Values correspond to average, n=3; asterisks indicate significant differences (p≤0.05).

25
48 h
96 h
S1-Wt N100
S1-Wt N5
I58W3 N100
I58W3 N5 S1-Wt N100
S1-Wt N5 I58W3 N100
I58W3 N5
α 0.011 0.006 0* 0* 0.05 0.0027* 0* 0*
ETRmax 11.17 11.5 4* 7.333* 5.417* 10.83 4.25* 5.583*
β 0.022 0.020 0.062* 0.057* 0.018 0.013 0.055* 0.053*
3.6. Gene expression analysis by qPCR
Several genes were tested through qPCR (fig. 3.12). Results are shown as fold change of the
target gene in the test samples compared to a control sample, after normalization to the
expression of the calibrator gene (housekeeping gene, actin) (Livak and Schmittgen, 2001). The
mutation causes changes in the photosynthetic apparatus which in turn trigger metabolic
changes already described throughout this investigation. In this test we tried to analyse the
expression of genes that were considered relevant, taking into account the biochemical and
physiological changes observed between control and mutant cells in both growth conditions.
It has been previously reported that, alongside TAG accumulation under N deprivation, there
are other changes in C. reinhardtii metabolism triggered by both Rubisco mutation and N
deprivation. Previous studies with C. reinhardtii Rubisco small subunit mutants by Esquível et
al. (2013; 2017) seem to suggest that the organism’s metabolism is affected, reporting low
photosynthetic capacity and low effective quantum yield of PSII and decreases in carboxylation
rates and CO2 / O2 specificity. SSU expression appears to be affected the most in the I58W3
mutant under N deprivation, but no significant differences were found. It is known that Rubisco
small subunit synthesis is negatively affected by drought (Parry et al., 2002). Regarding TAG
accumulation we targeted DGAT1, a gene that expresses an acyltransferase which catalyses the
conversion of diacylglycerol into TAG. Boyle et al. (2012) have reported that DGAT1 was up-
regulated under N deprivation and that it could be a key regulator regarding nitrogen deprivation
responses. Our qPCR analysis of this gene also showed a higher DGAT1 expression under N
deprivation. Without N deprivation the I58W3 mutant also showed higher expression
concerning the control strain. Regarding FA synthesis, we considered the works of Kajikawa et
al. (2006), where a fatty acid desaturase (FAD), CrDES, is described as having desaturase
activity specifically in C18 FA, which is in contrast with previous results from other front-end
desaturases. In this case, pinolenic acid is synthesized from linoleic acid. FAD are responsible
for the formation of carbon double bonds by removing hydrogen atoms from a fatty acid.
Transgenic tobacco plants which constitutively expressed CrDES showed higher levels of
pinolenic acid with no apparent morphological phenotypes (Kajikawa et al,. 2006). No further
Table 3. Rapid Light Curve parameters in 48 and 96 h old samples of C. reinhardtii under N deprivation and N repletion.
Values correspond to average of n = 3 samples. Marked (*) values indicate significant differences between mutant, S1 N5
and S1-Wt N100 control strains (p ≤ 0.05). α (photosystem II efficiency), ETRmax (maximum relative electron transport),
β (photoinhibition parameter). Values correspond to average, n=3; asterisks indicate significant differences (p≤0.05).

26
studies were conducted regarding how CrDES levels could be affected by N deprivation or by
a Rubisco mutation. Here we show an impact in the gene expression of CrDES under these
conditions. In I58W3 the CrDES gene was down-regulated in both N deprivation and repletion,
which implies a lower FAD activity when compared to the control strain. Sato et al. (1997)
described a ω-6 FAD, CrFAD6, which is an enzyme that catalyses the desaturation of mono to
dienoic acids in C. reinhardtii chloroplast, specifically oleic (C18:1Δ9) into linoleic acid. Their
works with a CrFAD6 mutant, hf-9, concluded that C. reinhardtii strains with a lower CrFAD6
expression have also lower linoleic acid concentrations. Here we found that both N deprivation
and the Rubisco mutation have an apparent impact on the FAD6 gene expression of CRFAD6.
The I58W3 strain again has lower expression levels of FAD6, indicating lower FAD activity
and lower conversion of oleic into linolenic acid. The control strain also has a drop in CrFAD6
expression under N deprivation, indicating that N environmental stress is a key element in both
control and I58W3 CrFAD6 synthesis and subsequent activity. Li et al (2012) gave us an insight
on a galactolipid lipase (PGD1) expression and its impact on TAG production. One of the
mutants used in this investigation did not accumulate TAG under N deprivation, which was
then attributed to lower expressions of the PDGD1 enzyme. The recombinant enzyme, while
expressed in E. coli, also hydrolysed monogalactosyldiacylglycerol (MGDG) to produce lyso-
MGDG and free FA ( X. Li et al., 2012; Li-Beisson et al., 2015), which indicates that C.
reinhardtii synthesizes TAG under N deprivation in two different ways, by de novo synthesis
and from acyl chains that are already present in membrane lipids. Our results indicate that
PGD1 expression only changed under N deprivation for the control strain, as the mutant strain
showed no differences in gene expression. Since this enzyme and its levels are related to TAG
accumulation, we believe the results obtained are in accordance with current knowledge. We
have shown TAG accumulates in both control and I58W3 strains under N deprivation. Normal
or higher levels of PGD1 expression, which is what we observe, indicate exactly TAG
accumulation. It has been previously reported that H2 production can be caused by nutrient
deficiency, such as N or S deprivation (Ghirardi et al., 2007; Hemschemeier et al. 2008),
through hydrogenase induction. It is believed that hydrogenase activity and synthesis are both
tied to O2 production rates during photosynthesis, which is known to be an inhibitor of H gas
production (Forestier et al., 2003; Batyrova and Hallenbeck, 2017). With a lower O2
concentration then it is possible for H2 production to be more effective. Our results show that
hydrogenase activity in I58W3 do not change, indicating no increase in H2 production. Control
strain under N deprivation did show an increase in hydrogenase expression, although H2 levels
were not measured. Culture growth was also undertaken in aerobic conditions, which could
prevent H2 production due to the presence of free O2. Nutrient deprivation can lead to a gradual
inactivation of PSII (Melis et al., 2000; Philipps et al., 2011; Batyrova et al., 2012) and
therefore create favourable environments for C. reinhardtii cells to produce H2. Electron
transport through cytb6f facilitates proton pumping from the stroma into the lumen, thus
maintaining a proton gradient necessary for ATP production through ATPsyntase (Liran et al.,
2016). If, under N deprivation, photosynthetic activity seems to be hindered, we targeted and
studied how cytb6f expression would vary under this type of stress. I58W3 analysis reported an
increase in cytb6f expression, which goes against findings reported previously (Valledor et al.,

27
2014), where a fivefold decrease in cytb6f expression under N deprivation was shown. cytb6f
complex (E.C. 1.10.99.1) is involved in the electron transport chain from PSII to PSI during
photosynthesis, and its gene expression could be tied to the electron transfer efficiency between
photosystems. PAM analyses showed that mutant cells have a higher absorbed photon flux per
reaction centre, and qPCR results show that the transcripts of this gene are more abundant in
both N deprived and replete cells and in N deprived control cells, which could mean there is an
attempt at normalizing electron transport.
0
0,5
1
1,5
Fold
Ch
ange
CrDES
S1-Wt N100 S1-Wt N5 I58W3 N100 I58W3 N5
0
1
2
3
Fold
Ch
ange
PGD1
S1-Wt N100 S1-Wt N5 I58W3 N100 I58W3 N5
0
1
2
Fold
Ch
ange
SSU
S1-Wt N100 S1-Wt N5 I58W3 N100 I58W3 N5
0
0,5
1
1,5
2
Fold
Ch
ange
HydA1
S1-Wt N100 S1-Wt N5 I58W3 N100 I58W3 N5
0
5
10
Fold
Ch
ange
DGAT1
S1-Wt N100 S1-Wt N5 I58W3 N100 I58W3 N5
0
0,5
1
1,5
Fold
Ch
ange
CrFAD6
S1-Wt N100 S1-Wt N5 I58W3 N100 I58W3 N5
*
* *
*
* *
*
*
*
*
*

28
4. Conclusions and perspectives
Our results show that TAG production from C. reinhardtii mutant is a real possibility and
culture growth under N deprivation seems to trigger steps that are required in order to increase
potential lipid yields, such as a hindered photosynthesis, less O2 production and TAG
accumulation. The energy and carbon required for de novo synthesis of TAG could have been
redirected from photosynthesis as well as from the external carbon substrates such as acetate
present in the culture media (Johnson and Alric 2013; Esquível et al., 2017). Overall it seems
I58W3 mutant is a capable candidate for biofuel production, although it seems that N
deprivation does not impact lipid production as much as desired. N deprived control cells seem
to also be an interesting target for lipid accumulation.
PAM results show that the mutant strain has its photosynthetic processes hindered, and that it
dissipates more energy than control cells even though it absorbs less. The overall analyses seem
to point out that, despite N deprivation, these differences in photosynthetic efficiency are due
the mutation, since both strains, under N deprivation and repletion, have a less efficient
photosynthesis.
Genetic analyses show that the expression of the genes varies under N deprivation. DGAT1 is
up-regulated, as well as cytb6f. CrDES is down-regulated in the mutant strain, which ties in
with the GC results that show a lower CrDES activity due a higher concentration of linoleic
acid. The analysis of more genes related to photosynthesis could complement our results. One
possible target is the PsbO protein expressed by the psbo gene, which could be a good indicator
of photosynthetic activity as it is a key component of PSII (De Las Rivas and Barber, 2004).
Figure 3.12. Fold change in gene expression
calculated using Livak method. Actin was
used as the control housekeeping gene. Values
correspond to average ± standard error, n=3;
asterisks indicate significant differences
(p≤0.05). Fatty acid desaturase (CrDES and
CrFAD6), galactolipase (PGD1),
diacylglycerol acyltransferase (DGAT1),
hydrogenase (HydA1), Rubisco small subunit
(SSU) and cytb6f protein.
0
1
2
3
Fold
Ch
ange
cytb6f
S1-Wt N100 S1-Wt N5 I58W3 N100 I58W3 N5
* *
*

29
5. References
Acquisti, C., Kumar, S., Elser, J.J. 2009. “Signatures of Nitrogen Limitation in the Elemental
Composition of the Proteins Involved in the Metabolic Apparatus.” Proceedings of the
Royal Society B: Biological Sciences 276(1667): 2605–10. DOI: 10.1098/rspb.2008.1960
Ak, B., Işık, O., Uslu, L., Azgın, C. 2015. “The Effect of Stress Due to Nitrogen Limitation on
Lipid Content of Phaeodactylum tricornutum (Bohlin) Cultured Outdoor in
Photobioreactor.” Turkish Journal of Fisheries and Aquatic Sciences 15: 647–52. DOI:
10.4194/1303-2712-v15_3_09
Alemán-Nava, G.S., Cuellar-Bermudez, S.P., Cuaresma, M., Bosma, R., Muylaert, K.,
Ritmann, B.E., Parra, R. 2016. “How to Use Nile Red , a Selective Fluorescent Stain for
Microalgal Neutral Lipids.” Journal of Microbiological Methods 128: 74–79. DOI:
10.1016/j.mimet.2016.07.011
Allen, J.P., Williams, J.C. 1998. “Photosynthetic Reaction Centers.” FEBS Letters 438(1–2):
5–9. DOI: 10.1016/S0014-5793(98)01245-9
Antal, T.K., Krendeleva, T.E., Rubin, A.B. 2011. “Acclimation of Green Algae to Sulfur
Deficiency: Underlying Mechanisms and Application for Hydrogen Production.” Applied
Microbiology and Biotechnology 89(1): 3–15. DOI: 10.1007/s00253-010-2879-6
Batyrova, K., Tsygankov, A., Kosourov, S.N.. 2012. “Sustained Hydrogen Photoproduction by
Phosphorus-Deprived Chlamydomonas reinhardtii Cultures.” International Journal of
Hydrogen Energy 37(10): 8834–39. DOI: 10.1016/j.ijhydene.2012.01.068
Batyrova, K., Hallenbeck, P.C. 2017. “Hydrogen Production by a Chlamydomonas reinhardtii
Strain with Inducible Expression of Photosystem II.” International Journal of Molecular
Sciences 18(3). DOI: 10.3390/ijms18030647
Baker, N.R. 2008. “Chlorophyll Fluorescence: A Probe of Photosynthesis in Vivo.” Annual
review of plant biology 59: 89–113. DOI: 10.1146/annurev.arplant.59.032607.092759
Bensadoun, A., Weinstein, D. 1976. “Assay of Proteins in the Presence of Interfering
Materials.” Analytical Biochemistry 70(1): 241–50. DOI: 10.1016/S0003-2697(76)80064-
4
Berges, J. A., Charlebois, D.O., Mauzerall, D.C., Falkowski, P.G.. 1996. “Differential Effects
of Nitrogen Limitation on Photosynthetic Efficiency of Photosystems I and II in
Microalgae.” Plant physiology 110(2): 689–96. DOI: 10.1104/pp.110.2.689
Bhuyan, A.K. 2010. “On the Mechanism of SDS-Induced Protein Denaturation.” Biopolymers
93(2): 186–99. DOI: 10.1002/bip.21318
Blaby, I. K., Glaesener, A.G., Mettler, T., Fitz-Gibbon, S.T., Gallaher, S.D., Liu, B., Boyle,
N.R., Kropat, J., Stitt, M., Johnson, S., Benning, C., Pellegrini, M., Casero, D., Merchant,
S.S. 2013. “Systems-Level Analysis of Nitrogen Starvation-Induced Modifications of
Carbon Metabolism in a Chlamydomonas reinhardtii Starchless Mutant.” The Plant Cell
25(11): 4305–23. DOI: 10.1105/tpc.113.117580
Bligh, E., Dyer, W. 1959. “A Rapid Method Of Total Lipid Extraction And Purification.”
Canadian Journal of Biochemistry and Physiology 37.

30
Borowitzka, M.A., Borowitzka, L.J. 1990. “Micro-algal Biotechnology” Cambridge University
press, Cambridge
Boyle, N.R., Page, M.D., Liu, B., Blaby, I.K., Casero, D., Kropat, J., Cokus, S.J., Hong-
Hermesdorf, A., Shaw, J., Karpowicz, S.J., Gallaher, S.D., Johnson, S., Benning, C.,
Pellegrini, M., Grossman, A., Merchant, S.S. 2012. “Three Acyltransferases and Nitrogen-
Responsive Regulator Are Implicated in Nitrogen Starvation-Induced Triacylglycerol
Accumulation in Chlamydomonas.” Journal of Biological Chemistry 287(19): 15811–25.
DOI: 10.1074/jbc.M111.334052
Chen, J.E., Smith, A.G. 2012. “A Look at Diacylglycerol Acyltransferases (DGATs) in Algae.”
Journal of Biotechnology 162(1): 28–39. DOI: 10.1016/j.jbiotec.2012.05.009
Chernev, P., Goltsev, V., Zaharieva, I., Strasser, R. 2006. “А Highly Restricted Model
Approach Quantifying Structural and Functional Parameters of Photosystem II Probed
by the Chlorophyll a Fluorescence Rise.” Ecological Engineering and Environment
protection (2): 19–29.
Converti, A., Casazza, A.A., Ortiz, E., Perego, P., Del Borghi, M. “Effect of Temperature and
Nitrogen Concentration on the Growth and Lipid Content of Nannochloropsis oculata and
Chlorella vulgaris for Biodiesel Production.” Chemical Engineering and Processing:
Process Intensification 48(6): 1146–51. DOI: 10.1016/j.cep.2009.03.006
Cooksey, K.E., Guckert, J.B., Williams, S.A., Callis, P.R. 1987. “Fluorometric Determination
of the Neutral Lipid Content of Microalgal Cells Using Nile Red.” Journal of
Microbiological Methods 6(6): 333–45. DOI: 10.1016/0167-7012(87)90019-4
De Las Rivas, J., Barber, J. 2004. “Analysis of the Structure of the PsbO Protein and Its
Implications.” Photosynthesis Research 81(3): 329–43. DOI:
10.1023/B:PRES.0000036889.44048.e4
Dent, R.M., Han, M., Niyogi, K.K. 2001. “Functional Genomics of Plant Photosynthesis in the
Fast Lane Using Chlamydomonas reinhardtii.” Trends in Plant Science 6(8): 364–71.
DOI: 10.1074/jbc.M111.334052
El-Kassas, H.Y. 2013. “Growth and Fatty Acid Profile of the Marine Microalga Picochlorum
Sp. Grown under Nutrient Stress Conditions.” The Egyptian Journal of Aquatic Research
39(4): 233–39. DOI: 10.1016/j.ejar.2013.12.007
Ellis, R.J. 1979. “The Most Abundant Protein in the World.” Trends in Biochemical Sciences
4(11): 241–44. DOI: 10.1074/jbc.M111.334052
Esquível, M.G., Ferreira, R.B., Teixeira, A.R. 2000. “Protein Degradation in C3 and C4 Plants
Subjected to Nutrient Starvation. Particular Reference to Ribulose Bisphosphate
Carboxylase/oxygenase and Glycolate Oxidase.” Plant Science 153(1): 15–23. DOI:
10.1016/S0168-9452(99)00238-1
EsquIvel, M.G.,Genkov, T., Nogueira, A.S., Salvucci, M.S., Spreitzer, R.J. 2013. “Substitutions
at the Opening of the Rubisco Central Solvent Channel Affect Holoenzyme Stability and
CO2/O2 Specificity but Not Activation by Rubisco Activase.” Photosynthesis Research
118(3): 209–18. DOI: 10.1007/s11120-013-9916-0

31
Esquível, M.G., Matos, A.R., Silva, J.M. 2017. “Rubisco Mutants of Chlamydomonas
reinhardtii Display Divergent Photosynthetic Parameters and Lipid Allocation.” Applied
Microbiology and Biotechnology 101(13): 5569–80. DOI: 10.1007/s00253-017-8322-5
Esquível, MG., Pinto, T.S., Marín-Navarro, J., Moreno, J. 2006. “Substitution of Tyrosine
Residues at the Aromatic Cluster around the βA-βB Loop of Rubisco Small Subunit
Affects the Structural Stability of the Enzyme and the in Vivo Degradation under Stress
Conditions.” Biochemistry 45(18): 5745–53. DOI: 10.1021/bi052588y
Evans, J.R., Seemann, J.R. 1989. “The Allocation of Protein Nitrogen in the Photosynthetic
Apparatus: Costs, Consequences, and Control.” Plant Biology.
Fernandez, E., Galvan, A. 2008. “Nitrate Assimilation in Chlamydomonas.” Eukaryotic Cell
7(4): 555–59. DOI: 10.1128/EC.00431-07
Florencio, FJ., Vega, J.M. 1983. “Utilization of Nitrate, Nitrite and Ammonium by
Chlamydomonas reinhardii - Photoproduction of Ammonium.” Planta 158(4): 288–93.
DOI: 10.1007/BF00397329
Forestier, M., King, P., Zhang, L., Posewitz, M., Schwarzer, S., Happe, T., Ghirardi, M.L.,
Seibert, M. 2003. “Expression of Two [Fe]-Hydrogenases in Chlamydomonas reinhardtii
under Anaerobic Conditions.” Eur. J. Biochem. 270: 2750–58. DOI: 10.1046/j.1432-
1033.2003.03656.x
Gallagher, S., Chakavarti, D. 2008. “Immunoblot Analysis.” Journal of Visualized Experiments
(16): 2008. DOI: 10.3791/759
Gallagher, Sean R. 2012. “One-Dimensional SDS Gel Electrophoresis of Proteins. ” Current
Protocols in Protein Science 10.1.1-10.1.44 DOI: 10.1002/0471140864.ps1001s68
Ghirardi, M.L. Posewitz, M., Maness, P., Dubini, A., Yu, J., Seibert, M. 2007. “Hydrogenases
and Hydrogen Photoproduction in Oxygenic Photosynthetic Organisms *.” Annual Review
of Plant Biology 58(1): 71–91. DOI: 10.1146/annurev.arplant.58.032806.103848
Giordano, M., Beardall, J., Raven, J.A.. 2005. “CO 2 Concentrating Mechanisms In Algae:
Mechanisms, Environmental Modulation, and Evolution.” Annual Review of Plant Biology
56(1): 99–131. DOI: 10.1146/annurev.arplant.56.032604.144052
Guschina, I.A., Harwood, J.L. 2006. “Lipids and Lipid Metabolism in Eukaryotic Algae.”
Progress in Lipid Research 45(2): 160–86. DOI: 10.1016/j.plipres.2006.01.001
Hames, B.D. 1990. “Gel Electrophoresis of Proteins: A Practical Approach” 2nd Edition. Oxford
University Press
Happe, T., Kaminski, A. 2002. “Differential Regulation of the Fe-Hydrogenase during
Anaerobic Adaptation in the Green Alga Chlamydomonas reinhardtii.” Eur. J. Biochem.
269: 1- Happe T and Naber JD 214: 475–81.
Harris, E.H. 2001. “Chlamydomonas as a Model Organism.” Molecular Biology 52(1): 363–
406. DOI: 10.1146/annurev.arplant.52.1.363

32
Hasan, R., Zhang, B., Wang, L., Shahbazi, A. 2014. “Bioremediation of Swine Wastewater and
Biofuel Potential by Using Chlorella vulgaris, Chlamydomonas reinhardtii, and
Chlamydomonas debaryana.” Journal of Petroleum & Environmental Biotechnology 5(3):
1–20. DOI: 10.4172/2157-7463.1000175
Hemschemeier, A., Fouchard, S., Cournac, L., Peltier, G., Happe, T. 2008. “Hydrogen
Production by Chlamydomonas reinhardtii: An Elaborate Interplay of Electron Sources
and Sinks.” Planta 227(2): 397–407.
Hu, Q., Sommerfeld, M., Jarvis, E., Ghirardi, M.L., Posewitz, M., Seibert, M., Darzins, A. 2008.
“Microalgal Triacylglycerols as Feedstocks for Biofuel Production: Perspectives and
Advances.” Plant Journal 54(4): 621–39. DOI: 10.1111/j.1365-313X.2008.03492.x
Huo, Y. Cho, K.M., Rivera, J.G.L., Monte, E., Shen, C.R., Yan, Y., Liao, J.C. 2011.
“Conversion of Proteins into Biofuels by Engineering Nitrogen Flux.” Nature
Biotechnology 29(4): 346–51. DOI: 10.1038/nbt.1789
Johnson, X., Alric, J. 2013. “Central Carbon Metabolism and Electron Transport in
Chlamydomonas reinhardtii: Metabolic Constraints for Carbon Partitioning between Oil
and Starch.” Eukaryotic Cell 12(6): 776–93. DOI: 10.1128/EC.00318-12
Juergens, M.T., Deshpande, R.R., Lucker, B., Park, J., Wang, H., Gargouri, M., Holguin, F.O.,
Disbrow, B., Schaub, T., Skepper, J.N., Kramer, D.M., Gang, D.R., Hicks, L.M., Sachar-
Hill, Y. 2015. “The Regulation of Photosynthetic Structure and Function during Nitrogen
Deprivation in Chlamydomonas reinhardtii.” Plant Physiology 167(2): 558–73. DOI:
10.1104/pp.114.250530
Jungnick, N., Ma, Y., Mukherjee, B., Cronan, J.C., Speed, D.J., Laborde, S.M., Longstreth,
D.J., Moroney, J.V. 2014. “The Carbon Concentrating Mechanism in Chlamydomonas
reinhardtii: Finding the Missing Pieces.” Photosynthesis Research 121(2–3): 159–73.
DOI: 10.1007/s11120-014-0004-x
Kajikawa, M., Yamato, K., Kohzu, Y., Shoji, S., Matsui, K., Tanaka, Y., Sakai, Y., Fukuzawa,
H. 2006. “A Front-End Desaturase from Chlamydomonas reinhardtii Produces Pinolenic
and Coniferonic Acids by ω13 Desaturation in Methylotrophic Yeast and Tobacco.” Plant
and Cell Physiology 47(1): 64–73. DOI: 10.1093/pcp/pci224
Kalaji, H.M., Bosa, K., Kościelniak, J., Hossain, Z. 2011. “Chlorophyll a Fluorescence—A
Useful Tool for the Early Detection of Temperature Stress in Spring Barley (Hordeum
vulgare L.).” OMICS: A Journal of Integrative Biology 15(12): 925–34. DOI:
10.1089/omi.2011.0070
Kraft, C., Deplazes, A., Sohrmann, M., Peter, M. 2008. “Mature Ribosomes Are Selectively
Degraded upon Starvation by an Autophagy Pathway Requiring the Ubp3p/Bre5p
Ubiquitin Protease.” Nature Cell Biology 10(5): 602–10. DOI: 10.1038/ncb1723
Langner, U., Jakob, T., Stehfest, K., Wilhelm, C. 2009. “An Energy Balance from Absorbed
Photons to New Biomass for Chlamydomonas reinhardtii and Chlamydomonas acidophila
under Neutral and Extremely Acidic Growth Conditions.” Plant, Cell and Environment
32(3): 250–58. DOI: 10.1111/j.1365-3040.2008.01917.x
Li, X., Moellering, E.R., Liu, B., Johnny, C., Fedewa, M., Sears, B.B., Kuo, M., Benning, C.
2012. “A Galactoglycerolipid Lipase Is Required for Triacylglycerol Accumulation and
33
Survival Following Nitrogen Deprivation in Chlamydomonas reinhardtii.” The Plant Cell
24(11): 4670–86. DOI: 10.1105/tpc.112.105106
Li, Y., Han, D., Hu, G., Sommerfeld, M., Hu, Q 2010. “Inhibition of Starch Synthesis Results
in Overproduction of Lipids in Chlamydomonas reinhardtii.” Biotechnology and
Bioengineering 107(2): 258–68. DOI: 10.1002/bit.22807
Li-Beisson, Y., Beisson, F., Riekhof, W. 2015. “Metabolism of Acyl-Lipids in Chlamydomonas
reinhardtii.” Plant Journal 82(3): 504–22. DOI: 10.1111/tpj.12787
Lichtenthaler, H.K. 1987. “Chlorophylls and Carotenoids: Pigments of Photosynthetic
Biomembranes.” Methods in Enzymology 148(C): 350–82. DOI: 10.1016/0076-
6879(87)48036-1
Liran, O., Semyatich, R., Milrad, Y., Eilenberg, H., Weiner, I., Yacoby, I. 2016. “Microoxic
Niches within the Thylakoid Stroma of Air-Grown Chlamydomonas reinhardtii Protect
[FeFe]-Hydrogenase and Support Hydrogen Production under Fully Aerobic
Environment.” Plant physiology 172(1): 264–71. DOI: 10.1104/pp.16.01063
Livak, K.J., Schmittgen, T.D. 2001. “Analysis of Relative Gene Expression Data Using Real-
Time Quantitative PCR and the 2−ΔΔCT Method.” Methods 25(4): 402–8. DOI:
10.1006/meth.2001.1262
Mahmood, T., Yang, P. 2012. “Western Blot: Technique, Theory, and Trouble Shooting.”
North American Journal of Medical Sciences 4(9): 429–34. DOI: 10.4103/1947-
2714.100998
Martin, N.C., Goodenough, U.W. 1975. “Gametic Differentiation in Chlamydomonas
reinhardtii. I: Production of Gametes and Their Fine Structure.” Journal of Cell Biology
(18): 587–605.
Matlock, B. 2012. “Assessment of Nucleic Acid Purity.” Technical Note 52646: 3.
http://www.nanodrop.com/Library/T042-NanoDrop-Spectrophotometers-Nucleic-Acid-
Purity-Ratios.pdf.
Maxwell, K., Johnson, G.N. 2000. “Chlorophyll Fluorescence - a Practical Guide.” Journal of
Experimental Botany 51(345): 659–68. DOI: 10.1093/jxb/51.345.659
Melis, A., Zhang. L., Forestier, M., Ghirardi, M.L., Seibert, M. 2000. “Sustained
Photobiological Hydrogen Gas Production upon Reversible Inactivation of Oxygen
Evolution in the Green Alga Chlamydomonas reinhardtii.” Plant Physiology 122, pp. 127–
135. DOI:
Merchant, S.S., Prochnik, S.E., Vallon, O., Harris, E.H., Karpowicz, S.J., Witman, G.B., Terry,
A., Salamov, A., et al. 2007. “The Chlamydomonas Genome Reveals the Evolution of Key
Animal and Plant Functions.” Science 318(5848): 245–50. DOI: 10.1126/science.1143609
Merzlyak, M.N., Chivkunova, O.B., Gorelova, O.A., Reshetnikova, I.V., Solovchenko, A.E.,
Khozin-Goldberg, I., Cohen, Z. 2007. “Effect of Nitrogen Starvation on Optical
Properties, Pigments, and Arachidonic Acid Content of the Unicellular Green Alga
Parietochloris incisa (Trebouxiophyceae, Chlorophyta).” Journal of Phycology 43(4):
833–43. DOI: 10.1111/j.1529-8817.2007.00375.x
Meyer, M, Griffiths, H. 2013. “Origins and Diversity of Eukaryotic CO2-Concentrating

34
Mechanisms: Lessons for the Future.” Journal of Experimental Botany 64(3): 769–86.
DOI: 10.1093/jxb/ers390S
Miller, R., Wu, G., Deshpande, R., Vieler, A., Gärtner, K., Li, X., Moellering, E.R., Z+auner,
S., Cornish, A.J., Liu, B., Bullard, B., Sears, B.B., Kuo, M., Hegg, E.L., Shachar-Hill, Y.,
Shiu-S., Benning, C. 2010. “Changes in Transcript Abundance in Chlamydomonas
reinhardtii Following Nitrogen Deprivation Predict Diversion of Metabolism.” Plant
Physiology 154(4): 1737–52. DOI: 10.1104/pp.110.165159
Minagawa, J., Tokutsu, R. 2015. “Dynamic Regulation of Photosynthesis in Chlamydomonas
reinhardtii.” Plant Journal 82(3): 413–28. DOI: 10.1111/tpj.12805
Msanne, J., Xu, D., Konda, A.R., Casas-Mollano, J.A., Awada, T., Cahoon, E.B., Cerutti, H.
2012. “Metabolic and Gene Expression Changes Triggered by Nitrogen Deprivation in the
Photoautotrophically Grown Microalgae Chlamydomonas reinhardtii and Coccomyxa Sp.
C-169.” Phytochemistry 75: 50–59. DOI: 10.1016/j.phytochem.2011.12.007
Park, J., Wang, H., Gargouri, M., Deshpande, R., Skepper, J.N., Holguin, F.O., Juergens, M.,
Shacahr-Hill, Y., Hicks, L.M., Gang, D.R. 2015. “The Response of Chlamydomonas
reinhardtii to Nitrogen Deprivation: A Systems Biology Analysis.” Plant Journal 81(4):
611–24. DOI: 10.1111/tpj.12747
Parry, M.A.J., Andralojc, P.J., Khan, S., Lea, P.J., Keys, A.J 2002. “Rubisco Activity: Effects
of Drought Stress.” Annals of Botany 89(7): 833–39. DOI: 10.1093/aob/mcf103
Philipps, G., Happe, T., Hemschemeier, A. 2011. “Nitrogen Deprivation Results in
Photosynthetic Hydrogen Production in Chlamydomonas reinhardtii.” Planta 235(4):
729–45. DOI: 10.1007/s00425-011-1537-2
Pinto, T. S., Malcata, F.X., Arrabça, J.D., Silva, J.M., Spreitzer, R.J., Esquível, M.G. 2013.
“Rubisco Mutants of Chlamydomonas reinhardtii Enhance Photosynthetic Hydrogen
Production.” Applied Microbiology and Biotechnology 97(12): 5635–43. DOI:
10.1007/s00253-013-4920-z
Rodolfi, L., Zittelli, G.C., Bassi, N., Padovani, G., Biondi, N., Bonini, G., Tredici, M.R. 2009.
“Microalgae for Oil: Strain Selection, Induction of Lipid Synthesis and Outdoor Mass
Cultivation in a Low-Cost Photobioreactor.” Biotechnology and Bioengineering 102(1):
100–112 DOI: 10.1002/bit.22033.
Roessler, P.G. 1990. “Environmental Control of Glycerolipid Metabolism in Microalgae:
Commercial Implications and Future Research Directions.” Journal of Phycology 26(3):
393–99. DOI: 10.1111/j.0022-3646.1990.00393.x
Rupprecht, J. 2009. “From Systems Biology to Fuel - Chlamydomonas reinhardtii as a Model
for a Systems Biology Approach to Improve Biohydrogen Production.” Journal of
Biotechnology 142(1): 10–20. DOI: 10.1016/j.jbiotec.2009.02.008
Sakurai, K., Moriyama, T., Sato, N. 2014. “Detailed Identification of Fatty Acid Isomers Sheds
Light on the Probable Precursors of Triacylglycerol Accumulation in Photoautotrophically
Grown Chlamydomonas reinhardtii.” Eukaryotic Cell 13(2): 256–66. DOI:
10.1128/EC.00280-13
Sato, N., Fujiwara, S., Kawaguchi, A., Tsuzuki, M. 1997. “Cloning of a Gene for Chloroplast

35
ω6 Desaturase of a Green Alga, Chlamydomonas reinhardtii.” Journal of biochemistry
122(6): 1224–32.
Scaife, M.A. Nguyen G.T.D.T., Rico, J., Lambert, D., Helliwell, K.E., Smith, A.G. 2015.
“Establishing Chlamydomonas reinhardtii as an Industrial Biotechnology Host.” Plant
Journal 82(3): 532–46. DOI: 10.1111/tpj.12781
Schmollinger, S., Mühlhaus, T., Boyler, N.R., Blaby, I.K., Casero, D., Mettler, T., Moseley,
J.L., Kropat, J., Sommer, F., Strenkert, D., Hemme, D., Pellegrini, M-., Grossman, A.R.,
Stitt, M., Schroda, M., Merchant, S.S. 2014. “Nitrogen-Sparing Mechanisms in
Chlamydomonas Affect the Transcriptome, the Proteome, and Photosynthetic
Metabolism.” The Plant Cell 26(4): 1410–35. DOI: 10.1105/tpc.113.122523
Shen, P., Wang, H., Pan, Y., Meng, Y., Wu, P., Xue, S. 2016. “Identification of Characteristic
Fatty Acids to Quantify Triacylglycerols in Microalgae.” Frontiers in Plant Science 7
DOI: 10.3389/fpls.2016.00162
Shifrin, N.S., Chisholm, S.W. 1981. “Phytoplankton Lipids: Interspecific Differences and
Effects of Nitrate, Silicate and Light‐Dark Cycles.” Journal of Phycology 17(4): 374–84.
DOI: 10.1111/j.1529-8817.1981.tb00865.x
Siaut, M., Cuiné, S., Cagnon, C., Fessler, B., Nguyen, M., Carrier, P., Beyly, A., Beisson, F.,
Triantaphylidès, C., Li-Beisson, Y., Peltier, G. 2011. “Oil Accumulation in the Model
Green Alga Chlamydomonas reinhardtii: Characterization, Variability between Common
Laboratory Strains and Relationship with Starch Reserves.” BMC Biotechnology 11(1): 7.
DOI: 10.1186/1472-6750-11-7
Skillman, J.B. 2008. “Quantum Yield Variation across the Three Pathways of Photosynthesis:
Not yet out of the Dark.” Journal of Experimental Botany 59(7): 1647–61. DOI:
10.1093/jxb/ern029
Spreitzer, R.J, Salvucci, M.E. 2002. “Rubisco: Structure, Regulatory Interactions, and
Possibilities for a Better Enzyme.” Annual review of plant biology 53: 449–75. DOI:
10.1146/annurev.arplant.53.100301.135233
Taiz, L., Zeiger, E. 2014. “Plant Physiology and Development” 6th Edition. Sinauer Associates
Taylor, T.C., Backlund, A., Bjorhall, K., Spreitzer, R.J., Andersson, I. 2001. “First Crystal
Structure of Rubisco from a Green Alga, Chlamydomonas reinhardtii.” Journal of
Biological Chemistry 276(51): 48159–64. DOI: 10.1074/jbc.M107765200
Thompson, G.A. 1996. “Lipids and Membrane Function in Green Algae.” Biochimica et
Biophysica Acta - Lipids and Lipid Metabolism 1302(1): 17–45. DOI: 10.1016/0005-
2760(96)00045-8
Tsekova, K., Todorova, D., Ganeva., S. 2010. “Removal of Heavy Metals from Industrial
Wastewater by Free and Immobilized Cells of Aspergillus niger.” International
Biodeterioration & Biodegradation 64(6): 447–51. DOI: 10.1016/j.ibiod.2010.05.003
Valledor, L., Furuhashi, T., Recuenco-Muñoz, L., Wienkoop, S., Weckwerth, W. 2014.
“System-Level Network Analysis of Nitrogen Starvation and Recovery in
Chlamydomonas reinhardtii Reveals Potential New Targets for Increased Lipid
Accumulation.” Biotechnology for Biofuels 7(1): 171.

36
Wagener, H. 1965. “Detection and Documentation of Lipids after Thin-Layer
Chromatography.” Nature 205.
Walker, D. 1987. “The Use of the Oxygen Electrode and Fluorescence Probes in Simple
Measurements of Photosynthesis.” DOI: 10.1007/s13398-014-0173-7.2
Wang, Z.T., Ullrich, N., Joo, S., Waffenschmidt, S., Goodenough, U.W. 2009. “Algal Lipid
Bodies: Stress Induction, Purification, and Biochemical Characterization in Wild-Type
and Starchless Chlamydomonas reinhardtii.” Eukaryotic Cell 8(12): 1856–68. DOI:
10.1128/EC.00272-09
Work, V.H., Radakovits, R., Jinkerson, R.E., Meuser, J.E., Elliott, L.G., Vinyard, D.J., Laurens,
M.L., Diamukes, G.C., Posewitz, M.C. 2010. “Increased Lipid Accumulation in the
Chlamydomonas reinhardtii sta7-10 Starchless Isoamylase Mutant and Increased
Carbohydrate Synthesis in Complemented Strains.” Eukaryotic Cell 9(8): 1251–61. DOI:
10.1128/EC.00075-10
Yang, D., Song, D., Kind, T., Ma, Y., Hoefkens, J., Fiehn, O. 2015. “Lipidomic Analysis of
Chlamydomonas reinhardtii under Nitrogen and Sulfur Deprivation.” PLoS ONE 10(9):
1–16. DOI: 10.1371/journal.pone.0137948
Zeraatkar, A.K., Ahmadzadeh, H., Talebi, A.F., Moheimani, N.R., McHenry, M.P. 2016.
“Potential Use of Algae for Heavy Metal Bioremediation, a Critical Review.” Journal of
Environmental Management 181: 817–31. DOI: 10.1016/j.jenvman.2016.06.059
Zhu, X., Govindjee., Baker, N.R., deSturler, E., Ort, D.R., Long, S.P. 2005. “Chlorophyll a
Fluorescence Induction Kinetics in Leaves Predicted from a Model Describing Each
Discrete Step of Excitation Energy and Electron Transfer Associated with Photosystem
II.” Planta 223(1): 114–33. DOI: 10.1007/s00425-005-0064-4

37
6. Supplements
Supplement 1 – Chlamydomonas reinhardtii media
1.1 – Liquid media and Beij Stock
Liquid media
TAP Media (1 L) Beij Stock (for 1 L solution) Beij Stock (for 1 L
solution, with 5% N)
Tris stock (10 mL)
Phosphate stock (10 mL)
Acetate stock (10 mL)
Beij stock (50 mL)
Trace elements (1 mL)
H2O (920 mL)
NH4Cl (8 g)
CaCl2.2H2O (1 g)
MgSO4.7H2O (2 g)
H2O to 1 L
NH4Cl (0,4 g)
CaCl2.2H2O (0,25 g)
MgSO4.7H2O (0,5 g)
KCl (1,8 g)
H2O to 1 L
Solid media: add 15 g of Bacto agar to 1 L of liquid TAP media
1.2 – Stock solutions
Solutions
Tris stock (1 L) Phosphate stock Acetate stock
Trizma base (242,2 g)
HCl (149,0 mL)
H2O to 1 L
K2HPO4 (14,34 g)
KH2PO4 (7,26 g)
H2O to 1 L
NaAcetate.3H2O (7,2 g)
H2O to 200 mL
Supplement 2 – Lichtenthaler equations for chlorophyll quantification when dissolved in
100% methanol (v/v)
Chlorophyll a = 16,72 x Abs 665,2 nm – 9,16 x Abs 652,4 nm
Chlorophyll b = 34,09 x Abs 652,4 nm – 15,28 x Abs 665,2 nm
Total cholorophyll = 1,44 x Abs 665,2 nm + 24,93 x Abs 652,4 nm

38
Supplement 3 – Summary of fluorometric analysis parameters and their description
JIP-test
Turnover number of QA; Total number of electrons transferred into electron
transport chain; Number of reduction turnovers (oxidation and re-reduction of QA)
in the time between turning on the light and TM
N
Quantum yield of electron transport flux from QA to QB of PSII; Efficiency with
which an absorbed photon results in electron transport beyond QA-; Probability that
an absorbed photon will move an electron into electron transport further than QA-
ΦEo
Quantum yield of dissipation; Quantum yield of energy dissipation as heat ΦDo
Efficiency or probability with which a PSII trapped electron is transferred from QA
to QB; Number of reaction centers open at the J-step (at 2 ms)
ΨO
Proportion of electron transport to energy dissipation as heat ETO/DIO
Absorbed energy flux per RC; Absorbed photon flux per RC; Rate of photon
absorption ABS/RC
Trapped energy flux per RC; Maximum trapped exciton flux per PSII; Maximum
rate of QA reduction TRO/RC
Electron transport flux per RC; Electron transport flux from QA to QB per PSII; Rate
of electron transport beyond QA- ETO/RC
Absorbed energy flux per CS; Absorbed photon flux per CS ABS/CS
Trapped energy flux per CS; Maximum trapped exciton flux per CS TR/CS
Electron transport flux per CS; Electron transport flux from QA to QB per CS ET/CS
Energy dissipation as heat per CS DI/CS
Density or amount or concentration of RCs per ABS; Number of QA reducing RCs
per PSII antenna chlorophyll RC/ABS
Density or amount or concentration of RCs per CS; Number of RCs per CS RC/CS
Rapid Light Curves (RLC)
Maximum ETR obtained from the RLC after which photo-inhibition can be observed
Photosynthetic efficiency, obtained from the initial slope of the RLC
RLC related respiration, obtained from the final slope; Photo-inhibition parameter
ETRmax
α
β

39
Supplement 4 – qPCR primers and materials
Gene Primer Sequence Gene ID Protein
Location
Annealing
Temperature (º C)
CrFAD6 Fw-
TACCTCATCTCTATCAGCCCC Rev-
TGTCCTCGATCAGGTTGTTCT
Cre13.g590
500.t1.1
Chloroplast
Fw – 64
Rev - 62
CrDES Fw-TGGCCGCGCAGAAGAAG
Rev-
AGGAAGGGCGTGATGTAGAA
Cre10.g453
600.t1.2
Cell
membrane
Fw – 56
Rev - 60
HydA1 Fw- GTCTATTCGCGGCAGCTC Rev-
GCTGGACATGACTCAAGGG
Cre03.g199
800.t1.1
Chloroplast
Fw – 58
Rev - 60
DGAT1 Fw-
TGCAGGCAAATGCAGGGTTTC Rev-
ACTCGCACCTCCTGCTGACC
Cre01.g045
903.t1.1
Chloroplast
Fw – 64
Rev - 66
PGD1 Fw-
AGCCAGCTATTGTCGCACTT Rev-
CAAGAAATCCGCTGACATCC
Cre07.g344
600.t1.2
Unknown
Fw – 60
Rev - 60
SSU Fw-
CTCCTACCTGCCTCCTCTGAC Rev-
CATGGGCAGCTTCCACATGG
Cre02.g120
150.t1.2
Chloroplast
Fw – 68
Rev - 64
cytb6f Fw- TGCTAGAGAGCCGTGATGA Rev- TGCGCCGAGTGGTTGAAGT
Cre11.g467
689.t1.1
Chloroplast
Fw – 58
Rev - 60
Actin Fw- GCTTCCAAATGCCTTCCTG Rev-
CAAACCCTATGCCTCCTACTGC
Cre09.g397
950.t1.1
Cytoskeleton
Fw – 58
Rev - 68