Embed Size (px)
Citation preview
Environmental ScienceProcesses & Impacts rsc.li/process-impacts
ISSN 2050-7887
PAPERW. M. Mayes et al.Geochemical recovery of the Torna–Marcal river system after the Ajka red mud spill, Hungary
Volume 16 Number 12 December 2014 Pages 2669–2818
EnvironmentalScienceProcesses & Impacts
PAPER
Ope
n A
cces
s A
rtic
le. P
ublis
hed
on 0
7 O
ctob
er 2
014.
Dow
nloa
ded
on 1
2/7/
2021
7:4
6:26
AM
. T
his
artic
le is
lice
nsed
und
er a
Cre
ativ
e C
omm
ons
Attr
ibut
ion
3.0
Unp
orte
d L
icen
ce.
View Article OnlineView Journal | View Issue
Geochemical rec
aDepartment of Applied Biotechnology and
Technology and Economics, St. Gellert sq. 4bCentre for Environmental and Marine Scienc
3AZ, UK. E-mail: [email protected]; F
1723357292cSchool of Earth and Environment, UniversidSchool of Civil Engineering and Geoscience
Tyne, NE1 7RU, UK
† Electronic supplementary informationelemental concentrations for the 2010 anDOI: 10.1039/c4em00452c
Cite this: Environ. Sci.: ProcessesImpacts, 2014, 16, 2677
Received 21st August 2014Accepted 6th October 2014
DOI: 10.1039/c4em00452c
rsc.li/process-impacts
This journal is © The Royal Society of C
overy of the Torna–Marcal riversystem after the Ajka red mud spill, Hungary†
A. D. Anton,ab O. Klebercz,a A. Magyar,a I. T. Burke,c A. P. Jarvis,d K. Gruiza
and W. M. Mayes*b
The failure of the Ajka red mud depository in October 2010 led to the largest single release of red mud into
the surface water environment. This study provides a comparative assessment of stream sediment quality in
the Torna–Marcal–Raba catchment between post-disaster surveys (2010) and follow up surveys at an
identical suite of 21 locations in 2013. The signature of red mud apparent in initial surveys with high Al,
As, Cr, Na, V was only apparent at a small number of sample stations in recent surveys. These constitute
<1 km of stream, compared to the >20 km reach of affected sediments in the immediate aftermath of
the spill. Concentrations of red mud-derived contaminants are predominately associated with fine
fractions of the red mud (<8 mm). This enhances transport out of the system of red mud-derived
contaminants and, along with extensive remedial efforts, has substantially limited the within-channel
inventory of potentially ecotoxic metals and metalloids.
Environmental impact
An increasing quantity of bauxite processing residue (red mud), a by-product of alumina rening is produced globally each year. The largest documentedenvironmental release of this residue occurred in western Hungary in 2010 aer the failure of a retaining wall of a residue impoundment. The highly caustic,metal-rich slurry hadmajor immediate environmental impacts on the receiving water courses. This paper highlights the rapid recovery of the affected rivers aerthe spill due to the physical nature of the spill material (ne grained which lends itself to downstream transport) and the extensive remedial efforts undertakenin affected reaches.
Introduction
There have been in excess of 100 major failures of primary oreextraction or processing tailings facilities globally since 1960.1
The vast majority of these failures occur at active mining orprocessing sites2 with the most common cause cited as beingextreme, or uncommon rainfall events prior to failure.2 From aEuropean perspective, the tailings spills at Aznalcollar insouthern Spain in 1999 (ref. 3) and the Baia Mare/Baia Borsadisasters in Romania in 2000 (ref. 4) played a major role in re-shaping EU legislation on the management of tailings facilities.European Union Directive 2006/21/EC on the management ofwaste from extractive industries (the “MiningWaste Directive”5)
Food Science, Budapest University of
, 1111 Budapest, Hungary
es, University of Hull, Scarborough, YO11
ax: +44 (0)1723370815; Tel: +44 (0)
ty of Leeds, Leeds, LS2 9JT, UK
s, Newcastle University, Newcastle upon
(ESI) available: Data le of totald 2013 surveys attached separately. See
hemistry 2014
set out implementing measures to minimise the risk of furtherdisasters within Europe. These measures included initialinventories of sites posing risk to the environment or humanhealth and the development of disaster management plans atrecognised sites.5 Unfortunately, the implementation of theMiningWaste Directive was not sufficiently advanced to preventthe release of around 1 million m3 of highly alkaline, saline,metalliferous red mud from an impoundment at Ajka inwestern Hungary in October 2010.6 Red mud (or bauxite pro-cessing residue) is the ne fraction by-product of the Bayerprocess for rening bauxite for alumina production. The natureof the material in the depository also meant it did not fall underthe auspices of other preventative legislature such as the SevesoII Directive. This Directive aims to minimise and prevent theoccurrence of major disasters associated with certain hazardouschemical wastes. However, given NaOH (as the key constituentof the red mud liquor) is not deemed a dangerous substance atthe concentrations it was present at the Ajka disposal site(category R34 under annex 1 of the Dangerous SubstancesDirective; 67/548/EEC), it did not fall under Seveso II reportingrequirements.7
A number of failings in operational management anddepository structure have been highlighted in official reviewssince the disaster,8 while a range of scientic studies have
Environ. Sci.: Processes Impacts, 2014, 16, 2677–2685 | 2677
Environmental Science: Processes & Impacts Paper
Ope
n A
cces
s A
rtic
le. P
ublis
hed
on 0
7 O
ctob
er 2
014.
Dow
nloa
ded
on 1
2/7/
2021
7:4
6:26
AM
. T
his
artic
le is
lice
nsed
und
er a
Cre
ativ
e C
omm
ons
Attr
ibut
ion
3.0
Unp
orte
d L
icen
ce.
View Article Online
assessed the impacts of the spill. Although there have beenlarge spills of alkaline wastes in the past,9 the Ajka disaster wasthe single largest release of highly caustic waste to the waterenvironment recorded, and as such, brought with it consider-able uncertainty about the short and long term environmentalimpacts of the release. Since the disaster, a suite of studies haveassessed a range of pathways and receptors for the red mudspill, the ndings of which are summarised below.
Some of the key ndings of the work in the spill aermathhighlight the very ne grained nature of the redmud, which as afugitive dust puts it in a similar risk class as urban dusts,10 whilein aquatic systems lends itself to downstream transport anddilution.11 Furthermore, the red mud is rich in various metalsand metalloids of potential environmental signicance.12,13
Geochemical studies have highlighted that many of themetal(loids) immediately highlighted as a potential concern arenot very mobile under ambient conditions once the leachate isneutralised.11,13 However, in common with other alkaline resi-dues,14 the presence and potential mobility of metal(loids)which form oxyanions has been highlighted. These include As,Cr, Mo and V.11,13 Biological studies have highlighted impacts ofred mud on plant growth,12,15 primary producers,15,16 soilbiota17,18 and genotoxic effects of vanadium in higher plants.19
However, short term impacts on human health have not beenidentied.20,21 The difficulty in specifying any individual causalagent given the concomitant high salinity, alkalinity,metal(loid) concentrations and ne particle size which could allbe stressors to a range of biota is highlighted in many studies.
The Hungarian government invested 38 million Forint(�V127 million) in demolition, reconstruction and environ-mental remediation in the aermath of the spill.22 Immediateinterventions included acid dosing at source, the addition ofaround 10 000 tonnes of gypsum to affected rivers and thebuilding of check dams to encourage buffering of waters andsedimentation.23 Longer term measures included channeldredging and the removal of red mud from affected oodplainareas. Extensive monitoring by regulatory agencies was alsocarried out in the year aer the disaster24,25 while routine bio-logical monitoring suggested wildlife recovered in the affectedsystems according to government press releases.22 Recentstudies based on ambient water quality monitoring data havehowever highlighted the persistence of As and Ni in highconcentrations in the water column in the two years aer thedisaster.26 Many other studies also caution of the need forlonger term monitoring of affected systems for a morecomprehensive risk assessment,27 for example from the effectsof sodication of soils or slow leaching of oxyanionic contam-inants under ambient conditions.
Fluvial sediments provide a good indication of the long termexposure of a river system to both aqueous and particulatecontaminants as well as identifying sinks of contaminants thatcould be potentially remobilised to the water column in thefuture. In the aermath of major base metal mining tailingsfailures elsewhere, sediment studies have highlighted thelongevity of the pollution issues and also the timescales forrecovery of the systems. In a review of river system recovery aermajor sediment spills, Bird et al.28 highlight how local
2678 | Environ. Sci.: Processes Impacts, 2014, 16, 2677–2685
geomorphology and remedial efforts can have a major inuenceon long term sediment concentrations. In affected river systemsconned to narrow valleys, sediment metal concentrations canrapidly recover to pre-spill conditions within a year.28 However,in systems with larger oodplain systems, episodic reworking ofoodplain sediments means that sediment contamination aermajor spills can remain readily identiable 2–3 years aer themajor spill, as was highlighted in the Viseu River, Romania,aer the Baia Borsa and Novat–Rosu tailings failures in2000.28,29 Surveys of the Rıos Agrio and Guadiamar over a yearaer the Aznalcollar spill in southern Spain highlighted thesignal of the metal and sulphide-rich tailings in uvial sedi-ments30 while other studies also highlighted the bio-accumulation of As, Cd, Cu and Pb in grasses to potentially toxiclevels 18 months aer the spill.31 However in the Aznalcollarcase, the extensive removal of contaminated material fromoodplain areas is thought to have aided recovery relative toother spills.28
This study aims to assess the changes in sediment qualityacross the river systems affected by the spill, the Torna Creek,Marcal River, Raba River andMosoni-Duna, which form amajortributary of the Danube. Through comparative assessment ofsediment quality this study aims to (a) highlight the distribu-tion of any residual red mud-derived contaminants in theTorna–Marcal system, and (b) assess the effectiveness of boththe natural attenuation and remedial efforts in the system sincethe disaster.
MethodsStudy site
Sample stations along the course of the Torna Creek, Marcal,Raba and Mosoni-Duna rivers were sampled as in11 (Fig. 1).These sample locations covered reference sites on the TornaCreek (code: T2), Marcal (M1) and Raba (R1) rivers as well as 18sample stations directly affected by the spill as it propagateddownstream. Bedrock geology in the upper catchment isdominated by dolomites and limestones of Triassic age whichlie beneath a sequence of uvial marls, slates and interbeddedsands of Miocene age.32 Land use in the catchments ispredominantly agricultural with some heavy industry in thetowns of Ajka and Gy}or, while the Torna, Marcal and Raba areall extensively channelised with levees minimising the extent ofoodplain, particularly downstream of Papa.
Sediment samples
At each station triplicate bulk (z500 g) sediment samples werecollected by aggregating three randomly collected sub-samplesfrom a 12 m2 area of stream bed (9 separate locations sampledat each reach to give three replicates). Sediments were homog-enized, air-dried, disaggregated gently and sieved (2 mm aper-ture) prior to microwave-assisted total digestion (aqua regia andHF) following standard methods.33 Elemental concentrations indigests were analysed using a Perkin Elmer Elan InductivelyCoupled Plasma Optical Emission Spectrometer (Optima 5300DV ICP-OES) for all elements quoted hereaer. Selected dried
This journal is © The Royal Society of Chemistry 2014
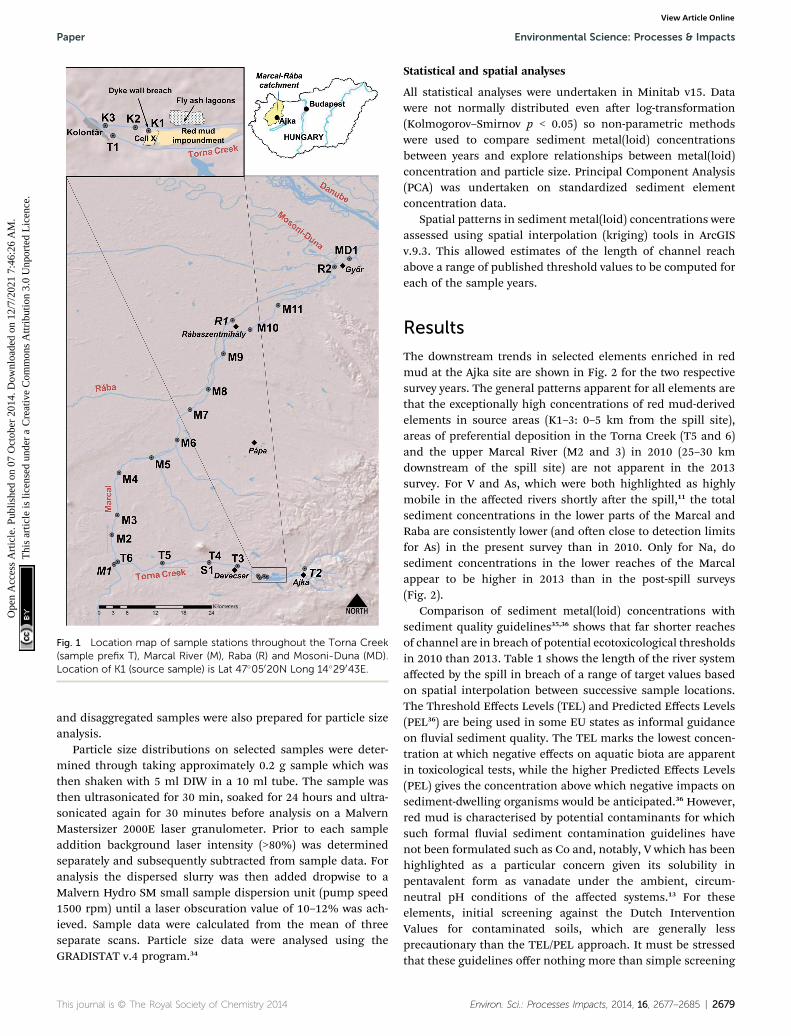
Fig. 1 Location map of sample stations throughout the Torna Creek(sample prefix T), Marcal River (M), Raba (R) and Mosoni-Duna (MD).Location of K1 (source sample) is Lat 47�05020N Long 14�29043E.
Paper Environmental Science: Processes & Impacts
Ope
n A
cces
s A
rtic
le. P
ublis
hed
on 0
7 O
ctob
er 2
014.
Dow
nloa
ded
on 1
2/7/
2021
7:4
6:26
AM
. T
his
artic
le is
lice
nsed
und
er a
Cre
ativ
e C
omm
ons
Attr
ibut
ion
3.0
Unp
orte
d L
icen
ce.
View Article Online
and disaggregated samples were also prepared for particle sizeanalysis.
Particle size distributions on selected samples were deter-mined through taking approximately 0.2 g sample which wasthen shaken with 5 ml DIW in a 10 ml tube. The sample wasthen ultrasonicated for 30 min, soaked for 24 hours and ultra-sonicated again for 30 minutes before analysis on a MalvernMastersizer 2000E laser granulometer. Prior to each sampleaddition background laser intensity (>80%) was determinedseparately and subsequently subtracted from sample data. Foranalysis the dispersed slurry was then added dropwise to aMalvern Hydro SM small sample dispersion unit (pump speed1500 rpm) until a laser obscuration value of 10–12% was ach-ieved. Sample data were calculated from the mean of threeseparate scans. Particle size data were analysed using theGRADISTAT v.4 program.34
This journal is © The Royal Society of Chemistry 2014
Statistical and spatial analyses
All statistical analyses were undertaken in Minitab v15. Datawere not normally distributed even aer log-transformation(Kolmogorov–Smirnov p < 0.05) so non-parametric methodswere used to compare sediment metal(loid) concentrationsbetween years and explore relationships between metal(loid)concentration and particle size. Principal Component Analysis(PCA) was undertaken on standardized sediment elementconcentration data.
Spatial patterns in sediment metal(loid) concentrations wereassessed using spatial interpolation (kriging) tools in ArcGISv.9.3. This allowed estimates of the length of channel reachabove a range of published threshold values to be computed foreach of the sample years.
Results
The downstream trends in selected elements enriched in redmud at the Ajka site are shown in Fig. 2 for the two respectivesurvey years. The general patterns apparent for all elements arethat the exceptionally high concentrations of red mud-derivedelements in source areas (K1–3: 0–5 km from the spill site),areas of preferential deposition in the Torna Creek (T5 and 6)and the upper Marcal River (M2 and 3) in 2010 (25–30 kmdownstream of the spill site) are not apparent in the 2013survey. For V and As, which were both highlighted as highlymobile in the affected rivers shortly aer the spill,11 the totalsediment concentrations in the lower parts of the Marcal andRaba are consistently lower (and oen close to detection limitsfor As) in the present survey than in 2010. Only for Na, dosediment concentrations in the lower reaches of the Marcalappear to be higher in 2013 than in the post-spill surveys(Fig. 2).
Comparison of sediment metal(loid) concentrations withsediment quality guidelines35,36 shows that far shorter reachesof channel are in breach of potential ecotoxicological thresholdsin 2010 than 2013. Table 1 shows the length of the river systemaffected by the spill in breach of a range of target values basedon spatial interpolation between successive sample locations.The Threshold Effects Levels (TEL) and Predicted Effects Levels(PEL36) are being used in some EU states as informal guidanceon uvial sediment quality. The TEL marks the lowest concen-tration at which negative effects on aquatic biota are apparentin toxicological tests, while the higher Predicted Effects Levels(PEL) gives the concentration above which negative impacts onsediment-dwelling organisms would be anticipated.36 However,red mud is characterised by potential contaminants for whichsuch formal uvial sediment contamination guidelines havenot been formulated such as Co and, notably, V which has beenhighlighted as a particular concern given its solubility inpentavalent form as vanadate under the ambient, circum-neutral pH conditions of the affected systems.13 For theseelements, initial screening against the Dutch InterventionValues for contaminated soils, which are generally lessprecautionary than the TEL/PEL approach. It must be stressedthat these guidelines offer nothing more than simple screening
Environ. Sci.: Processes Impacts, 2014, 16, 2677–2685 | 2679
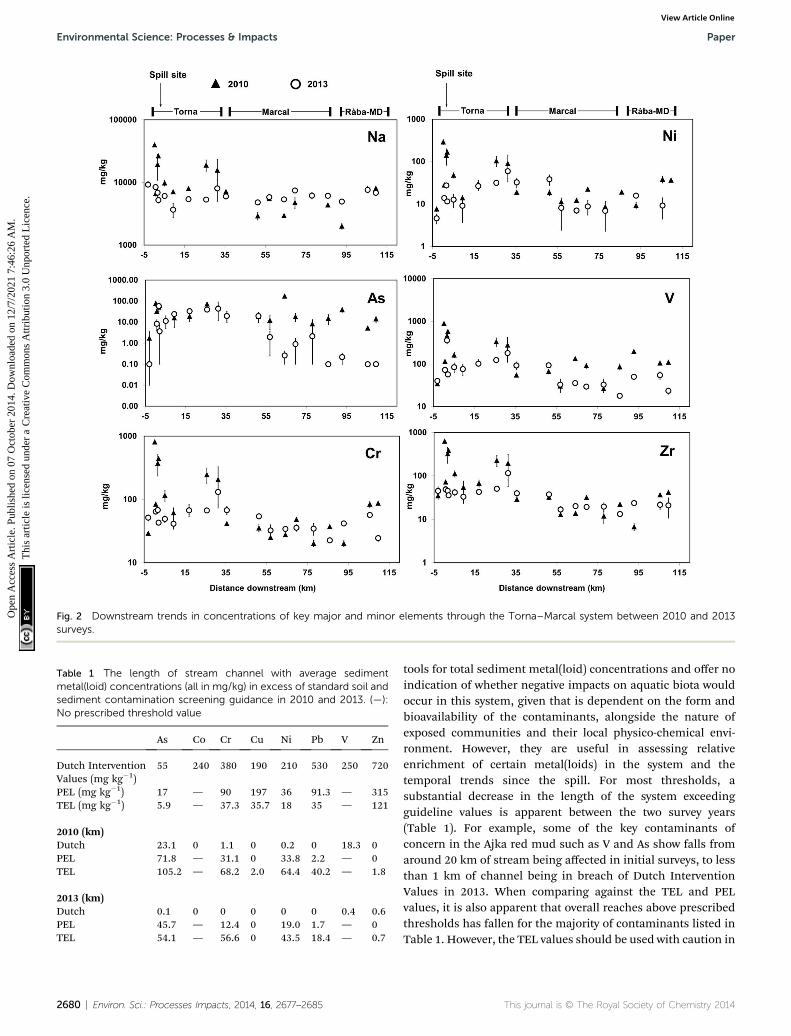
Fig. 2 Downstream trends in concentrations of key major and minor elements through the Torna–Marcal system between 2010 and 2013surveys.
Table 1 The length of stream channel with average sedimentmetal(loid) concentrations (all in mg/kg) in excess of standard soil andsediment contamination screening guidance in 2010 and 2013. (—):No prescribed threshold value
As Co Cr Cu Ni Pb V Zn
Dutch InterventionValues (mg kg�1)
55 240 380 190 210 530 250 720
PEL (mg kg�1) 17 — 90 197 36 91.3 — 315TEL (mg kg�1) 5.9 — 37.3 35.7 18 35 — 121
2010 (km)Dutch 23.1 0 1.1 0 0.2 0 18.3 0PEL 71.8 — 31.1 0 33.8 2.2 — 0TEL 105.2 — 68.2 2.0 64.4 40.2 — 1.8
2013 (km)Dutch 0.1 0 0 0 0 0 0.4 0.6PEL 45.7 — 12.4 0 19.0 1.7 — 0TEL 54.1 — 56.6 0 43.5 18.4 — 0.7
2680 | Environ. Sci.: Processes Impacts, 2014, 16, 2677–2685
Environmental Science: Processes & Impacts Paper
Ope
n A
cces
s A
rtic
le. P
ublis
hed
on 0
7 O
ctob
er 2
014.
Dow
nloa
ded
on 1
2/7/
2021
7:4
6:26
AM
. T
his
artic
le is
lice
nsed
und
er a
Cre
ativ
e C
omm
ons
Attr
ibut
ion
3.0
Unp
orte
d L
icen
ce.
View Article Online
tools for total sediment metal(loid) concentrations and offer noindication of whether negative impacts on aquatic biota wouldoccur in this system, given that is dependent on the form andbioavailability of the contaminants, alongside the nature ofexposed communities and their local physico-chemical envi-ronment. However, they are useful in assessing relativeenrichment of certain metal(loids) in the system and thetemporal trends since the spill. For most thresholds, asubstantial decrease in the length of the system exceedingguideline values is apparent between the two survey years(Table 1). For example, some of the key contaminants ofconcern in the Ajka red mud such as V and As show falls fromaround 20 km of stream being affected in initial surveys, to lessthan 1 km of channel being in breach of Dutch InterventionValues in 2013. When comparing against the TEL and PELvalues, it is also apparent that overall reaches above prescribedthresholds has fallen for the majority of contaminants listed inTable 1. However, the TEL values should be used with caution in
This journal is © The Royal Society of Chemistry 2014
Paper Environmental Science: Processes & Impacts
Ope
n A
cces
s A
rtic
le. P
ublis
hed
on 0
7 O
ctob
er 2
014.
Dow
nloa
ded
on 1
2/7/
2021
7:4
6:26
AM
. T
his
artic
le is
lice
nsed
und
er a
Cre
ativ
e C
omm
ons
Attr
ibut
ion
3.0
Unp
orte
d L
icen
ce.
View Article Online
this case, given thresholds are exceeded for As, Cr, Pb and Ni atsome of the reference sites in the system.
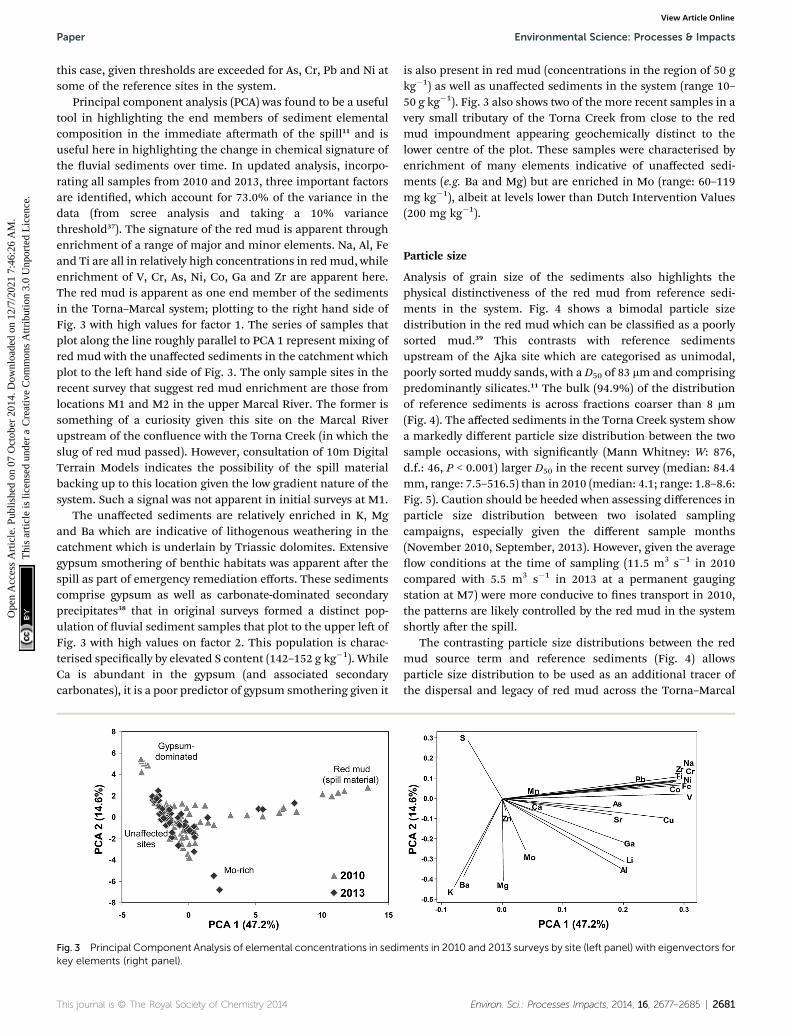
Principal component analysis (PCA) was found to be a usefultool in highlighting the end members of sediment elementalcomposition in the immediate aermath of the spill11 and isuseful here in highlighting the change in chemical signature ofthe uvial sediments over time. In updated analysis, incorpo-rating all samples from 2010 and 2013, three important factorsare identied, which account for 73.0% of the variance in thedata (from scree analysis and taking a 10% variancethreshold37). The signature of the red mud is apparent throughenrichment of a range of major and minor elements. Na, Al, Feand Ti are all in relatively high concentrations in redmud, whileenrichment of V, Cr, As, Ni, Co, Ga and Zr are apparent here.The red mud is apparent as one end member of the sedimentsin the Torna–Marcal system; plotting to the right hand side ofFig. 3 with high values for factor 1. The series of samples thatplot along the line roughly parallel to PCA 1 represent mixing ofred mud with the unaffected sediments in the catchment whichplot to the le hand side of Fig. 3. The only sample sites in therecent survey that suggest red mud enrichment are those fromlocations M1 and M2 in the upper Marcal River. The former issomething of a curiosity given this site on the Marcal Riverupstream of the conuence with the Torna Creek (in which theslug of red mud passed). However, consultation of 10m DigitalTerrain Models indicates the possibility of the spill materialbacking up to this location given the low gradient nature of thesystem. Such a signal was not apparent in initial surveys at M1.
The unaffected sediments are relatively enriched in K, Mgand Ba which are indicative of lithogenous weathering in thecatchment which is underlain by Triassic dolomites. Extensivegypsum smothering of benthic habitats was apparent aer thespill as part of emergency remediation efforts. These sedimentscomprise gypsum as well as carbonate-dominated secondaryprecipitates38 that in original surveys formed a distinct pop-ulation of uvial sediment samples that plot to the upper le ofFig. 3 with high values on factor 2. This population is charac-terised specically by elevated S content (142–152 g kg�1). WhileCa is abundant in the gypsum (and associated secondarycarbonates), it is a poor predictor of gypsum smothering given it
Fig. 3 Principal Component Analysis of elemental concentrations in sedikey elements (right panel).
This journal is © The Royal Society of Chemistry 2014
is also present in red mud (concentrations in the region of 50 gkg�1) as well as unaffected sediments in the system (range 10–50 g kg�1). Fig. 3 also shows two of the more recent samples in avery small tributary of the Torna Creek from close to the redmud impoundment appearing geochemically distinct to thelower centre of the plot. These samples were characterised byenrichment of many elements indicative of unaffected sedi-ments (e.g. Ba and Mg) but are enriched in Mo (range: 60–119mg kg�1), albeit at levels lower than Dutch Intervention Values(200 mg kg�1).
Particle size
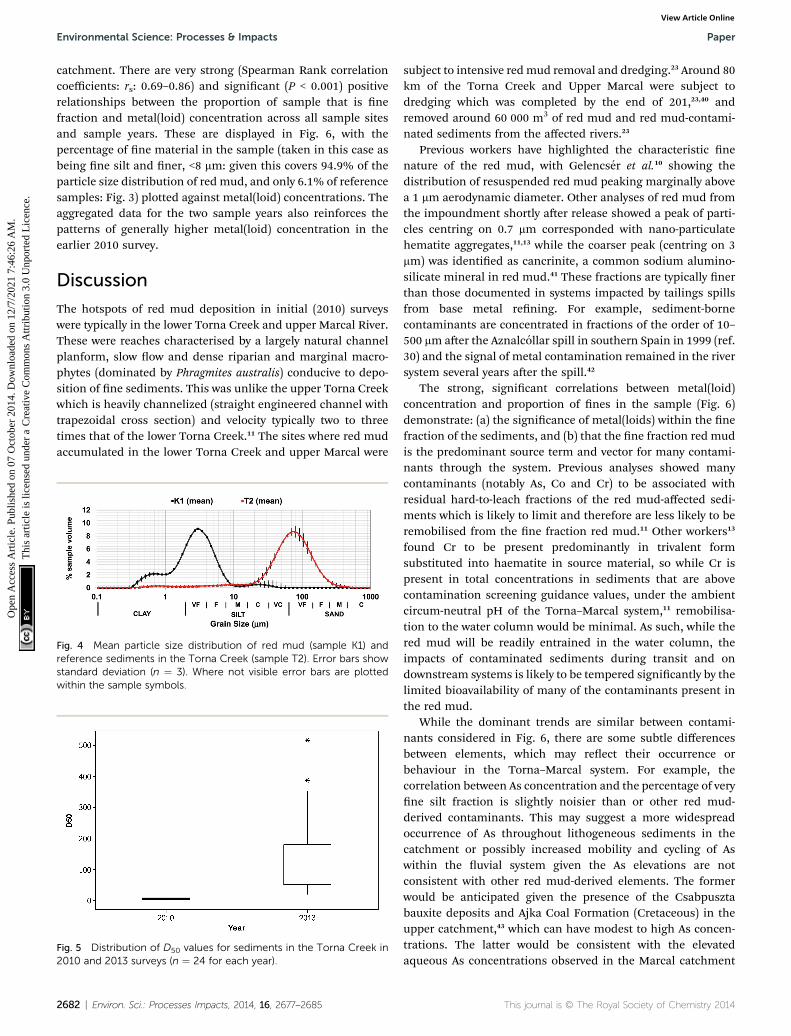
Analysis of grain size of the sediments also highlights thephysical distinctiveness of the red mud from reference sedi-ments in the system. Fig. 4 shows a bimodal particle sizedistribution in the red mud which can be classied as a poorlysorted mud.39 This contrasts with reference sedimentsupstream of the Ajka site which are categorised as unimodal,poorly sorted muddy sands, with a D50 of 83 mm and comprisingpredominantly silicates.11 The bulk (94.9%) of the distributionof reference sediments is across fractions coarser than 8 mm(Fig. 4). The affected sediments in the Torna Creek system showa markedly different particle size distribution between the twosample occasions, with signicantly (Mann Whitney: W: 876,d.f.: 46, P < 0.001) larger D50 in the recent survey (median: 84.4mm, range: 7.5–516.5) than in 2010 (median: 4.1; range: 1.8–8.6:Fig. 5). Caution should be heeded when assessing differences inparticle size distribution between two isolated samplingcampaigns, especially given the different sample months(November 2010, September, 2013). However, given the averageow conditions at the time of sampling (11.5 m3 s�1 in 2010compared with 5.5 m3 s�1 in 2013 at a permanent gaugingstation at M7) were more conducive to nes transport in 2010,the patterns are likely controlled by the red mud in the systemshortly aer the spill.
The contrasting particle size distributions between the redmud source term and reference sediments (Fig. 4) allowsparticle size distribution to be used as an additional tracer ofthe dispersal and legacy of red mud across the Torna–Marcal
ments in 2010 and 2013 surveys by site (left panel) with eigenvectors for
Environ. Sci.: Processes Impacts, 2014, 16, 2677–2685 | 2681
Environmental Science: Processes & Impacts Paper
Ope
n A
cces
s A
rtic
le. P
ublis
hed
on 0
7 O
ctob
er 2
014.
Dow
nloa
ded
on 1
2/7/
2021
7:4
6:26
AM
. T
his
artic
le is
lice
nsed
und
er a
Cre
ativ
e C
omm
ons
Attr
ibut
ion
3.0
Unp
orte
d L
icen
ce.
View Article Online
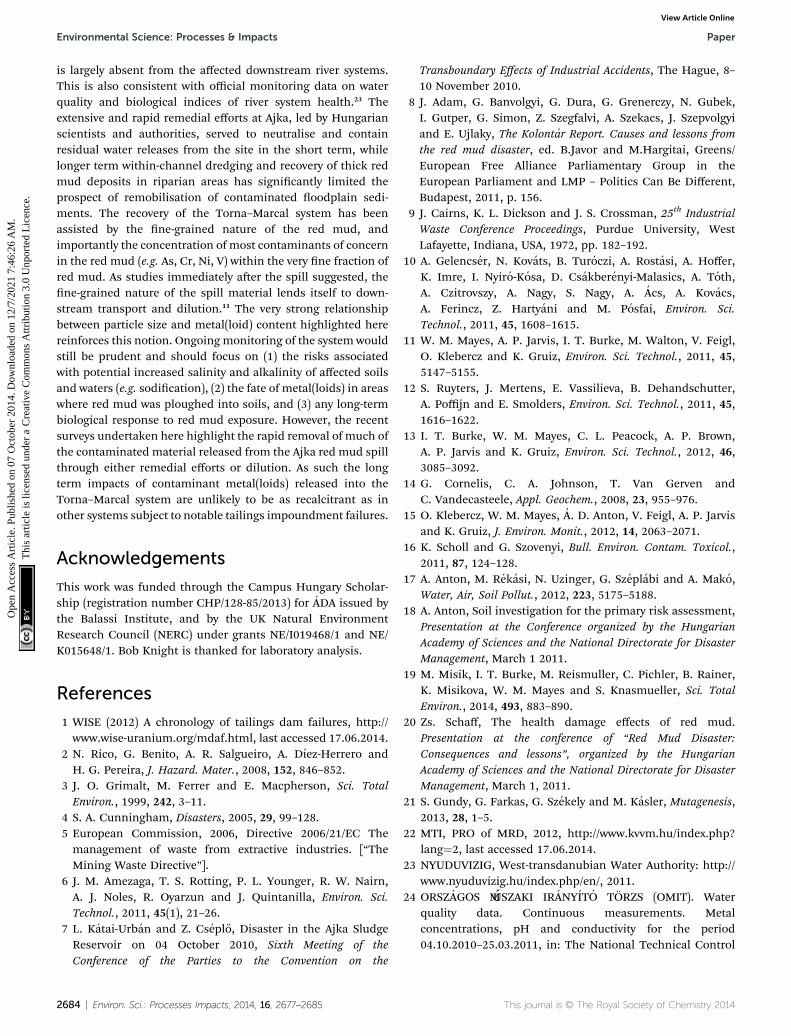
catchment. There are very strong (Spearman Rank correlationcoefficients: rs: 0.69–0.86) and signicant (P < 0.001) positiverelationships between the proportion of sample that is nefraction and metal(loid) concentration across all sample sitesand sample years. These are displayed in Fig. 6, with thepercentage of ne material in the sample (taken in this case asbeing ne silt and ner, <8 mm: given this covers 94.9% of theparticle size distribution of red mud, and only 6.1% of referencesamples: Fig. 3) plotted against metal(loid) concentrations. Theaggregated data for the two sample years also reinforces thepatterns of generally higher metal(loid) concentration in theearlier 2010 survey.
Discussion
The hotspots of red mud deposition in initial (2010) surveyswere typically in the lower Torna Creek and upper Marcal River.These were reaches characterised by a largely natural channelplanform, slow ow and dense riparian and marginal macro-phytes (dominated by Phragmites australis) conducive to depo-sition of ne sediments. This was unlike the upper Torna Creekwhich is heavily channelized (straight engineered channel withtrapezoidal cross section) and velocity typically two to threetimes that of the lower Torna Creek.11 The sites where red mudaccumulated in the lower Torna Creek and upper Marcal were
Fig. 5 Distribution of D50 values for sediments in the Torna Creek in2010 and 2013 surveys (n ¼ 24 for each year).
Fig. 4 Mean particle size distribution of red mud (sample K1) andreference sediments in the Torna Creek (sample T2). Error bars showstandard deviation (n ¼ 3). Where not visible error bars are plottedwithin the sample symbols.
2682 | Environ. Sci.: Processes Impacts, 2014, 16, 2677–2685
subject to intensive redmud removal and dredging.23 Around 80km of the Torna Creek and Upper Marcal were subject todredging which was completed by the end of 201,23,40 andremoved around 60 000 m3 of red mud and red mud-contami-nated sediments from the affected rivers.23
Previous workers have highlighted the characteristic nenature of the red mud, with Gelencser et al.10 showing thedistribution of resuspended red mud peaking marginally abovea 1 mm aerodynamic diameter. Other analyses of red mud fromthe impoundment shortly aer release showed a peak of parti-cles centring on 0.7 mm corresponded with nano-particulatehematite aggregates,11,13 while the coarser peak (centring on 3mm) was identied as cancrinite, a common sodium alumino-silicate mineral in red mud.41 These fractions are typically nerthan those documented in systems impacted by tailings spillsfrom base metal rening. For example, sediment-bornecontaminants are concentrated in fractions of the order of 10–500 mm aer the Aznalcollar spill in southern Spain in 1999 (ref.30) and the signal of metal contamination remained in the riversystem several years aer the spill.42
The strong, signicant correlations between metal(loid)concentration and proportion of nes in the sample (Fig. 6)demonstrate: (a) the signicance of metal(loids) within the nefraction of the sediments, and (b) that the ne fraction red mudis the predominant source term and vector for many contami-nants through the system. Previous analyses showed manycontaminants (notably As, Co and Cr) to be associated withresidual hard-to-leach fractions of the red mud-affected sedi-ments which is likely to limit and therefore are less likely to beremobilised from the ne fraction red mud.11 Other workers13
found Cr to be present predominantly in trivalent formsubstituted into haematite in source material, so while Cr ispresent in total concentrations in sediments that are abovecontamination screening guidance values, under the ambientcircum-neutral pH of the Torna–Marcal system,11 remobilisa-tion to the water column would be minimal. As such, while thered mud will be readily entrained in the water column, theimpacts of contaminated sediments during transit and ondownstream systems is likely to be tempered signicantly by thelimited bioavailability of many of the contaminants present inthe red mud.
While the dominant trends are similar between contami-nants considered in Fig. 6, there are some subtle differencesbetween elements, which may reect their occurrence orbehaviour in the Torna–Marcal system. For example, thecorrelation between As concentration and the percentage of veryne silt fraction is slightly noisier than or other red mud-derived contaminants. This may suggest a more widespreadoccurrence of As throughout lithogeneous sediments in thecatchment or possibly increased mobility and cycling of Aswithin the uvial system given the As elevations are notconsistent with other red mud-derived elements. The formerwould be anticipated given the presence of the Csabpusztabauxite deposits and Ajka Coal Formation (Cretaceous) in theupper catchment,43 which can have modest to high As concen-trations. The latter would be consistent with the elevatedaqueous As concentrations observed in the Marcal catchment
This journal is © The Royal Society of Chemistry 2014
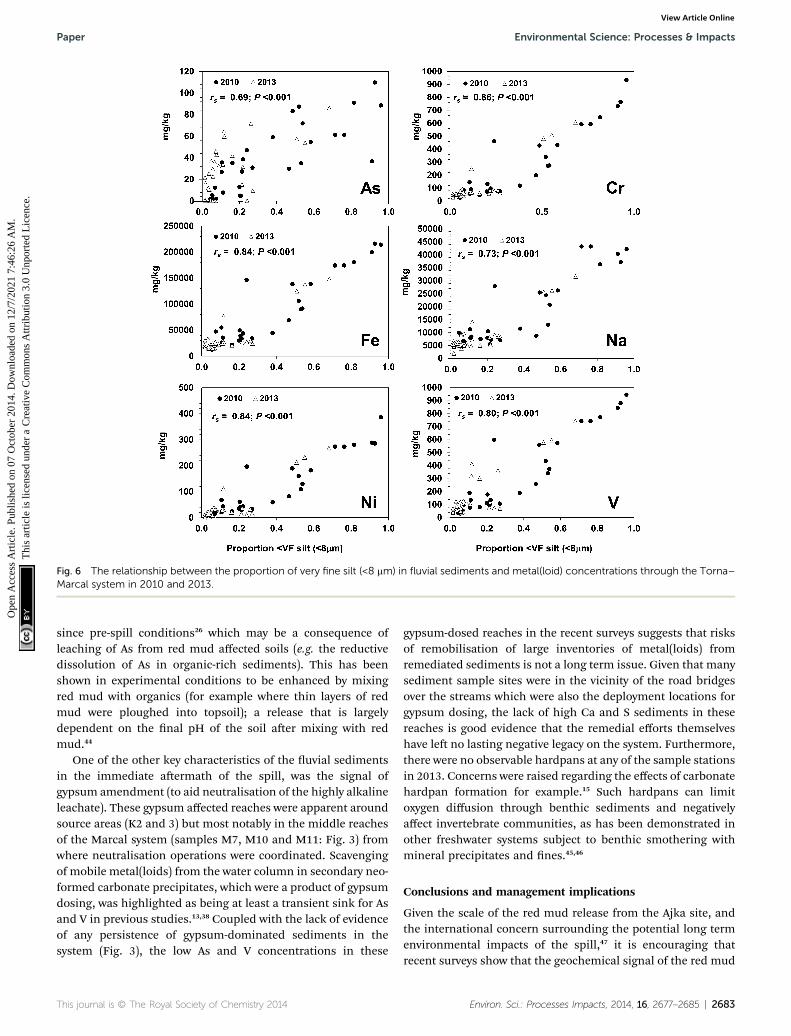
Fig. 6 The relationship between the proportion of very fine silt (<8 mm) in fluvial sediments and metal(loid) concentrations through the Torna–Marcal system in 2010 and 2013.
Paper Environmental Science: Processes & Impacts
Ope
n A
cces
s A
rtic
le. P
ublis
hed
on 0
7 O
ctob
er 2
014.
Dow
nloa
ded
on 1
2/7/
2021
7:4
6:26
AM
. T
his
artic
le is
lice
nsed
und
er a
Cre
ativ
e C
omm
ons
Attr
ibut
ion
3.0
Unp
orte
d L
icen
ce.
View Article Online
since pre-spill conditions26 which may be a consequence ofleaching of As from red mud affected soils (e.g. the reductivedissolution of As in organic-rich sediments). This has beenshown in experimental conditions to be enhanced by mixingred mud with organics (for example where thin layers of redmud were ploughed into topsoil); a release that is largelydependent on the nal pH of the soil aer mixing with redmud.44
One of the other key characteristics of the uvial sedimentsin the immediate aermath of the spill, was the signal ofgypsum amendment (to aid neutralisation of the highly alkalineleachate). These gypsum affected reaches were apparent aroundsource areas (K2 and 3) but most notably in the middle reachesof the Marcal system (samples M7, M10 and M11: Fig. 3) fromwhere neutralisation operations were coordinated. Scavengingof mobile metal(loids) from the water column in secondary neo-formed carbonate precipitates, which were a product of gypsumdosing, was highlighted as being at least a transient sink for Asand V in previous studies.13,38 Coupled with the lack of evidenceof any persistence of gypsum-dominated sediments in thesystem (Fig. 3), the low As and V concentrations in these
This journal is © The Royal Society of Chemistry 2014
gypsum-dosed reaches in the recent surveys suggests that risksof remobilisation of large inventories of metal(loids) fromremediated sediments is not a long term issue. Given that manysediment sample sites were in the vicinity of the road bridgesover the streams which were also the deployment locations forgypsum dosing, the lack of high Ca and S sediments in thesereaches is good evidence that the remedial efforts themselveshave le no lasting negative legacy on the system. Furthermore,there were no observable hardpans at any of the sample stationsin 2013. Concerns were raised regarding the effects of carbonatehardpan formation for example.15 Such hardpans can limitoxygen diffusion through benthic sediments and negativelyaffect invertebrate communities, as has been demonstrated inother freshwater systems subject to benthic smothering withmineral precipitates and nes.45,46
Conclusions and management implications
Given the scale of the red mud release from the Ajka site, andthe international concern surrounding the potential long termenvironmental impacts of the spill,47 it is encouraging thatrecent surveys show that the geochemical signal of the red mud
Environ. Sci.: Processes Impacts, 2014, 16, 2677–2685 | 2683
Environmental Science: Processes & Impacts Paper
Ope
n A
cces
s A
rtic
le. P
ublis
hed
on 0
7 O
ctob
er 2
014.
Dow
nloa
ded
on 1
2/7/
2021
7:4
6:26
AM
. T
his
artic
le is
lice
nsed
und
er a
Cre
ativ
e C
omm
ons
Attr
ibut
ion
3.0
Unp
orte
d L
icen
ce.
View Article Online
is largely absent from the affected downstream river systems.This is also consistent with official monitoring data on waterquality and biological indices of river system health.23 Theextensive and rapid remedial efforts at Ajka, led by Hungarianscientists and authorities, served to neutralise and containresidual water releases from the site in the short term, whilelonger term within-channel dredging and recovery of thick redmud deposits in riparian areas has signicantly limited theprospect of remobilisation of contaminated oodplain sedi-ments. The recovery of the Torna–Marcal system has beenassisted by the ne-grained nature of the red mud, andimportantly the concentration of most contaminants of concernin the red mud (e.g. As, Cr, Ni, V) within the very ne fraction ofred mud. As studies immediately aer the spill suggested, thene-grained nature of the spill material lends itself to down-stream transport and dilution.11 The very strong relationshipbetween particle size and metal(loid) content highlighted herereinforces this notion. Ongoing monitoring of the system wouldstill be prudent and should focus on (1) the risks associatedwith potential increased salinity and alkalinity of affected soilsand waters (e.g. sodication), (2) the fate of metal(loids) in areaswhere red mud was ploughed into soils, and (3) any long-termbiological response to red mud exposure. However, the recentsurveys undertaken here highlight the rapid removal of much ofthe contaminated material released from the Ajka red mud spillthrough either remedial efforts or dilution. As such the longterm impacts of contaminant metal(loids) released into theTorna–Marcal system are unlikely to be as recalcitrant as inother systems subject to notable tailings impoundment failures.
Acknowledgements
This work was funded through the Campus Hungary Scholar-ship (registration number CHP/128-85/2013) for ADA issued bythe Balassi Institute, and by the UK Natural EnvironmentResearch Council (NERC) under grants NE/I019468/1 and NE/K015648/1. Bob Knight is thanked for laboratory analysis.
References
1 WISE (2012) A chronology of tailings dam failures, http://www.wise-uranium.org/mdaf.html, last accessed 17.06.2014.
2 N. Rico, G. Benito, A. R. Salgueiro, A. Dıez-Herrero andH. G. Pereira, J. Hazard. Mater., 2008, 152, 846–852.
3 J. O. Grimalt, M. Ferrer and E. Macpherson, Sci. TotalEnviron., 1999, 242, 3–11.
4 S. A. Cunningham, Disasters, 2005, 29, 99–128.5 European Commission, 2006, Directive 2006/21/EC Themanagement of waste from extractive industries. [“TheMining Waste Directive”].
6 J. M. Amezaga, T. S. Rotting, P. L. Younger, R. W. Nairn,A. J. Noles, R. Oyarzun and J. Quintanilla, Environ. Sci.Technol., 2011, 45(1), 21–26.
7 L. Katai-Urban and Z. Csepl}o, Disaster in the Ajka SludgeReservoir on 04 October 2010, Sixth Meeting of theConference of the Parties to the Convention on the
2684 | Environ. Sci.: Processes Impacts, 2014, 16, 2677–2685
Transboundary Effects of Industrial Accidents, The Hague, 8–10 November 2010.
8 J. Adam, G. Banvolgyi, G. Dura, G. Grenerczy, N. Gubek,I. Gutper, G. Simon, Z. Szegfalvi, A. Szekacs, J. Szepvolgyiand E. Ujlaky, The Kolontar Report. Causes and lessons fromthe red mud disaster, ed. B.Javor and M.Hargitai, Greens/European Free Alliance Parliamentary Group in theEuropean Parliament and LMP – Politics Can Be Different,Budapest, 2011, p. 156.
9 J. Cairns, K. L. Dickson and J. S. Crossman, 25th IndustrialWaste Conference Proceedings, Purdue University, WestLafayette, Indiana, USA, 1972, pp. 182–192.
10 A. Gelencser, N. Kovats, B. Turoczi, A. Rostasi, A. Hoffer,K. Imre, I. Nyiro-Kosa, D. Csakberenyi-Malasics, A. Toth,A. Czitrovszy, A. Nagy, S. Nagy, A. Acs, A. Kovacs,A. Ferincz, Z. Hartyani and M. Posfai, Environ. Sci.Technol., 2011, 45, 1608–1615.
11 W. M. Mayes, A. P. Jarvis, I. T. Burke, M. Walton, V. Feigl,O. Klebercz and K. Gruiz, Environ. Sci. Technol., 2011, 45,5147–5155.
12 S. Ruyters, J. Mertens, E. Vassilieva, B. Dehandschutter,A. Poffijn and E. Smolders, Environ. Sci. Technol., 2011, 45,1616–1622.
13 I. T. Burke, W. M. Mayes, C. L. Peacock, A. P. Brown,A. P. Jarvis and K. Gruiz, Environ. Sci. Technol., 2012, 46,3085–3092.
14 G. Cornelis, C. A. Johnson, T. Van Gerven andC. Vandecasteele, Appl. Geochem., 2008, 23, 955–976.
15 O. Klebercz, W. M. Mayes, A. D. Anton, V. Feigl, A. P. Jarvisand K. Gruiz, J. Environ. Monit., 2012, 14, 2063–2071.
16 K. Scholl and G. Szovenyi, Bull. Environ. Contam. Toxicol.,2011, 87, 124–128.
17 A. Anton, M. Rekasi, N. Uzinger, G. Szeplabi and A. Mako,Water, Air, Soil Pollut., 2012, 223, 5175–5188.
18 A. Anton, Soil investigation for the primary risk assessment,Presentation at the Conference organized by the HungarianAcademy of Sciences and the National Directorate for DisasterManagement, March 1 2011.
19 M. Misik, I. T. Burke, M. Reismuller, C. Pichler, B. Rainer,K. Misikova, W. M. Mayes and S. Knasmueller, Sci. TotalEnviron., 2014, 493, 883–890.
20 Zs. Schaff, The health damage effects of red mud.Presentation at the conference of “Red Mud Disaster:Consequences and lessons”, organized by the HungarianAcademy of Sciences and the National Directorate for DisasterManagement, March 1, 2011.
21 S. Gundy, G. Farkas, G. Szekely and M. Kasler, Mutagenesis,2013, 28, 1–5.
22 MTI, PRO of MRD, 2012, http://www.kvvm.hu/index.php?lang¼2, last accessed 17.06.2014.
23 NYUDUVIZIG, West-transdanubian Water Authority: http://www.nyuduvizig.hu/index.php/en/, 2011.
24 ORSZAGOS M�U�SZAKI IRANYITO TORZS (OMIT). Waterquality data. Continuous measurements. Metalconcentrations, pH and conductivity for the period04.10.2010–25.03.2011, in: The National Technical Control
This journal is © The Royal Society of Chemistry 2014
Paper Environmental Science: Processes & Impacts
Ope
n A
cces
s A
rtic
le. P
ublis
hed
on 0
7 O
ctob
er 2
014.
Dow
nloa
ded
on 1
2/7/
2021
7:4
6:26
AM
. T
his
artic
le is
lice
nsed
und
er a
Cre
ativ
e C
omm
ons
Attr
ibut
ion
3.0
Unp
orte
d L
icen
ce.
View Article Online
Body (OMIT) and Central Directorate for Water andEnvironment (ed). Budapest, 2011.
25 Z. Kovacs, T. Yuzhakova, J. Lako, E. Domokos, R. Kurdi,E. Horvath, A. Utasi, V. Vincze-Csom, I. Raduly, L. Radulyand A. Redey, Water monitoring following the Hungarianred mud disaster, Environ. Eng. Manage. J., 2012, 11, 2047–2051.
26 A. S. Nagy, J. Szabo and I. Vass, Environ. Sci. Pollut. Res., 2013,20, 7603–7614.
27 K. Gruiz, E. Vaszita, V. Feigl, E. Ujaczki, O. Klebercz,A. Anton, Proceedings of AQUACONSOIL, 2013, 12thInternational UFZ-Deltares Conference on Groundwater-Soil-Systems and Water Resources Management, Barcelona,Spain, 16–19/04/2013, 2013.
28 G. Bird, P. A. Brewer, M. G. Macklin, M. Serban, D. Balteanu,B. Driga and S. Zaharia, Appl. Geochem., 2008, 23, 3498–3518.
29 M. G. Macklin, P. A. Brewer, D. Balteanu, T. J. Coulthard,B. Driga, A. J. Howard and S. Zaharia, Appl. Geochem.,2003, 18, 241–257.
30 K. A. Hudson-Edwards, M. G. Macklin, H. E. Jamieson,P. A. Brewer, T. J. Coulthard, A. J. Howard and N. Turner,Appl. Geochem., 2003, 18, 221–239.
31 P. Madejon, J. M. Murillo, T. Maranon, F. Cabrera andR. Lopez, Sci. Total Environ., 2002, 290, 105–120.
32 H. J. Reeves, G. Wealthall, P. L. Younger, Advisory visit to thebauxite processing tailings dam near Ajka, Vesprem County,western Hungary, British Geological Survey, Keyworth, UK,Open Report OR/11/006, 2011.
33 USEPA, Microwave assisted acid digestion of siliceous andorganically based matrices, USEPA Method 2052, 1996.
34 S. J. Blott and K. Pye, Earth Surf. Processes Landforms, 2001,26, 1237–1248.
This journal is © The Royal Society of Chemistry 2014
35 The Ministry of Housing, Spatial Planning andEnvironment, Intervention values and target values–soilquality standards, Directorate-General for EnvironmentalProtection Department of Soil Protection (625), Rijnstraat,P.O.Box 30945; 2500 GX, The Hague, The Netherlands, 2012.
36 M. F. Buchman, NOAA Screening Quick Reference Tables,NOAA HAZMAT Report 99–1, Coastal Protection andRestoration Division, National Oceanic and AtmosphericAdministration, Seattle WA, 1999, p. 12.
37 J. Fowler, L. Cohen, P. Jarvis, Practical statistics for eldbiology. John Wiley, Chichester, UK, 1998.
38 P. Renforth, W. M. Mayes, A. P. Jarvis, I. T. Burke,D. A. C. Manning and K. Gruiz, Sci. Total Environ., 2012,421–422, 253–259.
39 C. K. Wentworth, J. Geol., 1922, 30, 377–392.40 L. Kepli, in European Ecocycles Conference, Palermo, Italy,
2013.41 M. Grafe, G. Power and C. Klauber, Hydrometallurgy, 2011,
108, 60–79.42 M. Martinez-Haro, M. A. Taggart, H. Lefranc, R. C. Martın-
Doimeadios and A. J. Green, PLoS One, 2013, 8, e57295,DOI: 10.1371/journal.pone.0057295.
43 J. Kalmar and J. Knauer, Annual Report of the GeologicalInstitute of Hungary, 1994-1995, 2000, pp. 83–91.
44 A. P. Lehoux, C. L. Lockwood, W. M. Mayes, D. I. Stewart,R. J. G. Mortimer, K. Gruiz and I. T. Burke, Environ.Geochem. Health, 2013, 35, 643–656.
45 A. P. Jarvis and P. L. Younger, Chem. Ecol., 1996, 13, 249–270.46 S. L. Hull, U. V. Oty and W. M. Mayes, Hydrobiologia, 2014,
736, 83–97.47 K. Bachmann, Osteuropa, 2012, 60, 51–58.
Environ. Sci.: Processes Impacts, 2014, 16, 2677–2685 | 2685