Embed Size (px)
Citation preview
BioMed CentralBMC Genetics
ss
Open AcceResearch articleIdentification and characterisation of novel SNP markers in Atlantic cod: Evidence for directional selectionThomas Moen*1,2, Ben Hayes1,2, Frank Nilsen3,4, Madjid Delghandi5, Kjersti T Fjalestad5, Svein-Erik Fevolden6, Paul R Berg2,7 and Sigbjørn Lien2,7Address: 1AKVAFORSK – Institute of Aquaculture Research, Ås, Norway, 2CIGENE – Centre of Integrative Genetics, Ås, Norway, 3Institute of Marine Research, Bergen, Norway, 4Department of Biology, University of Bergen, Bergen, Norway, 5Norwegian Institute of Fisheries and Aquaculture Research, Tromsø, Norway, 6Norwegian College of Fishery Science, University of Tromsø, Tromsø, Norway and 7Norwegian University of Life Science, Ås, Norway
Email: Thomas Moen* - [email protected]; Ben Hayes - [email protected]; Frank Nilsen - [email protected]; Madjid Delghandi - [email protected]; Kjersti T Fjalestad - [email protected]; Svein-Erik Fevolden - [email protected]; Paul R Berg - [email protected]; Sigbjørn Lien - [email protected]
* Corresponding author
AbstractBackground: The Atlantic cod (Gadus morhua) is a groundfish of great economic value in fisheriesand an emerging species in aquaculture. Genetic markers are needed to identify wild stocks inorder to ensure sustainable management, and for marker-assisted selection and pedigreedetermination in aquaculture. Here, we report on the development and evaluation of a largenumber of Single Nucleotide Polymorphism (SNP) markers from the alignment of ExpressedSequence Tag (EST) sequences in Atlantic cod. We also present basic population parameters of theSNPs in samples of North-East Arctic cod and Norwegian coastal cod obtained from three differentlocalities, and test for SNPs that may have been targeted by natural selection.
Results: A total of 17,056 EST sequences were used to find 724 putative SNPs, from which 318segregating SNPs were isolated. The SNPs were tested on Atlantic cod from four different sites,comprising both North-East Arctic cod (NEAC) and Norwegian coastal cod (NCC). The averageheterozygosity of the SNPs was 0.25 and the average minor allele frequency was 0.18. FST valueswere highly variable, with the majority of SNPs displaying very little differentiation while others hadFST values as high as 0.83. The FST values of 29 SNPs were found to be larger than expected undera strictly neutral model, suggesting that these loci are, or have been, influenced by natural selection.For the majority of these outlier SNPs, allele frequencies in a northern sample of NCC wereintermediate between allele frequencies in a southern sample of NCC and a sample of NEAC,indicating a cline in allele frequencies similar to that found at the Pantophysin I locus.
Conclusion: The SNP markers presented here are powerful tools for future genetics workrelated to management and aquaculture. In particular, some SNPs exhibiting high levels ofpopulation divergence have potential to significantly enhance studies on the population structureof Atlantic cod.
Published: 26 February 2008
BMC Genetics 2008, 9:18 doi:10.1186/1471-2156-9-18
Received: 28 June 2007Accepted: 26 February 2008
This article is available from: http://www.biomedcentral.com/1471-2156/9/18
© 2008 Moen et al; licensee BioMed Central Ltd. This is an Open Access article distributed under the terms of the Creative Commons Attribution License (http://creativecommons.org/licenses/by/2.0), which permits unrestricted use, distribution, and reproduction in any medium, provided the original work is properly cited.
Page 1 of 9(page number not for citation purposes)

BMC Genetics 2008, 9:18 http://www.biomedcentral.com/1471-2156/9/18
BackgroundThe Atlantic cod (Gadus morhua L) is a well-known teleostinhabiting the Atlantic Ocean from North Carolina toGreenland in the west, and from the Bay of Biscay to theArctic Ocean in the east. Atlantic cod supports a commer-cially important fishery [1]. However, in recent decadesstocks have declined dramatically, particularly in theNorth-Western Atlantic (reviewed in [2]). The species ispresently an attractive candidate for aquaculture, withcommercial farming already taking place in Norway, Can-ada, and Scotland.
Genetic markers are imperative for proper management ofcod and for cod aquaculture, as well as for ensuring a sus-tainable coexistence of wild and farmed stocks. There is aneed for genetic markers for refining the stock structureand assigning fish to populations [3,4]. Today, manage-ment is primarily area-based and tends not to take intoaccount the existence of genetically distinct stocks withdifferent life history traits in a given area. In aquaculture,markers are needed for the mapping of genes or Quantita-tive Trait Loci (QTL) influencing commercially importanttraits, and for pedigree tracking or testing. Thus far themost widely used genetic markers for Atlantic cod havebeen limited numbers of allozymes [5], Restriction Frag-ment Length Polymorphisms (RFLPs) [6], and microsatel-lites [7-12].
The largest population of Atlantic cod at present is theNorth-East Arctic cod population (NEAC) [13], located inthe Barents Sea area. Although the feeding grounds are off-shore in the Barents Sea, the NEAC spawns along the Nor-wegian coast, particularly in the Lofoten and Vesterålenregion. Thus, NEAC may at times be found in areas whichare also inhabited by the more stationary Norwegiancoastal cod (NCC). A long-lasting controversy has beenfocused on whether NEAC and NCC are environmentallyselected groups from the same gene pool, separate popu-lations, or even siblings species [14-16]. Differencesbetween NEAC and NCC has predominantly been foundfor blood type E [17-19], the haemoglobin (Hb-I) alleles[17-22], the pantophysin (Pan I) locus [14,15], and atsome microsatellite loci [4,16]. Little or no genetic differ-ences have been detected at most allozyme- [5,21,23] andmicrosatellite loci [4,16] or at the mitochondrial cyto-chrome b locus [24]. At the Pan I locus, NEAC predomi-nantly have the Pan IB allele (> 90%), whereas NCC havepredominantly the Pan IA allele [15].
Expressed Sequence Tag (EST) sequences are very usefulresources in genomics, and can be used for the detectionof Single Nucleotide Polymorphism (SNP) markers [25].SNPs are by far the most abundant type of genetic poly-morphism, and using SNPs is the only option for con-structing very high-density marker maps and cost-efficient
high-throughput genotyping. In the present study, weused EST sequences from Atlantic cod to identify SNPsthat were subsequently assayed for allelic variation in 95specimens of Atlantic cod (NEAC and NCC) sampledfrom the wild-caught base population of a breeding pro-gramme run by the Norwegian Institute of Fisheries andAquaculture Research [26].
Results and DiscussionSNP detectionA total of 17,056 EST sequences were aligned and used todetect SNPs. The ESTs were 5' sequences representingeight different cDNA libraries with five to several hundredanimals per library. The average sequence length was 508± 137 bp (SD). The alignment of ESTs produced 1186contigs and 207 single sequences (Table 1). Seven hun-dred and twenty-four putative SNPs were found, distrib-uted on 415 contigs. The contigs having candidate SNPsconsisted of two to 11 EST sequences.
SNP validationAssays were successfully developed for 648 of the 724putative SNPs. Five hundred and ninety-four of these 648SNPs were genotyped on a collection of Atlantic cod sam-pled at four different locations; one site populated prima-rily by NEAC, one northern (NCC-N) and two southern(NCC-S1 and NCC-S2) sites populated primarily by NCC(Figure 1, Table 2). NCC-S1 and NCC-S2 were found notto be significantly different from one another (pairwiseFST = 0.013, p-value = 0.074), and are hereafter treated asone population, termed NCC-S. The animals that weregenotyped had been preselected from larger samplesbased on their Pan I genotype. Thus, all NEAC were PanIBB and all NCC were Pan IAA.
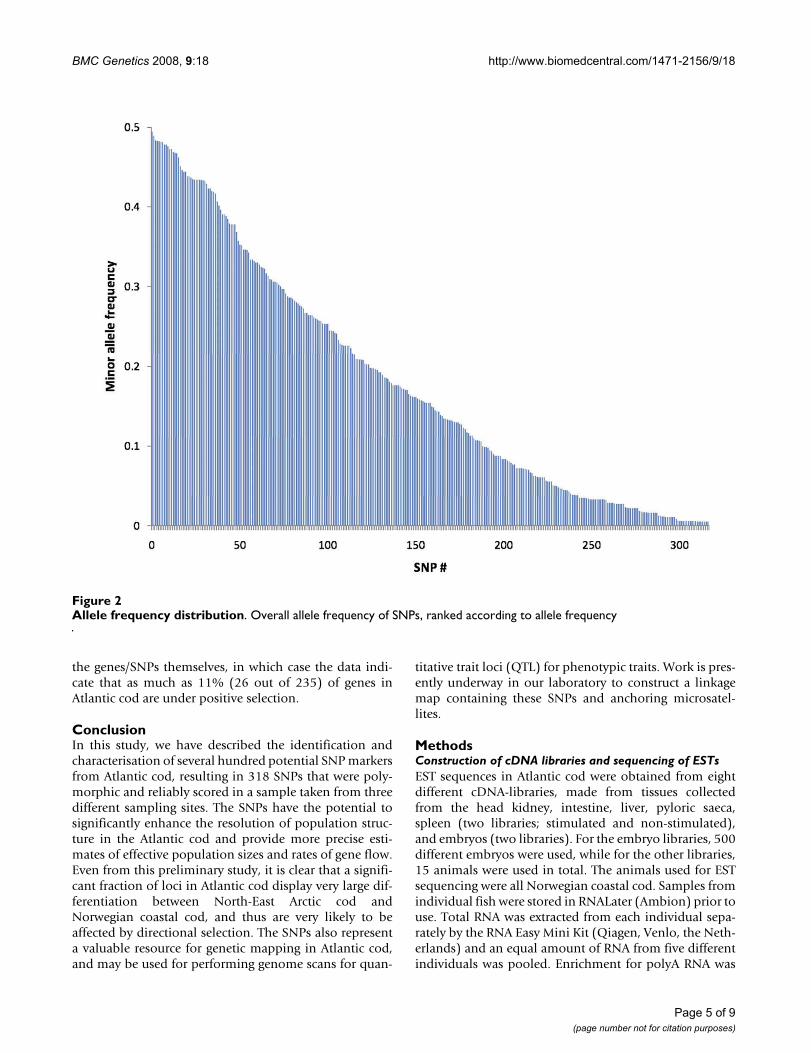
Twenty-nine percent of the genotyped SNPs failed toamplify or did not cluster well according to genotype andwere considered "failed assays", 2% were heterozygous inall animals and were thus assumed to represent dupli-cated genes, 15% were homozygous in all animals, while54% were polymorphic and reliably scored (Table 3). The318 polymorphic SNPs represented 235 contigs, with oneto five SNPs per contig (Table 3). The mean minor allelefrequency among the polymorphic SNPs was 0.18 ± 0.15(SD) (Figure 2), while the mean overall heterozygositywas 0.25 ± 0.17 (SD). When homozygous SNPs wereincluded, the heterozygosity was 0.19 ± 0.18 (SD). Thetrue heterozygosity of real SNPs in the data set is likely tolie somewhere in between these two estimates, since wecould not distinguish real SNPs that were homozygous inour material from loci that had falsely been identified asputative SNPs.
Page 2 of 9(page number not for citation purposes)

BMC Genetics 2008, 9:18 http://www.biomedcentral.com/1471-2156/9/18
SNP annotationAnnotation using BLASTN and BLASTX gave significanthits for all but 73 of the 594 genotyped SNPs. Synony-mous/non-synonymous status of SNPs could be deter-mined for 77 of 594 SNPs; the remaining 517 were eitherlocated outside coding regions, or the correspondinggenes had not been annotated. The overall ratio of synon-ymous to non-synonymous SNPs was 0.44, which agreeswell with results from other species. For example, Cargillet al. [27] and Lee et al. [28] reported the synonymous-to-total ratio to be 0.47 and 0.45 in humans and cattle,respectively. The annotations of those contigs that con-tained true SNPs are given in Additional file 1.
Population assignmentSince animals had been assigned to populations based ongenotypes at Pan I, we wanted to test for animals thatmight have been misclassified as NEAC, NCC-N, or NCC-S. The assignment test reassigned three animals in theNEAC sample to NCC-N, and one animal in NCC-N toNEAC. These four animals were culled from further anal-ysis. The three misclassified animals from the NEAC sam-ple had caused significant deviations from Hardy-Weinberg equilibrium (HWE) at individual markers withlarge FST-values, indicating that a few high-FST SNPs couldbe sufficient to substantially improve the accuracy of
NEAC/NCC assignments compared to assignment withPan I alone.
Hardy-Weinberg equilibriumAfter culling of misclassified animals, the fraction of pol-ymorphic SNPs that were not in Hardy-Weinberg Equilib-rium (HWE) (P < 0.05) was 0.10 for NEAC, 0.04 for NCC-N, and 0.09 for NCC-S, i.e. slightly higher than expectedby chance. Four SNPs, Gm376_0668, Gm0927_0134,Gm0786_0527, and Gm392_1244, were out of HWE inall three populations, while 12 other SNPs were out ofHWE in two populations [see Additional file 1]. Devia-tions from HWE could be due to genotyping errors or biasin the identities of uncalled genotypes. However, geno-types of SNPs out of HWE in one or more populations hadbeen carefully double-checked, and the fraction of mark-ers out of HWE were not changed significantly by remov-ing markers with call rates < 0.90, indicating thatgenotyping error is not likely to be the only cause of devi-ations from HWE in the data set.
Population comparisonsWe wanted to investigate the potential of the SNP markersfor discriminating different populations of Atlantic cod,in particular NEAC versus NCC, using the SNP genotypesdescribed above. The mean pair-wise FST-values were0.057 and 0.024 for NEAC – NCC-N and NCC-N – NCC-
Table 1: Summary of contig assembly from ESTs
EST sequences 17,056Putative transcripts 1,393
Singletons 207Contigs 1,186
Contigs with:2 ESTs 5593 ESTs 2014–5 ESTs 1366–10 ESTs 14911–20 ESTs 96>20 ESTs 45
Contigs with putative SNPs 415
Table 2: Samples used for SNP validation. All sampling locations were in Norway (Figure 1). The samples used for this study were selected from larger set of samples taken at the sites, selection being based on Pan I frequencies. Frequencies of Pan IA among all fish sampled at the respective locations are given in column 3. Pan I genotypes of the animals used for SNP-genotyping are given in column 4. NEAC = North-East Arctic cod; NCC-N = Norwegian coastal cod north; NCC-S1 = Norwegian coastal cod south site 1; NCC-S2 = Norwegian coastal cod south site 2.
Sampling location Sample abbreviation Freq. of Pan IA Pan I genotype No of fish
Båtsfjord NEAC 0.125 BB 45Malangen NCC-N 0.872 AA 11Molde NCC-S1 0.966 AA 30Florø/Nærøysund NCC-S2 0.980 AA 9
Table 3: Summary from validation of SNPs
Putative SNPs 724Put. SNPs with assay successfully made 648Putative SNPs genotyped 594
Failed assays 175SNPs w/all animals heterozygous 9SNPs w/all animals homozygous 92Polymorphic SNPs 318
Contigs with putative SNPs 415Contigs with real SNPs 235Contigs with:
1 real SNP 1722 real SNPs 483 real SNPs 114 real SNPs 25 real SNPs 2
Page 3 of 9(page number not for citation purposes)

BMC Genetics 2008, 9:18 http://www.biomedcentral.com/1471-2156/9/18
S respectively, both significantly different from zero (P <0.05). At individual markers, FST-values ranged from 0 to0.83 (Figure 3), and 48 SNPs had FST-values significantlydifferent from zero [see Additional file 1]. The Beaumontand Nichols test [29] revealed 29 outliers from the neu-tral-model FST distribution (Figure 3, Figure 4). The major-ity of these 29 SNPs had an allele frequency clinereminiscent of that observed at the Pan I locus [see Addi-tional file 2]. The outlying SNPs represented 26 genes, ofwhich five corresponded to ribosomal proteins, threewere involved in muscle contraction, two were involvedin immune response, seven had other known functions,and nine had unknown or ambiguous functions [seeAdditional file 2].
We did not aim to thoroughly investigate the complicatedissue of Atlantic cod population structure in this study,given the limited number of populations investigated andthe pre-selection of individuals according to their Pan I
genotype. However, since very large FST-values wereobserved, it seems reasonable to conclude that outlier lociare, or have been, subject to diversifying selection, andthat the gene flow between populations is minor; allelefrequency divergence at the scale observed here would elsenot be likely to occur. Selection could be acting i) on theoutlier SNPs themselves or on other SNPs within the samegene, or ii) on other loci in linkage disequilibrium withthe outlier SNPs. Given the large number of genes in anyhigher organism, the even larger number of SNPs, and thelimited number of markers tested in this study, selectionis quite likely to be acting on genes in LD with theobserved genes rather than on the observed genes them-selves. Determination of LD levels in Atlantic cod willthus be essential to differentiate these two possibilities. IfLD can be found across large genomics regions, the outliergenes/SNPs detected here are not likely to be under directselection. However, if LD can be found across only minorgenomic regions, selection is likely to be acting directly on
Map showing sampling locationsFigure 1Map showing sampling locations. Sample abbreviations are described in Table 2.
Båtsfjord (NEAC)
Malangen (NCC-N)
Molde (NCC-S1)
Florø (NCC-S2)
Page 4 of 9(page number not for citation purposes)
BMC Genetics 2008, 9:18 http://www.biomedcentral.com/1471-2156/9/18
the genes/SNPs themselves, in which case the data indi-cate that as much as 11% (26 out of 235) of genes inAtlantic cod are under positive selection.
ConclusionIn this study, we have described the identification andcharacterisation of several hundred potential SNP markersfrom Atlantic cod, resulting in 318 SNPs that were poly-morphic and reliably scored in a sample taken from threedifferent sampling sites. The SNPs have the potential tosignificantly enhance the resolution of population struc-ture in the Atlantic cod and provide more precise esti-mates of effective population sizes and rates of gene flow.Even from this preliminary study, it is clear that a signifi-cant fraction of loci in Atlantic cod display very large dif-ferentiation between North-East Arctic cod andNorwegian coastal cod, and thus are very likely to beaffected by directional selection. The SNPs also representa valuable resource for genetic mapping in Atlantic cod,and may be used for performing genome scans for quan-
titative trait loci (QTL) for phenotypic traits. Work is pres-ently underway in our laboratory to construct a linkagemap containing these SNPs and anchoring microsatel-lites.
MethodsConstruction of cDNA libraries and sequencing of ESTsEST sequences in Atlantic cod were obtained from eightdifferent cDNA-libraries, made from tissues collectedfrom the head kidney, intestine, liver, pyloric saeca,spleen (two libraries; stimulated and non-stimulated),and embryos (two libraries). For the embryo libraries, 500different embryos were used, while for the other libraries,15 animals were used in total. The animals used for ESTsequencing were all Norwegian coastal cod. Samples fromindividual fish were stored in RNALater (Ambion) prior touse. Total RNA was extracted from each individual sepa-rately by the RNA Easy Mini Kit (Qiagen, Venlo, the Neth-erlands) and an equal amount of RNA from five differentindividuals was pooled. Enrichment for polyA RNA was
Allele frequency distributionFigure 2Allele frequency distribution. Overall allele frequency of SNPs, ranked according to allele frequency
Page 5 of 9(page number not for citation purposes)

BMC Genetics 2008, 9:18 http://www.biomedcentral.com/1471-2156/9/18
conducted using the Oligotex mRNA Midi Kit from Qia-gen. Nucleic acid quality was measure using Agilent 2100Bioanalyzer (Agilent Technologies, Santa Clara, USA) andquantity was measure using Nanodrop ND-1000 (Nano-Drop Technologies, Wilmington, USA). Directional cDNAlibraries were constructed using 5 μg of polyA enrichedRNA using the pBluescript II XR cDNA library construc-tion kit from Stratagene (Cedar Creek, USA) according tothe manufactures recommendations. The quality (size)(Bioanalyser) and quantity (Nanodrop) of the producedcDNA was assessed prior to ligation. XL10-gold cells weretransformed and blue/white screened. Positive (white)colonies were randomly picked and grown overnight in96 well plates. Plasmids were purified using the MontagePlasmid Miniprep kit (Millipore, Billerica, USA).Sequencing was conducted using BigDye chemistry and
they were run on an ABI3700 sequencer from AppliedBiosystems (Foster City, USA). Sequencing was done fromthe 5' end of transcripts.
Construction of EST contigs and identification of putative SNPsBase-calling from chromatograms was performed usingthe Phred program [30]. Vector (pCMV-PCR) was maskedusing Cross-Match (P. Green, unpublished; [31]). PolyAand polyT sequences were also masked using a custommade script, to avoid false clustering on these motifs.Clustering and contig assembly was performed with thePhrap program, (P. Green, unpublished). Phrap was runwith the options "-trim_start 50 ~minmatch 50. The Poly-Bayes program [32] was used to detect putative SNPs inthe sequence alignments, and give a probability of being
FST values from locus-by-locus AMOVAFigure 3FST values from locus-by-locus AMOVA. FST values were calculated at individual markers, with a three-population struc-ture (North-East Artic cod (NCC), Norwegian coastal cod north (NCC-N), and Norwegian coastal cod south (NCC-S)). Blue columns = outlier loci according to the Beaumont and Nichols [29] test (Figure 4); red columns = non-outlier SNPs with FST values significantly different from zero; green columns = SNPs with FST values not significantly different from zero.
Page 6 of 9(page number not for citation purposes)

BMC Genetics 2008, 9:18 http://www.biomedcentral.com/1471-2156/9/18
a true SNP to each base substitution. The prior polymor-phism rate for PolyBayes was 0.001 In addition, all con-tigs were manually inspected for SNPs using the programConsed [33].
Annotation of SNPsIn order to annotate the SNP-containing contigs, BLASTXwas run against the Protein data base, Swiss-Prot and non-redundant GenBank databases. A significant database hitwas defined as having an expectation value (E-value)below 1.0 × 10⁻¹⁰. All sequences with a significant BLASTXhit in Swiss-Prot were annotated by annotation transfer,inferring similarity of function from sequence similarityby applying the Gene Ontology (GO) assignments for theUNIPROT database, produced by the GOA project of theEuropean Bioinformatics Institute [34]. Thegene_association goa_uniprot database of 07.07.2004was used (see [35] for details) together with GO termsform the GO release of 06.08.2004 [36]. The sequences
were annotated based on the single best hit in the Swiss-Prot database. BLASTN was used to annotate contigsagainst the nucleotide data base. Putative SNP functional-ity (e.g. resulting in a change in amino acid sequence orno change in amino acid sequence, non-synonymous orsynonymous changes respectively) was predicted usingthe cSnper program [37].
DNA samplingThe fish originated from randomly selected wild-caughtNorwegian coastal cod (NCC) from southern and north-ern locations as well as from North-East Arctic cod(NEAC) (Table 2). All samples were collected autumn2003. Genomic DNA was isolated from ethanol preservedfin clips in a GenoM-48 Robotic Workstation (Genovi-sion, Oslo, Norway) using Magnetic Bead kits for purifica-tion and extraction of nucleic acids (Genovision)following the manufacturer's instructions. The fish weregenotyped to characterise the fish as coastal cod or North-
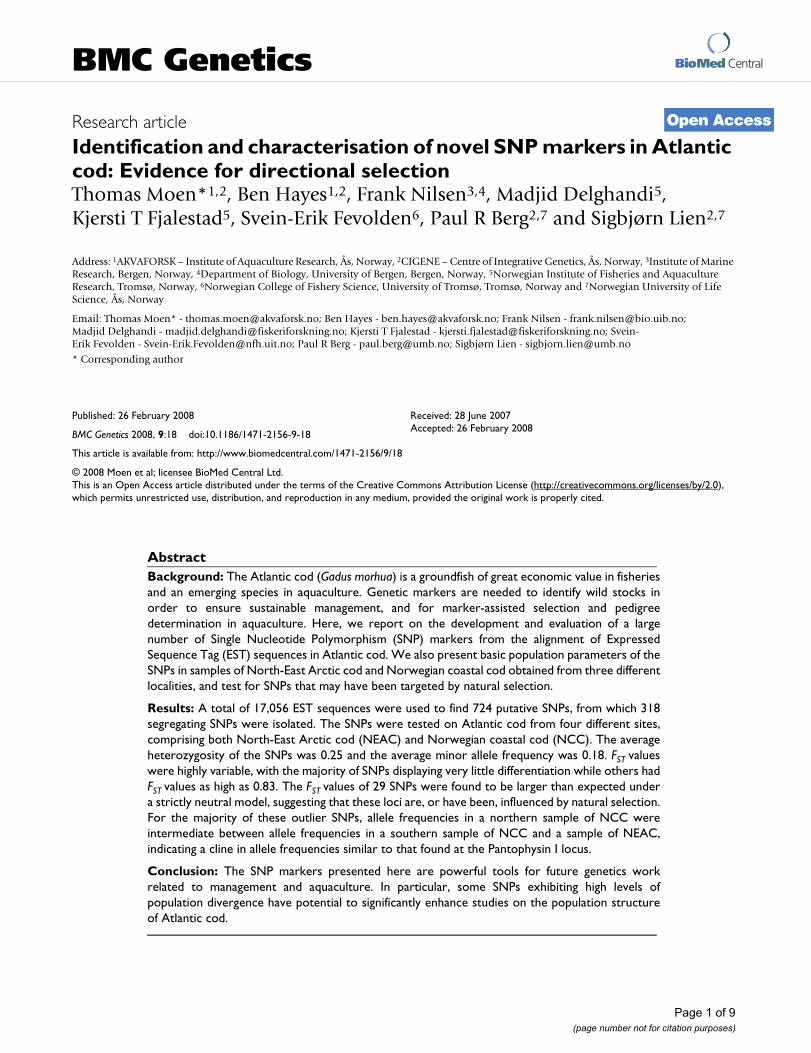
Outlier SNPsFigure 4Outlier SNPs. The method of Beaumont and Nichols [29] was used to generate a distribution of FST values versus heterozy-gosity under a neutral model. SNPs that had FST values above the 0.975 quantile were considered outlier loci.
Page 7 of 9(page number not for citation purposes)

BMC Genetics 2008, 9:18 http://www.biomedcentral.com/1471-2156/9/18
East Arctic cod based on their Pantophysin (Pan I geno-types [38]. The fish used in this study were a subset of thesamples taken at the locations, selected based on their PanI genotypes, where Pan IAA were regarded as NCC and PanIBB were regarded as NEAC (Table 2). Pan I genotyping wasdone according to Stenvik et al. [38].
Primer design and genotypingGenotyping of SNPs was performed using the MassARRAYsystem from Sequenom (San Diego, USA). PCR-primersand extension-primers were designed using the softwareSpectroDESIGNER v3.0 (Sequenom). Multiplexes andprimer sequences can be found in Additional file 1. Mul-tiplexing levels were between 20 and 29. All SNP genotyp-ing was performed according to the iPLEX protocol fromSequenom (available at [39]). For allele separation, theSequenom MassARRAY™ Analyzer (Autoflex mass spec-trometer) was used. Genotypes were assigned in real time[40] by the MassARRAY SpectroTYPER RT v3.4 software(Sequenom) based on the mass peaks present. All resultswere manually inspected, using the MassARRAY TyperAn-alyzer v3.3 software (Sequenom). SNPs were classified as"failed assays" (meaning that the majority of genotypescould not be scored and/or the samples did not clusterwell according to genotype), "SNPs w/all animals hetero-zygous", "SNPs w/all animals homozygous", or "poly-morphic SNPs", based on this manual inspection. SNPsthat were out of HWE in one or several populations weredouble-checked.
Analysis of genotype dataMean pairwise FST values were calculated using the "pair-wise FST" function of Arlequin v3.11 [41]. FST values atindividual SNPs were calculated using the AMOVA func-tion of the same program. Permutation testing with 1000iterations was used to calculate p-values for mean andlocus-by-locus FST values. Arlequin v3.11 was also used forexact tests of HWE equilibrium (100 000 Monte Carloiterations, 1000 dememorisation steps), and for assign-ment of individual genotypes to populations. OutlierSNPs were tested for using the method of Beaumont andNichols [29], as implemented in the software packageFDIST2 [42]. In FDIST2, average heterozygosity was firstcalculated using the datacal function. Simulations werethen run using this average heterozygosity, 20 000 itera-tions, and assuming 10 demes, 3 populations, 40 individ-uals per sample, and a stepwise mutation model (thenumber of demes was increased until the average of sim-ulated FST values was approximately equal to the observedaverage FST, as suggested in [29]). Simulated FST valueswere plotted against heterozygosity to yield a distributionfor FST under a neutral model. SNPs with FST values abovethe 0.975 quantile were considered to be outlier loci.
Authors' contributionsTM inspected contigs for SNPs, coordinated SNP genotyp-ing, did data analysis, and wrote a draft of the manuscript.BH did contig assembly, in silico SNP discovery, and anno-tations. FN performed the library construction and ESTsequencing. MD provided and prepared DNA samples,and did Pan I genotyping of samples prior to the study.KTF provided DNA samples, took part in planning of thestudy, and was project leader. SEF provided DNA samplesand guidance for the project. PRB did multiplexing ofSNPs and took part in SNP genotyping. SL provided SNPgenotyping facilities, and took part in SNP discovery. Allauthors took part in writing, and approved of, the manu-script.
Additional material
AcknowledgementsWe are very grateful to Heidi Kongshaug, Hege Munck, and Mette Serine Wesmajervi for excellent technical assistance. We also thank Dr. Sten Karlsson, Dr. Matthew P. Kent, Dr. Marie Cooper, and three anonymous reviewers for valuable comments on an earlier version of the manuscript. This study was funded by the HAVBRUK programme of the Norwegian Research Council (project Disease resistance in Atlantic cod: construction of a genetic map, QTL mapping, and implementing QTLs in a genetic improvement programme, #164981/S40). The project also benefited from grants to CIGENE from the Functional Genomics (FUGE) programme of the Norwe-gian Research Council.
References1. Kurlansky M: Cod. New York , Walker & Company; 1997. 2. Christensen V, Guâenette S, Heymans JJ, Walters CJ, Watson R, Zel-
ler D, Pauly D: Hundred-year decline of North Atlantic preda-tory fishes. Fish and Fisheries 2003, 4(1):1-24.
3. Nielsen EE, Hansen MM, Meldrup D: Evidence of microsatellitehitch-hiking selection in Atlantic cod (Gadus morhua L.):implications for inferring population structure in nonmodelorganisms. Molecular Ecology 2006, 15(11):3219-3229.
4. Westgaard JI, Fevolden SE: Atlantic cod (Gadus morhua L ) ininner and outer coastal zones of northern Norway display
Additional file 1SNP details. Properties of all 318 SNPs that were polymorphic, segregat-ing, and could be reliably scored (SNP name, contig name, multiplex, contig sequence, SNP sequence, primer sequences, BLASTX and BLASTN results, synonymous/non-synonymous SNP, genotype counts, allele- and genotype frequencies, heterozygosities, FST-values, tests for HWE)Click here for file[http://www.biomedcentral.com/content/supplementary/1471-2156-9-18-S1.xls]
Additional file 2Population parameters of outlier SNPs. Properties of high-FST outlier SNPs (FST-value, BLASTX hit, biological function, synonymous/non-synony-mous SNP, allele frequencies, tests for HWE)Click here for file[http://www.biomedcentral.com/content/supplementary/1471-2156-9-18-S2.doc]
Page 8 of 9(page number not for citation purposes)
BMC Genetics 2008, 9:18 http://www.biomedcentral.com/1471-2156/9/18
Publish with BioMed Central and every scientist can read your work free of charge
"BioMed Central will be the most significant development for disseminating the results of biomedical research in our lifetime."
Sir Paul Nurse, Cancer Research UK
Your research papers will be:
available free of charge to the entire biomedical community
peer reviewed and published immediately upon acceptance
cited in PubMed and archived on PubMed Central
yours — you keep the copyright
Submit your manuscript here:http://www.biomedcentral.com/info/publishing_adv.asp
BioMedcentral
divergent genetic signature at non-neutral loci. Fisheriesresearch 2007, 85(3):10.
5. Mork J, Ryman N, Stahl G, Utter F, Sundnes G: Genetic variationin Atlantic cod (Gadus morhua) throughout its range. Can JFish Aquat Sci 1985, 42:1580-1587.
6. Pogson GH, Mesa KA, Boutilier RG: Genetic population struc-ture and gone flow in the Atlantic cod Gadus morhua: a com-parison of allozyme and nuclear RFLP loci. Genetics 1995,139(1):375-385.
7. Miller KM, Le KD, Beacham TD: Development of tri- and tetra-nucleotide repeat microsatellite loci in Atlantic cod (Gadusmorhua). Molecular Ecology 2000, 9:238-240.
8. Delghandi M, Mortensen A, Westgaard JI: Simultaneous analysisof six microsatellite markers in Atlantic cod (Gadusmorhua): a novel multiplex assay system for use in selectivebreeding studies. Mar Biotechnol 2003, 5:141-148.
9. Jakobsdóttir KB, Jörundsdóttir BD, Skírnisdóttir S, Hjörleifsdóttir S,Hreggvidsson G, Daníelsdóttir AK, Pampoulie C: Nine new poly-morphic microsatellite loci for the amplification of archivedotolith DNA of Atlantic cod, Gadus morhua L. Molecular Ecol-ogy Notes 2006, 6:337-339.
10. Stenvik J, Wesmajervi MS, Fjalestad KT, Damsgård B, Delghandi M:Development of twenty-five gene-associated microsatellitemarkers of Atlantic cod (Gadus morhua L.). Molecular EcologyNotes 2006, 6:1105-1107.
11. Wesmajervi MS, Tafese T, Stenvik J, Fjalestad KT, Damsgård B,Delghandi M: Eight new microsatellite markers in Atlantic cod(Gadus morhua L.) derived from an enriched genomiclibrary. Molecular Ecology Notes 2007, 7:138-140.
12. Westgaard JI, Tafese T, Wesmajervi MS, Stenvik J, Fjalestad KT, Dam-sgård B, Delghandi M: Identification and characterisation ofthirteen new microsatellites for Atlantic cod (Gadus morhuaL.) from a repeat-enriched library. Conservation Genetics 2007,3:749-751.
13. ICES: Report of the ICES Advisory Committee on FisheryManagement. Advisory Committee on the Marine Environ-ment and Advisory Committee on Ecosystems. ICES advice.Books 1–10. 2006, 3:89.
14. Fevolden S, Pogson G: Genetic divergence at the synaptophysin(Syp I) locus among Norwegian coastal and north-east Arc-tic populations of Atlantic cod. Journal of Fish Biology 1997,51(5):895-908.
15. Sarvas TH, Fevolden SE: Pantophysin (Pan I) locus divergencebetween inshore v offshore and northern v southern popula-tions of Atlantic cod in the north-east Atlantic. Journal of FishBiology 2005, 67(2):444-469.
16. Skarstein TH, Westgaard. J I, Fevolden SE: Comparing microsatel-lite variation in north-east Atlantic cod (Gadus morhua L.)to genetic structuring as revealed by the pantophysin (Pan I)locus. Journal of Fish Biology 2007 2007, 70 (supplementC):271-290.
17. Møller D: Genetic differences between cod groups in theLofoten area. Nature 1966, 212:824.
18. Møller D: Genetic diversity in spawning cod along the Norwe-gian coast. Hereditas 1968, 60:1-32.
19. Møller D: The relationship between arctic and coastal cod intheir immature stages illustrated by frequencies of geneticcharacters. Fiskeridirektoratets Skriften, Serie Havundersokelser 1969,15:220-233.
20. Sick K: Haemoglobin polymorphism of cod in the North Seaand the North Atlantic Ocean. Hereditas 1965, 54:49-69.
21. Jørstad K, Nævdal G: Genetic variation and population struc-ture of cod, Gadus morhua L., in some fjords in northernNorway. 35 1989, Journal of Fish Biology:245-252.
22. Dahle G, Jørstad K: Haemoglobin variation-a reliable markerfor cod (Gadus morhua L.) . Fisheries Research 1993, 16:301-311.
23. Mork J, Giæver M: Genetic structure of cod along the coast ofNorway: Results from isozyme studies. Sarsia 1999,84:157-168.
24. Árnason E: Mitochondrial cytochrome b DNA variation in thehigh-fecundity Atlantic cod: Trans-Atlantic clines and shal-low gene genealogy. Genetics 2004, 166:1871-1885.
25. Hayes B, Lærdahl JK, Lien S, Moen T, Berg P, Hindar K, Davidson WS,Koop BF, Adzhubei A, Høyheim B: An extensive resource of sin-gle nucleotide polymorphism markers associated with
Atlantic salmon (Salmo salar) expressed sequences. Aquacul-ture 2007, 265:82-90.
26. Fjalestad KT, Fevolden SE, Jørstad K, Olesen I: Breeding andGenetics - New Species. In Aquaculture Research: From Cage to Con-sumption Volume ISBN 978-82-12-02408-3. The Research Council ofNorway; 2007:285-301.
27. Cargill M, Altshuler D, Ireland J, Sklar P, Ardlie K, Patil N, Lane CR,Lim EP, Kalyanaraman N, Nemesh J, Ziaugra L, Friedland L, Rolfe A,Warrington J, Lipshutz R, Daley GQ, Lander ES: Characterizationof single-nucleotide polymorphisms in coding regions ofhuman genes. Nature genetics 1999, 22(3):231-238.
28. Lee MA, Keane OM, Glass BC, Manley TR, Cullen NG, Dodds KG,McCulloch AF, Morris CA, Schreiber M, Warren J, Zadissa A, WilsonT, McEwan JC: Establishment of a pipeline to analyse non-syn-onymous SNPs in Bos taurus. BMC Genomics 2006, 7:298.
29. Beaumont MA, Nichols RA: Evaluating loci for use in the geneticanalysis of population structure. Proceedings of the Royal Societyof London Series B, Containing papers of a Biological character 1996,263(1377):1619-1625.
30. Ewing B, Hillier L, Wendl CW, Green P: Base-calling of auto-mated sequencer traces using Phred. I. Accuracy assess-ment. Genome Research 1998, 8:175–185.
31. University of Washington Genome Center [http://www.genome.washington.edu/UWGC]
32. Marth G T, Korf I, Yandell MD, Yeh RT, Gu Z, Zakeri H, Stitzial NO,Hillier L, Kwok PY, Gish WR: A general approach to single-nucleotide polymorphism discovery. Nature Genetics 1999,23:452–456.
33. Gordon D, Abajian C, Green P: Consed: a graphical tool forsequence finishing. Genome Research 1998, 8:195–202.
34. Gene Ontology Annotation (GOA) Database [http://www.ebi.ac.uk/GOA]
35. Gene Association GOA uniprot database [ftp://ftp.ebi.ac.uk/pub/databases/GO/goa/UNIPROT]
36. Gene Ontology Home [http://www.geneontology.org]37. Kim H, Schmidt CJ, Decker KS, Emara MG: A double-screening
method to identify reliable candidate non-synonymous SNPsfrom chicken EST data. Animal Genetics 2003, 34:249-254.
38. Stenvik J, Wesmajervi MS, Damsgård B, Delghandi M: Genotyping ofpantophysin I (Pan I) of Atlantic cod (Gadus morhua L.) byallele-specific PCR. Molecular Ecology Notes 2006, 6:272-275.
39. Sequenom [http://www.sequenom.com]40. Tang K, Fu DJ, Julien D, Braun A, Cantor CR, Köster H: Chip-based
genotyping by mass spectrometry. Proc Natl Acad Sci USA 1999,96:10016-10020.
41. Excoffier L, Laval G, Schneider S: Arlequin ver. 3.0: An integratedsoftware package for population genetics data analysis. Evo-lutionary Bioinformatics Online 2005, 1:47-50.
42. FDIST2 distribution site [http://www.rubic.reading.ac.uk/~mab/software/fdist2.zip]
Page 9 of 9(page number not for citation purposes)