Embed Size (px)
Citation preview
2
Identification and Characterisation of Microbial Populations Using
Flow Cytometry in the Adriatic Sea
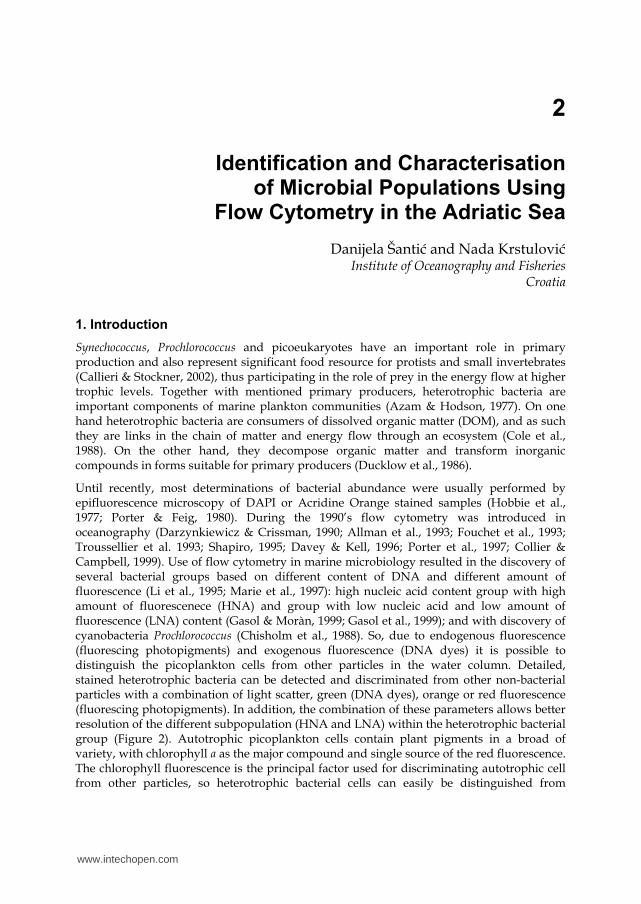
Danijela Šantić and Nada Krstulović Institute of Oceanography and Fisheries
Croatia
1. Introduction
Synechococcus, Prochlorococcus and picoeukaryotes have an important role in primary production and also represent significant food resource for protists and small invertebrates (Callieri & Stockner, 2002), thus participating in the role of prey in the energy flow at higher trophic levels. Together with mentioned primary producers, heterotrophic bacteria are important components of marine plankton communities (Azam & Hodson, 1977). On one hand heterotrophic bacteria are consumers of dissolved organic matter (DOM), and as such they are links in the chain of matter and energy flow through an ecosystem (Cole et al., 1988). On the other hand, they decompose organic matter and transform inorganic compounds in forms suitable for primary producers (Ducklow et al., 1986).
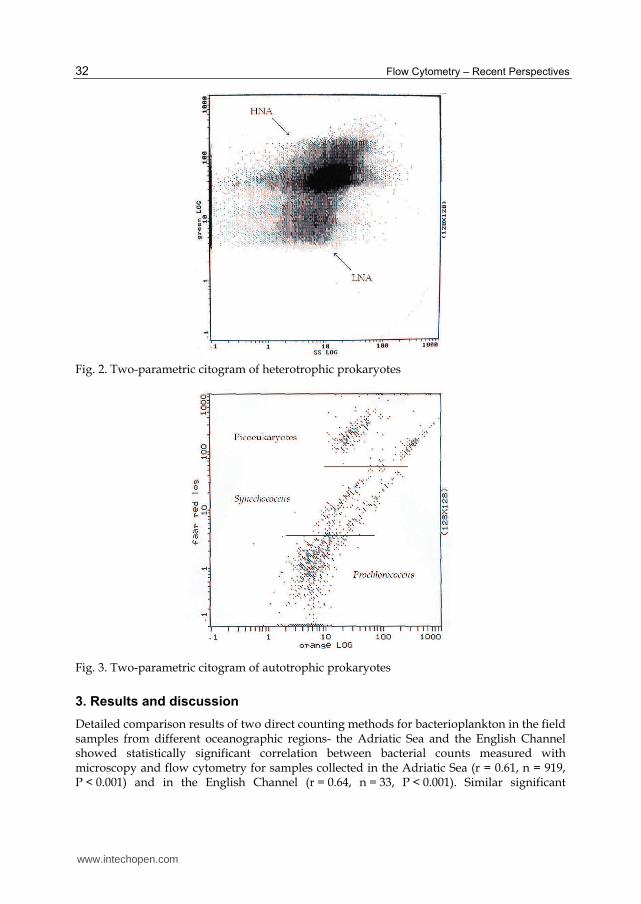
Until recently, most determinations of bacterial abundance were usually performed by epifluorescence microscopy of DAPI or Acridine Orange stained samples (Hobbie et al., 1977; Porter & Feig, 1980). During the 1990’s flow cytometry was introduced in oceanography (Darzynkiewicz & Crissman, 1990; Allman et al., 1993; Fouchet et al., 1993; Troussellier et al. 1993; Shapiro, 1995; Davey & Kell, 1996; Porter et al., 1997; Collier & Campbell, 1999). Use of flow cytometry in marine microbiology resulted in the discovery of several bacterial groups based on different content of DNA and different amount of fluorescence (Li et al., 1995; Marie et al., 1997): high nucleic acid content group with high amount of fluorescenece (HNA) and group with low nucleic acid and low amount of fluorescence (LNA) content (Gasol & Moràn, 1999; Gasol et al., 1999); and with discovery of cyanobacteria Prochlorococcus (Chisholm et al., 1988). So, due to endogenous fluorescence (fluorescing photopigments) and exogenous fluorescence (DNA dyes) it is possible to distinguish the picoplankton cells from other particles in the water column. Detailed, stained heterotrophic bacteria can be detected and discriminated from other non-bacterial particles with a combination of light scatter, green (DNA dyes), orange or red fluorescence (fluorescing photopigments). In addition, the combination of these parameters allows better resolution of the different subpopulation (HNA and LNA) within the heterotrophic bacterial group (Figure 2). Autotrophic picoplankton cells contain plant pigments in a broad of variety, with chlorophyll a as the major compound and single source of the red fluorescence. The chlorophyll fluorescence is the principal factor used for discriminating autotrophic cell from other particles, so heterotrophic bacterial cells can easily be distinguished from
www.intechopen.com

Flow Cytometry – Recent Perspectives
30
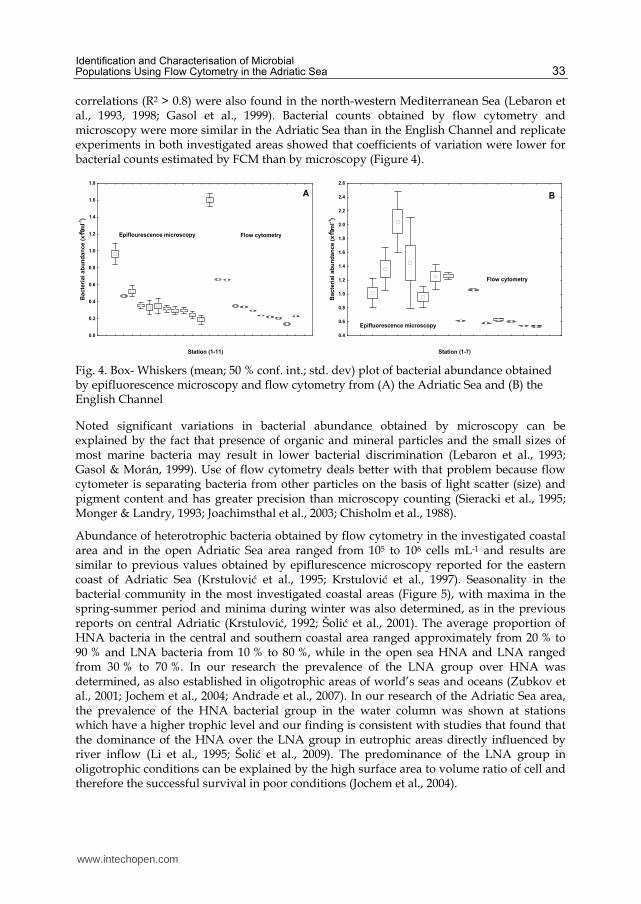
autotrophic cells in a plot Red vs. Green fluorescence. Further, the orange fluorescence can be used to detect second important fluorescing photopigment respectively phycoeritrin. Phycoeritrin is typical in many Synechococcus spp. and some picoeukaryotes, so Synechococcus, Prochlorococcus and picoeukaryotes can easy be discriminated in a plot Red vs. Orange fluorescence (Figure 3). Flow cytometry also significantly reduce the time employed in each of these determinations (multiparameter analysis of individual cells); increase the level of resolution and provide new insights into the structure and functioning of plankton communities that simply can not be obtained with conventional epifluorescence microscopy (Li et al., 1995; Marie et al., 1996; Marie et al., 1997). Flow cytometry has been routinely used for the analysis of marine samples and now is commonly accepted as a reference technique in oceanography and for the analysis of bacterial community (Monger & Landry, 1993).
Flow cytometry in our studies contributes to better understanding of prokaryotic roles in the Adriatic Sea as a separate ecosystem and as an important part of the Mediterranean Sea. Studies of prokaryotic community by flow cytometry in the eastern part of Adriatic Sea started in year 2003. The first studies were carried out for purposes of comparing two direct counting methods for bacterioplankton (Šantić et al., 2007). The accuracy of epifluorescence microscopy (EM) was assessed against direct counts made by flow cytometry (FCM). Furthermore, flow cytometry is used for investigation and characterization of heterotrophic prokariotic community (Šolić et al., 2008; Šolić et al., 2009; Šolić et al., 2010) and autotrophic prokaryotic community (Vilibić & Šantić, 2008; Šantić et al., 2011). Autotrophic picoplankton community, including Prochlorococcus and picoeukarytoes, in the eastern part of Adriatic was described for the first time in the northern Adriatic Sea (Radić et al., 2009).
2. Material and methods
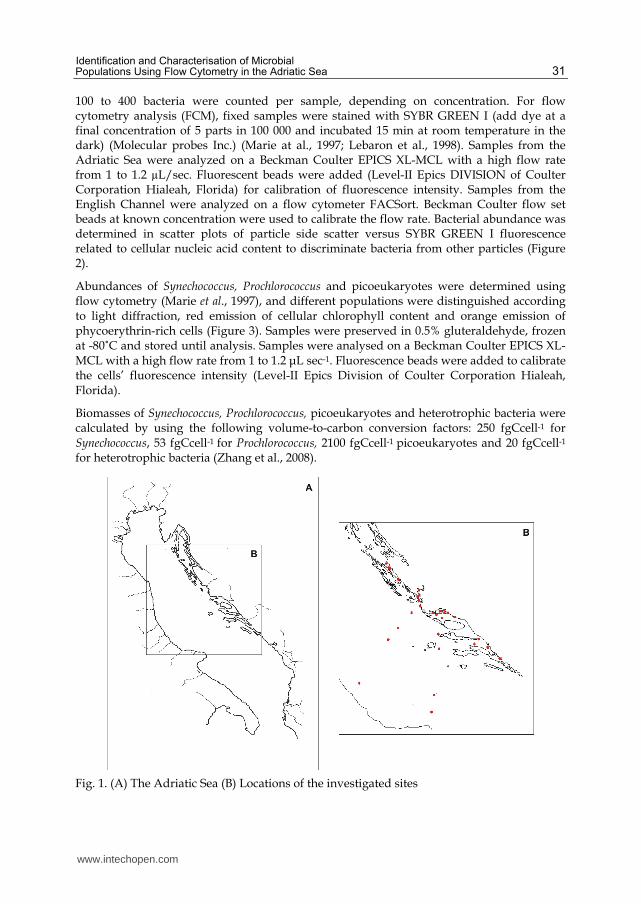
For comparing the two counting methods, epifluorescence microscopy and flow citometry, samples were collected in two geographically different areas: Adriatic Sea, part of the Mediterranean Sea (Figure 1) and English Channel, part of the Atlantic Ocean (50°15’ N, 4° 15’ W, off shore station 6 km off Plymouth, and four shore station from Plymouth Sound UK). From the Adriatic Sea a total of 919 samples comprising both offshore and shore areas were collected on monthly basis from 29 sites during 2005. From the English Channel (N =132) samples were collected at weekly to monthly intervals during winter 2006 from one offshore and four shore sites. In addition, for the purpose of testing repeatability and counting precision, four replicates were made by both direct counting methods, for each sample through vertical profile collected from shore and off shore sites from the Adriatic Sea and the English Channel. For the comparison of the share of biomass within the microbial community samples were collected on monthly basis from the Adriatic Sea (N = 110) from one coastal (ST103) and one open sea (CA009) site during 2010. Seawater samples from the Adriatic Sea sites and offshore site in the English Channel were collected by Niskin bottles through vertical profile. At four shore sites from the English Channel samples were collected manually from the surface. All samples were fixed with formaldehyde (2% final concentration), kept in the dark at 4 ºC and analyzed within two weeks. For epifluorescence microscopy (EM) preserved samples were stained with 4'-6-diamidino-2-phenylindole (DAPI) (1 µg mL-1 final concentration) for 5 minutes and were filtered through 0.2 µm pore diameter black polycarbonate filters (Millipore, Ireland). Filters were then mounted on microscope slides and stored at 4 ºC where they were kept until observation with an Olympus microscope under UV light (Porter & Feig, 1980) at magnification of 1000. From
www.intechopen.com
Identification and Characterisation of Microbial Populations Using Flow Cytometry in the Adriatic Sea
31
100 to 400 bacteria were counted per sample, depending on concentration. For flow cytometry analysis (FCM), fixed samples were stained with SYBR GREEN I (add dye at a final concentration of 5 parts in 100 000 and incubated 15 min at room temperature in the dark) (Molecular probes Inc.) (Marie at al., 1997; Lebaron et al., 1998). Samples from the Adriatic Sea were analyzed on a Beckman Coulter EPICS XL-MCL with a high flow rate from 1 to 1.2 µL/sec. Fluorescent beads were added (Level-II Epics DIVISION of Coulter Corporation Hialeah, Florida) for calibration of fluorescence intensity. Samples from the English Channel were analyzed on a flow cytometer FACSort. Beckman Coulter flow set beads at known concentration were used to calibrate the flow rate. Bacterial abundance was determined in scatter plots of particle side scatter versus SYBR GREEN I fluorescence related to cellular nucleic acid content to discriminate bacteria from other particles (Figure 2).
Abundances of Synechococcus, Prochlorococcus and picoeukaryotes were determined using flow cytometry (Marie et al., 1997), and different populations were distinguished according to light diffraction, red emission of cellular chlorophyll content and orange emission of phycoerythrin-rich cells (Figure 3). Samples were preserved in 0.5% gluteraldehyde, frozen at -80˚C and stored until analysis. Samples were analysed on a Beckman Coulter EPICS XL-MCL with a high flow rate from 1 to 1.2 μL sec-1. Fluorescence beads were added to calibrate the cells’ fluorescence intensity (Level-II Epics Division of Coulter Corporation Hialeah, Florida).
Biomasses of Synechococcus, Prochlorococcus, picoeukaryotes and heterotrophic bacteria were calculated by using the following volume-to-carbon conversion factors: 250 fgCcell-1 for Synechococcus, 53 fgCcell-1 for Prochlorococcus, 2100 fgCcell-1 picoeukaryotes and 20 fgCcell-1
for heterotrophic bacteria (Zhang et al., 2008).
Fig. 1. (A) The Adriatic Sea (B) Locations of the investigated sites
www.intechopen.com
Flow Cytometry – Recent Perspectives
32
Fig. 2. Two-parametric citogram of heterotrophic prokaryotes
Fig. 3. Two-parametric citogram of autotrophic prokaryotes
3. Results and discussion
Detailed comparison results of two direct counting methods for bacterioplankton in the field samples from different oceanographic regions- the Adriatic Sea and the English Channel showed statistically significant correlation between bacterial counts measured with microscopy and flow cytometry for samples collected in the Adriatic Sea (r = 0.61, n = 919, P < 0.001) and in the English Channel (r = 0.64, n = 33, P < 0.001). Similar significant
www.intechopen.com
Identification and Characterisation of Microbial Populations Using Flow Cytometry in the Adriatic Sea
33
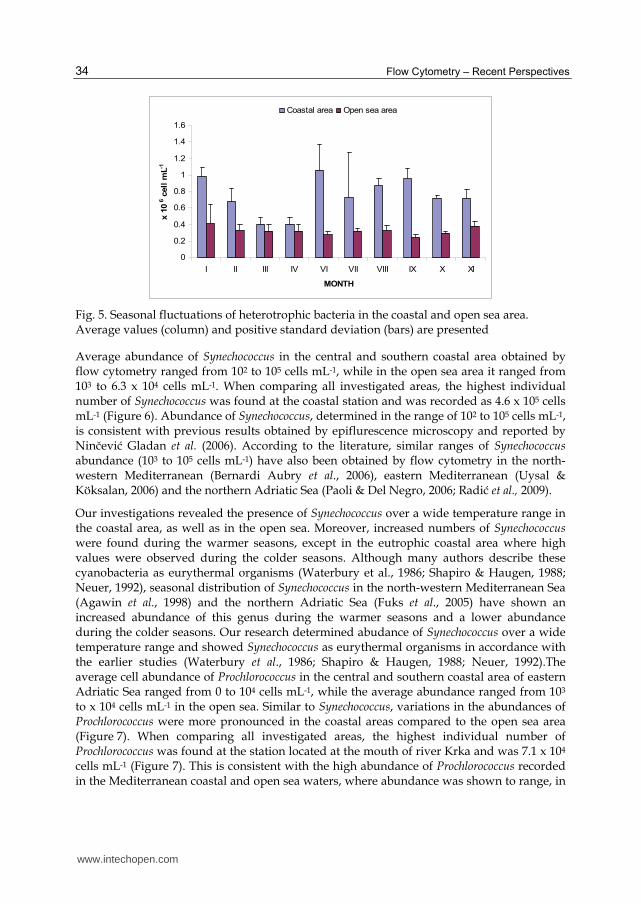
correlations (R2 > 0.8) were also found in the north-western Mediterranean Sea (Lebaron et al., 1993, 1998; Gasol et al., 1999). Bacterial counts obtained by flow cytometry and microscopy were more similar in the Adriatic Sea than in the English Channel and replicate experiments in both investigated areas showed that coefficients of variation were lower for bacterial counts estimated by FCM than by microscopy (Figure 4).
Fig. 4. Box- Whiskers (mean; 50 % conf. int.; std. dev) plot of bacterial abundance obtained by epifluorescence microscopy and flow cytometry from (A) the Adriatic Sea and (B) the English Channel
Noted significant variations in bacterial abundance obtained by microscopy can be explained by the fact that presence of organic and mineral particles and the small sizes of most marine bacteria may result in lower bacterial discrimination (Lebaron et al., 1993; Gasol & Morán, 1999). Use of flow cytometry deals better with that problem because flow cytometer is separating bacteria from other particles on the basis of light scatter (size) and pigment content and has greater precision than microscopy counting (Sieracki et al., 1995; Monger & Landry, 1993; Joachimsthal et al., 2003; Chisholm et al., 1988).
Abundance of heterotrophic bacteria obtained by flow cytometry in the investigated coastal area and in the open Adriatic Sea area ranged from 105 to 106 cells mL-1 and results are similar to previous values obtained by epiflurescence microscopy reported for the eastern coast of Adriatic Sea (Krstulović et al., 1995; Krstulović et al., 1997). Seasonality in the bacterial community in the most investigated coastal areas (Figure 5), with maxima in the spring-summer period and minima during winter was also determined, as in the previous reports on central Adriatic (Krstulović, 1992; Šolić et al., 2001). The average proportion of HNA bacteria in the central and southern coastal area ranged approximately from 20 % to 90 % and LNA bacteria from 10 % to 80 %, while in the open sea HNA and LNA ranged from 30 % to 70 %. In our research the prevalence of the LNA group over HNA was determined, as also established in oligotrophic areas of world’s seas and oceans (Zubkov et al., 2001; Jochem et al., 2004; Andrade et al., 2007). In our research of the Adriatic Sea area, the prevalence of the HNA bacterial group in the water column was shown at stations which have a higher trophic level and our finding is consistent with studies that found that the dominance of the HNA over the LNA group in eutrophic areas directly influenced by river inflow (Li et al., 1995; Šolić et al., 2009). The predominance of the LNA group in oligotrophic conditions can be explained by the high surface area to volume ratio of cell and therefore the successful survival in poor conditions (Jochem et al., 2004).
Station (1-7)
0.4
0.6
0.8
1.0
1.2
1.4
1.6
1.8
2.0
2.2
2.4
2.6
Bacte
rial
ab
un
dan
ce (
x106 m
l-1)
Epifluorescence microscopy
Flow cytometry
B
Station (1-11)
0.0
0.2
0.4
0.6
0.8
1.0
1.2
1.4
1.6
1.8
Bacte
rial
ab
un
dan
ce (
x106 m
l-1)
Epiflourescence microscopy Flow cytometry
A
www.intechopen.com
Flow Cytometry – Recent Perspectives
34
0
0.2
0.4
0.6
0.8
1
1.2
1.4
1.6
I II III IV VI VII VIII IX X XI
MONTH
x 1
0 6
cell
mL-1
Coastal area Open sea area
Fig. 5. Seasonal fluctuations of heterotrophic bacteria in the coastal and open sea area. Average values (column) and positive standard deviation (bars) are presented
Average abundance of Synechococcus in the central and southern coastal area obtained by flow cytometry ranged from 102 to 105 cells mL-1, while in the open sea area it ranged from 103 to 6.3 x 10⁴ cells mL-1. When comparing all investigated areas, the highest individual number of Synechococcus was found at the coastal station and was recorded as 4.6 x 10⁵ cells mL-1 (Figure 6). Abundance of Synechococcus, determined in the range of 102 to 105 cells mL-1, is consistent with previous results obtained by epiflurescence microscopy and reported by Ninčević Gladan et al. (2006). According to the literature, similar ranges of Synechococcus abundance (103 to 105 cells mL-1) have also been obtained by flow cytometry in the north-western Mediterranean (Bernardi Aubry et al., 2006), eastern Mediterranean (Uysal & Köksalan, 2006) and the northern Adriatic Sea (Paoli & Del Negro, 2006; Radić et al., 2009).
Our investigations revealed the presence of Synechococcus over a wide temperature range in the coastal area, as well as in the open sea. Moreover, increased numbers of Synechococcus were found during the warmer seasons, except in the eutrophic coastal area where high values were observed during the colder seasons. Although many authors describe these cyanobacteria as eurythermal organisms (Waterbury et al., 1986; Shapiro & Haugen, 1988; Neuer, 1992), seasonal distribution of Synechococcus in the north-western Mediterranean Sea (Agawin et al., 1998) and the northern Adriatic Sea (Fuks et al., 2005) have shown an increased abundance of this genus during the warmer seasons and a lower abundance during the colder seasons. Our research determined abudance of Synechococcus over a wide temperature range and showed Synechococcus as eurythermal organisms in accordance with the earlier studies (Waterbury et al., 1986; Shapiro & Haugen, 1988; Neuer, 1992).The average cell abundance of Prochlorococcus in the central and southern coastal area of eastern Adriatic Sea ranged from 0 to 104 cells mL-1, while the average abundance ranged from 103 to x 104 cells mL-1 in the open sea. Similar to Synechococcus, variations in the abundances of Prochlorococcus were more pronounced in the coastal areas compared to the open sea area (Figure 7). When comparing all investigated areas, the highest individual number of Prochlorococcus was found at the station located at the mouth of river Krka and was 7.1 x 10⁴ cells mL-1 (Figure 7). This is consistent with the high abundance of Prochlorococcus recorded in the Mediterranean coastal and open sea waters, where abundance was shown to range, in
www.intechopen.com

Identification and Characterisation of Microbial Populations Using Flow Cytometry in the Adriatic Sea
35
average order of magnitude, from 103 to 104 cells mL-1 (Sommaruga et al., 2005; Garczarek et al., 2007). For Prochlorococcus our research results indicate that cells are detectable within the temperature range of 6.33 ºC to 26.93 ºC, similar to some reports for the northern Atlantic and north-western Mediterranean Sea (Buck et al., 1996; Agawin et al., 2000; Vaulot et al. (1990).
Surface layerZ
1Z
2Z
3Š
1Š
2Š
4Š
5ST
101
ST 1
02ST
103 S
1S
3S
4S
5C
A 0
07 P 1
P 2
P 3
D 1
D 2
D 3
CA
001
CA
003
CA
009
Station
0
100
200
300
400
500
Abu
ndan
ce o
f Synechococcus
x 1
0 c
ell
3
mL -1
Min-MaxMean±SEMean
Fig. 6. Abundance of Synechococcus at the surface layer
3
mL -1
Surface layer
0
10
20
30
40
50
60
70
80
Z
1Z
2Z
3Š
1Š
2Š
4Š
5ST
101
ST 1
02ST
103 S
1S
3S
4S
5C
A 0
07 P 1
P 2
P 3
D 1
D 2
D 3
CA
001
CA
003
CA
009
Abu
nd
ance
of
Pro
chlo
roco
ccu
s x
10
cell
Mean Min-MaxMean±SE
Station Fig. 7. Abundance of Prochlorococcus at the surface layer
www.intechopen.com
Flow Cytometry – Recent Perspectives
36
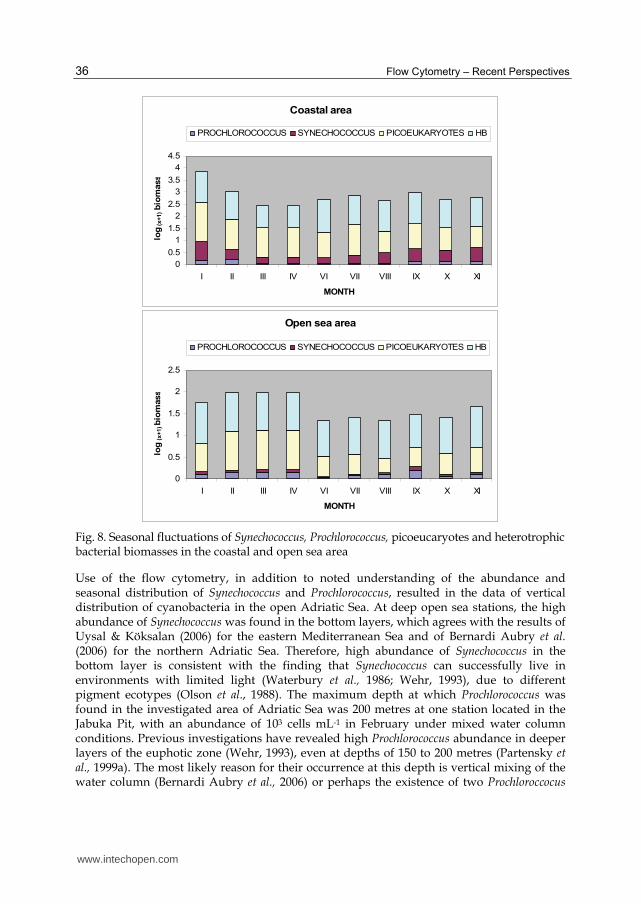
Fig. 8. Seasonal fluctuations of Synechococcus, Prochlorococcus, picoeucaryotes and heterotrophic bacterial biomasses in the coastal and open sea area
Use of the flow cytometry, in addition to noted understanding of the abundance and seasonal distribution of Synechococcus and Prochlorococcus, resulted in the data of vertical distribution of cyanobacteria in the open Adriatic Sea. At deep open sea stations, the high abundance of Synechococcus was found in the bottom layers, which agrees with the results of Uysal & Köksalan (2006) for the eastern Mediterranean Sea and of Bernardi Aubry et al. (2006) for the northern Adriatic Sea. Therefore, high abundance of Synechococcus in the bottom layer is consistent with the finding that Synechococcus can successfully live in environments with limited light (Waterbury et al., 1986; Wehr, 1993), due to different pigment ecotypes (Olson et al., 1988). The maximum depth at which Prochlorococcus was found in the investigated area of Adriatic Sea was 200 metres at one station located in the Jabuka Pit, with an abundance of 103 cells mL-1 in February under mixed water column conditions. Previous investigations have revealed high Prochlorococcus abundance in deeper layers of the euphotic zone (Wehr, 1993), even at depths of 150 to 200 metres (Partensky et al., 1999a). The most likely reason for their occurrence at this depth is vertical mixing of the water column (Bernardi Aubry et al., 2006) or perhaps the existence of two Prochloroccocus
Coastal area
0
0.5
1
1.5
2
2.5
3
3.5
4
4.5
I II III IV VI VII VIII IX X XI
MONTH
lo
g (x
+1) b
iom
ass
PROCHLOROCOCCUS SYNECHOCOCCUS PICOEUKARYOTES HB
Open sea area
0
0.5
1
1.5
2
2.5
I II III IV VI VII VIII IX X XI
MONTH
log
(x+1) b
iom
ass
PROCHLOROCOCCUS SYNECHOCOCCUS PICOEUKARYOTES HB
www.intechopen.com

Identification and Characterisation of Microbial Populations Using Flow Cytometry in the Adriatic Sea
37
ecotypes that inhabit the shallow and deeper euphotic layer (Moore et al., 1998; Partensky et al., 1999a). Our results generally showed that in the investigated microbial community autotrophic component was dominant over the heterotrophic component during the winter season, while dominance of heterotrophic component in the microbial community was observed during the warmer seasons. Further, within the prokaryotic community heterotrophic prokaryotes were mostly dominant throughout the studied area. It is also important to point out that autotrophic prokaryotic community was mostly dominated by the Synechococcus biomass, and it was also observed that the biomass of Prochlorococcus was higher in the open sea area in comparison with the coastal site (Figure 8).
Owing to the ability to analyze around ten thousand cells in few minutes, flow cytometry can really reduce the time needed for determination of microbial abundances and offer new insights into the structure and functioning of microbial communities that can not be obtained with conventional epifluorescence microscopy.
The future research of microbial communities in the Adriatic Sea, in addition to the characterisation of the microbial community by analysing endogenous fluorescence (chlorophyll and phicoerythrin fluorescence) and exogenous fluorescence (DNA dyes), should also introduce the methods of single cell analysis by cytometry. Introduction of activity probes, nucleic acid probes and immunofluorescent probes will expand the knowledge about functioning within the specific communities and between different ones.
4. Conclusions
In conclusion, the results reported herewith show a significant relationship between epifluorescence microscopy and flow cytometry, but coefficients of variation were considerably lower for bacterial counts estimated by flow cytometry than epifluorescence microscopy. Generally, the use of flow cytometry in marine microbiology reduces the processing time of the sample and increases the number of processed samples. Also, the use of this method provides more information about microbial community members, especially for Prochlorococcus, HNA and LNA bacterial groups (cells are not visible by epifluorescence microscopy). Thanks to flow cytometry, first data for abundances of Prochlorococcus, HNA and LNA bacteria were published, and this method increases the knowledge about microbial community members and their relationships in the Adriatic Sea.
5. Acknowledgments
This research was supported by the Croatian Ministry of Science, Education and Sport as part of the research program ‘Role of plankton communities in the energy and matter flow in the Adriatic Sea ‘(project no 001-0013077-0845). Also thank Olja Vidjak and Marin Ordulj to help.
6. References
Agawin, N.S.R., Duarte, C.M. and S. Agustí. 1998. Growth and abundance of Synechococcus sp. in a Mediterranean Bay: seasonality and relationship with temperature. Mar. Ecol. Prog. Ser. 170: 45–53.
www.intechopen.com
Flow Cytometry – Recent Perspectives
38
Agawin, N.S.R., Duarte, C.M. and S. Agustí. 2000. Nutrient and temperature control of the contribution of picoplankton to phytoplankton biomass and production. Limnol. Oceanogr. 45: 591–600.
Allman, R., R. Manchee and D. Lloyd. 1993. Flow cytometric analysis of heterogeneousbacterial populations. In 27-47. Flow cytometry in microbiology. D. Lloyd (ed.). pp. Springer-Verlag, London, United Kingdom.
Andrade, L., A.M.Gonzales, C.E. Rezende, M. Suzuki, J.L. Valentin and R. Paranhos. 2007. Distribution of HNA and LNA bacterial groups in the Southwest Atlantic Ocean. Braz. J. Microbiol. 38: 330-336.
Azam, F. and R.E. Hodson. 1977. Size distribution and activity of marine microheterotrophs. Limnol. Oceanogr. 22: 492–501.
Bernardi-Aubry, F., F. Acri, M. Bastianini, A. Pugnetti, and G. Socal. 2006. Picophytoplankton contribution to phytoplankton community structure in the Gulf of Venice (NW Adriatic Sea). International Review of Hydrobiology. 91: 51–70.
Buck, K.R., F.P. Chavez and L. Campbell. 1996. Basin-wide distributions of living carbon components and the inverted trophic pyramid of the central gyre of the North Atlantic Ocean, summer 1993. Aquat. Microb. Ecol. 10: 283-298.
Burkill, P.H. 1987. Analytical flow cytometry and its application to marine microbial ecology. IN: Microbes in the sea. M. A. Sleigh (Ed.). pp.139-166. J. Wiley & Sns, Chichester, W. Sussex (England).
Callieri, C. and J. C: Stockner. 2002. Freshwater autotrophic picoplankton: a review. J. Limnol. 61: 1–14.
Calvo-Díaz, A. and X.A.G. Morán. 2006. Seasonal dynamics of picoplankton in shelf waters of the southern Bay of Biscay. Aquat. Microb. Ecol. 42: 159–174.
Chisholm, S.W., R.J. Olson, E.R. Zettler, J.B. Waterbury, R. Goericke and N. Welschmeyer. 1988. A novel free-living prochlorophyte occurs at high cell concentrations in the oceanic euphotic zone. Nature. 334: 340–343.
Christaki, U., A. Giannakourou, F. Van Wambeke and G. Grégori. 2001. Nanoflagellate predation on auto- and heterotrophic picoplankton in the oligotrophic Mediterranean Sea. J. Plankton Res. 23 : 1297-1310.
Christaki, U., C. Courties, H. Karayanni, A. Giannakourou, C. Maravelias, K.A. Kormas and P. Lebaron. 2002. Dynamic characteristics of Prochlorococcus and Synechococcus consumption by bacterivorous nanoflagellates. Microb. Ecol. 43: 341-352.
Cole, J.J., S. Findlay and M.L. Pace. 1988. Bacterial production in fresh and saltwater ecosystems: a cross-system overview.Mar. Ecol. Prog. Ser.43: 1–10.
Collier, J. L. and L. Campbell. 1999. Flow cytometry in molecular aquatic ecology. Hydrobiologia. 401:33–53.
Cotner, J.B. and B. A. Biddanda. 2002. Small players, large role: microbial influence on auto-heterotrophic coupling and biogeochemical processes in aquatic ecosystems. Ecosystems. 5: 105–121.
Darzynkiewicz, Z. and Crissman, H.A.: Preface. 1990. In: Methods in Cell Biology Vol. 33. Flow Cytometry. Z. Darzynkiewicz and H.A. Crissman, (eds.). pp, 15-17. Academic Press. New York.
Davey, H., and D. Kell. 1996. Flow cytometry and cell sorting of heterogeneous microbial populations: the importance of single-cell analysis. Microbiol. Rev. 60: 641-696.
www.intechopen.com

Identification and Characterisation of Microbial Populations Using Flow Cytometry in the Adriatic Sea
39
Ducklow, H.W., D.A. Purdie, P.J.L. Williams and J.M. Davis. 1986. Bacterioplankton: A sink for carbon in a coastal marine plancton community. Science. 232: 865–867.
Fouchet, P., C. Jayat, Y. Hechard, M.H. Ratinaud, and G. Frelat. 1993. Recent advances in flow cytometry in fundamental and applied microbiology. Biochem. Cell Biol. 78: 95–109.
Fuks, D., J. Radić, T. Radić, M. Najdek, M. Blažina, D. Degobbis and N. Smodlaka. 2005. Relationships between heterotrophic bacteria and cyanobacteria in the northern Adriatic in relation to the mucilage phenomenon. Sci. Total Environ. 353: 178-188.
Garczarek, L., A. Dufresne, S. Rousvoal, N.J. West, S. Mazard, D. marie, H. Claustre, P. Raimbault, A.F.Post, D.J.Scanlan and F. Partensky. 2007. High vertical and low horizontal diversity of Prochlorococcus in the Mediterranean Sea in summer. FEMS Microbiol. Ecol. 60: 189-206.
Gasol, J.M. and X.A.G. Morán. 1999. Effects of filtration on bacterial activity and picoplankton community structure as assessed by flow cytometry. Aquat. Microb. Ecol. 16: 251–264.
Gasol, J.M., U.L. Zweifel, F. Peters, J.A. Furhman and Å. Hagström. 1999. Significance of size and nucleic acid content heterogeneity as assessed by flow cytometry in natural planktonic bacteria. Appl. Environ. Microbiol. 65: 4475–4483.
Guillou, L., S. Jacquet, M.J. Chretiennot-Dinet and D. Vaulot. 2001. Grazing impact of two heterotrophic flagellates on Prochlorococcus and Synechococcus. Aquat. Microb. Ecol. 26: 201–207.
Hobbie, J.E., R.J. Daley and S. Jasper. 1977. Use of nucleopore filters for counting bacteria by epifluorescence microscopy. Appl.Environ.Microbiol.33: 1225-1228.
Jiao, N.Z., Y.H. Yang, H. Koshikawa and M. Watanabe. 2002. Influence of hydrographic conditions on picoplankton distribution in the East China Sea. Aquat. Microb. Ecol. 30: 37-48.
Joachimsthal, E.L., V. Ivanov, J-H. Tay and S.T-L. Tay. 2003. Flow cytometry and conventional enumeration of microorganisms in ships’ ballast water and marine samples. Mar.Poll.Bul. 46: 308-313.
Jochem, F.J. 2001. Morphology and DNA content of bacterioplankton in the northern Gulf of Mexico: analysis by epifluorescence microscopy and flow cytometry. Aquat. Microb. Ecol. 25: 179-194.
Jochem, F.J., P.J. Lavrentyev and M.R. First. 2004. Growth and grazing rates of bacteria groups with different apparent DNA content in the Gulf of Mexico, Mar. Biol. 145: 1213–1225.
Krstulović, N. 1992. Bacterial biomass and production rates in the central Adriatic. Acta Adriat. 33: 49-65.
Krstulović, N., T. Pucher-Petković and M. Šolić. 1995. The relation between bacterioplankton and phytoplankton production in the mid Adriatic Sea. Aquat. Microb. Ecol. 9: 41-45.
Krstulović, N., M. Šolić and I. Marasović. 1997. Relationship between bacteria, phytoplankton and heterotrophic nanoflagellates along the trophic gradient. Helgöland. Meeresuntersuch. 51: 433-443.
Lebaron, P., M. Troussellier and P. Got. 1993. Accuracy and precision of epifluorescence microscopy count for direct estimates of bacterial numbers. J.Microbiol.Meth.19: 89-94.
www.intechopen.com
Flow Cytometry – Recent Perspectives
40
Lebaron, P., N. Parthuisot and P.Catala. 1998. Comparison of blue nucleic acid dyes for flow cytometric enumeration of bacteria in aquatic systems. Appl.Environ.Microbiol. 64: 1725-1730.
Li, W.K.W., T. Zohary, Z. Yacobi and A.M. Wood. 1993: Ultraphytoplankton in the eastern Mediterranean Sea: towards deriving phytoplankton biomass from flow cytometric measurements of abundance, fluorescence and light scatter. Mar. Ecol. Prog. Ser. 102: 79–87.
Li, W.K.W., J.F. Jellett and P.M. Dickie. 1995. DNA distribution in planktonic bacteria stained with TOTO or TO-PRO. Limnol. Oceanog. 40: 1485-1495.
López-Lozano, A., J. Diez, S. El Alaoui, C. Moreno-Vivián and J.M. García-Fernández. 2002. Nitrate is reduced by heterotrophic bacteria but not transferred to Prochlorococcus non axenic cultures. FEMS Microb. Ecol .41: 151–160.
Marie, D., D. Vaulot and F. Partensky. 1996. Application of the novel nucleic acid dyes YOYO-1, YO-PRO-1, and PicoGreen for flow cytometric analysis of marine prokaryotes. Appl.Environ.Microbiol .62: 1649-1655.
Marie, D., F. Partensky, S. Jacquet and D. Vaulot. 1997. Enumeration and cell cycle analysis of natural populations of marine picoplankton by flow cytometry using the nucleic acid stain SYBR Green I. Appl. Environ. Microb. 63: 186-193.
Marasović, I. i sur. 2006. Biološke osobine pp. 68-81. u Kušpilić. G. i sur. Kontrola kakvoće obalnog mora (Projekt Vir-Konavle 2005). Studije i elaborati Instituta za oceanografiju i ribarstvo, Split.
Martin, V. 1997. Etude par cytometrie en flux de la distribution des populations phytoplanctoniques en Mediterranée. Mise en relation avec la production metabolique de CO2 et comparaison avec le golfe du Saint-Laurent. Thesis: Université de la Mediterranée. 250 p.
Monger, B.C. and M. R.Landry. 1993. Flow cytometric analysis of marine bacteria with Hoechst 33342. Appl.Environ.Microbiol. 59: 905-911.
Moore, L.R., G. Rocap, and S.W. Chisholm. 1998. Physiology and molecular phylogeny of coexisting Prochlorococcus ecotypes. Nature. 393: 464-467.
Moore, L.R., A.F. Post, G. Rocap and S.W. Chisholm. 2002. Utilization of Different Nitrogen Sources by the Marine Cyanobacteria Prochlorococcus and Synechococcus. Limnol. Oceanogr. 47: 989-996.
Neuer, S. 1992. Growth dynamics of marine Synechococcus spp in the Gulf of Alaska. Mar. Ecol. Prog. Ser. 83: 251-262.
Ninčević Gladan, Ž., I. Marasović, G. Kušpilić, N. Krstulović, M. Šolić and S. Šestanović. 2006. Abundance and composition of picoplankton in the mid Adriatic Sea. Acta Adriat. 47: 127-140.
Olson, R.J. S.W. Chisholm, E.R. Zettler and E.V. Armbrust. 1990. Pigments, Size, and Distribution of Synechococcus in the North Atlantic and Pacific Oceans. Limnol. Oceanogr. 35: 45-58.
Olson, R.J., S.W. Chisholm, E.R. Zettler and E.V. Armbrust. 1988. Analysis of Synechococcus pigment types in the sea using single and dual beam flow cytometry. Deep Sea Res. 35: 425-440.
Pan, L.A., L.H. Zhang, J. Zhang, J.M. Gasol and M.Chao. 2005. On-board flow cytometric observation of picoplankton community structure in the East China Sea during the fall of different years. FEMS Microb. Ecol. 52: 243–253.
www.intechopen.com
Identification and Characterisation of Microbial Populations Using Flow Cytometry in the Adriatic Sea
41
Pan, L.A., J. Zhang and L.H. Zhang. 2007. Picophytoplankton, nanophytoplankton, heterotrohpic bacteria and viruses in the Changjiang Estuary and adjacent coastal waters. J. Plankton Res. 29: 187-197.
Paoli, A. and P. Del Negro. 2006. Bacterial abundances in the Gulf of Trieste waters from 1993 to 2004. Biol. Mar. Medit. 13: 141–148.
Partensky, F., J. Blanchot, and D. Vaulot. 1999a. Differential distribution and ecology of Prochlorococcus and Synechococcus in oceanic waters: a review. Bull. Inst. Oceanogr. Monaco Numero Spec. 19: 431-449.
Partensky, F., W.R. Hess and D.Vaulot. 1999b. Prochlorococcus, a marine photosynthetic prokaryote of global significance. Microb. Mol. Biol. Rev. 63: 106–127.
Porter, K.G. and Y.S. Feig. 1980. The use of DAPI for identifying and counting aquatic microflora. Limnol.Oceanol. 25: 943-948.
Porter, J., D. Deere, M. Hardman, C. Edwards and R. Pickup. 1997. Go with the flow: use of flow cytometry in environmental microbiology. FEMS Microbiol. Ecol. 24: 93–101.
Radić, T., T. Šilović, D. Šantić, D. Fuks and M. Mičić. 2009. Preliminary flow cytometric analyses of phototrophic pico-and nanoplankton communities in the Northern Adriatic. Fresen. Environ. Bull. 18: 715-724.
Raven, J.A. 1986. Physiological consequences of extremely small size for autotrophic organisms in the sea. In: Photosyntetic picoplankton. Pp. 1-70. Platt T, Li WKW (eds) Can. Bull. Fish. Aquat. Sci. 214.
Shapiro, L.P, and E.M. Haugen. 1988. Seasonal distribution and tolerance of Synechococcus in Boothbay harbor, maine. Estuar. Coast. Shelf. Sci. 26:517-525.
Sieracki, M.E., E.M. Haugen and T.L. Cucci. 1995.Overestimation of heterotrophic bacteria in the Sargasso Sea. Direct evidence by flow and imaging cytometry. Deep-Sea Res. Part I 42: 1399-1409.
Shapiro, H. M. 1995. Practical flow cytometry, 3rd ed. Wiley-Liss, New York, N.Y. Sommaruga, R., J.S. Hofer, L. Alonso-Sáez and J.M. Gasol. 2005. Differential sunlight
sensitivity of picophytoplankton from surface Mediterranean coastal waters. Appl. Environ. Microbiol. 71:2157-2157.
Šantić, D., N. Krstulović and M. Šolić. 2007. Comparison of flow cytometric and epifluorescent counting methods for marine heterotrophic bacteria. Acta Adriatic. 48: 107-114.
Šantić, D., N. Krstulović, M. Šolić, Mladen and G. Kušpilić, 2011. Distribution of Synechococcus and Prochlorococcus in the central Adriatic Sea. Acta Adriatic. 52 : 101-113.
Šolić, M., N. Krstulović and S. Šestanović. 2001. The roles of predation, substrate suply and temperature in controlling bacterial abundance : interaction between spatial and seasonal scale. Acta Adriat. 42: 35-48.
Šolić, M., N. Krstulović, I.Vilibić, G. Kušpilić S. Šestanović, D. Šantić and M. Ordulj. 2008. The role of water mass dynamics in controlling bacterial abundance and production in the middle Adriatic Sea. Mar. Environ. Res. 65: 388-404.
Šolić, M., N. Krstulović, I. Vilibić, N. Bojanić, G. Kušpilić, S. Šestanović, D. Šantić and M. Ordulj. 2009. Variability in the bottom-up and top-down control of bacteria on trophic and temporal scale in the middle Adriatic Sea. Aquat. Microb. Ecol. 58: 15–29.
www.intechopen.com
Flow Cytometry – Recent Perspectives
42
Šolić, M., N. Krstulović, G. Kušpilić, Ž. Ninčević Gladan, N. Bojanić, S. Šestanović, D. Šantić and M. Ordulj. 2010.Changes in microbial food web structure in response to changed environmental trophic status: A case study of the Vranjic Basin (Adriatic Sea). Mar. Environ. Res.70: 239-249.
Troussellier, M., C. Courties and A. Vaquer. 1993. Recent applications of flow cytometry in aquatic microbial ecology. Biol. Cell. 78: 111–121.
Uysal, Z. and İ. Köksalan. 2006. The annual cycle of Synechococcus (cyanobacteria) in the northern Levantine Basin shelf waters (Eastern Mediterranean). Mar. Ecol. 27:187–197.
Vaquer, A., M. Troussellier, C. Courties and B. Bibent, 1996: Standing stock and dynamics of picophytoplankton in the Thau Lagoon (northwest Mediterranean coast). Limnol. Oceanogr. 41: 1821–1828.
Vaulot D., F. Partensky, J. Neveux., R.F.C. Mantoura and C. Llewellyn. 1990. Winter presence of prochlorophytes in surface waters of the northwestern Mediteranean Sea. Limnol. Oceanogr. 35: 1156-1164.
Vaulot, D. and F.Partensky. 1992. Cell cycle distributions of prochlorophytes in the North Western Mediterranean Sea. Deep Sea Res. 39: 727-742.
Viličić, D., M. Kuzmić, S. Bosak, T. Šilović, E. Hrustić and Z. Burić. 2009. Distribution of phytoplankton along the thermohaline gradient in the north-eastern Adriatic channel; winter aspect. Oceanologya. 51: 495-513.
Waterbury, J.B., S.W. Watson, F.W. Valois and D.G. Franks. 1986b. "Biological and ecological characterization of the marine unicellular cyanobacterium Synechococcus". Can. J. Fish. Aquat. Sci. 214: 71–120.
Wehr, J. D. 1993. Effects of experimental manipulations of light and phosphorus supply on competition among picoplankton and nanoplankton in an oligotrophic lake. Can. J. Fish. Aquat. Sci.50: 936–945.
Worden, A.Z., J.K Nolan and B. Palenik. 2004. Assessing the dynamics and ecology of marine picophytoplankton: the importance of the eukaryotic component. Limnol. Oceanogr. 49: 168–179.
Zhang, Y., N.Z. Jiao and N. Hong. 2008. Comparative study of picoplankton biomass and community structure in different provinces from Subarctic to Subtropical oceans. Deep-Sea Res. Part II. 55: 1605- 1614.
Zubkov, M.V., B.M. Fuchs, P.H. Burkill and R. Amann. 2001a. Comparison of cellular and biomass specific activities of dominant bacterioplankton groups in stratified waters of the Celtic Sea. Appl. Environ. Microbiol. 67: 5210–5218.
Zweifel, U. L. and Å. Hagström. 1995. Total counts of marine bacteria include a large fraction of non-nucleoid-containing bacteria (ghosts). Appl. Environ. Microbiol. 61: 2180-2185.
www.intechopen.com

Flow Cytometry - Recent PerspectivesEdited by M.Sc. Ingrid Schmid
ISBN 978-953-51-0626-5Hard cover, 500 pagesPublisher InTechPublished online 13, June, 2012Published in print edition June, 2012
InTech EuropeUniversity Campus STeP Ri Slavka Krautzeka 83/A 51000 Rijeka, Croatia Phone: +385 (51) 770 447 Fax: +385 (51) 686 166www.intechopen.com
InTech ChinaUnit 405, Office Block, Hotel Equatorial Shanghai No.65, Yan An Road (West), Shanghai, 200040, China
Phone: +86-21-62489820 Fax: +86-21-62489821
"Flow Cytometry - Recent Perspectives" is a compendium of comprehensive reviews and original scientificpapers. The contents illustrate the constantly evolving application of flow cytometry to a multitude of scientificfields and technologies as well as its broad use as demonstrated by the international composition of thecontributing author group. The book focuses on the utilization of the technology in basic sciences and coverssuch diverse areas as marine and plant biology, microbiology, immunology, and biotechnology. It is hoped thatit will give novices a valuable introduction to the field, but will also provide experienced flow cytometrists withnovel insights and a better understanding of the subject.
How to referenceIn order to correctly reference this scholarly work, feel free to copy and paste the following:
Danijela Santic and Nada Krstulovic (2012). Identification and Characterisation of Microbial Populations UsingFlow Cytometry in the Adriatic Sea, Flow Cytometry - Recent Perspectives, M.Sc. Ingrid Schmid (Ed.), ISBN:978-953-51-0626-5, InTech, Available from: http://www.intechopen.com/books/flow-cytometry-recent-perspectives/identification-and-characterisation-of-microbial-populations-using-flow-cytometry-in-the-adriati

© 2012 The Author(s). Licensee IntechOpen. This is an open access articledistributed under the terms of the Creative Commons Attribution 3.0License, which permits unrestricted use, distribution, and reproduction inany medium, provided the original work is properly cited.