Embed Size (px)
Citation preview

ISSN 1744-1986
T e c h n i c a l R e p o r t N O 2008/ 02
Identification of User Information NeedsBased in the Analysis of Local Web Search
Queries
J. Dokler
28 June, 2008
Department of ComputingFaculty of Mathematics, Computing and TechnologyThe Open University
Walton Hall, Milton Keynes, MK7 6AAUnited Kingdom
http://computing.open.ac.uk
Identification of User Information Needs Based
in the Analysis of Local Web Search Queries
A dissertation submitted in partial fulfilment of the requirements for the Open University’s Master of Science Degree in Software Development.
Joahim Dokler
(W8427136)
10 March 2009
Word count: 12,452

Preface
I would like to thank my dear friends Maja Brajnik and Andrej Bauer for their continuous
encouragement and their willingness to endlessly discuss my work on this dissertation.
Special thanks to my supervisor Kathy Spurr for her invaluable advice and guidance.

ii
Table of Contents
Preface .................................................................................................................................. i
Table of Contents .................................................................................................................. ii
List of Figures ........................................................................................................................ iv
List of Tables ......................................................................................................................... iv
Abstract .................................................................................................................................v
1 Introduction ................................................................................................................ 1
1.1 Background ............................................................................................................................ 1
1.1.1 Single Web Site and User Information Needs .................................................................. 1
1.1.2 Change of User Information Needs .................................................................................. 3
1.2 The Objectives of this Research ............................................................................................. 3
1.3 The Research Question .......................................................................................................... 4
1.4 Intended Audience ................................................................................................................ 4
1.5 Contribution to Knowledge ................................................................................................... 4
1.6 Summary ................................................................................................................................ 5
2 Literature Review ........................................................................................................ 6
2.1 Introduction ........................................................................................................................... 6
2.2 Clickstream Data Processing .................................................................................................. 7
2.3 Nature and Distribution of Search Queries ........................................................................... 9
2.4 Search Query Clustering ...................................................................................................... 12
2.4.1 Content Ignorant Search Query Clustering .................................................................... 12
2.4.2 Content Aware Search Query Clustering ........................................................................ 14
2.4.3 Comparison of Content Ignorant and Content Aware Methods .................................... 15
2.5 Summary .............................................................................................................................. 16
3 Research Methods ......................................................................................................17
3.1 Web Server Log Pre-processing ........................................................................................... 18
3.1.1 Filtering ........................................................................................................................... 18
3.1.2 Storage ............................................................................................................................ 19
3.2 Manual Search Query Clustering ......................................................................................... 20
3.3 Automatic Search Query Clustering .................................................................................... 21
3.4 Comparison and Analysis of the Results .............................................................................. 22
3.4.1 Manual clustering versus Automatic Clustering ............................................................. 22
3.4.2 Automatic Clustering of data from Different Time Periods ........................................... 23

iii
3.5 Summary .............................................................................................................................. 23
4 Results .......................................................................................................................24
4.1 Introduction ......................................................................................................................... 24
4.2 Web Server Log Pre-processing ........................................................................................... 24
4.3 Manual Clustering ................................................................................................................ 25
4.3.1 Manual clustering of Mobitel Query Log ........................................................................ 25
4.3.2 Manual Clustering of the Coolinarika Query Log ........................................................... 27
4.4 Automatic Clustering ........................................................................................................... 28
4.4.1 Content Clustering of Coolinarika Query Log ................................................................. 28
4.4.2 Temporal Analysis........................................................................................................... 31
4.5 Identification of Missing Content ........................................................................................ 32
4.6 Data Noise and Termination of Clustering .......................................................................... 33
4.7 Summary .............................................................................................................................. 33
5 Conclusions ................................................................................................................34
5.1 Introduction ......................................................................................................................... 34
5.2 Key Findings of this Research .............................................................................................. 34
5.2.1 The Nature of The Search Queries ................................................................................. 34
5.2.2 Determination of Site Structure by Query Clustering .................................................... 35
5.2.3 Identification of Change in User Information Needs ...................................................... 37
5.2.4 Missing Content .............................................................................................................. 37
5.3 Validation and Implications of this Research ...................................................................... 37
5.4 Limitations of this Research ................................................................................................. 38
5.4.1 Size and Type of Analyzed Data ...................................................................................... 38
5.4.2 Session Analysis .............................................................................................................. 38
5.4.3 Manual Clustering Bias ................................................................................................... 39
5.4.4 Examination of the Search Engine Quality ..................................................................... 39
5.5 Future research .................................................................................................................... 39
5.6 Summary .............................................................................................................................. 40
References ...........................................................................................................................41
Glossary ...............................................................................................................................44
Index ..................................................................................................................................46
Appendix A Automatic Clustering Algorithm Code Listing ......................................................47

iv
List of Figures
Figure 2.1 Example of a transaction log entry ...............................................................................7
Figure 2.2 Zipf’s distribution on linear and log-log graph (a = 1.2)............................................. 11
Figure 4.1 Top 15 clusters from Mobitel manual clustering ....................................................... 26
List of Tables
Table 1.1 Activities used to answer the research question ...........................................................4
Table 2.1 Main themes of the literature review ............................................................................6
Table 3.1 Summary of the research methods used .................................................................... 17
Table 3.2 Query list before clustering ......................................................................................... 20
Table 3.3 Query list after some queries have been clustered .................................................... 21
Table 4.1 Size reduction of the Coolinarika log file during the log pre-processing .................... 24
Table 4.2 Rules for clustering search queries about mobile phones .......................................... 25
Table 4.3 Top 15 clusters from Mobitel manual clustering ........................................................ 27
Table 4.4 Most popular un-clustered queries from Coolinarika for June 2008 .......................... 29
Table 4.5 Most popular clusters from Coolinarika for June 2008 ............................................... 29
Table 4.6 Most popular un-clustered queries from Coolinarika for October 2008 .................... 31
Table 4.7 Most popular clusters from Coolinarika for October 2008 ......................................... 31

v
Abstract
Together with the emergence of the World Wide Web some sixteen years ago there came the
promise of instant feedback from users as to what information they want and when they want
it. This information could then be used to determine the content and structure of web sites.
As is usually the case, reality proved to be more complicated. Although user feedback was
indeed instantaneous, the analysis was mostly limited to what people looked at as opposed to
what they were looking for.
Only in recent years has research focused on analysis of search queries that users submit to
search engines. And search queries come close to representing what users are looking for. Still
the majority of this research is based on queries from general purpose search engines.
In this dissertation I explore the findings and ideas coming from the work on general search
engines (and in parts on local search engines) and try to apply them in the context of a single
web site to improve the structure and content of this web site.
In particular I explore the idea that it is possible to determine the top level content elements
of a web site from the analysis of the local search queries. Based on this I then proceed to
explore the periodic change of web site’s content and how this information can be used to
improve the web site.
By implementing two different methods of search query analysis (manual and automatic
clustering) and examining the results I show that search query analysis is a viable potential
source of information about a web site’s structure and that identification of periodic changes
of content can be used to amend a web site in advance before the next change occurs.

1
1 Introduction
1.1 Background With the ever increasing amount of information created by human society, most notably on
the World Wide Web, the ability of individuals to find information in the shortest possible
space of time is becoming of the greatest importance. Therefore if we are to make existing
information useful and accessible, we must not only make it available but also findable.
Morville (2005) defines findability as:
a) The quality of being locatable or navigable.
b) The degree to which a particular object is easy to discover or locate.
c) The degree to which a system or environment supports navigation and retrieval.
Another key aspect of information is its relevance. Even if the information is findable it is
useless unless it is at the same time relevant to the user who finds it. Furthermore it is
important to understand that the relevance of information is in most cases determined by
human interest.
In the context of the entire Web we can see the manifestation of this fact in the examination
of the general purpose search engines such as Google which compute the relevance of their
search results based on the links people create between documents on the Web. The more
links people create to a certain document, the higher the rank (and consequently relevance)
this document will have (Brin and Page, 1998). As a result of this simple but powerful idea,
searching has become primary way for people to find information on the Web.
1.1.1 Single Web Site and User Information Needs
In the context of a single web site experts responsible for aligning the content and structure of
the web site with information needs of users are information architects. They try to align user
information needs and web site’s content and structure in such a way that users can find the
information as quickly as possible.
A single web site in most cases do not provide information architects with the wealth of
information about content relevance as is the case of the entire Web. As a result, the
information architects focus on the site’s users, content and context to develop the site

2
structure (Morville and Rosenfeld, 2006). This process can be very complex and unfortunately
inexact. Furthermore, it is often not clear how well (if at all) the site satisfies information needs
of its users.
To remedy the situation information architects rely on direct or indirect feedback from the
users after the site has been designed. Methods used to elicit this feedback can be divided into
two main groups:
User testing where users are observed while using the site and describing their
experience to the tester (Krug, 2000).
Clickstream data analysis which analyzes transaction logs of communication between
a user and a web site.
Information architects use this feedback to change the structure and content of a web site
with the aim of enhancing findability of information of a given Web site (Srivastava et al.,
2000). As there is constant change of user information needs and content this process is
cyclical.
Based on the nature of the data each group analyzes and the approaches took by the papers I
reviewed I further divided the clickstream data analysis into two main groups:
1. Browse log analysis which deals with data generated by users browsing a web site.
2. Search log analysis (or local search log analysis to distinguish it from general purpose
search engine log analysis) which deals with search queries generated by users using a
web site’s search engine.
In the case of browse log analysis the user information needs are stated implicitly (what
people were looking at) and can mostly be extracted through interpretation. In the case of
search log analysis however, the user information needs are expressed more directly (what
people were looking for). To emphasize the distinction between these two ways user
information needs are stated Baeza-Yates (2005) calls search queries demonstrated
information needs.

3
This difference between the implicitly and directly stated information needs can be clearly
illustrated by identifying the missing content. Consider this comment to the article Tweaking
Internal Site-Searches into Buying Opportunities (McGuigan, 2008):
Eight years ago Zappos.com did not exist. Today, it is the largest online retailer of shoes. In the
last eight years Zappos executed many brilliant strategies but there is one that succinctly
illustrates the power of the online channel. Zappos monitors their site searches and noticed a
disproportionate number of queries for ‘vegetarian shoes’. Being smart and nimble they quickly
realized potential and created a new category for vegetarian shoe shoppers which quickly
became a significant source of revenue.
It would never be possible to identify the missing content category (in terms of user
information needs) just by analyzing the browse logs; the missing content category would
never show up.
1.1.2 Change of User Information Needs
User information needs often change over time. For example, in a case of a major event such
as a big earthquake, the information needs of on-line news site readers (or even people who
otherwise do not visit such sites) would likely include information about such an event. This is
an example of a one-time change of user information needs.
Clearly, the change in user information needs can also occur periodically. For example, users
of a culinary web site might seek different dishes during the summer than during the winter. In
terms of a general purpose search engine Beitzel et al. (2007) discovered the rise of user
interest in entertainment towards the evening and night time while financial information was
most searched for during the day.
1.2 The Objectives of this Research
This research project investigated the local search log analysis.
The primary objective of this research project was to identify how search log analysis can be
used to suggest changes in the structure and content of a web site so that information
featured on the web site is findable and aligned with user information needs (with focus on
periodic change of information needs).

4
The secondary objective of this research was to test some of the methods and report on how
these methods behave while being applied on the clickstream data from selected web sites.
Following are the activities used to achieve the stated objectives:
Activity Activity description
1. Literature review Review the current literature on this area and identify
possible answers to the research question.
2. Select testing methods Select a method, modified method or a combination of
methods identified in literature review suitable for
testing.
3. Apply testing method
Apply the selected method(s) on search query logs from
selected web sites.
4. Analyze the results
Analyze the results and interpret them in terms of the
research question.
5. Present the result Present the results of the analysis and possible findings.
Table 1.1 Activities used to answer the research question
1.3 The Research Question The research question addressed by this research is as follows:
How and to what extent can web sites with changing user needs, context and content
benefit from local search log analysis?
1.4 Intended Audience The primary audience of this research are information architects, web developers and content
editors of web sites whose content and user information need change through time especially
in cases where these changes occur periodically.
1.5 Contribution to Knowledge Expected contribution to knowledge is in the idea that by using local search log analysis
information architects may be able to:
a) Devise top level content topics of a web site from search query clusters.

5
b) Predict change in user information needs in advance and prepare their sites
accordingly before this change occurs. This should be possible in cases where certain
information needs occur periodically (for example every evening or every weekend).
1.6 Summary This chapter provided description of the main problems in aligning a web site’s content and
structure with information needs of web site’s users. It introduced the main tools which
information architects can use to overcome such problems and also introduced the concept of
change in user information needs.
This chapter identified the research question that will be addressed in this dissertation and
outlined the activities that will be performed to answer this question.
The following chapter presents the literature review that explores this in greater detail and
provides part of the answer to the proposed research question.

6
2 Literature Review
2.1 Introduction This literature review forms part of the research on how the local search query analysis can be
used to improve a web site’s structure and content.
Not all the papers reviewed here deal directly with local search analysis – the body of
literature, at the time of this dissertation, related directly to local search query analysis was
relatively small compared to the body of literature related to browse log analysis. Still, the
papers suggest interesting ideas and provide context that can be used to in part answer the
research question of this dissertation.
During the literature review a number of different themes emerged. Table 2.1 below lists these
themes, organized as sections, along with their descriptions and reasons why each of the
themes is relevant for this research. Each theme builds on or stems from the findings of its
predecessor.
Theme Description and importance of the theme
Clickstream data processing This is the foundation for all further work. Basic
concepts are introduced and suggestions for data
storage, pre-processing and processing are provided.
The nature and the distribution of
search queries
This theme deals with the structure of the search
queries and their distribution. The nature of the
distribution of queries dictates how processing should
be carried out.
Search query clustering To make the analysis of search queries possible (as a
result of their distribution) clustering methods must
be used.
Table 2.1 Main themes of the literature review

7
2.2 Clickstream Data Processing
Each time a visitor interacts with a web site, the web server hosting the web site logs this
interaction as clickstream data in the transaction log. Clickstream data is usually composed of
the following fields:
IP (Internet Protocol) address of the user’s computer
Transaction date and time
Address of the requested document or URL (Uniform Resource Locator)
Transaction status (success, error …)
Referrer URL (URL of the document from which the user navigated to the requested
document)
Identifier of the web browser the user used to access the web site.
83.131.237.241 - - [04/Nov/2008:08:01:07 +0100] "GET /recept/vjesticin-sesiric HTTP/1.1" 200
10242 "http://www.coolinarika.com/clanak/halloween-djecji-party" "Mozilla/4.0 (compatible;
MSIE 6.0; Windows NT 5.1; SV1)"
Figure 2.1 Example of a transaction log entry
Web site owners can use this data to perform a wide array of clickstream data analysis which
Srivastava et al. (2000) divide into the following stages:
Pre-processing where we clean, parse and transform the data in the form suitable for
further processing. For example, we can store clickstream data in the SQL database.
Pattern discovery where we look for patterns such as most requested documents,
paths users make through the web site, document clusters etc.
Pattern analysis where we look for interesting patterns found during the pattern
discovery.
A branch of clickstream data analysis that deals with searching is called search log analysis.
Here the focus of the analysis is on the search queries that users submit to a general web
search engine such as Google or a local search engine provided by a given web site. In this case
the transaction log is extended by one field: search words and search operators users submit
to the search engine.
8
Jansen (2006) identifies and defines three main areas of the search log analysis:
Term level analysis which uses a term as the basis for analysis. A term is a string of
characters, a word. With this kind of analysis one looks for patterns such as the term
frequency distribution, high usage terms, total number of terms etc.
Query level analysis which uses a query as the basis for analysis. A query is composed
of zero or more terms. First query is called the initial query. All subsequent queries by
the same user in one search session (defined below) are called modified queries.
Examples of a query level analysis are similar to the term level analysis but also include
the analysis of the query transformation during a search session (defined below).
Session level analysis which uses a search session as the basis for analysis. A search
session or a searching episode is a series of interactions (with limited duration)
between the user and the search engine.
With the session level analysis we come closest to observing the actual user behaviour and
her information needs. It is therefore important to understand it a bit better.
What exactly constitutes a search session? In the light of the following questions the above
definition turns out to be very simplistic: what happens if a user comes back to the search
engine after some length of time? Does this count as a new session or is it part of the old one?
What then is the minimum duration of time between two interactions that does not start a
new session? Furthermore, when does a reformulation of a query represent a beginning of a
new session and when is it just a continuation of the previous one?
To answer these questions Jansen et al. (2007) compared three methods of session detection
based on:
a) IP address and cookie
b) IP address, cookie and the time between two subsequent requests
c) IP address, cookie and the content change
Their results show that defining a sessions by using method (c) provided the best results. For
this method they report the mean session duration of 5 min 15 s, with standard deviation of 39
min 22 s. This is a very useful finding since the previously reported session cut-off durations
9
ranged from 5 min to 125 min and were picked arbitrarily (as reported by Jansen et al. (2007))
or selected using less reliable methods (for example IP address alone).
This is a very useful and practical measure although not a definite one. Jansen et al. (2007), for
example, do not consider the issue of multiple browser tabs which became popular in recent
years and which offer users a way to browse (or search) multiple topics in parallel and
consequently further complicate the understanding of what constitutes a search session.
2.3 Nature and Distribution of Search Queries
If we are going to analyze search queries we must first understand what the nature of an
average search query is. In particular, how much information each query carries.
To do so in terms of a general search engine Jansen et al. (2000) performed search log analysis
in the context of a general purpose search engine Excite. They analyzed 51.473 user requests.
They report low number of queries per search session (mean value of 2.8 queries per search
session), short queries (mean value of 2.21 terms per query), and low number of result pages
viewed by the users (on average users viewed 2.35 pages of results where one result page
contained 10 results). They also report low use of Boolean operators and + and – operators
used to specify mandatory presence or absence of terms.
Silverstein and Henzinger (1999) performed similar analysis on a larger set from Altavista made
up of 575 million queries. Their findings are similar to the ones reported by Jansen et al.
(2000): 2.02 for the average number of queries per session, 2.35 for the average number of
words per query and 1.39 for the average number of pages of viewed results.
As these are rather old studies in terms of the speed with which the Web is evolving Jansen
and Spink (2006) later performed a study of nine general search engines and observed how
these numbers change over time. They confirm findings reported by Jansen et al. (2000) and
Silverstein and Henzinger (1999) and report the numbers to be fairly steady through time with
the exception of the average number of pages of viewed results which increased through the
years.
How do these numbers relate to the local web site search engines? Chau et al. (2005) analyzed
the transaction log of the Utah state government Web site (792.103 search queries). They

10
report similar (although somewhat smaller) numbers as were found for the general search
engines: 1.73 for the average number of queries per session, 2.25 for the average number of
words per query and 1.47 for the average number of pages of viewed results.
The low average number of search terms per search query and low number of queries per
session gives us very little context in terms of what exactly the user was looking for while
searching. It can also lead to ambiguities. Consider, for example, the word java: depending on
context it can denote an island, a programming language or a variety of coffee.
Although the above example of the word java looks very convincing (especially in the context
of a general search engine) the reviewed papers fail to provide much more evidence on the
lack of information or context of the search queries. Also, it is important to ask the question
who is processing the search queries: a person or a computer? Perhaps the authors have in
mind the computers (they do not state this) in which case the claim makes more sense.
What about the frequency with which each individual query shows up in the transaction log?
As the number of different unique queries can quickly run into thousands, it is, intuitively and
from the practical viewpoint of the information architect, reasonable to consider the more
popular ones (i.e. the ones that show up more often). If we are to do so, we must first
examine the distribution of occurrences of the queries in the transaction log.
The query (or term) frequency distribution tells us how often certain queries (or terms) appear
in the transaction log. For example, in the case of the Utah state government web site
analyzed by Chau et al. (2005), the most common term was ‘utah’ which appeared 40,425
times, the twentieth most common term was ‘laws’ appearing 6,188 times and so on to a large
number of terms that appeared only once. Papers I reviewed did not distinguish between the
upper and lower case versions of terms. I followed the same rule in my own experiments.
While some of the papers looked at the term frequency distribution and some of the papers
looked at the query frequency distribution they all report that the observed distributions
follow the Zipf distribution.
The Zipf distribution is the mathematical manifestation of the Zipf’s law (Zipf, 1932) which
states that in the corpus of the natural language utterances, the frequency of any word is
inversely proportional to its rank (popularity) in the frequency table. In mathematical terms

11
this means that the probability of attaining a certain frequency x is proportional to x-a, where a
is greater than or equal to 1 (Adamic and Huberman, 2002).
Figure 2.2 Zipf’s distribution on linear and log-log graph (a = 1.2)
For the search engine query terms this means that there will be a small number of highly used
queries (forming the distribution head) and a large number of rarely used terms (forming the
distribution tail) (Downey et al., 2007). Furthermore, the sum of the occurrences of the
queries in the tail will be larger than the sum of the occurrences of the queries in the head.
From the perspective of an information architect this is both promising and problematic.
Promising because she will have to examine only a small number of top occurring queries to
cover a substantial number of all query occurrences (compare this with the case where the
query frequency distribution would be flat).
Unfortunately it is also problematic if we take into account the previous finding about the low
context of each individual query and the fact that users will state the same information need in
different ways. For a simple example consider some of the different queries people used to
search for ‘Sony Ericsson’ on a web site of a mobile provider discussed later in this research:
sony, sonny, soni, ericson, ericsson, erikson, erickson. None of the queries by itself was among
the top ten terms but together they came out as second, just after the term Nokia.
The previous example used a misspelled word but there can be more complicated examples
such as using completely different terms to express the same general meaning. For example
consider the queries ‘manhattan project’ and ‘atomic bomb world war 2’.

12
It follows that in the search query log analysis we can’t simply neglect the queries in the tail
since their cumulative number of occurrences, when we also consider the same meaning
(information need) of different queries, can be higher than that of the queries in the head.
Since the number of unique terms in the search engine query log can quickly go into thousands
(and millions for unique queries) it would be extremely helpful if we were able to somehow
automatically group (aggregate) the queries with the same meaning and thus fix our problem
while still retaining the benefits coming from the nature of the distribution.
2.4 Search Query Clustering
To group different search queries into groups that represent distinct topics different authors
propose a number of clustering (grouping) methods. The proposed methods share the idea of
query similarity which is the basis for clustering. The approaches different authors propose
differ mostly in the manner of how this similarity is defined.
Since the queries are very short and (as suggested in the reviewed papers) don’t carry enough
semantic information it is not viable to perform clustering based solely on the direct query
comparison (at least not automatically) as is the case with traditional document clustering. To
successfully cluster the queries they have to be first connected with further information.
The reviewed papers propose two main strategies, where each strategy is relaying on enriching
the semantic information of a search query by connecting it with the document the user
selected after searching with this query:
Content ignorant search query clustering which does not use the actual content of the
target document, just the connection between the query and the document.
Content aware search query clustering which uses the actual content of the target
document.
Search queries can be given further meaning if we connect them with the documents users
selected from the list of result after using the search query to express their information need.
2.4.1 Content Ignorant Search Query Clustering
To cluster search queries Beeferman and Berger (2000) proceed by making two observations:

13
1. Users with same or similar information need may phrase their queries differently. For
example cheetahs and wild cats.
2. After issuing the same query users may visit two different URLs (select two different
results from the result page).
Based on observation (1) they define the query similarity: two queries are similar (have same
meaning) if the users selected the same document after using these two search queries.
Based on observation (2) they define the document similarity: two documents are similar
(convey similar information) if the users selected these two documents after searching with
the same search query.
After creating a bipartite graph connecting URLs and documents the clustering process works
by agglomerating the query and document pairs respectively until the queries and documents
are sufficiently clustered. To do so they use a hierarchical agglomerative clustering algorithm.
Hierarchical agglomerative clustering is a type of clustering (Tan et al., 2006) where:
a) Successive clusters are formed based on previously established clusters (hierarchical).
b) Clustering begins witch each element being a separate cluster and then merges
elements into successively larger clusters (agglomerative).
The benefits of this method are that it is relatively simple to implement and that it is content-
ignorant, meaning that in order to cluster the queries we do not need to know the content of
documents that were selected by users after searching.
The downside of this method is that it has high algorithmic space complexity (O(m2)) and time
complexity (O(m2 log m)). Also, their solution does not take into account the number of times
users associated particular query with a particular document.
Shun et al. (2004) build on the last observation to improve the Beeferman and Berger (2000)
method by modifying the similarity function of the algorithm to account for the frequency of
each query document connections.
By doing so they also eliminate (or better reduce the impact of) noisy data or in this case clicks
on the search results which may occur because users are mislead by a poor summary of the

14
result, click on some result out of curiosity or simply click on a wrong result because they make
a mistake.
Wen et al. (2001) propose a clustering method that is based on observations that are similar to
the ones made by Beeferman and Berger (2000). To improve the method they also consider
the similarity based on terms and queries themselves and the similarity based on document
hierarchy (in a given web site documents are structured in a hierarchy and distance in this
hierarchy can serve as a measure of similarity). Finally they combine all three similarities and
use this as input to the clustering algorithm.
2.4.2 Content Aware Search Query Clustering
To enrich the meaning of search queries Baeza-Yates (2005) propose pairing them with the
content of the documents users selected from the list of results after searching with those
queries.
Each document is represented as an n-dimensional vector where components of the vector are
all the words from a web site. Each query is then associated with a weighted sum of all the
documents (now represented as vectors) users selected after searching. As was the case with
content ignorant methods, the resulting vectors are then clustered to provide information
architect with content topics.
Baeza-Yates and Poblete (2006) build on this idea to present a model to mine both clickstream
data and search queries and relate the findings to the improvement of a web site’s structure
and content.
They classify queries as successful queries (users selected documents after searching) or
unsuccessful queries (users did not select any documents after searching). In the case of
unsuccessful queries they identify two possible causes for users not selecting any documents
from the list of results:
1. The search engine displayed zero documents in the results page, because there were
no documents matching the query.
2. The search engine displayed one or more results but users decided they do not match
their information need.

15
Baeza-Yates and Poblete (2006) than suggest how to use the extracted information to improve
content and structure of a web site. Although the complete model relies on analysis of both
clickstream data and search queries a number of suggestions are related only to analysis of
search queries. Following is the list of these suggestions:
1. Documents that are often reached by search should be moved towards or be reached
from the top levels of the site.
2. Keywords (terms) from often used successful queries are good candidates for words
used to link to the documents users selected after searching using these queries.
3. Unsuccessful queries for which the search engine returned results indicate content
with ambiguous meaning. Documents in the result reflect the terms used in the query
but do not match the information need of the user searching. Content represented by
such queries should be developed and included on the site.
4. Unsuccessful queries for which the search engine did not return results indicate
content users looked for but the site did not have or was named (or phrased)
differently. In the former case such content should be developed and included on the
site. In the later case, existing content should be amended to include keywords used in
the search queries.
The first two suggestions are based on the clustering of the search queries. The second two
however are based on the information obtained directly from the search engine as this
information cannot be extracted from the regular web server logs described at the beginning
of this chapter. It is therefore important for the information architect to use a search engine
that can produce such information, namely the number of results for each submitted query
and whether users selected any of the documents from the list of the results.
2.4.3 Comparison of Content Ignorant and Content Aware Methods
One could argue that connecting the search queries with content of the target documents
would result in more context and therefore better or more accurate clusters then in the case
of simply linking the queries with target documents. Unfortunately I was unable to find any
research that would compare the two methods.
While the content aware method (presumably) produces better results than the content
ignorant method, the latter is simpler to implement and perform since it does not require the

16
storage and handling of the actual text of the documents of the web site. This is especially true
in the case where documents change or are added and then removed over time.
Both methods assume that documents selected after searching reflect user information needs.
As a result they somewhat confuse the desirability of a given document by the number of
times users selected it. To what extent this happens is highly related to the quality of the
search engine. The better the search engine is, the more accurate the described methods are.
One idea that was not proposed by the reviewed literature is to treat the resulting query
clusters as content topics that can be used to design the entire site structure. For example,
most popular clusters (the ones containing most popular queries) can be used as the top
content topics (and top level navigation) of the web site. This idea is explored in the following
chapter.
2.5 Summary This chapter reviewed the representative literature on search query analysis, provided a
background to the research question and in part answered the research question.
It first considered the clickstream data processing and outlined some general guidelines how
to perform this step.
It then highlighted some of the problems stemming from the nature of search queries such as
low number of terms in queries and the distribution of the queries. It then described different
methods used to group (cluster) related queries into groups (topics).
Finally it provided some of the ideas on how analysis of search queries can be used to improve
the content and structure of web sites by using both successful and unsuccessful search
queries.
The next chapter describes an implementation of a content ignorant query clustering and
introduces manual clustering to test the behaviour of these two methods on search queries
from a local search engine.

17
3 Research Methods
Along with the goal of answering the research question I followed the following two criteria to
select the research methods used in this dissertation:
Research methods should not be over complicated and should be feasible to
implement.
Results of the automatic methods should be somehow verified by the results of the
methods performed by a practicing information architect.
To satisfy the first criteria I decided to implement and apply a content ignorant query
clustering. To satisfy the second criteria I introduced a method I call manual query clustering.
This provided me with the foundation for comparison of behaviours of the two different
methods. Also, the results of the comparison could be used to establish under what
circumstances the information architect might choose which method.
Following is a summary of the research methods I used in my work. Manual Clustering and
Automatic Query Clustering are primary methods I used to elicit user information needs from
the search query logs.
Method Summary of reasons for using this method
1. Web Server Log Pre-processing To remove unnecessary entries and noise from the
data and to store the data in suitable form for further
processing. To gain initial understanding of data.
2. Manual Query Clustering
Relatively easy to perform, requires little resources,
provides good feeling and a benchmark for
understanding of data.
3. Automatic Query Clustering
More complicated than manual clustering but
automatic and simpler than content aware methods.
Provides a way to dig deeper into the long tail.
4. Analysis of the Results To look for patterns in different result sets.
Table 3.1 Summary of the research methods used
18
In addition to the above list I had to familiarize myself with the analyzed site’s content and
structure.
The data used in my analysis came from the following two web sites:
Mobitel (www.mobitel.si): mobile operator’s corporate web site with high traffic
volume. Content language is Slovenian.
Coolinarika (www.coolinarika.com): a culinary site with high traffic volume and
expected hourly, daily and seasonal change of user information needs. Content
language is Croatian.
Both sites have a relatively large number of pages (more than 1000) which I expected would
result in users searching the sites.
The Coolinarika logs were in standard Apache format (example in Figure 2.1 Example of a
transaction log ) and did not contain cookie-based session information. The Mobitel logs came
directly from the search engine and were composed just of search queries and timestamps
indicating when these queries were submitted to the search engine.
I performed all data processing using the Python scripting language. Python source code for
automatic search clustering is listed in Appendix A Automatic Clustering Algorithm Code
Listing.
3.1 Web Server Log Pre-processing Data used in data mining operations is rarely directly suitable for analysis. Before the analysis
is conducted data must be first cleaned of unwanted or noisy entries and then transformed
into the form suitable for further analysis (Tan et al., 2006).
For the purpose of search query log analysis I first filtered server logs of unwanted entries and
then stored the filtered entries in the relational database.
3.1.1 Filtering
I performed the filtering process which included the following steps:
Remove log entries representing request for images, CSS style-sheets, and Java script.

19
Remove log entries representing requests from web robots. These are requests
coming from general search engines which are indexing content of the web site. These
requests did not include any search requests which made them irrelevant in terms of
my research.
Remove log entries that were not related to searching. To do so I retained only entries
for which the referrer document was a search page.
One final filtering step I had to perform surfaced only after I started analyzing the data. I had to
remove log entries representing the case where users selected an item from the main
navigation of the site instead of one of the results from the list of the search results (either
because there were no results or users were not satisfied with the results). Without this
filtering step the clustering process would group unrelated queries.
I decided not to extract the session information for two reasons. First, as described earlier this
process can be very complicated and second, the authors of the content ignorant clustering
implementation I was going to use (Shun et al., 2004) claim that the method automatically
reduces the noise I would be otherwise removing by looking at the sessions (erroneous,
mislead, etc. clicks on the search results).
3.1.2 Storage
I stored the filtered data in a relational database. Each record included the following
information about the request:
timestamp of the request
address of a document that a user selected from a list of search results
search query extracted from the referrer
I did not store the data about the user agent or IP address since it was not relevant for further
processing. Storing the data in the relational database allowed me to easily request data based
on different criteria. For example, all search requests made in June, between 6 p.m. and 10
p.m., coming from an external search engine.
To store filtered data I used PostgreSQL, an open source relational database implementation.
Since I did not consider the session information the data was stored in a single table with the
above mentioned columns (timestamp, document path, search query).

20
3.2 Manual Search Query Clustering
To explore the search query clustering data and get a benchmark for automatic clustering I
devised a method which I call manual clustering of search queries.
To aid the process of manual clustering I wrote a small Python script which is used in the
following way:
1. Run the script on search queries. The result is an ordered list of queries and their
frequencies (see Table 3.2 Query list before clustering).
2. Identify two or more queries from the list that you think belong to the same cluster
(topic) and specify that in the script’s configuration. For example, you may decide that
queries apple, apples, apple pie, and apple tart all belong to the same cluster (see
Table 3.3 Query list after some queries have been clustered).
3. Repeat the process until the search queries are sufficiently clustered.
The question is when are the search queries sufficiently clustered? Since the distribution of
search queries follows the Zipf distribution it is useful to operate with the cumulative percent
of the clustered queries. If for example the cumulative percent of clustered queries is 90% it
follows that each of the existing clusters is accurate to 10%. The percent of un-clustered
queries left in the tail of the distribution is therefore a good measure of the maximum error for
each of the existing clusters.
Rank Count Percent Cumulative (%) Query
1 5952 1.24 1.24 apple
2 5572 1.16 2.41 pear
3 4356 0.91 3.32 apricot marmalade
4 3736 0.78 4.10 apple pie
5 3433 0.71 4.82 sweet apples
6 3393 0.71 5.53 tomato juice
Table 3.2 Query list before clustering
21
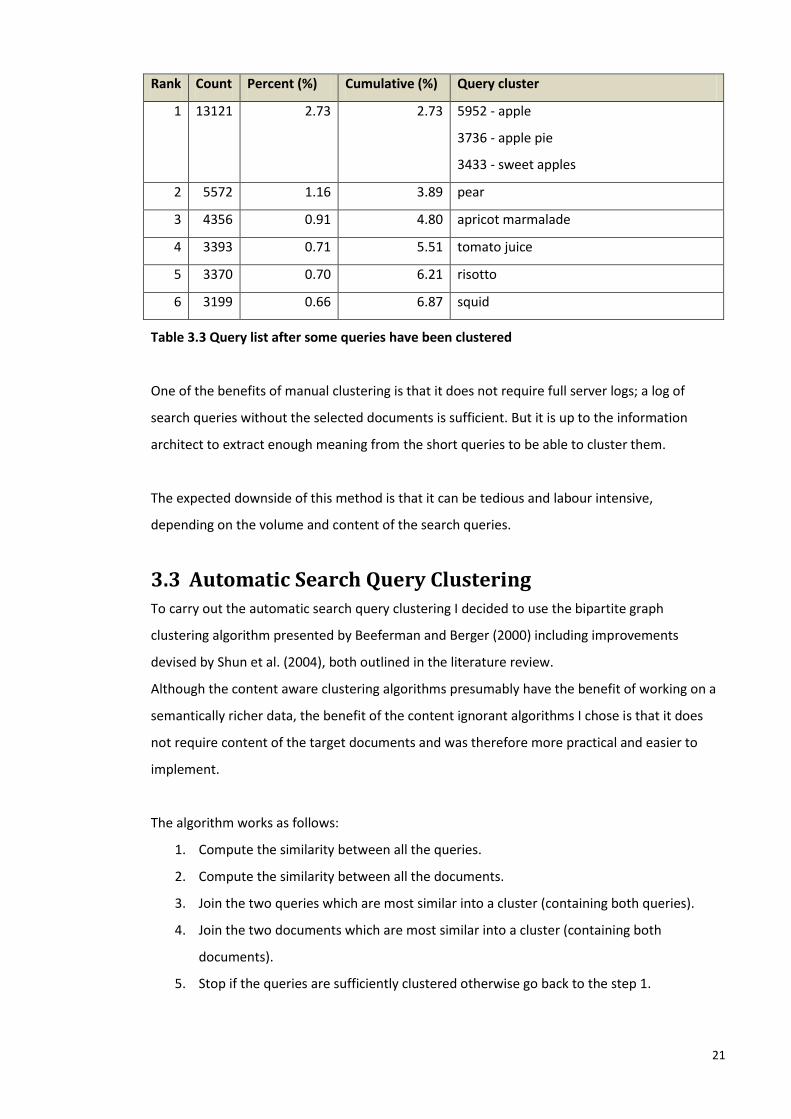
Rank Count Percent (%) Cumulative (%) Query cluster
1 13121 2.73 2.73 5952 - apple
3736 - apple pie
3433 - sweet apples
2 5572 1.16 3.89 pear
3 4356 0.91 4.80 apricot marmalade
4 3393 0.71 5.51 tomato juice
5 3370 0.70 6.21 risotto
6 3199 0.66 6.87 squid
Table 3.3 Query list after some queries have been clustered
One of the benefits of manual clustering is that it does not require full server logs; a log of
search queries without the selected documents is sufficient. But it is up to the information
architect to extract enough meaning from the short queries to be able to cluster them.
The expected downside of this method is that it can be tedious and labour intensive,
depending on the volume and content of the search queries.
3.3 Automatic Search Query Clustering
To carry out the automatic search query clustering I decided to use the bipartite graph
clustering algorithm presented by Beeferman and Berger (2000) including improvements
devised by Shun et al. (2004), both outlined in the literature review.
Although the content aware clustering algorithms presumably have the benefit of working on a
semantically richer data, the benefit of the content ignorant algorithms I chose is that it does
not require content of the target documents and was therefore more practical and easier to
implement.
The algorithm works as follows:
1. Compute the similarity between all the queries.
2. Compute the similarity between all the documents.
3. Join the two queries which are most similar into a cluster (containing both queries).
4. Join the two documents which are most similar into a cluster (containing both
documents).
5. Stop if the queries are sufficiently clustered otherwise go back to the step 1.
22
As stated before two search queries are similar if users selected the same document after
using these two queries and conversely, two documents are similar if users selected these two
documents when searching with the same queries.
The results of the automatic query clustering were displayed in the same way as the results of
the manual clustering (see Table 3.3 Query list after some queries have been clustered).
Each clustering step joins two queries (or clusters) into one. Again the question arises when
should the clustering algorithm stop? As this is the same question I encountered in the context
of the manual clustering I decided to use the same measure of completeness as with the
manual clustering. Therefore the decision when to stop clustering depended on the criteria of
cumulative percent of clustered queries, the quality of clusters and of course the judgment of
the information architect performing the clustering.
To satisfy this requirement the clustering algorithm runs until there are no more queries to
cluster but the program writes intermediate clustering results to a file every n steps (n is
specified by the person running the program).
3.4 Comparison and Analysis of the Results When the two clustering methods were implemented I proceeded with applying them on my
data sets and then analyzed and compared the results.
3.4.1 Manual clustering versus Automatic Clustering
In this experiment I performed the following steps:
Clustered queries for a single month using manual clustering.
Clustered queries for a single month using automatic clustering.
Compared the manual and automatic clustering results for a single month.
By performing this experiment I tried to discover how each clustering method performs on real
data and if they both yield similar results. I was also trying to determine if the resulting clusters
could be used to suggest top level structure of the web site from which the logs came from.

23
3.4.2 Automatic Clustering of data from Different Time Periods
In this experiment I performed the following steps:
Clustered queries for each month in a series of months and compared them.
Clustered queries for each week in a month and compared them.
Clustered queries for different time periods of the day (morning, midday, afternoon,
evening, night) and compared them.
By performing this experiment I was looking for changes in visitors’ information needs and
what the nature of these changes was. If some patterns would emerge this information could
be used to organize the site’s content in such a way that it would match users’ expectations in
the next period of change.
3.5 Summary This chapter outlined the research methods used in this dissertation. The overall strategy was
to first prepare the data for clustering and then perform two different kinds of clustering on
this data. One manual and one automatic clustering method were selected and the test cases
for which these two methods were applied were described.
Following is the summary of the research methods:
Web Server Log Pre-processing: used to remove unnecessary entries and noise from
the data and to store the data in suitable form for further processing and to gain initial
understanding of the data through simple statistics.
Manual Query Clustering: relatively easy to perform, requires little resources,
provides a benchmark for understanding of data.
Automatic Query Clustering: more complicated than manual clustering but automatic
and simpler than content aware methods. Provides a way to dig deep into the long tail.
Analysis of the Results: used to look for patterns in different result sets.
The following chapter presents the results that were gathered by performing the selected
research methods along with the analysis and interpretation of these results.
24
4 Results
4.1 Introduction The purpose of this chapter is to present the results of my work and establish the foundation
for an answer to the research question of this dissertation: How and to what extent can web
sites with changing user needs, context and content benefit from local search log analysis?
4.2 Web Server Log Pre-processing
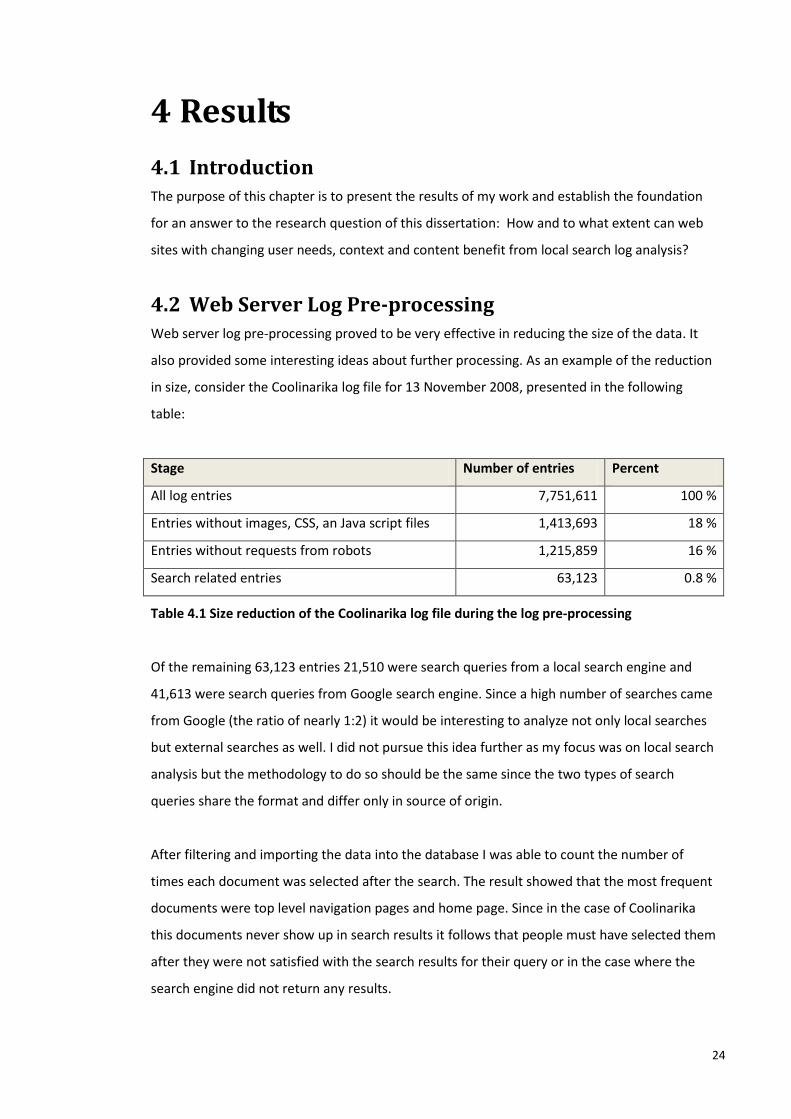
Web server log pre-processing proved to be very effective in reducing the size of the data. It
also provided some interesting ideas about further processing. As an example of the reduction
in size, consider the Coolinarika log file for 13 November 2008, presented in the following
table:
Stage Number of entries Percent
All log entries 7,751,611 100 %
Entries without images, CSS, an Java script files 1,413,693 18 %
Entries without requests from robots 1,215,859 16 %
Search related entries 63,123 0.8 %
Table 4.1 Size reduction of the Coolinarika log file during the log pre-processing
Of the remaining 63,123 entries 21,510 were search queries from a local search engine and
41,613 were search queries from Google search engine. Since a high number of searches came
from Google (the ratio of nearly 1:2) it would be interesting to analyze not only local searches
but external searches as well. I did not pursue this idea further as my focus was on local search
analysis but the methodology to do so should be the same since the two types of search
queries share the format and differ only in source of origin.
After filtering and importing the data into the database I was able to count the number of
times each document was selected after the search. The result showed that the most frequent
documents were top level navigation pages and home page. Since in the case of Coolinarika
this documents never show up in search results it follows that people must have selected them
after they were not satisfied with the search results for their query or in the case where the
search engine did not return any results.

25
This had two important consequences. First, I excluded query-page pairs that contained such
pages since the clustering process would otherwise connect unrelated queries. This also made
the data less noisy and simplified further calculation of clusters.
Second, the fact that people were not satisfied with search results could potentially be used to
identify missing content. I discuss this topic in more detail in Chapter 4.5 Identification of
Missing Content below.
I did not perform any specific pre-processing for data coming from Mobitel as this data
contained only search queries and timestamps when these queries occurred.
Frequency counts of search queries coming from both sites showed that the query distribution
follows a Zipf distribution. This confirmed the need and validated the decision to perform
clustering of the queries.
4.3 Manual Clustering
I performed manual clustering on two sets of query logs.
4.3.1 Manual clustering of Mobitel Query Log
I first performed manual clustering described in Chapter 3.2 on Mobitel data which included
242,930 search queries from January until May 2008. It took me around 6 hours to cluster the
data to the point where 80 % of queries were clustered.
Following is an example of clustering rules I used to group queries coming from users looking
for information about mobile phones:
nokia := nokia | nokija | n\d+
sony := sony | sonny | ericson | ericsson | erikson
siemens := siemens | simens
...
phones := nokia | sony | Siemens
Table 4.2 Rules for clustering search queries about mobile phones
It is important to understand that I made the decision to interpret company names as requests
for information about the phones these companies make rather than information about these
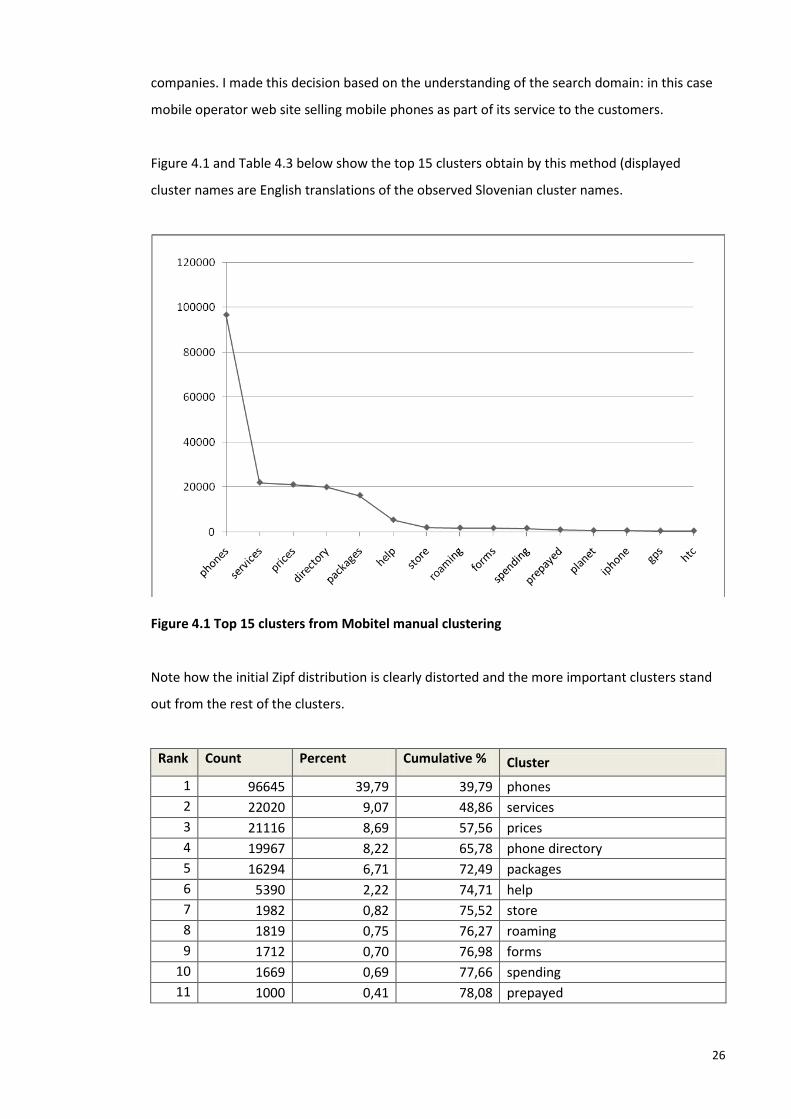
26
companies. I made this decision based on the understanding of the search domain: in this case
mobile operator web site selling mobile phones as part of its service to the customers.
Figure 4.1 and Table 4.3 below show the top 15 clusters obtain by this method (displayed
cluster names are English translations of the observed Slovenian cluster names.
Figure 4.1 Top 15 clusters from Mobitel manual clustering
Note how the initial Zipf distribution is clearly distorted and the more important clusters stand
out from the rest of the clusters.
Rank Count Percent Cumulative % Cluster
1 96645 39,79 39,79 phones
2 22020 9,07 48,86 services
3 21116 8,69 57,56 prices
4 19967 8,22 65,78 phone directory
5 16294 6,71 72,49 packages
6 5390 2,22 74,71 help
7 1982 0,82 75,52 store
8 1819 0,75 76,27 roaming
9 1712 0,70 76,98 forms
10 1669 0,69 77,66 spending
11 1000 0,41 78,08 prepayed

27
12 664 0,27 78,35 planet
13 659 0,27 78,62 iphone
14 508 0,21 78,83 gps
15 499 0,21 79,03 htc
Table 4.3 Top 15 clusters from Mobitel manual clustering
This result is very promising as it represents condensed user information needs, expressed
through search queries, as manageable number of distinct content topics. Furthermore the
topics are ordered according to their importance to the users. The resulting topics are
therefore good candidates for the top level organization of the web site.
Manual clustering is therefore a feasible option to determine the top level structure of the
web site. This may be possible even in the case where search queries are not enriched with
further context.
The downside of this approach is that it is labour intensive and time consuming. However, 6
hours (in this particular case) is far less than it would ordinarily take an information architect
to devise the top level organization of such a web site (this would usually take from a week to
several months).
4.3.2 Manual Clustering of the Coolinarika Query Log
Manual clustering of search queries from Coolinarika proved to be much more difficult than in
the case of search queries coming from Mobitel. The problem arose from the nature of the
content of the site. Culinary sites are very good examples of sites featuring content that can be
organized in many different ways.
Consider the example of the query zucchini (a popular query from the data) which may be
grouped with other queries in a number of different ways, for example:
with other vegetables
with Mediterranean dishes
with other plants that ripen in the summer

28
To make things more difficult, a lot of queries were made of multiple terms. To continue with
our example, how should we classify the query zucchini risotto: under zucchini or under
risotto?
The problem is that all the above options are valid and Coolinarika indeed offers many
different classifications of the same content. The recipes, primary content of the site can be
organized by different facets such as country of origin, preparation time, vegetarian/non-
vegetarian, preparation difficulty, etc.)
Two important questions arise here. First, is any one of the classifications better or preferred
by the users? Second, how will the manual clustering fare in the case of different content
organizations?
The answer to the first question should emerge from the automatic clustering where queries
are enriched by further context and not subject to interpretation by an information architect.
The possible working answer to the second question may be given by the comparison with the
clustering of the Mobitel data where clear and discrete clusters emerged: manual clustering is
feasible in cases where the content is not subject to multiple organizational schemes.
4.4 Automatic Clustering I performed automatic clustering only on query log from Coolinarika since Mobitel log did not
contain information which documents users selected after searching.
4.4.1 Content Clustering of Coolinarika Query Log
I first clustered Coolinarika search query log for June 2008. This log contained the total of
53.7197 queries of which 20.919 were unique queries, connected with 19.473 different
documents. Table 4.4 and Table 4.5 list most popular queries before and after the clustering
(displayed cluster names are English translations of the observed Croatian cluster names):
Rank Count Percent Cumulative % Cluster
1 15317 3,63 3,63 Zucchini
2 6401 1,52 5,14 sour cherries
3 5471 1,30 6,44 strawberries

29
4 5324 1,26 7,70 ice cream
5 4011 0,95 8,65 green beans
6 3941 0,93 9,59 chicken
7 3486 0,83 10,41 cakes
8 2864 0,68 11,09 lasagne
9 2707 0,64 11,73 squid
10 2687 0,64 12,37 raspberry
Table 4.4 Most popular un-clustered queries from Coolinarika for June 2008
Rank Count Percent Cumulative % Cluster
1 21034 4,98 4,98 zucchini, zucchini with minced meat
2 7188 1,70 6,69 sour cherries
3 7066 1,67 8,36 strawberries, strawberry cake
4 5324 1,26 9,62 ice cream
5 5102 1,21 10,83 squid, filled squid, grill
6 4451 1,05 11,88 green beans, green beans stew
7 3941 0,93 12,82 chicken
8 3827 0,91 13,72 pancakes
9 3527 0,84 14,56 cherries, cherry pie
10 3486 0,83 15,38 cakes
Table 4.5 Most popular clusters from Coolinarika for June 2008
I stopped the clustering process after 1,600 steps. After that, the top cluster started to grow
rapidly and included seemingly unrelated queries (for example zucchini, cake, chicken…). I
suspected this happened for one of the following possible reasons:
noise in the data
working of the clustering algorithm
my failure to see the connection between the different queries in such clusters
nature (structure) of the data
What is evident from the comparison of the clustering results in tables Table 4.4 Most popular
un-clustered queries from Coolinarika for June 2008 and Table 4.5 Most popular clusters from

30
Coolinarika for June 2008 is that the clustering process did very little to change the order of
the most popular items at the top of the list. Also, the cumulative percent at the 10th place did
not change significantly, which means that clustering had very little effect, at least in the head
of the query distribution.
Nevertheless an important observation can be made based on the results of this experiment.
First, the majority of queries are related to specific ingredient. These are followed (in much
lesser number) by general dishes such as cake or soup. Finally there are also queries related to
certain dishes such as pizza, lasagne or pancakes. There are little queries related to other
facets such as the type of the recipe, region of the recipe or recipe difficulty – where they
occur they are usually paired with an ingredient, for example: baked zucchini. In the case of
multi-faceted data users evidently focused on one particular facet while searching.
What then is the value of query clustering in this case? From the comparison of top clustered
and top un-clustered queries it would appear that there is not much added value here. But let
us again consider the number of unique queries (20.919) and unique documents (19.473).
Since these two numbers are nearly identical it follows that there will be very little strong
connections between the queries (two queries are similar if users selected the same document
after searching using these two queries).
This in turn is the answer to the question why at some point the clusters became unstable –
the clustering algorithm started to join clusters based on weaker connections since it already
joined all the strong (meaningful) connections. The cause is therefore in the nature of the data
(few strong connections) and in the noise in the data (weak connections).
It follows that the resulting clusters are a valid representation of the expressed user needs –
there is just a great number of different needs resulting in different clusters. Based on this
information an information architect would not be able to develop the site’s structure. Still she
could use the information for hints as to which ingredients are most sought after by the site’s
visitors. For example, it would be reasonable to promote recipes that include sour cherries on
the top of the web site or make a theme presentation around this ingredient.
The next question is how the sought after items change over time?

31
4.4.2 Temporal Analysis
To answer the question how popular clusters change over time I first clustered Coolinarika
data from October 2008. Table 4.6 and Table 4.7 list most popular queries before and after the
clustering (displayed cluster names are English translations of the observed Croatian cluster
names):
Rank Count Percent Cumulative % Cluster
1 5952 1,25 1,25 cakes
2 5572 1,17 2,41 chestnut
3 4356 0,91 3,32 chicken
4 3736 0,78 4,11 apples
5 3433 0,72 4,82 apple pie
6 3393 0,71 5,53 cake
7 3370 0,71 6,24 croissants
8 3199 0,67 6,91 lasagne
9 3069 0,64 7,55 pumpkin
10 2961 0,62 8,17 musaka
Table 4.6 Most popular un-clustered queries from Coolinarika for October 2008
Rank Count Percent Cumulative % Cluster
1 13383 2,80 2,80 apple, apple pie
2 11483 2,40 5,20 chestnut, chestnut tart, chestnut cream
3 6878 1,44 6,64 squid, squid and potatoes
4 5952 1,25 7,89 cakes
5 4356 0,91 8,80 chicken
6 4354 0,91 9,71 pancakes
7 4054 0,85 10,56 croissant, salty croissant
8 3393 0,71 11,27 cake
9 3340 0,70 11,97 sarma, sauerkraut
10 3294 0,69 12,66 pumpkin
Table 4.7 Most popular clusters from Coolinarika for October 2008

32
Comparison of the results from June and October shows a significant difference between the
top ten clusters. Although some of the items such as squid and chicken remained popular,
there is a clear change in seasonal items: sour cherries, zucchini, and strawberries in June and
apples, chestnuts, and pumpkins in October.
While the existence of seasonal change in user interest is, in the case of Coolinarika, intuitive
and somewhat expected it is here confirmed by the analysis and inspection of the search
queries. Furthermore, concrete suggestions can be extracted from this analysis by an
information architect as to what ingredients to feature on the site in a given month.
Last I performed clustering of queries for each week in October as well as for different times of
the day (morning, afternoon, evening and night). Weekly analysis showed only a slight change
in dominant clusters. The analysis based on the time of the day on the other hand did not
show much change in dominant clusters and was more or less the same for all the different
times of the day (and more or less the same as for the whole month of October).
It follows from this analysis that information architects can use the described method to
prepare their sites in advance if the nature of change of content is periodic. Good candidates
to examine may be month, week, day, and time of day, depending on the nature of the site.
4.5 Identification of Missing Content During the automatic clustering I came across clusters that contained seemingly unrelated
search queries. After further inspection I determined that these clusters contained search
queries used in cases where people did not select any of the search results but rather clicked
on one of the elements of the main navigation. This either indicated that users were not
satisfied with the results of the search queries or that the search engine did not return any
results.
By looking at one such cluster where users selected the link to the home page instead of any of
the search results I saw that the majority of the queries, when entered in the search engine
produced some results. Such queries then represented cases where particular users were not
satisfied with search results or abandoned searching for some other reason that I was not able
to determine. It is interesting to note that the most frequent queries in this cluster matched
the most frequent queries used overall.

33
Some of the search queries, when entered in the search engine did not produce any results.
For example users selected the ‘children’ tab in the top level navigation after searching for
halloween (4 of 427 queries in this cluster for October 2008).
4.6 Data Noise and Termination of Clustering
A procedural aspect of clustering which is here worth mentioning is the termination of
clustering. The clustering method I used is, as described, agglomerative in nature which means
that with every clustering step a new cluster is created from two previous clusters. In practice
this resulted in large and unusable clusters connecting unrelated queries if I let the clustering
algorithm run as long as there was anything left to cluster.
This behaviour is the result of noise in the data. I was able to identify two sources of such
noise: inclusion of data where users were opted to move away from search as described in the
previous section and the inclusion of weakly connected queries.
I was able to eliminate the first cause by simply removing such data from clustering.
The second cause of noise proved more difficult as I was unable to establish precise measure
of what constituted a weak connection in relation to the quality of clustering results. I resolved
this issue by simply monitoring the clustering results of intermediate steps of clustering and
terminating the clustering process when the distorted clusters started to form.
4.7 Summary
This chapter described the results of the research methods of my research.
It first presented the results of manual and automatic clustering applied to two different data
sets and considered how these results could be used to determine the top level structure of a
web site.
This was followed by the findings based on the temporal analysis of search queries using the
automatic clustering method.
Finally I considered the identification of missing content and the termination of the automatic
clustering method.
34
5 Conclusions
5.1 Introduction The purpose of this chapter is to summarize key findings of this research and relate them back
to the proposed objectives and the research question. This is followed by a review and
evaluation of the used research methods and work that produced the findings. Finally, I
consider possible further research to extend the here presented work.
5.2 Key Findings of this Research The central contribution of this research revolves around the idea that it is possible to extract
user information needs from search queries that users submit to web site’s local search engine
and that it is possible to use this information to improve the information architecture of the
underlying web site.
Building on the idea from the literature review that documents often reached by search should
be moved towards the top level of the site I explored two new ideas:
1. By identifying the periodic change in the expressed information needs in search queries
information architects may be able to prepare a web site to reflect this need in advance,
before the next occurrences of this particular need.
2. The most frequently occurring content topics represented and extracted from search
queries are good candidates for the top level structure of a web site.
To explore these ideas I first studied the nature of the search queries.
5.2.1 The Nature of The Search Queries
The literature review indicated an important property of search queries: the specific frequency
distribution of search queries. This distribution follows the Zipf distribution where a small
number of highly used queries form the distribution head and a large number of rarely used
terms form the distribution tail (Adamic and Huberman, 2002).
Since there are often thousands of unique search queries this is promising since we can handle
a substantial percentage of all the queries just by considering the often occurring queries from
the distribution head.

35
At the same time, unfortunately, by combining the fact that users often express the same
information need by using different queries and the property of the Zipf distribution that the
sum of the occurrences of queries in the tail can be higher than the sum of the occurrences of
queries in the head, we can see that if we are to extract information from search queries we
can’t really ignore the large number of infrequently occurring queries from the tail.
To solve this problem we can group together (or cluster) search queries representing the same
information need. This on the other hand is made difficult by another property of the search
queries: the observed low number of terms in search queries and therefore low context or
information content of these queries which prevents us from clustering search queries using
the usual document clustering methods.
To increase the context and therefore information content of the queries we can connect
them with the documents users selected from the list of result after searching. By doing so we
can introduce the following similarity between the queries: two search queries must be similar
(have the same meaning) if the users selected the same document after using these queries.
Conversely, two documents must be similar (convey similar information) if the users selected
these documents when searching with the same queries.
Using the introduced similarity I was able to perform the actual clustering of the queries.
5.2.2 Determination of Site Structure by Query Clustering
I performed the clustering by using two different clustering methods:
1. Automatic hierarchical agglomerative clustering as proposed by Shun et al. (2004).
2. Manual clustering which I devised as a control for automatic clustering.
I performed the clustering on two different datasets:
1. A complete web server log (Coolinarika).
2. Local search engine transaction log composed of search queries and timestamps when
these queries occurred (Mobitel).

36
Manual clustering of the Mobitel log showed that it is feasible to determine the web site’s top
level structure by performing manual clustering of the local search queries even in the case
where search queries are not enriched with further context.
Manual clustering of the Coolinarika log on the other hand showed the above may not always
be feasible. I showed that the decisive element here is the nature of a site’s content,
specifically how this content can be organized: manual clustering can be used to determine the
site’s top level structure when the content is subject to a single organization scheme. If on the
other hand the site’s content can be simultaneously organized using different organization
schemes, manual clustering can’t be used (exclusively) to establish the site’s top level
structure.
Since manual clustering proved to be quite demanding and time consuming it may not always
be feasible to consider and cluster all the queries. To address this and at the same time
account for the properties of the distribution of search queries I introduced the following
measure: the percent of un-clustered queries (the count of their cumulative occurrences) left
in the tail of the distribution is a measure of the maximum error of size for all the clusters.
Automatic clustering of Coolinarika did not substantially cluster the queries (top cluster
represented around 2% of all query occurrences). This showed that automatic clustering can’t
always be used to devise the web site’s top level navigation from the search queries.
Furthermore, clustering became unstable after a certain number of steps, joining together
seemingly unrelated queries. This led me to compare the number of unique queries and the
number of unique documents which in case of Coolinarika turned out to be very close (20.919
queries and 19.473 documents). I reasoned that the relation between the number of unique
queries and the number of documents determine the degree to which the queries will be
clustered when using an automatic clustering method. The more unique queries there are in
relation to the number of documents, the more substantial the clustering will be.
As in the case of manual clustering of Coolinarika logs the automatic clustering also can’t be
used do derive the site’s top level structure if the site’s content can be organized in different
ways. However, automatic clustering can be used to determine the primary facet or facets of
content that users use when searching.

37
5.2.3 Identification of Change in User Information Needs
Clustering Coolinarika logs for different time periods showed that top clusters (different
ingredients) vary across different months. Although the top clusters in this case represented a
small percentage of all the query occurrences, they would nevertheless be good candidates to
determine the content the site might feature on the home page in a given month.
It follows from this analysis that information architects can use, at least in some cases, the
described analysis of search queries to prepare their sites in advance if the nature of change is
periodic. Good candidates to examine may be month, week, day, and time of day, depending
on the nature of the site’s content.
5.2.4 Missing Content
In terms of identification of missing content my research showed that the extraction of this
information from web server logs is difficult and unreliable. While this in itself is a negative
result it can be used to direct information architects to set up their web servers so that they
can easily extract this information directly from the search engine by recording queries for
which the search engine did not return any results.
5.3 Validation and Implications of this Research
By doing this research I showed that analysis of search queries from a local search engine can
be used to determine, at least in some cases, the top level structure of a web site.
Since this information is extracted from the explicitly stated information needs provided by the
site’s users this organization should be directly aligned with the users’ expectations. The same
argument can also be made for the case of identification of change in information needs over
time and the identification of the missing content.
Information architects should therefore be able to use these methods to align the structure
and content of web sites with the expectations and information needs of the site’s users.
However, since the different behavior of different methods even in the case of limited data
used in this research showed variations in quality and applicability of the results these
methods should be applied with a grain of salt and not used exclusively but only as one tool in
a toolbox of information architecture.

38
As an example of how things may go wrong consider a hypothetical example of a newspaper
using exclusively search log analysis to determine the content preferences of its users. The
analysis shows a clear preference for sports related topics. What the analysis fails to identify is
the fact that the sports fans prefer searching to browsing while readers of other subjects
prefer browsing to searching. The decision to feature more sport topics based solely on the
information from search log analysis would in this case be obviously wrong.
5.4 Limitations of this Research During my research I came across some important limitations which I discuss below.
5.4.1 Size and Type of Analyzed Data
Although the datasets from both the examined sites were sufficiently large, the number of the
examined sites was rather low. This proved to be a limitation especially in the examination of
clustering behavior for sites with different content structures.
Furthermore the fact that the Mobitel log was missing the information required to perform the
automatic clustering reduced the application of this method to only one site. As a result I was
unable to compare the behavior of this method while being applied on different test cases.
Finally, the relation between the number of unique search queries and documents in the
Coolinarika log was rather unfortunate and provided an example where automatic clustering
would not be able to cluster a substantial number of queries. On the other hand it was this
property that led me to discover and discuss the importance of comparing the number of
unique queries to the number of documents of a site and the effect this ratio has on the
clustering process.
5.4.2 Session Analysis
During my analysis I did not perform any session level analysis of search queries. By doing so I
regarded all the query document pairs as positive even in the cases when they were not. Such
cases include the scenario where a user selects a document from the list of results, looks at it
but then returns back to the list of results since the document was not what she was looking
for.

39
5.4.3 Manual Clustering Bias
Manual clustering method as proposed by my research is susceptible to bias of the user
performing the clustering. This bias could come from understanding (or the lack of) of the
underlying content domain as well as personal preferences.
Although I argued that manual clustering is useful, I feel this claim should be confirmed further
by comparison of results of manual clustering performed by a number of different information
architects.
5.4.4 Examination of the Search Engine Quality
During my literature review I pointed out the somewhat unconfirmed assumption of the
different clustering methods that the selected documents after the searching reflect user
information needs. I argued that by making this assumption the authors somewhat confuse
the desirability of a given document by the number of times users selected it. I suggested that
extent to which this happens is related to the quality of the search engine - the better the
search engine is, the more accurate the described methods are.
While I did consider this issue at the beginning of my research I did not pursue it further at the
later stages. Consequently my analysis based on the Coolinarika logs makes the same
assumption i.e. lacking the examination of the quality of the search engine.
5.5 Future research There are a number of areas where future research could build on the work presented in this
dissertation. Some of these areas are related to further validation of the findings of this
research (stemming from the limitations described in the previous chapter) while others could
be used to extend this research.
As I noted before, the analysis of search queries coming from a number of different web sites
(with different content structure) using both manual and automatic clustering could provide a
better understanding of and a stronger foundation for some of the findings of this research (or
potentially invalidate some of them). This analysis could be further extended to include the
content aware method proposed by Baeza-Yates and Poblete (2006).

40
To measure the value and the benefits of the results of the proposed analysis these results
could be used to amend the structure and content of the analyzed web site. By doing so the
cyclical nature of web development would be established. One possible measure of success
could then be the number of submitted search queries which I would expect to fall down after
the web site was amended to include the results of the analysis.
During the inspection of the Coolinarika logs I also found search queries coming from the
general search engine Google. The number of such queries was very high and nearly the same
as the number of local search queries. As these queries could be analyzed in the same way as
the local search queries one could look for differences between the two data sets. Also, one
could use the analysis of search queries from a general search engine in the case of a web site
that does not feature a local search engine.
In terms of the temporal analysis of search queries it would be interesting to establish and
define a measure of similarity between the clusters. This measure could then be used for
automatic detection in changes of user information needs or perhaps to automatically identify
the periods of time during which periodic changes occur.
Finally, the measure of similarity between the two queries used by Shun et al. (2004) (the
Jaccard similarity coefficient (Tan et al., 2006)) could be replaced by a different similarity
measure which may produce better results. A suitable candidate here would be the Cosine
similarity (Tan et al., 2006).
5.6 Summary This chapter summarized the key findings of this research. It then considered the implications
and limitations of these findings. Finally, it considered some of the areas where additional
work might further validate and extend the findings of this research.

41
References
Adamic, L., Huberman, B. (2002) Zipf’s law and the Internet, Glottometrics 3, 2002, Pages 143-
150
Baeza-Yates, R. (2005) Applications of Web query mining, Advances in Information Retrieval.
27th European Conference on IR Research, ECIR 2005. Proceedings (Lecture Notes in Computer
Science Vol.3408) 01/01/2005. Pages.7-22
Baeza-Yates, R., Poblete, B. (2006) A Website mining model centered on user queries,
Semantics, Web and Mining. Joint International Workshops, EWMF 2005 and KDO 2005.
Revised Selected Papers (Lecture Notes in Artificial Intelligence Vol.4289) 01/01/2006. Pages 1-
17
Beeferman D., Berger A. (2000) Agglomerative Clustering of a Search Engine Query Log,
Proceedings of the sixth ACM SIGKDD international conference on Knowledge discovery and
data mining, 2000, Pages 407-16
Beitzel, S., Jensen, E., Chowdhury, A., Frieder, O., Grossman D. (2007) Temporal analysis of a
very large topically categorized Web query log, Journal of the American Society for Information
Science and Technology, Volume 58, Issue 2, January 2007, Pages 166-178
Bring, S., Page, L. (1998) The anatomy of a large-scale hypertextual Web search engine,
Proceedings of the Seventh International World Wide Web Conference, Volume 30, Issues 1-7,
April 1998, Pages 107-117
Chau, M., Fang, X., Sheng, L., Sheng, O. (2005) Analysis of the query logs of a Web site search
engine, Journal of the American Society for Information Science & Technology (1532-2882)
01/11/2005, Volume 56, Issue 13, Pages 1363-1376
Downey, D., Dumais, S., Horvitz, E. (2007) Heads and Tails: Studies of Web Search with
Common and Rare Queries, Proceedings of the 30th Annual International ACM SIGIR
Conference on Research and Development in Information Retrieval, SIGIR'07, 2007, Pages 847-
848

42
Jansen, B. (2006) Search log analysis: What it is, what's been done, how to do it, Library &
Information Science Research, Volume 28, Issue 3, Autumn 2006, Pages 407-4
Jansen, B., Spink, A. (2006) How are we searching the World Wide Web? A comparison of nine
search engine transaction logs, Information Processing & Management (0306-4573),
01/01/2006. Volume 42, Issue 1, Pages 248-263
Jansen, B., Spink, A., Blakely, C., Koshman, S. (2007) Defining a Session on Web Search
Engines, Journal of the American Society for Information Science and Technology, Volume 58,
Issue 6, Pages 862-871
Jansen, B., Spink, A., Saracevic T. (2000) Real life, real users, and real needs: a study and
analysis of user queries on the web, Information Processing & Management, Volume 36, Issue
2, 1 March 2000, Pages 207-227
Krug, S. (2000) Don’t Make Me Think!: A Common Sense Approach to Web Usability,
Indianapolis, Que Corp
McGuigan, D. (2008) Tweaking Internal Site-Searches into Buying Opportunities [online],
http://www.grokdotcom.com/2008/10/13/making-the-most-of-your-internal-searches/
[Accessed 29 October 2008]
Morville, P. (2005) Ambient Findability, O'Reilly Media
Morville, P. and Rosenfeld, L. (2006) Information Architecture for the World Wide Web,
O'Reilly Media
Shun, W., Ting, W., Lun, D. (2004) Clustering Search Engine Query Log Containing Noisy
Clickthroughs, 2004 International Symposium on Applications and the Internet, Pages 305-308
Silverstein, C., Hensinger, M., Marais, H., Moricz, M. (1999) Analysis of a very large Web
search engine query log, SIGIR Forum (0163-5840) 01/09/1999, Volume 33, Issue 1, Pages 6-12

43
Srivastava, J., Cooley, R., Deshpande, M., Tan, P. (2000) Web usage mining: discovery and
applications of usage patterns from Web data, ACM SIGKDD Explorations Newsletter, Volume
1 , Issue 2, January 2000, Pages: 12-23
Tan, P., Steinbach, M., Kumar, V. (2006) Introduction to Data Mining, Pearson education, inc.,
Addison Wesley
Wen, J., Nie, J., Zhan, H. (2001) Clustering User Queries of a Search Engine, Proceedings of the
10th international conference on World Wide Web, Hong Kong, 2001, Pages 162-168
Zipf, G. (1932) Selected Studies of the Principle of Relative Frequency in Language, Cambridge,
MA, Harvard University Press (cited in Adamic and Huberman (2002))
44
Glossary
Algorithmic space complexity
Algorithmic space complexity is a measure of required memory space used by the algorithms.
It is expressed as a function of the number of elements processed by the algorithm. For
example the algorithm with quadratic algorithmic space complexity O(n2) will use k * n2
memory space where k is a constant and n is the number of elements processed by the
algorithm.
Algorithmic time complexity
Algorithmic time complexity is a measure of required time in which the algorithm processes
it’s input. It is expressed as a function of the number of elements processed by the algorithm.
For example the algorithm with quadratic algorithmic time complexity O(n2) will spend k * n2
time units to process its input where k is a constant and n is the number of elements processed
by the algorithm.
Clustering
Clustering is a process of grouping of objects where the resulting groups or clusters hold
objects more similar to each other than to those objects in other groups. Similarity of objects is
usually determined by the distance between objects (in some metric space) defined by the
properties of the objects.
Content aware search query clustering
Content aware search query clustering is a type of search query clustering that uses the
content of the documents users selected from the list of results after searching to determine
the similarity between the queries.
Content ignorant search query clustering
Content ignorant search query clustering is a type of search query clustering that does not use
the content of the target documents to determine the similarity between the queries. It is only
the information which documents were selected after searching which is used. For example, if
users selected the same document after searching with two different queries, these two
queries can be considered as similar.

45
Cookie
Cookie or a Web Cookie is a small piece of information stored by the web server on the web
browser of the user visiting the web server. Each time the user requests a document from the
server, the web browser sends unmodified cookie back to the server, along with the request
for the document. Cookies are usually used by the server to identify users across their
multiple requests to the server.
Hierarchical agglomerative clustering
Hierarchical agglomerative clustering is a type of clustering where:
c) Successive clusters are formed based on previously established clusters (hierarchical).
d) Clustering begins witch each element being a separate cluster and then merges
elements into successively larger clusters (agglomerative).
IP address
IP or Internet Protocol address is a unique address identifying computers connected to the
internet. IP address is used to route data traffic between computers. IP address consists of 4
parts (digits from 0 to 255) separated by dots, for example: 82.255.201.32. As this is hard to
remember for people, computers can alternatively be identified by unique domain names, for
example www.open.ac.uk.
Search session
A search session or a searching episode is a series of interactions (with limited duration)
between the user and the search engine where the user queries the search engine for
documents using search query and then selects a document from a list of results or
reformulates her query.
URL
URL or Uniform Resource Locator is a string of characters used to identify a document or
resource on the Internet. Example: http://www.open.ac.uk/study/. URL is composed of
protocol (http, ftp...), hostname (www.open.ac.uk) and the path of the document on the
server, represented by the hostname (/study/).

46
Index
browse log analysis, 2
clickstream data
analysis, 2
preprocessing, 18
pre-processing, 24
processing, 7
clustering, 12
automatic, 21, 28, 35
content aware, 12, 14, 15
content ignorant, 12, 15
hierarchical agglomerative, 13
manual, 20, 25, 27, 35, 39
content organization, 28
Coolinarika, 18
document similarity, 13, 22, 35
findability, 1
information architect, 1
information needs, 2, 8, 27, 35
change of, 3, 32, 37
local search log analysis. See search log
analysis
missing content, 3, 32, 37
Mobitel, 18
noise in data, 13, 29, 33
relevance of information, 1
search log analysis, 2, 7
search query, 8, 9
clustering. See clustering
distribution head, 11
distribution tail, 11
frequency distribution, 10, 34
similarity, 13, 14, 22, 35
successful, 14
unsuccessful, 14
search session, 8, 38
search term, 8, 9
uniform resource locator. See URL
URL, 7
referrer, 7
user testing, 2
Zipf distribution, 10, 25, 26, 34

47
Appendix A Automatic Clustering Algorithm Code Listing
Following is the code listing of the Python program used for automatic clustering of the search
queries. Function main() controls the clustering process, reporting and termination. Class
Graph implements the agglomerative hierarchical clustering of queries and documents.
1 def main():
2
3 start_date = datetime(2008, 11, 1)
4 stop_date = datetime(2008, 12, 1)
5
6 queryset = LogEntry.objects.filter(site='www.coolinarika.com',
time__gte=start_date, time__lt=stop_date)
7 logging.info('Loading %d search requests from database', queryset.count())
8
9 graph = Graph(SkipPathsIteratorFilter(QuerysetIterator(queryset.iterator()),
config.skip_paths))
10 logging.info('Identified %d unique queries leading to %d unique documents' %
(len(graph.queries), len(graph.documents)))
11
12 logging.info('Computing initial sigma...')
13 graph.init_sigma()
14 logging.info('Found %d similarities between queries' % len(graph.query_sigma))
15 logging.info('Found %d similarities between documents' %
len(graph.document_sigma))
16
17 step = 0
18 report_steps = 100
19
20 while True:
21
22 if step % report_every_n_steps == 0:
23 # produce report for review every at report_steps steps
24 graph.pp_queries(filename='queries-%d.txt' % (step / report_steps))
25 graph.pp_documents(filename='documents-%d.txt' % (step / report_steps))
26
27 # merge two most similar queries and two most similar documents
28 a12 = graph.merge_query()
29 b12 = graph.merge_document()
30
31 step += 1
32
33 # exit if nothing was merged (clustering options exhausted)
34 if not a12 and not b12: break
35
36 class Graph:
37
38 class Counter:
39 def __init__(self):
40 self.counter = 0
41
42 def get_next(self):
43 self.counter += 1
44 return self.counter
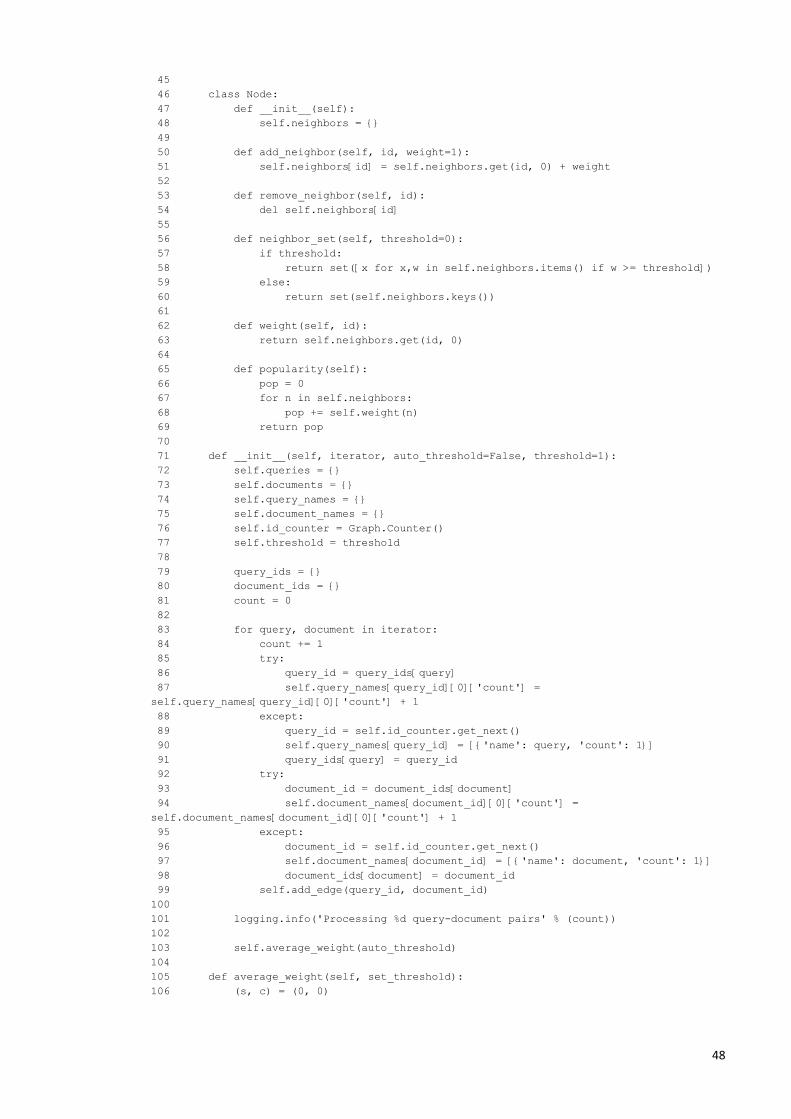
48
45
46 class Node:
47 def __init__(self):
48 self.neighbors = {}
49
50 def add_neighbor(self, id, weight=1):
51 self.neighbors[id] = self.neighbors.get(id, 0) + weight
52
53 def remove_neighbor(self, id):
54 del self.neighbors[id]
55
56 def neighbor_set(self, threshold=0):
57 if threshold:
58 return set([x for x,w in self.neighbors.items() if w >= threshold])
59 else:
60 return set(self.neighbors.keys())
61
62 def weight(self, id):
63 return self.neighbors.get(id, 0)
64
65 def popularity(self):
66 pop = 0
67 for n in self.neighbors:
68 pop += self.weight(n)
69 return pop
70
71 def __init__(self, iterator, auto_threshold=False, threshold=1):
72 self.queries = {}
73 self.documents = {}
74 self.query_names = {}
75 self.document_names = {}
76 self.id_counter = Graph.Counter()
77 self.threshold = threshold
78
79 query_ids = {}
80 document_ids = {}
81 count = 0
82
83 for query, document in iterator:
84 count += 1
85 try:
86 query_id = query_ids[query]
87 self.query_names[query_id][0]['count'] =
self.query_names[query_id][0]['count'] + 1
88 except:
89 query_id = self.id_counter.get_next()
90 self.query_names[query_id] = [{'name': query, 'count': 1}]
91 query_ids[query] = query_id
92 try:
93 document_id = document_ids[document]
94 self.document_names[document_id][0]['count'] =
self.document_names[document_id][0]['count'] + 1
95 except:
96 document_id = self.id_counter.get_next()
97 self.document_names[document_id] = [{'name': document, 'count': 1}]
98 document_ids[document] = document_id
99 self.add_edge(query_id, document_id)
100
101 logging.info('Processing %d query-document pairs' % (count))
102
103 self.average_weight(auto_threshold)
104
105 def average_weight(self, set_threshold):
106 (s, c) = (0, 0)

49
107 for a, n in self.queries.iteritems():
108 for b, w in n.neighbors.iteritems():
109 c += 1
110 s += w
111 logging.info('Average number of query-document weights: %.2f' % (float(s) /
c))
112 if set_threshold:
113 self.threshold = int(float(s)/c)
114 logging.info('Setting threshold to %d' % (self.threshold))
115
116 def add_edge(self, query, path):
117 query_node = self.queries.get(query, Graph.Node())
118 document_node = self.documents.get(path, Graph.Node())
119 query_node.add_neighbor(path)
120 document_node.add_neighbor(query)
121 self.queries[query] = query_node
122 self.documents[path] = document_node
123
124 def sigma_query_one(self, a):
125 self.sigma_one(self.queries, self.documents, self.query_sigma, a)
126
127 def sigma_document_one(self, b):
128 self.sigma_one(self.documents, self.queries, self.document_sigma, b)
129
130 def sigma_one(self, nodes_A, nodes_B, sigma, a1):
131 ''' For each node A in A's Bs get a list of B's As and join them.
132 The result is a set of simmilar As to initial node A. '''
133 similar_to_a1 = set()
134
135 for b in nodes_A[a1].neighbor_set(threshold=self.threshold):
136 similar_to_a1 =
similar_to_a1.union(nodes_B[b].neighbor_set(threshold=self.threshold))
137
138 for a2 in similar_to_a1:
139 if a1 != a2 and not ((a1 < a2 and sigma.has_key((a1, a2))) or (a1 > a2
and sigma.has_key((a2, a1)))):
140
141 intersection =
nodes_A[a1].neighbor_set(threshold=self.threshold).intersection(nodes_A[a2].neighbor_set
(threshold=self.threshold))
142
143 L_intersection = 0
144 for b in intersection:
145 L_intersection += nodes_A[a1].weight(b) + nodes_A[a2].weight(b)
146 L_a1 = 0
147 for b in nodes_A[a1].neighbors.iterkeys():
148 L_a1 += nodes_A[a1].weight(b)
149 L_a2 = 0
150 for b in nodes_A[a2].neighbors.iterkeys():
151 L_a2 += nodes_A[a2].weight(b)
152
153 s = float(L_intersection) / (L_a1 + L_a2)
154
155 if a1 < a2:
156 sigma[(a1, a2)] = s
157 else:
158 sigma[(a2, a1)] = s
159
160 def init_sigma(self):
161 self.query_sigma = {}
162 for a in self.queries:
163 self.sigma_query_one(a)
164 self.document_sigma = {}
165 for b in self.documents:

50
166 self.sigma_document_one(b)
167
168 def merge_query(self):
169 return Graph.merge(self, self.queries, self.documents, self.query_sigma,
self.document_sigma, self.query_names, self.document_names)
170
171 def merge_document(self):
172 return Graph.merge(self, self.documents, self.queries, self.document_sigma,
self.query_sigma, self.document_names, self.query_names)
173
174 def merge(self, nodes_A, nodes_B, sigma_A, sigma_B, names_A, names_B):
175 ''' Find two most similar nodes and merge them '''
176 # find pair a1, a2 for merging
177 max_sigma = 0
178 max_pair = None
179 for p, s in sigma_A.iteritems():
180 if s > max_sigma:
181 max_pair, max_sigma = p, s
182 if not max_pair:
183 return None
184 a1, a2 = max_pair
185
186 # id for new, merged node
187 a12 = self.id_counter.get_next()
188
189 # merged query
190 names_A[a12] = []
191 names_A[a12].extend(names_A[a1])
192 names_A[a12].extend(names_A[a2])
193 del names_A[a1]
194 del names_A[a2]
195
196 # new node with connections from a1 and a2
197 node12 = Graph.Node()
198 for b, w in nodes_A[a1].neighbors.iteritems():
199 node12.add_neighbor(b, w)
200 for b, w in nodes_A[a2].neighbors.iteritems():
201 node12.add_neighbor(b, w)
202
203 # relink nodes_B from a1 and a2 to a12
204 for b in nodes_A[a1].neighbors:
205 nodes_B[b].add_neighbor(a12, nodes_B[b].weight(a1))
206 nodes_B[b].remove_neighbor(a1)
207 for b in nodes_A[a2].neighbors:
208 nodes_B[b].add_neighbor(a12, nodes_B[b].weight(a2))
209 nodes_B[b].remove_neighbor(a2)
210
211 # remove from sigma everything related to a1 and a2
212 for x1, x2 in sigma_A.keys():
213 if x1 == a1 or x1 == a2 or x2 == a1 or x2 == a2:
214 del sigma_A[(x1, x2)]
215 for y1, y2 in sigma_B.keys():
216 if node12.neighbors.has_key(y1) or node12.neighbors.has_key(y2):
217 del sigma_B[(y1, y2)]
218
219 # remove a1 and a2 and insert a12
220 del nodes_A[a1]
221 del nodes_A[a2]
222 nodes_A[a12] = node12
223
224 # calculate new sigmas
225 self.sigma_one(nodes_A, nodes_B, sigma_A, a12)
226 for b in node12.neighbors:
227 self.sigma_one(nodes_B, nodes_A, sigma_B, b)

51
228
229 return a12
230
231 def pp_queries(self, filename='queries.txt'):
232 return self.pp_clusters(self.queries, self.query_names, filename)
233
234 def pp_documents(self, filename='documents.txt'):
235 return self.pp_clusters(self.documents, self.document_names, filename)
236
237 def pp_clusters(self, nodes, names, filename):
238 ''' Pretty print clusters (queries or documents) '''
239 f = open(filename, 'w')
240 count = 0
241 for n in nodes:
242 count += nodes[n].popularity()
243 cumulative_percent = 0
244
245 for i, n in enumerate(sorted(nodes, lambda n1, n2:
cmp(nodes[n2].popularity(), nodes[n1].popularity()))):
246 percent = nodes[n].popularity() / float(count)
247 cumulative_percent += percent
248 f.write('-' * 80)
249 f.write('\n')
250 f.write('%d. Count: %d Percent: %02f Cumulative: %02f\n%s\n' % (
251 i+1, nodes[n].popularity(),
252 percent * 100, cumulative_percent * 100,
253 '\n'.join(map(lambda x: ' %4d - %s' % (x['count'],
x['name'].encode('UTF-8')), sorted(names[n], lambda a, b: cmp(b['count'],
a['count']))))))
254
255 f.close()