Embed Size (px)
Citation preview

INTERNATIONAL JOURNAL OF CLIMATOLOGYInt. J. Climatol. (in press)Published online in Wiley InterScience(www.interscience.wiley.com) DOI: 10.1002/joc.1534
Identification of large scale climate patterns affecting snowvariability in the eastern United States
Jennifer Morin,a Paul Block,a* Balaji Rajagopalana,b and Martyn Clarkb
a Department of Civil Environmental and Architectural Engineering, University of Colorado, Boulder, Colorado, USAb Co-operative Institute for Research in Environmental Sciences, University of Colorado, Boulder, Colorado, USA
ABSTRACT: This study investigates dominant patterns of snow variability and their relationship to large-scale climatecirculations over the eastern half of the United States. Two snowfall variables – total seasonal snowfall (TSF) and numberof snow days (NSD) – are examined. A principal components (PC) analysis is conducted on data from 124 snowfallstations. The leading mode of variability for both TSF and NSD is driven by the North Atlantic Oscillation (NAO). Thesecondary mode of variability for TSF is driven by the Pacific/North American pattern (PNA), while the secondary modeof variability for NSD is driven by a dipole pattern and is attributable to regional influences and noise. These patternsexhibit persistence, which provides prospects for seasonal predictions of snowfall variables. This research compliments andextends the work of Serreze et al. (1998), who performed a PC analysis of geopotential heights during the winter seasonand correlated the spatial patterns of the leading modes of variability with seasonal snowfall values. Copyright 2007Royal Meteorological Society
KEY WORDS snowfall; snowfall variability; North American Oscillation; climate patterns
Received 10 September 2006; Revised 3 March 2007; Accepted 4 March 2007
1. Introduction
Variability in snowfall and snow cover has a profoundimpact from global scales to individual communities.Large snowfall events affect communities by effectivelyshutting down businesses and creating transportationproblems. In the eastern United States, the predictionsof annual snowfall amounts are important for communityplanners, water resources managers, and snow-dependentrecreational facilities. Predicting snow is a relevant anddifficult problem as snowfall is highly localized in itsoccurrence and is influenced both directly and indirectlyby a number of climatic factors, including temperature,precipitation, large-scale atmospheric circulation patterns,and topographic effects (Brown, 2000; Serreze et al.,2001; Serreze et al., 1998; Clark et al., 1999; Cayan,1996; McCabe and Dettinger, 2002). Thus, there isa present need for a thorough understanding of thefactors that affect snowfall frequency and magnitudefor accurate predictions of snowfall in a given winterseason.
The paper begins with broad background informationon large-scale climate patterns that influence the east-ern U.S. Following this is a description of the datasources utilized, and a brief description of the gen-eral relationships between climate variables (temperatureand precipitation) and snowfall variables. Next, a princi-pal component analysis (PCA) on two station variables,
* Correspondence to: Paul Block, Department of Civil Environmen-tal and Architectural Engineering, University of Colorado, Boulder,Colorado, USA. E-mail: [email protected]
total seasonal snowfall (TSF) and number of snow days(NSD), is described. The spatial patterns of the firsttwo principal components (PC) are presented, along withindependent correlations of the PC with climate variablesto identify regions of importance and specific climaticforcings. The paper concludes with a summary and dis-cussion.
Several aspects of this work help to advance theresearch of climate factors affecting variability in snow-fall in the eastern United States. First, the methodologyemploys a PCA on two snowfall variables over a studyarea comprising of the entire eastern U.S. Second, thestudy includes the number of days snow fell at each sta-tion as a variable in the analysis. NSD is a variable notoften studied in literature, but quite relevant to policymakers interested in the number of times it will snow intheir region each winter.
2. Background
The eastern United States climate is impacted by large-scale atmospheric circulation in both the Pacific andAtlantic regions (Mantua et al., 1997; Thompson andWallace, 1998; Kushnir et al., 1999; Hurrell, 1995b). TheNorth Atlantic Oscillation (NAO) is a primary mode ofatmospheric variability over the North Atlantic regionon decadal time scales (Hurrell, 1995a; Barnston andLivezey, 1987; Kushnir et al., 1999; Walker and Bliss,1932; Wallace and Gutzler, 1981). Wallace and Gutzler(1981) link the intensity of the Icelandic low, as associ-ated with the NAO, to 700 mb pressure anomalies over
Copyright 2007 Royal Meteorological Society

J. MORIN ET AL.
land surfaces in the Atlantic region. A strong icelandiclow is conducive to positive pressure anomalies over theeastern US and northwestern Europe. Hurrell (1995b)and Kushnir et al. (1999) describe the physical mech-anisms of the NAO, including its impact on Europeanand American climates.
The Pacific/North American pattern (PNA) has alsobeen identified as a major contributor to climate vari-ability over North America during winter (Barnston andLivezey, 1987; Wallace and Gutzler, 1981). Leatherset al. (1991) indicate that the PNA is highly correlatedwith monthly temperature and precipitation over mostof the contiguous U.S. from September to May. Deep-ening of the Aleutian low during positive PNA yearscauses the jet stream to bring cold Arctic air and lowertemperatures to the eastern U.S. Increased meridionalitycauses decreased precipitation in the northwestern andsoutheastern U.S., by steering tropical convective stormsnorthward, and bringing dry Artic air to the southeast-ern U.S. Northern Hemisphere temperature and precip-itation variations are related to the PNA on interannualtime scales. The PNA pattern is modulated by sea sur-face temperature (SST) anomalies in the Pacific Ocean,specifically the El Nino-Southern Oscillation (ENSO)phenomenon.
Various climatic conditions in the eastern U.S. per-taining to snow have been studied over the past fewdecades, including snowfall and precipitation amounts
Figure 1. Locations of stations with data provided by the NWSCOOP in the eastern U.S. This figure is available in colour online
at www.interscience.wiley.com/ijoc
and inter-relationships with temperature. Janowiak andBell (1999) examine wintertime cold-air outbreaks in theU.S., and note that the frequency of outbreaks in the east-ern part of the U.S. decreases during both positive ENSOyears (El Nino) and negative ENSO years (La Nina)winters. Groisman and Easterling (1994) observed thatannual precipitation has increased by 13% in southeastern
Figure 2. Mean values of (a) seasonal maximum temperature in degrees Fahrenheit, and (b) total seasonal precipitation in millimeters.
Figure 3. Mean values of (a) total seasonal snowfall in mm, and (b) number of snow days.
Copyright 2007 Royal Meteorological Society Int. J. Climatol. (in press)DOI: 10.1002/joc

CLIMATE PATTERNS AFFECTING SNOW VARIABILITY IN THE EASTERN US
Figure 4. Correlations between total seasonal snowfall and numberof snow days; values greater than 0.178 indicate 90% significance.All correlations are positive, and the size of the symbol indicates the
magnitude of the correlation.
Canada and by 4% in the U.S over the past century. Morerecent studies have associated snowfall with geopotential
height and SST anomalies. Serreze et al. (1998) iden-tify three dominant large-scale climate patterns that con-tribute to variability in snowfall over the eastern U.S.: thePNA, the TNH (Tropical-Northern Hemisphere), and theEP (east Pacific) pattern. In addition, the authors denotetwo distinct snowfall regions, divided by limiting factorsin snow production. The first includes the upper Mid-west, Kansas, and Nebraska, where snowfall is a func-tion of precipitation. The second includes the remainingMidwest, the southeast, and the northeast, where snow-fall is a function of temperature. Hartley and Robinson(1999) studied potential links between climate anoma-lies and SST anomalies along the east coast of the U.S.They note that negative SST anomalies off the north-east coast during fall produces above average snowfallfrom the central Appalachians to the east coast duringthe following winter. Additionally, they found that lower700 mb geopotential heights over the southeastern U.S.and Atlantic in wintertime, when preceded by a cold fall,tend to result in lower wintertime temperatures, creatingmore potential for precipitation to fall as snow. Bradburyet al. (2003) linked New England snowfall variabilityto the NAO, ENSO, and the pacific decadal oscillation(PDO) via regional storm tracking patterns. They alsoidentify a significant correlation between snowfall andregional SST anomalies, and suggest snowfall may also
Figure 5. Correlations between (a) mean seasonal maximum temperature and total seasonal snowfall, and (b) mean seasonal maximum temperatureand number of snow days. Values outside of +/ − 0.178 indicate 90% significance.
Figure 6. Correlations between (a) total seasonal precipitation and total seasonal snowfall, and (b) total seasonal precipitation and number ofsnow days. Values outside of +/ − 0.178 indicate 90% significance.
Copyright 2007 Royal Meteorological Society Int. J. Climatol. (in press)DOI: 10.1002/joc

J. MORIN ET AL.
Figure 7. Percent of variance explained for the first ten principal components; (a) total seasonal snowfall, (b) number of snow days. This figureis available in colour online at www.interscience.wiley.com/ijoc
be indirectly modulated by NAO influence of SST vari-ability.
The previous section illustrates how past research hascontributed to the understanding of snowfall variabilityover the eastern U.S. More investigation into the specificpatterns, circulations, and areas of the globe that influ-ence snowfall variability is necessary to make accuratepredictions of seasonal snowfall for water managers andpolicy makers in this region. The intention of this studyis to examine the association of station snow variablesin the eastern portion of the contiguous U.S. with north-ern hemisphere climate variables, including SST, pressureand winds, with the hope of including these new relation-ships into future snowfall prediction models.
3. Data
Climate data from 227 observation stations locatedthroughout the eastern half of the United States isutilized in this study. The seasonally-averaged winterdata (November–March) was obtained from the NationalWeather Service Cooperative (COOP) network of stationsfor the period 1951–2001. This equates to one annualvalue per variable per station. It is well known that incon-sistencies exist within the COOP data, including samplingtime and frequency, measuring equipment, local effects,etc. None of these issues have been explicitly dealt within this study.
Station locations are shown in Figure 1. Climaterecords for each station include number of precipitationdays, total seasonal precipitation, maximum temperatureon precipitation days, mean se asonal maximum temper-ature, NSD, number of days with snow on the ground,and TSF (actual depth). The records are substantially
Figure 8. Spatial pattern of EOF1 of total snowfall.
complete, although missing annual values for a variableoccasionally exist. To minimize uncertainty, a station waseliminated from a variable set if it lacked annual valuesfor three or more years during the period of analysis. Thenumber of stations retained in the variable sets rangedfrom 216 stations (TSF) to all 227 stations (total sea-sonal precipitation). Any remaining gaps were filled withthe average value for the variable at that station duringthe study period.
Monthly NAO and Southern Oscillation Index (SOI)values were obtained from the National Oceanic &Atmospheric Administration’s (NOAA) Climate Predic-tion Center web site, and represent the sea-level pressuredifferences between Iceland and the Azores. MonthlyPNA values, as derived by the Wallace and Gutzler
Copyright 2007 Royal Meteorological Society Int. J. Climatol. (in press)DOI: 10.1002/joc

CLIMATE PATTERNS AFFECTING SNOW VARIABILITY IN THE EASTERN US
Figure 9. (a) PC1 of total snowfall correlation with 500 mb geopotential height; shaded regions are 90% significant. (b) PC1 of total snowfall (solidline) and December–February NAO-index (dashed line) time-series. This figure is available in colour online at www.interscience.wiley.com/ijoc
(1981) formula, were obtained from the Joint Insti-tute for the Study of the Atmosphere and Ocean website. Correlation maps of snowfall PC and geopotentialheight were created using national center for environ-mental predictions (NCEP) Reanalysis data provided bythe NOAA/OAR/ESRL PSD in Boulder, Colorado, fromtheir website at http://www.cdc.noaa.gov/.
4. General relationships of climate variables
In an effort to identify general patterns in temperature andprecipitation governing the physical mechanisms of snowover the eastern United States, plots of average stationvariables over the wintertime study period were created.Average values of mean seasonal maximum temperature(Figure 2(a)) and maximum temperature on precipitation
Copyright 2007 Royal Meteorological Society Int. J. Climatol. (in press)DOI: 10.1002/joc

J. MORIN ET AL.
Figure 10. Correlation of (a) EOF1 of total snowfall with total precipitation, and (b) EOF1 of total snowfall with number of snow days. Valuesoutside of +/ − 0.178 indicate 90% significance.
days (not shown) illustrate the expected zonal decreasein temperature with increased latitude. A plot of meantotal seasonal precipitation (Figure 2(b)) points to a highcenter of precipitation in the south central portion of thestudy area over Alabama and Mississippi, with decreasingamounts of precipitation moving away from this center,especially over the Midwestern states. Precipitation inthe form of snow is recorded according to its snowwater equivalent. This spatial pattern is not unexpected,and coincides with well-know precipitation patterns.Coastal states typically experience higher quantities ofprecipitation, due to their proximity to the ocean, thanthose farther inland (Joyce, 2002). El Nino tends toemphasize this wintertime pattern, while La Nina has apropensity to reverse the trend, especially in the southeastand Ohio valley, becoming drier and wetter, respectively(Livezey, 1999).
TSF and NSD (Figure 3(a) and (b)) tend to be high-est surrounding the Great Lakes region and into thenortheast, where cold seasonal temperatures and highamounts of precipitation serve to produce large amountsof snow. The Great Lakes region receives snowfall based
Figure 11. Spatial pattern of EOF2 of total snowfall.
on the lake effect, a phenomena caused by cold arcticair blowing over the relatively warm lakes, picking upmoisture, then rising, causing the moisture to condense,and finally snowing over the downwind land (Heidorn,1998; Niziol et al., 1995). Numerous studies have investi-gated wintertime precipitation in the northeast (Bradburyet al., 2002, 2003; Hartley, 1996; Hartley and Keables,1998) as previously outlined, attributing variability tosea-surface temperatures, geopotential heights, and theNAO, allowing for colder temperatures, causing moreprecipitation to fall as snow. Contrastingly, TSF and NSDwere very low (less than 5 days of snow and less than200 mm of total season snowfall) south of Missouri,Kentucky, and Virginia, due to warmer seasonal tem-peratures. Therefore, as a result of their low values andminimal contribution to snowfall patterns, stations southof 35°N are not included in the subsequent analysis.
A spatial map of correlations between TSF and NSDat each station, presented in Figure 4, shows significantpositive correlation over the entire remaining study area.Correlations of these and other variables in the paperwere computed using the Pearson correlation coefficientand were tested for field significance using the MonteCarlo technique outlined in Livezey and Chen (1982)and described in von Storch and Zweirs (1999). Thistechnique recognizes that spatial data across a regionare not independent, and determines the probability ofobtaining a significant result simply by chance. The fieldsignificance level, computed using a Pearson correlationcoefficient and 1000 Monte Carlo simulations of arandom time series, was 11.6 for the 121 stations withboth TSF and NSD data. The number of stations withsignificant correlations was determined for each spatialmap of correlation presented in this paper, and wasfound to be above the field significance level, or 95thhighest ranking of randomized significance, in all casesreported. The strong positive correlations of TSF andNSD are expected and intuitive, as years with numeroussnow storms typically produce high seasonal snowfalltotals. Cold air is dominant in this region, causingprecipitous days to often be snowy days. The variabilityin correlations is mostly due to local features, such
Copyright 2007 Royal Meteorological Society Int. J. Climatol. (in press)DOI: 10.1002/joc
CLIMATE PATTERNS AFFECTING SNOW VARIABILITY IN THE EASTERN US
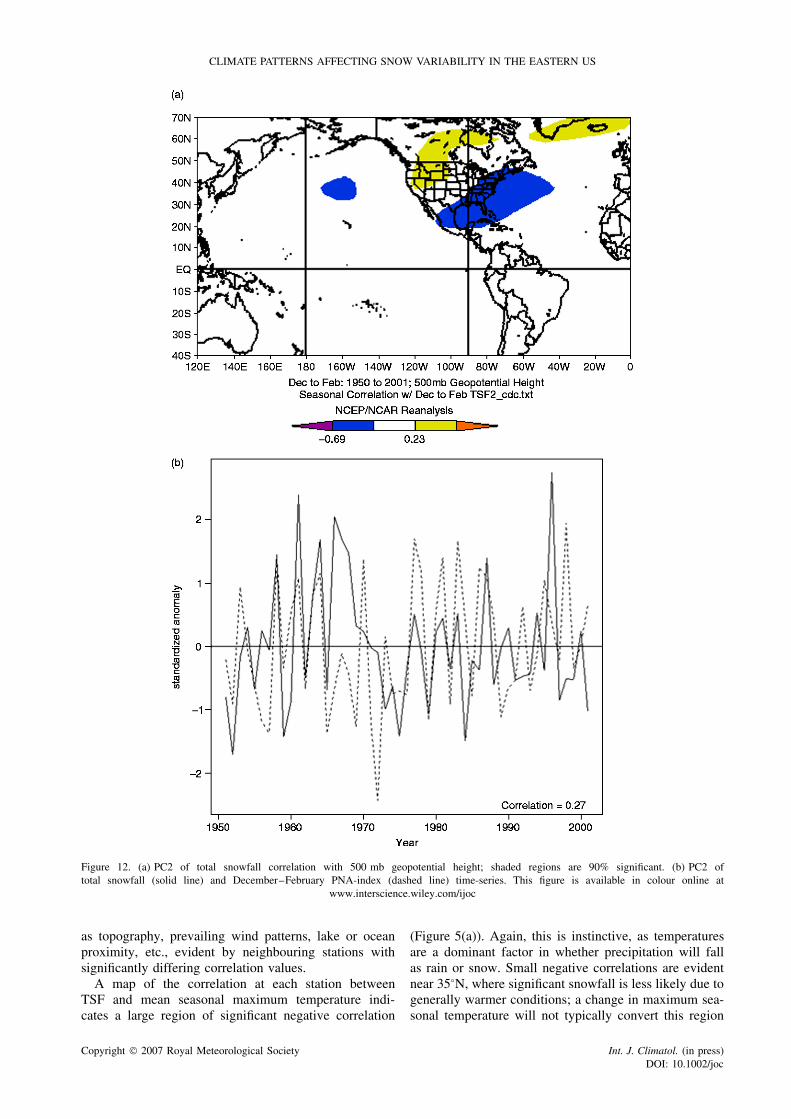
Figure 12. (a) PC2 of total snowfall correlation with 500 mb geopotential height; shaded regions are 90% significant. (b) PC2 oftotal snowfall (solid line) and December–February PNA-index (dashed line) time-series. This figure is available in colour online at
www.interscience.wiley.com/ijoc
as topography, prevailing wind patterns, lake or oceanproximity, etc., evident by neighbouring stations withsignificantly differing correlation values.
A map of the correlation at each station betweenTSF and mean seasonal maximum temperature indi-cates a large region of significant negative correlation
(Figure 5(a)). Again, this is instinctive, as temperaturesare a dominant factor in whether precipitation will fallas rain or snow. Small negative correlations are evidentnear 35°N, where significant snowfall is less likely due togenerally warmer conditions; a change in maximum sea-sonal temperature will not typically convert this region
Copyright 2007 Royal Meteorological Society Int. J. Climatol. (in press)DOI: 10.1002/joc
J. MORIN ET AL.
from a rainy to snowy region. Likewise, small negativecorrelations are present near the Great Lakes regions, butfor the opposite reason; temperature variability will nottypically transform this snowy region into a rainy oneduring the wintertime. Correlations between NSD andmean seasonal maximum temperature exhibit a similarrelationship (Figure 5(b)), as expected, due to the rela-tively strong correlation of total snowfall and NSD. Smallnegative correlations are not as pronounced, though, astemperature variability plays a more pivotal role on adaily basis. (Some stations with small correlations inFigure 5(a) were removed for Figure 5(b) along 35°N forlack of data values, as described in the previous section.As a result, the interpretation for NSD is not as wellsupported as for TS.)
A correlation map between TSF and total seasonalprecipitation at each station is shown in Figure 6(a).Boxes represent positive correlation, circles representnegative correlation. A low to moderate positive corre-lation between the two variables exists at the majorityof stations north of 37°N. Where temperature is not alimiting factor (i.e. it is predominantly cold), the amountof snow falling in a given winter will increase as thetotal season precipitation increases. Indeed, correlationsare highest in the northern regions, where cold tem-peratures prevail throughout the winter and snowfall isheavily dependent upon precipitation. In areas of lowpositive correlation, the influence of temperature andlocal topography could be more significant than total sea-sonal precipitation. A few stations in the southern portionof the study area exhibit small negative correlations; here,seasonal snowfall is more dependent upon temperaturethan precipitation. Correlations between NSD and totalseasonal precipitation demonstrate a similar relationship(Figure 6(b)), although positive correlations in the northare not as strong, as the size and duration of storms arealso factors.
5. Interpretation and analysis of regional andlarge-scale climate patterns
Two variables of great interest to water managers andutility personnel, TSF and NSD, were retained for fur-ther analysis. A PCA was conducted on the two vari-ables independently to assess their potential associa-tions with well-known large-scale climate patterns, asreported in previous studies. Owing to the orthogo-nal nature of the PCA, dominant climate patterns arereadily identifiable by correlation with large-scale cli-mate variables (sea-surface temperature, sea-level pres-sure, etc.) The PCA was performed on stations foreach variable that met the aforementioned criteria; thisresulted in 124 stations for TSF and 121 stationsfor NSD.
The first PC of TSF and NSD explain approximately30 and 35% of the variance, respectively, while eachof the remaining PCs explains less than 15% of thevariability in its respective variable. Figure 7(a) and(b) illustrate this for the first ten PCs. North’s Rule
of Thumb, as described in von Storch and Zweirs(1999), is employed for determining the number of PCsto retain. This roughly equates to the first three forTSF (totaling 51.9% of the variance explained), andthe first two for NSD (totaling 45.8% of the varianceexplained). The remaining PCs, collectively explainingapproximately half of the variance in the data, areassumed to be representative of local features or noise inthe data. This result is a product of the large geographicregion and numerous stations being considered. Smallerregions or fewer stations in closer proximity typicallyresult in greater percentages of variances explained. Forexample, if only the southeastern quad of this region isconsidered, the variance explained in the first three PCsincreases to approximately 75 and 70% for TSF and NSD,respectively – a substantial jump. Further limiting theregion to Virginia and Maryland increases the varianceexplained to nearly 90%.
Although the large-scale climate patterns affectingthe entire eastern half of the U.S. may be expectedto be less pronounced than for smaller areas, thePCA still greatly aids in understanding what drivesthe interannual variability of TSF and NSD. The fol-lowing sections outline each PC retained, via spa-tial loading patterns, association with large-scale cli-mate patterns, and interrelationships with other vari-ables.
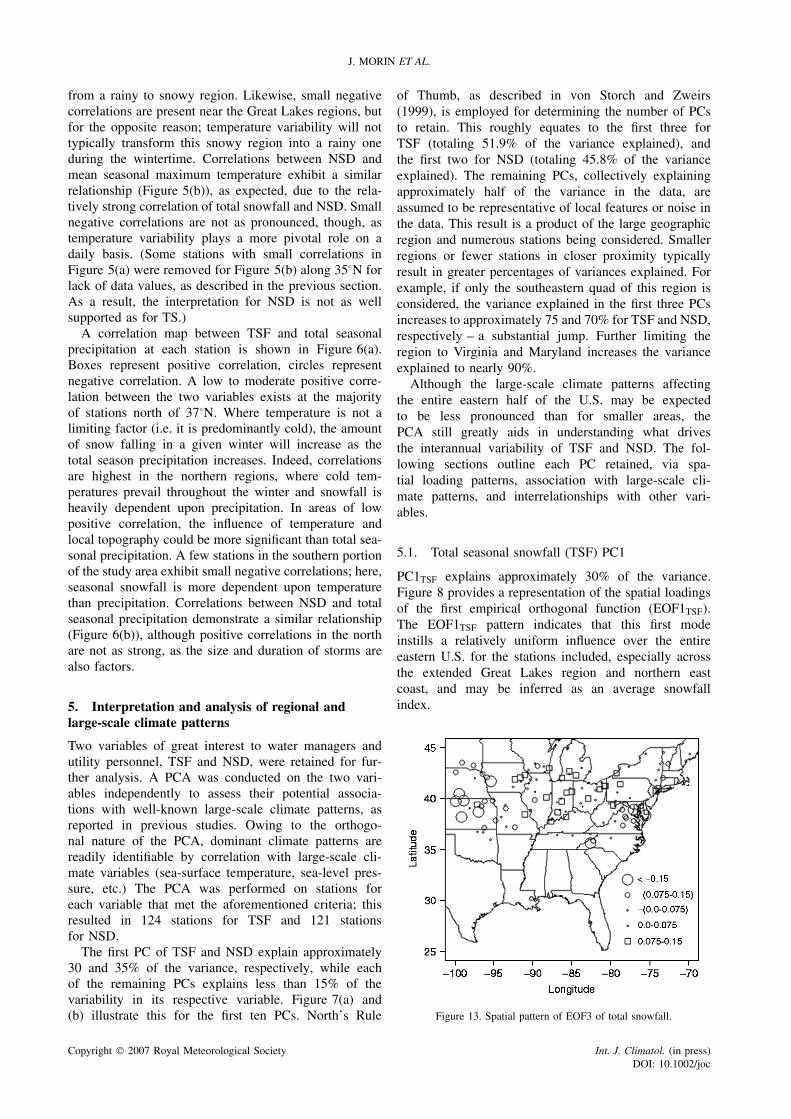
5.1. Total seasonal snowfall (TSF) PC1
PC1TSF explains approximately 30% of the variance.Figure 8 provides a representation of the spatial loadingsof the first empirical orthogonal function (EOF1TSF).The EOF1TSF pattern indicates that this first modeinstills a relatively uniform influence over the entireeastern U.S. for the stations included, especially acrossthe extended Great Lakes region and northern eastcoast, and may be inferred as an average snowfallindex.
Figure 13. Spatial pattern of EOF3 of total snowfall.
Copyright 2007 Royal Meteorological Society Int. J. Climatol. (in press)DOI: 10.1002/joc

CLIMATE PATTERNS AFFECTING SNOW VARIABILITY IN THE EASTERN US
Figure 14. (a) PC3 of total snowfall correlation with sea-surface temperatures; shaded regions are 90% significant. (b) PC3 of total snowfall (solidline) and December–February SOI-index (dashed line) time-series. This figure is available in colour online at www.interscience.wiley.com/ijoc
A correlation map of the PC1TSF time-series with500 mb geopotential height, in the concurrent sea-son, is presented in Figure 9(a). This pressure patternresembles the NAO, with the classic Atlantic dipole,although the regions of highest correlation do not
coincide exactly with the major centers of action ofthe NAO (i.e., Iceland and Portugal) as defined byvan Loon and Rogers (1978). Nonetheless, the simi-larity is evident. Also present is a strong high pres-sure centered over the Midwest/Great Lakes region. The
Copyright 2007 Royal Meteorological Society Int. J. Climatol. (in press)DOI: 10.1002/joc

J. MORIN ET AL.
PC1TSF time-series and December–February NAO indexare illustrated in Figure 9(b). As expected, there is onlya moderate correlation with the standard NAO index(correlation coefficient = 0.47), indicating that alterna-tive indices may need to be identified to predict seasonalsnowfall.
Figure 10 illustrates correlations of EOF1TSF with twostation variables: total seasonal precipitation and NSD.The intent of these figures is to aid in identifyingregional relationships and variable dependence that maynot be intuitive. Correlations between EOF1TSF and totalprecipitation are predominantly positive over the eastcoast and Atlantic states region (Figure 10(a)). This isanticipated, as positive phases of the NAO typicallyimply warmer temperatures and more precipitation overthe eastern half of the study area. In this region snowfallis dependent upon precipitation as shown in Figure 6;thus a positive NAO increases snowfall. These positivecorrelations fade moving inland, and the Midwest andupper Midwest acts in contrary fashion for positive NAOphases, experiencing drier than normal conditions due tocold dry air surging from Canada. Opposite patterns resultfor negative phases of the NAO. The correlation betweenEOF1TSF and the NSD presents a relatively low positivecorrelation throughout the majority of the southern andeastern portions of the study area, with weak negativecorrelations in the upper Midwest (Figure 10(b)). Thisimplies that the NAO-like mode of PC1TSF has minimalbearing on the NSD, but does constitute more (less) daysof snow in the south and east (Midwest) for positivephases, and vice-versa.
5.2. Total seasonal snowfall (TSF) PC2
PC2TSF explains approximately 13% of the variance.Figure 11 exhibits the spatial loading of EOF2TSF. Adipole pattern of negative loadings in the Midwestand positive loadings on the Atlantic Coast are clearlyevident.
Correlation maps of PC2TSF and 500 mb geopotentialheights create sandwich patterns in both the Atlantic andPacific oceans. While the dominant mode of total snow-fall is driven by patterns in the Atlantic, the secondarymode is driven by patterns in the Pacific and over thenorth American continent. The geopotential correlationmap, Figure 12(a), illustrates a strong low pressure zonejust off the southeastern tip of the U.S., a weaker lowpressure zone in the north Pacific Ocean, and a highpressure zone over the northwest U.S. This three-pointconfiguration is similar to the PNA pattern described byBarnston and Livezey (1987). A positive PNA phase typ-ically produces below-average precipitation in the upperMidwest, as denoted in Figure 11, thereby decreasingsnowfall. A positive PNA also pulls cold air from Canadato the eastern half of the United States and decreasestemperatures, thus increasing the proportion of precipita-tion that falls as snow. Figure 12(b) depicts the PC2TSF
time series along with the December–February PNAtime series as derived by Wallace and Gutzler (1981);
again, the moderate correlation (r = 0.27) emphasizes theneed to develop alternative indices for seasonal snowfallprediction.
5.3. Total seasonal snowfall (TSF) PC3
The third and final principal component retained fortotal snowfall, PC3TSF, explains approximately 9% ofthe variance; Figure 13 exhibits the spatial loading ofEOF3TSF. A contrasting pattern of low negative correla-tion throughout the central Midwest portion of the studyarea below the Great Lakes and low positive correlationin the far eastern and western portions of the study areais evident.
Figure 14(a) maps the correlation of PC3TSF withSST. The familiar correlation in the equatorial Pacificwaters points to a potential connection with an ENSO-like pattern. El Nino years typically compel warmer anddrier conditions in the upper Midwest and cooler andwetter conditions in the southeast; La Nina years typicallyproduce opposite effects. These conditions are consistentwith the EOF3TSF spatial loadings of Figure 13, wherethe Midwest and east coast have opposing responsesto the pattern. Figure 14(b) presents the PC3TSF andDecember–February SOI time series; not surprisingly,the moderate correlation (r = 0.28) reflects the spatiallylarge and diverse study area.
5.4. Number of snow days (NSD) PC1
PC1NSD explains approximately 35% of the variance.The spatial loadings of EOF1NSD, presented in Figure 15,closely approximate the spatial loadings of PC1TSF. Onceagain, PC1NSD can be inferred as an average index of theNSD during the winter season.
A correlation map of PC1NSD with 500 mb geopo-tential height for the same season is presented inFigure 16(a). This correlation is distinctly similar toPC1TSF, and also resembles the NAO pattern. The time-series of PC1NSD and the December–February NAO aredisplayed in Figure 16(b). The correspondence between
Figure 15. Spatial pattern of EOF1 of number of snow days.
Copyright 2007 Royal Meteorological Society Int. J. Climatol. (in press)DOI: 10.1002/joc

CLIMATE PATTERNS AFFECTING SNOW VARIABILITY IN THE EASTERN US
Figure 16. (a) PC1 of number of snow days correlation with 500 mb geopotential height; shaded regions are 90% significant. (b) PC1 ofnumber of snow days (solid line) and December–February NAO-index (dashed line) time-series. This figure is available in colour online at
www.interscience.wiley.com/ijoc
the NAO index and PC1NSD is slightly stronger (r =0.52) than the NAO with PC1TSF. Physical mechanismscontrolling snow frequency and variability are similarto those described for PC1TSF. This dominant NAO-like pattern may prove useful for seasonal predictionsof the NSD.
Figure 17 illustrates correlations of EOF1NSD withtotal seasonal precipitation and TSF. The correlationbetween the spatial loading and total precipitation, asshown in Figure 17(a), is not dissimilar to the corre-lation of EOF1TSF to total seasonal precipitation, butindicates greater anomalies in the midwest and Great
Copyright 2007 Royal Meteorological Society Int. J. Climatol. (in press)DOI: 10.1002/joc

J. MORIN ET AL.
Figure 17. Correlation of (a) EOF1 of number of snow days with total precipitation, and (b) EOF1 of number of snow days with total snowfall.Values outside of +/ − 0.178 indicate 90% significance.
Lakes region, perhaps indicating local features (suchas the lake effect) that have an influence on seasonalNSD. Figure 17(b) shows a strong positive correlationbetween EOF1NSD and total snowfall that is homoge-neous over nearly the entire study area. This is intuitive,and agrees with prior figures in establishing the strongrelationship between NSD and TSF, but also furthers thenotion that the PC1NSD mode is similar to the NAO inbringing more snow to the region, excluding the mid-west.
As PC1TSF and PC1NSD both describe an NAO-like pattern, and possess nearly identical pressure pat-terns in the Atlantic Ocean, it is logical to believethe two are closely related. The correlation coeffi-cient between the two is 0.91, significantly greater thanthe straight station correlations of the two variables(Figure 4).
5.5. Number of snow days (NSD) PC2
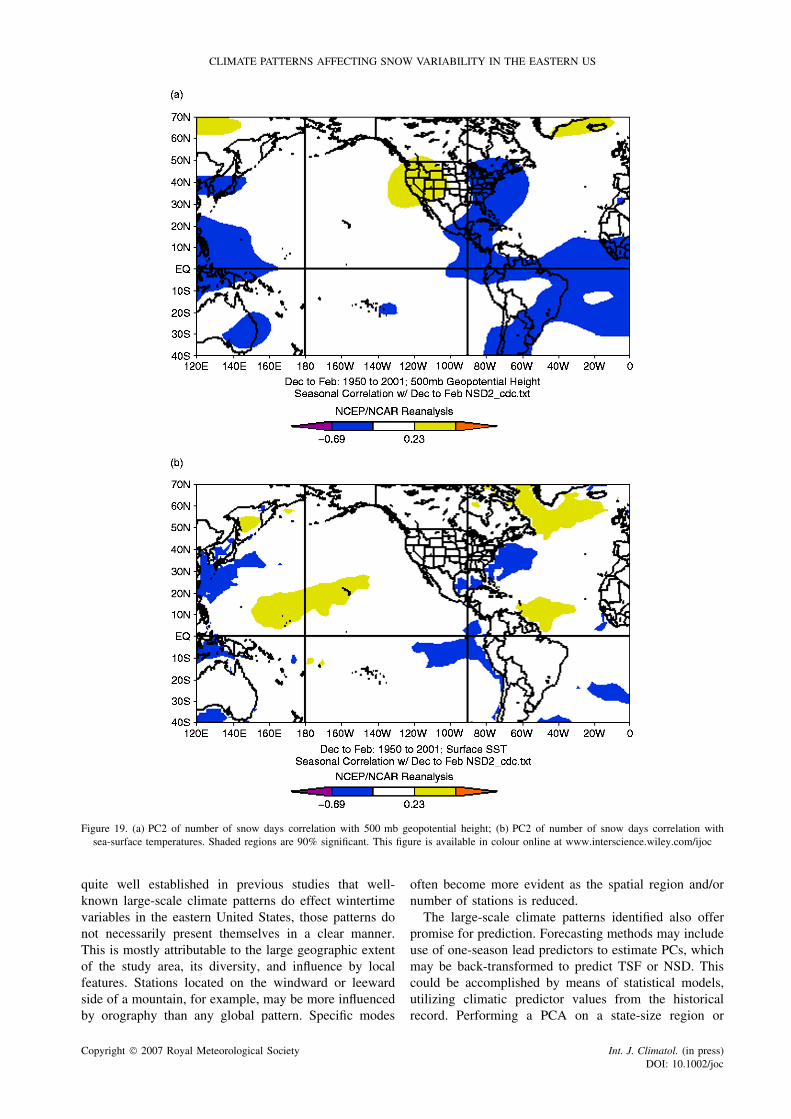
PC2NSD explains approximately 11% of the variance;Figure 18 shows the spatial loading of PC2NSD. A dipolepattern similar to the one in Figure 11 for EOF2TSF isapparent. A correlation map with 500 mb geopotentialheights, illustrated in Figure 19(a), specifies a patternmore likely to be associated with regional influences. Noknown large-scale patterns are identified, but a strongconfiguration is present. The geopotential correlationmap illustrates a strong anomalously low pressure zonethroughout the upper northeast U.S. and along the WestAtlantic coastal waters. A strong anomalously high pres-sure zone resides over the southwest U.S., centered onNevada. These two pressure systems abut in the middleof the study region, working in tandem to pull cold dryair from Canada and decrease snow in the Midwest. Thedividing line between systems approximates the divid-ing line between positive and negative correlations inFigure 18, and may be responsible for the differing signs.Much of the atmosphere between 30°N and 30 °S consistsof anomalously low pressure zones, which form a bandaround the globe, demonstrating some annular oscillationpatterns. This pattern is not a persistence of the previous
season’s pattern, although much of the low pressure bandis beginning to form. The sea-surface pattern correlationwith PC2NSD, presented in Figure 19(b), includes coolSSTs off the East Coast and into the central Atlantic,and warm SSTs south, from the northwest coast of SouthAmerica well into the Atlantic. This pattern persists andgrows in intensity and spatial realm from the fall into thewinter season for PC2NSD.
6. Summary and discussion
This study identifies large-scale climate patterns and theirinfluence on wintertime precipitation and temperaturevariables for the eastern United States. Associationswith well-known patterns, including the NAO, PNA,and ENSO, are interpreted based on a PCA on TSFand NSD. Broad physical mechanisms responsible forseasonal variability of snowfall are also explored.
Scale is a critical feature in interpretation of climaticinfluences on snow variables. Although it has been
Figure 18. Spatial loading of EOF2 of number of snow days.
Copyright 2007 Royal Meteorological Society Int. J. Climatol. (in press)DOI: 10.1002/joc
CLIMATE PATTERNS AFFECTING SNOW VARIABILITY IN THE EASTERN US
Figure 19. (a) PC2 of number of snow days correlation with 500 mb geopotential height; (b) PC2 of number of snow days correlation withsea-surface temperatures. Shaded regions are 90% significant. This figure is available in colour online at www.interscience.wiley.com/ijoc
quite well established in previous studies that well-known large-scale climate patterns do effect wintertimevariables in the eastern United States, those patterns donot necessarily present themselves in a clear manner.This is mostly attributable to the large geographic extentof the study area, its diversity, and influence by localfeatures. Stations located on the windward or leewardside of a mountain, for example, may be more influencedby orography than any global pattern. Specific modes
often become more evident as the spatial region and/ornumber of stations is reduced.
The large-scale climate patterns identified also offerpromise for prediction. Forecasting methods may includeuse of one-season lead predictors to estimate PCs, whichmay be back-transformed to predict TSF or NSD. Thiscould be accomplished by means of statistical models,utilizing climatic predictor values from the historicalrecord. Performing a PCA on a state-size region or
Copyright 2007 Royal Meteorological Society Int. J. Climatol. (in press)DOI: 10.1002/joc

J. MORIN ET AL.
smaller, and forecasting locally, in lieu of forecasting forthe entire eastern United States, may ultimately provemore valuable and accurate.
References
Barnston A, Livezey RE. 1987. Classification, seasonality andpersistence of low-frequency circulation patterns. Monthly WeatherReview 115: 1083–1126.
Bradbury JA, Keim BD, Wake CP. 2002. U.S. East Coast troughindices at 500-hPa and New England winter climate variability.Journal of Climate 15: 3509–3517.
Bradbury JA, Keim BD, Wake CP. 2003. The influence of regionalstorm tracking and Teleconnections on winter precipitation in thenortheastern United States. Annals of the Association of AmericanGeographers 93: 544–556.
Brown RD. 2000. Northern hemisphere snow cover variability andchange, 1915–17. Journal of Climate 13: 2339–2355.
Cayan DR. 1996. Interannual climate variability and snowpack in thewestern United States. Journal of Climate 9: 928–948.
Clark MP, Serreze MC, Robinson DA. 1999. Atmospheric controls onEurasian snow extent. International Journal of Climatology 198:27–40.
Groisman PY, Easterling DR. 1994. Variability and trends of totalprecipitation and snowfall over the United States and Canada.Journal of Climate 7: 184–205.
Hartley S. 1996. Atlantic sea surface temperatures and New Englandsnowfall. Hydrological Processes 10: 1553–1563.
Hartley S, Keables MJ. 1998. Synoptic associations of winter climateand snowfall variability in New England. Inernational Journal ofClimatology 18: 281–298.
Hartley S, Robinson DA. 1999. Atlantic sea surface temperatures andeastern United States climate, 1950–1992. In Eighth Conference onClimate Variations , Denver, CO, Amer. Meteor. Soc., 94–97.
Heidorn K. 1998. Lake Effect Snowfalls, http://www.islandnet.com/∼see/weather/elements/lkefsnw1.htm.
Hurrell JW. 1995a. Transient eddy forcing of the rotational flow duringnorthern winter. Journal of the Atmospheric Sciences 52: 2286–2301.
Hurrell JW. 1995b. Decadal trends in the North-Atlantic Oscillation:regional temperatures and precipitation. Science 269: 676–679.
Janowiak JE, Bell GD. 1999. Interannual differences in the distributionof daily wintertime temperature, precipitation, and snowfall in theU.S. In 17th Conference on Weather Analysis and Forecasting,Denver, CO, Amer. Meteor. Soc., 1–5.
Joyce T. 2002. One hundred plus years of wintertime climate variabilityin the eastern United States. Journal of Climate 15: 1076–1086.
Kushnir Y, Zuk M, Rajagopalan B. 1999. Inter-annual variability oftemperature spells in Northeastern U.S. 1951–1998. In EighthConference on Climate Variations , Denver, CO, Amer. Meteor. Soc.,6–9.
Leathers DJ, Yarnal B, Palecki MA. 1991. The Pacific/North Americanteleconnection pattern and United States climate, Part I: Regionaltemperature and precipitation associations. Journal of Climate 4:517–528.
Livezey RE. 1999. Putting together winter forecasts for U.Stemperature and precipitation–La Nina and long-term trends.Acclimations, Jan-Feb.
Livezey RE, Chen WY. 1982. Statistical field significance and itsdetermination by monte carlo Techniques. Monthly Weather Review111: 46–59.
Mantua NJ, Hare SR, Zhang Y, Wallace JM, Francis RC. 1997. APacific interdecadal climate oscillation with impacts on salmonproduction. Bulletin of the American Meteorological Society 78:1069–1079.
McCabe GJ, Dettinger MD. 2002. Primary modes and predictabilityof year-to-year snowpack variations in the western United Statesfrom teleconnections with Pacific Ocean climate. Journal ofHydrometerology 3: 13–25.
Niziol T, Snyder W, Waldstreicher J. 1995. Winter weather forecastingthroughout the Eastern United States. Part IV: Lake Effect Snow.Weather and Forecasting 10: 61–77.
Serreze MC, Clark MP, Frei A. 2001. Characteristics of large snowfallevents in the montane western United States as examined usingSnowpack Telemetry (SNOTEL) Data. Water Resources Research37: 675–678.
Serreze MC, Clark MP, McGinnis DL, Robinson DA. 1998. Charac-teristics of snowfall over the eastern half of the United States andrelationships with principal modes of low-frequency atmosphericvariability. American Meterology Society 11: 234–250.
Thompson DWJ, Wallace JM. 1998. The Artic Oscillation signaturein the wintertime geopotential height and temperature fields.Geophysical Research Letters 25: 1297–1300.
van Loon H, Rogers JC. 1978. Seesaw in winter temperature betweenGreenland and Northern Europe. 1. General description. MonthlyWeather Review 106: 296–310.
Walker GT, Bliss EW. 1932. World weather V. Memorial of the RoyalMeteorological Society 4: 53–84.
Wallace JM, Gutzler DS. 1981. Teleconnections in the geopotentialheight field during the Northern Hemisphere winter. MonthlyWeather Review 109: 784–812.
Copyright 2007 Royal Meteorological Society Int. J. Climatol. (in press)DOI: 10.1002/joc

![Algebraic graph statics - block.arch.ethz.ch · E-mailaddresses:vanmelet@ethz.ch(T.VanMele),pblock@ethz.ch(P.Block). visualfeedbackabouttherelationbetweenformandforcesinre-sponsetomanipulationsofthedrawingbytheuser[5–7].Ithas](https://img.pdfslide.us/doc/110x75/5b9fccbb09d3f2c2598b9139/algebraic-graph-statics-blockarchethzch-e-mailaddressesvanmeletethzchtvanmelepblockethzchpblock.jpg)