Embed Size (px)
Citation preview
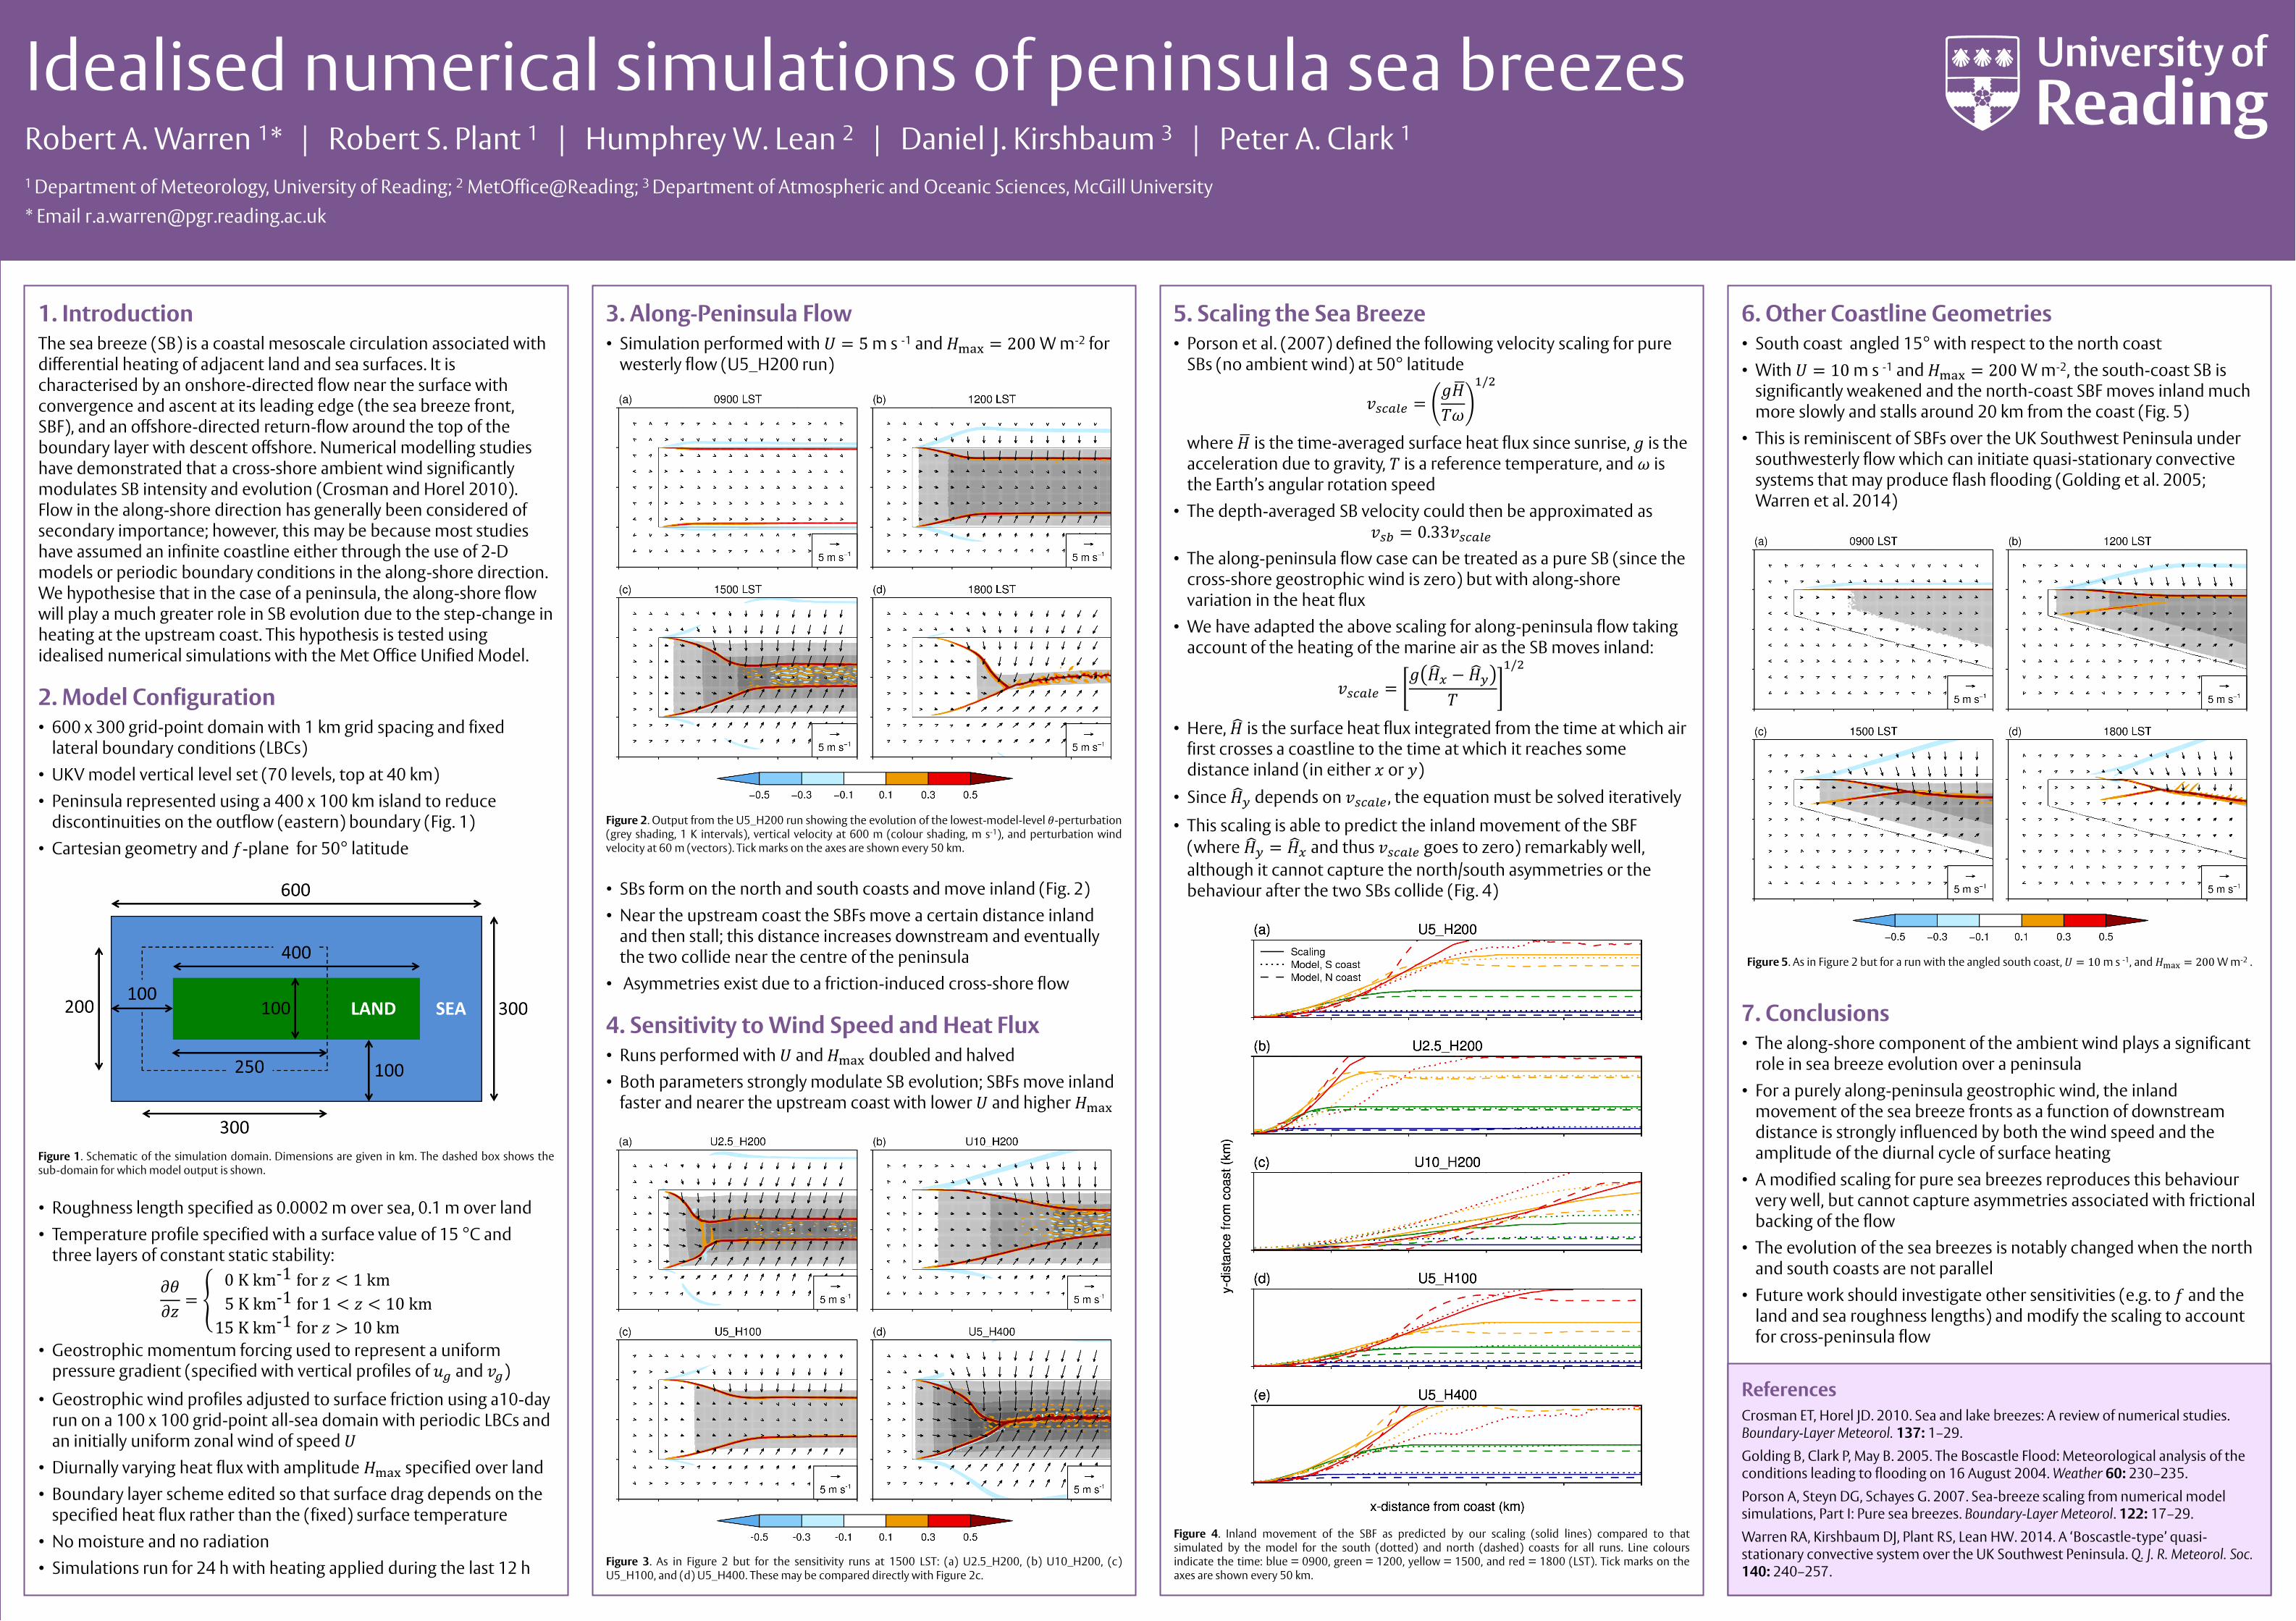
Robert A. Warren 1* | Robert S. Plant 1 | Humphrey W. Lean 2 | Daniel J. Kirshbaum 3 | Peter A. Clark 1 1 Department of Meteorology, University of Reading; 2 MetOffice@Reading; 3 Department of Atmospheric and Oceanic Sciences, McGill University
* Email [email protected]
Idealised numerical simulations of peninsula sea breezes
References
Crosman ET, Horel JD. 2010. Sea and lake breezes: A review of numerical studies. Boundary-Layer Meteorol. 137: 1–29.
Golding B, Clark P, May B. 2005. The Boscastle Flood: Meteorological analysis of the conditions leading to flooding on 16 August 2004. Weather 60: 230–235.
Porson A, Steyn DG, Schayes G. 2007. Sea-breeze scaling from numerical model simulations, Part I: Pure sea breezes. Boundary-Layer Meteorol. 122: 17–29.
Warren RA, Kirshbaum DJ, Plant RS, Lean HW. 2014. A ‘Boscastle-type’ quasi-stationary convective system over the UK Southwest Peninsula. Q. J. R. Meteorol. Soc. 140: 240–257.
1. Introduction The sea breeze (SB) is a coastal mesoscale circulation associated with differential heating of adjacent land and sea surfaces. It is characterised by an onshore-directed flow near the surface with convergence and ascent at its leading edge (the sea breeze front, SBF), and an offshore-directed return-flow around the top of the boundary layer with descent offshore. Numerical modelling studies have demonstrated that a cross-shore ambient wind significantly modulates SB intensity and evolution (Crosman and Horel 2010). Flow in the along-shore direction has generally been considered of secondary importance; however, this may be because most studies have assumed an infinite coastline either through the use of 2-D models or periodic boundary conditions in the along-shore direction. We hypothesise that in the case of a peninsula, the along-shore flow will play a much greater role in SB evolution due to the step-change in heating at the upstream coast. This hypothesis is tested using idealised numerical simulations with the Met Office Unified Model.
2. Model Configuration • 600 x 300 grid-point domain with 1 km grid spacing and fixed
lateral boundary conditions (LBCs)
• UKV model vertical level set (70 levels, top at 40 km)
• Peninsula represented using a 400 x 100 km island to reduce discontinuities on the outflow (eastern) boundary (Fig. 1)
• Cartesian geometry and 𝑓-plane for 50° latitude
Figure 1. Schematic of the simulation domain. Dimensions are given in km. The dashed box shows the sub-domain for which model output is shown.
• Roughness length specified as 0.0002 m over sea, 0.1 m over land
• Temperature profile specified with a surface value of 15 °C and three layers of constant static stability:
𝜕𝜃
𝜕𝑧=
0 K km-1 for 𝑧 < 1 km
5 K km-1 for 1 < 𝑧 < 10 km
15 K km-1 for 𝑧 > 10 km
• Geostrophic momentum forcing used to represent a uniform pressure gradient (specified with vertical profiles of 𝑢𝑔 and 𝑣𝑔)
• Geostrophic wind profiles adjusted to surface friction using a10-day run on a 100 x 100 grid-point all-sea domain with periodic LBCs and an initially uniform zonal wind of speed 𝑈
• Diurnally varying heat flux with amplitude 𝐻max specified over land
• Boundary layer scheme edited so that surface drag depends on the specified heat flux rather than the (fixed) surface temperature
• No moisture and no radiation
• Simulations run for 24 h with heating applied during the last 12 h
Figure 4. Inland movement of the SBF as predicted by our scaling (solid lines) compared to that simulated by the model for the south (dotted) and north (dashed) coasts for all runs. Line colours indicate the time: blue = 0900, green = 1200, yellow = 1500, and red = 1800 (LST). Tick marks on the axes are shown every 50 km.
3. Along-Peninsula Flow • Simulation performed with 𝑈 = 5 m s -1 and 𝐻max = 200 W m-2 for
westerly flow (U5_H200 run)
6. Other Coastline Geometries • South coast angled 15° with respect to the north coast
• With 𝑈 = 10 m s -1 and 𝐻max = 200 W m-2, the south-coast SB is significantly weakened and the north-coast SBF moves inland much more slowly and stalls around 20 km from the coast (Fig. 5)
• This is reminiscent of SBFs over the UK Southwest Peninsula under southwesterly flow which can initiate quasi-stationary convective systems that may produce flash flooding (Golding et al. 2005; Warren et al. 2014)
Figure 2. Output from the U5_H200 run showing the evolution of the lowest-model-level 𝜃-perturbation (grey shading, 1 K intervals), vertical velocity at 600 m (colour shading, m s-1), and perturbation wind velocity at 60 m (vectors). Tick marks on the axes are shown every 50 km.
• SBs form on the north and south coasts and move inland (Fig. 2)
• Near the upstream coast the SBFs move a certain distance inland and then stall; this distance increases downstream and eventually the two collide near the centre of the peninsula
• Asymmetries exist due to a friction-induced cross-shore flow
4. Sensitivity to Wind Speed and Heat Flux • Runs performed with 𝑈 and 𝐻max doubled and halved
• Both parameters strongly modulate SB evolution; SBFs move inland faster and nearer the upstream coast with lower 𝑈 and higher 𝐻max
Figure 3. As in Figure 2 but for the sensitivity runs at 1500 LST: (a) U2.5_H200, (b) U10_H200, (c) U5_H100, and (d) U5_H400. These may be compared directly with Figure 2c.
5. Scaling the Sea Breeze • Porson et al. (2007) defined the following velocity scaling for pure
SBs (no ambient wind) at 50° latitude
𝑣𝑠𝑐𝑎𝑙𝑒 =𝑔𝐻
𝑇𝜔
1/2
where 𝐻 is the time-averaged surface heat flux since sunrise, 𝑔 is the acceleration due to gravity, 𝑇 is a reference temperature, and 𝜔 is the Earth’s angular rotation speed
• The depth-averaged SB velocity could then be approximated as 𝑣𝑠𝑏 = 0.33𝑣𝑠𝑐𝑎𝑙𝑒
• The along-peninsula flow case can be treated as a pure SB (since the cross-shore geostrophic wind is zero) but with along-shore variation in the heat flux
• We have adapted the above scaling for along-peninsula flow taking account of the heating of the marine air as the SB moves inland:
𝑣𝑠𝑐𝑎𝑙𝑒 =𝑔 𝐻 𝑥 − 𝐻 𝑦
𝑇
1/2
• Here, 𝐻 is the surface heat flux integrated from the time at which air first crosses a coastline to the time at which it reaches some distance inland (in either 𝑥 or 𝑦)
• Since 𝐻 𝑦 depends on 𝑣𝑠𝑐𝑎𝑙𝑒, the equation must be solved iteratively
• This scaling is able to predict the inland movement of the SBF (where 𝐻 𝑦 = 𝐻 𝑥 and thus 𝑣𝑠𝑐𝑎𝑙𝑒 goes to zero) remarkably well,
although it cannot capture the north/south asymmetries or the behaviour after the two SBs collide (Fig. 4)
7. Conclusions • The along-shore component of the ambient wind plays a significant
role in sea breeze evolution over a peninsula
• For a purely along-peninsula geostrophic wind, the inland movement of the sea breeze fronts as a function of downstream distance is strongly influenced by both the wind speed and the amplitude of the diurnal cycle of surface heating
• A modified scaling for pure sea breezes reproduces this behaviour very well, but cannot capture asymmetries associated with frictional backing of the flow
• The evolution of the sea breezes is notably changed when the north and south coasts are not parallel
• Future work should investigate other sensitivities (e.g. to 𝑓 and the land and sea roughness lengths) and modify the scaling to account for cross-peninsula flow
Figure 5. As in Figure 2 but for a run with the angled south coast, 𝑈 = 10 m s -1, and 𝐻max = 200 W m-2 .