Embed Size (px)
Citation preview

IDEA CELLULAR LIMITED
INVESTOR PRESENTATION
Public
2
Disclaimer
This presentation does not constitute a prospectus, offering circular or offering memorandum or an offer, or a solicitation of any offer, to purchase or sell any securities.This presentation should not be considered as a recommendation that any investor should subscribe for, or purchase, any securities of Idea Cellular Limited or itssubsidiaries or joint venture (together, the “Company”) and should not be used as a basis for any investment decision.
The information contained in this presentation is only current as of its date and has not been independently verified. No express or implied representation or warranty ismade as to, and no reliance should be placed on, the accuracy, fairness or completeness of the information presented or contained in this presentation. Thispresentation contains certain currency exchange rates and the same have been provided only for the convenience of readers. No representation is made that theRupee amounts actually represent such USD amounts or could have been, or could be, converted into USD at the indicated rates.
None of the Company or any of its affiliates, advisers or representatives accepts any liability whatsoever for any loss howsoever arising from any information presentedor contained in this presentation. Please note that the past performance of the Company is not, and should not be considered as, indicative of future results.Furthermore, no person is authorized to give any information or make any representation which is not contained in, or is inconsistent with, this presentation. Any suchextraneous or inconsistent information or representation, if given or made, should not be relied upon as having been authorized by or on behalf of the Company.
The Company may alter, modify or otherwise change in any manner the contents of this presentation, without obligation to notify any person of such revision orchanges.
These materials are confidential, are being given solely for your information and for your use, and may not be copied, reproduced or redistributed to any other person inany manner. The distribution of this presentation in certain jurisdictions may be restricted by law. Accordingly, any persons in possession of this presentation shouldinform themselves about and observe any such restrictions.
This presentation contain certain statements of future expectations and other forward-looking statements, including those relating to our general business plans andstrategy, our future financial condition and growth prospects, and future developments in our sector and our competitive and regulatory environment. In addition tostatements which are forward looking by reason of context, the words ‘may’, ‘will’, ‘should’, ‘expects’, ‘plans’, ‘intends’, ‘anticipates’, ‘believes’, ‘estimates’, ‘predicts’,‘potential’ or ‘continue’ and similar expressions identify forward looking statements. All forward looking statements are subject to risks, uncertainties and assumptionsthat could cause actual results, performances or events to differ materially from the results contemplated by the relevant forward looking statement. The factors whichmay affect the results contemplated by the forward looking statements could include, amongst others, future changes or developments in (i) the Company’s business,(ii) the Company’s competitive environment, (iii) telecommunications technology and application, and (iv) political, economic, legal and social conditions in India.
The information contained herein does not constitute an offer of securities for sale in the United States or in any other jurisdiction. Securities may not be offered or soldin the United States absent registration or an exemption from registration under the U.S. Securities Act of 1933, as amended.
Public
3
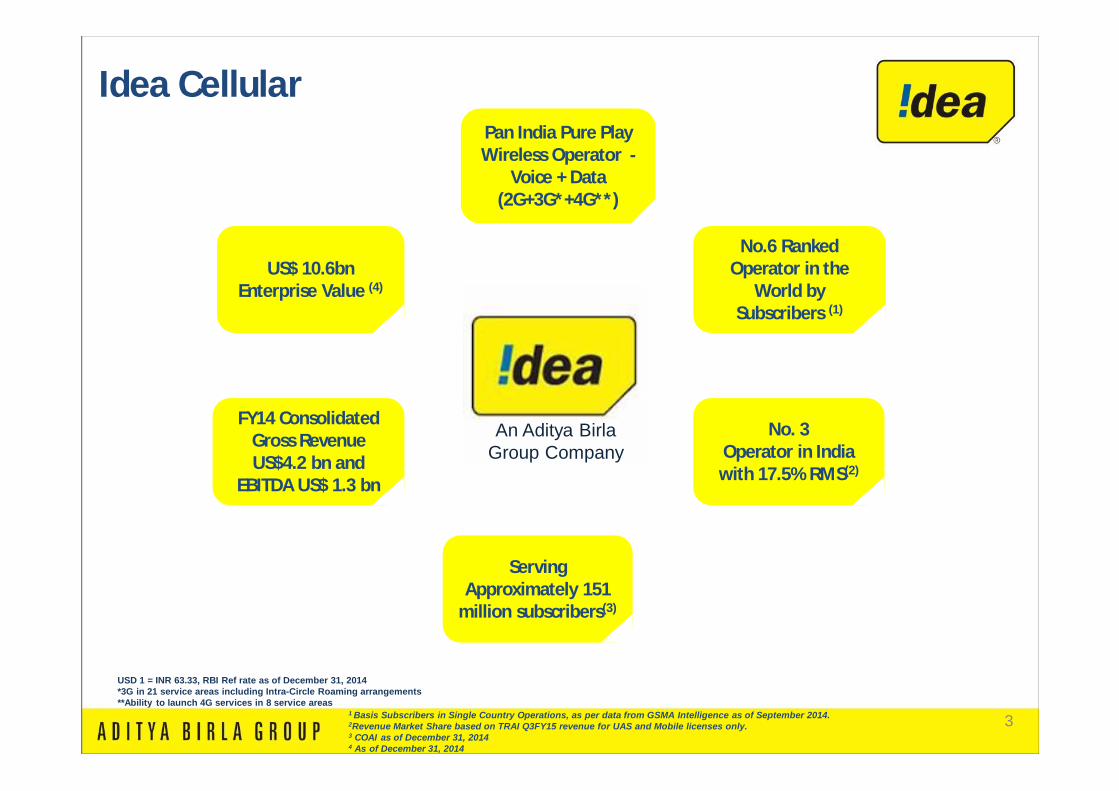
Serving Approximately 151
million subscribers(3)
Pan India Pure Play Wireless Operator -
Voice + Data (2G+3G*+4G**)
FY14 Consolidated Gross Revenue US$4.2 bn and
EBITDA US$ 1.3 bn
US$ 10.6bn Enterprise Value (4)
No.6 Ranked Operator in the
World by Subscribers (1)
No. 3Operator in India with 17.5% RMS(2)
An Aditya Birla Group Company
Idea Cellular
1 Basis Subscribers in Single Country Operations, as per data from GSMA Intelligence as of September 2014.2Revenue Market Share based on TRAI Q3FY15 revenue for UAS and Mobile licenses only.3 COAI as of December 31, 20144 As of December 31, 2014
USD 1 = INR 63.33, RBI Ref rate as of December 31, 2014*3G in 21 service areas including Intra-Circle Roaming arrangements**Ability to launch 4G services in 8 service areas
Public
4
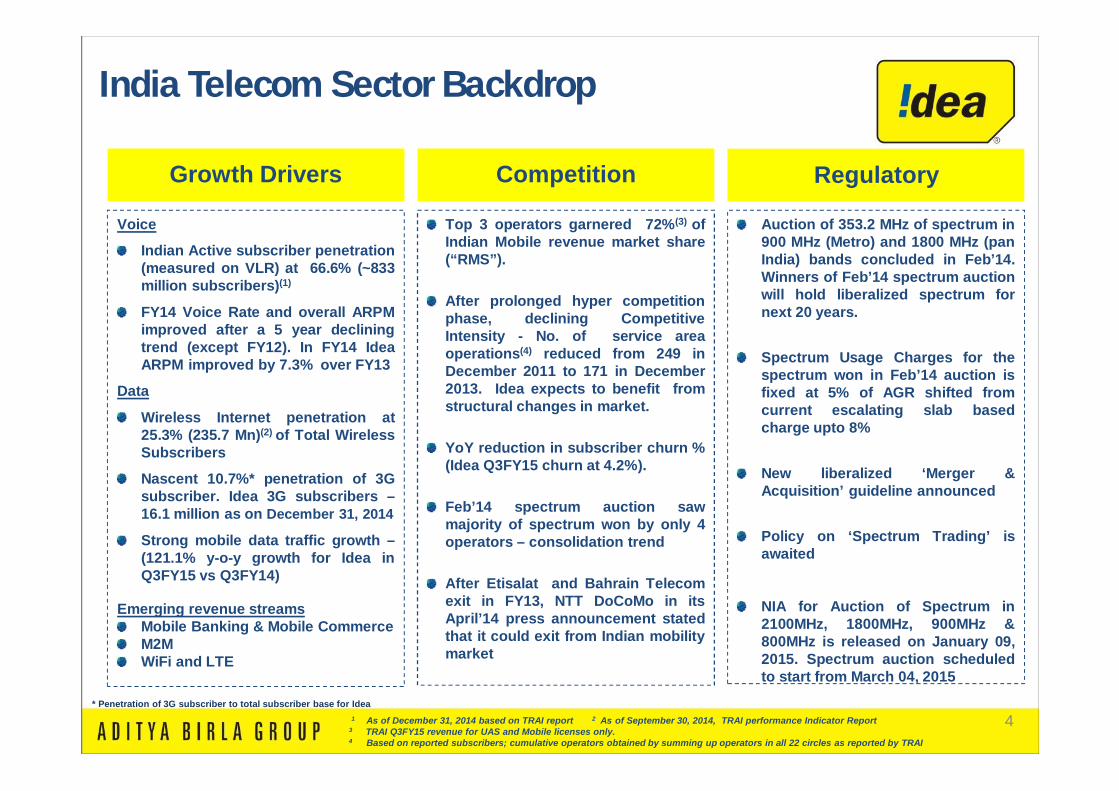
Growth Drivers Competition Regulatory
Voice
Indian Active subscriber penetration(measured on VLR) at 66.6% (~833million subscribers)(1)
FY14 Voice Rate and overall ARPMimproved after a 5 year decliningtrend (except FY12). In FY14 IdeaARPM improved by 7.3% over FY13
Data
Wireless Internet penetration at25.3% (235.7 Mn)(2) of Total WirelessSubscribers
Nascent 10.7%* penetration of 3Gsubscriber. Idea 3G subscribers –16.1 million as on December 31, 2014
Strong mobile data traffic growth –(121.1% y-o-y growth for Idea inQ3FY15 vs Q3FY14)
Emerging revenue streamsMobile Banking & Mobile CommerceM2MWiFi and LTE
Top 3 operators garnered 72%(3) ofIndian Mobile revenue market share(“RMS”).
After prolonged hyper competitionphase, declining CompetitiveIntensity - No. of service areaoperations(4) reduced from 249 inDecember 2011 to 171 in December2013. Idea expects to benefit fromstructural changes in market.
YoY reduction in subscriber churn %(Idea Q3FY15 churn at 4.2%).
Feb’14 spectrum auction sawmajority of spectrum won by only 4operators – consolidation trend
After Etisalat and Bahrain Telecomexit in FY13, NTT DoCoMo in itsApril’14 press announcement statedthat it could exit from Indian mobilitymarket
Auction of 353.2 MHz of spectrum in900 MHz (Metro) and 1800 MHz (panIndia) bands concluded in Feb’14.Winners of Feb’14 spectrum auctionwill hold liberalized spectrum fornext 20 years.
Spectrum Usage Charges for thespectrum won in Feb’14 auction isfixed at 5% of AGR shifted fromcurrent escalating slab basedcharge upto 8%
New liberalized ‘Merger &Acquisition’ guideline announced
Policy on ‘Spectrum Trading’ isawaited
NIA for Auction of Spectrum in2100MHz, 1800MHz, 900MHz &800MHz is released on January 09,2015. Spectrum auction scheduledto start from March 04, 2015
1 As of December 31, 2014 based on TRAI report 2 As of September 30, 2014, TRAI performance Indicator Report3 TRAI Q3FY15 revenue for UAS and Mobile licenses only.4 Based on reported subscribers; cumulative operators obtained by summing up operators in all 22 circles as reported by TRAI
* Penetration of 3G subscriber to total subscriber base for Idea
India Telecom Sector BackdropPublic
5
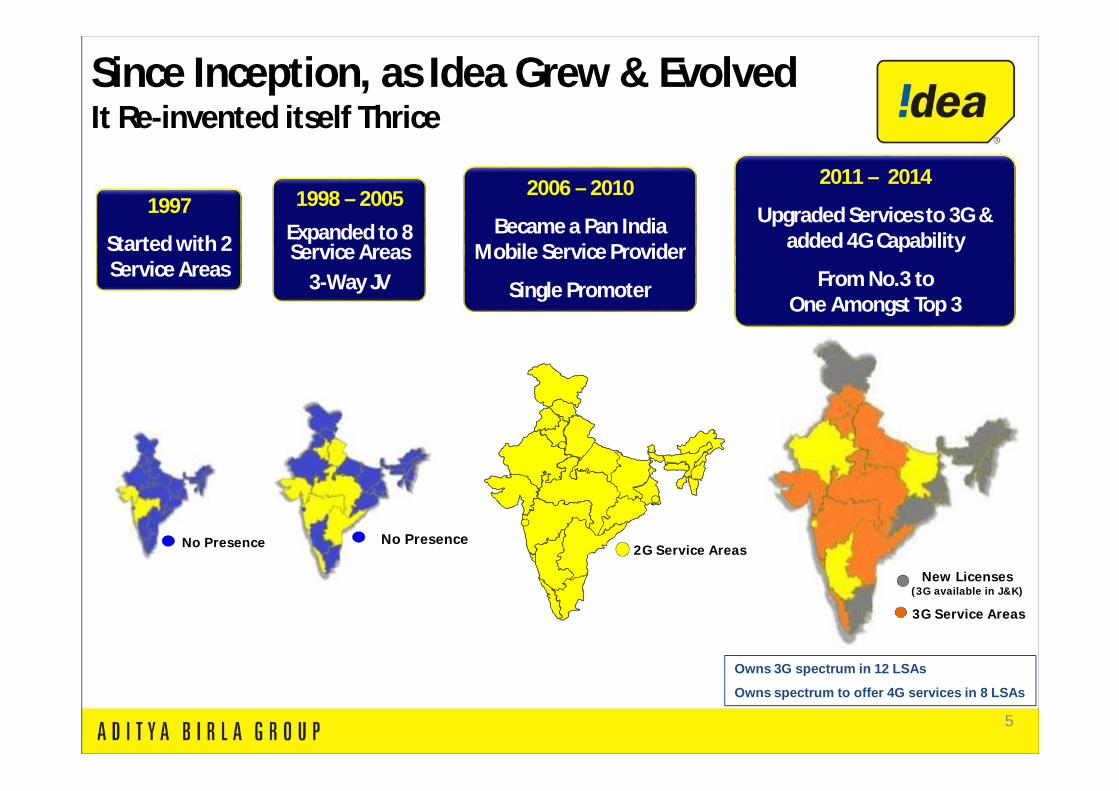
1997
Started with 2 Service Areas
1998 – 2005Expanded to 8 Service Areas
3-Way JV
2006 – 2010
Became a Pan India Mobile Service Provider
Single Promoter
2011 – 2014
Upgraded Services to 3G & added 4G Capability
From No.3 to One Amongst Top 3
No Presence2G Service Areas
3G Service Areas
New Licenses(3G available in J&K)
Since Inception, as Idea Grew & EvolvedIt Re-invented itself Thrice
Owns 3G spectrum in 12 LSAs
Owns spectrum to offer 4G services in 8 LSAs
Public
No Presence
6
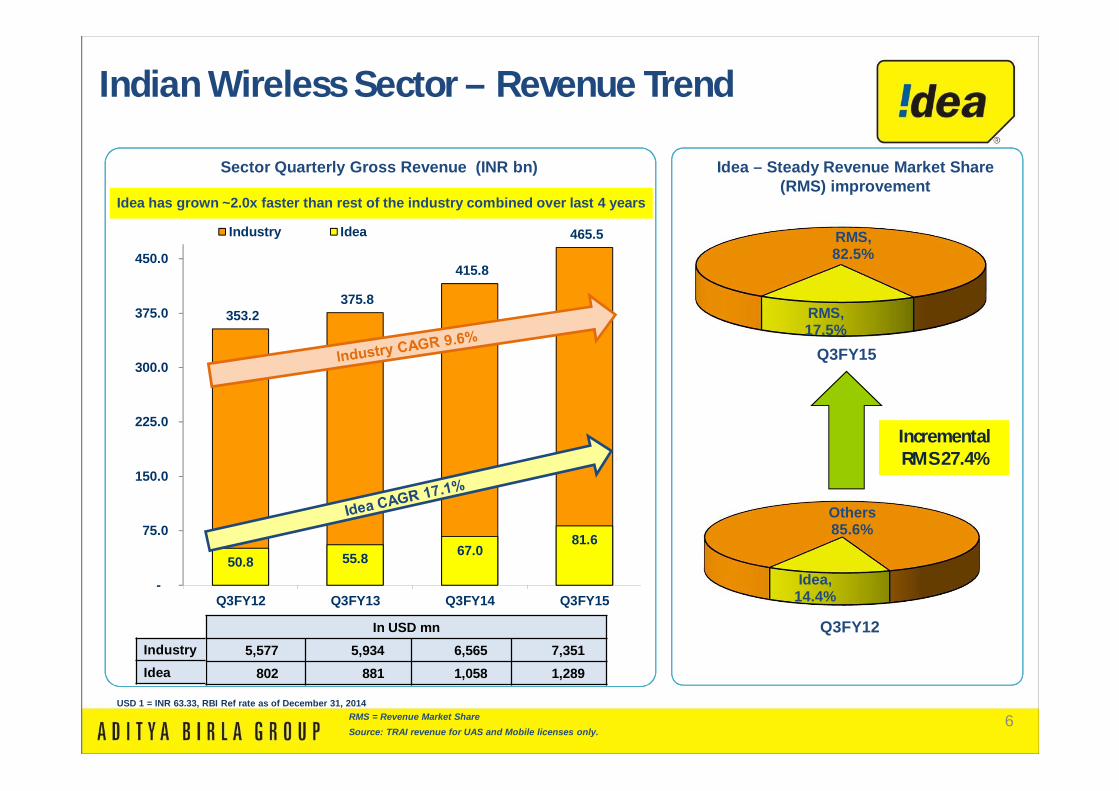
353.2 375.8
415.8
465.5
50.8 55.8 67.081.6
-
75.0
150.0
225.0
300.0
375.0
450.0
Q3FY12 Q3FY13 Q3FY14 Q3FY15
Industry Idea
Idea, 14.4%
Others85.6%
RMS = Revenue Market ShareSource: TRAI revenue for UAS and Mobile licenses only.
Indian Wireless Sector – Revenue Trend
Sector Quarterly Gross Revenue (INR bn) Idea – Steady Revenue Market Share (RMS) improvement
Incremental RMS 27.4%Incremental RMS 27.4%
RMS, 17.5%
RMS, 82.5%
Q3FY15
Q3FY12In USD mn5,577 5,934 6,565 7,351
802 881 1,058 1,289
IndustryIdea
USD 1 = INR 63.33, RBI Ref rate as of December 31, 2014
Idea has grown ~2.0x faster than rest of the industry combined over last 4 years
Public
7
65.4
83.3
105.3
120.2
137.9152.2
13.5%
14.5%
15.4%
16.6%
17.4%18.1%
13%
14%
15%
16%
17%
18%
25
55
85
115
145
Sep'10 Mar'11 Mar'12 Mar'13 Mar'14 Dec'14
Idea VLR Subs (mn) Idea (VLR) Subs Mkt Share
167
161 160
167
173
179
155
160
165
170
175
180
185
Sep'10 Mar'11 Mar'12 Mar'13 Mar'14 Dec'14
Idea ARPU (Rs.)
VLR = Visitor Location RegisterSource: TRAI
IDEA
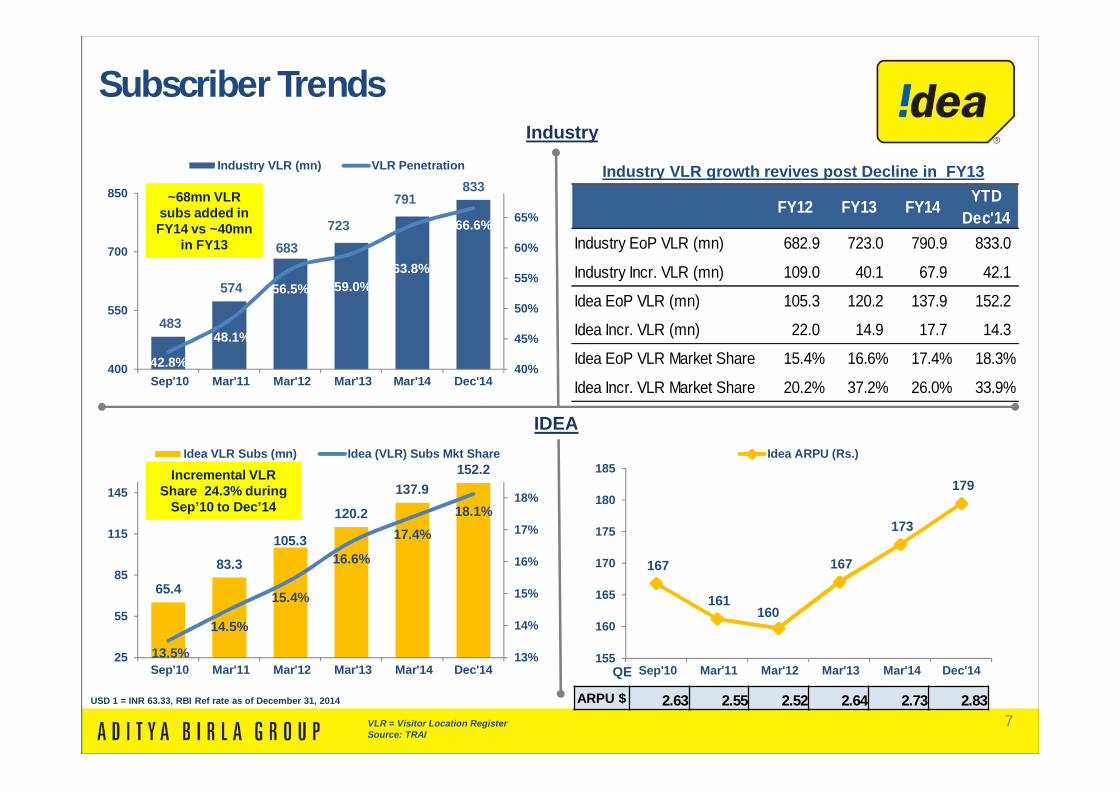
Subscriber Trends
483
574
683 723
791 833
42.8%
48.1%
56.5% 59.0%63.8%
66.6%
40%
45%
50%
55%
60%
65%
400
550
700
850
Sep'10 Mar'11 Mar'12 Mar'13 Mar'14 Dec'14
Industry VLR (mn) VLR Penetration
Incremental VLR Share 24.3% during
Sep’10 to Dec’14
Incremental VLR Share 24.3% during
Sep’10 to Dec’14
QE
~68mn VLR subs added in FY14 vs ~40mn
in FY13
~68mn VLR subs added in FY14 vs ~40mn
in FY13
Industry
Industry VLR growth revives post Decline in FY13
ARPU $ 2.63 2.55 2.52 2.64 2.73 2.83
Public
USD 1 = INR 63.33, RBI Ref rate as of December 31, 2014
FY12 FY13 FY14 YTD Dec'14
Industry EoP VLR (mn) 682.9 723.0 790.9 833.0
Industry Incr. VLR (mn) 109.0 40.1 67.9 42.1
Idea EoP VLR (mn) 105.3 120.2 137.9 152.2
Idea Incr. VLR (mn) 22.0 14.9 17.7 14.3
Idea EoP VLR Market Share 15.4% 16.6% 17.4% 18.3%
Idea Incr. VLR Market Share 20.2% 37.2% 26.0% 33.9%
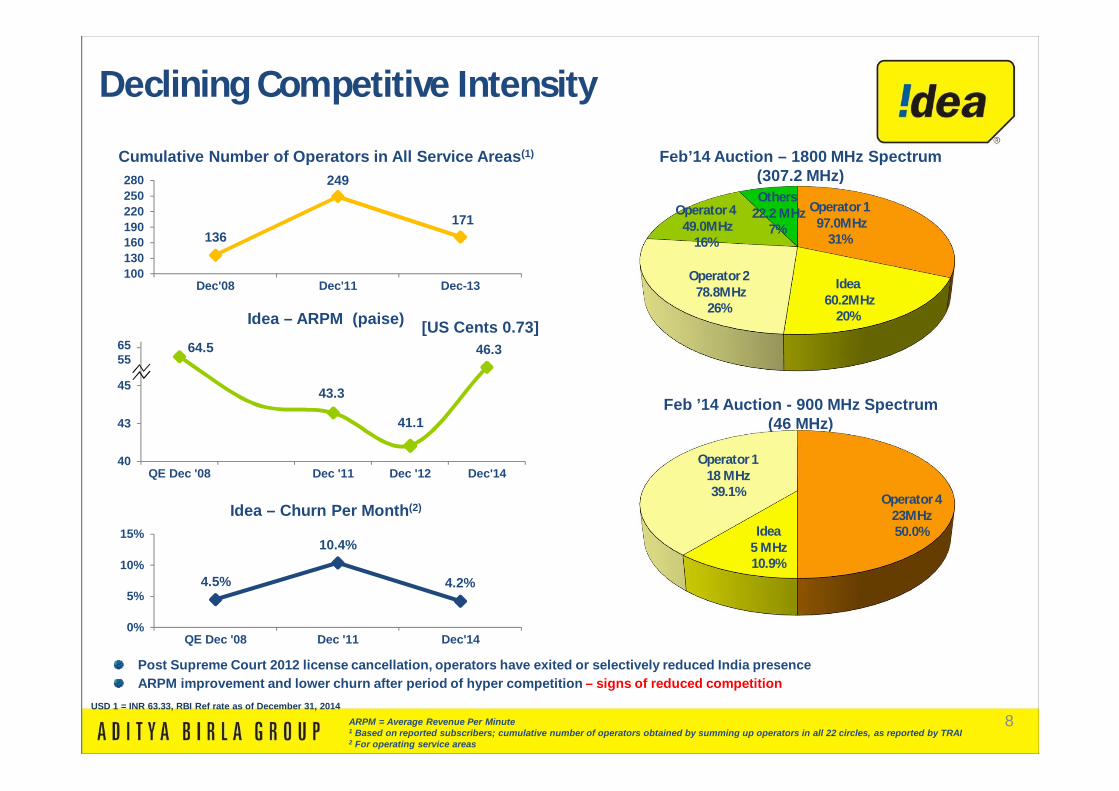
8ARPM = Average Revenue Per Minute1 Based on reported subscribers; cumulative number of operators obtained by summing up operators in all 22 circles, as reported by TRAI2 For operating service areas
Post Supreme Court 2012 license cancellation, operators have exited or selectively reduced India presenceARPM improvement and lower churn after period of hyper competition – signs of reduced competition
Declining Competitive Intensity
Feb’14 Auction – 1800 MHz Spectrum(307.2 MHz)
Feb ’14 Auction - 900 MHz Spectrum(46 MHz)
Cumulative Number of Operators in All Service Areas(1)
136
249
171
100130160190220250280
Dec'08 Dec'11 Dec-13
Idea – ARPM (paise)
Idea – Churn Per Month(2)
4.5%
10.4%
4.2%
0%
5%
10%
15%
QE Dec '08 Dec '11 Dec'14
64.5
43.3
41.1
46.3
40
43
45
48
QE Dec '08 Dec '11 Dec '12 Dec'14
6555
Operator 423MHz 50.0%Idea
5 MHz10.9%
Operator 1 18 MHz 39.1%
Operator 197.0MHz
31%
Idea60.2MHz
20%
Operator 278.8MHz
26%
Operator 449.0MHz
16%
Others22.2 MHz
7%
[US Cents 0.73]
Public
USD 1 = INR 63.33, RBI Ref rate as of December 31, 2014
91 Source: TRAI Q3FY15 revenue for UAS and Mobile licenses only.2 Providence Equity Partners, through its affiliates has invested INR 20,982mn in ABTL through Compulsorily Convertible Preference Shares, convertibleinto equity shares representing 30.3% of the total equity share capital of ABTL post conversion of these CCPS, which in turn reflects Providence EquityPartners’ beneficial equity interest in Indus Towers of 4.85% (assuming no other change in the equity share capital of Indus Towers)
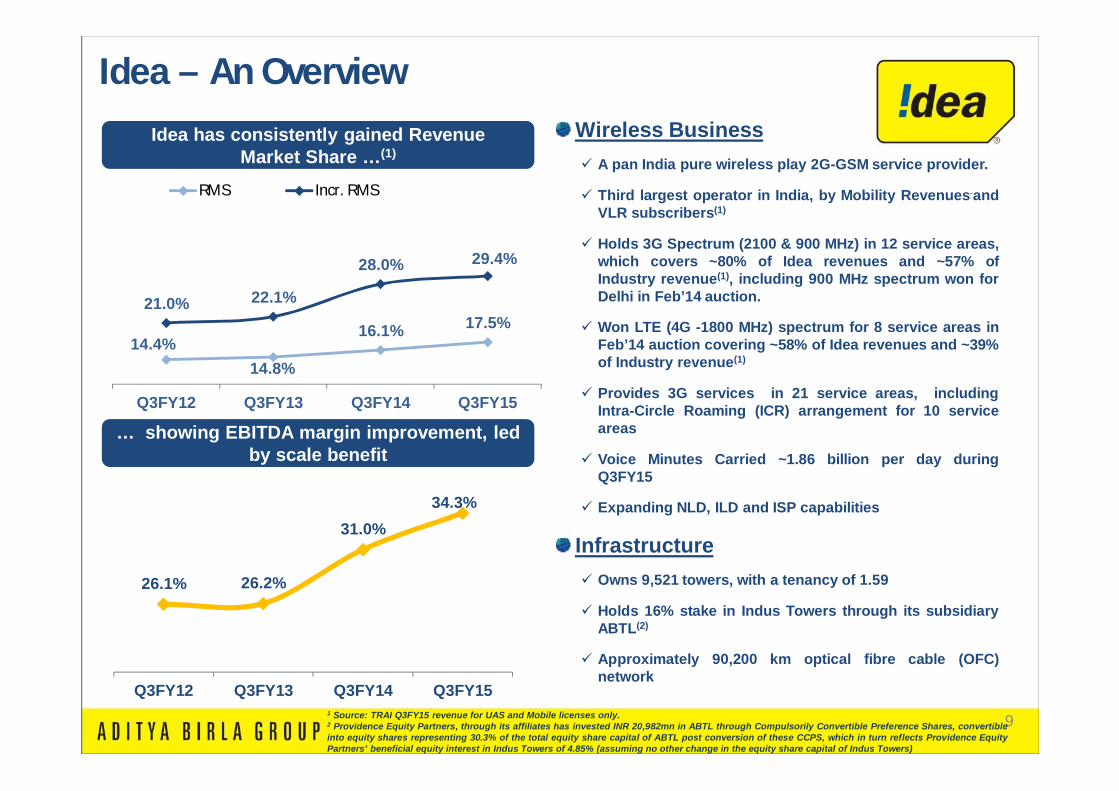
Idea has consistently gained Revenue Market Share …(1)
… showing EBITDA margin improvement, led by scale benefit
26.1% 26.2%
31.0%34.3%
Q3FY12 Q3FY13 Q3FY14 Q3FY15
Idea – An OverviewWireless Business A pan India pure wireless play 2G-GSM service provider.
Third largest operator in India, by Mobility Revenues andVLR subscribers(1)
Holds 3G Spectrum (2100 & 900 MHz) in 12 service areas,which covers ~80% of Idea revenues and ~57% ofIndustry revenue(1), including 900 MHz spectrum won forDelhi in Feb’14 auction.
Won LTE (4G -1800 MHz) spectrum for 8 service areas inFeb’14 auction covering ~58% of Idea revenues and ~39%of Industry revenue(1)
Provides 3G services in 21 service areas, includingIntra-Circle Roaming (ICR) arrangement for 10 serviceareas
Voice Minutes Carried ~1.86 billion per day duringQ3FY15
Expanding NLD, ILD and ISP capabilities
Infrastructure Owns 9,521 towers, with a tenancy of 1.59
Holds 16% stake in Indus Towers through its subsidiaryABTL(2)
Approximately 90,200 km optical fibre cable (OFC)network
14.4%14.8%
16.1% 17.5%21.0% 22.1%
28.0% 29.4%
Q3FY12 Q3FY13 Q3FY14 Q3FY15
RMS Incr. RMS
Public
10
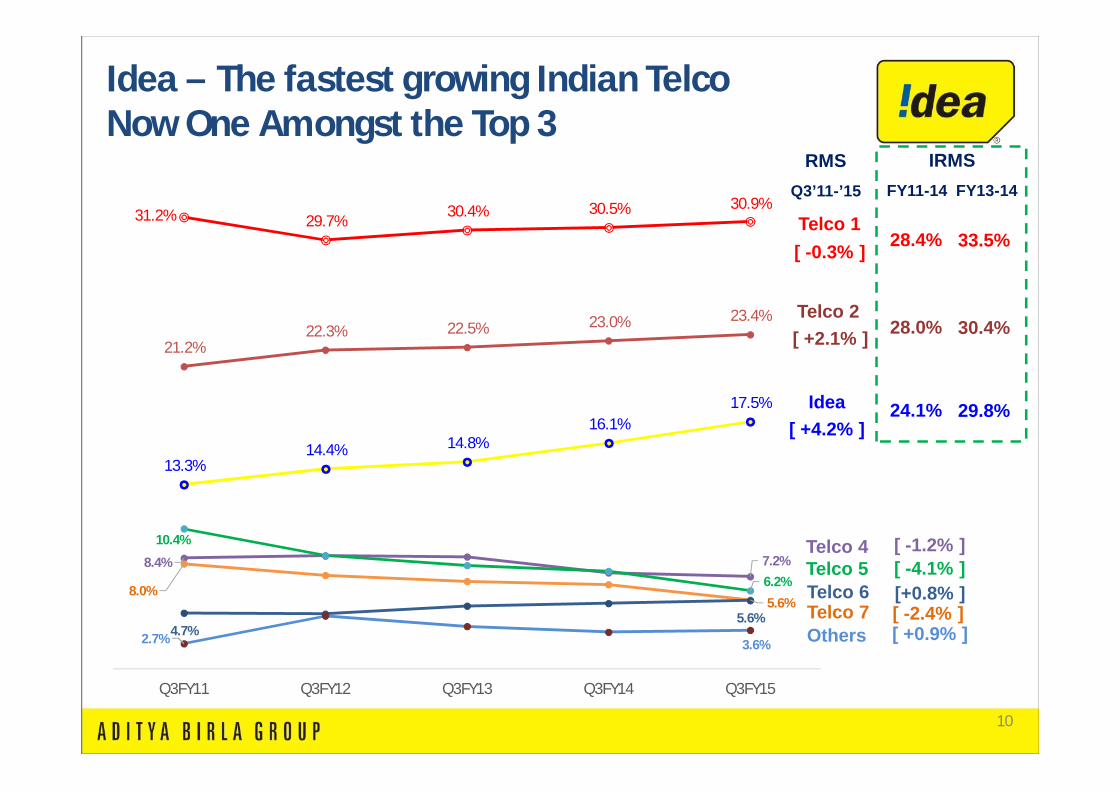
31.2% 29.7% 30.4% 30.5% 30.9%
21.2%22.3% 22.5% 23.0% 23.4%
13.3%14.4% 14.8%
16.1%17.5%
8.4% 7.2%10.4%
6.2%8.0%
5.6%
4.7%5.6%
2.7% 3.6%
Q3FY11 Q3FY12 Q3FY13 Q3FY14 Q3FY15
Idea – The fastest growing Indian TelcoNow One Amongst the Top 3
[ -2.4% ]
[ -1.2% ][ -4.1% ]
Idea
Telco 5Telco 4
Telco 7
28.4%
28.0%
24.1%
IRMSFY11-14 FY13-14
Others [ +0.9% ]
Telco 1
Telco 2
[ -0.3% ]
[ +2.1% ]
[ +4.2% ]
Telco 6 [+0.8% ]
RMSQ3’11-’15
33.5%
30.4%
29.8%
Public
11
# 2 Player # 3 Player# 1 Player# 4 Player # 5 Player
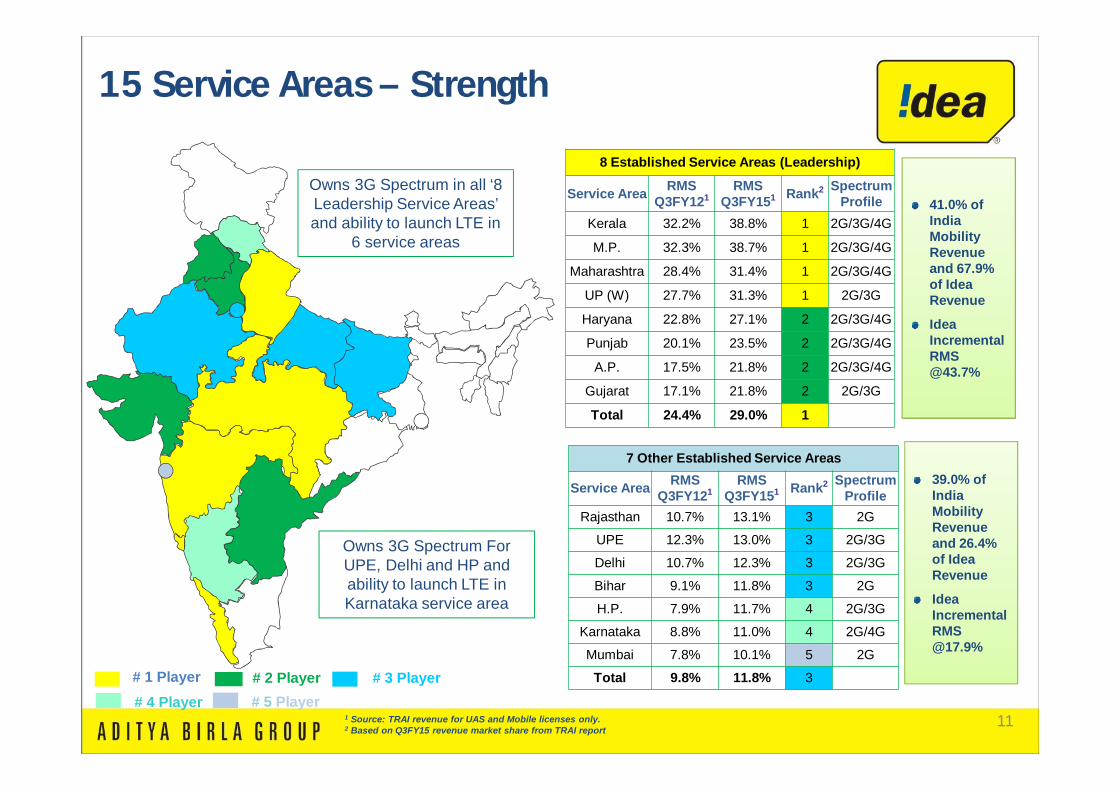
Owns 3G Spectrum in all ‘8 Leadership Service Areas’ and ability to launch LTE in
6 service areas
15 Service Areas – Strength
1 Source: TRAI revenue for UAS and Mobile licenses only.2 Based on Q3FY15 revenue market share from TRAI report
41.0% of India Mobility Revenue and 67.9% of Idea Revenue
Idea Incremental RMS @43.7%
39.0% of India Mobility Revenue and 26.4% of Idea Revenue
Idea Incremental RMS @17.9%
Owns 3G Spectrum For UPE, Delhi and HP and ability to launch LTE in Karnataka service area
Public
8 Established Service Areas (Leadership)
Service Area RMS Q3FY121
RMS Q3FY151 Rank2 Spectrum
ProfileKerala 32.2% 38.8% 1 2G/3G/4G
M.P. 32.3% 38.7% 1 2G/3G/4G
Maharashtra 28.4% 31.4% 1 2G/3G/4G
UP (W) 27.7% 31.3% 1 2G/3G
Haryana 22.8% 27.1% 2 2G/3G/4G
Punjab 20.1% 23.5% 2 2G/3G/4G
A.P. 17.5% 21.8% 2 2G/3G/4G
Gujarat 17.1% 21.8% 2 2G/3G
Total 24.4% 29.0% 1
7 Other Established Service Areas
Service Area RMS Q3FY121
RMS Q3FY151 Rank2 Spectrum
ProfileRajasthan 10.7% 13.1% 3 2G
UPE 12.3% 13.0% 3 2G/3G
Delhi 10.7% 12.3% 3 2G/3G
Bihar 9.1% 11.8% 3 2G
H.P. 7.9% 11.7% 4 2G/3G
Karnataka 8.8% 11.0% 4 2G/4G
Mumbai 7.8% 10.1% 5 2G
Total 9.8% 11.8% 3
12
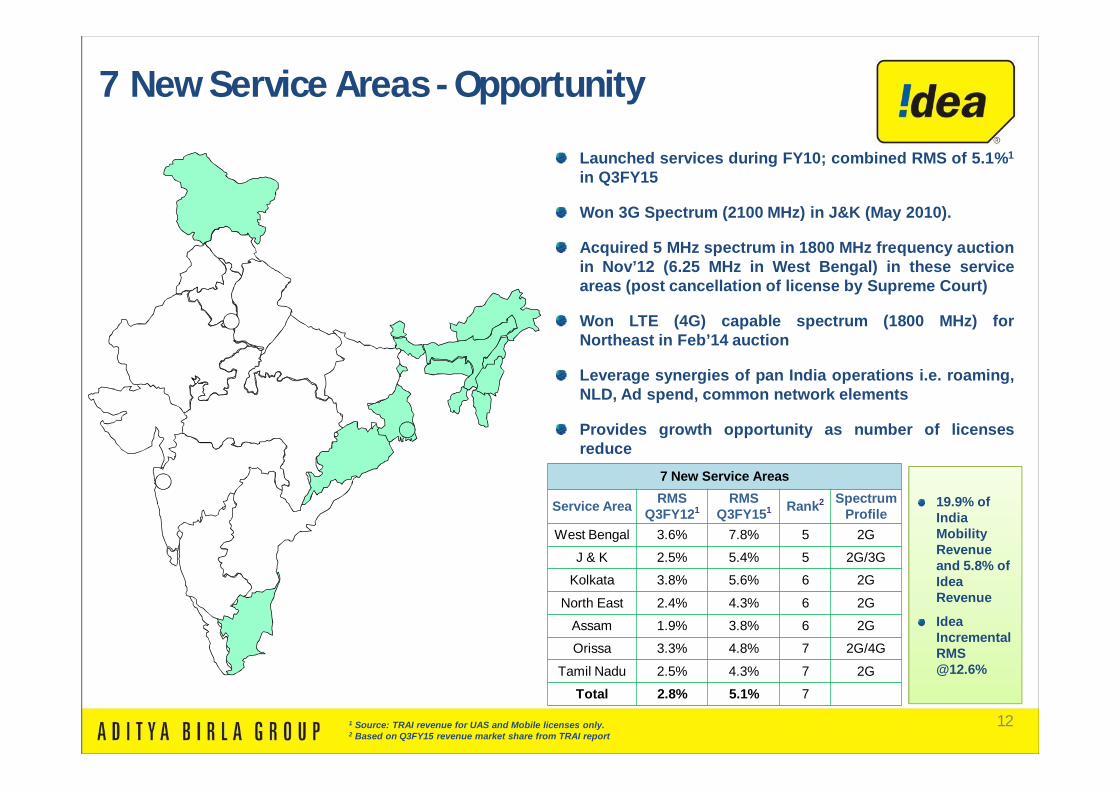
Launched services during FY10; combined RMS of 5.1%1
in Q3FY15
Won 3G Spectrum (2100 MHz) in J&K (May 2010).
Acquired 5 MHz spectrum in 1800 MHz frequency auctionin Nov’12 (6.25 MHz in West Bengal) in these serviceareas (post cancellation of license by Supreme Court)
Won LTE (4G) capable spectrum (1800 MHz) forNortheast in Feb’14 auction
Leverage synergies of pan India operations i.e. roaming,NLD, Ad spend, common network elements
Provides growth opportunity as number of licensesreduce
7 New Service Areas - Opportunity
1 Source: TRAI revenue for UAS and Mobile licenses only.2 Based on Q3FY15 revenue market share from TRAI report
19.9% of India Mobility Revenue and 5.8% of Idea Revenue
Idea Incremental RMS @12.6%
Public
7 New Service Areas
Service Area RMS Q3FY121
RMS Q3FY151 Rank2 Spectrum
ProfileWest Bengal 3.6% 7.8% 5 2G
J & K 2.5% 5.4% 5 2G/3G
Kolkata 3.8% 5.6% 6 2G
North East 2.4% 4.3% 6 2G
Assam 1.9% 3.8% 6 2G
Orissa 3.3% 4.8% 7 2G/4G
Tamil Nadu 2.5% 4.3% 7 2G
Total 2.8% 5.1% 7
13
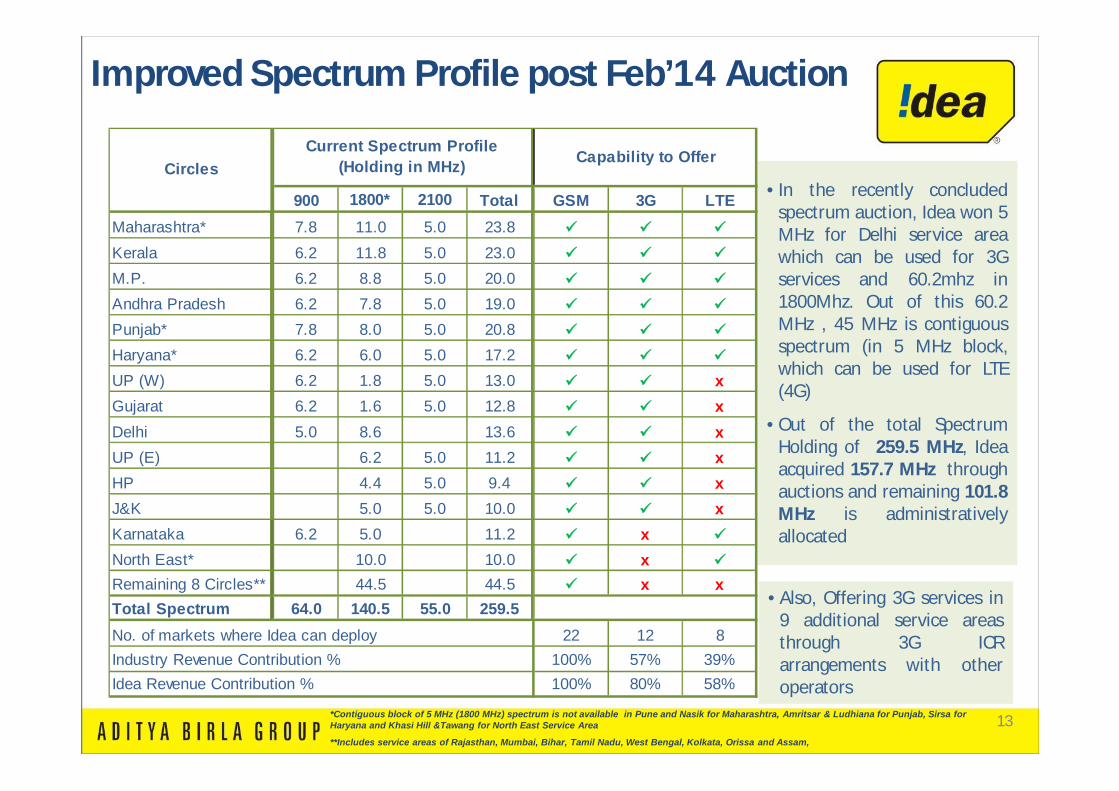
• In the recently concludedspectrum auction, Idea won 5MHz for Delhi service areawhich can be used for 3Gservices and 60.2mhz in1800Mhz. Out of this 60.2MHz , 45 MHz is contiguousspectrum (in 5 MHz block,which can be used for LTE(4G)
• Out of the total SpectrumHolding of 259.5 MHz, Ideaacquired 157.7 MHz throughauctions and remaining 101.8MHz is administrativelyallocated
Improved Spectrum Profile post Feb’14 Auction
*Contiguous block of 5 MHz (1800 MHz) spectrum is not available in Pune and Nasik for Maharashtra, Amritsar & Ludhiana for Punjab, Sirsa for Haryana and Khasi Hill &Tawang for North East Service Area
**Includes service areas of Rajasthan, Mumbai, Bihar, Tamil Nadu, West Bengal, Kolkata, Orissa and Assam,
• Also, Offering 3G services in9 additional service areasthrough 3G ICRarrangements with otheroperators
900 1800* 2100 Total ` GSM 3G LTEMaharashtra* 7.8 11.0 5.0 23.8
Kerala 6.2 11.8 5.0 23.0
M.P. 6.2 8.8 5.0 20.0
Andhra Pradesh 6.2 7.8 5.0 19.0
Punjab* 7.8 8.0 5.0 20.8
Haryana* 6.2 6.0 5.0 17.2
UP (W) 6.2 1.8 5.0 13.0 xGujarat 6.2 1.6 5.0 12.8 xDelhi 5.0 8.6 13.6 xUP (E) 6.2 5.0 11.2 xHP 4.4 5.0 9.4 xJ&K 5.0 5.0 10.0 xKarnataka 6.2 5.0 11.2 x
North East* 10.0 10.0 x
Remaining 8 Circles** 44.5 44.5 x xTotal Spectrum 64.0 140.5 55.0 259.5
22 12 8100% 57% 39%100% 80% 58%
No. of markets where Idea can deployIndustry Revenue Contribution %
Current Spectrum Profile(Holding in MHz)
Idea Revenue Contribution %
CirclesCapability to Offer
Public
14
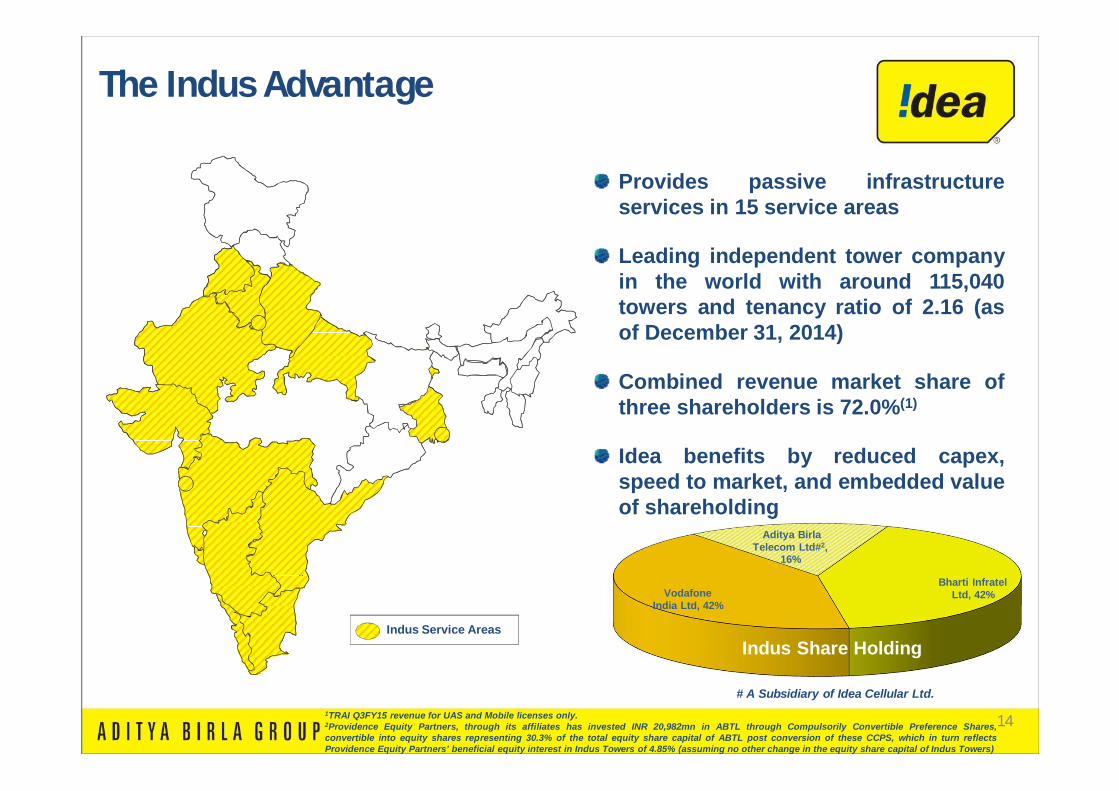
Provides passive infrastructureservices in 15 service areas
Leading independent tower companyin the world with around 115,040towers and tenancy ratio of 2.16 (asof December 31, 2014)
Combined revenue market share ofthree shareholders is 72.0%(1)
Idea benefits by reduced capex,speed to market, and embedded valueof shareholding
Indus Service Areas
Bharti Infratel Ltd, 42%Vodafone
India Ltd, 42%
Aditya Birla Telecom Ltd#2,
16%
Indus Share Holding
# A Subsidiary of Idea Cellular Ltd.
The Indus Advantage
1TRAI Q3FY15 revenue for UAS and Mobile licenses only.2Providence Equity Partners, through its affiliates has invested INR 20,982mn in ABTL through Compulsorily Convertible Preference Shares,convertible into equity shares representing 30.3% of the total equity share capital of ABTL post conversion of these CCPS, which in turn reflectsProvidence Equity Partners’ beneficial equity interest in Indus Towers of 4.85% (assuming no other change in the equity share capital of Indus Towers)
Public
15
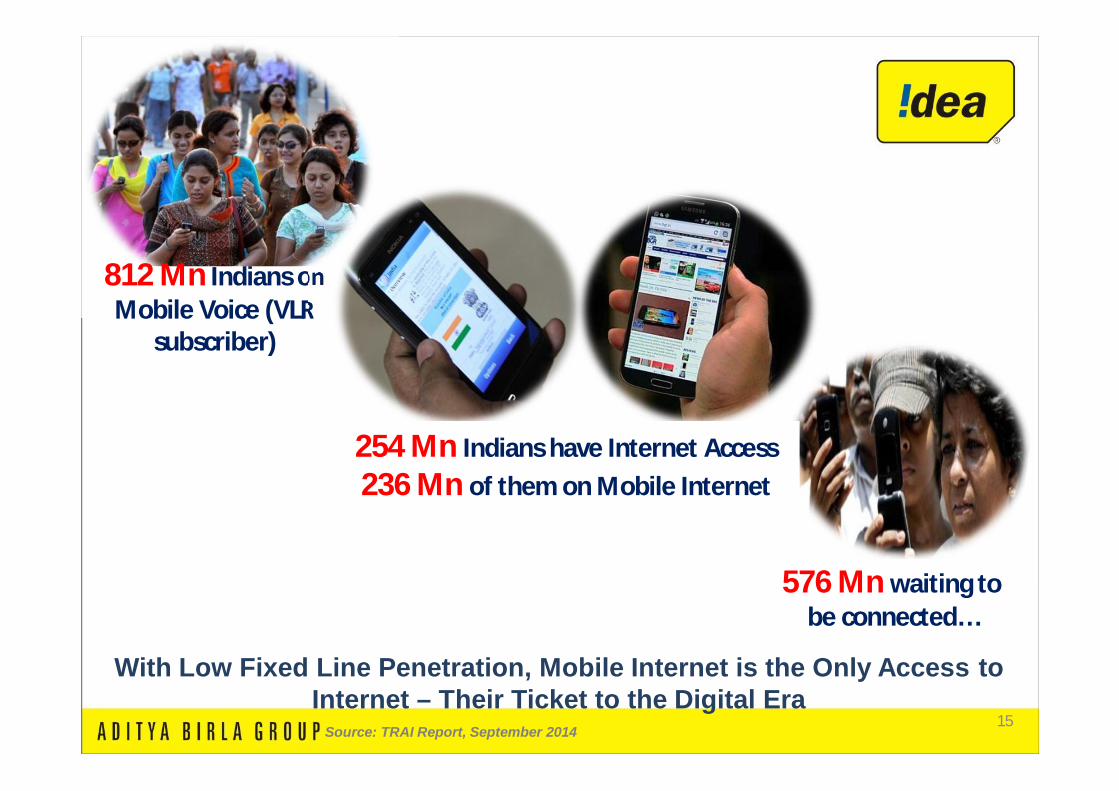
With Low Fixed Line Penetration, Mobile Internet is the Only Access to Internet – Their Ticket to the Digital Era
812 Mn Indians on Mobile Voice (VLR
subscriber)
254 Mn Indians have Internet Access236 Mn of them on Mobile Internet
576 Mn waiting to be connected…
Source: TRAI Report, September 2014
Public
16
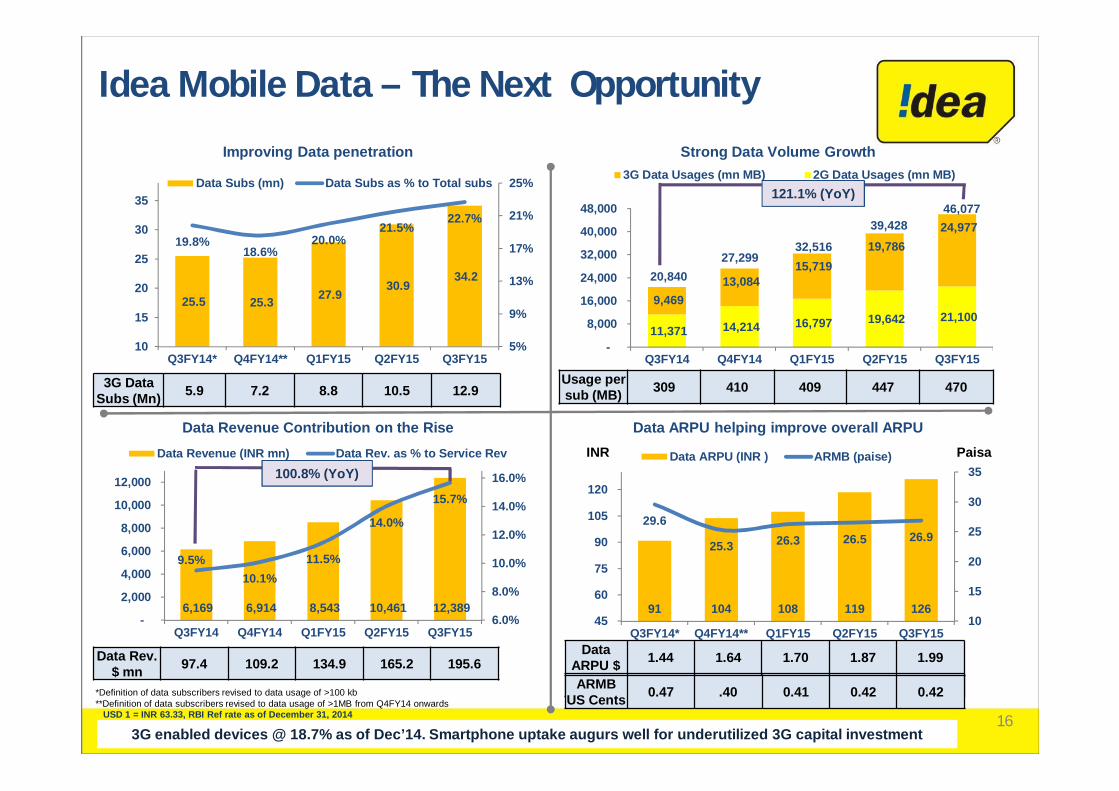
6,169 6,914 8,543 10,461 12,389
9.5%10.1%
11.5%
14.0%
15.7%
6.0%
8.0%
10.0%
12.0%
14.0%
16.0%
-
2,000
4,000
6,000
8,000
10,000
12,000
Q3FY14 Q4FY14 Q1FY15 Q2FY15 Q3FY15
Data Revenue (INR mn) Data Rev. as % to Service Rev
11,371 14,214 16,797 19,642 21,100 9,469
13,084 15,719
19,786 24,977
20,840 27,299
32,516
39,428 46,077
-
8,000
16,000
24,000
32,000
40,000
48,000
Q3FY14 Q4FY14 Q1FY15 Q2FY15 Q3FY15
3G Data Usages (mn MB) 2G Data Usages (mn MB)
25.5 25.3 27.9 30.9
34.2
19.8%18.6%
20.0%21.5%
22.7%
5%
9%
13%
17%
21%
25%
10
15
20
25
30
35
Q3FY14* Q4FY14** Q1FY15 Q2FY15 Q3FY15
Data Subs (mn) Data Subs as % to Total subs
91 104 108 119 126
29.6
25.3 26.3 26.5 26.9
10
15
20
25
30
35
45
60
75
90
105
120
Q3FY14* Q4FY14** Q1FY15 Q2FY15 Q3FY15
Data ARPU (INR ) ARMB (paise)
3G enabled devices @ 18.7% as of Dec’14. Smartphone uptake augurs well for underutilized 3G capital investment
Improving Data penetration Strong Data Volume Growth
Data Revenue Contribution on the Rise Data ARPU helping improve overall ARPU
121.1% (YoY)
100.8% (YoY)
Idea Mobile Data – The Next Opportunity
INR Paisa
*Definition of data subscribers revised to data usage of >100 kb**Definition of data subscribers revised to data usage of >1MB from Q4FY14 onwards
Usage per sub (MB) 309 410 409 447 4703G Data
Subs (Mn) 5.9 7.2 8.8 10.5 12.9
Data Rev.$ mn 97.4 109.2 134.9 165.2 195.6
DataARPU $ 1.44 1.64 1.70 1.87 1.99
ARMB US Cents 0.47 .40 0.41 0.42 0.42
Public
USD 1 = INR 63.33, RBI Ref rate as of December 31, 2014
17
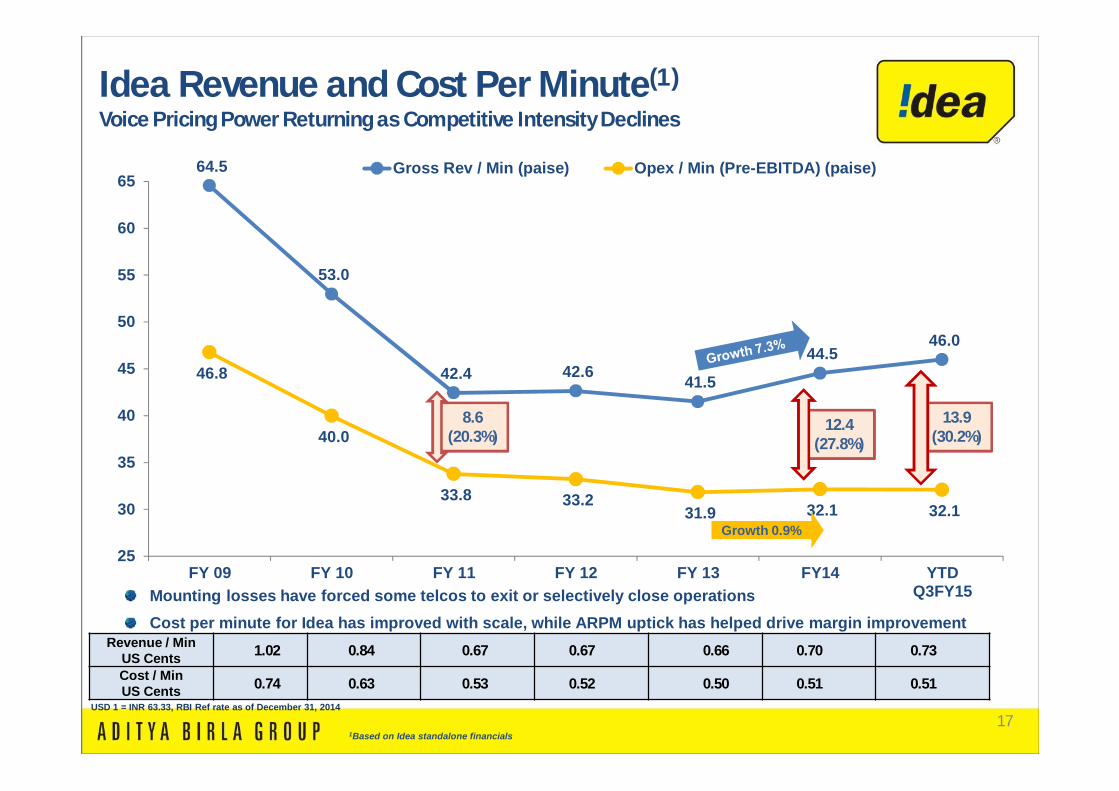
64.5
53.0
42.4 42.6 41.5
44.5 46.0
46.8
40.0
33.8 33.2 31.9 32.1 32.1
25
30
35
40
45
50
55
60
65
FY 09 FY 10 FY 11 FY 12 FY 13 FY14 YTDQ3FY15
Gross Rev / Min (paise) Opex / Min (Pre-EBITDA) (paise)
8.6 (20.3%)
12.4 (27.8%)
Growth 0.9%
13.9 (30.2%)
Mounting losses have forced some telcos to exit or selectively close operationsCost per minute for Idea has improved with scale, while ARPM uptick has helped drive margin improvement
Idea Revenue and Cost Per Minute(1)
Voice Pricing Power Returning as Competitive Intensity Declines
1Based on Idea standalone financials
Revenue / Min US Cents 1.02 0.84 0.67 0.67 0.66 0.70 0.73
Cost / Min US Cents 0.74 0.63 0.53 0.52 0.50 0.51 0.51
Public
USD 1 = INR 63.33, RBI Ref rate as of December 31, 2014
18
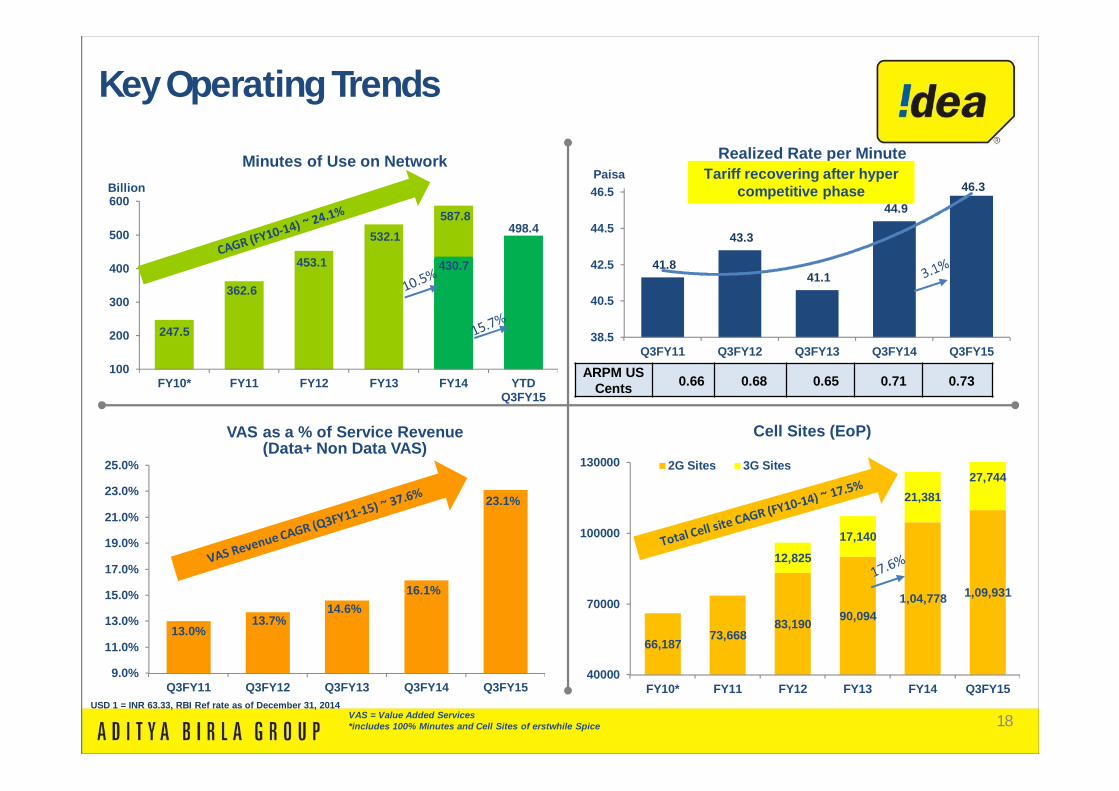
41.8
43.3
41.1
44.9
46.3
38.5
40.5
42.5
44.5
46.5
Q3FY11 Q3FY12 Q3FY13 Q3FY14 Q3FY15247.5
362.6
453.1
532.1587.8
498.4
430.7
100
200
300
400
500
600
FY10* FY11 FY12 FY13 FY14 YTDQ3FY15
VAS as a % of Service Revenue (Data+ Non Data VAS)
Realized Rate per MinutePaisa
Billion
Cell Sites (EoP)
66,18773,668
83,190 90,0941,04,778 1,09,931
12,825
17,140
21,38127,744
40000
70000
100000
130000
FY10* FY11 FY12 FY13 FY14 Q3FY15
2G Sites 3G Sites
13.0%13.7%
14.6%16.1%
23.1%
9.0%
11.0%
13.0%
15.0%
17.0%
19.0%
21.0%
23.0%
25.0%
Q3FY11 Q3FY12 Q3FY13 Q3FY14 Q3FY15
VAS = Value Added Services*includes 100% Minutes and Cell Sites of erstwhile Spice
Tariff recovering after hyper competitive phase
Key Operating Trends
Minutes of Use on Network
ARPM US Cents 0.66 0.68 0.65 0.71 0.73
Public
USD 1 = INR 63.33, RBI Ref rate as of December 31, 2014
19
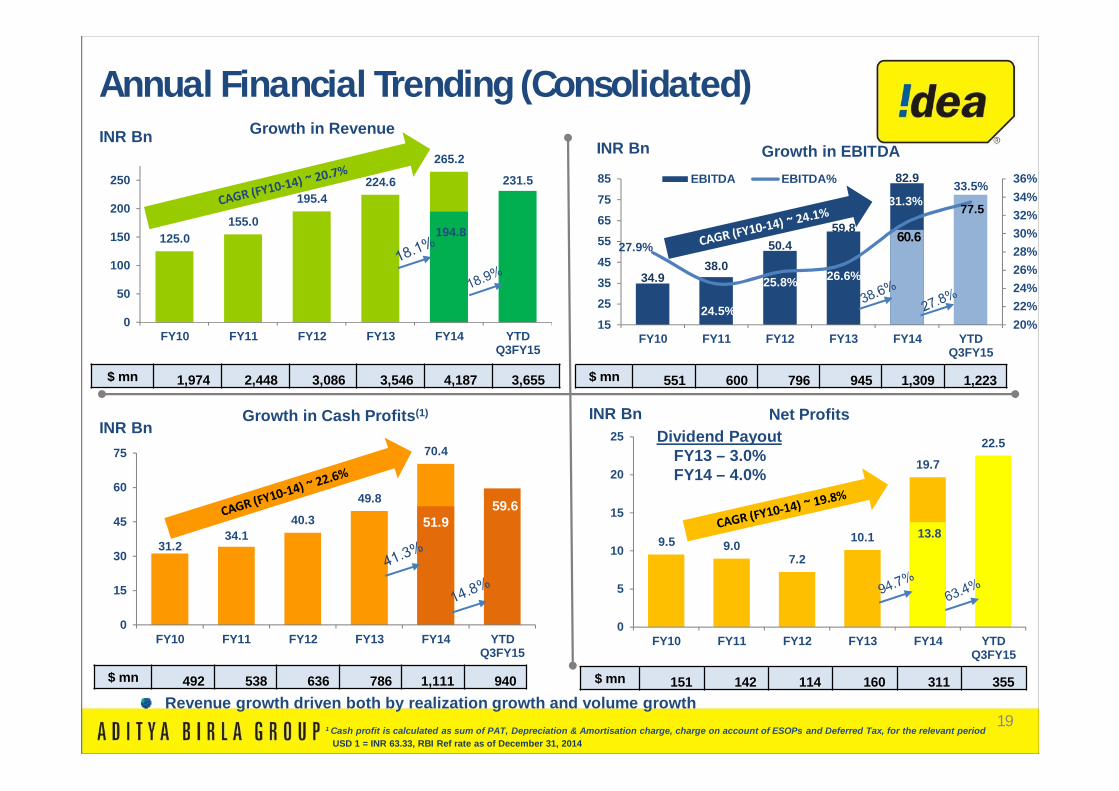
125.0 155.0
195.4 224.6
265.2
231.5
194.8
0
50
100
150
200
250
FY10 FY11 FY12 FY13 FY14 YTDQ3FY15
31.2 34.1
40.3
49.8
70.4
59.6 51.9
0
15
30
45
60
75
FY10 FY11 FY12 FY13 FY14 YTDQ3FY15
9.5 9.0 7.2
10.1
19.7
22.5
13.8
0
5
10
15
20
25
FY10 FY11 FY12 FY13 FY14 YTDQ3FY15
Growth in Revenue
34.938.0
50.459.8
82.9
77.5
60.627.9%
24.5%
25.8% 26.6%
31.3%33.5%
20%22%24%26%28%30%32%34%36%
1525354555657585
FY10 FY11 FY12 FY13 FY14 YTDQ3FY15
EBITDA EBITDA%
Growth in EBITDA
Net ProfitsGrowth in Cash Profits(1)
INR Bn
Annual Financial Trending (Consolidated)
1 Cash profit is calculated as sum of PAT, Depreciation & Amortisation charge, charge on account of ESOPs and Deferred Tax, for the relevant period
Revenue growth driven both by realization growth and volume growth
$ mn 1,974 2,448 3,086 3,546 4,187 3,655 $ mn 551 600 796 945 1,309 1,223
$ mn 151 142 114 160 311 355 $ mn 492 538 636 786 1,111 940
Dividend PayoutFY13 – 3.0%FY14 – 4.0%
INR Bn
INR BnINR Bn
Public
USD 1 = INR 63.33, RBI Ref rate as of December 31, 2014
20
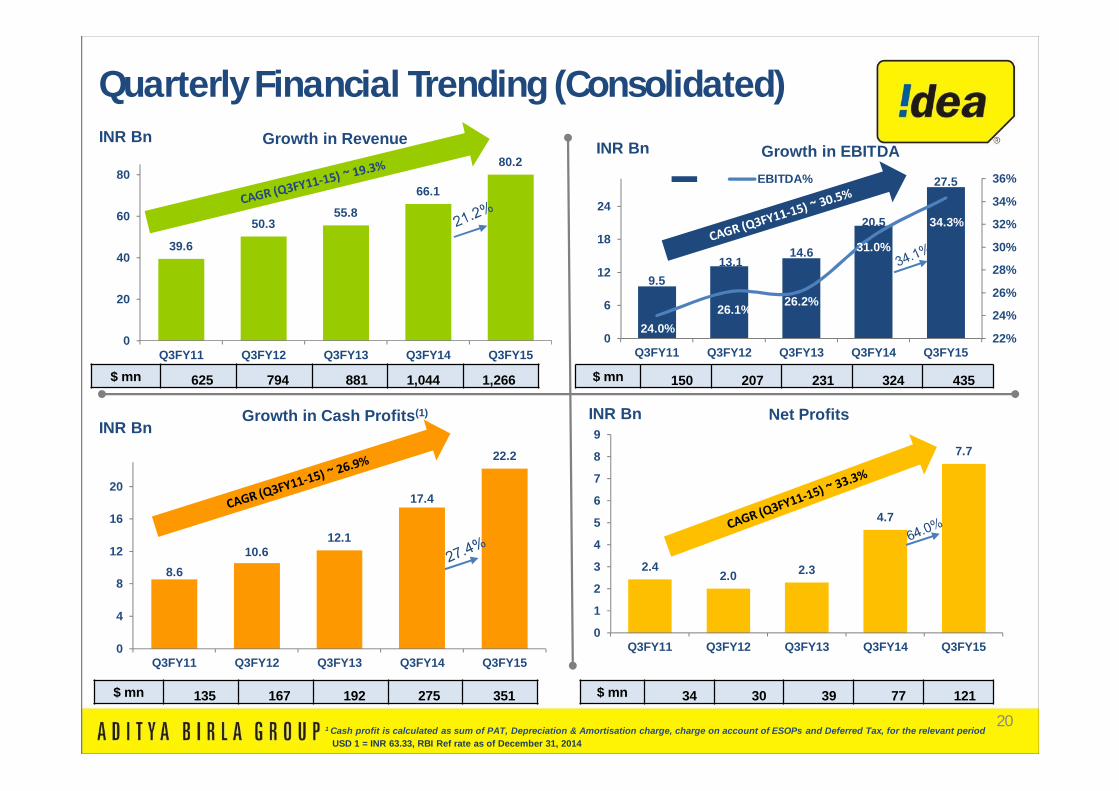
39.6
50.3 55.8
66.1
80.2
0
20
40
60
80
Q3FY11 Q3FY12 Q3FY13 Q3FY14 Q3FY15
2.4 2.0 2.3
4.7
7.7
0
1
2
3
4
5
6
7
8
9
Q3FY11 Q3FY12 Q3FY13 Q3FY14 Q3FY15
8.6 10.6
12.1
17.4
22.2
0
4
8
12
16
20
Q3FY11 Q3FY12 Q3FY13 Q3FY14 Q3FY15
Growth in Revenue
9.513.1
14.6
20.5
27.5
24.0%26.1% 26.2%
31.0%
34.3%
22%
24%
26%
28%
30%
32%
34%
36%
0
6
12
18
24
Q3FY11 Q3FY12 Q3FY13 Q3FY14 Q3FY15
EBITDA%
Growth in EBITDA
Net ProfitsGrowth in Cash Profits(1)
INR Bn
Quarterly Financial Trending (Consolidated)
1 Cash profit is calculated as sum of PAT, Depreciation & Amortisation charge, charge on account of ESOPs and Deferred Tax, for the relevant period
$ mn 625 794 881 1,044 1,266 $ mn 150 207 231 324 435
$ mn 34 30 39 77 121 $ mn 135 167 192 275 351
INR Bn
INR BnINR Bn
Public
USD 1 = INR 63.33, RBI Ref rate as of December 31, 2014
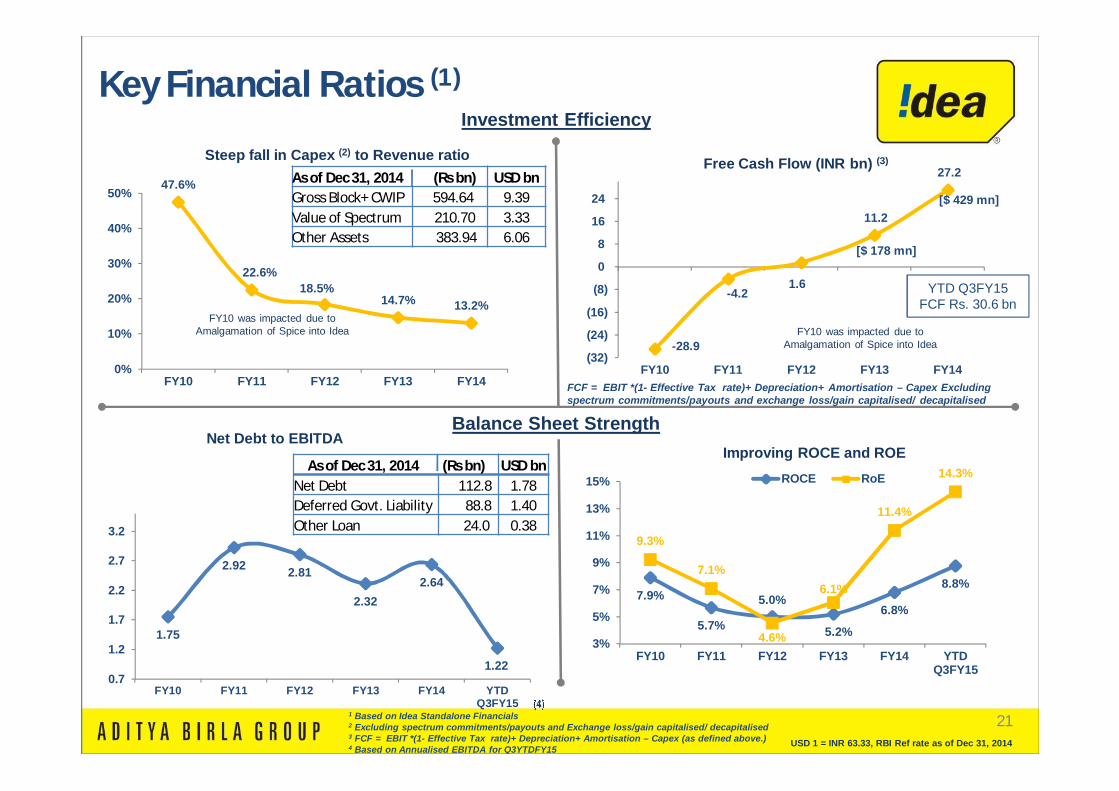
211 Based on Idea Standalone Financials2 Excluding spectrum commitments/payouts and Exchange loss/gain capitalised/ decapitalised3 FCF = EBIT *(1- Effective Tax rate)+ Depreciation+ Amortisation – Capex (as defined above.)4 Based on Annualised EBITDA for Q3YTDFY15
Key Financial Ratios (1)
Balance Sheet Strength
-28.9
-4.2 1.6
11.2
27.2
(32)
(24)
(16)
(8)
0
8
16
24
FY10 FY11 FY12 FY13 FY14
7.9%
5.7%
5.0%
5.2%
6.8%
8.8%
9.3%
7.1%
4.6%
6.1%
11.4%
14.3%
3%
5%
7%
9%
11%
13%
15%
FY10 FY11 FY12 FY13 FY14 YTDQ3FY15
ROCE RoE
Investment Efficiency
47.6%
22.6%18.5%
14.7% 13.2%
0%
10%
20%
30%
40%
50%
FY10 FY11 FY12 FY13 FY14
1.75
2.92 2.81
2.322.64
1.220.7
1.2
1.7
2.2
2.7
3.2
FY10 FY11 FY12 FY13 FY14 YTDQ3FY15
Improving ROCE and ROE
Steep fall in Capex (2) to Revenue ratio
Net Debt to EBITDA
Free Cash Flow (INR bn) (3)
FY10 was impacted due to Amalgamation of Spice into Idea FY10 was impacted due to
Amalgamation of Spice into Idea
As of Dec 31, 2014 (Rs bn) USD bnNet Debt 112.8 1.78Deferred Govt. Liability 88.8 1.40Other Loan 24.0 0.38
As of Dec 31, 2014 (Rs bn) USD bnGross Block+ CWIP 594.64 9.39Value of Spectrum 210.70 3.33Other Assets 383.94 6.06
FCF = EBIT *(1- Effective Tax rate)+ Depreciation+ Amortisation – Capex Excluding spectrum commitments/payouts and exchange loss/gain capitalised/ decapitalised
[$ 429 mn]
[$ 178 mn]
Public
USD 1 = INR 63.33, RBI Ref rate as of Dec 31, 2014
YTD Q3FY15 FCF Rs. 30.6 bn
22
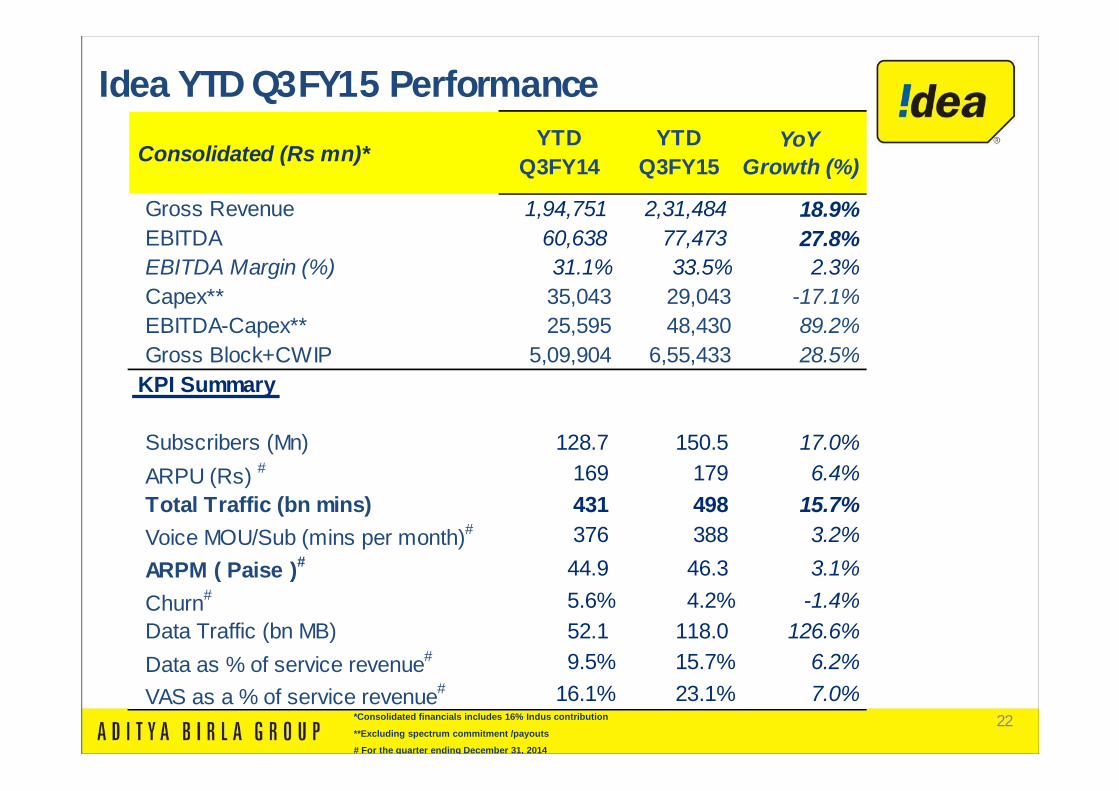
Idea YTD Q3FY15 Performance
*Consolidated financials includes 16% Indus contribution
**Excluding spectrum commitment /payouts
# For the quarter ending December 31, 2014
Public
Consolidated (Rs mn)* YTD
Q3FY14YTD
Q3FY15YoY
Growth (%)
Gross Revenue 1,94,751 2,31,484 18.9%EBITDA 60,638 77,473 27.8%EBITDA Margin (%) 31.1% 33.5% 2.3%Capex** 35,043 29,043 -17.1%EBITDA-Capex** 25,595 48,430 89.2%Gross Block+CWIP 5,09,904 6,55,433 28.5%
KPI Summary
Subscribers (Mn) 128.7 150.5 17.0%ARPU (Rs) # 169 179 6.4%Total Traffic (bn mins) 431 498 15.7%Voice MOU/Sub (mins per month)# 376 388 3.2%ARPM ( Paise )# 44.9 46.3 3.1%Churn# 5.6% 4.2% -1.4%Data Traffic (bn MB) 52.1 118.0 126.6%Data as % of service revenue# 9.5% 15.7% 6.2%VAS as a % of service revenue# 16.1% 23.1% 7.0%
23
Appendix
Public
24
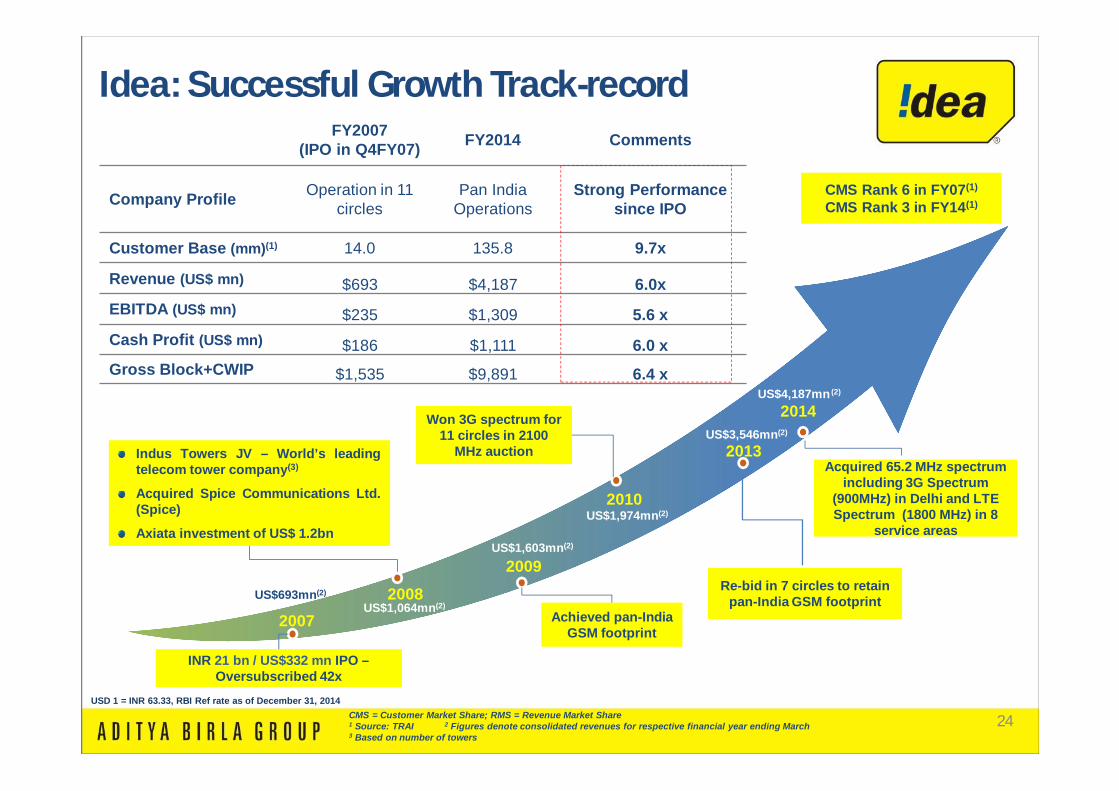
INR 21 bn / US$332 mn IPO –Oversubscribed 42x
Achieved pan-India GSM footprint
2007
2009
2013
Re-bid in 7 circles to retain pan-India GSM footprint
FY2007(IPO in Q4FY07) FY2014 Comments
Company Profile Operation in 11 circles
Pan India Operations
Strong Performance since IPO
Customer Base (mm)(1) 14.0 135.8 9.7x
Revenue (US$ mn) $693 $4,187 6.0x EBITDA (US$ mn) $235 $1,309 5.6 xCash Profit (US$ mn) $186 $1,111 6.0 xGross Block+CWIP $1,535 $9,891 6.4 x
2008
Indus Towers JV – World’s leadingtelecom tower company(3)
Acquired Spice Communications Ltd.(Spice)
Axiata investment of US$ 1.2bn
2010
Won 3G spectrum for 11 circles in 2100
MHz auction
US$693mn(2)
US$1,064mn(2)
US$1,603mn(2)
US$1,974mn(2)
US$4,187mn (2)
CMS Rank 6 in FY07(1)
CMS Rank 3 in FY14(1)
CMS = Customer Market Share; RMS = Revenue Market Share1 Source: TRAI 2 Figures denote consolidated revenues for respective financial year ending March3 Based on number of towers
Idea: Successful Growth Track-record
2014
Acquired 65.2 MHz spectrum including 3G Spectrum
(900MHz) in Delhi and LTE Spectrum (1800 MHz) in 8
service areas
US$3,546mn(2)
Public
USD 1 = INR 63.33, RBI Ref rate as of December 31, 2014
25
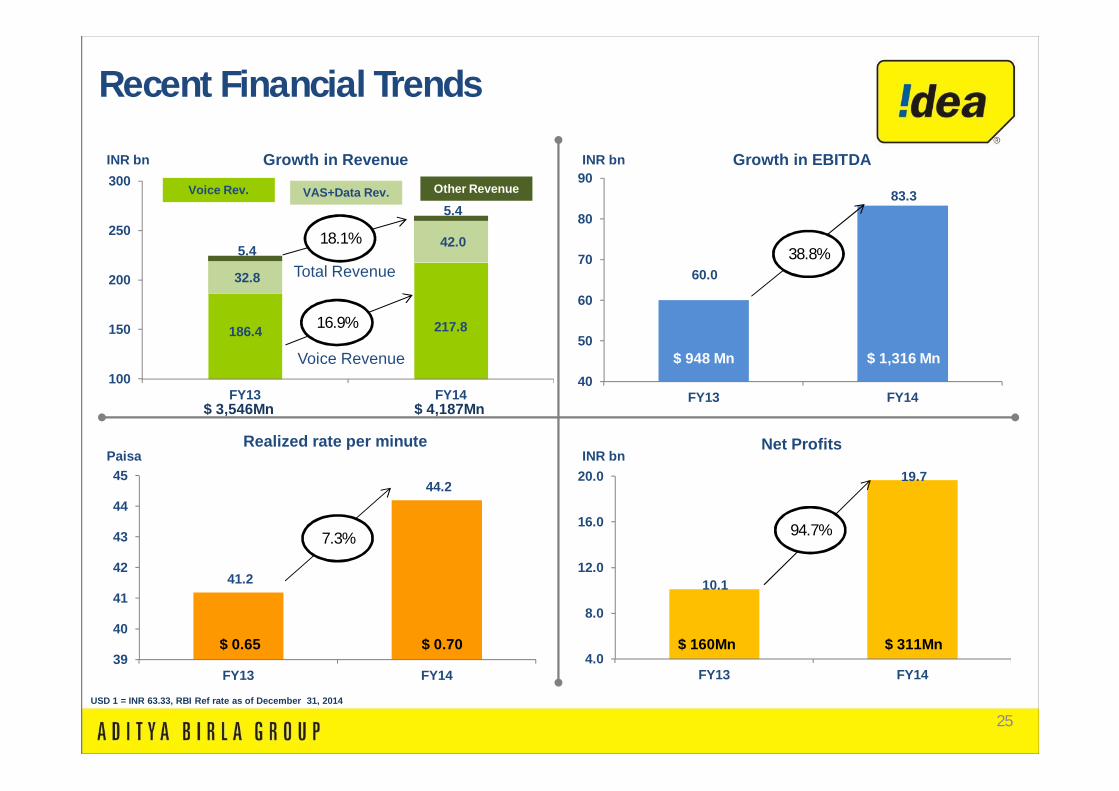
186.4 217.8
32.8
42.0 5.4
5.4
100
150
200
250
300
FY13 FY14
Voice Rev.
Growth in RevenueINR bn
60.0
83.3
40
50
60
70
80
90
FY13 FY14
Growth in EBITDAINR bn
Net Profits
10.1
19.7
4.0
8.0
12.0
16.0
20.0
FY13 FY14
18.1%38.8%
94.7%
Realized rate per minute
41.2
44.2
39
40
41
42
43
44
45
FY13 FY14
7.3%
$ 3,546Mn $ 4,187Mn
$ 948 Mn $ 1,316 Mn
$ 160Mn $ 311Mn$ 0.65 $ 0.70
Recent Financial Trends
INR bnPaisa
VAS+Data Rev. Other Revenue
16.9%
Total Revenue
Voice Revenue
Public
USD 1 = INR 63.33, RBI Ref rate as of December 31, 2014
26
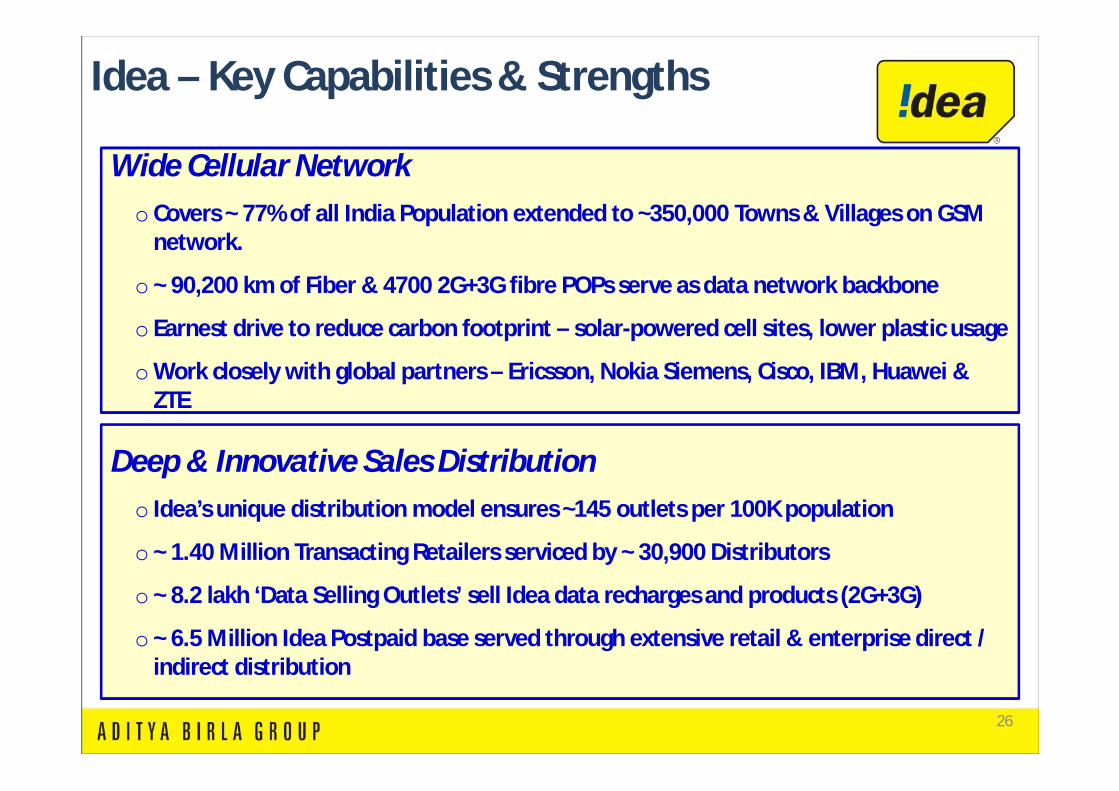
Idea – Key Capabilities & Strengths
Wide Cellular Networko Covers ~ 77% of all India Population extended to ~350,000 Towns & Villages on GSM
network.
o ~ 90,200 km of Fiber & 4700 2G+3G fibre POPs serve as data network backbone
o Earnest drive to reduce carbon footprint – solar-powered cell sites, lower plastic usage
oWork closely with global partners – Ericsson, Nokia Siemens, Cisco, IBM, Huawei & ZTE
Deep & Innovative Sales Distributiono Idea’s unique distribution model ensures ~145 outlets per 100K population
o ~ 1.40 Million Transacting Retailers serviced by ~ 30,900 Distributors
o ~ 8.2 lakh ‘Data Selling Outlets’ sell Idea data recharges and products (2G+3G)
o ~ 6.5 Million Idea Postpaid base served through extensive retail & enterprise direct / indirect distribution
Public
27
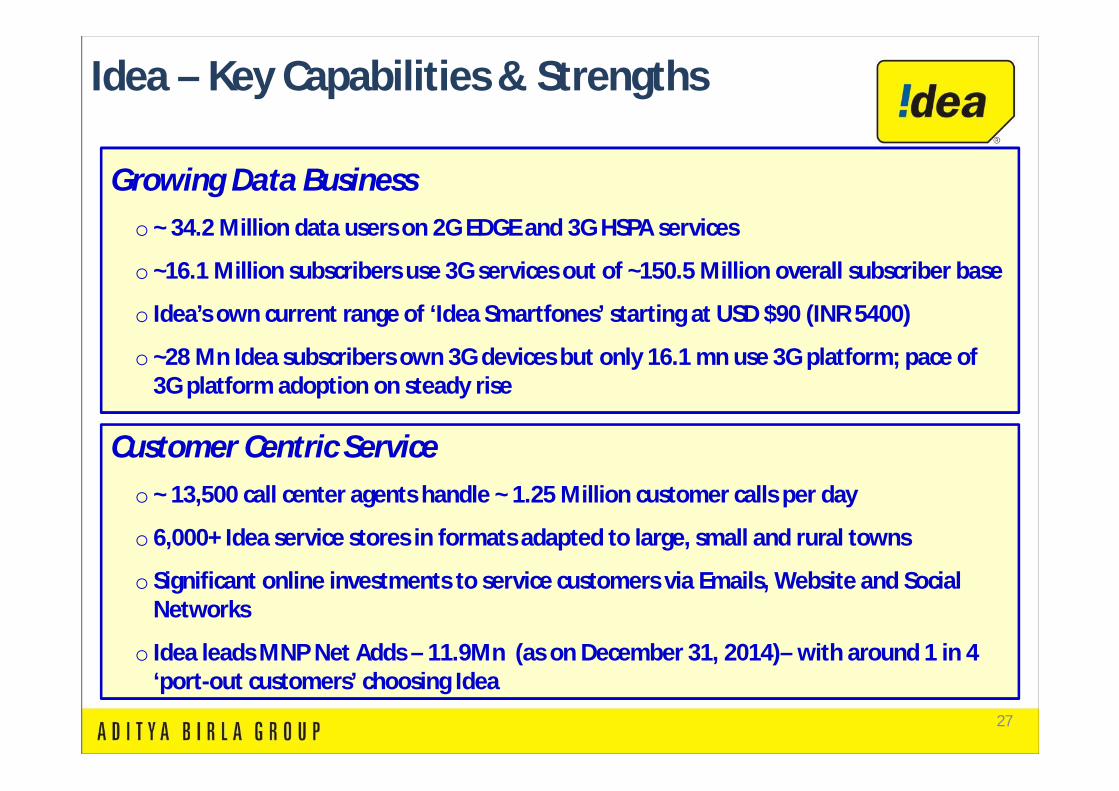
Idea – Key Capabilities & Strengths
Growing Data Businesso ~ 34.2 Million data users on 2G EDGE and 3G HSPA services
o ~16.1 Million subscribers use 3G services out of ~150.5 Million overall subscriber base
o Idea’s own current range of ‘Idea Smartfones’ starting at USD $90 (INR 5400)
o ~28 Mn Idea subscribers own 3G devices but only 16.1 mn use 3G platform; pace of 3G platform adoption on steady rise
Customer Centric Serviceo ~ 13,500 call center agents handle ~ 1.25 Million customer calls per day
o 6,000+ Idea service stores in formats adapted to large, small and rural towns
o Significant online investments to service customers via Emails, Website and Social Networks
o Idea leads MNP Net Adds – 11.9Mn (as on December 31, 2014)– with around 1 in 4 ‘port-out customers’ choosing Idea
Public
28
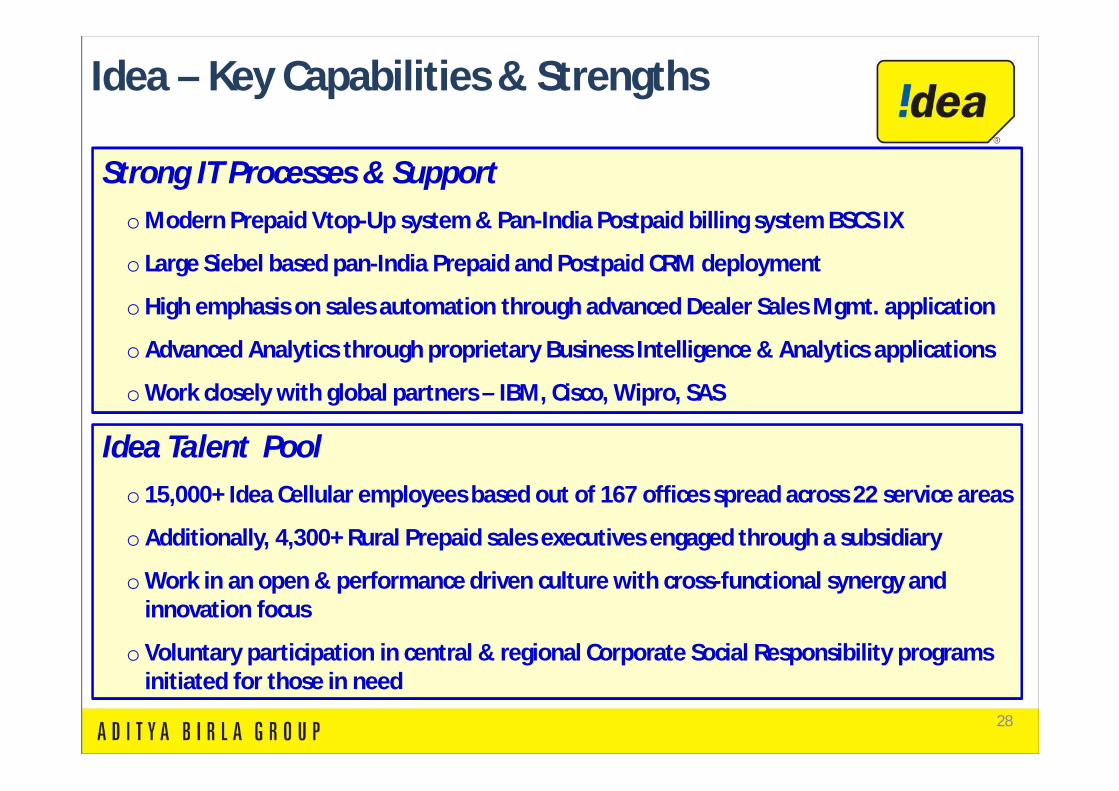
Idea – Key Capabilities & Strengths
Strong IT Processes & SupportoModern Prepaid Vtop-Up system & Pan-India Postpaid billing system BSCS IX
o Large Siebel based pan-India Prepaid and Postpaid CRM deployment
oHigh emphasis on sales automation through advanced Dealer Sales Mgmt. application
oAdvanced Analytics through proprietary Business Intelligence & Analytics applications
oWork closely with global partners – IBM, Cisco, Wipro, SAS
Idea Talent Poolo 15,000+ Idea Cellular employees based out of 167 offices spread across 22 service areas
oAdditionally, 4,300+ Rural Prepaid sales executives engaged through a subsidiary
oWork in an open & performance driven culture with cross-functional synergy and innovation focus
oVoluntary participation in central & regional Corporate Social Responsibility programs initiated for those in need
Public
29
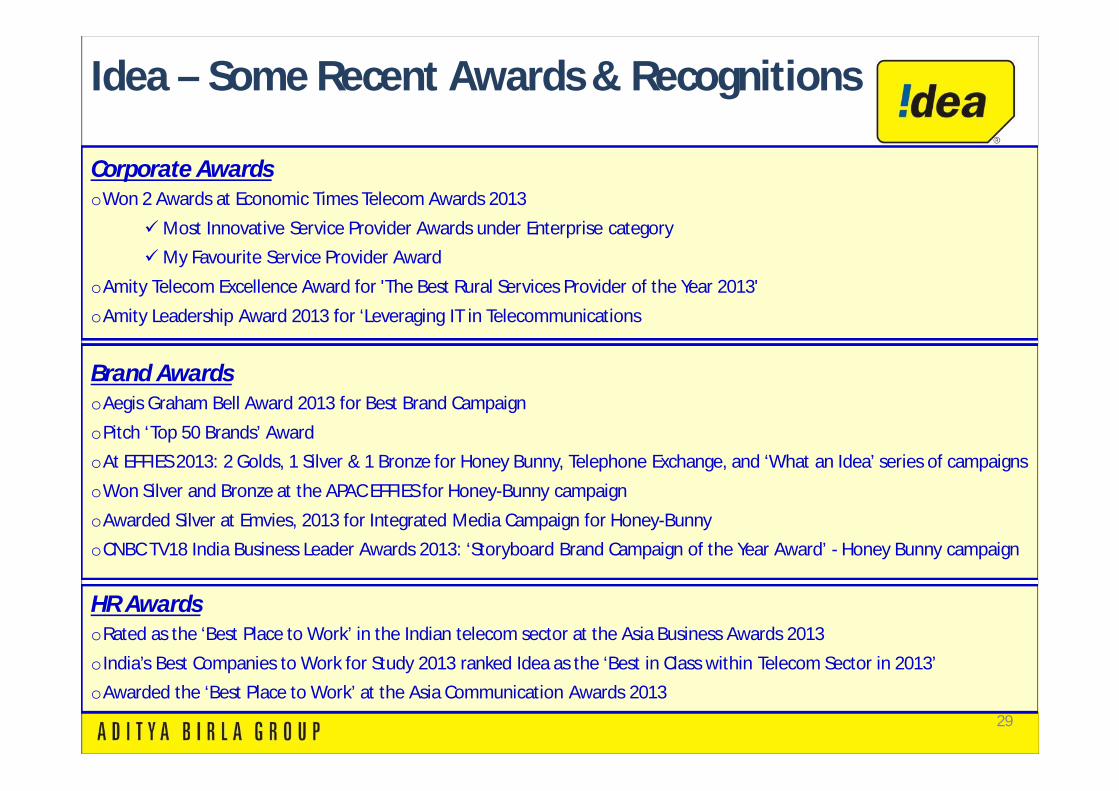
Idea – Some Recent Awards & Recognitions
Brand AwardsoAegis Graham Bell Award 2013 for Best Brand Campaign
oPitch ‘Top 50 Brands’ Award oAt EFFIES 2013: 2 Golds, 1 Silver & 1 Bronze for Honey Bunny, Telephone Exchange, and ‘What an Idea’ series of campaigns
oWon Silver and Bronze at the APAC EFFIES for Honey-Bunny campaign
oAwarded Silver at Emvies, 2013 for Integrated Media Campaign for Honey-BunnyoCNBC TV18 India Business Leader Awards 2013: ‘Storyboard Brand Campaign of the Year Award’ - Honey Bunny campaign
Corporate AwardsoWon 2 Awards at Economic Times Telecom Awards 2013
Most Innovative Service Provider Awards under Enterprise categoryMy Favourite Service Provider Award
oAmity Telecom Excellence Award for 'The Best Rural Services Provider of the Year 2013'
oAmity Leadership Award 2013 for ‘Leveraging IT in Telecommunications
HR AwardsoRated as the ‘Best Place to Work’ in the Indian telecom sector at the Asia Business Awards 2013
oIndia’s Best Companies to Work for Study 2013 ranked Idea as the ‘Best in Class within Telecom Sector in 2013’oAwarded the ‘Best Place to Work’ at the Asia Communication Awards 2013
Public

30
Idea Brand Philosophy
Transforming Indian consumers’ life through Mobile Telephony
Public
31
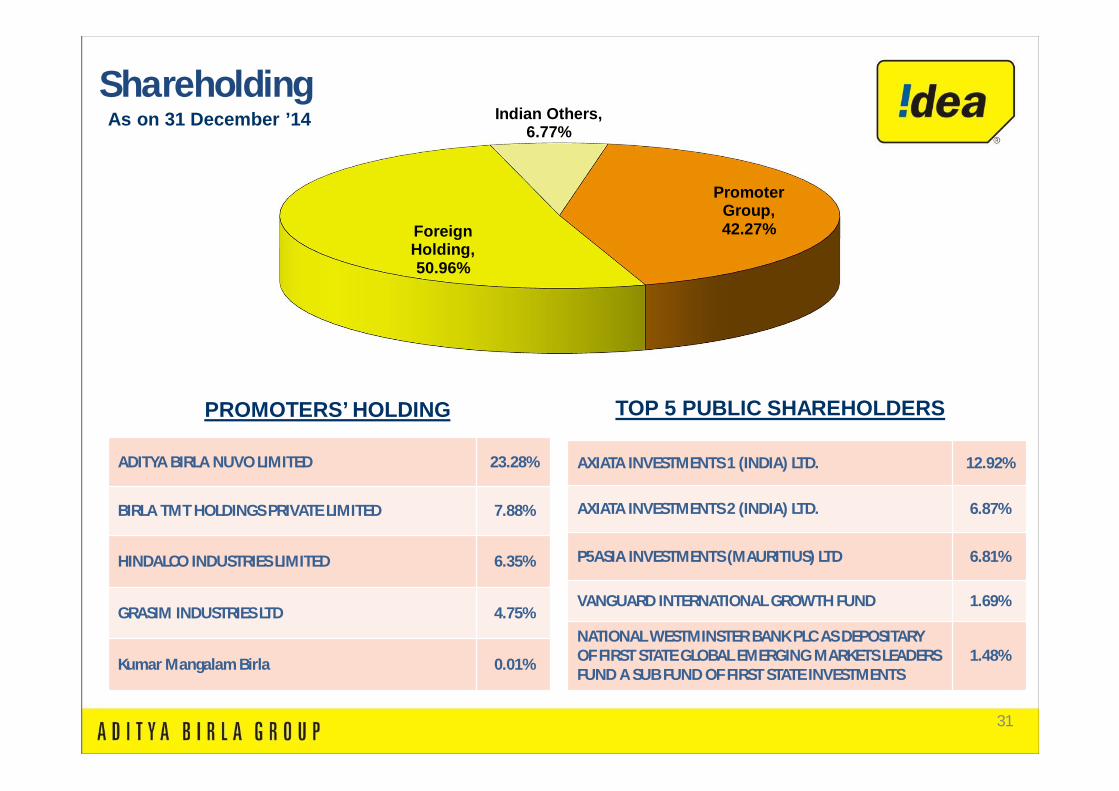
Promoter Group, 42.27%Foreign
Holding, 50.96%
Indian Others, 6.77%
As on 31 December ’14
PROMOTERS’ HOLDING TOP 5 PUBLIC SHAREHOLDERS
Shareholding
AXIATA INVESTMENTS 1 (INDIA) LTD. 12.92%
AXIATA INVESTMENTS 2 (INDIA) LTD. 6.87%
P5ASIA INVESTMENTS (MAURITIUS) LTD 6.81%
VANGUARD INTERNATIONAL GROWTH FUND 1.69%
NATIONAL WESTMINSTER BANK PLC AS DEPOSITARY OF FIRST STATE GLOBAL EMERGING MARKETS LEADERS FUND A SUB FUND OF FIRST STATE INVESTMENTS
1.48%
ADITYA BIRLA NUVO LIMITED 23.28%
BIRLA TMT HOLDINGS PRIVATE LIMITED 7.88%
HINDALCO INDUSTRIES LIMITED 6.35%
GRASIM INDUSTRIES LTD 4.75%
Kumar Mangalam Birla 0.01%
Public
32
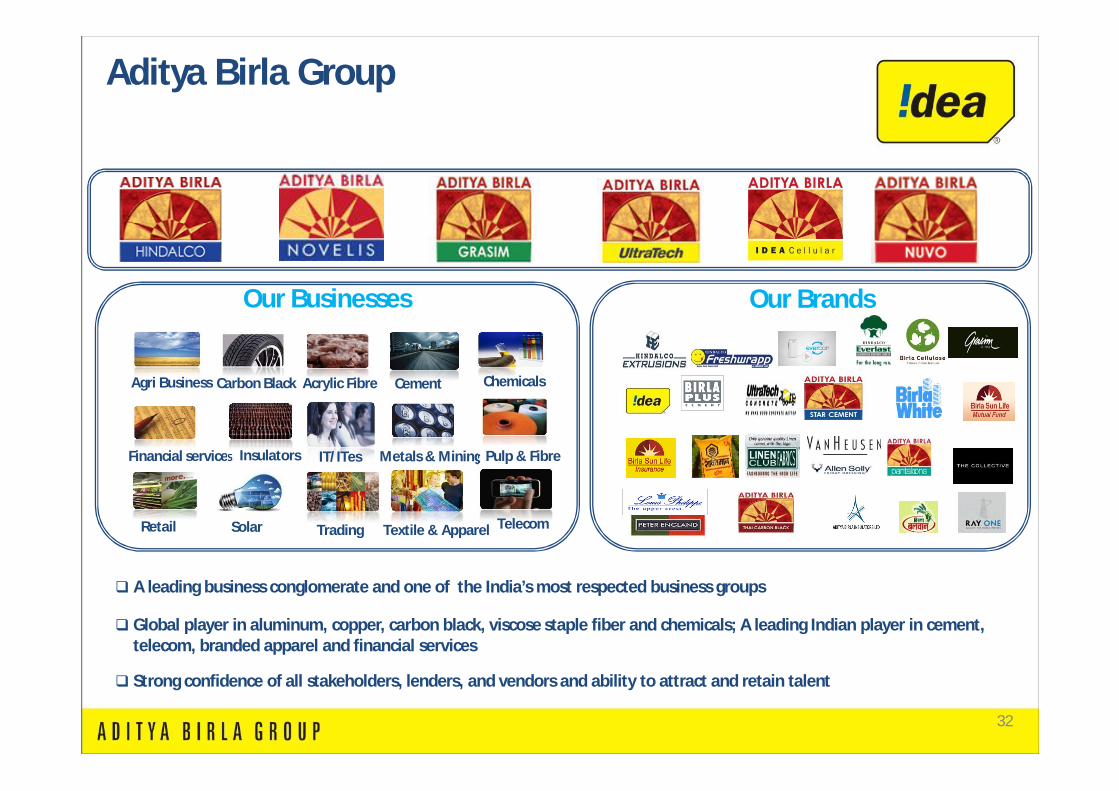
Aditya Birla Group
Acrylic Fibre Agri Business Carbon Black Cement Chemicals
Financial services Insulators IT/ITes Metals & Mining
Retail Solar Trading Textile & Apparel Telecom
Our Businesses
Pulp & Fibre
Our Brands
A leading business conglomerate and one of the India’s most respected business groups
Global player in aluminum, copper, carbon black, viscose staple fiber and chemicals; A leading Indian player in cement, telecom, branded apparel and financial services
Strong confidence of all stakeholders, lenders, and vendors and ability to attract and retain talent
Public
33
Board Members
PIC[Smt.
Rajashree Birla]
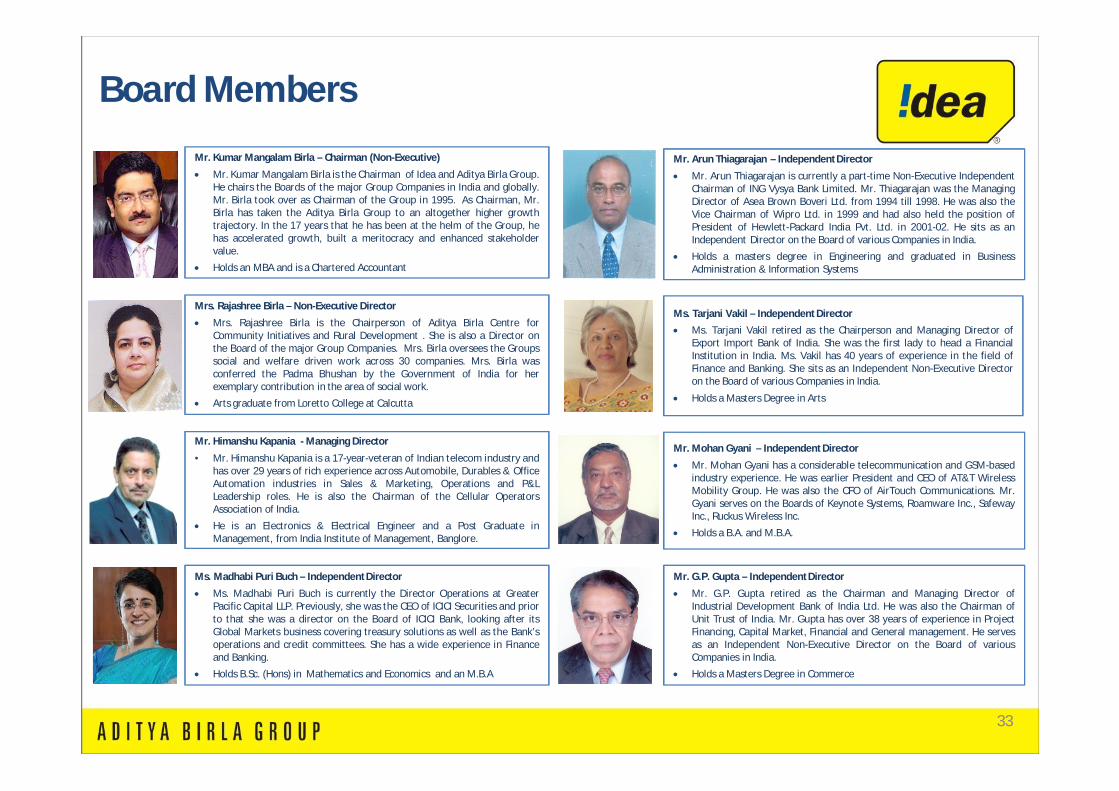
Mrs. Rajashree Birla – Non-Executive Director
Mrs. Rajashree Birla is the Chairperson of Aditya Birla Centre forCommunity Initiatives and Rural Development . She is also a Director onthe Board of the major Group Companies. Mrs. Birla oversees the Groupssocial and welfare driven work across 30 companies. Mrs. Birla wasconferred the Padma Bhushan by the Government of India for herexemplary contribution in the area of social work.
Arts graduate from Loretto College at Calcutta
PIC[Himanshu Kapania]
Mr. Himanshu Kapania - Managing Director
• Mr. Himanshu Kapania is a 17-year-veteran of Indian telecom industry andhas over 29 years of rich experience across Automobile, Durables & OfficeAutomation industries in Sales & Marketing, Operations and P&LLeadership roles. He is also the Chairman of the Cellular OperatorsAssociation of India.
He is an Electronics & Electrical Engineer and a Post Graduate inManagement, from India Institute of Management, Banglore.
PIC[Madhabi Puri
Buch]
Mr. Arun Thiagarajan – IndependentDirector
Mr. Arun Thiagarajan is currently a part-time Non-Executive IndependentChairman of ING Vysya Bank Limited. Mr. Thiagarajan was the ManagingDirector of Asea Brown Boveri Ltd. from 1994 till 1998. He was also theVice Chairman of Wipro Ltd. in 1999 and had also held the position ofPresident of Hewlett-Packard India Pvt. Ltd. in 2001-02. He sits as anIndependent Director on the Board of various Companies in India.
Holds a masters degree in Engineering and graduated in BusinessAdministration & Information Systems
Ms. Tarjani Vakil – Independent Director Ms. Tarjani Vakil retired as the Chairperson and Managing Director of
Export Import Bank of India. She was the first lady to head a FinancialInstitution in India. Ms. Vakil has 40 years of experience in the field ofFinance and Banking. She sits as an Independent Non-Executive Directoron the Board of various Companies in India.
Holds a Masters Degree in Arts
Mr. Mohan Gyani – Independent Director
Mr. Mohan Gyani has a considerable telecommunication and GSM-basedindustry experience. He was earlier President and CEO of AT&T WirelessMobility Group. He was also the CFO of AirTouch Communications. Mr.Gyani serves on the Boards of Keynote Systems, Roamware Inc., SafewayInc., Ruckus Wireless Inc.
Holds a B.A. and M.B.A.
Mr. G.P. Gupta – IndependentDirector
Mr. G.P. Gupta retired as the Chairman and Managing Director ofIndustrial Development Bank of India Ltd. He was also the Chairman ofUnit Trust of India. Mr. Gupta has over 38 years of experience in ProjectFinancing, Capital Market, Financial and General management. He servesas an Independent Non-Executive Director on the Board of variousCompanies in India.
Holds a Masters Degree in Commerce
Mr. Kumar Mangalam Birla – Chairman (Non-Executive)
Mr. Kumar Mangalam Birla is the Chairman of Idea and Aditya Birla Group.He chairs the Boards of the major Group Companies in India and globally.Mr. Birla took over as Chairman of the Group in 1995. As Chairman, Mr.Birla has taken the Aditya Birla Group to an altogether higher growthtrajectory. In the 17 years that he has been at the helm of the Group, hehas accelerated growth, built a meritocracy and enhanced stakeholdervalue.
Holds an MBA and is a Chartered Accountant
PIC[Tarjani Vakil]
PIC[Mohan Gyani]
PIC[Gian Prakash
Gupta]
PIC[Mr. Arun
Thiagarajan]
Ms. Madhabi Puri Buch – IndependentDirector
Ms. Madhabi Puri Buch is currently the Director Operations at GreaterPacific Capital LLP. Previously, she was the CEO of ICICI Securities and priorto that she was a director on the Board of ICICI Bank, looking after itsGlobal Markets business covering treasury solutions as well as the Bank’soperations and credit committees. She has a wide experience in Financeand Banking.
Holds B.Sc. (Hons) in Mathematics and Economics and an M.B.A
Public
34
Board Members
PIC[P. Murari]
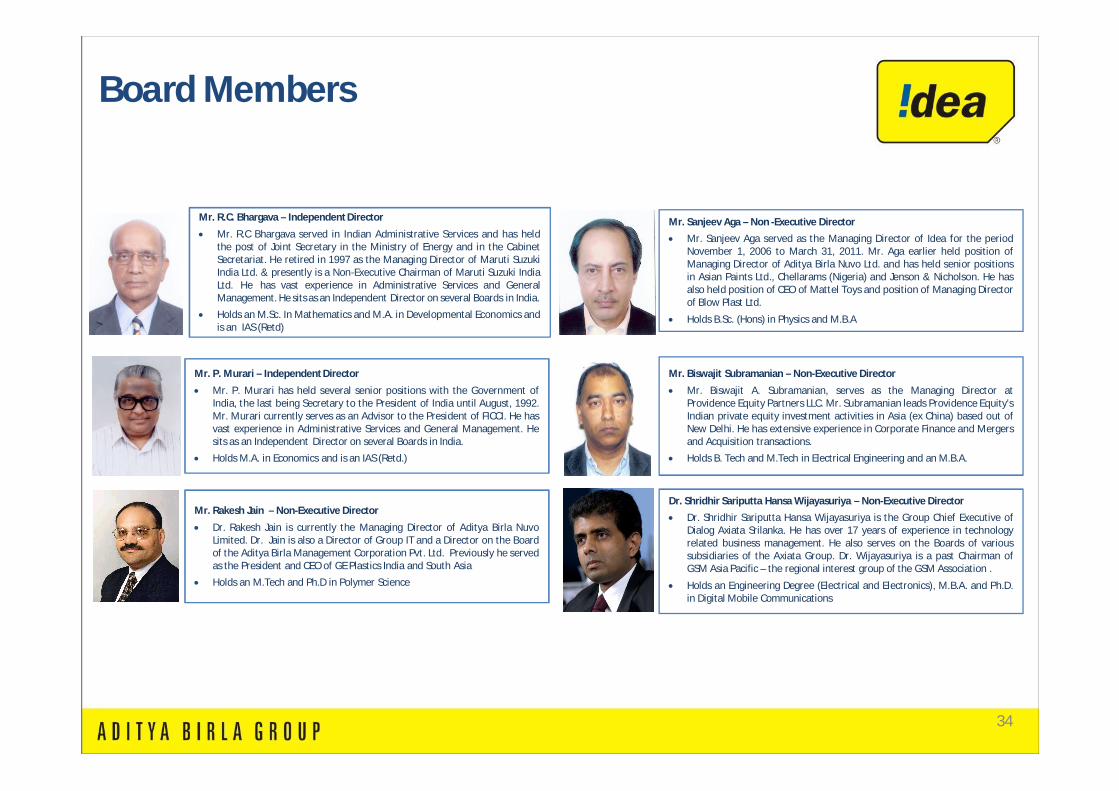
Mr. P. Murari – Independent Director
Mr. P. Murari has held several senior positions with the Government ofIndia, the last being Secretary to the President of India until August, 1992.Mr. Murari currently serves as an Advisor to the President of FICCI. He hasvast experience in Administrative Services and General Management. Hesits as an Independent Director on several Boards in India.
Holds M.A. in Economics and is an IAS (Retd.)
PIC[Rakesh Jain]
Dr. Shridhir Sariputta Hansa Wijayasuriya – Non-Executive Director Dr. Shridhir Sariputta Hansa Wijayasuriya is the Group Chief Executive of
Dialog Axiata Srilanka. He has over 17 years of experience in technologyrelated business management. He also serves on the Boards of varioussubsidiaries of the Axiata Group. Dr. Wijayasuriya is a past Chairman ofGSM Asia Pacific – the regional interest group of the GSM Association .
Holds an Engineering Degree (Electrical and Electronics), M.B.A. and Ph.D.in Digital Mobile Communications
PIC[Dr. Hansa
Wijayasuriya]
Mr. R.C. Bhargava – Independent Director
Mr. R.C Bhargava served in Indian Administrative Services and has heldthe post of Joint Secretary in the Ministry of Energy and in the CabinetSecretariat. He retired in 1997 as the Managing Director of Maruti SuzukiIndia Ltd. & presently is a Non-Executive Chairman of Maruti Suzuki IndiaLtd. He has vast experience in Administrative Services and GeneralManagement. He sits as an Independent Director on several Boards in India.
Holds an M.Sc. In Mathematics and M.A. in Developmental Economics andis an IAS (Retd)
PIC[R.C.
Bhargava]
Mr. Biswajit Subramanian – Non-Executive Director
Mr. Biswajit A. Subramanian, serves as the Managing Director atProvidence Equity Partners LLC. Mr. Subramanian leads Providence Equity'sIndian private equity investment activities in Asia (ex China) based out ofNew Delhi. He has extensive experience in Corporate Finance and Mergersand Acquisition transactions.
Holds B. Tech and M.Tech in Electrical Engineering and an M.B.A.
Mr. Sanjeev Aga – Non -Executive Director Mr. Sanjeev Aga served as the Managing Director of Idea for the period
November 1, 2006 to March 31, 2011. Mr. Aga earlier held position ofManaging Director of Aditya Birla Nuvo Ltd. and has held senior positionsin Asian Paints Ltd., Chellarams (Nigeria) and Jenson & Nicholson. He hasalso held position of CEO of Mattel Toys and position of Managing Directorof Blow Plast Ltd.
Holds B.Sc. (Hons) in Physics and M.B.A
Mr. Rakesh Jain – Non-Executive Director
Dr. Rakesh Jain is currently the Managing Director of Aditya Birla NuvoLimited. Dr. Jain is also a Director of Group IT and a Director on the Boardof the Aditya Birla Management Corporation Pvt. Ltd. Previously he servedas the President and CEO of GE Plastics India and South Asia
Holds an M.Tech and Ph.D in Polymer Science
Public
35
Management Team
Akshaya Moondra
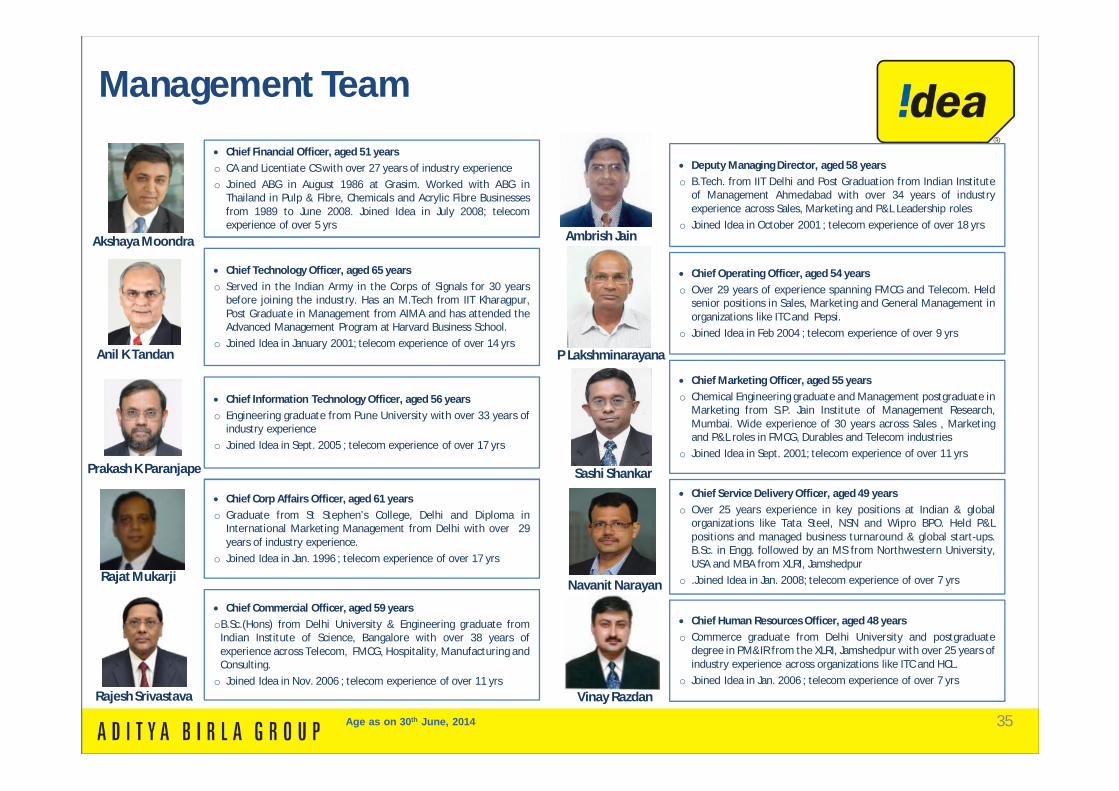
Deputy Managing Director, aged 58 yearso B.Tech. from IIT Delhi and Post Graduation from Indian Institute
of Management Ahmedabad with over 34 years of industryexperience across Sales, Marketing and P&L Leadership roles
o Joined Idea in October 2001 ; telecom experience of over 18 yrs
Chief Financial Officer, aged 51 yearso CA and Licentiate CS with over 27 years of industry experienceo Joined ABG in August 1986 at Grasim. Worked with ABG in
Thailand in Pulp & Fibre, Chemicals and Acrylic Fibre Businessesfrom 1989 to June 2008. Joined Idea in July 2008; telecomexperience of over 5 yrs
Chief Operating Officer, aged 54 yearso Over 29 years of experience spanning FMCG and Telecom. Held
senior positions in Sales, Marketing and General Management inorganizations like ITC and Pepsi.
o Joined Idea in Feb 2004 ; telecom experience of over 9 yrs
Chief Technology Officer, aged 65 yearso Served in the Indian Army in the Corps of Signals for 30 years
before joining the industry. Has an M.Tech from IIT Kharagpur,Post Graduate in Management from AIMA and has attended theAdvanced Management Program at Harvard Business School.
o Joined Idea in January 2001; telecom experience of over 14 yrs
Chief Marketing Officer, aged 55 yearso Chemical Engineering graduate and Management postgraduate in
Marketing from S.P. Jain Institute of Management Research,Mumbai. Wide experience of 30 years across Sales , Marketingand P&L roles in FMCG, Durables and Telecom industries
o Joined Idea in Sept. 2001; telecom experience of over 11 yrs
Chief Information Technology Officer, aged 56 yearso Engineering graduate from Pune University with over 33 years of
industry experienceo Joined Idea in Sept. 2005 ; telecom experience of over 17 yrs
Chief Service Delivery Officer, aged 49 yearso Over 25 years experience in key positions at Indian & global
organizations like Tata Steel, NSN and Wipro BPO. Held P&Lpositions and managed business turnaround & global start-ups.B.Sc. in Engg. followed by an MS from Northwestern University,USA and MBA from XLRI, Jamshedpur
o .Joined Idea in Jan. 2008; telecom experience of over 7 yrs
Chief Corp Affairs Officer, aged 61 yearso Graduate from St Stephen’s College, Delhi and Diploma in
International Marketing Management from Delhi with over 29years of industry experience.
o Joined Idea in Jan. 1996 ; telecom experience of over 17 yrs
Chief Human Resources Officer, aged 48 yearso Commerce graduate from Delhi University and postgraduate
degree in PM&IR from the XLRI, Jamshedpur with over 25 years ofindustry experience across organizations like ITC and HCL.
o Joined Idea in Jan. 2006 ; telecom experience of over 7 yrs
Chief Commercial Officer, aged 59 yearsoB.Sc.(Hons) from Delhi University & Engineering graduate from
Indian Institute of Science, Bangalore with over 38 years ofexperience across Telecom, FMCG, Hospitality, Manufacturing andConsulting.o Joined Idea in Nov. 2006 ; telecom experience of over 11 yrs
Anil K Tandan
Prakash K Paranjape
Rajat Mukarji
Rajesh Srivastava
Ambrish Jain
P Lakshminarayana
Sashi Shankar
Navanit Narayan
Vinay Razdan
Age as on 30th June, 2014
Public
36
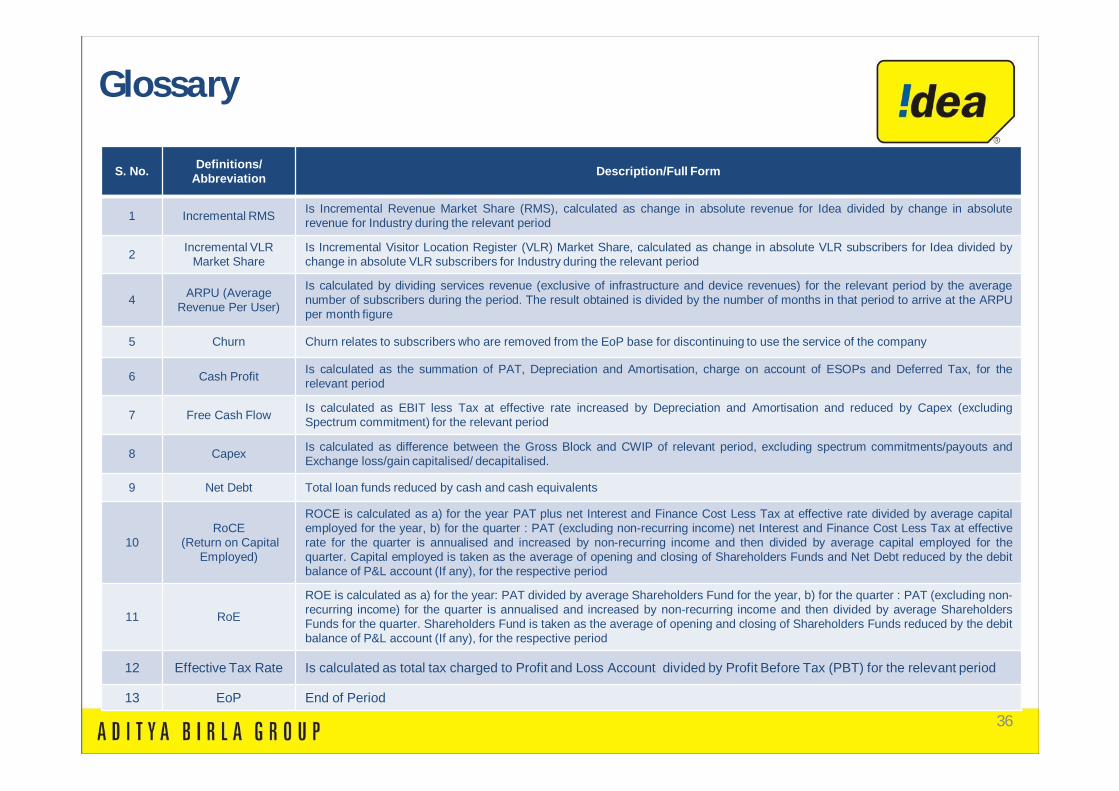
S. No. Definitions/ Abbreviation Description/Full Form
1 Incremental RMS Is Incremental Revenue Market Share (RMS), calculated as change in absolute revenue for Idea divided by change in absoluterevenue for Industry during the relevant period
2 Incremental VLR Market Share
Is Incremental Visitor Location Register (VLR) Market Share, calculated as change in absolute VLR subscribers for Idea divided bychange in absolute VLR subscribers for Industry during the relevant period
4 ARPU (Average Revenue Per User)
Is calculated by dividing services revenue (exclusive of infrastructure and device revenues) for the relevant period by the averagenumber of subscribers during the period. The result obtained is divided by the number of months in that period to arrive at the ARPUper month figure
5 Churn Churn relates to subscribers who are removed from the EoP base for discontinuing to use the service of the company
6 Cash Profit Is calculated as the summation of PAT, Depreciation and Amortisation, charge on account of ESOPs and Deferred Tax, for therelevant period
7 Free Cash Flow Is calculated as EBIT less Tax at effective rate increased by Depreciation and Amortisation and reduced by Capex (excludingSpectrum commitment) for the relevant period
8 Capex Is calculated as difference between the Gross Block and CWIP of relevant period, excluding spectrum commitments/payouts andExchange loss/gain capitalised/ decapitalised.
9 Net Debt Total loan funds reduced by cash and cash equivalents
10RoCE
(Return on CapitalEmployed)
ROCE is calculated as a) for the year PAT plus net Interest and Finance Cost Less Tax at effective rate divided by average capitalemployed for the year, b) for the quarter : PAT (excluding non-recurring income) net Interest and Finance Cost Less Tax at effectiverate for the quarter is annualised and increased by non-recurring income and then divided by average capital employed for thequarter. Capital employed is taken as the average of opening and closing of Shareholders Funds and Net Debt reduced by the debitbalance of P&L account (If any), for the respective period
11 RoE
ROE is calculated as a) for the year: PAT divided by average Shareholders Fund for the year, b) for the quarter : PAT (excluding non-recurring income) for the quarter is annualised and increased by non-recurring income and then divided by average ShareholdersFunds for the quarter. Shareholders Fund is taken as the average of opening and closing of Shareholders Funds reduced by the debitbalance of P&L account (If any), for the respective period
12 Effective Tax Rate Is calculated as total tax charged to Profit and Loss Account divided by Profit Before Tax (PBT) for the relevant period
13 EoP End of Period
GlossaryPublic

3737
Thank You
Public